Estimating Farm-Level Effects of Adopting Biotechnology by William Lin, Gregory K. Price, and Jorge Fernandez-Cornejo Field Crops Branch Market and Trade Economics Division Economic Research Service U.S. Department of Agriculture Washington, D.C. August 2001 __________ Paper presented at the American Agricultural Economics Association Annual Meeting in Chicago, IL, August 5-8, 2001. William Lin and Gregory K. Price are agricultural economists with the Market and Trade Economics Division, and Jorge Fernandez-Cornejo is an agricultural economist with the Resource Economics Division, ERS- USDA.

Welcome message from author
This document is posted to help you gain knowledge. Please leave a comment to let me know what you think about it! Share it to your friends and learn new things together.
Transcript

Estimating Farm-Level Effects of Adopting Biotechnology
by
William Lin, Gregory K. Price, and Jorge Fernandez-Cornejo
Field Crops BranchMarket and Trade Economics Division
Economic Research ServiceU.S. Department of Agriculture
Washington, D.C.
August 2001
__________Paper presented at the American Agricultural Economics Association Annual Meeting in Chicago, IL, August 5-8,2001. William Lin and Gregory K. Price are agricultural economists with the Market and Trade EconomicsDivision, and Jorge Fernandez-Cornejo is an agricultural economist with the Resource Economics Division, ERS-USDA.
1
Estimating Farm-Level Effects of Adopting BiotechnologyWilliam Lin, Gregory K. Price, and Jorge Fernandez-Cornejo
Introduction
The rapid adoption of biotech crops in the United States in recent years has largely reflected the
benefits of potential increases in crop yields and pest control cost savings from this technology.
U.S. and overseas consumers have also indirectly benefited from biotechnology adoption
because increased crop supplies lower prices for these commodities. Thus, estimates of the
benefits from biotechnology adoption require accurate information about the technologies' farm-
level impacts on crop yields and pest control costs. In addition, estimates of these farm-level
effects induced by biotech adoption affect the distribution of benefits among the stakeholders--
U.S. producers, gene developers, germplasm suppliers, U.S. consumers, and producers and
consumers in the rest of the world.
However, estimates of the farm-level effects differ significantly, depending on the data source.
For example, a recent study of the distribution of benefits from biotech adoption by Falck-
Zepeda, Traxler, and Nelsona (hereafter FTN) shows that adopters' yields for 1997 herbicide-
tolerant soybeans were 13.0 percent higher than nonadopters in the Corn Belt based on the
USDA Agricultural Resource Management Studies (ARMS) survey. In contrast, Moschini et al.
in another study of the welfare effects of herbicide-tolerant soybean adoption assumed no yield
difference, which is based on a costs-of-production budget for Iowa (Duffy and Vontalge).1
Differentials in mean crop yields between adopters and nonadopters from the ARMS survey
1 The costs-of-production budget for 1999 Iowa soybeans estimated that yields for both conventional and herbicide-tolerant biotech varieties averaged 45 bushels per acre. The budget assumes a conventional tillage and a productionpractice by which soybeans are planted following corn. Carpenter and Gianessic recently reported that there hasbeen conflicting evidence from university variety trials about the effect of herbicide-tolerant soybeans on cropyields. Overall, the evidence suggests that yields of herbicide-tolerant soybeans are about the same as those ofconventional varieties, consistent with the Iowa costs-of-production budget.

2
reflect the combined effect of biotechnology and other confounding factors. The effects on pest
control costs differ even more dramatically across data sources than the impacts on crop yields.
Variations among various estimates warrant further evaluation of these farm-level effects with a
concerted effort to find ways to reconcile these differences. For example, in the case of Bt
cotton, a private data source EMD (Enhanced Market Data) was used in studies of 1996 and
1997 Bt cotton by FTNa,b. This data source, based on a survey of consultants, provided pairwise
comparisons of cotton yield and pest control cost differences between Bt and non-Bt cotton
fields. ARMS survey data, to be comparable, require further analysis to isolate the effect of
biotechnology from other confounding factors.
Accordingly, the main purpose of this paper is to compare and evaluate the farm-level effects of
adopting biotechnology obtained from various data sources at the regional level. The analysis
focuses on 1997 herbicide-tolerant soybeans, Bt cotton, and herbicide-tolerant cotton in the
United States. These data sources include: (1) means of the ARMS survey, (2) the private EMD
data, and (3) the elasticity-based estimates obtained by isolating the effect of biotechnology
through econometric analysis of the ARMS survey data (Fernandez-Cornejo et al.) Yield and
pesticide use elasticities from this adoption-impact model are further analyzed in this study to
show yield and per-acre pest control cost differentials between adopters and nonadopters.
This paper is organized as follow. First, various data sources for estimating farm-level effects of
adopting biotech varieties in this study are discussed. Estimated impacts of biotech adoption on
crop yields are then presented in the second section. In the third section, estimated impacts on
pest control costs are discussed. Finally, implications of biotech adoption for pesticide use are
presented.

3
Data Sources
The estimates of potential increases in crop yields and savings in pest control costs induced by
the adoption of biotech varieties are among the most difficult variables to measure accurately for
gauging economic surpluses from biotech adoption. This section discusses a few sources of data
that were used to estimate the farm-level effects of biotechnology adoption in this study.
The ARMS survey, which is a nationwide producer survey conducted by USDA to monitor
economic and environmental indicators in the U.S. farm sector, is a data source used by some
researchers in estimating the farm-level impacts (Falck-Zepeda, Traxler, and Nelson (a)). Farm
financial and chemical use data are collected in the ARMS survey each year, while detailed
enterprise production practice and cost data are collected for several commodities (including
soybeans and cotton) on a rotating basis every 4-7 years (McBride).2
According to McBride, there are four characteristics of the ARMS data that make it particularly
useful for assessing the farm-level impacts of biotechnology adoption. First, the ARMS survey
has a broad coverage, including all major states producing a commodity, and generally covers
more than 90 percent of the acreage of targeted commodities. Second, the ARMS survey uses a
stratified random sample where each farm represents a known number of similar farms in the
population based on its probability of being selected. Each farm is weighted by the number of
farms it represents so that the ARMS sample can be expanded to reflect the targeted population.
Third, ARMS enterprise cost-of-production data contain sufficient detail about specific inputs to
isolate the seed and pest control costs used to produce a given commodity. Finally, enterprise
costs-of-production can be estimated for each observation in the ARMS data so that a
distribution of costs can be developed. However, data from the ARMS farm survey are more
2 The 1997 ARMS data are used in this study because these are the latest available data for cotton and soybeans.

4
expensive to obtain and more difficult to use than state cost budgets. More importantly, the data
do not lend themselves easily to estimating the farm-level impacts solely attributed to the
adoption of biotechnology. Mean crop yield and pest control cost differentials between adopters
and nonadopters often reflect not only the effect of biotechnology adoption but also those of
other factors, such as production practices, soil productivity, farm size, and the managerial
ability of farm operators.
An alternative to estimating mean differentials from the survey data is to estimate the impacts of
biotechnology adoption by statistically isolating the effects of the technology from other factors
through econometric analysis (Fernandez-Cornejo, Klotz-Ingram, Jans; Fernandez-Cornejo and
McBride). The econometric model is also estimated from ARMS survey data but takes into
account the fact that farmers' adoption of biotechnology and pesticide use decisions may be
simultaneous. In addition, the model corrects for self-selectivity to prevent biasing the results.
Self-selection arises because farmers are not assigned randomly to one of the two groups
(adopters and nonadopters); instead, they make the adoption choices themselves. Therefore,
adopters and nonadopters may be systematically different and these differences may manifest
themselves in farm performance, which could confound the effect of adoption.
The results of this two-stage impact model are expressed in elasticity form. In terms of the
impact on crop yields, the adoption of herbicide-tolerant soybeans has a positive and significant
effect, but the effect is small--U.S. herbicide-tolerant soybean yields in 1997 are estimated to
have increased by 0.3 percent for a 10-percent increase in adoption (table 1). This yield effect is
generally consistent with other studies (Gianessi and Carpenterb; Carpenter and Gianessia, b;
Moschini, Lapan, and Sobolevsky; Duffy and Vontalge). In the cases of Bt cotton in the

5
Table 1. The Impact of Adoption of Herbicide-Tolerant and Bt Crops__________________________________________________________________
Elasticity with respect to probability of adoption of __________________________________________
Herbicide-tolerant Herbicide-tolerant Bt cotton,soybeans, 1997 cotton, 1997 1997
(Southeast)__________________________________________________________________
Yields +0.03 +0.17 +0.21
Pesticide useHerbicidesAcetamide herbicides 0a
Triazine herbicides 0a
Other synthetic herbicides -0.14 0a
Glyphosate +0.43 0a
InsecticidesOrganophosphate insecticides 0a
Pyrethroid insecticides 0a
Other insecticides -0.21__________________________________________________________________a Insignificant underlying coefficients.
Source: Fernandez-Cornejo, Klotz-Ingram, Jans.
Southeast and herbicide-tolerant cotton, yields in 1997 are estimated to have increased by 2.1
percent and 1.7 percent for a 10-percent increase in adoption, respectively (table 1).
The impact of biotechnology adoption on pesticide use, based on this econometric model, varies
among the commodities. An increase in the adoption of herbicide-tolerant soybeans is estimated
to have led to statistically significant reduction in the use of herbicides other than acetamides or
glyphosate and a significant increase in the use of glyphosate. The change in acetamides was not
statistically significant. Use of other synthetic herbicides is estimated to have decreased by 1.4
percent for a 10-percent increase in adoption of herbicide-tolerant soybeans. In contrast, use of
glyphosate is estimated to have increased by 4.3 percent (table 1). In the case of Bt cotton, while
the change in the use of organophosphate and pyrethroid insecticides associated with an increase
6
in adoption were not statistically significant, a 10-percent increase in adoption led to a 2.1-
percent decrease in use of other insecticides, which was statistically significant (table 1). The
change in herbicide use associated with the adoption of herbicide-tolerant cotton was not
statistically significant.
Finally, still another data source for estimating the farm-level impacts of biotechnology adoption
is databases maintained by private firms. For example, in their studies on 1997 Bt cotton, Falck-
Zepeda, Traxler, and Nelson (a) employed the comprehensive Enhanced Market Data (EMD)
obtained from a survey of consultants conducted by Plexus Marketing Group, Inc. and Timber
Mill Research, Inc. In this survey, cotton consultants were recruited to provide agronomic and
pest management information on matched pairs of Bt and non-Bt cotton fields. These matched
pairs of fields were carefully selected so that they represented equivalent histories of crop
production, agronomic practices and productivity. Data were included for fields in Alabama,
Arkansas, Georgia, Louisiana, Mississippi, North Carolina, South Carolina, and East Texas. For
regions and states not included in the EMD data, Falck-Zepeda et al. used data from Monsanto as
well as from Zelinski and Kerby.
Estimated Impacts on Crop Yields
A fundamental question that needs to be addressed before estimating the benefits from the
adoption of biotechnology is: "How much of the difference in crop yields between adopters and
nonadopters is attributable to the adoption of the technology?" This section discusses the
differences in the impacts on crop yields across three data sources: (1) mean values for adopters
and nonadopters obtained from the ARMS survey, (2) analysis based on the elasticities derived
from the adoption-impact model (Fernandez-Cornjo, Klotz-Ingram, Jans), and (3) the EMD

7
database, which is applicable only to Bt cotton produced in the Southern Seaboard and
Mississippi Portal regions.
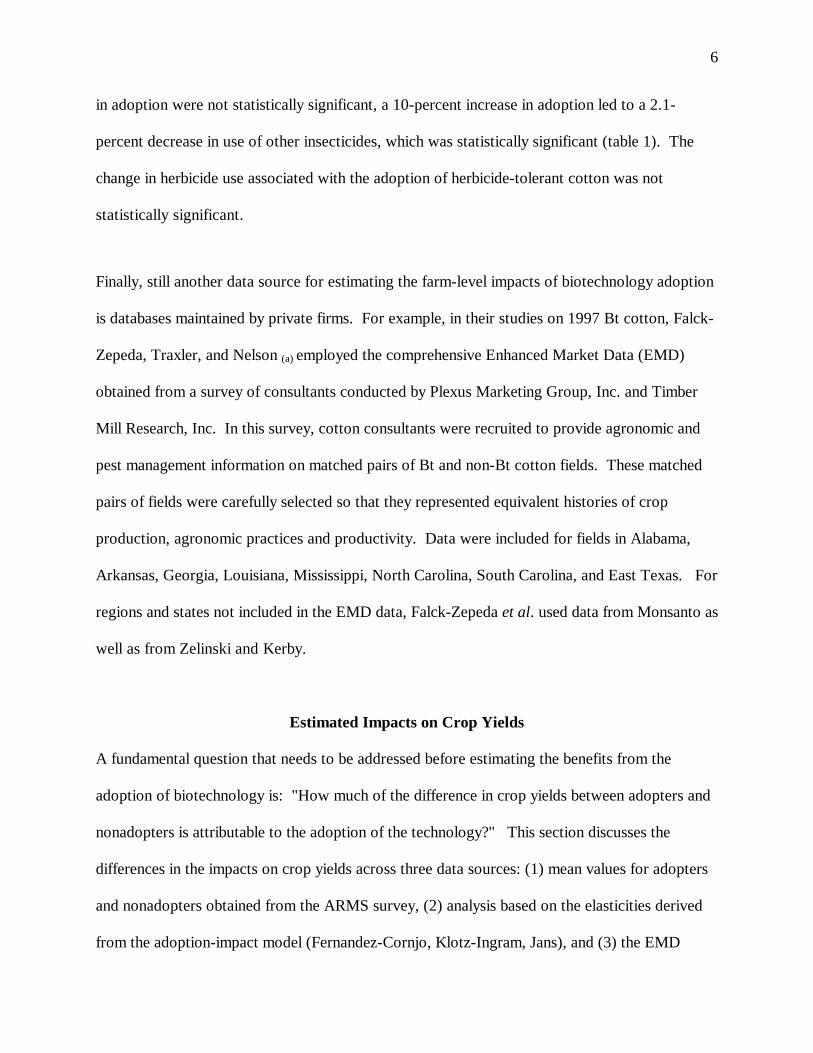
The impact of adopting Bt cotton on crop yields, based on one-year data in 1997, appears to vary
significantly across data sources and production regions. In the Southern Seaboard, for which
the elasticity-based estimate is applicable, yields for adopters of 1997 Bt cotton are estimated to
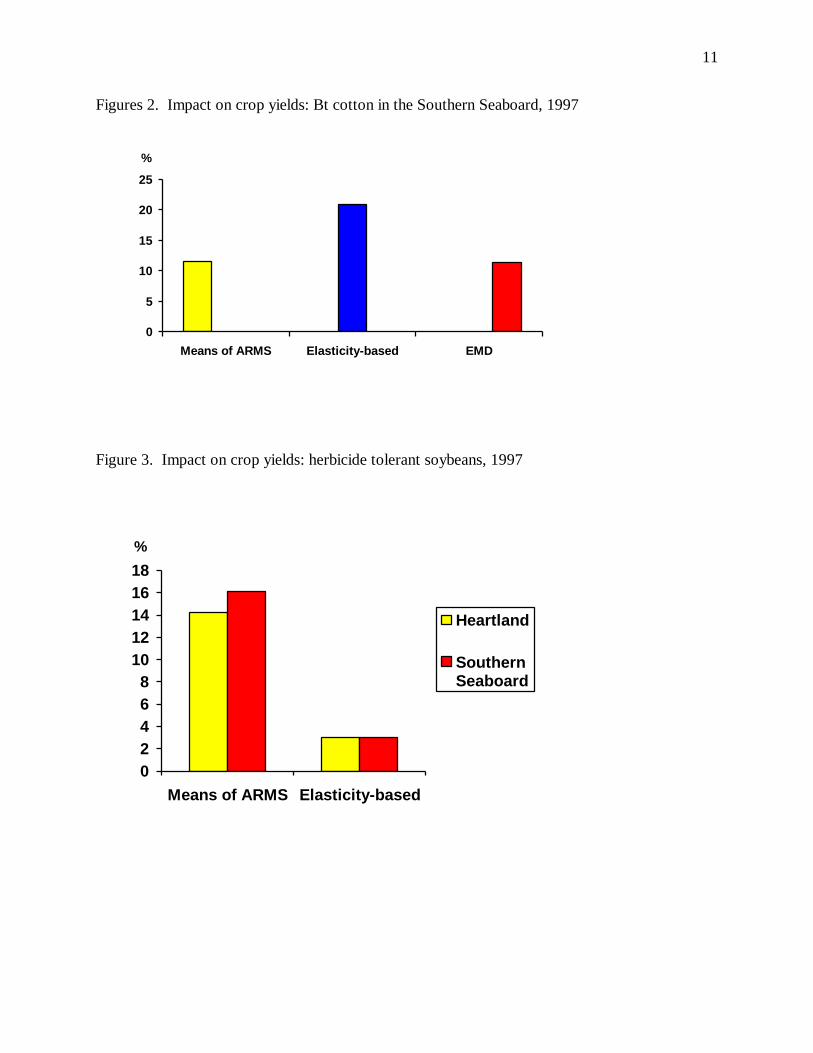
have been higher than those for nonadopters in all three data sources (fig. 1).3 However, the
yield increase varies across the data sources, ranging from an increase of about 11-12 percent
based on means of the ARMS survey and EMD database to 21 percent based on the elasticity
reported by Fernandez-Cornejo, Klotz-Ingram, and Jans (table 2 & fig. 2). For example,
according to mean values of the ARMS survey, while nonadopters' cotton lint yields averaged
about 700.0 pounds per acre in this region, Bt cotton adopters' showed an average of 780.9
pounds. Thus, evidence to date suggests that Bt cotton adopters' yields in 1997 might have been
about 11- 21 percent higher than for nonadopters in the Southern Seaboard.4
The effect of adopting herbicide-tolerant cotton varieties on cotton yields differed even more
starkly between means of the ARMS survey and the elasticity-based estimate. While adopters'
cotton yields are shown to have been lower than or no different from nonadopters' according to
means of the ARMS survey, the elasticity-based estimate indicates an overall 17-percent increase
in cotton yields for herbicide-tolerant cotton adopters (table 3). These results between the two
3 No elasticity-based estimate of the impact of adopting Bt cotton on crop yields is available for other productionregions.4 Marr et al. found that 1997 Bt cotton yields were 4 to 8 percent higher than that of conventional varieties, whichresulted in a benefit of $13 to $26 per acre for adopters.
8
Figure 1. ERS crop production regions

9
Table 2--Impact of adopting Bt cotton on crop yields by region and by data source, 1997
_______________________________________________________________________ Data Source
Production region Means of ARMS Elasticity-based EMD_______________________________________________________________________
Percent
Southern Seaboard +11.6 +21.0 +11.3Fruitful Rim +0.03 n.a. n.a.Mississippi Portal -0.01 n.a. + 3.7Eastern Uplands +22.4 n.a. n.a._______________________________________________________________________
n.a. = Not applicable.
Table 3--Impact of adopting herbicide-tolerant cotton on crop yields by region and by datasource, 1997_______________________________________________________________________
Data Source Production region Means of ARMS Elasticity-based_______________________________________________________________________
Percent
Southern Seaboard -1.16 n.a.Mississippi Portal -10.15 n.a.Prairie Gateway +1.00 n.a.Fruitful Rim 0 n.a.
U.S. total n.a. +17.0_____________________________________________________________________
n.a. = Not applicable.
data sources suggest that factors other than biotechnology might have caused cotton yields for
adopters of herbicide-tolerant varieties to be lower than that for nonadopters.
There are significant differences in the impacts of adopting herbicide-tolerant soybeans between
means of the ARMS survey and the elasticity-based estimates and across production regions
based on means of the ARMS survey. While adopters' 1997 yields are shown to have been

10
14.2-percent higher than those of nonadopters (averaging 44.4 bushels per acre) in the Heartland,
based on means of the ARMS survey, the elasticity-based estimate indicates only a 3-percent
higher yield for adopters (fig. 3). The small, 3-percent increase in yields based on the elasticity
estimate statistically isolates factors other than biotechnology, such as production practices, farm
operator's managerial ability, soil productivity, and weather, which affect crop yields. Thus, the
elasticity-based estimate reflects the impact on crop yields that is attributable to the technology,
and is consistent with findings of other studies that the adoption of herbicide-tolerant soybeans
has little or no overall impact on soybean yields (Gianessi and Carpenter; Moschini, Lapan, and
Sobolevsky).
Similar patterns also exist for the Southern Seaboard, Prairie Gateway, and Northern Great
Plains regions (table 4). Thus, studies using the yield estimates from means of the ARMS survey
(e.g., Falck-Zepeda, Traxler, and Nelsona) would inevitably overestimate the benefits from
biotech adoption for U.S. farmers.
Estimated Impacts on Pest Control Costs
Another fundamental question that needs to be addressed before estimating benefits from
biotechnology adoption is: "How much of the difference in pest control costs between adopters
and nonadopters is attributable to the adoption of biotechnology?" This section discusses the
impacts of the Bt and herbicide-tolerant technologies on cotton and soybean pest control costs
(including expenses associated with pesticide materials, pesticide application, scouting, and
cultivation) across the three data sources.
11
Figures 2. Impact on crop yields: Bt cotton in the Southern Seaboard, 1997
Figure 3. Impact on crop yields: herbicide tolerant soybeans, 1997
0
5
10
15
20
25
Means of ARMS Elasticity-based EMD
%
02468
1012141618
Means of ARMS Elasticity-based
%
Heartland
SouthernSeaboard

12
Table 4--Impact of adopting herbicide-tolerant soybeans on crop yields by region and by datasource, 1997___________________________________________________________________________
Data source__________________Production region Means of ARMS Elasticity-based___________________________________________________________________________
Percent
Heartland +14.23 n.a.Northern Crescent - 0.01 n.a.Southern Seaboard +16.13 n.a.Mississippi Portal - 0.09 n.a.Prairie Gateway +20.00 n.a.Eastern Uplands + 5.00 n.a.Northern Great Plains +10.81 n.a.
U.S. total n.a. +3.0___________________________________________________________________________
In general, pest control costs for Bt cotton adopters were lower in 1997 than those incurred by
nonadopters. However, the differences in pest control costs are quite large, depending on the
data source used for the estimation. For example, while pest control costs for Bt cotton adopters
averaged about 5-7 percent lower than nonadopters in the Southern Seaboard based on mean
differentials between adopters and nonadopters from the ARMS survey and elasticity-based
estimate, the savings reached as high as 60 percent based on the EMD data (table 5 & fig. 4).5
The estimate of pest control cost savings from the EMD data were obtained from a survey
of consultants based on matched pairs of Bt and non-Bt cotton fields, closely resembling a
controlled environment which isolates the effects of factors other than biotechnology itself. In
contrast, the elasticity-based estimate statistically isolates the effect of biotechnology from other
factors. Yet the estimates differ greatly, suggesting a lack of consensus based on empirical
5 A 69-percent saving in pest control costs for Bt cotton adopters in Georgia was reported by Stark. In addition,Mullins and Mills reported a 47-percent saving in per-acre pest control costs for Bt cotton in Tennessee.

13
Table 5--Impact of adopting Bt cotton on pest control costs by region and by data source, 1997____________________________________________________________________________
Data Source_____________________Production region Means of ARMS Elasticity-based estimate EMD____________________________________________________________________________
PercentSouthern Seaboard - 5.27 -7.08a -60.0Fruitful Rim -43.65 n.a. n.a.Mississippi Portal +28.63 n.a. -54.3Eastern Uplands -30.52 n.a. n.a.____________________________________________________________________________
aSee table 6 for the procedures used to derive the saving in pest control costs for adopters.n.a.= Not available.
evidence available to date. Thus, estimating benefits from biotechnology adoption based on the
EMD data (which include comparable cost items as in the ARMS data), such as the study on
1996 and 1997 Bt cotton by Falck-Zepeda, Traxler, and Nelsona,c, would result in much larger
benefits to U.S. farmers than based on other data sources.
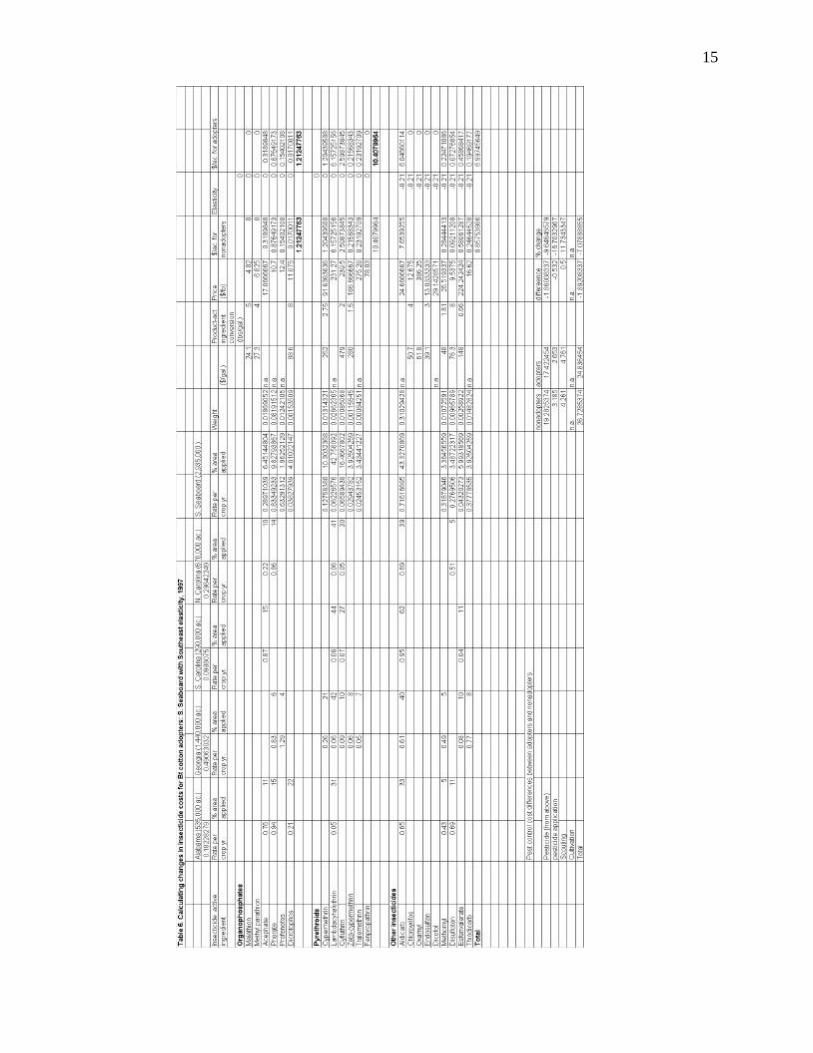
The elasticity-based estimate of the pest control cost difference between adopters and
nonadopters is estimated by making use of the elasticity determined by Fernandez-Cornejo,
Klotz-Ingram, and Jans. To illustrate, the first step is to estimate expenses associated with
pesticide material for nonadopters in a specific production region, such as the Southern Seaboard
in the case of Bt cotton. Based on NASS's chemical use data, the insecticide application rate per
crop year and the percent of area applied with insecticides are tabulated by insecticide ingredient
at the regional level, which were developed from state data (table 6). Insecticide active
ingredients are grouped into 3 categories: organophosphates, pyrethroids, and other insecticides.
Price data for insecticide active ingredients are obtained from NASSa and a database of 1996

14
Figures 4. Impact on pest control costs: Bt cotton in the Southern Seaboard, 1997
Figure 5. Impact on pest control cost savings: herbicide-tolerant soybeans, 1997
0
10
20
30
40
50
60
70
Means of ARMS Elasticity-based EMD
%
05
101520253035404550
Means of ARMS Elasticity-based
%
Heartland
SouthernSeaboard
15

16
prices developed by Gianessi and Marcelli. In cases where insecticide prices were expressed in
terms of dollars per pound of active ingredient, no adjustment of the price data was necessary.
However, in cases where price data were shown for final products in dollars per gallon, the final
product price was divided by the product-active ingredient conversion ratio (lbs/gal.) to obtain
prices for active ingredients ($/lb.). Multiplying the active ingredient price by the weighting
factor, which is the product of the application rate per crop year and the percent of area
applied,gives the expense associated with a specific active ingredient for nonadopters.
Continuing this calculation for all active ingredients and adding up the expenses across active
ingredients results in the total per-acre expense associated with pesticide materials--$19.28 for
nonadopters of Bt cotton in the Southern Seaboard. Including expenses for pesticide application,
scouting and cultivation (taken from the ARMS data) brings the total pest control cost to $26.73
per acre for nonadopters.
Pesticide material costs for adopters are estimated by accounting for any potential savings in
pesticide use, ingredient-by-ingredient, assuming application rates of each active ingredient are
the same for adopters and nonadopters. In the Southern Seaboard, the -0.21 elasticity for "other
insecticides" means that adopters' pesticide use would be about 21 percent lower than
nonadopters' pesticide use. Thus, expenses associated with the "other insecticides" decreased
from $8.86 per acre for nonadopters to $7.00 per acre for adopters in 1997. No change occurred
in the use of organophosphates and pyrethroids. As a result, expenses for total pesticide
materials totaled $17.42 per acre for adopters, nearly 10-percent lower than nonadopters.
Including expenses for pesticide application, scouting, and cultivation brings the total pest
control cost to $24.84 per acre for adopters, a decline of about 7.1 percent from those for
nonadopters (table 6).

17
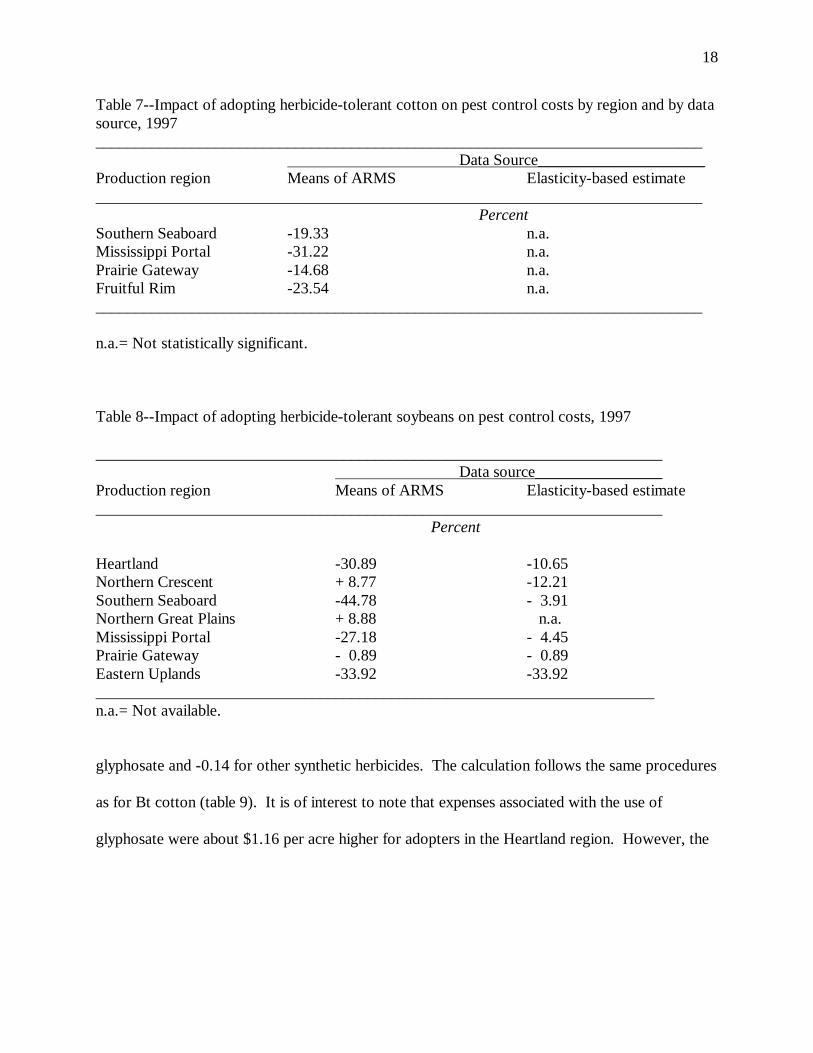
In the case of herbicide-tolerant cotton, mean differentials of the ARMS survey revealed a 15-31
percent savings in pest control costs in 1997, depending on the region (table 7). However, the
elasticity-based estimate indicates that there is no statistically significant effect on pest control
costs from the adoption of herbicide-tolerant cotton varieties. Much of the savings in pest
control costs, as indicated in mean differentials of the ARMS survey, could be attributed to
factors other than biotechnology.
Similar to Bt cotton, pest control costs for herbicide-tolerant soybean adopters were lower in
1997 than those incurred by nonadopters (table 8).6 However, adopters' savings in pest control
costs based on means of the ARMS survey were generally much higher than those based on the
elasticity-based estimates. For example, while pest control costs for adopters of herbicide-
tolerant soybeans were 31 percent lower than an average of $33.05 per acre for nonadopters in
the Heartland based on means of the ARMS data, the saving is estimated by the elasticity-based
approach to be 11 percent. Similar patterns exist between the two data sources for other regions.
The smaller saving in pest control costs for herbicide-tolerant soybean adopters from the
elasticity-based approach contradicts the much larger saving assumed in Moschini, Lapan, and
Sobolvsky's study, where the savings in herbicide expenses ranged from 48.9 percent to 66
percent, depending the number of additional Roundup treatments applied.
The elasticity-based estimate of the pest control cost difference between adopters and
nonadopters is estimated in the same manner as in the case of Bt cotton by making use of the
herbicide use elasticities estimated by Fernandez-Cornejo, Klotz-Ingram, and Jans-- +0.43 for
6 This is consistent with the finding by Marra et al. that in 1996, total herbicide costs decreased despite an increasein glyphosate--glyphosate costs rose by $13/ac. while expenditures for other herbicides fell by $24/ac. In 1999, 0.98pound per acre of herbicide were applied, down from 1.01 pounds per acre in 1995 (Carpenter and Gianessi(a)).Glyphosate usage increased 42 percentage points between 1995 and 1999, while the use of other herbicides(including trifluralin, pendamethoin, and imazethapyr) decreased (Carpenter and Gianessi (a, b)).
18
Table 7--Impact of adopting herbicide-tolerant cotton on pest control costs by region and by datasource, 1997____________________________________________________________________________
Data Source_____________________Production region Means of ARMS Elasticity-based estimate____________________________________________________________________________
PercentSouthern Seaboard -19.33 n.a.Mississippi Portal -31.22 n.a.Prairie Gateway -14.68 n.a.Fruitful Rim -23.54 n.a.____________________________________________________________________________
n.a.= Not statistically significant.
Table 8--Impact of adopting herbicide-tolerant soybeans on pest control costs, 1997
_______________________________________________________________________ Data source________________
Production region Means of ARMS Elasticity-based estimate_______________________________________________________________________
Percent
Heartland -30.89 -10.65Northern Crescent + 8.77 -12.21Southern Seaboard -44.78 - 3.91Northern Great Plains + 8.88 n.a.Mississippi Portal -27.18 - 4.45Prairie Gateway - 0.89 - 0.89Eastern Uplands -33.92 -33.92______________________________________________________________________n.a.= Not available.
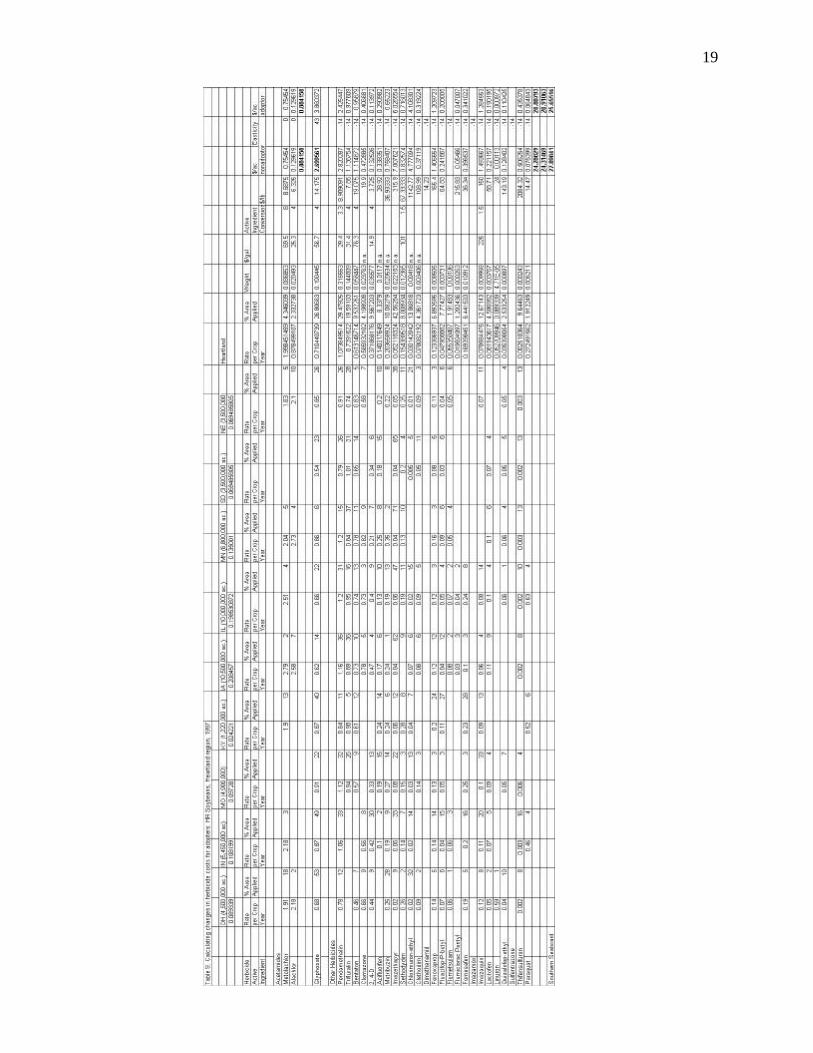
glyphosate and -0.14 for other synthetic herbicides. The calculation follows the same procedures
as for Bt cotton (table 9). It is of interest to note that expenses associated with the use of
glyphosate were about $1.16 per acre higher for adopters in the Heartland region. However, the
19

20
decline in expenses associated with the use of other herbicides--$3.40 per acre--more than offset
the increase in expenses for glyphosate. As a result, adopters' expenses for all pesticide materials
totaled $25.66 per acre, lower than the $27.89 per acre for nonadopters. Adopters of herbicide-
tolerant soybeans in the Heartland region are estimated to have realized a 10.65-percent pest
control cost saving (or $3.50 per acre) if herbicide applications, weed scouting, and cultivation
expenses, together with herbicide materials, are all included in the calculation of pest control
costs (figure 5 and table 9). Overall, pest control cost savings are estimated to range from 1
percent to 34 percent according to the elasticity-based estimate, depending on the production
region.
Implications for Pesticide Use
The above analysis of the effect on pest control costs has important implications for pesticide
use, which is what biotechnology promises to achieve in simplifying pest management, in
reducing the use of chemical inputs, and in increasing flexibility in field operations. If the
adoption of biotechnology leads to savings in pest control costs as well as pesticide use, then the
technology will not only benefit producers but also have positive environmental and health
benefits.
In the case of Bt cotton, it is clear that the adoption of the technology not only reduces pest
control costs but also, in general, lowers the use of insecticide active ingredients. While there is
no compelling evidence that shows any savings in the use of organophosphates and pyrethroids
for adopters, adopters' use of "other insecticides" is estimated to be 21 percent lower than for
nonadopters. As a result, pesticide use was lower for Bt cotton adopters than for nonadopters.

21
In contrast, the impact of adopting herbicide-tolerant soybeans on pesticide use is not completely
clear. The main reason is that while the adoption of herbicide-tolerant soybeans is estimated to
lower the use of "other herbicides" by 14 percent and have no effect on acetamides for adopters,
it is estimated to raise the use of glyphosate by 43 percent. Since average application rates vary
across pesticide active ingredients, the net effect of substituting one for another may be an
increase or a decrease in total pounds used. As a result, the impact on pesticide use is being
pulled in two opposite directions, depending on whether the decrease in "other herbicide" use can
outweigh the increase in glyphosate use. Results of the analysis show that the impact of
adopting herbicide-tolerant soybeans on pesticide use is mixed--a decline for the Heartland and
Prairie Gateway, but an increase for all other regions. Overall, the impact is a slight increase in
pesticide use (measured in pounds of active ingredients) nationwide in the case of herbicide-
tolerant soybeans. Measuring pesticide use in pounds of active ingredient implicitly assumes
that a pound of any two ingredients has equal impact on human health and/or the environment.
However, “other herbicides” being replaced by glyphosate, as a result of the adoption of
herbicide-tolerant soybeans, are at least 3 times as toxic and persist in the environment twice as
long as glyphosate (Heimlich et al.).
The decline in pesticide use (in terms of active ingredients applied) for adopters ranges from 1.78
percent in the Heartland region to 3.26 percent in the Prairie Gateway.7 For example, the use of
glyphosate increased from 0.19 pounds per acre for nonadopters to 0.27 pounds per acre for
adopters in the Heartland , an increase of 43 percent (table 10). In contrast, the use of "other
herbicides" decreased from 0.70 pounds per acre for nonadopters to 0.60 pounds per acre for
7 Heimlich et al. reported earlier that assuming application rates of each active ingredient are the same for adoptersand nonadopters, the net effect of adopting herbicide-tolerant soybeans is a reduction in acre-treatments (An acre-treatment is the number of acres treated multiplied by the number of pesticide treatments) but a slight increase inpesticide use (pounds of active ingredients) from 1997 to 1998. In contrast, the finding of this study suggests thatadoption of herbicide-tolerant soybeans has led to a decline in pounds of active ingredients in these 2 regions. Totalpesticide use has increased in other regions as a result of increasing adoption of herbicide-tolerant soybeans.

22
23
adopters. The end result is a decline in the use of all herbicides from 0.89 pounds for
nonadopters to 0.87 pounds for adopters, or a decline of 1.78 percent, which is lower than the 8.0
percent decline in pest control costs for adopters. The increase in herbicide use for other regions
are as follow: 8.35 percent, Northern Crescent; 11.74 percent, Mississippi Portal; and 10.89
percent, Southern Seaboard.
Conclusions
Estimates of the farm-level effects of adopting biotechnology differ significantly, depending on
the data source. A key challenge to analysts in these kinds of studies is to isolate the effects of
biotech adoption so that estimated farm-level effects can be attributed solely to the technology
itself. Estimates of the farm-level effects of adopting biotechnology derived from the elasticity-
based approach and the EMD data appear to be more plausible than those obtained from the
means of the ARMS survey because farm-level impacts obtained from the first two sources are
attributed more exclusively to biotechnology. Nonetheless, the use of one-year (1997) data in
this study has its limitations. As more data become available in the future, further analyses using
multi-year data would provide a more complete assessment.
The farm-level effects of biotech adoption on crop yields vary across varieties and data sources.
Bt cotton adopters' yields are estimated to be 21 percent higher than nonadopters in the Southern
Seaboard based on the elasticity-based estimate and 4-11 percent higher than nonadopters based
on the EMD data. Herbicide-tolerant cotton adopters' yields are estimated to be 17-percent
higher than nonadopters based on the elasticity-based estimate. In the case of herbicide-tolerant
soybeans, adopters' yields are estimated to be not much different from nonadopters'--only a 3-
percent increase for adopters.

24
The effects on pest control costs also vary across biotech varieties and in the case of Bt cotton,
vary significantly across data sources. While Bt cotton adopters' pest control costs are estimated
to be 7 percent lower than nonadopters in the Southern Seaboard based on the elasticity-based
estimate, the impact could reach 54-60 percent based on the EMD data. In contrast, no
statistically significant effect on pest control costs was found for herbicide-tolerant cotton
adopters. In the case of herbicide-tolerant soybeans, pest control costs for adopters in the
Heartland are estimated 11 percent lower than for nonadopters, with the effect ranging from 1-34
percent lower in other regions.
References
Carpenter, J. and L. Gianessi(a). “Case Study in Benefits and Risks of AgriculturalBiotechnology: Roundup Ready Soybeans” National Center for Food and AgriculturalPolicy (2000). http://www.ncfap.org/pup/biotech/icabr.pdf
_____(b). “Herbicide Tolerant Soybeans: Why Growers are Adopting Roundup ReadyVarieties.” AgBioForum 2(1999a): 65-72.
_____(c). “Why U.S. Farmers are Adopting Genetically Modified Crops.” EconomicPerspectives 1999b. http://www.ncfap.org/pup/biotech/economic%20perspectives.htm
Duffy, M. and A. Vontalge. "Estimated Costs of Crop Production in Iowa 1999." Iowa StateUniversity Extension, Fm-1712, January 1999.Http://www.extension.iastate.edu/Publications/FM1712.pdf.
Falck-Zepeda, J. B., G. Traxler, and R. G. Nelson(a). “Rent Creation and Distribution fromBiotechnology Innovations: The Case of Bt Cotton and Herbicide-Tolerant Soybeans in1997.” Agribusiness 16(2000): 21-32.
_____(b). “Surplus Distribution from the Introduction of a Biotechnology Introduction.”American Journal of Agricultural Economics 82(2000): 360-369.
Fernandez-Cornejo, J. and W. McBride. Genetically Engineered Crops for Pest Management onU.S. Agriculture: Farm-Level Effects. AER-786, ERS-USDA. April 2000.
Fernandez-Cornejo, J., C. Klotz-Ingram, and S. Jans. "Farm-Level Effects of AdoptingGenetically Engineered Crops in the U.S.A." Presented at the International Conference"Transitions in Agbiotech: Economics of Strategy and Policy" NE-165. Washington, DC. June24-25, 1999.

25
Gianessi, L. P. and J. E. Carpenter. “Agricultural Biotechnology: Insect Control Benefits.”National Center for Food and Agricultural Policy (1999).http://www.ncfap.org/pup/biotech/insectcontrolbenefits.pdf
____. Agricultural Biotechnology:Benefits of Transgenic Soybeans. National Center for Foodand Agricultural Policy. April 2000.
Gianessi, L. P. and M. B. Marcelli “Prices of Pesticide Active Ingredients (1996)” NationalCenter for Food and Agricultural Policy Oct. 1996.
Heimlich, R.E., J. Fernandez-Cornejo, W. McBride, C. Klotz-Ingram, S. Jans. "GeneticallyEngineered Crops: Has Adoption Reduced Pesticide Use?" Agricultural Outlook, ERS-USDA,Aug. 2000.
Marra, M., G. Carlson, and B. Hubbell. “ Economic Impacts of the First Crop Biotechnologies.”http://www.ag-econ.ncsu.edu:8250/faculty/marra/FirstCrop/sld001.htm
McBride W. D. "Using Cost and Return Data in Estimating Benefits from BiotechnologyAdoption." Presented at the American Agricultural Economics Association meeting, Tampa, FL.July 30 - August 2, 2000.
Moschini, G, H. Lapan, and A. Sobolevsky. “Roundup Ready® Soybeans and Welfare Effectsin the Soybean Complex.” Agribusiness 16(2000): 33-55.
Mullins, J. W. and J. M. Mills. “Economics of Bollgard Versus Non-Bollgard Cotton in 1998.”Proceedings of the Beltwide Cotton Conferences. vol. 2 958-960. P. Dugger and D. Richter,eds. Memphis, TN: National Cotton Council of America, 1999.
Plexis Marketing Group, Inc. and Timber Mill Research, Inc. Enhanced Market Data Cotton1997/1998 Report. Indianapolis, IN: Timber Mill Research, Inc. (1997).
Stark, C. R. Jr. “Economics of Transgenic Cotton: Some Indicators Based on GeorgiaProducers.” Proceedings of the Beltwide Cotton Conference. vol. 1 251-254 P. Dugger and D.Richter, eds. Memphis, TN: National Cotton Council of America, 1997.
U.S. Department of Agriculture, NASS. Agricultural Chemical Usage: 1997 Field CropsSummary. Ag Ch 1(98) May 1998.
U.S. Department of Agriculture, NASS(a) Agricultural Prices: 1997 Summary Pr 1-3(98) July1998.
Zelinski, L. J. and T. Kerby. Comparison of NUCOTN33(B) to Best Adapted VarietiesThroughout the U.S. Cotton Belt. Scott, MS: Delta and Pine Land Company. (1997).
Related Documents