Estimating Demand for Intercity Bus Services in a Rural Environment TRB 96 th Annual Meeting January 10, 2017 Jeremy Mattson Small Urban and Rural Transit Center Upper Great Plains Transportation Institute North Dakota State University

Welcome message from author
This document is posted to help you gain knowledge. Please leave a comment to let me know what you think about it! Share it to your friends and learn new things together.
Transcript

Estimating Demand for Intercity Bus
Services in a Rural Environment
TRB 96th Annual Meeting
January 10, 2017
Jeremy Mattson
Small Urban and Rural Transit Center
Upper Great Plains Transportation Institute
North Dakota State University
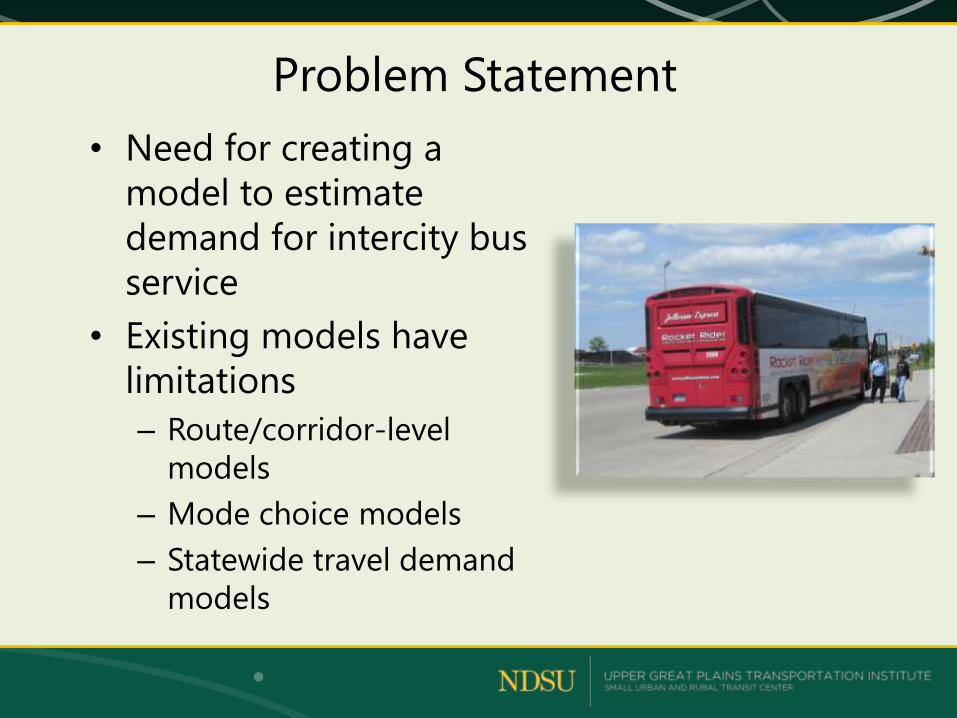
Problem Statement
• Need for creating a
model to estimate
demand for intercity bus
service
• Existing models have
limitations
– Route/corridor-level
models
– Mode choice models
– Statewide travel demand
models
Method
• Mode choice model
– Stated preference survey
– Mixed logit model
• Incorporated into a statewide travel demand model
• Contribution: Improve upon previous mode choice
models and include it in statewide model
• Applications
– Estimate demand throughout the state
– Estimate ridership on proposed services
– Estimate impact of potential service changes, changes in
fares or travel time, gasoline prices, etc.

Demographic characteristics
General transportation questions
Stated preference survey
Attitudinal questions

Survey Response Rate
Paper + Online Online Only Total
Sample 2,274 2,489 4,763
Responses* 393 148 541
Response Rate 17.3% 5.9% 11.4%
*For the paper+online survey, 341 paper surveys were completed, and 52 were
received online
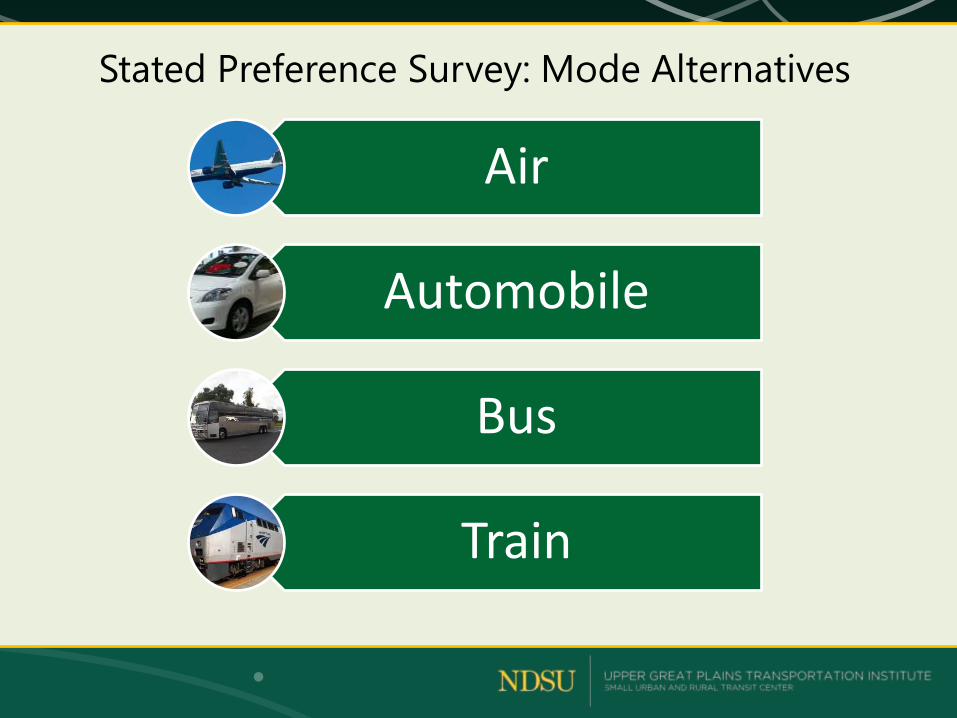
Stated Preference Survey: Mode Alternatives
Air
Automobile
Bus
Train

Attributes
Generic trip attributes
• Trip distance (50 miles, 100 miles, 250 miles, 400 miles)
• Trip type (business or personal)
• Party type (alone or in a group)
Mode-specific attributes
• Price
• Travel time
• Access distance
• Egress distance
• Service frequency
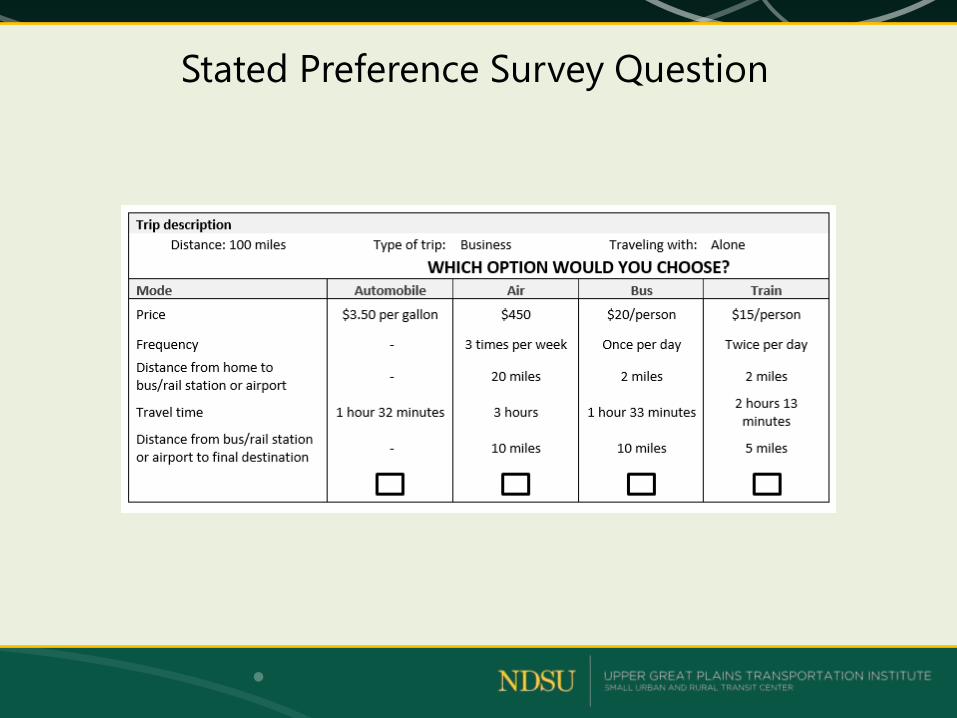
Stated Preference Survey Question

Attitudinal Questions
• 27 statements about travel with a 1-10 agree-
disagree scale
• Focuses on attitudes regarding
– Environment, time, flexibility, safety, stress, comfort,
reliability, privacy, convenience
• Derived from Outwater et al. (2004) and used
previously by Mattson et al. (2010)
• Uses
– Identify what is important to travelers
– Identify trends or changes in attitudes
– Estimate impacts of attitudes on mode choice

Response to Opinion Questions
Average
Score Statement
8.4If my travel options are delayed, I want to know the cause and length of the
delay.
8.1When traveling, I like to keep as close as possible to my departure and arrival
schedules.
8.0 It is important to have comfortable seats when I travel.
8.0 I prefer a travel option that has a predictable travel time.
7.8 A clean vehicle is important to me.
7.0 I would like to make productive use of my time when traveling.
6.8 I would change my form of travel if it would save me some time.
6.8 Having a stress-free trip is more important than reaching my destination quickly.
6.2 I would rather do something else with the time that I spend traveling.
5.9 Having privacy is important to me when I travel.
5.7 It’s important to be able to change my travel plans at a moment’s notice.
5.6 I need to make trips according to a fixed schedule.
5.6 I avoid traveling at certain times because it is too stressful.
5.6 The people who fly are like me.

Response to Opinion Questions
Average
Score Statement
5.5 I prefer to make trips alone, because I like the time to myself.
5.5 When traveling, I like to talk and visit with other people.
5.4 I’m willing to pay more for a ticket if it allows me to re-book my trip later for free.
5.0 I use the most convenient form of transportation regardless of cost.
5.0I always take the fastest route to my destination even if I have a cheaper
alternative.
4.7 I don’t mind traveling with strangers.
4.5 The people who use intercity rail service are like me.
4.5I would switch to a different form of transportation if it would help the
environment.
4.4 I worry about getting in an accident when I travel.
4.4 I don’t mind long delays as long as I’m comfortable.
4.1 The people who ride intercity bus are like me.
4.1 I would be willing to pay more when I travel if it would help the environment.
2.7 People who travel alone should pay more to help improve the environment.

Stated Preference Response
• 4,724 responses received from 541
respondents
• Mode choice responses:
4%
10%
13%
73%
Bus
Rail
Air
Automobile

Mode Choice by Individual Characteristics
Auto Air Bus Rail
Gender
Male 75 12 4 8
Female 70 14 4 12
Age
< 25 71 13 6 10
25-49 70 16 4 10
50-69 77 11 4 9
70+ 76 7 6 11
Household Income
<$25,000 69 11 6 14
$25,000 - $49.999 67 14 6 12
$50,000 - $74,999 78 10 4 8
$75,000 - $99,999 74 14 3 9
$100,000+ 74 14 3 9

Mode Choice by Trip Characteristics
Auto Air Bus Rail
Trip distance
50 miles 89 1 4 6
100 miles 85 2 4 8
250 miles 71 12 4 12
400 miles 45 37 5 14
Trip purpose
Personal 77 11 3 9
Business 69 15 5 11
Party Size
Alone 71 13 5 11
Group 75 13 3 8

Mode Choice by Mode CharacteristicsAuto Air Bus Rail
Price of gasoline
$2.00/gallon 79 12 3 6
$3.50/gallon 75 14 3 8
$5.00/gallon 65 14 6 15
Own-price
Low 79 16 5 13
Medium 75 13 5 9
High 65 10 3 8
Speed
Slow - 10 4 7
Medium - - 4 11
Fast - 16 5 11
Access distance
2 miles - 12 5 11
10 miles - 13 4 10
20 miles - 13 4 8
Egress distance
1 mile - 13 5 11
5 miles - 12 5 9
10 miles - 14 3 10
Frequency
Three times per week - 14 4 10
Once per day - 12 5 10
Twice per day - 13 5 9
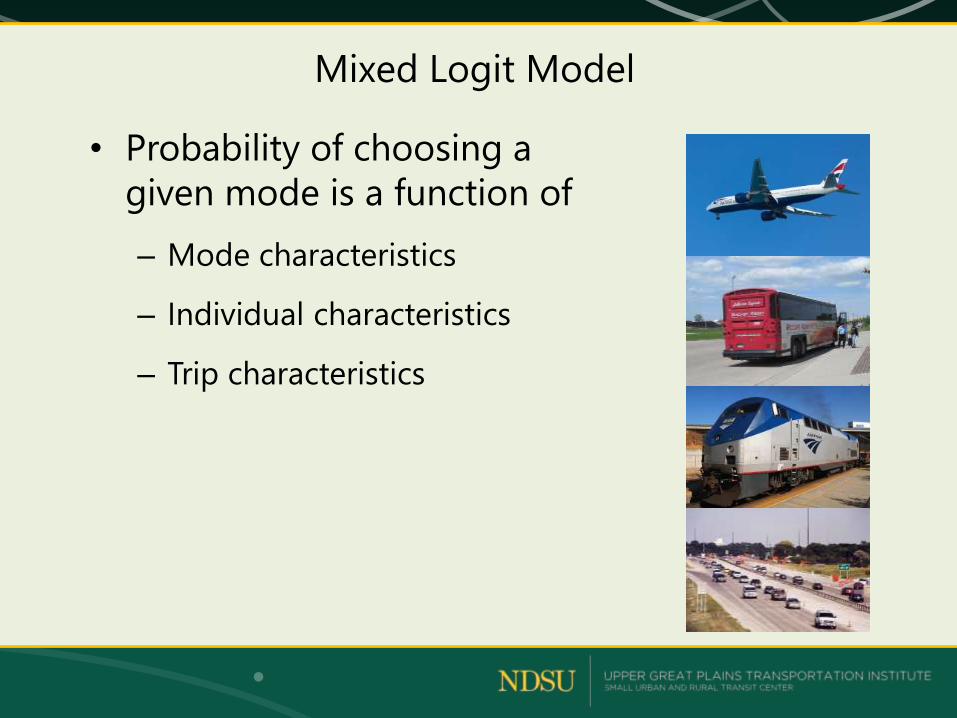
Mixed Logit Model
• Probability of choosing a
given mode is a function of
– Mode characteristics
– Individual characteristics
– Trip characteristics
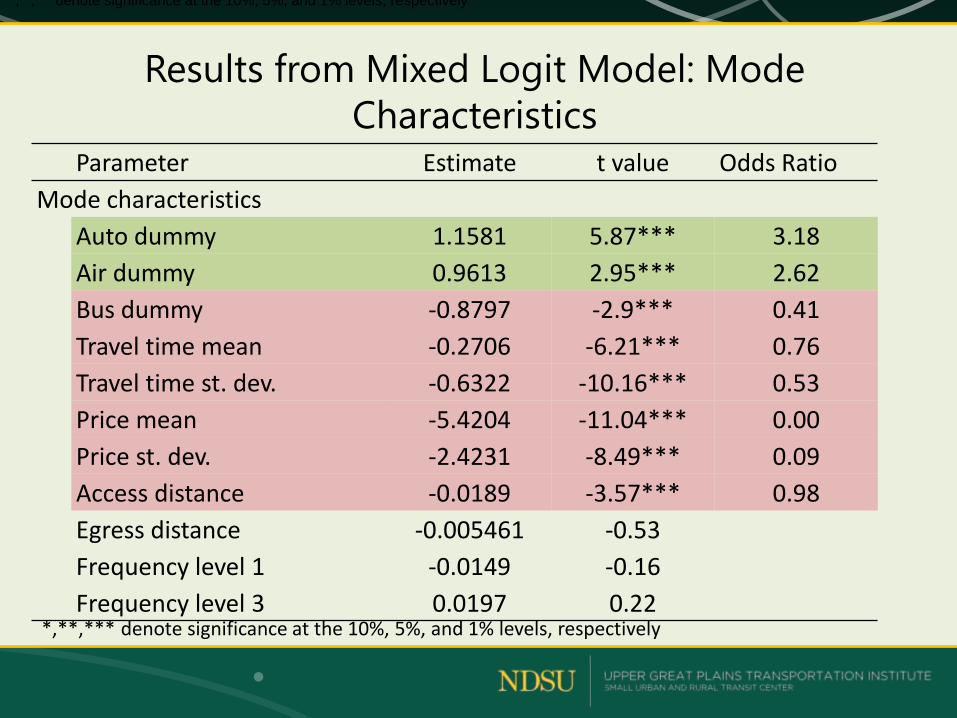
Results from Mixed Logit Model: Mode
CharacteristicsParameter Estimate t value Odds Ratio
Mode characteristics
Auto dummy 1.1581 5.87*** 3.18
Air dummy 0.9613 2.95*** 2.62
Bus dummy -0.8797 -2.9*** 0.41
Travel time mean -0.2706 -6.21*** 0.76
Travel time st. dev. -0.6322 -10.16*** 0.53
Price mean -5.4204 -11.04*** 0.00
Price st. dev. -2.4231 -8.49*** 0.09
Access distance -0.0189 -3.57*** 0.98
Egress distance -0.005461 -0.53
Frequency level 1 -0.0149 -0.16
Frequency level 3 0.0197 0.22
*,**,*** denote significance at the 10%, 5%, and 1% levels, respectively
*,**,*** denote significance at the 10%, 5%, and 1% levels, respectively
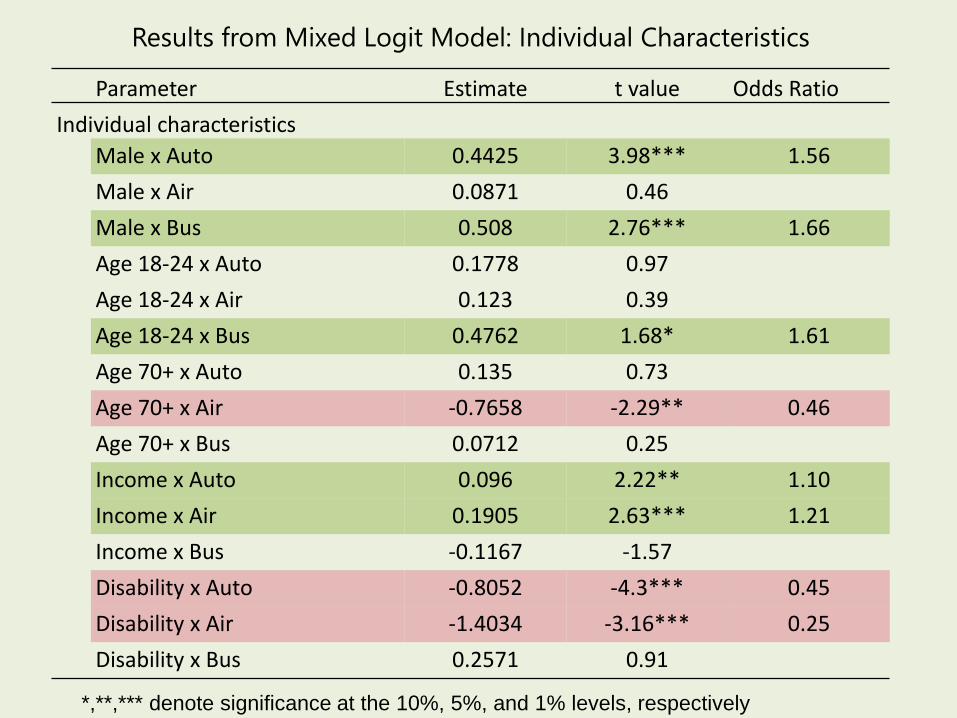
Results from Mixed Logit Model: Individual Characteristics
Parameter Estimate t value Odds Ratio
Individual characteristics
Male x Auto 0.4425 3.98*** 1.56
Male x Air 0.0871 0.46
Male x Bus 0.508 2.76*** 1.66
Age 18-24 x Auto 0.1778 0.97
Age 18-24 x Air 0.123 0.39
Age 18-24 x Bus 0.4762 1.68* 1.61
Age 70+ x Auto 0.135 0.73
Age 70+ x Air -0.7658 -2.29** 0.46
Age 70+ x Bus 0.0712 0.25
Income x Auto 0.096 2.22** 1.10
Income x Air 0.1905 2.63*** 1.21
Income x Bus -0.1167 -1.57
Disability x Auto -0.8052 -4.3*** 0.45
Disability x Air -1.4034 -3.16*** 0.25
Disability x Bus 0.2571 0.91
*,**,*** denote significance at the 10%, 5%, and 1% levels, respectively

Results from Mixed Logit Model: Trip
Characteristics
Parameter Estimate t value Odds Ratio
Trip characteristics
Travel alone x Auto -0.3531 -3.28*** 0.70
Travel alone x Air -0.2013 -1.11
Travel alone x Bus 0.1236 0.69
Personal trip x Auto 0.3108 2.88*** 1.36
Personal trip x Air -0.4977 -2.67*** 0.61
Personal trip x Bus -0.1997 -1.1
*,**,*** denote significance at the 10%, 5%, and 1% levels, respectively

Applying the Results
North Dakota Statewide Passenger
Travel Demand Model
Estimating Mode Shares
Scenario Analysis
Statewide Travel Demand Model
• North Dakota passenger travel demand model
under development
• Census block groups used as TAZs
• O-D matrix of trips across the state
• Number of bus trips for each O-D pair can be
estimated using results from mode choice model
• To account for demographics, TAZ data for age and
income is used

North Dakota Intercity Bus Network
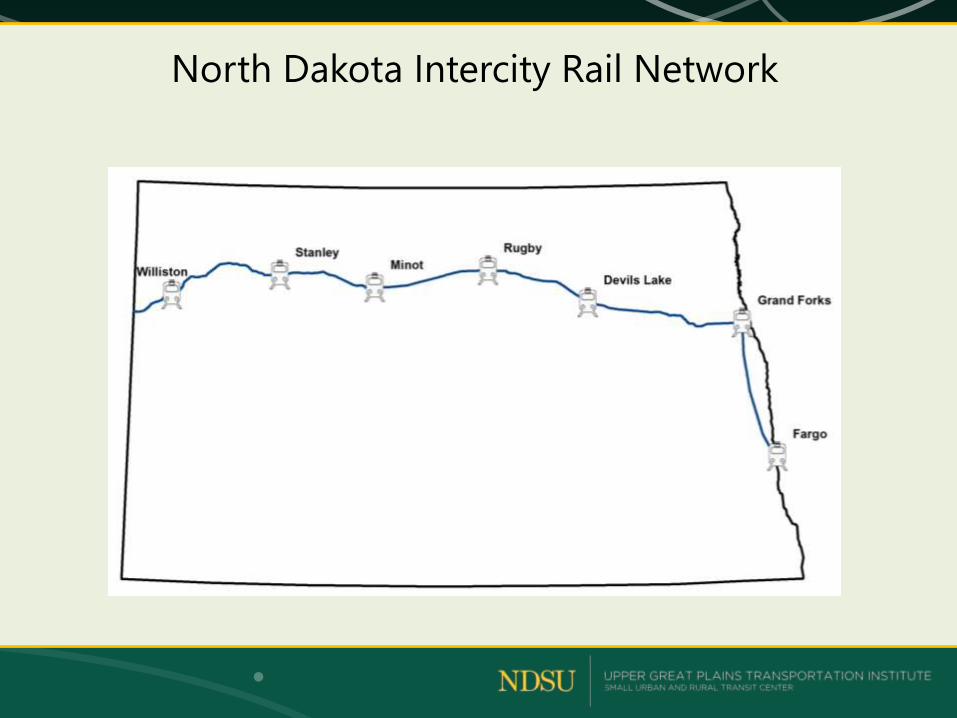
North Dakota Intercity Rail Network

TAZs within 25 Miles of Intercity Bus Stop
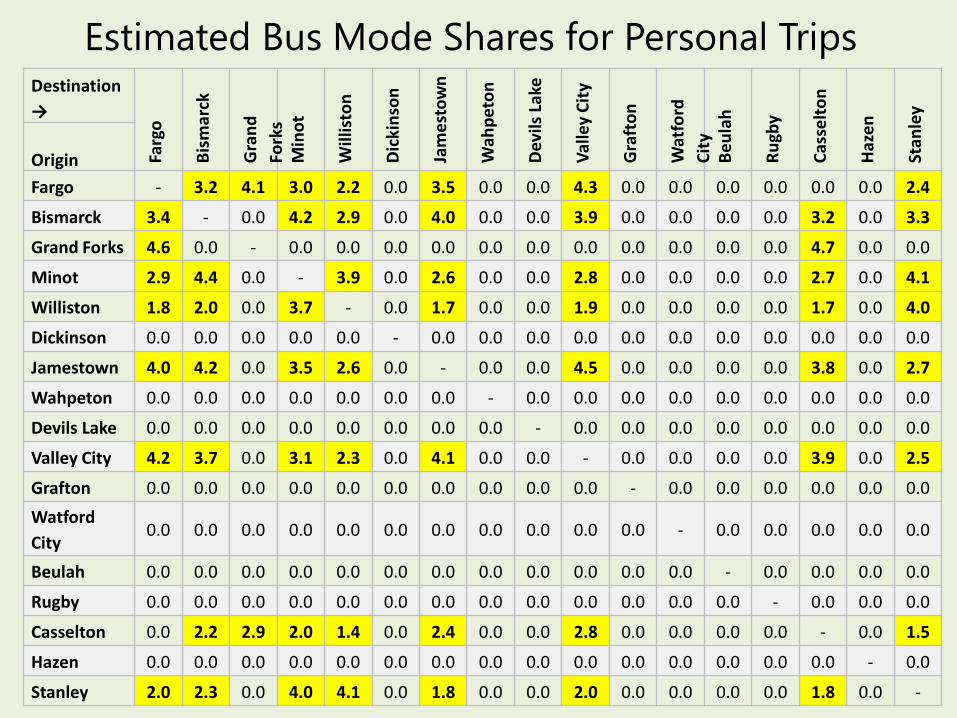
Estimated Bus Mode Shares for Personal TripsDestination
→
Farg
o
Bis
mar
ck
Gra
nd
Fork
sM
ino
t
Will
isto
n
Dic
kin
son
Jam
est
ow
n
Wah
pet
on
Dev
ils L
ake
Val
ley
Cit
y
Gra
fto
n
Wat
ford
Cit
yB
eu
lah
Ru
gby
Cas
selt
on
Haz
en
Stan
ley
Origin
Fargo - 3.2 4.1 3.0 2.2 0.0 3.5 0.0 0.0 4.3 0.0 0.0 0.0 0.0 0.0 0.0 2.4
Bismarck 3.4 - 0.0 4.2 2.9 0.0 4.0 0.0 0.0 3.9 0.0 0.0 0.0 0.0 3.2 0.0 3.3
Grand Forks 4.6 0.0 - 0.0 0.0 0.0 0.0 0.0 0.0 0.0 0.0 0.0 0.0 0.0 4.7 0.0 0.0
Minot 2.9 4.4 0.0 - 3.9 0.0 2.6 0.0 0.0 2.8 0.0 0.0 0.0 0.0 2.7 0.0 4.1
Williston 1.8 2.0 0.0 3.7 - 0.0 1.7 0.0 0.0 1.9 0.0 0.0 0.0 0.0 1.7 0.0 4.0
Dickinson 0.0 0.0 0.0 0.0 0.0 - 0.0 0.0 0.0 0.0 0.0 0.0 0.0 0.0 0.0 0.0 0.0
Jamestown 4.0 4.2 0.0 3.5 2.6 0.0 - 0.0 0.0 4.5 0.0 0.0 0.0 0.0 3.8 0.0 2.7
Wahpeton 0.0 0.0 0.0 0.0 0.0 0.0 0.0 - 0.0 0.0 0.0 0.0 0.0 0.0 0.0 0.0 0.0
Devils Lake 0.0 0.0 0.0 0.0 0.0 0.0 0.0 0.0 - 0.0 0.0 0.0 0.0 0.0 0.0 0.0 0.0
Valley City 4.2 3.7 0.0 3.1 2.3 0.0 4.1 0.0 0.0 - 0.0 0.0 0.0 0.0 3.9 0.0 2.5
Grafton 0.0 0.0 0.0 0.0 0.0 0.0 0.0 0.0 0.0 0.0 - 0.0 0.0 0.0 0.0 0.0 0.0
Watford
City0.0 0.0 0.0 0.0 0.0 0.0 0.0 0.0 0.0 0.0 0.0 - 0.0 0.0 0.0 0.0 0.0
Beulah 0.0 0.0 0.0 0.0 0.0 0.0 0.0 0.0 0.0 0.0 0.0 0.0 - 0.0 0.0 0.0 0.0
Rugby 0.0 0.0 0.0 0.0 0.0 0.0 0.0 0.0 0.0 0.0 0.0 0.0 0.0 - 0.0 0.0 0.0
Casselton 0.0 2.2 2.9 2.0 1.4 0.0 2.4 0.0 0.0 2.8 0.0 0.0 0.0 0.0 - 0.0 1.5
Hazen 0.0 0.0 0.0 0.0 0.0 0.0 0.0 0.0 0.0 0.0 0.0 0.0 0.0 0.0 0.0 - 0.0
Stanley 2.0 2.3 0.0 4.0 4.1 0.0 1.8 0.0 0.0 2.0 0.0 0.0 0.0 0.0 1.8 0.0 -
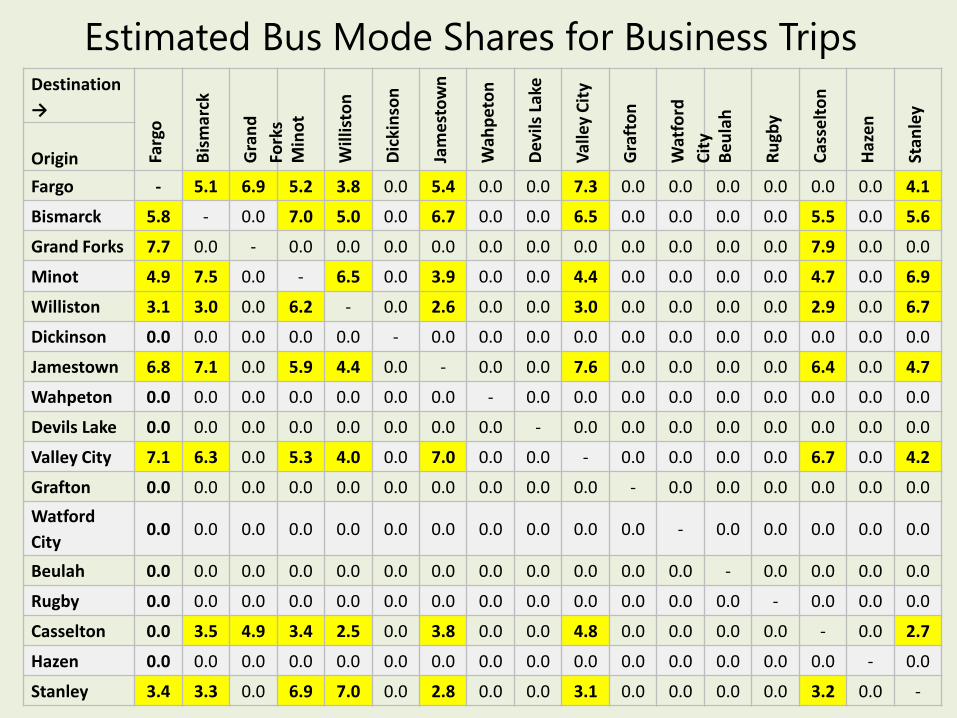
Estimated Bus Mode Shares for Business TripsDestination
→
Farg
o
Bis
mar
ck
Gra
nd
Fork
sM
ino
t
Will
isto
n
Dic
kin
son
Jam
est
ow
n
Wah
pet
on
Dev
ils L
ake
Val
ley
Cit
y
Gra
fto
n
Wat
ford
Cit
yB
eu
lah
Ru
gby
Cas
selt
on
Haz
en
Stan
ley
Origin
Fargo - 5.1 6.9 5.2 3.8 0.0 5.4 0.0 0.0 7.3 0.0 0.0 0.0 0.0 0.0 0.0 4.1
Bismarck 5.8 - 0.0 7.0 5.0 0.0 6.7 0.0 0.0 6.5 0.0 0.0 0.0 0.0 5.5 0.0 5.6
Grand Forks 7.7 0.0 - 0.0 0.0 0.0 0.0 0.0 0.0 0.0 0.0 0.0 0.0 0.0 7.9 0.0 0.0
Minot 4.9 7.5 0.0 - 6.5 0.0 3.9 0.0 0.0 4.4 0.0 0.0 0.0 0.0 4.7 0.0 6.9
Williston 3.1 3.0 0.0 6.2 - 0.0 2.6 0.0 0.0 3.0 0.0 0.0 0.0 0.0 2.9 0.0 6.7
Dickinson 0.0 0.0 0.0 0.0 0.0 - 0.0 0.0 0.0 0.0 0.0 0.0 0.0 0.0 0.0 0.0 0.0
Jamestown 6.8 7.1 0.0 5.9 4.4 0.0 - 0.0 0.0 7.6 0.0 0.0 0.0 0.0 6.4 0.0 4.7
Wahpeton 0.0 0.0 0.0 0.0 0.0 0.0 0.0 - 0.0 0.0 0.0 0.0 0.0 0.0 0.0 0.0 0.0
Devils Lake 0.0 0.0 0.0 0.0 0.0 0.0 0.0 0.0 - 0.0 0.0 0.0 0.0 0.0 0.0 0.0 0.0
Valley City 7.1 6.3 0.0 5.3 4.0 0.0 7.0 0.0 0.0 - 0.0 0.0 0.0 0.0 6.7 0.0 4.2
Grafton 0.0 0.0 0.0 0.0 0.0 0.0 0.0 0.0 0.0 0.0 - 0.0 0.0 0.0 0.0 0.0 0.0
Watford
City0.0 0.0 0.0 0.0 0.0 0.0 0.0 0.0 0.0 0.0 0.0 - 0.0 0.0 0.0 0.0 0.0
Beulah 0.0 0.0 0.0 0.0 0.0 0.0 0.0 0.0 0.0 0.0 0.0 0.0 - 0.0 0.0 0.0 0.0
Rugby 0.0 0.0 0.0 0.0 0.0 0.0 0.0 0.0 0.0 0.0 0.0 0.0 0.0 - 0.0 0.0 0.0
Casselton 0.0 3.5 4.9 3.4 2.5 0.0 3.8 0.0 0.0 4.8 0.0 0.0 0.0 0.0 - 0.0 2.7
Hazen 0.0 0.0 0.0 0.0 0.0 0.0 0.0 0.0 0.0 0.0 0.0 0.0 0.0 0.0 0.0 - 0.0
Stanley 3.4 3.3 0.0 6.9 7.0 0.0 2.8 0.0 0.0 3.1 0.0 0.0 0.0 0.0 3.2 0.0 -

Applications of Model
• Estimate impacts of changes in:
– The intercity bus network
– Service characteristics of intercity
bus
– Attributes of competing modes
– Demographics

Analysis of Attitudes and Mode Choice
Statement Mode Choice
Would rather do something else with the time I spend traveling
Less likely to choose automobile
Prefer predictable travel time More likely to choose automobile
Want to know the cause and length of delay
Less likely to choose air
Would change form of travel if it would save some time
More likely to choose air
Don’t mind traveling with strangers More likely to choose bus or rail
Worry about getting into an accident Less likely to choose automobile
Stress-free trip is more important than getting there quickly
More likely to choose bus and less likely to choose air
Clean vehicle is important More likely to choose automobile
Use the most convenient form of travel regardless of cost
More likely to choose auto or air, less likely to choose bus or rail
People who ride a given mode are like me More likely to use that given mode
Conclusions
• Intercity mode choice model estimated
incorporating individual, trip, and mode
characteristics
• Results show effects of travel time, cost, access
distance, age, income, disability, trip purpose, and
party size on mode share
• Results incorporated into statewide travel demand
model
• Application: Estimate effects of changes in service
characteristics, competing modes, demographic
shifts

Related Documents