Estimating belowground carbon stocks in peatlands of the Ecuadorian páramo using ground- penetrating radar (GPR) Xavier Comas 1 , Neil Terry 2 , John A. Hribljan 3 , Erik A. Lilleskov 4 , Esteban Suarez 5 , Rodney A. Chimner 3 , and Randy K. Kolka 6 1 Department of Geosciences, Florida Atlantic University, Davie, Florida, USA, 2 Department of Earth and Environmental Sciences, Rutgers, State University of New Jersey, Newark, New Jersey, USA, 3 School of Forest Resources and Environmental Science, Michigan Technological University, Houghton, Michigan, USA, 4 USDA Forest Service Northern Research Station, Houghton, Michigan, USA, 5 Colegio de Ciencias Biológicas y Ambientales, Universidad San Francisco de Quito, Cumbayá, Ecuador, 6 USDA Forest Service, Northern Research Station, Grand Rapids, Michigan, USA Abstract The páramo ecoregion of Ecuador contains extensive peatlands that are known to contain carbon (C) dense soils capable of long-term C storage. Although high-altitude mountain peatlands are typically small when compared to low-altitude peatlands, they are abundant across the Andean landscape and are likely a key component in regional C cycling. Since efforts to quantify peatland distribution and C stocks across the tropical Andes have been limited due to the difficulty in sampling remote areas with very deep peat, there is a large knowledge gap in our quantification of the current C pools in the Andean mountains, which limits our ability to predict and monitor change from high rates of land use and climate change. In this paper we tested if ground-penetrating radar (GPR), combined with manual coring and C analysis, could be used for estimating C stocks in peatlands of the Ecuadorian páramo. Our results indicated that GPR was successful in quantifying peat depths and carbon stocks. Detection of volcanic horizons like tephra layers allowed further refinement of variability of C stocks within the peat column, while providing information on the lateral extent of tephras at high (centimeter-scale) resolution that may prove very useful for the correlation of time-stratigraphic markers between sediments in alpine peatlands. In conclusion, this paper provides a methodological basis for quantifying C stocks in high-altitude peatlands and to infer changes in the physical properties of soils that could be used as proxies for C content or paleoclimate reconstructions. 1. Introduction Peatlands occur throughout the world from lowlands to high mountains, covering roughly 4 × 10 6 km 2 or 3–5% of the Earth’s land surface [Limpens et al., 2008; Roulet et al., 2007]. Peatlands are crucial in the global climate system because they sequester and emit greenhouse gases and are estimated to contain 450–600 Gt of carbon (C) [Gorham, 1991; Yu et al., 2010]. The majority of peatland research occurs in the bor- eal regions of the Northern Hemisphere. However, tropical peatlands are undergoing much higher rates of alteration by land use change (i.e., fire, agriculture, grazing, mining, and hydrological diversions) because they are often situated in areas with high population densities [Hooijer et al., 2010; Koh et al., 2011; Salvador et al., 2014]. Disturbances to tropical peatlands, which are currently estimated to contain 18–25% of the global peat volume [Page et al., 2011], have negative consequences for global C storage and green- house emissions. In addition, land use change can compromise ecosystem services derived from tropical peatlands that are essential to local populations including key wildlife habitat, regulation of air quality, sustainable grazing lands, and water storage and supply. The tropical Andean mountains of South America have numerous peatlands throughout the páramo ecore- gion of Venezuela, Colombia, Ecuador, and Peru [Chimner and Karberg, 2008; Hribljan et al., 2016; Samaniego et al., 1998]; the Jalca of Peru [Cooper et al., 2010]; and in the high-elevation puna ecoregion of Boliva, Chile, and Peru [Earle et al., 2003; Hribljan et al., 2015; Preston et al., 2003]. Individual mountain peatlands are typi- cally small in comparison to low-altitude peatlands, occurring primarily in basins and on slopes. Despite their small size, they exist in large numbers and contain deep peats and may be a key component in regional C stocks [Chimner et al., 2010; Hribljan et al., 2015; Viviroli et al., 2003]. However, peatland distribution and C stocks have only been quantified in a few areas across the tropical Andes [Chimner and Karberg, 2008; COMAS ET AL. ESTIMATING CARBON STOCKS IN THE PÁRAMO 370 PUBLICATION S Journal of Geophysical Research: Biogeosciences RESEARCH ARTICLE 10.1002/2016JG003550 Key Points: • Ground-penetrating radar was tested to quantify peat depths and refine C stocks in the Ecuadorian páramo • Imaging of tephras and changes in the reflection record show potential for time-stratigraphic correlations in alpine peatlands • A linear relationship was developed for estimating total C stock based on total peat volume in the Ecuadorian páramo Correspondence to: X. Comas, [email protected] Citation: Comas, X., N. Terry, J. A. Hribljan, E. A. Lilleskov, E. Suarez, R. A. Chimner, and R. K. Kolka (2017), Estimating below- ground carbon stocks in peatlands of the Ecuadorian páramo using ground- penetrating radar (GPR), J. Geophys. Res. Biogeosci., 122, 370–386, doi:10.1002/ 2016JG003550. Received 14 JUL 2016 Accepted 25 JAN 2017 Accepted article online 28 JAN 2017 Published online 18 FEB 2017 ©2017. American Geophysical Union. All Rights Reserved.

Welcome message from author
This document is posted to help you gain knowledge. Please leave a comment to let me know what you think about it! Share it to your friends and learn new things together.
Transcript
Estimating belowground carbon stocks in peatlandsof the Ecuadorian páramo using ground-penetrating radar (GPR)Xavier Comas1 , Neil Terry2 , John A. Hribljan3 , Erik A. Lilleskov4 , Esteban Suarez5 ,Rodney A. Chimner3 , and Randy K. Kolka6
1Department of Geosciences, Florida Atlantic University, Davie, Florida, USA, 2Department of Earth and EnvironmentalSciences, Rutgers, State University of New Jersey, Newark, New Jersey, USA, 3School of Forest Resources and EnvironmentalScience, Michigan Technological University, Houghton, Michigan, USA, 4USDA Forest Service Northern Research Station,Houghton, Michigan, USA, 5Colegio de Ciencias Biológicas y Ambientales, Universidad San Francisco de Quito, Cumbayá,Ecuador, 6USDA Forest Service, Northern Research Station, Grand Rapids, Michigan, USA
Abstract Thepáramoecoregion of Ecuador contains extensive peatlands that are known to contain carbon(C) dense soils capable of long-term C storage. Although high-altitudemountain peatlands are typicallysmallwhen compared to low-altitudepeatlands, they are abundant across theAndean landscape andare likelya key component in regional C cycling. Since efforts to quantify peatland distribution and C stocks across thetropical Andes have been limited due to the difficulty in sampling remote areas with very deep peat, there is alarge knowledge gap in our quantification of the current C pools in the Andeanmountains, which limits ourability to predict andmonitor change fromhigh rates of land use and climate change. In this paper we tested ifground-penetrating radar (GPR), combined with manual coring and C analysis, could be used for estimatingC stocks in peatlands of the Ecuadorian páramo. Our results indicated that GPR was successful in quantifyingpeat depths and carbon stocks. Detection of volcanic horizons like tephra layers allowed further refinement ofvariability of C stocks within the peat column, while providing information on the lateral extent of tephras athigh (centimeter-scale) resolution that may prove very useful for the correlation of time-stratigraphic markersbetween sediments in alpine peatlands. In conclusion, this paper provides a methodological basis forquantifyingC stocks inhigh-altitudepeatlands and to infer changes in thephysical properties of soils that couldbe used as proxies for C content or paleoclimate reconstructions.
1. Introduction
Peatlands occur throughout the world from lowlands to high mountains, covering roughly 4 × 10⁶ km2 or3–5% of the Earth’s land surface [Limpens et al., 2008; Roulet et al., 2007]. Peatlands are crucial in the globalclimate system because they sequester and emit greenhouse gases and are estimated to contain450–600Gt of carbon (C) [Gorham, 1991; Yu et al., 2010]. The majority of peatland research occurs in the bor-eal regions of the Northern Hemisphere. However, tropical peatlands are undergoing much higher rates ofalteration by land use change (i.e., fire, agriculture, grazing, mining, and hydrological diversions) becausethey are often situated in areas with high population densities [Hooijer et al., 2010; Koh et al., 2011;Salvador et al., 2014]. Disturbances to tropical peatlands, which are currently estimated to contain 18–25%of the global peat volume [Page et al., 2011], have negative consequences for global C storage and green-house emissions. In addition, land use change can compromise ecosystem services derived from tropicalpeatlands that are essential to local populations including key wildlife habitat, regulation of air quality,sustainable grazing lands, and water storage and supply.
The tropical Andean mountains of South America have numerous peatlands throughout the páramo ecore-gion of Venezuela, Colombia, Ecuador, and Peru [Chimner and Karberg, 2008; Hribljan et al., 2016; Samaniegoet al., 1998]; the Jalca of Peru [Cooper et al., 2010]; and in the high-elevation puna ecoregion of Boliva, Chile,and Peru [Earle et al., 2003; Hribljan et al., 2015; Preston et al., 2003]. Individual mountain peatlands are typi-cally small in comparison to low-altitude peatlands, occurring primarily in basins and on slopes. Despite theirsmall size, they exist in large numbers and contain deep peats and may be a key component in regional Cstocks [Chimner et al., 2010; Hribljan et al., 2015; Viviroli et al., 2003]. However, peatland distribution and Cstocks have only been quantified in a few areas across the tropical Andes [Chimner and Karberg, 2008;
COMAS ET AL. ESTIMATING CARBON STOCKS IN THE PÁRAMO 370
PUBLICATIONSJournal of Geophysical Research: Biogeosciences
RESEARCH ARTICLE10.1002/2016JG003550
Key Points:• Ground-penetrating radar was testedto quantify peat depths and refine Cstocks in the Ecuadorian páramo
• Imaging of tephras and changes in thereflection record show potential fortime-stratigraphic correlations inalpine peatlands
• A linear relationship was developedfor estimating total C stock based ontotal peat volume in the Ecuadorianpáramo
Correspondence to:X. Comas,[email protected]
Citation:Comas, X., N. Terry, J. A. Hribljan, E. A.Lilleskov, E. Suarez, R. A. Chimner, andR. K. Kolka (2017), Estimating below-ground carbon stocks in peatlands ofthe Ecuadorian páramo using ground-penetrating radar (GPR), J. Geophys. Res.Biogeosci., 122, 370–386, doi:10.1002/2016JG003550.
Received 14 JUL 2016Accepted 25 JAN 2017Accepted article online 28 JAN 2017Published online 18 FEB 2017
©2017. American Geophysical Union.All Rights Reserved.

Hribljan et al., 2015; Hribljan et al., 2016]. Thus, there is a large knowledge gap in our understanding of thecurrent C pool present in the Andean mountains that limits C accounting initiatives for South America.Moreover, because of limited peatland characterization in the Andes, we do not have a benchmark for usein quantifying the high rate of land use change (e.g., grazing, drainage, and water diversions) and/or futureclimatic effects to these ecosystems.
Measuring C stocks in mountain peatlands is challenging, especially in the Andes due to the remote andrugged terrain, high altitude, and dense and deep peat deposits. The peat soils in the Andes are also com-monly interbedded with multiple layers of volcanic ash and pumice [Hribljan et al., 2016]. Additionally, peatsoils in the Andes commonly have a high mineral content due to depositional input from fluvial and aeolianprocesses [Chimner and Karberg, 2008; Hribljan et al., 2015]. Therefore, the soils can be extremely difficult tocore. Furthermore, mountain peatlands typically have a complex basin morphology that is challenging to sur-vey. Rapid probing methods have been developed to reduce sampling time and effort [Chimner et al., 2014]and provide a means for basin quantification. However, probing has technical issues because of (1) the highmineral content of the peat and (2) underlying lake sediments that make it difficult to determine the transi-tional zone between the peatland and the underlying mineral substratum in some mountain basins [Parryet al., 2014]. Therefore, conducting extensive peatland soil surveys across the Andean landscape with precisebasin morphology determinations is limited by current approaches and hinders our ability to accurately scaleC stocks to the Andean landscape.
To overcome some of the difficulties and limitations with coring and probing mountain peatlands, we testedthe feasibility of utilizing noninvasive ground-penetrating radar (GPR) as a tool to characterize the basin mor-phology and C content of mountain peatlands in the páramo of northern Ecuador. GPR has been used tostudy peatland ecosystems for nearly three decades. Most of its applications relate to the determination ofpeat thickness and the detection of stratigraphical features [Jol and Smith, 1995;Warner et al., 1990], determi-nation of moisture content [Theimer et al., 1994], or stratigraphic controls on peatland hydrology [Comas et al.,2004; Comas et al., 2005a; Slater and Reeve, 2002]. More recently, several studies using GPR have investigatedmultiple aspects of C cycling in peatlands including the quantification and monitoring of biogenic gases inpeatlands (mainly methane and carbon dioxide) in northern [Comas et al., 2005b, 2007, 2008; Parsekianet al., 2011; Strack and Mierau, 2010] and subtropical systems [Comas and Wright, 2014; Wright and Comas,2016]. The method has also been used to refine C stocks in peat soils both in northern peatlands[Parsekian et al., 2012] and tropical systems [Comas et al., 2015]. However, to our knowledge, GPR has neverbeen used in tropical mountain peatlands or in other similar high-altitude peatland systems throughout theworld. Furthermore, although tephra layers still need to be isotopically dated at specific peatlands, the use ofGPR has potential as a valuable method for the quantification of volcanic depositional horizons, which couldprovide a valuable proxy and low-cost alternative as synchronous peat time markers.
We tested the applicability of GPR (constrained with manual coring and C analysis) for estimating C stocks inpeatlands of the Ecuadorian páramo. The unique presence of tephra layers at the study sites helps to define Ccontent distribution with depth and allows better constraint of C stock estimates from the GPR by laterallyisolating individual layers (i.e., in between GPR reflectors) with specific C content and detecting their thick-ness variability with centimeter resolution. Furthermore, it shows the potential of GPR for imaging the lateralextent of tephra layers for time-stratigraphic correlations between sediments in alpine peatlands. Our objec-tives were to test the ability of GPR to (1) distinguish the basal peat/mineral contact from substratum soils forpeat depth calculations and basin morphology characterization, (2) estimate soil C density for C stock deter-minations of mountain peatland soils as a substitute for direct soil coring and analysis, and (3) detect tephralayers throughout the peatland that could be used for peat dating. Applying GPR technology to alpine peat-lands in volcanically active regions will be an important step forward in developing more efficient high-resolution methods for quantifying C dynamics in high-altitude wetlands.
2. Study Sites
This study was conducted in the South American Andean páramo, which extends north of Ecuador intoColombia and Venezuela and south into Perú (Figure 1a). Sites were located in the eastern branch of theEcuadorian Andes, at altitudes approximately between 3950 and 4250m and surrounded by three volcanoes:Cayambe, Antisana, and Cotopaxi with elevations of 5790m, 5704m, and 5897m, respectively. A total of four
Journal of Geophysical Research: Biogeosciences 10.1002/2016JG003550
COMAS ET AL. ESTIMATING CARBON STOCKS IN THE PÁRAMO 371

peatland sites (Figures 1b and 1c) were investigated following the core locations from a previous study[Hribljan et al., 2016] and included (a) three sites located at the Cayambe-Coca National Park (Sites 1–3)and (b) one site located at the Antisana Ecological Preserve (Site 4).
The Ecuadorian volcanic arc corresponds to the northern volcanic zone of the Andean volcanic belt and hasbeen very active in terms of volcanic eruptions since the late Pliocene with 50 or more eruptive centers[Barberi et al., 1988], with several of them currently active. Study sites are located in what is known as theEastern Cordillera, a linear grouping characterized by stratovolcanoes underlain by Paleozoic and Mesozoicmetamorphic rocks and Late Tertiary volcanics (see Hall et al. [2008] for a review on volcanism in theEcuadorian Andes). According to this review, volcanoes in the Eastern Cordillera are also characterized by(1) recent periodic eruptions (i.e., Cotopaxi had periodic eruptions at 100 ± 50 year intervals, while they areless frequent for Cayambe and Antisana), (2) ash and scoria lapillus falls during eruptions that were trans-ported in the direction of the dominant E-ESE trade winds, and (3) andesitic lava flows that travelled up to50 km down adjacent valleys. These valleys were carved by the last glacial period inducing the formationof numerous lakes and ponds [Schubert and Clapperton, 1990]. Moreover, all out sites are part of theChacana caldera, a large (~50 km) Pleistocene volcanic complex which most recent activity dates from theeighteenth century [Hall and Mothes, 2008].
The sites selected for this study followed locations previously cored by Hribljan et al. [2016], where vegetationis dominated by a matrix of cushion plants (mainly Plantago rigida) and mosses (e.g., Breutelia spp. andCampylopus spp.), interspersed with grasses and small shrubs including Cortaderia sericantha,Calamagrostis intermedia, Disterigma empetrifoilum, and Hypericum sprucei. While Sites 1–3 were more diverseand showed no signs of human disturbance, Site 4 was dominated by P. rigida and has current cattle grazingthat dates back about two centuries.
3. Methods and Experimental Field Design
An array of minimally invasive ground-penetrating radar (GPR) measurements (i.e., indirect method) wascombined with manual coring and C analysis in the laboratory (i.e., direct method) to achieve the goals ofthe study.
Figure 1. (a) Satellite image showing the location of the study sites in the context of the Andean páramo and surroundedby three main volcanoes: Cayambe, Antisana, and Cotopaxi. (b and c) Satellite images showing the location of the fourpeatlands sites (Sites 1–4) investigated in this paper. Source: Google Earth, 17M, 806,895.6 m E, and 9,943,711.8m S, 13December 2015, Data SIO, NOAA, U.S. Navy, NGA, GEBCO Image Landsat.
Journal of Geophysical Research: Biogeosciences 10.1002/2016JG003550
COMAS ET AL. ESTIMATING CARBON STOCKS IN THE PÁRAMO 372

3.1. Manual Coring and C Analysis
In order to obtain a record as complete as possible for the entire peat column from the surface down to thepeat-basal mineral contact, coring locations at each site were selected at the center of each basin (generallyrepresenting the thickest part of the basin). Further details on site selection can be found at Hribljan et al.[2016]. Depths to the mineral soil interface ranged approximately between 3.5 and 6.5m for Sites 1–4 (S1–S4) as shown in Figure 2. The upper 1m at each site was cored with a 6.35 cm diameter open faced gougeauger (AMS Inc., American Falls, ID, USA) in order to minimize compaction of the surface. The remainder ofthe peat core was sampled with either the open faced gouge auger or a Russian peat corer (AquaticResearch Instruments, Hope, ID, USA). While still in the field, and immediately after extraction, cores weretypically cut into 5–10 cm sections; placed in soil tins; and transported to the Wetlands Laboratory atMichigan Technological University, USA, for further analyses. Thickness was varied to isolate distinct layerswith high concentrations of mineral material (tephra or alluvium) from organic-rich layers.
Soils were dried in the laboratory using a convection oven at 65°C until a constant mass was achieved.Samples were ground and homogenized to a powder using a ball mill and dried again at 65°C. As coringin these dense peats showed no evidence of compression, dry bulk density (g cm�3) was calculated by divid-ing the oven dried soil mass by the original sample volume from the gouge auger or Russian peat corer.Subsamples of 1 g for each section along each core were used for estimating soil organic matter contentthrough loss of ignition (i.e., samples placed at 550°C for a minimum of 5 h). A subset of 400 samples was ana-lyzed for %C with an elemental analyzer (Costech 4010, Valencia, CA, USA, and Fisons NA 1500, Lakewood, NJ,USA). The linear equation C (%) = (0.5324 × loss on ignition (LOI) (%))� 0.9986 (R2 = 0.989; p< 0.001) wasdeveloped on the relationship between LOI and %C to calculate C content in the remaining samples not ana-lyzed by elemental analysis. Since no carbonates are present in the soils of the páramo, total soil C wasassumed be equal to total organic C content. To estimate the total C content (kg) of each peat horizondetected by the GPR we used the product of the mean dry bulk density (g cm�1) from the core for thehorizon, volume of peat for the entire layer (m�3), and the mean %C from the core for the horizon.
Figure 2. Bulk density (g cm�3) and C content (%) estimates with depth for cores collected at (a) Site 1 (S1), (b) Site 2 (S2), (c) Site 3 (S3), and (d) Site 4 (S4). Samplinginterval for all cores is 5–10 cm. Depth of the interface peat-mineral soil for each core is shown as a solid black line.
Journal of Geophysical Research: Biogeosciences 10.1002/2016JG003550
COMAS ET AL. ESTIMATING CARBON STOCKS IN THE PÁRAMO 373
3.2. Ground-Penetrating Radar (GPR) Method
The GPR method is based on a transmitting antenna (Tx) that generates a high-frequency electromagnetic(EM) wave (generally ranging between 25 and 2,000MHz) that penetrates the subsurface and is returnedto a receiving antenna (Rx) as a sequence of reflections from stratigraphic interfaces. The velocity of thisEM wave is controlled by the relative dielectric permittivity (εr), which is a geophysical property that dependsstrongly on soil water content. Since changes in bulk density and organic matter content imply changes inmoisture content, sediment interfaces showing such changes in physical properties are expected to resultin contrasting GPR reflections [e.g., Warner et al., 1990]. Limitations in terms of EM wave propagation resultwhen soils present high fluid electrical conductivity and/or contain high proportions of clay, resulting inexcessive EM wave attenuation and thus reducing the depth of penetration in peat [Theimer et al., 1994].
Data acquisition using GPR was performed in two basic operation modes, constant-offset (CO) profilingand common midpoint (CMP) surveys. In the CO mode, transmitter and receiver antennae are separatedby a fixed distance at the surface and the two-way travel time of the EM wave from the transmitter toreflectors at depth is returned to the receiver and recorded. Profiles collected in the CO mode typicallyshow a series of reflections commonly interpreted as sedimentary interfaces or layers with contrastingwater contents that resemble a geologic cross section, where the vertical scale is expressed as a two-way travel time (and later converted into a depth typically using the CMP surveys). Constant-offset surveyshave been commonly used to image the stratigraphy of the peat sequence (e.g., location of possible con-fining layers) and to determine depth to the mineral soil contact [Comas and Slater, 2009; Slater and Reeve,2002; Warner et al., 1990]. In the CMP mode the two-way travel time is recorded as the transmitter andreceiver pair is separated by increasingly larger distances resulting in a radar reflection profile that depictshow travel time increases as a function of antenna separation (i.e., distance). The relationship betweentravel time and antenna separation (i.e., time-distance) is then used to generate models of EM wave velo-city (or εr) with depth along the center point (i.e., midpoint) of the survey [Greaves et al., 1996]. The infor-mation on average EM wave velocity provided by the CMP profiles in this study was critical for convertingtime into depth scale in the COs presented (i.e., specific average velocity values are indicated in the depthscale for each CO). Average velocity for the entire peat column was inferred from the relation time-distance to the reflector representing the peat-mineral soil in each case.
GPR surveys were measured using a Mala RAMAC GPR with 100 and 200MHz unshielded antennae forcollecting the CMPs and with a set of 50 and 100MHz rough terrain antennae (RTA) for collecting the COs.Trace spacing was set to 0.1m for CMPs and 0.2m for COs, both with 16 stacks per trace, and a sampling timewindow ranging between 500 and 1000 ns depending on antennae frequency. Manual keyboard and hip-chain (an odometer wheel) modes were used to trigger data acquisition for CMPs and COs, respectively.The combination of RTA antennae and hip-chain triggering allowed for the collection of long CO profiles(hundreds of meters) in a time-efficient manner (walking pace). GPR data processing was performed usingReflexW by Sandmeier Geophysical Research. Steps were limited to (a) a “dewow” filter to eliminate low fre-quencies by subtracting amean amplitude calculated for each trace over a 10 ns time window, (b) applicationof a time-varying gain to distribute amplitude equally in the time axis for each trace, (c) a band-pass filter toeliminate high- and low-frequency noise, and (d) a static correction to eliminate the time delay betweentriggering and recording. Elevation corrections were also applied whenever profiles extended over the edgeof the peatland basin (as measured in the field with a level); however, peatland topography was consideredinsignificant over the length of the survey lines.
3.3. Experimental Field Design
To test the ability of GPR to better refine C stocks an array of GPR constant-offset (CO) and commonmidpoint(CMP) profiles were combined with direct cores at each of the four study sites. At Site 1 a three-dimensional(3-D) survey was deployed consisting of an array of eight orthogonal COs, four in the E-W direction and four inthe N-S direction with a lateral spacing between profiles of 9m and 30m, respectively. The core was approxi-mately located in the center of the array coinciding with the location of the CMP. Given time constraints andsince this site represents one of the smallest in terms of spatial extent, Site 1 was used as the testing locationfor deploying the more time-consuming 3-D survey. At the rest of the sites (Sites 2, 3, and 4), only a set of twoorthogonal lines crossing at the location of the core were gathered. In this case a CMP was also collectedcoinciding with the location of the core.
Journal of Geophysical Research: Biogeosciences 10.1002/2016JG003550
COMAS ET AL. ESTIMATING CARBON STOCKS IN THE PÁRAMO 374
3.4. Calculation of C Stocks
Calculation of C stocks for each site was based on the average C content and average bulk density of a seriesof layers bounded by distinctive reflections in the GPR profiles. In most cases these distinctive GPR reflectorscorresponded to either pumice or ash layers that were easily detectable (i.e., visually) in the core; however, itis important to note that certain GPR reflections related to obvious changes in C content (i.e., after laboratoryanalysis) were difficult to visually detect in the core. For Site 1 a surface modeling software (Surfer by GoldenSoftware) was used to estimate the surface area corresponding to each specific GPR reflection chosen fromthe 3-D grid. A volume defined by an upper and lower surface is then calculated for each pair of chosenreflections along the core using the extended trapezoidal rule, which estimates the area between surfacesby dividing it into parallel strips of equal width with each strip being a trapezoid. As time constraints didnot allow for full 3-D GPR surveys for Sites 2–4 and only two orthogonal lines were collected, volumes weredetermined in reference to a set of reflectors detected along the core using a simple oblate spheroid equa-tion and considering that depressions represent half of that spheroid. For this approach, GPR profiles wereused to determine the axes for the spheroid for each reflector, using the horizontal lengths for each reflectoras defined from the GPR profiles and the depth as defined from the GPR profiles and confirmed from the cor-ing. The main difference between this approach and the 3-D grid is the fact that the spheroid assumes thatthe reflectors are perfectly horizontal, bringing an additional error to our estimates. To evaluate the errorimplied with this simplification, both methods for estimating total C stock were used for Site 1.
4. Results4.1. Coring and C Analysis
All coring and laboratory C analyses are based on the work presented by Hribljan et al. [2016]. Figure 2 showsthe coring results for the four study sites (Sites 1–4 (S1–S4)). In all cases, dry bulk density (in g cm�3) and Ccontent (in percent) with depth are shown for intervals between 5 and 10 cm. Depth to the mineral soil is alsoindicated for each site. Maximum bulk density values for each site are 1.11 g cm�3, 0.70 g cm�3, 0.85 g cm�3,and 1.71g cm�3 for Sites 1–4, respectively, while average bulk densities for the entire column are 0.35 g cm�3,0.27 g/cm�3, 0.31 g cm�3, and 0.73 g cm�3 for Sites 1–4, respectively. Carbon content ranges between 33.6%(maximum) and 0.6% (minimum) for Site 1, 46.3 and 3.3% for Site 2, 35.6 and 1.5% for Site 3, and 48.6 and0.2% for Site 4, with average values of 10.9%, 20.3%, 14.7%, and 7.0% for Sites 1–4, respectively. In all sites,average values of bulk density are interspersed with sharp increases in bulk density within layers of only afew centimeters. These layers are also characterized by sharp declines in C content and correspond to ashand pumice layers as identified in the core sections. Lithological identification based on the coring resultsis presented below with the GPR results for each individual site. Volcanic ash and pumice are visually distinctlayers within the cores. The ash was light gray and a fine consistency that produced an extremely solid hor-izon. Pumice is characterized as a fine-grained volcanic rock and when present was immediately below theash horizon for that particular volcanic eruption.
While we acknowledge the overall high bulk density and low C content shown here for a material defined as apeat soil, it is important to consider that these ecosystems present all characteristics of a peatland including(1) a well-developed layer of carbon over a mineral soil; (2) they were formed by accumulation of vegetationsuch as mosses, herbaceous, and woody plants; and (3) they accumulated organic matter over time due toincreased productivity over decomposition. These characteristics result in soils with high C density and accu-mulation rates that are comparable to or higher than other low- and high-latitude peatlands [Hribljan et al.,2015; Hribljan et al., 2016].
4.2. GPR
GPR measurements at each study site include (a) common midpoint (CMP) surveys used to develop one-dimensional (1-D) models of EM wave velocity with depth at selected locations and (b) common offset(CO) surveys used to develop cross sections based on 2-D distributions of reflections with depth that intersectcore locations.4.2.1. Site 1An array of eight orthogonal CO profiles was collected in Site 1 (Figure 3a). Profiles mimic those depicted inFigure 3b and were characterized by (a) a basin-shaped bottom reflector (R7 in Figure 3b) corresponding to
Journal of Geophysical Research: Biogeosciences 10.1002/2016JG003550
COMAS ET AL. ESTIMATING CARBON STOCKS IN THE PÁRAMO 375
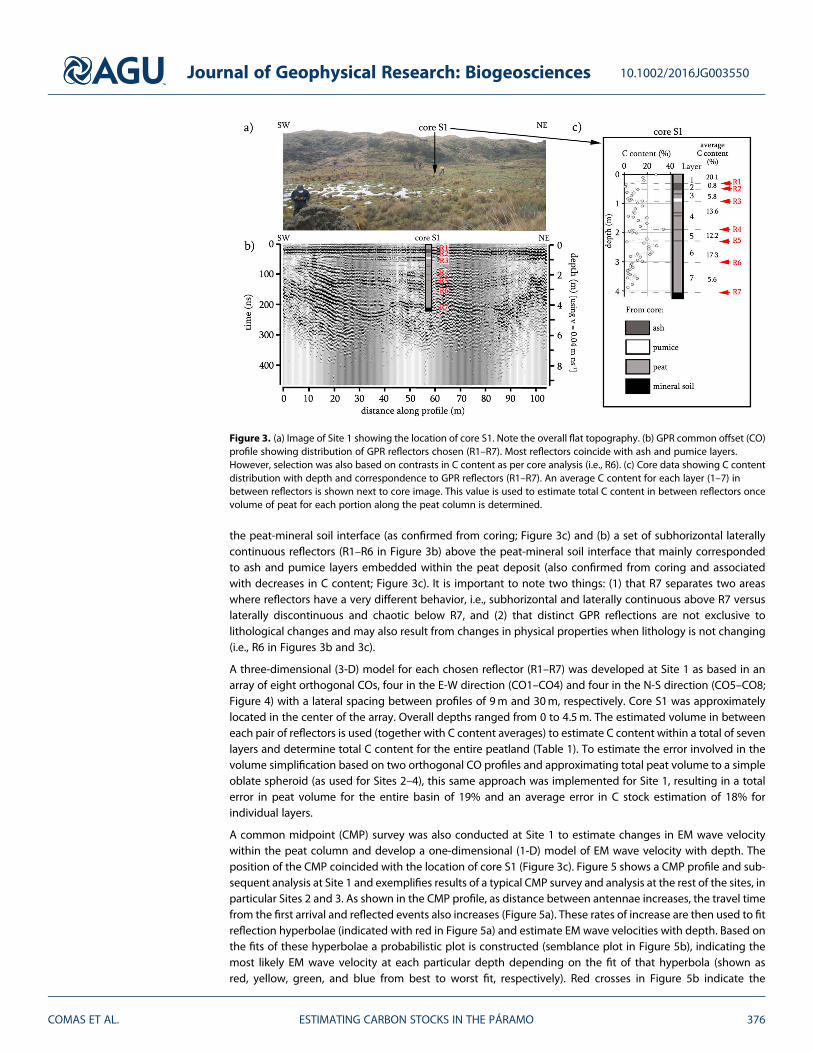
the peat-mineral soil interface (as confirmed from coring; Figure 3c) and (b) a set of subhorizontal laterallycontinuous reflectors (R1–R6 in Figure 3b) above the peat-mineral soil interface that mainly correspondedto ash and pumice layers embedded within the peat deposit (also confirmed from coring and associatedwith decreases in C content; Figure 3c). It is important to note two things: (1) that R7 separates two areaswhere reflectors have a very different behavior, i.e., subhorizontal and laterally continuous above R7 versuslaterally discontinuous and chaotic below R7, and (2) that distinct GPR reflections are not exclusive tolithological changes and may also result from changes in physical properties when lithology is not changing(i.e., R6 in Figures 3b and 3c).
A three-dimensional (3-D) model for each chosen reflector (R1–R7) was developed at Site 1 as based in anarray of eight orthogonal COs, four in the E-W direction (CO1–CO4) and four in the N-S direction (CO5–CO8;Figure 4) with a lateral spacing between profiles of 9m and 30m, respectively. Core S1 was approximatelylocated in the center of the array. Overall depths ranged from 0 to 4.5m. The estimated volume in betweeneach pair of reflectors is used (together with C content averages) to estimate C content within a total of sevenlayers and determine total C content for the entire peatland (Table 1). To estimate the error involved in thevolume simplification based on two orthogonal CO profiles and approximating total peat volume to a simpleoblate spheroid (as used for Sites 2–4), this same approach was implemented for Site 1, resulting in a totalerror in peat volume for the entire basin of 19% and an average error in C stock estimation of 18% forindividual layers.
A common midpoint (CMP) survey was also conducted at Site 1 to estimate changes in EM wave velocitywithin the peat column and develop a one-dimensional (1-D) model of EM wave velocity with depth. Theposition of the CMP coincided with the location of core S1 (Figure 3c). Figure 5 shows a CMP profile and sub-sequent analysis at Site 1 and exemplifies results of a typical CMP survey and analysis at the rest of the sites, inparticular Sites 2 and 3. As shown in the CMP profile, as distance between antennae increases, the travel timefrom the first arrival and reflected events also increases (Figure 5a). These rates of increase are then used to fitreflection hyperbolae (indicated with red in Figure 5a) and estimate EM wave velocities with depth. Based onthe fits of these hyperbolae a probabilistic plot is constructed (semblance plot in Figure 5b), indicating themost likely EM wave velocity at each particular depth depending on the fit of that hyperbola (shown asred, yellow, green, and blue from best to worst fit, respectively). Red crosses in Figure 5b indicate the
Figure 3. (a) Image of Site 1 showing the location of core S1. Note the overall flat topography. (b) GPR common offset (CO)profile showing distribution of GPR reflectors chosen (R1–R7). Most reflectors coincide with ash and pumice layers.However, selection was also based on contrasts in C content as per core analysis (i.e., R6). (c) Core data showing C contentdistribution with depth and correspondence to GPR reflectors (R1–R7). An average C content for each layer (1–7) inbetween reflectors is shown next to core image. This value is used to estimate total C content in between reflectors oncevolume of peat for each portion along the peat column is determined.
Journal of Geophysical Research: Biogeosciences 10.1002/2016JG003550
COMAS ET AL. ESTIMATING CARBON STOCKS IN THE PÁRAMO 376

depth and velocity of chosen hyperbolae in Figure 5a. Based on the selection of these particular hyperbolae,and the estimation of interval velocities using the Dix equation [Dix, 1955], a one-dimensional (1-D) model ofEM wave velocity is estimated for Site 1 (Figure 5c). The model shows a consistent average velocity of about0.04mns�1 for the peat column followed by a progressive velocity increase once encountering the mineralsoil at 4m and reaching values of 0.068mns�1 at 5m depth.
Figure 4. Three-dimensional model of basin morphology and individual reflectors as per Figure 3 (R1–R7) based on 2-Dgrid of GPR common offsets (CO1–CO8) collected from ground surface at Site 1. The estimated volume in between eachpair of reflectors is used (together with C content averages) to estimate C content within a total of seven layers anddetermine total C content for the entire peatland.
Journal of Geophysical Research: Biogeosciences 10.1002/2016JG003550
COMAS ET AL. ESTIMATING CARBON STOCKS IN THE PÁRAMO 377

4.2.2. Site 2A set of two orthogonal CO profiles crossing at the location of core S2 was performed at Site 2 (Figure 6). ACMP profile was also collected coinciding with the location of the core. Following the approach for Site 1, anaverage C content between reflectors (R1–R3 coincident with two ash layers and the interface with themineral soil) is shown next to the core image in Figure 6 and is used to estimate total C content betweenreflectors once volume of peat at each layer along the peat column is determined. Depth ranges for eachlayer (i.e., Figure 6) are as follows: layer 1 (0–1.0m), layer 2 (1.0–2.3m), and layer 3 (2.3–3.5m). Unlike Site 1no GPR grid was collected and volume estimates are based on approximating total peat volume to a simpleoblate spheroid (with radius determined from the CO profiles) and considering that peat basins representhalf of that spheroid. This approach was repeated for each specific reflector, and volumes for each intervalwere measured by subtraction of total volumes. Interval volumes combined with the average C contentper layer resulted in C stock estimates of 30,182; 62,864; and 70,994 kg for layers surface to R1, R1 to R2,and R2 to R3, respectively (Figure 6).4.2.3. Site 3Following the survey at Site 2, a set of two orthogonal CO profiles crossing at the location of core S3 wereperformed at Site 3 (Figure 7). A CMP profile was also collected coinciding with the location of the core. Anaverage C content per layer is shown next to the core image and is used for estimating C stocks. Depth ranges
Table 1. Summary of Depth, Total Peat Volume, Average C Content, and Total C Stock per Peat Layer for 3-D Model Basinat Site 1
Layera Depth Range (m) Total Peat Volume (m3) Average C Content (%) Total C Stock (kg)
Layer 1 (Surface–R1) 0–0.5 1,476 20 58,445Layer 2 (R1–R2) 0.5–0.7 894 1 8,967Layer 3 (R2–R3) 0.7–1.2 1,815 6 62,182Layer 4 (R3–R4) 1.2–2.0 3,268 14 130,851Layer 5 (R4–R5) 2.0–2.6 2,766 12 51,116Layer 6 (R5–R6) 2.6–3.1 2,200 17 72,556Layer 7 (R6–R7) 3.1–4.3 2,004 6 41,964Total - 14,423 11 426,085
aPeat layer as limited by two reflectors (R1–R7).
Figure 5. (a) GPR commonmidpoint survey to determine changes in EM wave velocity within the peat column collected at core location S1. (b) GPR semblance plotfor the CMP survey, which is a probabilistic plot of the most likely EM wave velocities at each depth within the peat column to fit hyperbolas in Figure 5a. Reds andyellows indicate good probability, while blues indicate low probability. (c) One-dimensional model of EM wave velocities based on GPR semblance results andafter application of the Dix equation, which determines EM wave velocities at different intervals within the peat column. A sudden increase in velocity around 4mdepth is indicative of the peat-mineral soil interface as inferred from coring (i.e., peat shown as gray shading and mineral soil as white). Average peat velocity isconsistent around 0.04m ns�1, while mineral soil ranges between 0.05 and 0.07m ns�1.
Journal of Geophysical Research: Biogeosciences 10.1002/2016JG003550
COMAS ET AL. ESTIMATING CARBON STOCKS IN THE PÁRAMO 378

for each layer (i.e., Figure 7) are as follows: layer 1 (0–0.6m), layer 2 (0.6–1.0m), layer 3 (1.0–2.5m), layer 4 (2.5–2.7), layer 5 (2.7–3.9m), layer 6 (3.9–4.6m), and layer 7 (4.6–6.4m). As shown in Figure 7, R1, R3, R4, and R5coincide with ash layers; R2 coincide with a pumice layer; and R6 coincides with the interface of peat-mineralsoil. Following the approach for Site 2 volume estimates per interval are based on approximating total peatvolume to a simple oblate spheroid (with radius taken from the CO profiles) and considering that peat basinsrepresent half of that spheroid. Interval volumes combined with the average C content per layer resulted in Cstock estimates of 164,302; 115,827; 516,971; 404,250; 257,055; and 641,153 kg for layers surface to R1, R1 toR2, R2 to R3, R3 to R4, R4 to R5, and R5 to R6, respectively (Figure 7).4.2.4. Site 4A set of two orthogonal CO profiles crossing at the location of core S4 was performed at Site 4 (Figure 8). Forcomparison purposes between sites the display in Figure 8 mimics that in Figure 3 and includes an image ofSite 4 (Figure 8a) showing the differences in terms of both vegetation cover and topography. For example,Site 4 contained a larger proportion of cushion plants dominated by P. rigida (Plantaginaceae) [Hribljanet al., 2016]. As shown in Figure 8b, reflectors R2 and R3 coincide with a pumice and ash layer, respectively;however, reflectors R1 and R4 do not coincide with a change in lithology as detected during coring but with acontrast in C content determined from later laboratory analysis of the core (Figure 8c). Following theapproach for Sites 2 and 3 volume estimates per interval are based on approximating total peat volume toa simple oblate spheroid (using a radius determined from the CO profiles) and considering that peat basinsrepresent half of that spheroid. Interval volumes combined with the average C content per layer resulted in Cstock estimates of 526, 459; 254,675; 221,725; and 822 kg for layers 1–5, respectively (Figure 8c). Depth rangesfor each layer are as follows: layer 1 (0–0.6m), layer 2 (0.6–1.1m), layer 3 (1.1–1.6m), and layer 4 (1.6–3.0).
Figure 6. GPR common offset (CO) profiles at Site 2 showing distribution of GPR reflectors (R1–R3) chosen for C stock esti-mation. Reflectors coincide with ash and pumice layers. Inset shows the details of core S2 with lithology and average Ccontent per layer (1–3) and in between GPR reflectors (R1–R3).
Journal of Geophysical Research: Biogeosciences 10.1002/2016JG003550
COMAS ET AL. ESTIMATING CARBON STOCKS IN THE PÁRAMO 379

A CMP profile was also collected at Site 4 at the location of the core to estimate changes in EM wave velocitywithin the peat column and develop a one-dimensional (1-D) model of EM wave velocity with depth. A CMPprofile is shown in Figure 9a. Reflection hyperbolae fitting results are shown in the semblance plot in Figure 9b,and the subsequent estimated 1-D model of EM wave velocity for Site 4 is shown in Figure 9c. Peat velocity atSite 4 is larger than peat velocities for Sites 1–3, averaging 0.043m/ns and reaching 0.045m/ns for the first
Figure 7. GPR common offset (CO) profiles at Site 3 showing distribution of GPR reflectors (R1–R6) chosen for C stock esti-mation. Reflectors coincide with ash and pumice layers. Inset shows the details of core S3 with lithology and average Ccontent per layer (1–6) and in between GPR reflectors (R1–R6).
Figure 8. (a) Image of Site 4 showing the location of core S4. Note the overall flat topography. (b) GPR common offset (CO)profile showing distribution of GPR reflectors chosen (R1–R4). Most reflectors coincide with ash and pumice layers; how-ever, selection was also based on contrasts in C content as per core analysis (i.e., R4). (c) Core data showing C contentdistribution per layer and correspondence to GPR reflectors (R1–R4). An average C content in between reflectors is shownnext to core image. This value is used to estimate total C content in between reflectors once volume of peat for eachportion along the peat column is determined.
Journal of Geophysical Research: Biogeosciences 10.1002/2016JG003550
COMAS ET AL. ESTIMATING CARBON STOCKS IN THE PÁRAMO 380

3m. Mineral soil velocity shows an increase reaching values close 0.06m/ns, a value consistent with othersites. This increase in velocity coincides with a sudden decrease in C content and sudden increase in bulkdensity as measured at core S4 (Figures 2d and 8c) that may already correspond to nonpeaty soils giventhe low C content.
5. Discussion5.1. Estimation of C Stocks in the Páramo Using GPR
The results presented here exemplify the ability of GPR to image Andean peatlands in Ecuador by (1) its abilityto profile at high lateral resolution (i.e., traces can be collected every few centimeters) and (2) the good depthof penetration of the EM signal, reaching depths close to 7m and sufficient for reaching the peat-mineral soilinterface. For these reasons, peat thickness variability can be accurately determined at resolutions unfeasiblefor traditional methods like coring. Furthermore, the use of specialized GPR antennae, which includes the useof RTA antennae in this work, allows for the collection of long GPR profiles (hundreds of meters) in a very timeefficient manner (walking pace) even under difficult terrain conditions (e.g., dense vegetation or highlyvariable relief).
The Ecuadorian páramo also presents a unique soil characteristic to make the use of GPR particularly effectivefor C stock estimation: the presence of ash and pumice layers interbedded within the peat column. Asdepicted in the CO profiles shown for all sites (i.e., Figures 3b, 6, 7, and 8b), these volcanic layers result in amarked contrast in signal amplitude and therefore are easily identifiable within the reflection record, allowingthe isolation of peat layers embedded between ash/pumice layers and thus rendering GPR more effective atcapturing changes in thickness within these different soil horizons. This principle of contrasting soil layersforms the basis for the work presented here by combining (1) thickness and lateral extent of isolated peatlayers embedded within ash and pumice layers and (2) C content analysis of those layers from selected directcores to refine C stock estimates for specific peatland systems in the Ecuadorian páramo.
Due to the time constraints involved in this preliminary campaign, the recommended survey design for effec-tively characterizing thickness variability of individual peat layers was only implemented at Site 1 and con-sisted of a 3-D survey composed of a total of eight CO profiles (CO1–8 in Figure 4). For the remaining sites(Sites 2–4), the simplified approach using an oblate spheroid approximation based on two orthogonal COprofiles was conducted. As previously reported for Site 1, the estimated error between the two approachesresulted in an average of 18–19% total difference in C stocks. These differences are attributed to the
Figure 9. (a) GPR commonmidpoint survey to determine changes in EM wave velocity within the peat column collected at core S4. (b) GPR semblance plot for CMPsurvey, with reds and yellows indicating good probability and blues indicating low probability. (c) One-dimensional model of EM wave velocities based on GPRsemblance results and after application of the Dix equation. Average peat velocity is consistent around 0.043m/ns but slightly higher than the rest of the sites. Peatsoil is shown as gray shading, while mineral soil is white. Depth of the interface was inferred from coring.
Journal of Geophysical Research: Biogeosciences 10.1002/2016JG003550
COMAS ET AL. ESTIMATING CARBON STOCKS IN THE PÁRAMO 381

simplified approach that assumes that layers are horizontal, which is not the case for most of the layersdepicted here. For example, both R4 and R5 as depicted in Figure 3b for Site 1 show variability in depthexceeding 1m in places. For that reason, using the oblate spheroid approach at Site 1 underestimates peatvolume, and thus C stocks, for most layers. Despite such error this research demonstrates that the approachcan be effective when a large number of peatland systems are to be surveyed. Although a similar error ana-lysis would be also useful when comparing the simplified GPR approach (i.e., oblate spheroid) versus directcoring, the fact that only one core per site was collected prevents making any estimations in terms of thick-ness variability and thus C stock based solely on coring.
GPR is a useful tool to overcome the difficulties with coring deep and mineral dense mountain peatlands.Andean peatlands develop due to year-round growth of vegetation [Cooper et al., 2015], which deposits plantlitter into perennially saturated soils that limit decomposition. The peat soils are not typical of the commondefinition of peats because of the high rates of mineral deposition (volcanic, fluvial, and aeolian processes)into these ecosystems that can lower the soil carbon content below the 12% designation currently used todefine organic soils in a sandy matrix [Soil Survey Staff, 1999]. However, because Andean peatlands haveorganic-rich soils with uncommonly high bulk densities they can be very carbon dense. These peatlandscontain some of the largest belowground carbon stocks for any peat accumulating ecosystem worldwide[Hribljan et al., 2015; Hribljan et al., 2016].
5.2. Imaging the Lateral Extent of Volcanic Horizons for Time-Stratigraphic Correlations
The ability of GPR to quickly image and estimate the lateral extent of tephra layers also has utility for beingused as a proxy for paleoclimate reconstructions. Tephras are isochronous marker horizons typical in areasclose to volcanic eruptions that are widely used as time-stratigraphic markers for correlation between sedi-ments in a wide variety of sedimentary environments including peat deposits, lake sediments, and soilprofiles [Langdon and Barber, 2004; Lowe and Walker, 2014]. While most studies using tephras for time-stratigraphic correlations between sediments rely on linear extrapolations from individual coring sites[Lowe, 2011], the work presented here shows the ability of GPR to map the lateral extent of individual tephralayers at high (centimeter-scale) resolution. This is particularly important when considering how laterally vari-able the depth of some of these layers may be. For example, at Site 1, the tephra layer depicted as R4 inFigure 3 shows a variability in depth up to 0.6m or 15% of the total depth of the peat column at that site.Furthermore, accumulation of organic matter in peatlands provides a detailed archive of local and regionalvegetation [Charman, 2002] that can reflect changes in structure and composition along the peat strati-graphic column and is commonly associated to environmental and climatic changes over the Holocene[Yu, 2006]. Since the last century, peat-based paleoclimatic reconstructions have relied on the observationof peat stratigraphy and recurrence surfaces (e.g., peat decomposition is enhanced by dry peat surfacesresulting in higher humification rates and darker colors [Barber, 1982]). Most recently, a wider range ofanalytical techniques have been used to investigate the paleoenvinromental archive in peat including micro-fossil, macrofossil, physico-chemical, pollen, and radiometric analyses. However, like in the case of tephralayers, most existing studies commonly ignore spatial aspects and rely on vertical sequences in single-peatcores. For this reason, GPR can be used to derive continuous proxy climate data for large (i.e., kilometer-scale)peat profiles (e.g., by localizing laterally continuous layers like tephras) at much faster rates and increasedlateral resolution that traditional methods and to produce replicable results within sites to compare regionalclimatic fluctuations. Furthermore, GPR offers an efficient and noninvasive means to quickly locate the 3-Ddistribution of these subsurface features.
5.3. Estimation of Peat Properties
Given the differences in bulk density and C content within the peat column for the different sites, it is impor-tant to consider how peat properties may contribute to the overall picture of global C stocks. For example,coring results at Site 4 are clearly different than those from Sites 1–3 as characterized by (1) the highest aver-age bulk density at Site 4, which is double the average values at Site 1 and Site 3 and almost triple the averagevalues at Site 2, and (2) the lowest average %C content at Site 4, representing less than half of the average Ccontent at Site 3 and less than a third C content in Site 2. To better understand the relation between total peatvolume and total C stock when considering the differences in average C content within the peat column forall study sites, Figure 10 shows the dependence of total C stock on estimated peat volume for Sites 1–4. Aleast squares regression is shown in the figure considering Sites 1–4 (shown in Figure 10 as a solid black
Journal of Geophysical Research: Biogeosciences 10.1002/2016JG003550
COMAS ET AL. ESTIMATING CARBON STOCKS IN THE PÁRAMO 382
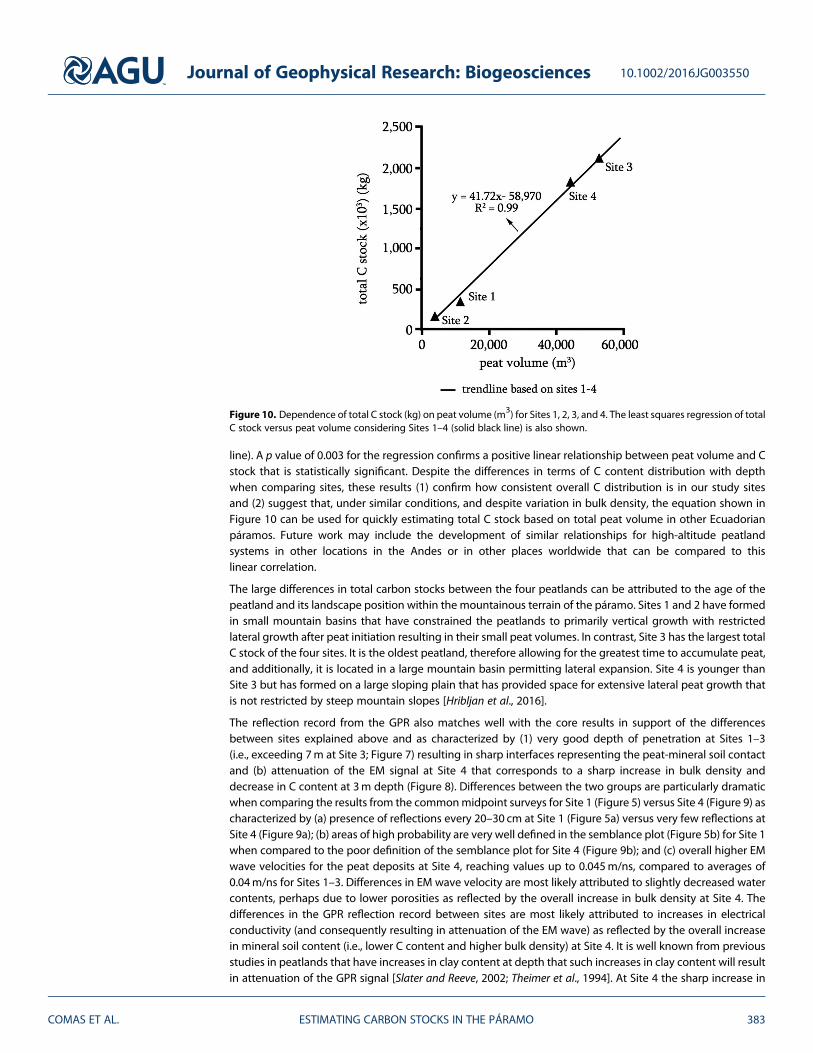
line). A p value of 0.003 for the regression confirms a positive linear relationship between peat volume and Cstock that is statistically significant. Despite the differences in terms of C content distribution with depthwhen comparing sites, these results (1) confirm how consistent overall C distribution is in our study sitesand (2) suggest that, under similar conditions, and despite variation in bulk density, the equation shown inFigure 10 can be used for quickly estimating total C stock based on total peat volume in other Ecuadorianpáramos. Future work may include the development of similar relationships for high-altitude peatlandsystems in other locations in the Andes or in other places worldwide that can be compared to thislinear correlation.
The large differences in total carbon stocks between the four peatlands can be attributed to the age of thepeatland and its landscape position within the mountainous terrain of the páramo. Sites 1 and 2 have formedin small mountain basins that have constrained the peatlands to primarily vertical growth with restrictedlateral growth after peat initiation resulting in their small peat volumes. In contrast, Site 3 has the largest totalC stock of the four sites. It is the oldest peatland, therefore allowing for the greatest time to accumulate peat,and additionally, it is located in a large mountain basin permitting lateral expansion. Site 4 is younger thanSite 3 but has formed on a large sloping plain that has provided space for extensive lateral peat growth thatis not restricted by steep mountain slopes [Hribljan et al., 2016].
The reflection record from the GPR also matches well with the core results in support of the differencesbetween sites explained above and as characterized by (1) very good depth of penetration at Sites 1–3(i.e., exceeding 7m at Site 3; Figure 7) resulting in sharp interfaces representing the peat-mineral soil contactand (b) attenuation of the EM signal at Site 4 that corresponds to a sharp increase in bulk density anddecrease in C content at 3m depth (Figure 8). Differences between the two groups are particularly dramaticwhen comparing the results from the commonmidpoint surveys for Site 1 (Figure 5) versus Site 4 (Figure 9) ascharacterized by (a) presence of reflections every 20–30 cm at Site 1 (Figure 5a) versus very few reflections atSite 4 (Figure 9a); (b) areas of high probability are very well defined in the semblance plot (Figure 5b) for Site 1when compared to the poor definition of the semblance plot for Site 4 (Figure 9b); and (c) overall higher EMwave velocities for the peat deposits at Site 4, reaching values up to 0.045m/ns, compared to averages of0.04m/ns for Sites 1–3. Differences in EM wave velocity are most likely attributed to slightly decreased watercontents, perhaps due to lower porosities as reflected by the overall increase in bulk density at Site 4. Thedifferences in the GPR reflection record between sites are most likely attributed to increases in electricalconductivity (and consequently resulting in attenuation of the EM wave) as reflected by the overall increasein mineral soil content (i.e., lower C content and higher bulk density) at Site 4. It is well known from previousstudies in peatlands that have increases in clay content at depth that such increases in clay content will resultin attenuation of the GPR signal [Slater and Reeve, 2002; Theimer et al., 1994]. At Site 4 the sharp increase in
Figure 10. Dependence of total C stock (kg) on peat volume (m3) for Sites 1, 2, 3, and 4. The least squares regression of totalC stock versus peat volume considering Sites 1–4 (solid black line) is also shown.
Journal of Geophysical Research: Biogeosciences 10.1002/2016JG003550
COMAS ET AL. ESTIMATING CARBON STOCKS IN THE PÁRAMO 383
bulk density detected in the core at 3m depth represents a strong contrast in dielectric permittivity and thusresults in a sharp reflection (R4 in Figure 8). This reflector represents the mineral soil interface, as detectedfrom the coring and characterized by a sudden drop in carbon content detected below 3m at core S4. Thefact that below this depth the EM signal is completely attenuated confirms this hypothesis.
The results in this study also exemplify the ability of GPR to detect interfaces that represent strong changes inphysical properties of the peat, but that may not be characterized by specific changes in lithology that arevisually detectable during direct sampling. These results confirm the potential of GPR for inferring changesin the physical properties of the peat as manifested by (1) marked reflectors representing contrasts in physi-cal properties (i.e., bulk density and carbon content) that may not be “visually” detected during coring or (2)areas of enhanced GPR signal attenuation. For example, reflector R6 at Site 1 (Figure 3) at a depth of 3m wascharacterized by a change in the reflection record with increased attenuation of the signal between 3 and 4mand corresponded to the core by a sudden increase in bulk density and decrease in C content. Althoughattenuation of the EM wave when encountering electrically conductive materials is often considered a limita-tion of GPR, in this case (and particularly for the example at Site 4), it shows that this attenuation could beuseful for detecting certain changes in the physical properties of the soil. Some of this attenuation is alsopatent in the reflection record when crossing certain interfaces, such as ash layers. For example, at Site 1(Figure 3), several areas of attenuation are detected along the peat column. A good example is the areabetween 1 and 2m depth (R3–R4), where the signal crosses two consecutive ash layers at around 1.5mdepth. Once again, the decrease in C content and increase in bulk density along these ash layers may beresponsible for the increased attenuation of the signal. The shallow nature of this interface and plenty ofreflectors (i.e., EM wave energy) coming from deeper parts of the column confirm that the attenuation of thesignal must be related to the physical properties of the materials rather than the natural attenuation ofthe signal with depth.
6. Conclusions
This paper shows the value of GPR for estimating C stocks and characterizing peat soil properties in mountainpeatland systems. Themethod is particularly useful in peatlands containing laterally continuous layers of con-trasting lithology (such as ash or pumice), which allow the isolation of peat soil embedded between theselayers and thus improving estimation of changes in thickness within these layers. Direct coring can thenbe used to determine C content within these isolated volumes of soil allowing refinement of total C stockswhen compared to estimates based on isolated direct cores. Besides the minimally invasive nature of theGPR method (requires only an operator moving the antennae at the surface of the ground), data acquisitionis also very fast, particularly when compared to traditional coring methods, and 2-D profiles on the order ofhundreds of meters with centimeter lateral resolution can be collected in a few hours. Furthermore, themethod also shows the potential for detecting changes in physical properties of the peat that may not bedetectable through visual characterization; in that, reflections are very sensitive to changes in bulk densityand/or organic content. For example, as bulk density increases and C content decreases (most likely relatedto increased mineral content), attenuation of the EM wave signal also becomes more patent. While furtherresearch is needed (i.e., time-frequency analysis of GPR data sets), the apparent limitation represented bythe attenuation of the EM wave signal could potentially be used as a quick proxy for organic content in peatsoils. This approach can improve estimates of the extent of peat soils and C stocks in high-altitude tropicalsystems. Specifically, if we can use GPR and coring in combination with regression analyses to parameterizepredictive models of peat volume and carbon stocks based on landscape features (slope, slope position,basin morphology, elevation, etc.), we should then be able to use these predictive models in a remote sen-sing and geographic information system environment to derive improved landscape to national-scale esti-mates of carbon stocks.
ReferencesBarber, K. E. (1982), Peat bog stratigraphy as a proxy climate record, in Climatic Change in Later Prehistory, edited by A. Harding, pp. 103–113,
Edinburg Univ. Press, Edinburg, Tex.Barberi, F., M. Coltelli, G. Ferrara, F. Innocenti, J. M. Navarro, and R. Santacroce (1988), Plio-Quaternary volcanism in Ecuador, Geol. Mag.,
125(1), 1–14.Charman, D. J. (2002), Peatlands and Environmental Change, 312 pp., John Wiley, Chichester, England.
Journal of Geophysical Research: Biogeosciences 10.1002/2016JG003550
COMAS ET AL. ESTIMATING CARBON STOCKS IN THE PÁRAMO 384
AcknowledgmentsThis work was supported by theSustainable Wetlands Adaptation andMitigation Program and the USDAForest Service, Research andDevelopment. We thank the Ministry ofthe Environment of Ecuador for issuingresearch permit nos. 001-2015-RIC-FLO-DPAP-MA and 08-15-IC-FAU-DPAP-MAfor our work at the Cayambe-CocaNational Park and Antisana EcologicalReserve. E. Suárez was also supportedby the Chancellor and PREPA grantprogram from Universidad SanFrancisco de Quito. We also thank twoanonymous reviewers and Editor Gonifor their insightful comments in a pre-vious version of this manuscript. All dataare available from authors: [email protected] for the geophysical datasets [email protected] for the core data.

Chimner, R. A., and J. M. Karberg (2008), Long-term carbon accumulation in two tropical mountain peatlands, Andes Mountains, Ecuador,Mires Peat, 3(4), 1–10.
Chimner, R. A., D. J. Cooper, and J. M. Lemly (2010), Mountain fen distribution, types and restoration priorities, San Juan Mountains, Colorado,USA, Wetlands, 30, 763–771.
Chimner, R. A., C. A. Ott, C. H. Perry, and R. K. Kolka (2014), Developing and evaluating rapid field methods to estimate peat carbon,Wetlands,34(6), 1241–1246.
Comas, X., and L. Slater (2009), Non-invasive field-scale characterization of gaseous-phase methane dynamics in peatlands using the groundpenetrating radar (GPR) method, in Carbon Cycling in Northern Peatlands, edited by A. Baird et al., pp. 159–172, AGU, Washington, D. C.
Comas, X., and W. Wright (2014), Investigating carbon flux variability in subtropical peat soils of the Everglades using hydrogeophysicalmethods, J. Geophys. Res. Biogeosci., 119, 1506–1519, doi:10.1002/2013JG002601.
Comas, X., L. Slater, and A. Reeve (2004), Geophysical evidence for peat basin morphology and stratigraphic controls on vegetation observedin a northern peatland, J. Hydrol., 295, 173–184.
Comas, X., L. Slater, and A. Reeve (2005a), Stratigraphic controls on pool formation in a domed bog inferred from ground penetrating radar(GPR), J. Hydrol., 315(1–4), 40–51.
Comas, X., L. Slater, and A. Reeve (2005b), Spatial variability in biogenic gas accumulations in peat soils is revealed by ground penetratingradar (GPR), Geophys. Res. Lett., 32, L08401, doi:10.1029/2004GL022297.
Comas, X., L. Slater, and A. Reeve (2007), In situ monitoring of ebullition from a peatland using ground penetrating radar (GPR), Geophys. Res.Lett., 34, L06402, doi:10.1029/2006GL029014.
Comas, X., L. Slater, and A. Reeve (2008), Seasonal geophysical monitoring of biogenic gases in a northern peatland: Implications for tem-poral and spatial variability in free phase gas production rates, J. Geophys. Res., 113, G01012, doi:10.1029/2007JG000575.
Comas, X., N. Terry, L. Slater, M. Warren, R. Kolka, A. Kristiyono, N. Sudiana, D. Nurjaman, and T. Darusman (2015), Imaging tropical peatlandsin Indonesia using ground-penetrating radar (GPR) and electrical resistivity imaging (ERI): Implications for carbon stock estimates andpeat soil characterization, Biogeosciences, 12(10), 2995–3007.
Cooper, D. J., E. C. Wolf, C. Colson, W. Vering, A. Granda, and M. Meyer (2010), Alpine peatlands of the Andes, Cajamarca, Peru, Arct. Antarct.Alp. Res., 41, 19–33.
Cooper, D. J., K. Kaczynski, D. Slayback, and K. Yager (2015), Growth and organic carbon production in peatlands dominated by Distichiamuscoides, Bolivia, South America, Arct. Antarct. Alp. Res., 47(3), 505–510.
Dix, C. H. (1955), Seismic velocities from surface measurements, Geophysics, 20(1), 68–86.Earle, L. R., B. G. Warner, and R. Aravena (2003), Rapid development of an unusual peat-accumulating ecosystem in the Chilean Altiplano,
Quat. Res., 59(1), 2–11.Gorham, E. (1991), Role in the carbon cycle and probable responses to climatic warming, Ecol. Appl., 1, 182–195.Greaves, R. J., D. P. Lesmes, J. M. Lee, and M. N. Toksöz (1996), Velocity variations and water content estimated from multi-offset, ground-
penetrating radar, Geophysics, 61(3), 683–695.Hall, M. L., and P. Mothes (2008), The Chacana caldera complex, Collapse Calderas Workshop, IOP Conf. Ser. Earth Environ. Sci., 3, doi:10.1088/
1755-1307/3/1/012004.Hall, M. L., P. Samaniego, J. L. Le Pennec, and J. B. Johnson (2008), Ecuadorian Andes volcanism: A review of late Pliocene to present activity,
J. Volcanol. Geotherm. Res., 176(1), 1–6.Hooijer, A., S. Page, J. G. Canadell, M. Silvius, J. Kwadijk, H. Wösten, and J. Jauhiainen (2010), Current and future CO2 emissions from drained
peatlands in Southeast Asia, Biogeosciences, 7(5), 1505–1514.Hribljan, J. A., D. J. Cooper, J. Sueltenfuss, E. C. Wolf, K. A. Heckman, E. A. Lilleskov, and R. A. Chimner (2015), Carbon storage and long-term
rate of accumulation in high-altitude Andean peatlands of Bolivia, Mires Peat, 15(12), 1–14.Hribljan, J. A., E. Suárez, K. A. Heckman, E. A. Lilleskov, and R. A. Chimner (2016), Peatland carbon stocks and accumulation rates in the
Ecuadorian páramo, Wetlands Ecol. Manage., 24, 113–127.Jol, H. M., and D. G. Smith (1995), Ground penetrating radar surveys of peatlands for oilfield pipelines in Canada, J. Appl. Geophys., 34, 109–123.Koh, L. P., J. Miettinen, S. C. Liew, and J. Ghazoul (2011), Remotely sensed evidence of tropical peatland conversion to oil palm, Proc. Natl.
Acad. Sci. U.S.A., 108(12), 5127–5132.Langdon, P. G., and K. E. Barber (2004), Snapshots in time: Precise correlations of peat-based proxy climate records in Scotland using mid-
Holocene tephras, Holocene, 14(1), 21–33.Limpens, J., F. Berendse, C. Blodau, J. G. Canadell, C. Freeman, J. Holden, N. Roulet, H. Rydin, and G. Schaepman-Strub (2008), Peatlands and
the carbon cycle: From local processes to global implications—A synthesis, Biogeosciences, 5, 1475–1491.Lowe, D. J. (2011), Tephrochronology and its application: A review, Quat. Geochronol., 6(2), 107–153.Lowe, J. J., and M. J. C. Walker (2014), Reconstructing Quaternary Environments, Taylor & Francis, London.Page, S. E., J. O. Rieley, and C. J. Banks (2011), Global and regional importance of the tropical peatland carbon pool, Global Change Biol., 17(2),
798–818.Parry, L. E., L. J. West, J. Holden, and P. J. Chapman (2014), Evaluating approaches for estimating peat depth, J. Geophys. Res. Biogeosci., 119,
567–576, doi:10.1002/2013JG002411.Parsekian, A., X. Comas, L. Slater, and P. H. Glaser (2011), Geophysical evidence for the lateral distribution of free phase gas at the peat basin
scale in a large northern peatland, J. Geophys. Res., 116, G03008, doi:10.1029/2010JG001543.Parsekian, A. D., L. Slater, S. D. Sebestyen, R. K. Kolka, D. Ntarlagiannis, J. Nolan, and P. Hanson (2012), Comparison of uncertainty in peat
volume and soil carbon estimated using GPR and probing, Soil Sci. Soc. Am. J., 76(5), 1911–1918.Preston, D. J., J. Fairbairn, N. Paniagua, G. Mass, M. Yevara, and S. Beck (2003), Grazing and environmental change on the Tarija Altiplano,
Bolivia, Mountain Res. Dev., 23, 141–148.Roulet, N. T., P. M. Lafleu, P. J. H. Richard, T. R. Moore, E. R. Humphreys, and J. Bubier (2007), Contemporary carbon balance and late Holocene
carbon accumulation in a northern peatland, Global Change Biol., 13, 397–411.Salvador, F., J. Monerris, and L. Rochefort (2014), Peatlands of the Peruvian Puna ecoregion: Types, characteristics and disturbance, Mires
Peat, 15(3), 1–17.Samaniego, P., M. Monzier, C. Robin, and L. M. Hall (1998), Late Holocene eruptive activity at Nevado Cayambe Volcano, Ecuador, Bull.
Volcanol., 59(7), 451–459.Schubert, C., and C. M. Clapperton (1990), Quaternary glaciations in the northern Andes (Venezuela, Colombia and Ecuador), Quat. Sci. Rev.,
9(2), 123–135.Slater, L., and A. Reeve (2002), Understanding peatland hydrology and stratigraphy using integrated electrical geophysics, Geophysics, 67,
365–378.
Journal of Geophysical Research: Biogeosciences 10.1002/2016JG003550
COMAS ET AL. ESTIMATING CARBON STOCKS IN THE PÁRAMO 385
Soil Survey Staff (1999), Soil Taxonomy: A Basic System of Soil Classification for Making and Interpreting Soil Surveys, USDA Agric. Handb. No. 436,2nd ed., U.S. Govt. Print Office, Washington, D. C.
Strack, M., and T. Mierau (2010), Evaluating spatial variability of free-phase gas in peat using ground penetrating radar and direct mea-surement, J. Geophys. Res., 115, G02010, doi:10.1029/2009JG001045.
Theimer, B. D., D. C. Nobes, and B. G. Warner (1994), A study of the geoelectrical properties of peatlands and their influence on ground-penetrating radar surveying, Geophys. Prospect., 42, 179–209.
Viviroli, D., R. Weingartn, and B. Messeril (2003), Assessing the hydrological significance of the world’s mountains, Mountain Res. Dev., 23,32–40.
Warner, B. G., D. C. Nobes, and B. D. Theimer (1990), An application of ground penetrating radar to peat stratigraphy of Ellice Swamp,southwestern Ontario, Can. J. Earth Sci., 27, 932–938.
Wright, W., and X. Comas (2016), Estimating methane gas production in peat soils of the Florida everglades using hydrogeophysicalmethods, J. Geophys. Res. Biogeosci., 121, 1190–1202, doi:10.1002/2015JG003246.
Yu, Z. (2006), Holocene carbon accumulation of fen peatlands in boreal western Canada: A complex ecosystem response to climate variationand disturbance, Ecosystems, 9, 1278–1288.
Yu, Z., J. Loisel, D. P. Brosseau, D. W. Beilman, and S. J. Hunt (2010), Global peatland dynamics since the Last Glacial Maximum, Geophys. Res.Lett, 37, L13402, doi:10.1029/2010GL043584.
Journal of Geophysical Research: Biogeosciences 10.1002/2016JG003550
COMAS ET AL. ESTIMATING CARBON STOCKS IN THE PÁRAMO 386
Related Documents