ESTIMATES OF TOTAL NITROGEN, TOTAL PHOSPHORUS, TOTAL SUSPENDED SOLIDS, AND BIOCHEMICAL OXYGEN DEMAND LOADINGS TO TAMPA BAY, FLORIDA: 2004-2007 Prepared for: Florida Department of Environmental Protection 2600 Blair Stone Road, MS 3500 Tallahassee, FL 32399 Prepared by: 1155 Eden Isle Drive NE St. Petersburg, FL 33704 November 2008

Welcome message from author
This document is posted to help you gain knowledge. Please leave a comment to let me know what you think about it! Share it to your friends and learn new things together.
Transcript

ESTIMATES OF TOTAL NITROGEN, TOTAL PHOSPHORUS,
TOTAL SUSPENDED SOLIDS, AND BIOCHEMICAL OXYGEN DEMAND
LOADINGS TO TAMPA BAY, FLORIDA: 2004-2007
Prepared for:
Florida Department of Environmental Protection 2600 Blair Stone Road, MS 3500
Tallahassee, FL 32399
Prepared by:
1155 Eden Isle Drive NE St. Petersburg, FL 33704
November 2008

ii
FOREWORD
This report was prepared by Janicki Environmental, Inc. for the Florida Department of Environmental Protection under contract #100000138 to PBS&J, Inc.

iii
ACKNOWLEDGMENTS We wish to thank the staffs of the Environmental Protection Commission of Hillsborough County and the Tampa office of the Florida Department of Environmental Protection for the assistance rendered in retrieving point source data. We sincerely appreciate the help of the following in obtaining data and providing advice for this project: Misty Cladas of the TBEP and Charles Kovach, Sam Zamani, and Jackie Champion of the FDEP with point source data collection, Roberta Starks and Carol Craft of the SWFWMD with groundwater data, Mark Dickman of USGS with potentiometric maps, and all the county, city, and industrial facility representatives who patiently reviewed, revised, and provided data for accurate estimation of point source loadings to the bay.

iv
TABLE OF CONTENTS FOREWORD ii ACKNOWLEDGMENTS iii LIST OF TABLES v LIST OF FIGURES vi 1. INTRODUCTION 1-1
1.1 Objectives 1-1 2. LOADING SOURCES 2-1
2.1 Atmospheric Deposition 2-1 2.2 Domestic Point Sources 2-3 2.3 Industrial Point Sources 2-7
2.4 Springs 2-11 2.5 Groundwater 2-12 2.6 Nonpoint Sources 2-14
3. HYDROLOGIC AND POLLUTANT LOADINGS BY BAY SEGMENT 3-1
3.1 Old Tampa Bay 3-1 3.2 Hillsborough Bay 3-4 3.3 Middle Tampa Bay 3-8
3.4 Lower Tampa Bay 3-12 3.5 Boca Ciega Bay 3-15 3.6 Terra Ceia Bay 3-18 3.7 Manatee River 3-21
4. CONCLUSIONS 4-1 5. LITERATURE CITED 5-1 APPENDIX A - Table of Point Sources from 1992-1994 which Were Not Included or had Name Change in the 2004-2007 Analysis APPENDIX B - Aggregated Florida Land Use, Cover and Form
Classification System Categories APPENDIX C - Land Use-specific Water Quality Concentrations APPENDIX D - Land Use-specific Seasonal Runoff Coefficients APPENDIX E - Description of Piney Point Discharge APPENDIX F - Tables of Annual Loads of TP, TSS, and BOD,
by Bay Segment and Source

v
LIST OF TABLES
Table 2-1. Domestic point sources in the Tampa Bay watershed (2004-2007). 2-5 Table 2-2. Fertilizer handling facilities 2004-2007. 2-7 Table 2-3. Industrial point sources in the Tampa Bay watershed (2004-2007). 2-8 Table 2-4. Downstream stream gage stations. 2-17 Table 3-1. Total annual rainfall to the watersheds draining to each bay segment for 1985-2007. 3-1 Table 3-2. Estimated TN loadings (tons/year and percentage of total) by
source to Old Tampa Bay. 3-3 Table 3-3. Estimated TN loadings (tons/year and percentage of total) by
source to Hillsborough Bay. 3-6 Table 3-4. Estimated TN loadings (tons/year and percentage of total) by
source to Middle Tampa Bay. 3-10 Table 3-5. Estimated TN loadings (tons/year and percentage of total) by
source to Lower Tampa Bay. 3-13 Table 3-6. Estimated TN loadings (tons/year and percentage of total) by
source to Boca Ciega Bay. 3-16 Table 3-7. Estimated TN loadings (tons/year and percentage of total) by
source to Terra Ceia Bay. 3-19 Table 3-8. Estimated TN loadings (tons/year and percentage of total) by
source to Manatee River. 3-22

vi
LIST OF FIGURES
Figure 1-1. Bay segments of Tampa Bay. 1-2 Figure 1-2. Major basins of the Tampa Bay watershed. 1-3 Figure 2-1. Map showing gaged and ungaged basins. 2-16 Figure 2-2. Process for estimating total watershed loadings from gaged and
ungaged basins. 2-18 Figure 3-1. Estimated monthly hydrologic loadings to Old Tampa Bay,
2004-2007. 3-2 Figure 3-2. Estimated monthly TN loadings to Old Tampa Bay, 2004-2007. 3-2 Figure 3-3. Estimated monthly TP loadings to Old Tampa Bay, 2004-2007. 3-3 Figure 3-4. Estimated monthly TSS loadings to Old Tampa Bay, 2004-2007. 3-4 Figure 3-5. Estimated monthly BOD loadings to Old Tampa Bay, 2004-2007. 3-4 Figure 3-6. Estimated monthly hydrologic loadings to Hillsborough Bay,
2004-2007. 3-5 Figure 3-7. Estimated monthly TN loadings to Hillsborough Bay, 2004-2007. 3-5 Figure 3-8. Estimated monthly TP loadings to Hillsborough Bay, 2004-2007. 3-7 Figure 3-9. Estimated monthly TSS loadings to Hillsborough Bay, 2004-2007. 3-7 Figure 3-10. Estimated monthly BOD loadings to Hillsborough Bay, 2004-2007. 3-8 Figure 3-11. Estimated monthly hydrologic loadings to Middle Tampa Bay,
2004-2007. 3-9 Figure 3-12. Estimated monthly TN loadings to Middle Tampa Bay, 2004-2007. 3-9 Figure 3-13. Estimated monthly TP loadings to Middle Tampa Bay, 2004-2007. 3-10 Figure 3-14. Estimated monthly TSS loadings to Middle Tampa Bay, 2004-2007. 3-11 Figure 3-15. Estimated monthly BOD loadings to Middle Tampa Bay, 2004-2007. 3-11 Figure 3-16. Estimated monthly hydrologic loadings to Lower Tampa Bay,
2004-2007. 3-12 Figure 3-17. Estimated monthly TN loadings to Lower Tampa Bay, 2004-2007. 3-13 Figure 3-18. Estimated monthly TP loadings to Lower Tampa Bay, 2004-2007. 3-14 Figure 3-19. Estimated monthly TSS loadings to Lower Tampa Bay, 2004-2007. 3-14 Figure 3-20. Estimated monthly BOD loadings to Lower Tampa Bay, 2004-2007. 3-15 Figure 3-21. Estimated monthly hydrologic loadings to Boca Ciega Bay,
2004-2007. 3-15 Figure 3-22. Estimated monthly TN loadings to Boca Ciega Bay, 2004-2007. 3-16 Figure 3-23. Estimated monthly TP loadings to Boca Ciega Bay, 2004-2007. 3-17 Figure 3-24. Estimated monthly TSS loadings to Boca Ciega Bay, 2004-2007. 3-17 Figure 3-25. Estimated monthly BOD loadings to Boca Ciega Bay, 2004-2007. 3-18 Figure 3-26. Estimated monthly hydrologic loadings to Terra Ceia Bay,
2004-2007. 3-18 Figure 3-27. Estimated monthly TN loadings to Terra Ceia Bay, 2004-2007. 3-19 Figure 3-28. Estimated monthly TP loadings to Terra Ceia Bay, 2004-2007. 3-20 Figure 3-29. Estimated monthly TSS loadings to Terra Ceia Bay, 2004-2007. 3-20 Figure 3-30. Estimated monthly BOD loadings to Terra Ceia Bay, 2004-2007. 3-21 Figure 3-31. Estimated monthly hydrologic loadings to Manatee River,
2004-2007. 3-21 Figure 3-32. Estimated monthly TN loadings to Manatee River, 2004-2007. 3-22 Figure 3-33. Estimated monthly TP loadings to Manatee River, 2004-2007. 3-23 Figure 3-34. Estimated monthly TSS loadings to Manatee River, 2004-2007. 3-23 Figure 3-35. Estimated monthly BOD loadings to Manatee River, 2004-2007. 3-24

1-1
1. INTRODUCTION The Tampa Bay Estuary Program (TBEP) has previously developed pollutant loading estimates for 1985-1991, 1992-1994, 1995-1998, and 1999-2003 (Zarbock et al., 1994; 1996; Pribble et al., 2001; Poe et al., 2005). These estimates were developed for total nitrogen, total phosphorus, and total suspended solids loadings to the bay, with the last two also including loadings of biochemical oxygen demand. This report is the fifth in the series of loading estimates, and is for the period 2004-2007. The 1985-1994 loading estimates were used in the development of empirical relationships between total nitrogen loadings and observed chlorophyll concentrations in three mainstem segments of the bay: Old Tampa Bay, Hillsborough Bay, and Middle Tampa Bay (Janicki and Wade, 1996). These relationships were part of the empirical model relating total nitrogen loadings to chlorophyll concentrations, chlorophyll concentrations to light availability, and light availability to seagrass restoration acreage. 1.1 Objectives The objective of this report is to provide annual average loading estimates for total nitrogen, total phosphorus, total suspended solids, and total biochemical oxygen demand for 2004-2007. These annual average estimates are derived from monthly loading estimates, using methods similar to those used previously (Zarbock et al., 1994; 1996; Pribble et al., 2001; Poe et al., 2005). The estimated 1992-1994 mean annual total nitrogen loadings represent those identified by the TBEP expected to result in light availability sufficient to meet the TBEP’s seagrass restoration goals. The empirical model relating total nitrogen loadings to seagrass restoration goals (Janicki and Wade, 1996) and observed increases in seagrass coverage suggested that light availability necessary for obtaining seagrass restoration goals could be met by establishing a “hold the line” strategy for nitrogen loadings. This strategy would hold nitrogen loadings to each segment of the bay to the average levels of 1992-1994. The TBEP adopted this strategy in 1996, and local government partners agreed to preclude increases in future nitrogen loadings to the bay to aid in this effort. Comparison of annual TN loadings for 2004-2007 to the loadings from 1992-1994 allows identification of the sources responsible for changes in loadings during 2004-2007. It also allows comparison of 2004-2007 nitrogen loadings to the “hold the line” loadings of 1992-1994 and extends the annual TN, TP, TSS, and BOD loading estimates through 2007. Estimated pollutant loadings are reported for each bay segment (Figure 1-1) from the major basins in each bay segment’s watershed (Figure 1-2). These loadings were developed by estimating loadings from each previously identified source in the watershed of the bay.

1-2
Figure 1-1. Bay segments of Tampa Bay.

1-3
The following sections present the methods and results of the 2004-2007 loading estimates. These sections include:
• descriptions of the methods used and data summaries for the estimated loadings from each loading source category for the 2004-2007 period;
• descriptions of the estimated hydrologic loadings for the 2004-2007 period, with comparison of 2004-2007 estimated annual hydrologic loadings to the mean annual 1992-1994 and 1995-1998 hydrologic loadings;
• a summary of the estimated total bay pollutant loadings, the estimated pollutant loadings to each bay segment, and a discussion of the differences in estimated total pollutant loadings of the 2004-2007 period as compared to those of 1992-1994, and their causes; and
• conclusions concerning the results of this update.
Figure 1-2. Major basins of the Tampa Bay watershed.
2-1
2. LOADING SOURCES As in previous loading estimates (Zarbock et al., 1994; 1996; Pribble et al., 2001; Poe et al., 2005), seven categories of sources were examined for their contributions to loadings of total nitrogen (TN), total phosphorus (TP), and total suspended solids (TSS) to the bay. Loading estimates of biochemical oxygen demand (BOD) were also developed for the 2004-2007 period. The loading sources examined were: • atmospheric deposition, • domestic point sources, • industrial point sources, • springs, • groundwater, • material losses from fertilizer handling facilities, and • nonpoint sources. For the purposes of this report, and for loading updates in the future, material losses are included in the industrial point source category, resulting in six source categories described in the following. The methods used to develop the loading estimates from each loading source are given in the following subsections. Modifications to the methods used for developing estimates from each source are described in each of the subsections. 2.1 Atmospheric Deposition 2.1.1 Background Total atmospheric deposition is defined as the sum of wet deposition (rainfall) and dry deposition (gaseous constituent interaction and dust fallout) directly to the surface of the bay. Deposition of pollutants to the watershed of the bay is incorporated into nonpoint source loading estimates. There are three data types needed to estimate total atmospheric deposition:
• an estimate of the hydrologic load directly to the surface of the bay via precipitation; • an estimate of the pollutant concentration in that precipitation; and • an estimate of dry deposition, either from empirical data or model-based estimates.
2.1.2 Methods The segment-specific hydrologic load to the surface of the bay via precipitation was estimated in the same manner as in the previous loading estimates (Zarbock et al., 1994; 1996; Pribble et al., 2001; Poe et al., 2005). An inverse distance-squared method was applied to data from 22 National Weather Service (NWS) rainfall monitoring sites in or near the Tampa Bay watershed to provide bay segment-specific monthly hydrologic loads from rainfall inputs. For previous loading estimates through 1996, TN concentration data in precipitation were obtained from the National Atmospheric Deposition Program (NADP) Verna Wellfield site (Zarbock et al.,

2-2
1994; 1996; Pribble et al., 2001). This site is near the southern boundary of the Tampa Bay watershed in Sarasota County, and represented the nearest site measuring precipitation concentration data. Concentrations of TP in precipitation were estimated based on data collected by the Tampa National Urban Runoff Study (NURP) (Metcalf & Eddy, 1983), and the mean TP concentration of 0.195 mg/L from the study was used for all rainfall events in estimating loadings up to 1996 (Zarbock et al., 1994; 1996; Pribble et al., 2001). The TN loadings from precipitation were estimated by multiplying the monthly precipitation-weighted mean TN concentrations from the Verna site and the monthly segment-specific hydrologic loads to estimate monthly wet TN loads to each bay segment. Similarly, the constant TP concentration derived from the NURP study was multiplied by the monthly segment-specific hydrologic loads to estimate monthly wet TP loads to each bay segment. The loading estimates through 1996 derived dry deposition of TN and TP using a ratio of dryfall to wetfall from the Florida Acid Deposition Study (FADS). Results of the study suggested that the dry:wet deposition ratio in Hillsborough County was 2.04:1 (ES&E, 1987). Thus, the monthly wet deposition was multiplied by 3.04 to estimate the total monthly TN and TP loading attributable to atmospheric deposition directly to the surface of the bay (Zarbock et al., 1994; 1996; Pribble et al., 2001). For the 1996-2006 period, more site-specific data were available for the atmospheric deposition loading estimate of nitrogen and phosphorus. In August 1996, the TBEP initiated monitoring as part of the Tampa Bay Atmospheric Deposition Study (TBADS). This program included sampling elements for both wet and dry deposition at an intensive monitoring site located on the Gandy Bridge Causeway. The data available from TBADS that are used to estimate atmospheric deposition to Tampa Bay include precipitation pollutant (nitrogen and phosphorous) concentration data, wet and dry deposition rates, and an estimate of the ratio of dry:wet deposition. The TBADS monitoring concluded in June 2006, so that for this estimate of 2004-2007 loadings, TBADS data were used for estimating nitrogen and phosphorus loadings from January 2004 through June 2006. For the period July 2006 through the end of 2007, the nitrogen concentration data from the Verna site were used for estimation of nitrogen loadings. Phosphorus concentration data were not available for the Verna site, so that a significant relationship was developed between total nitrogen and total phosphorus concentrations in rainfall at the TBADS site. This relationship was then used to estimate phosphorus concentrations based on the Verna nitrogen concentration data. The equation for wet deposition of nitrogen is as follows: Nwetm,s=[N]m * Hm,s, where:
Nwetm,s = wet deposition of nitrogen (kg/month) for each month m and bay segment s, [N]m= mean precipitation-weighted nitrogen concentration (g/m3) in the rainfall
measured at the TBADS site for January 2004 through June 2006, and at the Verna Wellfield for July 2006 through December 2007, for each month m, and

2-3
Hm,s= estimated hydrologic load (m3/month) from rainfall for each month m and bay segment s.
Dry deposition was estimated using the TBADS-derived seasonal dry:wet deposition ratio, which was 1.05 for the dry season (months 1-6, 11, and 12) and 0.66 for the wet season (months 7-10), as follows: Ndrym,s= Seasonal Deposition Ratio * Nwetm,s, where: Ndrym,s = dry deposition of nitrogen (kg/month) for each month m and bay segment s,
and Nwetm,s = wet deposition of nitrogen (kg/month) for each month m and bay segment s. The total atmospheric deposition to a bay segment was given as the sum of the wet and dry deposition, as follows: Ntotm,s= Nwetm,s + Ndrym,s, where: Ntotm,s = total atmospheric deposition of nitrogen (kg/month) for each month m and
bay segment s. The estimation of phosphorus deposition utilized the same equations. Wet phosphorus concentrations for January 2004–June 2006 were obtained from monitoring at the TBADS site, and for July 2006–December 2007 were obtained from applying the relationship developed between nitrogen and phosphorus concentrations at the TBADS site to the nitrogen data from the Verna site. Estimates of dry deposition of phosphorus were obtained using the same seasonal dry:wet ratios as utilized for estimation of nitrogen deposition. 2.2 Domestic Point Sources 2.2.1 Background Point sources of flow and pollutant loadings are defined as discharges that originate at a discrete location, such as from a pipe or a small, definable land area (such as for land application of treated wastewater effluent). Domestic sources include publicly and privately owned wastewater treatment plants. 2.2.2 Methods The estimated pollutant loadings from domestic point sources were derived using the same methods as used in previous loading estimates (Zarbock et al., 1994; 1996; Pribble et al., 2001; Poe et al., 2005). Domestic point sources identified for use in estimation of 2004-2007 loadings are shown in Table 2-1, and include all direct surface discharges and all land application discharges

2-4
with an annual average daily flow (ADF) of 0.1 mgd or greater. Appendix A provides a table of all point sources for which loading estimates were developed for the 1992-1994 period which were no longer active during the 2005-2007 period. Domestic point sources were identified by reviewing FDEP point source discharge locations in relation to the Tampa Bay watershed. These locations were used to create an ArcGIS coverage, and then mapped for FDEP Tampa office staff review. The domestic point sources in the Tampa Bay watershed with ADF of 0.1 mgd or greater were identified with the assistance of FDEP Tampa office staff. Data sources used to estimate domestic point source discharge and concentration data to Tampa Bay for 2004-2007 are as follows:
• Monthly Operating Reports (MOR) and Discharge Monitoring Reports (DMR) obtained from the EPCHC and the Tampa office of the FDEP; and
• MOR and DMR data obtained directly from the domestic wastewater treatment
facilities for those data not obtained from the EPCHC and FDEP. A database of domestic point source discharge information was developed, including monthly discharge rates and TN, TP, TSS, and BOD concentration data. Both surface water dischargers and facilities with land application of effluent were included. Monthly data from a total of 32 major domestic point source dischargers (Table 2-1) were included. Three facilities that were included in the 1999-2003 estimates are not included in the 2004-2007 list because the facilities closed. There are no new facilities in the 2004-2007 list. The database was subjected to quality control measures to ensure that the most accurate flows and concentrations obtainable were used in the loading estimates. The entries were scanned for incongruous data points. Obvious outliers (such as flows of two or three orders of magnitude higher than the design capacity of the facility) were removed from the record. Complete records existed for most domestic wastewater treatment plants, with facilities reporting flow rate and concentrations for TN, TP, TSS, and BOD on a monthly basis. Attempts were made to locate sources of valid data to replace missing or invalid values, often by contacting facility personnel directly. For those data gaps that could not be filled with actual recorded data, two methods were used to complete the record, depending upon the amount of data missing, as follows:
• If 1-3 consecutive months of data were missing, discharge and/or pollutant concentrations were set to those of the last month for which values existed.
• If data from more than 3 consecutive months were missing, discharge and/or
pollutant concentrations were set to the monthly averages of the 2004-2007 record. In some cases, a form of nutrient other than total nitrogen was reported. For example, if both total nitrogen and nitrate nitrogen were recorded for some months at a facility, but only nitrate nitrogen was recorded for most months, the average ratio of nitrate to total nitrogen was calculated for those

2-5
Table 2-1. Domestic point sources in the Tampa Bay watershed (2004-2007).
Facility Name Bay Segment Major Basin
City of Bradenton Manatee River Manatee River City of Clearwater East Old Tampa Bay Coastal OTB City of Clearwater Northeast Old Tampa Bay Coastal OTB Hillsborough County Dale Mabry Old Tampa Bay Coastal OTB Hillsborough County Falkenburg Hillsborough Bay Coastal HB City of Tampa H.F. Curren Hillsborough Bay Coastal HB City of Lakeland Hillsborough Bay Alafia River City of Largo Old Tampa Bay Coastal OTB Manatee County North County Regional Lower Tampa Bay Coastal LTB Manatee County Southeast Subregional Manatee River Manatee River MacDill A.F.B. Middle Tampa Bay Coastal MTB City of Mulberry Hillsborough Bay Hillsborough River Hillsborough County Northwest Regional Old Tampa Bay Coastal OTB City of Oldsmar Old Tampa Bay Coastal OTB On Top of the World Old Tampa Bay Coastal OTB City of Palmetto Terra Ceia Bay Terra Ceia Bay Pasco County Southeast Subregional Hillsborough Bay Hillsborough River Pebble Creek Hillsborough Bay Hillsborough River City of Plant City Hillsborough Bay Hillsborough River Polk County Southwest Regional Hillsborough Bay Alafia River Hillsborough County River Oaks Old Tampa Bay Coastal OTB Hillsborough County South County Regional Middle Tampa Bay Little Manatee River City of St. Petersburg Albert Whitted City of St. Petersburg Northeast City of St. Petersburg Northwest City of St. Petersburg Southwest
Old Tampa Bay, Middle Tampa Bay, and Boca Ciega Bay
Coastal OTB, Coastal MTB, Boca Ciega Bay
Hillsborough County Valrico Hillsborough Bay Alafia River Hillsborough County Van Dyke Old Tampa Bay Coastal OTB Wesley Chapel Hillsborough Bay Hillsborough River City of Zephyrhills Hillsborough Bay Hillsborough River Pinellas County South Cross Bayou Boca Ciega Bay Boca Ciega Bay Pinellas County Northwest Old Tampa Bay Coastal OTB
months with both values. The resulting ratio was applied to the other months, resulting in an estimate of total nitrogen for those months. If only nitrate nitrogen data existed, then total nitrogen concentration was set to the reported concentration of nitrate nitrogen. No quantitative analysis of the potential underestimate of the resulting TN loading from facilities without TN data has been performed. If no data for a certain parameter were available for a facility and it was known or suspected that loadings of that chemical did occur, then other similar facilities were examined. Typical or averaged data from these facilities were used to fill data gaps if no other source of information was available. This method was chosen as an alternative to showing missing data for loads from major point sources.

2-6
Only 0.1% of the domestic facility flow records were filled via interpolation. Very few data records were filled with interpolated or facility mean TN concentrations, as information was requested from many of the facilities directly to complete the database. Those facilities which are no longer required to report TN concentrations were assigned concentrations based on means of data collected from previous years. Surface Discharge Many of the inventoried domestic facilities utilize direct surface discharge for effluent disposal. Surface water inputs from domestic point sources were estimated for both the gaged and ungaged basins of the watershed, expressed as a volume per unit time, such as million gallons per day (mgd). The flows from each point source were assigned to the subbasin that receives the discharge, allowing the aggregation of point source flows for each major drainage basin and each bay segment. All of the effluent released via surface discharge was assumed to reach Tampa Bay. Domestic point source loadings were subtracted from the total gaged nonpoint source loads, discussed later, to avoid double counting of point source loadings originating upstream of gages. Estimates of point source pollutant loading for surface water discharges were obtained by multiplying the reported mean monthly concentration of the pollutant of concern and the mean monthly discharge volume. With appropriate conversion factors, this calculation yields a mass per unit time, such as tons per year of pollutant (TN, TP, TSS, BOD). Land Application Treated effluent from domestic facilities is frequently discharged onto the land, most commonly for reuse by spray irrigation or into percolation ponds. The applied effluent evaporates, is taken up by vegetation, becomes surface runoff (generally a very small component of the total volume), or infiltrates to the water table. Therefore, pollutant loadings from this source that reach the bay generally do so via groundwater. In this loading analysis, land application effluent loads are calculated separately from groundwater loads. Land application loadings were estimated using recorded effluent quality data from specific facilities, with "typical" reduction rates applied to the nitrogen and phosphorus once in the environment. These reduction rates are the same as those used previously for loading estimations for the 1985-2003 period (Zarbock et al., 1994; 1996; Pribble et al., 2001; Poe et al., 2005), and account for attenuation of pollutants in the environment prior to the effluent flow reaching the receiving water of Tampa Bay. Pollutant loading reductions applied to loads discharged to land were as follows:
TN (spray irrigation) : 95% reduction for City of St. Petersburg facilities,
: 90% reduction for all other facilities, TN (percolation pond) : 70% reduction, TP (all) : 95% reduction, TSS (all) : 95% reduction, and BOD (all) : 95% reduction.
The attenuation of BOD loads was set to the same rate as that for TP and TSS. A complete description of loading calculations from land application can be found in Zarbock et al. (1994).

2-7
2.3 Industrial Point Sources 2.3.1 Background Industrial point sources include dischargers of process water and other effluent not categorized as domestic sewage, as well as those sources of fertilizer handling losses. Fertilizer losses from loading docks at port facilities constitute a source of nutrient loading to the bay. In particular, bulk phosphate fertilizer is subject to product losses during its transfer from land carrier to storage facility, and onto vessels for shipping. Product is lost both through spilled product directly entering the bay and via fugitive dust. Any materials loadings transported to the bay by stormwater runoff are estimated using data from the NPDES monitoring reporting. Material losses occur at facilities at the Port of Tampa in the Coastal Hillsborough Bay basin, and at Port Manatee in the Coastal Lower Tampa Bay basin. 2.3.2 Methods Estimates of total nitrogen and total phosphorus loadings due to material losses were developed for handling facilities listed in Table 2-2. For previous loading estimates, facility personnel provided shipping tonnage estimates, to which were applied multipliers to represent loss fractions (Zarbock et al., 1996; Pribble et al., 2001; Poe et al., 2005). For the 2004-2007 estimates, most facilities provided spreadsheets containing loss estimates due to handling losses and airborne (fugitive) losses on an annual basis. The Kinder Morgan and Eastern facilities did not provide updated estimates for 2004-2007, so the average annual loadings for the 1999-2003 period were used. These annual loading estimates were requested and obtained through the assistance of Mr. Craig Kovach, QuietEarth Consultants, Inc., and provided to the TBEP in electronic format. The estimates for the 2004-2007 period represent the best estimates by facility personnel of actual losses. These estimates reflect both actual reductions in nutrient losses from improved handling practices implemented by all facilities over the past several years and improved loss estimation techniques for both ship loading losses and air borne losses.
Table 2-2. Fertilizer handling facilities 2004-2007. Facility Name Bay Segment CF Industries Hillsborough Bay CSX Hillsborough Bay Mosaic Riverview (fka Cargill) Hillsborough Bay Eastern Hillsborough Bay Mosaic Big Bend Hillsborough Bay Kinder Morgan Port Sutton Hillsborough Bay Kinder Morgan Port Manatee Lower Tampa Bay
The remaining estimated pollutant loadings, those other than the material losses described above, from industrial point sources were derived using the same methods as used in previous loading estimates (Zarbock et al., 1994; 1996; Pribble et al., 2001; Poe et al., 2005). Industrial point sources identified for use in estimation of 2004-2007 loadings from process water and stormwater discharges are shown in Table 2-3, and include all direct surface discharges and all land application discharges with an average daily flow of 0.1 mgd or greater. Appendix A provides a table of all

2-8
point sources for which loading estimates were developed for the 1992-1994 period which were no longer active during the 2005-2007 period.
Table 2-3. Industrial point sources in the Tampa Bay watershed (2004-2007). Facility Name Bay Segment Agrifos Nichols Prep Plant (fka Mobil) Hillsborough Bay Alpha/Owens-Corning Hillsborough Bay Brewster Phosphogypsum Hillsborough Bay Bridgeway Acres Landfill Old Tampa Bay CF Industries Bartow Hillsborough Bay CF Industries Plant City Hillsborough Bay CF Industries Tampa Ammonia Terminal Hillsborough Bay CF Industries Tampa Phosphate Warehouse Hillsborough Bay Coronet Industries Hillsborough Bay CSX Transportation Winston Yard Hillsborough Bay Estech-Agricola Silver City Mine Hillsborough Bay Exxon Mobil ElectroPhos Site Hillsborough Bay Kinder Morgan Hartford Terminal (fka Nitram) Hillsborough Bay Kinder Morgan NH3 Facility (fka IMC Agrico Port Sutton) Hillsborough Bay Kinder Morgan Port Sutton (fka Pakhoed Dry Bulk) Hillsborough Bay Mastertaste (fka Crystals) Hillsborough Bay Mosaic Bartow Hillsborough Bay Mosaic Fort Lonesome Mine Hillsborough Bay Mosaic Four Corners Mine Middle Tampa Bay Mosaic Green Bay Plant (fka Farmland Hydro) Hillsborough Bay Mosaic Hookers Prairie Hillsborough Bay Mosaic Hopewell Hillsborough Bay Mosaic Kingsford Mine Complex Hillsborough Bay Mosaic Mulberry Plant (fka Mulberry Phosphates) Hillsborough Bay Mosaic New Wales Hillsborough Bay Mosaic New Wales Stack Closure Hillsborough Bay Mosaic Nichols Stack Closure Hillsborough Bay Mosaic Riverview (fka Cargill) Hillsborough Bay Mosaic Riverveiw Stack Closure Hillsborough Bay Mosaic South Pierce Hillsborough Bay Piney Point Phosphates Lower Tampa Bay TECO Big Bend Station Middle Tampa Bay TECO Gannon Station Hillsborough Bay Trademark Nitrogen Hillsborough Bay Tropicana North America Manatee River Yara North America (fka Farmland Port Sutton) Hillsborough Bay
Industrial point source identification was initiated using those sources identified for the 1999-2003 loading estimates (Poe et al., 2005). These sources were first checked to identify which sources were operational during the 2004-2007 period, with those that were no longer discharging removed from the list. Additional industrial point sources in the Tampa Bay watershed not included in the 1999-2003 list and meeting the 0.1 MGD discharge criterion were then identified with the assistance of FDEP staff. The locations of these sources were obtained from FDEP. These locations were used to create an ArcGIS coverage, and then mapped for FDEP Tampa office staff review.

2-9
Data sources used to estimate process water and stormwater industrial point source discharges and loadings to Tampa Bay for 2004-2007 are as follows:
• MORs and DMRs obtained from the Environmental Protection Commission of Hillsborough County (EPCHC) and the Tampa office of the FDEP; and
• MOR and DMR data obtained directly from the industrial wastewater treatment facilities for those data not obtained from the EPCHC and FDEP.
A database of industrial point source discharge information was developed, listing monthly discharge rates and TN, TP, TSS, and BOD concentration data. Both surface water dischargers and facilities with land application of effluent were included. Monthly data from a total of 37 major industrial point sources (Table 2-3) were included. The database was subjected to quality control measures to ensure that the most accurate flows and concentrations obtainable were used in the loading estimates. The entries were scanned for incongruous data points. Obvious outliers (such as flows of two or three orders of magnitude higher than the design capacity of the facility) were removed from the record. Attempts were made to locate sources of valid data to replace missing or invalid values, often by contacting facility personnel directly. For those data gaps that could not be filled with actual recorded data, two methods were used to complete the record, depending upon the amount of data missing, as follows.
• If 1-3 consecutive months of data were missing, discharge and/or pollutant concentrations were set to those of the last month’s for which values existed.
• If data from more than 3 consecutive months were missing, discharge and/or
pollutant concentrations were set to the monthly averages of the 2004-2007 record. In some cases, a form of nutrient other than total nitrogen was reported. For example, if both total nitrogen and nitrate-nitrogen were recorded for some months at a facility, but only nitrate-nitrogen was recorded for most months, the average ratio of nitrate to total nitrogen was calculated for those months with both values. The resulting ratio was applied to the other months, resulting in an estimate of total nitrogen for those months. If only nitrate-nitrogen data existed, then total nitrogen concentration was set to the reported concentration of nitrate-nitrogen. If no data for a certain parameter were available for a facility and it was known or suspected that loadings of that chemical did occur, then other similar facilities were examined. Typical or averaged data from these facilities were used to fill data gaps if no other source of information was available. This method was chosen as an alternative to showing missing data for loads from major point sources. Approximately 3% of the industrial facility flow records were missing, and were filled via interpolation. Very few data records were filled with interpolated or facility mean TN concentrations, as information was requested from many of the facilities directly to complete the database. Those facilities which are no longer required to report TN concentrations were assigned concentrations based on means of data collected from previous years.

2-10
Surface Discharge Most of the inventoried industrial facilities utilize direct surface discharge for effluent disposal. Surface water inputs from industrial point sources were estimated for both the gaged and ungaged basins of the watershed, expressed as a volume per unit time, such as mgd. The flows from each point source were assigned to the subbasin that receives the discharge, allowing the aggregation of point source flows for each major drainage basin and each bay segment. All of the effluent released via surface discharge was assumed to reach the Tampa Bay system. As for domestic point source loadings, industrial point source loadings in gaged basins were subtracted from the total gaged loads to avoid double counting of point source loadings originating upstream of gages. Estimates of industrial point source pollutant loading for surface water discharges were calculated by multiplying the reported concentration of the pollutant of concern and the discharge volume. With appropriate conversion factors, this calculation yields a mass per unit time, such as tons of pollutant per year (TN, TP, TSS, BOD). Land Application Treated effluent from industrial facilities is sometimes discharged onto the land, most commonly into percolation ponds. The applied effluent evaporates, is taken up by vegetation, becomes surface runoff (generally a very small component of the total volume), or infiltrates to the water table. Therefore, pollutant loadings from this source that reach the bay generally do so via groundwater. In this loading analysis, land application effluent loads are calculated separately from groundwater loads. Land application loadings were estimated using recorded effluent quality data from specific facilities, with "typical" reduction rates applied to the nitrogen and phosphorus once in the environment. These reduction rates are the same as those used previously for loading estimations for the 1985-2003 period (Zarbock et al., 1994; 1996; Pribble et al., 2001; Poe et al., 2005), and account for attenuation of pollutants in the environment prior to the effluent flow reaching the receiving water of Tampa Bay. The reduction rates are listed above in the description of the domestic point source loading estimate methods. Accidental Spills Large spills or discharges occurring during the time period under study are accounted for in the best estimate loadings reported. These spills and discharges are included in the industrial point source loadings, as all are associated with industrial point source entities. For example, the Mulberry Phosphate spill was incorporated into the industrial point source loadings provided in the 1995-1998 loadings report. Loadings from the former Piney Point Phosphate facility are included in the 2004-2007 estimates presented here, as are loadings from industrial NPDES facilities during the period of emergency discharge as authorized by FDEP during 2004 and 2005. In addition to these discharges, two accidental spills of note occurred from industrial point sources during the 2004-2007 period, as described below, and are also included in the loadings reported. Detailed descriptions of the management actions and subsequent controlled releases from the Piney Point facility to Bishop Harbor are provided in Appendix E. In brief, the Piney Point complex held

2-11
a process water inventory of ±500 million gallons, which was acidic and contained elevated levels of nutrients (i.e. ammonia and phosphorus), fluoride, sulfate, and metals. In 2001, Piney Point Phosphates, Inc. notified the Department of Environmental Protection that it had no money and could no longer maintain the facility. As a result, in 2001 the U.S. Environmental Protection Agency assumed responsibility for the environmental security of the facility until transferring that role to the Department on February 21, 2001. Water consumption requirements were significantly increased by Tropical Storm Gabrielle in September 2001 and El Niño conditions in December 2002 and January 2003, coupled with above average rainfall in calendar year 2002. In order to minimize potential adverse environmental impacts to Bishop Harbor, the Department, at extremely high cost, treated and barge dispersed in the Gulf of Mexico over 248 million gallons of process water and trucked over 86 million gallons of water to area domestic wastewater treatment facilities and another 96 million gallons to industrial facilities for beneficial re-use. In addition, the Department founded the development of the use of reverse osmosis technology to treat phosphate chemical complex process wastewater streams, which resulted in treatment to ultra-pure water quality levels. Water quality improvements were also obtained through double lime treatment and spray evaporation prior to discharge. Discharges of the reverse osmosis, lime, and aeration treated water occurred sporadically to Bishop Harbor during 2001 through 2003 and occurred continuously throughout 2004 until March 2007, after which no discharge from the site has occurred. As of this date, most of the stacks at the facility are closed, with the final stack closure scheduled for this year or next. As noted above, two accidental spills resulting in relatively high loadings of nitrogen to the bay occurred during the 2004-2007 period. The first of these was a release of acidic process water from the Mosaic Riverview facility due to berm erosion on September 5-6, 2004, during Hurricane Frances. This release totaled 65 million gallons containing 125 tons of TN and 1823 tons of TP to the lower Alafia River and thence to Hillsborough Bay (R. Boler, pers. comm.). The second accidental spill was an anhydrous ammonia release from a ruptured pipeline to the lower Alafia River in November 2007, releasing 4.5 tons of TN to the bay (E. Sherwood, pers. comm.). 2.4 Springs 2.4.1 Background Springs are also a source of pollutant loadings to Tampa Bay. Previous loading estimates have been developed for Sulphur Springs, Lithia Springs, Buckhorn Springs for 1985-2003, these springs being identified as significant discharges in the Tampa Bay watershed (Zarbock et al., 1994; 1996; Pribble et al., 2001; Poe et al., 2005). Smaller springs also exist in the watershed, but have relatively small discharges and were not considered in this loading analysis or the previous estimates. Lithia Springs, Buckhorn Springs, and Sulphur Springs are not in gaged portions of the Tampa Bay watershed, but are themselves gaged, therefore loading estimates were derived for these springs. Loadings from Crystal Springs, in the gaged Hillsborough River watershed, were not estimated for the 1995-2007 period, as sufficient records did not exist. Since Crystal Springs is in a gaged basin, the loadings from the springs are still accounted for in the total loads to the bay, captured in the nonpoint source category loads.

2-12
2.4.2 Methods Pollutant loadings from Sulphur Springs, Lithia Springs, and Buckhorn Spring were estimated. Spring discharge loadings were estimated based on discharge data measured by SWFWMD, USGS, and Tampa Bay Water, and water quality data from FDEP via the Florida STORET database. Only periodic data were available. The pollutant concentrations were obtained by averaging measured data for each spring over the 2004-2007 period, if the data were available, or using previous concentrations if no data were available. Discharge estimates for months with no measured flow data were made by interpolating between preceding and succeeding months that did have measured data. For each spring, the monthly measured or estimated pollutant concentrations were multiplied by the monthly estimated or measured discharge to obtain monthly loads. Monthly loads were summed to produce annual loads for the 2004-2007 period. 2.5 Groundwater 2.5.1 Background
Groundwater is a source of freshwater and nutrient loadings to many coastal areas. The surficial (water table), intermediate, and Floridan aquifers all contribute flows and loads to Tampa Bay. Estimates of groundwater pollutant loadings for the 2004-2007 period were derived using the same methods as in previous estimates (Zarbock et al., 1994; 1996; Pribble et al., 2001; Poe et al., 2005).
2.5.2 Methods Data sources used to estimate groundwater flows and loadings to Tampa Bay for 2004-2007 are as follows:
• Floridan aquifer potentiometric surfaces for May (representing the dry season) and September (representing the wet season) for calendar years 2004 through 2007 were obtained from USGS
• Topography data for the Tampa Bay watershed and shoreline lengths of the bay were obtained from USGS quadrangle (7.5-minute) maps.
• TN and TP concentration data for the surficial, intermediate, and Floridan aquifers were obtained from the SWFWMD Ambient Ground Water Monitoring Program (AGWMP) (R. Starks, personal communication, April 21, 2008). Reported concentrations from monitor wells in the groundwater flow area tributaries to each bay segment were averaged to yield a representative groundwater concentration. If only a few monitor wells were present in an area, concentrations from several adjoining flow areas were averaged. It was desired to obtain a representative regional set of concentration values. Thus, the data set was reviewed and monitor wells deemed to not be representative of regional conditions (such as wells located adjacent to known groundwater pollution sources) were not used. Additionally, individual concentration values that were noted in the data set as being outside the normal range of concentrations for that station (potential outliers) were censored. Nitrate+nitrite (as N) concentrations were used to estimate nitrogen loads, as these species are most often cited as groundwater pollution threats. Few ammonia concentration data were available, and ammonia nitrogen concentrations were typically less than 10% of those of nitrate+nitrite nitrogen. Total phosphorus (as P)

2-13
was used to estimate phosphorus loads due to the general lack of significant concentrations of organic phosphorus in groundwater.
• Surficial and intermediate aquifer elevation data used for the 1999-2003 estimate were the most recent available information suitable for bay-wide loading calculations, and were used for this analysis.
Groundwater flows were estimated for each of the bay segments. Only groundwater inflow that entered the bay directly from the shoreline or bay bottom was considered. Groundwater and septic tank leachate inflow to streams was accounted for through measured or modeled surface water flow and was attributed as nonpoint source loading, and was not included in these groundwater loading estimates. Existing estimates of wet and dry season groundwater inflow to Tampa Bay were completed using the methods of Hutchinson (1983) and Brooks et al. (1993). Flow estimates were calculated using a flow net analysis and Darcy's equation (Freeze and Cherry, 1979), a well-recognized analytical method for estimating groundwater flow. The flow net analysis is a graphical procedure used to identify groundwater flow paths based on water surface profiles. Darcy's Equation is: Q = (7.48 x10⁻⁶) T x I x L where: Q = flow rate, in million gallons per day (MGD), T = aquifer transmissivity, in ft2/day, I = hydraulic gradient (head difference/length of flow path), L = width of flow path, in feet, and
1 cubic foot = 7.48 x 10⁻⁶ million gallons. Average wet season and dry season flows and loadings from the Floridan and intermediate aquifers, and annual flows and loadings from the surficial aquifer, were estimated using the following methods:
1) Values for transmissivity (T) for the Floridan and intermediate aquifers were taken from USGS and SWFWMD groundwater modeling reports for the Tampa Bay area (Ryder et al., 1980; Wolansky and Corral, 1985; Jones, 1990). “T” values for different areas of the watershed were used as available. A single watershed-wide value for “T” for the surficial aquifer was taken from Brooks et al. (1993). These aquifer characteristic values are generally stable over time and did not change from previous loading estimates (Zarbock et al., 1994; 1996; Pribble et al., 2001; Poe et al., 2005).
2) For all three aquifers, the regions of groundwater flow to each bay segment were identified as discrete flow zones. Flow zones were delineated using USGS potentiometric surface maps and a flow net analysis. Groundwater flow path lines were drawn perpendicular to the lines of equipotential (constant head). Flow paths leading to each bay segment were identified, and the associated flow zones were then delineated.

2-14
3) Values for “I” and “L” for the Floridan and intermediate aquifers were determined using USGS potentiometric surface maps as referenced above. Seasonal values for “I”, the hydraulic gradient of the aquifer, were estimated by measuring the change in potentiometric surface elevation and the length of the groundwater flow path over the distance from the inland boundary of the groundwater flow area to the bay shoreline, for each bay segment tributary area. An average annual value of “I” for the surficial aquifer was estimated by measuring the change in land surface elevation over the horizontal distance from an inland topographic depression to the bay shoreline, and measuring the length of the groundwater flow path from the topographic depression to the bay shoreline, for each bay segment tributary area. It was assumed that the gradient of the surficial aquifer would follow the general gradient of the land surface. This value did not change from previous estimates.
4) “L,” the width of the flow path, was estimated by measuring the length of the bay segment shoreline, expressed as a plane perpendicular to the groundwater flow path for each bay segment.
5) Using the above data and Darcy’s equation, flow estimates were made for the Floridan and intermediate aquifers for wet and dry seasons using the appropriate potentiometric surface maps.
6) Because surficial aquifer gradients can change greatly over relatively small distances and time frames, it was not feasible to estimate surficial aquifer inflows on a seasonal basis. Therefore, surficial aquifer flow rates were estimated for average annual conditions only, also using Darcy’s equation.
Monthly groundwater TN, TP, and freshwater loadings to each bay segment from each aquifer for the period 2004 through 2007 were then estimated as follows:
1) Wet and dry season Floridan and intermediate aquifer flow rates (expressed as million gallons per day) were multiplied by the average TN and TP concentrations (mg/L) for each bay segment flow zone. The resulting bay segment loading rates were converted to kg/month.
2) Surficial aquifer loading rates were estimated in the same manner, but with a constant monthly flow rate throughout the year, not seasonal rates.
3) Pollutant loads and flows from the Floridan, intermediate, and surficial aquifers were then summed on a monthly basis to yield total monthly pollutant loads (kg/month) and inflows (cubic meters/month) to each bay segment.
2.6 Nonpoint Sources 2.6.1 Background Nonpoint source pollutant loadings result from stormwater runoff from the Tampa Bay watershed and base flow from the rivers draining to the bay. The estimated nonpoint source loadings for the 2004-2007 period were derived using the same methods as those for the previous loadings estimates (Zarbock et al., 1994; 1996; Pribble et al., 2001; Poe et al., 2005). The SWFWMD 2005 land use was utilized for the 2004-2007 nonpoint source loadings estimates, whereas previous estimates used the SWFWMD landuse for 1999, 1995 and 1990.

2-15
2.6.2 Methods Nonpoint source TN, TP, TSS, and BOD loadings for the gaged and ungaged portions of the watershed were estimated for the period 2004-2007. The methods for estimating loadings from gaged basins and ungaged basins are described below. A map showing the location of the gaged and ungaged basins is provided in Figure 2-1. The methods for estimating pollutant loadings from the watershed are presented in Figure 2-2 below. It should be noted that the watershed pollutant loadings include loadings from nonpoint sources, domestic point sources, industrial point sources, and springs. The first method shown in Figure 2-2 is used for those gaged basins for which both measured flow and water quality data exist. The second method is used for those gaged basins for which measured flow data exist, but for which no measured water quality data exist. The third method is used for ungaged basins, for which neither flow nor water quality data are measured. Each of these methods is described below. Streamflow data were obtained from USGS, SWFWMD, Manatee County, and the City of Bradenton. Water quality data were obtained from the USGS, EPCHC, Pinellas County Department of Environmental Management, and Manatee County. Gaged Basins with Measured Streamflow and Water Quality Data. Measured streamflow data and measured water quality data were used to estimate nonpoint source loadings from the gaged basins where both data types existed. As shown in Figure 2-2, pollutant loadings from these basins were estimated by multiplying measured monthly flows (Q) at stream gage sites by pollutant concentrations (WQ) measured at or very near the same site, yielding monthly pollutant loads at each gaged point. The pollutant concentration for any missing month at a stream gage was estimated by interpolating between the nearest preceding and succeeding months. Pollutant loads for the most downstream gage in each gaged river and stream were estimated on a monthly basis. Data from the sites in Table 2-4 were used to estimate gaged area loadings. To derive the nonpoint source loading estimates using this method, the contributions of domestic and industrial point sources in the gaged basins were subtracted from the total watershed loadings estimates. This provided estimates of the loadings from nonpoint sources only. Gaged Basins with Measured Streamflow but no Water Quality Data. Measured streamflow and estimated water quality data were used to estimate nonpoint source loadings from the gaged basins for which measured water quality data did not exist. As in previous loading estimates, derivation of pollutant loadings from these basins involved utilization of streamflow data and data from GIS coverages for land use and subbasin boundaries, wet and dry season land use-specific runoff coefficients, and land use-specific water quality concentrations. Land use information was obtained from the SWFWMD GIS coverages based on 2005 aerial photographs and classified according to the Florida Land Use and Cover Classification System (FDOT, 1985). Land uses were aggregated into 21 categories (Appendix B) for loading calculations. Subbasin delineations were also obtained from SWFWMD, and were based on USGS subbasin boundaries (Foose, 1993). The land use categories and subbasin boundaries are the same as those used in the previous loading estimates (Poe et al., 2005; Pribble et al., 2001; Zarbock et al., 1994; 1996).

2-16
Figure 2-1. Map showing gaged and ungaged basins.

2-17
Table 2-4. Downstream stream gage stations
Stream Gage Site Name Streamflow
(Agency/Site Number) Water Quality
(Agency/Site Number) Lake Tarpon Outfall Canal
SWFWMD/FLO12 (S-551)
PCDEM/3-9
Rocky Creek
USGS/02307000
EPCHC/103
Sweetwater Creek
USGS/02306647
EPCHC/104
Hillsborough River at Dam
USGS/02304500
EPCHC/105
Tampa Bypass Canal
SWFWMD/FLO13 (S-160)
EPCHC/147
Delaney Creek
USGS/02301750
EPCHC/138
Alafia River at Lithia
USGS/02301500
EPCHC/114
Bullfrog Creek
USGS/02300700
EPCHC/132
Little Manatee River at Wimauma
USGS/02300500
EPCHC/113
Manatee River at Lake Manatee Dam
Manatee County/Lake Manatee Dam
Manatee County/Lake Manatee Dam
As shown in Figure 2-2, for each land use category (i), specific water quality concentrations (WQi’) were obtained from the literature (Appendix C). Runoff from each land use category was estimated by apportioning the nonpoint source gaged streamflow among the constituent land use categories in the basin. The nonpoint source streamflow was derived from the gaged basin flow by subtracting domestic point source, industrial point source, and spring contributions from the gaged flow. The apportionment of the nonpoint source flows to each land use category was accomplished as follows:
∑=
iii
iini RA
RAQQ '
where:
Qi’= total nonpoint source flow (m3/month) from land use category i, Qn= total nonpoint source flow (m3/month) from the gaged basin, Ai = area of land use category i in gaged basin, and Ri = runoff coefficient for land use category i for the month, representing fraction of
rainfall that runs off of the land (Appendix D).

2-18
Basin Gaged?
Gaged Basin
Yes No
Ungaged Basin
WQ DataAvailable?
Yes
EstimateQi’By Land Use
No
WQi’ fromLiterature
NPS Load=Σ(Qi’* WQi’)By Land Use
Total Load=NPS+DPS+IPS+SpringsTotal Load=Q*WQ
EstimateQi’From Rain &
Land Use DataWQi’ fromLiterature
NPS Load=Σ(Qi’* WQi’)By Land Use
Total Load=NPS+DPS+IPS+Springs
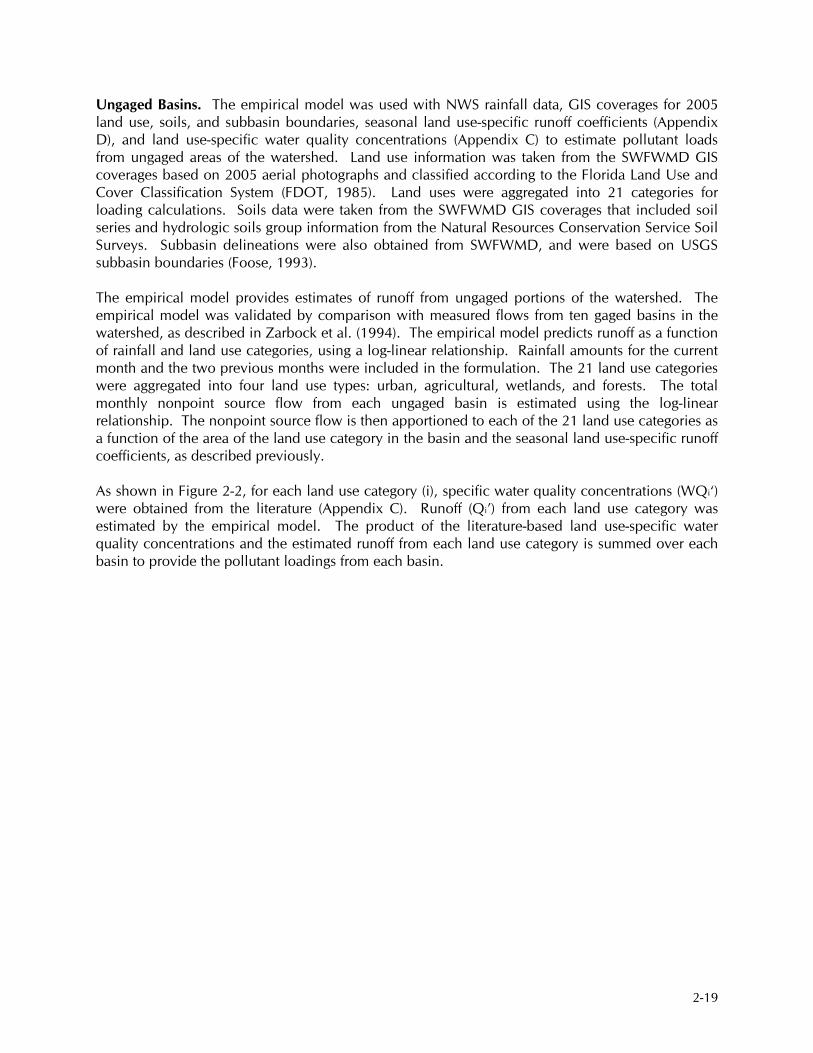
Figure 2-2. Process for estimating total watershed loadings from gaged and ungaged basins. As shown in Figure 2-2, nonpoint source pollutant loadings from these basins were estimated by multiplying the monthly nonpoint source flows apportioned to each land use category (Qi’) by the land use-specific pollutant concentrations (WQi’), yielding monthly pollutant loadings from each land use category in the basin. The monthly pollutant loadings from all land use categories were then summed over the basin to provide an estimate of the total nonpoint source pollutant loadings from the basin. Loadings for the gaged portion of the Alafia River were adjusted for the reduction of loading due the permanent withdrawal for potable water supply by Tampa Bay Water. The withdrawal point is located on the Alafia River between the Lithia gage and Bell Shoals Road Crossing. The reduction in load was calculated by multiplying the rate of the actual water withdrawals by ambient EPC observed concentrations of pollutants at Bell Shoals Road. The numbers throughout the report reflect this correction.
2-19
Ungaged Basins. The empirical model was used with NWS rainfall data, GIS coverages for 2005 land use, soils, and subbasin boundaries, seasonal land use-specific runoff coefficients (Appendix D), and land use-specific water quality concentrations (Appendix C) to estimate pollutant loads from ungaged areas of the watershed. Land use information was taken from the SWFWMD GIS coverages based on 2005 aerial photographs and classified according to the Florida Land Use and Cover Classification System (FDOT, 1985). Land uses were aggregated into 21 categories for loading calculations. Soils data were taken from the SWFWMD GIS coverages that included soil series and hydrologic soils group information from the Natural Resources Conservation Service Soil Surveys. Subbasin delineations were also obtained from SWFWMD, and were based on USGS subbasin boundaries (Foose, 1993). The empirical model provides estimates of runoff from ungaged portions of the watershed. The empirical model was validated by comparison with measured flows from ten gaged basins in the watershed, as described in Zarbock et al. (1994). The empirical model predicts runoff as a function of rainfall and land use categories, using a log-linear relationship. Rainfall amounts for the current month and the two previous months were included in the formulation. The 21 land use categories were aggregated into four land use types: urban, agricultural, wetlands, and forests. The total monthly nonpoint source flow from each ungaged basin is estimated using the log-linear relationship. The nonpoint source flow is then apportioned to each of the 21 land use categories as a function of the area of the land use category in the basin and the seasonal land use-specific runoff coefficients, as described previously. As shown in Figure 2-2, for each land use category (i), specific water quality concentrations (WQi‘) were obtained from the literature (Appendix C). Runoff (Qi’) from each land use category was estimated by the empirical model. The product of the literature-based land use-specific water quality concentrations and the estimated runoff from each land use category is summed over each basin to provide the pollutant loadings from each basin.

3-1
3. HYDROLOGIC AND POLLUTANT LOADINGS Changes in hydrologic loadings were examined to evaluate whether increases in pollutant loadings were due to increased hydrologic loadings, the results of higher rainfall totals, or to anthropogenic activities. If higher than expected pollutant loadings result, then anthropogenic activities may be suspected as a causative factor. For this reason, annual variations in hydrologic loadings were examined with respect to annual rainfall totals. The annual rainfall ranged relatively widely from 2004-2007, from approximately 41 to 66 inches (Table 3-1). In 2004, four hurricanes hit peninsular Florida and are largely responsible for this year being the wettest year within the 2004-2007 study period. Both 2006 and 2007 were among the driest years since 1985.
Table 3-1. Total rainfall (inches) to the watersheds draining to each bay segment for 1985-2007. Bay Segment
Year
Old Tampa
Bay
Hillsborough Bay
Middle Tampa
Bay
Lower Tampa
Bay
Boca Ciega Bay
Terra Ceia Bay
Manatee River
1985 46 51 48 49 48 49 47 1986 47 57 53 54 57 54 53 1987 53 58 54 56 56 56 55 1988 57 58 62 64 65 64 62 1989 43 45 49 50 43 52 52 1990 37 43 40 41 38 43 43 1991 47 49 48 46 48 46 49 1992 43 53 56 56 46 61 63 1993 41 44 49 48 42 50 52 1994 47 59 57 53 44 56 60 1995 58 56 63 65 64 65 64 1996 50 51 45 47 44 48 47 1997 68 65 71 74 73 75 74 1998 56 58 59 58 55 58 60 1999 40 44 44 46 45 46 47 2000 37 37 40 40 44 39 40 2001 46 55 56 57 54 58 58 2002 62 64 61 59 62 57 59 2003 51 59 73 72 62 74 76 2004 62 65 66 62 62 60 64 2005 43 55 56 51 43 53 58 2006 50 43 50 48 42 51 53 2007 41 43 44 42 42 42 43
3.1 Old Tampa Bay Hydrologic loadings to Old Tampa Bay were highest in 2004, and lowest in 2007, consistent with the aforementioned precipitation amounts (Figure 3-1). A marked seasonal pattern in loadings occurs. The typical summer wet season can be observed in the annual peaks for each year (July-September), in addition to annual minima, in the late spring period (April and May).

3-2
Figure 3-1. Estimated monthly hydrologic loadings to Old Tampa Bay, 2004-2007.
The temporal variation in TN loadings to Old Tampa Bay was primarily driven by rainfall. A distinctive seasonal signature can be observed in the monthly TN loads to Old Tampa Bay for the study period (Figure 3-2). The greatest loads to Old Tampa Bay consistently occur in the summer wet season, which closely mirrors the hydrologic loadings (Figure 3-1).
Figure 3-2. Estimated monthly TN loadings to Old Tampa Bay, 2004-2007.
The primary source category contributor of TN loads to Old Tampa Bay is nonpoint sources, accounting for at least half of the total TN load (Table 3-2). Atmospheric deposition contributed between 23 and 35% of the total annual TN load (Table 3-2). Together, these two sources account for 82% or more of the annual TN loads to Old Tampa Bay during 2004-2007.
3-3
Table 3-2. Estimated TN loadings (tons/year and percentage of total) by source to Old Tampa Bay.
Source 2004 2005 2006 2007
Atmospheric Deposition 200 (23%)
141 (29%)
149 (28%)
143 (35%)
Domestic Point Sources 89 (10%)
101 (21%)
94 (18%)
75 (18%)
Industrial Point Sources 3 (<1%)
0 (0%)
1 (<1%)
0 (0%)
Groundwater <1 (<1%)
<1 (<1%)
<1 (<1%)
<1 (<1%)
Nonpoint Sources 580 (66%)
244 (50%)
291 (54%)
192 (47%)
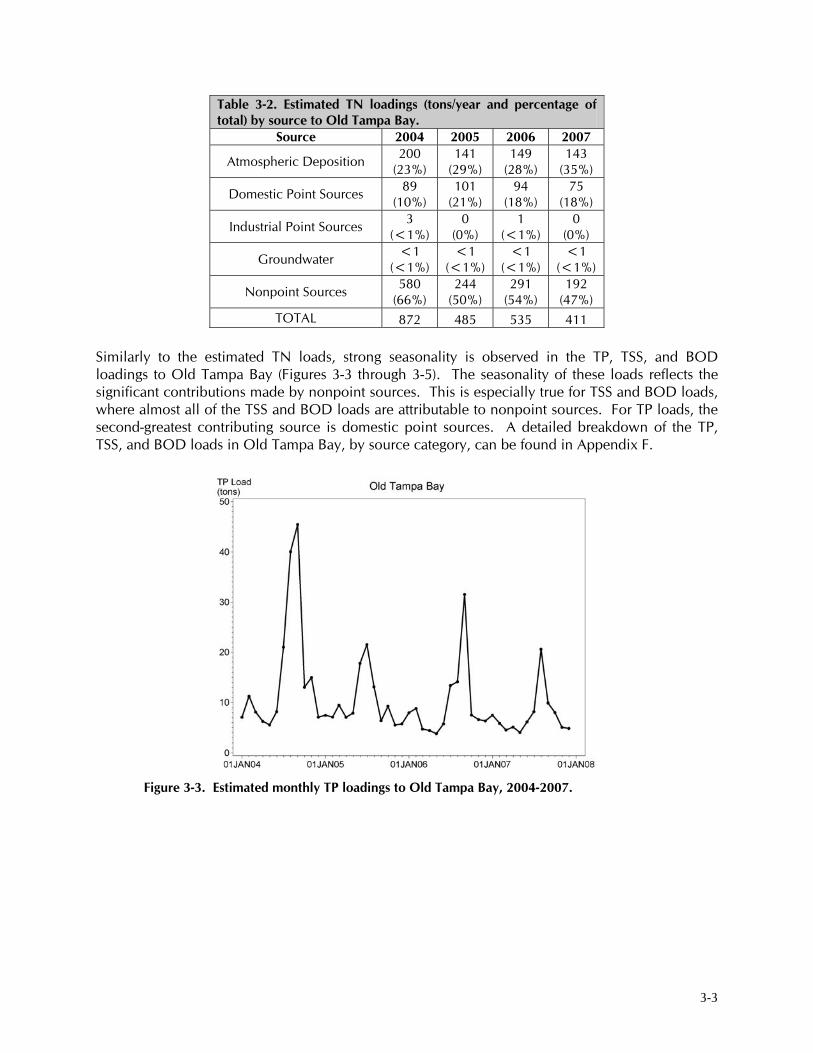
TOTAL 872 485 535 411 Similarly to the estimated TN loads, strong seasonality is observed in the TP, TSS, and BOD loadings to Old Tampa Bay (Figures 3-3 through 3-5). The seasonality of these loads reflects the significant contributions made by nonpoint sources. This is especially true for TSS and BOD loads, where almost all of the TSS and BOD loads are attributable to nonpoint sources. For TP loads, the second-greatest contributing source is domestic point sources. A detailed breakdown of the TP, TSS, and BOD loads in Old Tampa Bay, by source category, can be found in Appendix F.
Figure 3-3. Estimated monthly TP loadings to Old Tampa Bay, 2004-2007.

3-4
Figure 3-4. Estimated monthly TSS loadings to Old Tampa Bay, 2004-2007.
Figure 3-5. Estimated monthly BOD loadings to Old Tampa Bay, 2004-2007.
3.2 Hillsborough Bay Hydrologic loads to Hillsborough Bay were highest in 2004, the “hurricane year”, and then progressively decreased each year through 2007, when hydrologic loads were at a minimum for the study period (Figure 3-6). Seasonality can be observed in each year, with peaks during the summer months of July, August, and September, while April and May represent the dry season and have corresponding low hydrologic loads.

3-5
Figure 3-6. Estimated monthly hydrologic loadings to Hillsborough Bay, 2004-2007.
TN loads peaked in 2004, which reflects the high hydrologic loads from that year (Figure 3-7). Note the peaks in the monthly signal as well, directly resulting from the seasonality of rainfall in the region.
Figure 3-7. Estimated monthly TN loadings to Hillsborough Bay, 2004-2007.
Nonpoint sources were the primary source for TN in Hillsborough Bay for the period of 2004-2007, reaching an annual maximum load of nearly 55% in 2004 (Table 3-3). Industrial point sources were the second-greatest contributing source of TN loads in 2004-2006. Over 1000 tons were contributed from industrial point sources in 2004, an amount that was heavily impacted by emergency discharge orders by the DEP after the multiple hurricanes that passed through the state that year. Several mining facilities in the Alafia River watershed discharged loads from September

3-6
2004 through the beginning of 2005 that lead to the high amounts of TN loading to Hillsborough Bay in 2004. As described above, a berm breach at the Mosaic Riverview facility in September 2004 resulted in 125 additional tons of nitrogen, and 1823 additional tons of phosphorus, loaded to Hillsborough Bay. This load is included in the industrial point source load in Table 3-3.
Table 3-3. Estimated TN loadings (tons/year and percentage of total) by source to Hillsborough Bay, annual 2004-2007. Source 2004 2005 2006 2007
Atmospheric Deposition 95 (3%)
71 (4%)
69 (5%)
67 (8%)
Domestic Point Sources 293 (8%)
279 (17%)
283 (20%)
246 (30%)
Industrial Point Sources 1061 (31%)
511 (32%)
489 (35%)
152 (19%)
Springs 112 (3%)
100 (6%)
69 (5%)
60 (7%)
Groundwater 2 (<1%)
2 (<1%)
1 (<1%)
2 (<1%)
Nonpoint Sources 1903 (55%)
647 (40%)
504 (36%)
291 (36%)
TOTAL 3466 1610 1416 819 Similar to TN loads, TP loads were driven by climatological factors, as industrial point sources were the chief contributor of TP loads in 2004 and 2005 (71% and 37%, respectively). The seasonal signature of the summer wet season is evident in the monthly plot of TP loads to Hillsborough Bay, especially in 2004 (Figure 3-8). Point source loadings were especially significant to the overall loading estimates in Hillsborough Bay in 2004, as TP loads also spiked due to the previously-discussed emergency discharge orders for several mining companies in the Alafia River watershed. Additionally, the proportion of total TP loadings due to domestic point sources consistently increased over the study period, going from 10% in 2004 to 55% in 2007, although the total loadings from domestic sources over this period declined slightly. In 2007, domestic point sources were the chief category contributor of TP to Hillsborough Bay. Appendix F includes tables of annual loads of TP, TSS, and BOD to Hillsborough Bay, by source. Nonpoint sources contributed between 87% and 93% of annual TSS loads to Hillsborough Bay. As for the other constituents, the seasonality of TSS loadings is clearly observable in the monthly plot from 2004-2007 (Figure 3-9).

3-7
Figure 3-8. Estimated monthly TP loadings to Hillsborough Bay, 2004-2007.
Figure 3-9. Estimated monthly TSS loadings to Hillsborough Bay, 2004-2007.
Nonpoint sources were also the chief contributor of BOD loads to Hillsborough Bay in 2004. The spike in BOD loads in 2004 is directly related to the above-average amount of rainfall this bay segment and its watershed received that year (Figure 3-10). Industrial point sources were the primary source of BOD loadings in 2005-2007, with contributions ranging from 43% to 56%. The seasonality of BOD loads is evident as well, as nonpoint sources are the second-greatest contributing source.

3-8
Figure 3-10. Estimated monthly BOD loadings to Hillsborough Bay, 2004-2007.
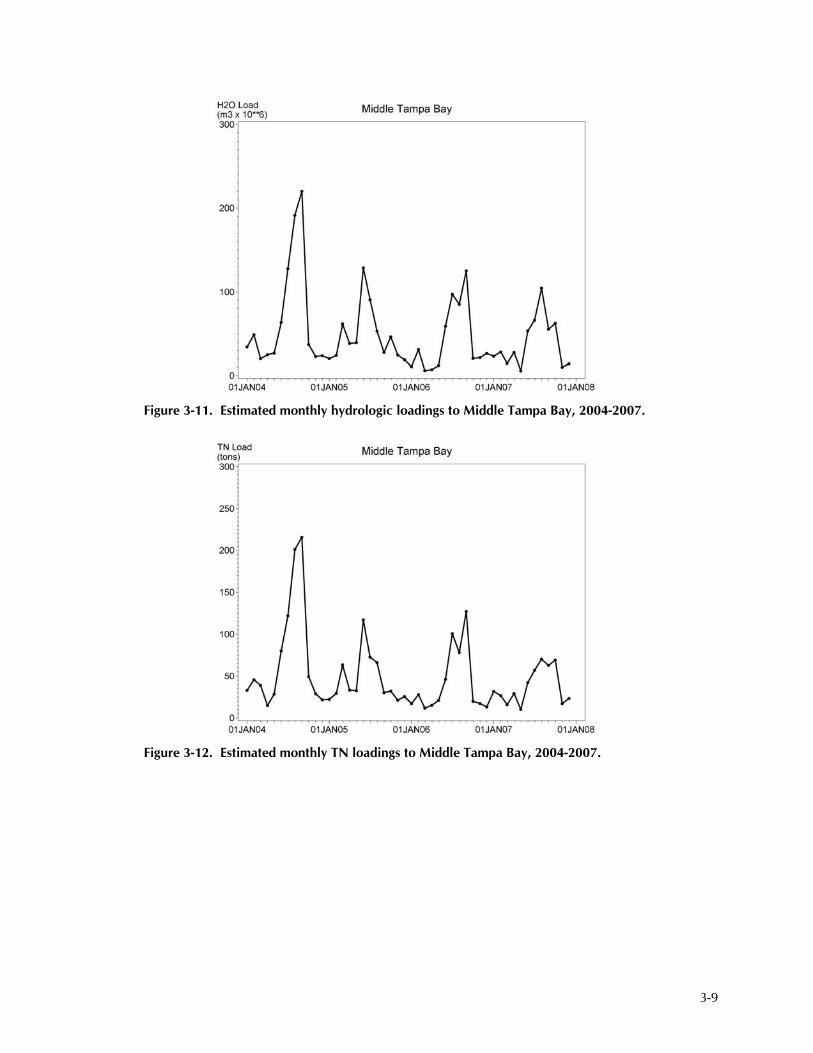
Hillsborough Bay is the only bay segment with spring contributions of loadings to Tampa Bay. Buckhorn, Lithia, and Sulphur springs contributed 3%-7% of annual TN loads and between 1% and 3% of annual TSS loads. Groundwater was not a significant source of loads for any of the constituents during the study period. 3.3 Middle Tampa Bay Hydrologic loads to Middle Tampa Bay peaked in 2004, due to the higher amounts of precipitation in the catchment basin (Figure 3-11). The hydrologic loads in 2005, 2006, and 2007 followed similar seasonal patterns, but were significantly lower than those in 2004, due to decreasing rainfall in each of the following years. A seasonal signature is observed in each of the years, with June, July, and August generally corresponding with the region’s wet season and April and May contributing the lowest amount of hydrologic loads. TN loads were highest in 2004, due to the high hydrologic loads of that year (Figure 3-12). The seasonal pulse observed in hydrologic loads is also evident in the monthly plot of TN loads to Middle Tampa Bay, as they are driven in large part by nonpoint source loading. Nonpoint sources are the primary source for TN loads to Middle Tampa Bay, peaking in the wettest year, 2004, while the minimum annual loads occurred in 2007, the driest year in the study period (Table 3-4). Atmospheric deposition was the second-greatest contributing source for TN loads; contributions from atmospheric deposition as a proportion of loads from all sources increased from 2004-2007, as nonpoint source contributions decreased due to decreasing hydrologic loads. These climatological factors lead to the seasonality of the loadings (Figure 3-12). The proportion of the total TN load attributable to industrial point source contributions increased from 12% in 2004 to 14% in 2007, while the TN load from these sources declined.
3-9
Figure 3-11. Estimated monthly hydrologic loadings to Middle Tampa Bay, 2004-2007.
Figure 3-12. Estimated monthly TN loadings to Middle Tampa Bay, 2004-2007.

3-10
Table 3-4. Estimated TN loadings (tons/year and percentage of total) by source to Middle Tampa Bay, annual 2004-2007. Source 2004 2005 2006 2007
Atmospheric Deposition 250 (28%)
186 (34%)
159 (32%)
180 (40%)
Domestic Point Sources 20 (2%)
24 (4%)
25 (5%)
21 (5%)
Industrial Point Sources 102 (12%)
79 (15%)
55 (11%)
66 (14%)
Groundwater <1 (<1%)
<1 (<1%)
<1 (<1%)
<1 (<1%)
Nonpoint Sources 508 (58%)
255 (47%)
256 (52%)
188 (41%)
TOTAL 880 545 495 455 Nonpoint and industrial point sources were the primary sources of TP loads to Middle Tampa Bay. Contributions from atmospheric deposition as a proportion of TP loads from all sources declined during 2004-2007, as did contributions from nonpoint sources as hydrologic loads decreased during the period. Nonpoint sources contributed the highest amounts of TP loads in 2004 and 2006, while industrial point sources contributed the highest amounts of TP in 2005 and 2007. These climatological factors once more account for the seasonality of the loadings observable in the monthly plot of TP loadings (Figure 3-13). Detailed breakdowns of the annual TP, TSS, and BOD loadings by source to Middle Tampa Bay are provided in Appendix F.
Figure 3-13. Estimated monthly TP loadings to Middle Tampa Bay, 2004-2007.
Nonpoint sources were the primary source for TSS loads in all years, and in each year except 2005 for BOD loads, when industrial point sources were the primary source. As a result, seasonality in loadings corresponds with hydrologic loadings (Figure 3-14 and 3-15). A very high peak in TSS in

3-11
2006 is observable in Figure 3-14. In September 2006, very high flows occurred in the Little Manatee River over the span of several days, related to locally high rainfall, with relatively high TSS concentrations measured. Industrial point sources were the second-greatest contributing source for BOD in 2004, 2006, and 2007.
Figure 3-14. Estimated monthly TSS loadings to Middle Tampa Bay, 2004-2007.
Figure 3-15. Estimated monthly BOD loadings to Middle Tampa Bay, 2004-2007.
3-12
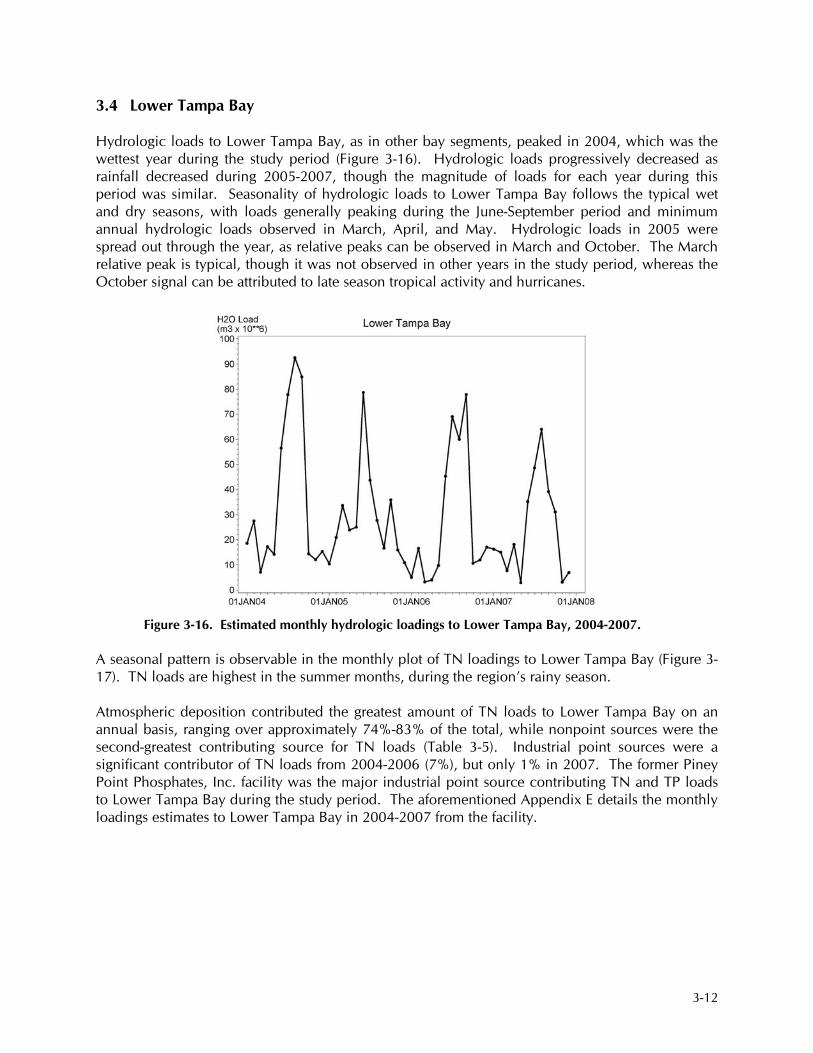
3.4 Lower Tampa Bay Hydrologic loads to Lower Tampa Bay, as in other bay segments, peaked in 2004, which was the wettest year during the study period (Figure 3-16). Hydrologic loads progressively decreased as rainfall decreased during 2005-2007, though the magnitude of loads for each year during this period was similar. Seasonality of hydrologic loads to Lower Tampa Bay follows the typical wet and dry seasons, with loads generally peaking during the June-September period and minimum annual hydrologic loads observed in March, April, and May. Hydrologic loads in 2005 were spread out through the year, as relative peaks can be observed in March and October. The March relative peak is typical, though it was not observed in other years in the study period, whereas the October signal can be attributed to late season tropical activity and hurricanes.
Figure 3-16. Estimated monthly hydrologic loadings to Lower Tampa Bay, 2004-2007.
A seasonal pattern is observable in the monthly plot of TN loadings to Lower Tampa Bay (Figure 3-17). TN loads are highest in the summer months, during the region’s rainy season. Atmospheric deposition contributed the greatest amount of TN loads to Lower Tampa Bay on an annual basis, ranging over approximately 74%-83% of the total, while nonpoint sources were the second-greatest contributing source for TN loads (Table 3-5). Industrial point sources were a significant contributor of TN loads from 2004-2006 (7%), but only 1% in 2007. The former Piney Point Phosphates, Inc. facility was the major industrial point source contributing TN and TP loads to Lower Tampa Bay during the study period. The aforementioned Appendix E details the monthly loadings estimates to Lower Tampa Bay in 2004-2007 from the facility.

3-13
Figure 3-17. Estimated monthly TN loadings to Lower Tampa Bay, 2004-2007.
Table 3-5. Estimated TN loadings (tons/year and percentage of total) by source to Lower Tampa Bay, annual 2004-2007. Source 2004 2005 2006 2007
Atmospheric Deposition 213 (74%)
169 (78%)
147 (74%)
152 (83%)
Domestic Point Sources 4 (1%)
5 (2%)
4 (2%)
6 (3%)
Industrial Point Sources 19 (7%)
15 (7%)
13 (7%)
1 (1%)
Groundwater <1 (<1%)
<1 (<1%)
<1 (<1%)
<1 (<1%)
Nonpoint Sources 51 (18%)
28 (13%)
35 (18%)
25 (13%)
TOTAL 288 217 199 184 Nonpoint source contributions for all loads, however, underlie the seasonal signal that can be observed during the summer months in the monthly plots for each constituent’s loadings (Figures 3-17 through 3-20). Appendix F details annual TP, TSS, and BOD loadings to Lower Tampa Bay, by source. Greater than 98% of all TSS loads and 88% of all BOD loads came from nonpoint sources. Atmospheric deposition was also the chief contributor of annual TP loads during 2004 and 2005. The proportion of the segment TP loads from atmospheric deposition declined considerably over the study period, dropping from approximately 47% of all TP loads in 2004 to 22% of all TP loads in 2007. Nonpoint sources were the greatest contributing source of TP loads in 2006 and 2007. After contributing approximately 40% of the annual TP loads in 2004 and 2005, nonpoint sources contributed approximately 57% and 60% in 2006 and 2007, respectively, although the total load from nonpoint sources declined as precipitation and resultant hydrologic loads decreased.

3-14
Figure 3-18. Estimated monthly TP loadings to Lower Tampa Bay, 2004-2007.
Figure 3-19. Estimated monthly TSS loadings to Lower Tampa Bay, 2004-2007.

3-15
Figure 3-20. Estimated monthly BOD loadings to Lower Tampa Bay, 2004-2007.
3.5 Boca Ciega Bay The maximum annual hydrologic load to Boca Ciega Bay occurred in 2004, while significantly lower annual hydrologic loads were observed in 2005-2007 (Figure 3-21). The seasonality of hydrologic loads to Boca Ciega Bay follows the typical climatic pattern of the region. Hydrologic loads peak during the July-August period, whereas annual minimum loadings are observed in April and May.
Figure 3-21. Estimated monthly hydrologic loadings to Boca Ciega Bay, 2004-2007.
3-16
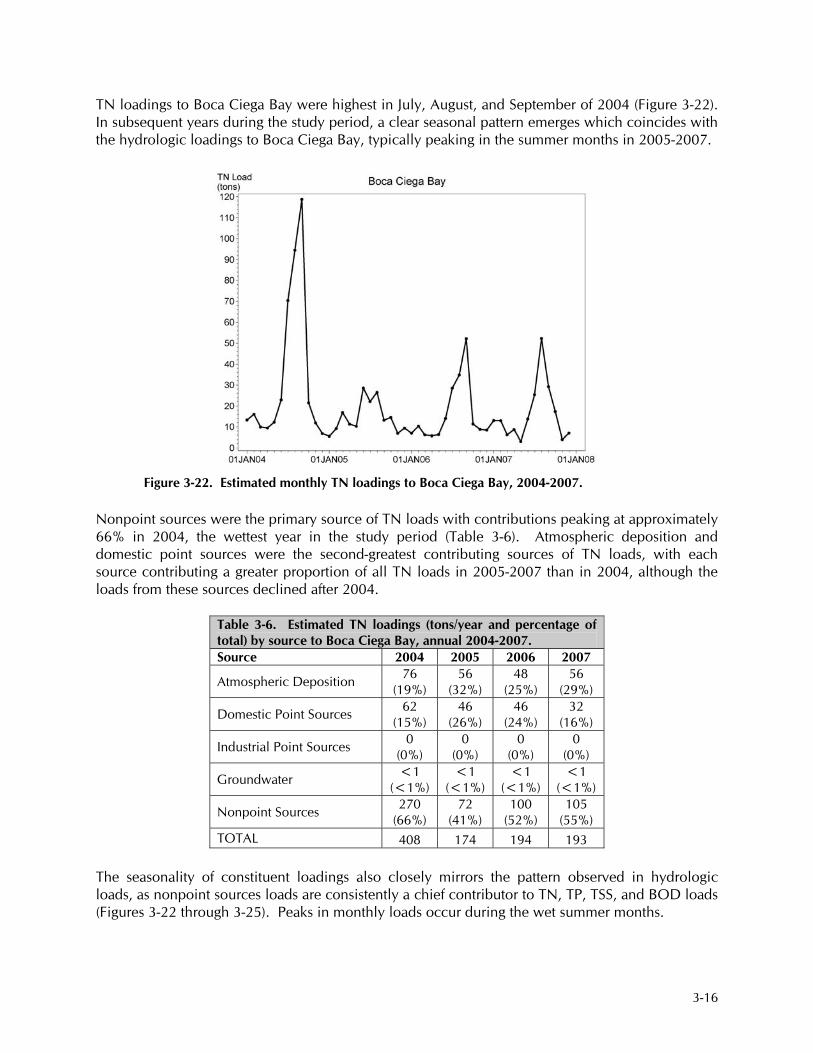
TN loadings to Boca Ciega Bay were highest in July, August, and September of 2004 (Figure 3-22). In subsequent years during the study period, a clear seasonal pattern emerges which coincides with the hydrologic loadings to Boca Ciega Bay, typically peaking in the summer months in 2005-2007.
Figure 3-22. Estimated monthly TN loadings to Boca Ciega Bay, 2004-2007.
Nonpoint sources were the primary source of TN loads with contributions peaking at approximately 66% in 2004, the wettest year in the study period (Table 3-6). Atmospheric deposition and domestic point sources were the second-greatest contributing sources of TN loads, with each source contributing a greater proportion of all TN loads in 2005-2007 than in 2004, although the loads from these sources declined after 2004.
Table 3-6. Estimated TN loadings (tons/year and percentage of total) by source to Boca Ciega Bay, annual 2004-2007. Source 2004 2005 2006 2007
Atmospheric Deposition 76 (19%)
56 (32%)
48 (25%)
56 (29%)
Domestic Point Sources 62 (15%)
46 (26%)
46 (24%)
32 (16%)
Industrial Point Sources 0 (0%)
0 (0%)
0 (0%)
0 (0%)
Groundwater <1 (<1%)
<1 (<1%)
<1 (<1%)
<1 (<1%)
Nonpoint Sources 270 (66%)
72 (41%)
100 (52%)
105 (55%)
TOTAL 408 174 194 193 The seasonality of constituent loadings also closely mirrors the pattern observed in hydrologic loads, as nonpoint sources loads are consistently a chief contributor to TN, TP, TSS, and BOD loads (Figures 3-22 through 3-25). Peaks in monthly loads occur during the wet summer months.

3-17
In 2004 and 2006-2007, nonpoint sources were the primary source for TP loads, while in 2005 domestic point sources contributed the greatest proportion of TP loads. Greater than 99% of all TSS loads and 86% of all BOD loads came from nonpoint sources. All TP, TSS, and BOD annual loadings, by source, can be found in Appendix F.
Figure 3-23. Estimated monthly TP loadings to Boca Ciega Bay, 2004-2007.
Figure 3-24. Estimated monthly TSS loadings to Boca Ciega Bay, 2004-2007.

3-18
Figure 3-25. Estimated monthly BOD loadings to Boca Ciega Bay, 2004-2007.
3.6 Terra Ceia Bay Hydrologic loadings to Terra Ceia Bay reached the maximum observed during this period in 2004 and the minimum in 2007, reflecting the amount of rainfall which occurred in the catchment basin during these two years (Figure 3-26). Seasonality of hydrologic loads was similar to other bay segments, with peaks in the summer months and minimum annual loads generally observed in March, April, and May. Hydrologic loadings to Terra Ceia Bay in 2005 were, however, more spread out in nature than in other years, as relative peaks in March and October were evident.
Figure 3-26. Estimated monthly hydrologic loadings to Terra Ceia Bay, 2004-2007.
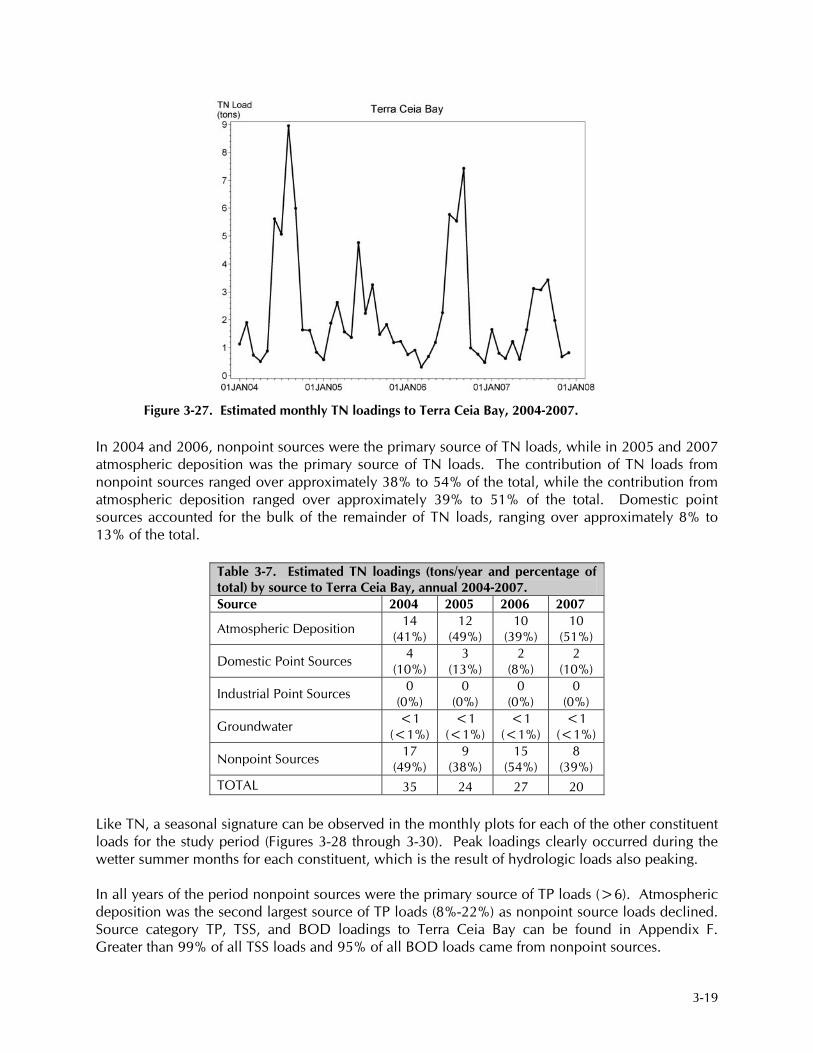
3-19
Figure 3-27. Estimated monthly TN loadings to Terra Ceia Bay, 2004-2007.
In 2004 and 2006, nonpoint sources were the primary source of TN loads, while in 2005 and 2007 atmospheric deposition was the primary source of TN loads. The contribution of TN loads from nonpoint sources ranged over approximately 38% to 54% of the total, while the contribution from atmospheric deposition ranged over approximately 39% to 51% of the total. Domestic point sources accounted for the bulk of the remainder of TN loads, ranging over approximately 8% to 13% of the total.
Table 3-7. Estimated TN loadings (tons/year and percentage of total) by source to Terra Ceia Bay, annual 2004-2007. Source 2004 2005 2006 2007
Atmospheric Deposition 14 (41%)
12 (49%)
10 (39%)
10 (51%)
Domestic Point Sources 4 (10%)
3 (13%)
2 (8%)
2 (10%)
Industrial Point Sources 0 (0%)
0 (0%)
0 (0%)
0 (0%)
Groundwater <1 (<1%)
<1 (<1%)
<1 (<1%)
<1 (<1%)
Nonpoint Sources 17 (49%)
9 (38%)
15 (54%)
8 (39%)
TOTAL 35 24 27 20 Like TN, a seasonal signature can be observed in the monthly plots for each of the other constituent loads for the study period (Figures 3-28 through 3-30). Peak loadings clearly occurred during the wetter summer months for each constituent, which is the result of hydrologic loads also peaking. In all years of the period nonpoint sources were the primary source of TP loads (>6). Atmospheric deposition was the second largest source of TP loads (8%-22%) as nonpoint source loads declined. Source category TP, TSS, and BOD loadings to Terra Ceia Bay can be found in Appendix F. Greater than 99% of all TSS loads and 95% of all BOD loads came from nonpoint sources.

3-20
Figure 3-28. Estimated monthly TP loadings to Terra Ceia Bay, 2004-2007.
Figure 3-29. Estimated monthly TSS loadings to Terra Ceia Bay, 2004-2007.

3-21
Figure 3-30. Estimated monthly BOD loadings to Terra Ceia Bay, 2004-2007.
3.7 Manatee River Hydrologic loads to the Manatee River reached an annual maximum in 2004, which was the wettest year during the study period (Figure 3-31). Hydrologic loads progressively decreased as rainfall decreased from 2005-2007, to less than one-third of the 2004 loadings in 2007. A seasonal signal in the hydrologic loads was observed which corresponds to the typical wet/dry seasons of the region. Maximum monthly hydrologic loads generally occurred during the months of July, August, and September, whereas the minimum loads can be observed in April and May. The hydrologic loads of 2005 were a notable exception, as signals in March and October are observed.
Figure 3-31. Estimated monthly hydrologic loadings to Manatee River, 2004-2007.
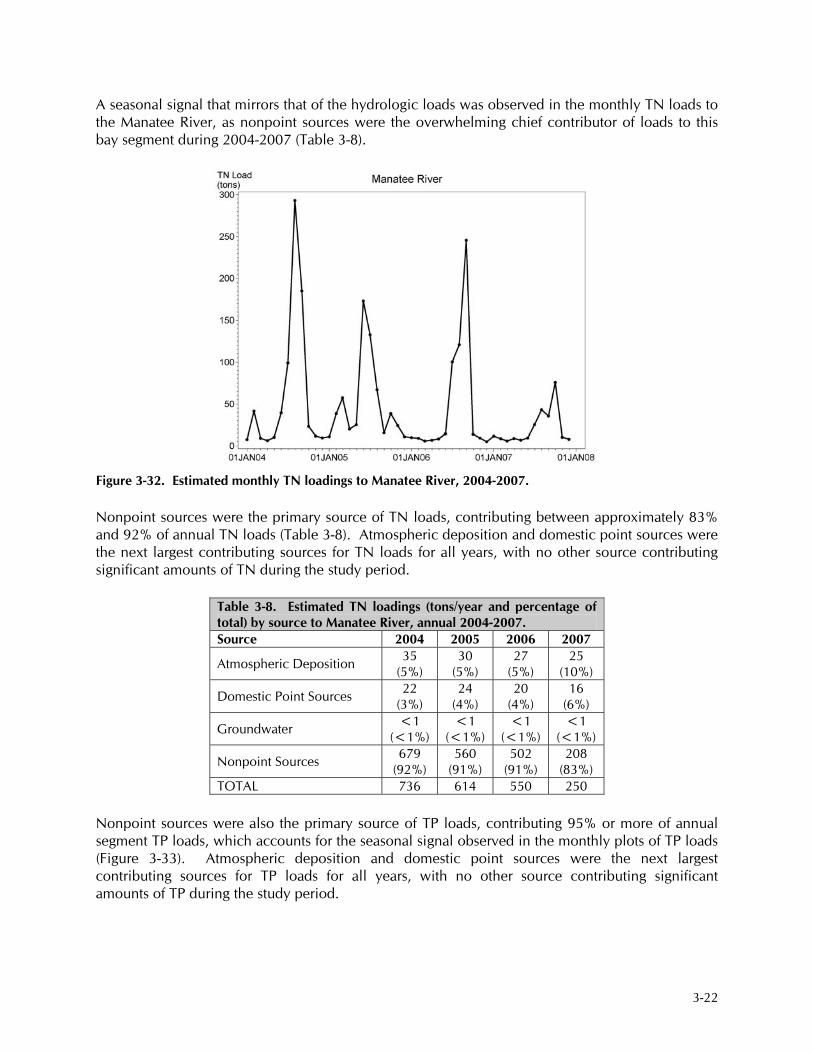
3-22
A seasonal signal that mirrors that of the hydrologic loads was observed in the monthly TN loads to the Manatee River, as nonpoint sources were the overwhelming chief contributor of loads to this bay segment during 2004-2007 (Table 3-8).
Figure 3-32. Estimated monthly TN loadings to Manatee River, 2004-2007. Nonpoint sources were the primary source of TN loads, contributing between approximately 83% and 92% of annual TN loads (Table 3-8). Atmospheric deposition and domestic point sources were the next largest contributing sources for TN loads for all years, with no other source contributing significant amounts of TN during the study period.
Table 3-8. Estimated TN loadings (tons/year and percentage of total) by source to Manatee River, annual 2004-2007. Source 2004 2005 2006 2007
Atmospheric Deposition 35 (5%)
30 (5%)
27 (5%)
25 (10%)
Domestic Point Sources 22 (3%)
24 (4%)
20 (4%)
16 (6%)
Groundwater <1 (<1%)
<1 (<1%)
<1 (<1%)
<1 (<1%)
Nonpoint Sources 679 (92%)
560 (91%)
502 (91%)
208 (83%)
TOTAL 736 614 550 250 Nonpoint sources were also the primary source of TP loads, contributing 95% or more of annual segment TP loads, which accounts for the seasonal signal observed in the monthly plots of TP loads (Figure 3-33). Atmospheric deposition and domestic point sources were the next largest contributing sources for TP loads for all years, with no other source contributing significant amounts of TP during the study period.

3-23
Figure 3-33. Estimated monthly TP loadings to Manatee River, 2004-2007.
Appendix F presents tables of annual TP, TSS, and BOD loadings to Manatee River by source. Greater than 99% of all TSS loads and 98% of all BOD loads came from nonpoint sources. The resultant seasonal signature is clear in the monthly plots of each constituent, as peaks occur in the July-September for each year in the study period (Figures 3-34 and 3-35).
Figure 3-34. Estimated monthly TSS loadings to Manatee River, 2004-2007.

3-24
Figure 3-35. Estimated monthly BOD loadings to Manatee River, 2004-2007.

4-1
4. CONCLUSIONS The following provides the conclusions from this update of hydrological and pollutant loadings to Tampa Bay during the 2004-2007 study period:
• Annual rainfall varied significantly over the time period: - 2004 was the wettest year, characterized by four hurricanes impacting
peninsular Florida; 2006 and 2007 were the driest years; - A seasonal pattern in loadings was observed in each year, with July-September
generally the wettest months, and April and May generally the driest months; • Old Tampa Bay:
- TN loads to Old Tampa Bay followed the annual and seasonal rainfall patterns; - The three major sources of TN to Old Tampa Bay were:
Nonpoint sources (47%-66%); Atmospheric deposition (23%-35%); Industrial point sources (10%-21%);
- As for TN loads, TP, TSS, and BOD loads to Old Tampa Bay were driven by hydrological loadings, and demonstrated similar annual and seasonal patterns;
• Hillsborough Bay: - TN loads to Hillsborough Bay in 2004 were driven heavily by high rainfall but
follow the seasonal and annual patterns of hydrologic loads in each year; - Point sources were also of key importance in Hillsborough Bay’s watershed,
with FDEP overseeing an emergency discharge from several industrial point sources after the hurricanes in 2004;
- The three major sources of TN to Hillsborough Bay were: Nonpoint sources (36%-55%); Industrial point sources (19%-35%); Domestic point sources (8%-30%);
- TP, TSS, and BOD loads showed similar patterns in 2004, but muted seasonal and annual responses to hydrologic loadings in 2005-2007;
• Middle Tampa Bay: - TN loads to Middle Tampa Bay reflected the seasonal and annual patterns of
hydrologic loads in 2004-2007; - The three major sources of TN to Middle Tampa Bay were:
Nonpoint sources (41%-58%); Atmospheric deposition (28%-40%); Industrial point sources (11%-15%);
- TP, TSS, and BOD loads to Middle Tampa Bay were driven by hydrological loadings, and demonstrated similar annual and seasonal patterns;
• Lower Tampa Bay: - TN loads to Lower Tampa Bay closely mirrored the watershed’s seasonal and
annual patterns in hydrologic loadings, due almost completely to high rainfall; - The three major sources of TN to Lower Tampa Bay were:
Atmospheric deposition (74%-83%); Nonpoint sources (13%-18%); Industrial point sources (1%-7%);
- The TP, TSS, and BOD loads each showed similar patterns of loadings that reflected the rainfall within the watershed;

4-2
- Releases from the former Piney Point Phosphates facility were also a significant contributor of TN and TP loads to Lower Tampa Bay;
• Boca Ciega Bay: - TN loads were driven largely by climate, and thus showed similar seasonal and
annual patterns as hydrologic loads to the basin; - The three major sources of TN to Boca Ciega Bay were:
Nonpoint sources (41%-66%); Atmospheric deposition (19%-32%); Domestic point sources (15%-26%);
- The seasonality found in the TN loads was also found in TP, TSS, and BOD loads to Boca Ciega Bay, as nonpoint sources were the primary contributor of these constituent loads;
• Terra Ceia Bay: - TN loads to Terra Ceia Bay strongly reflected the seasonal and annual patterns
of hydrologic loads from the watershed; - The three major sources of TN to Terra Ceia Bay were:
Nonpoint sources (38%-54%); Atmospheric deposition (39%-51%); Domestic point sources (8%-13%);
- As with the TN loads, the TP, TSS, and BOD loadings to Terra Ceia Bay had a distinct seasonal signature that was attributable to rainfall;
• Manatee River: - TN loads to Manatee River were strongly related to the seasonal and annual
patterns observed in hydrologic loads throughout the study period; - The three major sources to of TN to Manatee River were:
Nonpoint sources (83%-92%); Atmospheric deposition (5%-10%); Domestic point sources (3%-6%);
- Nonpoint sources were the overwhelming primary source of loads to Manatee River in 2004-2007, with an observable seasonal and annual pattern that followed rainfall in the watershed.

5-1
5. LITERATURE CITED Brooks, G.R., T.L. Dix, and L.J. Doyle. 1993. Groundwater/surface water interactions in Tampa Bay and implications for nutrient fluxes. Prepared for: Tampa Bay National Estuary Program. St. Petersburg, Florida. 44 p. Environmental Science & Engineering, Inc. 1987. Florida Acid Deposition Study – Five-year data summary. Prepared for: Florida Electric Power Coordinating Group. Tampa, Florida. Florida Department of Transportation Thematic Mapping Section (FDOT). 1985. Florida land use, cover and forms classification system. Second ed. Tallahassee, Florida. 81 p. Foose, D. 1993. U.S. Geological Survey WRD. Personal communication. Tallahassee, Florida. Freeze and Cherry. 1979. Groundwater. Prentice-Hall, Inc. Englewood Cliffs, NJ. 604 p. Hutchinson, C.B. 1983. Assessment of the interconnection between Tampa Bay and the Floridan Aquifer, Florida. U.S. Geological Survey Water Resources Investigations Report 82-54. Tallahassee, Florida. 61 p. Janicki, A. and D. Wade. 1996. Model-based Estimates of Total Nitrogen Loading to Tampa Bay. Prepared by: Janicki Environmental, Inc. Prepared for: Tampa Bay National Estuary Program. St. Petersburg, FL. Jones, G.W. 1990. Ground-water quality sampling from wells in the Southwest Florida Water Management District: Central Region - Section 1. Prepared by: Ambient Ground-Water Monitoring Program. Brooksville, FL. Metcalf & Eddy, Inc. 1983. Tampa Nationwide Urban Runoff Program. Phase 3, Task II.2 – Rainfall Analysis. Tampa, Florida. Poe, A., Hackett, K., Janicki, S., Pribble, R., and A. Janicki. 2005. Estimates of Total Nitrogen, Total Phosphorus, Total Suspended Solids, and Biochemical Oxygen Demand Loadings to Tampa Bay, Florida: 1999-2003. Prepared by: Janicki Environmental, Inc. Prepared for: Tampa Bay National Estuary Program. St. Petersburg, FL. Pribble, J.R., A. Janicki, K. Hackett, and S. Janicki. 2001. Estimates of Total Nitrogen, Total Phosphorus, and Total Suspended Solids Loadings to Tampa, Bay, Florida. Technical Appendix: 1995-1998 Total Nitrogen Loads to Tampa Bay. Prepared by Janicki Environmental, Inc. Prepared for Tampa Bay National Estuary Program. St. Petersburg, FL. Ryder, P.W., D.M. Johnson, and J.M. Gerhart. 1980. Model evaluation of the hydrogeology of the Morris Bridge Wellfield and vicinity in west-central Florida. U.S. Geological Survey Water-Resources Investigations 80-29. Tallahassee, FL. 100 p. Wolansky, R.M., and M.A. Corral. 1985. Aquifer tests in west-central Florida, 1952-1976. U.S. Geological Survey Water-Resources Investigations 84-4044. Tallahassee, FL. 127 p.

5-2
Zarbock, H., A. Janicki, D. Wade, D. Heimbuch, and H. Wilson. 1994. Estimates of Total Nitrogen, Total Phosphorus, and Total Suspended Solids Loadings to Tampa Bay, Florida. Technical Publication #04-94. Prepared by Coastal Environmental, Inc. Prepared for Tampa Bay National Estuary Program. St. Petersburg, FL. Zarbock, H., A. Janicki, and S. Janicki. 1996. Estimates of Total Nitrogen, Total Phosphorus, and Total Suspended Solids Loadings to Tampa, Bay, Florida. Technical Appendix: 1992-94 Total Nitrogen Loads to Tampa Bay. Technical Publication #19-96. Prepared by Coastal Environmental, Inc. Prepared for Tampa Bay National Estuary Program. St. Petersburg, FL.

APPENDIX A
Table of Point Sources from 1992-1994 which
Were Not Included or had Name Change in the 2004-2007 Analysis

2
Domestic point sources included in 1992-1994 loadings, not included or name changed in 2004-2007 loadings.
Bay Segment Facility Name Comment Old Tampa Bay Pine Ridge No longer tracked, closed Old Tampa Bay Tarpon Woods No longer tracked, small source Old Tampa Bay Tarpon Lake Village No longer tracked, small source Old Tampa Bay Eastlake Woodlands No longer tracked, closed
Hillsborough Bay Boyette Springs No longer tracked, closed Hillsborough Bay Progress Village No longer tracked, closed Hillsborough Bay Rice Creek No longer tracked, closed Hillsborough Bay River Hills Country Club No longer tracked, closed Hillsborough Bay Seaboard Utilities No longer tracked, closed Hillsborough Bay Summerfield Subregional No longer tracked, closed Hillsborough Bay Bloomingdale Hills No longer tracked, closed Hillsborough Bay Meadowlands No longer tracked, closed

3
Industrial point sources included in 1992-1994 loadings, not included or name changed in 2004-2007 loadings.
Bay Segment Facility Name Comment Old Tampa Bay Shell Oil Now Motiva, no longer tracked, small source
Hillsborough Bay Mobil Nichols Prep Plant Now Agrifos - Nichols Prep Plant Hillsborough Bay IMC Agrico Haynesworth Mine Included in Mosaic Kingsford Hillsborough Bay Nitram Now Kinder Morgan Hartford Terminal Hillsborough Bay IMC Agrico - Port Sutton Terminal Now Kinder Morgan NH3 Facility Hillsborough Bay Crystals International Now Mastertaste Hillsborough Bay Mobile Big Four Mine Included in Mosaic Kingsford Hillsborough Bay Farmland Hydro Green Bay Plant Now Mosaic - Green Bay Hillsborough Bay Mulberry Phosphates Now Mosaic – Mulberry Hillsborough Bay Mobil Nichols Mine Now Mosaic - Nichols Mine Hillsborough Bay Cargill Now Mosaic – Riverview Hillsborough Bay City of Tampa Waterworks No longer tracked, small source Hillsborough Bay TECO Gannon Station Now TECO – Bayside Hillsborough Bay Florida Juice Now WBRK Property Hillsborough Bay Farmland Hydro Port Sutton Now Yara North America
Middle Tampa Bay Florida Power & Light Manatee No longer tracked, small source Middle Tampa Bay IMC Agrico - Four Corners Mine Now Mosaic - Four Corners Mine

4
APPENDIX B
Aggregated Florida Land Use, Cover and
Form Classification System Categories

5
URBAN LAND USE CATEGORIES
Coastal Land Use Code FLUCCS Code
1 - Low Density Residential 1100
2 - Medium Density Residential 1200
3 - High Density Residential 1300
4 – Commercial 1400
5 - Industrial 1500
7 - Institutional, Transportation, Utilities 1700 8100 8200 8300
AGRICULTURAL LAND USE CATEGORIES Coastal Land Use Code FLUCCS Code
6 - Mining 1600
11 - Groves 2200 2210 2220 2230
12 - Feedlots 2300
13 - Nursery 2400
14 - Row and Field Crops 2100 2140 2150 2440
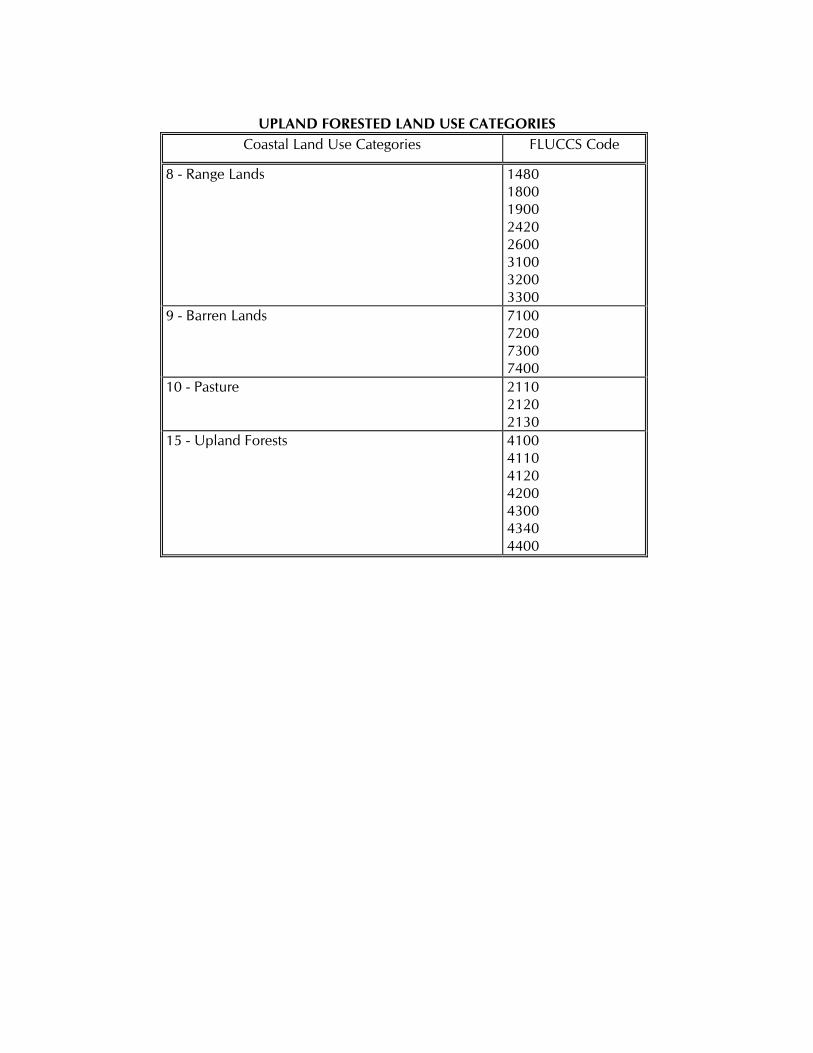
6
UPLAND FORESTED LAND USE CATEGORIES
Coastal Land Use Categories FLUCCS Code
8 - Range Lands 1480 1800 1900 2420 2600 3100 3200 3300
9 - Barren Lands 7100 7200 7300 7400
10 - Pasture 2110 2120 2130
15 - Upland Forests 4100 4110 4120 4200 4300 4340 4400

7
WATER AND WETLANDS LAND USE CATEGORIES Coastal Land Use Categories FLUCCS Code
16 - Freshwater 2500 2540 2550 5100 5200 5210 5220 5230 5240 5300 5310 5320 5330 5340 5500 5600 6440 6450
17 - Saltwater 5400 9113 9116 9121
18 - Forested Freshwater Wetlands 6100 6110 6150 6200 6210 6240 6300
19 - Saltwater Wetlands 6120 6420
20 - Non-forested Freshwater Wetlands 6400, 6410, 6411, 6430
6530 21 - Tidal Flats 6500, 6510
6520

1
APPENDIX C
Land Use-specific Water Quality Concentrations

2
Land Use-Specific Nonpoint Source Water Quality Concentrations
URBAN LAND USES
Land Use Classification Land Use-Specific Water Quality Concentrations
Coastal Land Use
Classification
Land Use
Description
Reference
TN
(mg/L)
TP
(mg/L)
TSS
(mg/L)
BOD (mg/L)
1 (LDR)
Low Density Single Family Residential
(SFR)
(1) (1) (1) (1) (1) (1) (4) (8) (9) (10) (11) (13)
2.31 2.14 0.605 1.18 3.0 2.2
1.87 1.46 1.56 2.04 2.88
-
0.40 0.32 0.073 0.307 0.45 0.25 0.39 0.401 0.27 0.593 0.72
-
33.0 28.0 7.2 3.5 - - -
19.0 20.8 49.7 56.8
-
- - - - - - - - - - -
4.4
min mean max
0.605 1.93 2.88
0.073 0.380 0.598
3.5 27.3 56.8
- 4.4 -
2 (MDR)
Medium Density
(See notes)
mean
2.04
0.44
33.5
- 7.4 -
3 (HDR)
Multifamily Residential
(1) (1) (1) (1) (1) (1) (4) (8) (9) (10) (11) (13)
1.61 2.57 4.68 1.91 1.02 1.91 1.65 2.05 2.04 2.05 2.00
-
0.33 0.45 0.72 0.73 0.033 0.51 0.33 1.34 0.282 0.150 0.56
-
53.0 36.8 95.6
- 67.6 14.3
- 29.0 10.7 8.3 41 -
- - - - - - - - - - -
11.0 min
mean max
1.02 2.14 4.68
0.033 0.49 1.34
8.3 39.6 95.6
- 11.0
-

3
Coastal Land Use
Classification
Land Use
Description
Reference
TN
(mg/L)
TP
(mg/L)
TSS
(mg/L)
BOD (mg/L)
4 Low Intensity Commercial
High Intensity Commercial
Commercial (Office)
Commercial (Retail)
(1) (1)
(1) (1) (1)
(8) (9) (10) (11)
(8) (10) (11)
1.19 1.10
2.81 3.53 2.15
2.38 1.08 1.40 1.05
1.69 1.28 2.12
0.15 0.10
0.31 0.82 0.15
0.305 0.495 0.113 0.145
0.253 0.177 0.22
22.0 45.0
94.3
- -
36.5 50.6 6.2
13.8
9.3 14.5 36.3
- - - - - - - - - - - -
Combined Commercial
min mean max
1.05 1.82 3.53
0.100 0.270 0.495
6.2 32.9 94.3
- 17.2
-
5 Industrial (1) (1) (4) (8) (9) (10) (11) (13)
1.42 1.42 1.18 2.28 1.77 1.92 3.00
-
0.19 0.31 0.15 0.332 0.465 0.490 0.503
-
71.8 102.0
- 18.2 28.3 84.3 70.0
-
- - - - - - -
9.6 6 Mining (4)
(13) 1.18
- 0.15
- 35 (e)
- -
9.6 7 Institutional (4)
(13) 1.18
- 0.15
- 35 (e)
- -
8.2

4
AGRICULTURAL LAND USES
Land Use Classification
Land Use-Specific Water Quality Concentrations
Coastal Land Use
Classification
Land Use
Description
Reference
TN
(mg/L)
TP
(mg/L)
TSS
(mg/L)
BOD (mg/L)
10 Pasture (1) (1) (2) (3) (4) (5)
(13)
2.37 2.48 2.0 3.0
1.02 5.1 -
0.697 0.27 0.3
0.25 0.16 3.2 -
- 8.6 - - - - -
- - - - - -
5.1 11 Grove (7)
(13) 2.31
- 0.10
- - -
- 2.55
11,13 Grove, Nursery
(4) (13)
0.92 -
0.41 -
- -
- 2.55
12 Feed Lot (3) (3) (5)
(13)
29.3 3.74 26.0
-
5.1 1.13 5.1 -
- - - -
- - -
5.1 14 Field Crop (2)
(3) (4)
(13)
2.5 2.5
3.75 -
0.25 2.5
1.13 -
- - - -
- - -
5.1 Mixed Agricultural
10,11 Citrus+ Pasture
(1) (1) (1) (1) (1)
1.57 1.33 2.58 2.68 3.26
0.09 0.09 0.046 0.562 0.24
- 4.6 180
- 28.0
- - - - -
11,14 Citrus+ Row Crops
(6) 1.78 0.3 5.6 -
(See following page for summarized agricultural water quality concentrations.)

5
WATER/WETLAND AND FOREST/UNDEVELOPED LAND USES
Land Use Classification
Land Use-Specific Water Quality Concentrations
Coastal Land Use
Classification
Land Use
Description
Reference
TN
(mg/L)
TP
(mg/L)
TSS
(mg/L)
BOD (mg/L)
8 Open Space/ Non-forested
(1) (1) (1) (4) (13)
1.38 0.90 1.47 1.02
-
0.07 0.02 0.07 0.16
-
17.3 4.8 - - -
- - - -
1.45 15 Upland Forest (2)
(3) (4) (13)
0.1 0.2 1.02
-
0.007 0.007 0.16
-
- - - -
- - -
1.45 16,17 Open Water (1)
(1) (1) (13)
0.79 0.73 2.22
-
0.17 0.04
- -
- 0.00 6.2 -
- - -
0.00 18,20 Freshwater
Wetland (1) (1) (1) (1) (4) (13)
2.26 1.02 1.24 1.88 0.79
-
0.09 0.16
0.018 0.33 0.17
-
13.4 -
4.6 12.7
- -
- - - - -
4.63 17 Saltwater NA NA NA NA
19 Saltwater Wetlands
NA NA NA NA
21 Tidal Flats NA NA NA NA
Notes: • Concentrations for CLUCCS code 2 (MDR) are an average of CLUCCS codes
1 (LDR) and 3 (HDR). • Concentrations for CLUCCS code 4 (Commercial) are an average of reported
values for "low intensity" and "high intensity" commercial. • Estimated (e) agricultural values were based on similar land uses data when
no land use specific data were identified. • Row crop data were often reported with other agricultural uses. • Saltwater and salwater wetlands were assigned zero loads.

6
References (1) Harper, H.H. 1991. Estimation of Loading Rate Parameters for Tampa Bay Watershed.
Southwest Florida Water Management District. Brooksville, Florida. (2) Delwiche, Lora L.D. and D.A. Haith. 1983. Loading Functions for Predicting Nutrient
Losses from Complex Watersheds. Water Resources Bulletin vol. 19, no. 6. p. 951-959. (3) Haith, D. A. and L.L. Shoemaker. 1987. Generalized Watershed Loading Function for
Stream Flow Nutrients. Water Resources Bulletin. vol. 23, no. 3. p. 471-477. (4) Camp, Dresser, & McKee. 1992. Point/Non-Point Source Loading Assessment for Sarasota
Bay. SBNEP, Sarasota, Florida. (5) Andrews, W.J. 1992. Reconnaissance of Water Quality at Nine Dairy Farms in North
Florida, 1990-1991. USGS WRI 92-4058. Tallahassee, Florida. (6) Flannery, M.S. et al. 1991. Increased Nutrient Loading and Baseflow Supplementation in
the Little Manatee Watershed. in: Treat, F.S. and P.A. Clark (eds.) Proceedings, Tampa Bay Area Scientific Information Symposium 2. 1991 February 27-March 1. Tampa, Florida. p. 369-396.
(7) Allhands, M. 1993. Water Quality Data for Gator Slough Groves. Agricultural
Management Services. Punta Gorda, Florida. (8) Hillsborough County Engineering Services. 1993. NPDES Part 2 Application. Tampa, FL. (9) City of Tampa Stormwater Management Division. 1994. NPDES Part 2 Application.
Tampa, FL. (10) Pinellas County Department of Environmental Management. 1993. NPDES Part 2
Application. Clearwater, FL. (11) City of St. Petersburg Engineering Department. 1993. NPDES Part 2 Application. St.
Petersburg, FL. (12) Carr, D.W. and B.T. Rushton. 1995. Integrating a Native Herbaceous Wetland into
Stormwater Management. Southwest Florida Water Management District Stormwater Research Program. Brooksville, FL.
(13) Harper, H.H. 1994. Stormwater Loading Rate Parameters for Central and South Florida.
Environmental Research & Design, Inc. Orlando, FL.

1
APPENDIX D
Land Use-specific Seasonal Runoff Coefficients
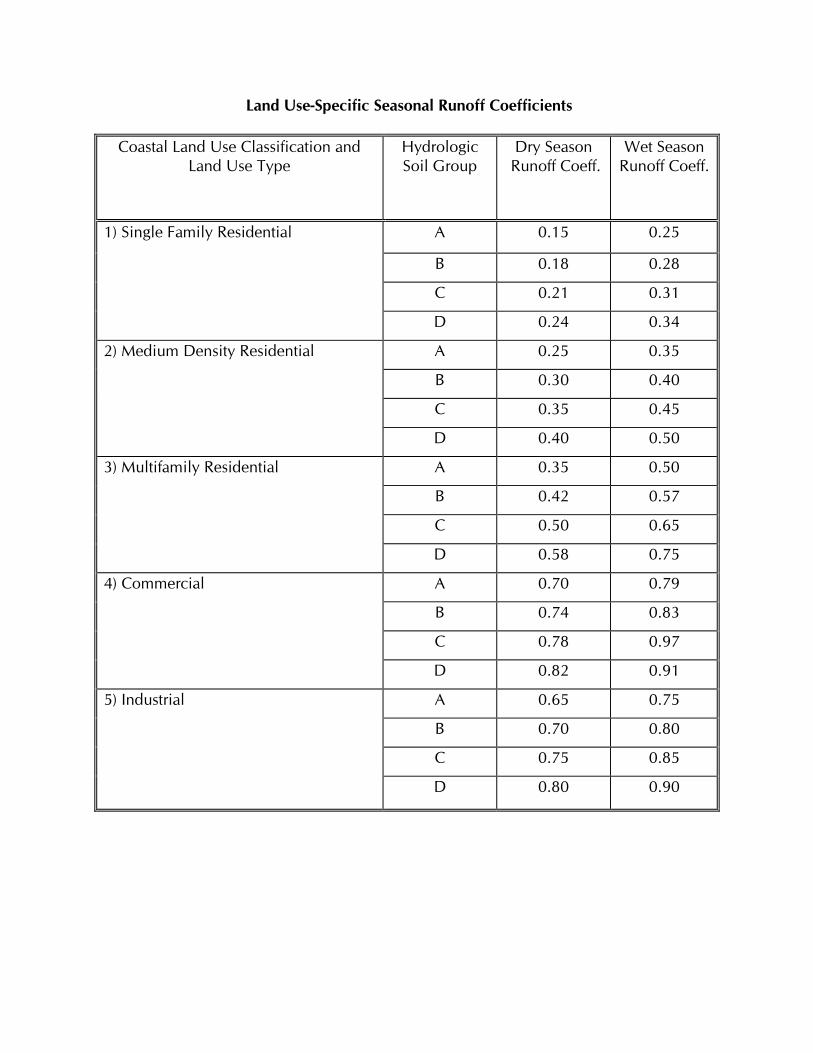
2
Land Use-Specific Seasonal Runoff Coefficients
Coastal Land Use Classification and Land Use Type
Hydrologic Soil Group
Dry Season Runoff Coeff.
Wet Season Runoff Coeff.
1) Single Family Residential A 0.15 0.25
B 0.18 0.28
C 0.21 0.31
D 0.24 0.34
2) Medium Density Residential A 0.25 0.35
B 0.30 0.40
C 0.35 0.45
D 0.40 0.50
3) Multifamily Residential A 0.35 0.50
B 0.42 0.57
C 0.50 0.65
D 0.58 0.75
4) Commercial A 0.70 0.79
B 0.74 0.83
C 0.78 0.97
D 0.82 0.91
5) Industrial A 0.65 0.75
B 0.70 0.80
C 0.75 0.85
D 0.80 0.90

3
Land Use-Specific Seasonal Runoff Coefficients (cont)
Land Use Hydrologic Soil Group
Dry Season Runoff Coeff.
Wet Season Runoff Coeff.
6) Mining A 0.20 0.20
B 0.30 0.30
C 0.40 0.40
D 0.50 0.50
7) Institutional, Transportation Utils. A 0.40 0.50
B 0.45 0.55
C 0.50 0.60
D 0.55 0.65
8) Range Lands A 0.10 0.18
B 0.14 0.22
C 0.18 0.26
D 0.22 0.30
9) Barren Lands A 0.45 0.55
B 0.50 0.60
C 0.55 0.65
D 0.60 0.70
10) Agricultural - Pasture A 0.10 0.18
B 0.14 0.22
C 0.18 0.26
D 0.22 0.30

4
Land Use-Specific Seasonal Runoff Coefficients (cont)
Land Use Hydrologic Soil Group
Dry Season Runoff Coeff.
Wet Season Runoff Coeff.
11) Agricultural - Groves A 0.20 0.26
B 0.23 0.29
C 0.26 0.32
D 0.29 0.33
12) Agricultural - Feedlots A 0.35 0.45
B 0.40 0.50
C 0.45 0.55
D 0.50 0.60
13) Agricultural - Nursery A 0.20 0.30
B 0.25 0.35
C 0.30 0.40
D 0.35 0.45
14) Agricultural - Row and Field Crops A 0.20 0.30
B 0.25 0.35
C 0.30 0.40
D 0.35 0.45
15) Upland Forested A 0.10 0.15
B 0.13 0.18
C 0.16 0.21
D 0.19 0.24

5
Land Use-Specific Seasonal Runoff Coefficients (cont)
Land Use
Hydrologic Soil Group
Dry Season Runoff Coeff.
Wet Season Runoff Coeff.
16) Freshwater - Open Water A 0.80 0.90
B 0.80 0.90
C 0.80 0.90
D 0.80 0.90
17) Saltwater - Open Water A 1.0 1.0
B 1.0 1.0
C 1.0 1.0
D 1.0 1.0
18) Forested Freshwater Wetlands A 0.50 .60
B 0.55 0.65
C 0.60 0.70
D 0.65 0.75
19) Saltwater Wetlands A 0.95 0.95
B 0.95 0.95
C 0.95 0.95
D 0.95 0.95
20) Non-forested Freshwater Wetlands A 0.45 0.55
B 0.50 0.60
C 0.55 0.65
D 0.60 0.70
21) Tidal Flats A 1.0 1.0
B 1.0 1.0
C 1.0 1.0
D 1.0 1.0

5-6
APPENDIX E
Summary of Management Actions Taken at the Mulberry Phosphate Piney Point Facility
5-7
The Piney Point complex produced phosphoric acid, sulfuric acid, and ammonium phosphate products that were manufactured from molten sulfur, phosphate rock, and anhydrous ammonia raw materials. The predominant waste produced, calcium sulfate, or phosphogypsum, was deposited in two above grade stacks onsite. In addition, a process water inventory of ±500 million gallons was maintained in the gypsum stack impoundments as well as two above grade cooling water ponds. The process water inventory was acidic and contained elevated levels of nutrients (i.e. ammonia and phosphorus), fluoride, sulfate, and metals. Collectively, the manufacturing areas, cooling ponds, and gypsum stacks lay within a 460-acre controlled watershed within the Bishop Harbor basin. The facility is located at 13300 U.S. Highway 41 North, Palmetto, Florida in Sections 5 through 8, Township 33 South, Range 18 East in Manatee County, Florida. On February 1, 2001, Piney Point Phosphates, Inc. notified the Department of Environmental Protection that it had no money and could no longer maintain the facility. To prevent the process water pooled in the above grade ponds from uncontrollably releasing into the environment, on February 7, 2001 the U.S. Environmental Protection Agency assumed responsibility for the environmental security of the facility until transferring that role to the Department on February 21, 2001. On February 8, 2001, Piney Point Phosphates, Inc., along with its parent corporation and related companies, filed voluntary petitions for bankruptcy relief under Chapter 11 (i.e. re-organization) of the bankruptcy code, which proceedings were converted into a Chapter 7 liquidation. Piney Point Phosphates did not have the financial ability to manage the facility to prevent the catastrophic environmental damage that would result from a release of untreated process water, which would ultimately reach Bishop Harbor. In order to preclude such an event, the Department successfully petitioned the Manatee County Circuit Court, which on April 18, 2001 appointed Mr. Louis J. Timchak, Jr., attorney, as the Receiver responsible for initially managing and subsequently closing the Piney Point gypsum stack system. When the Piney Point complex was operational, evaporative heat losses consumed all rainfall and runoff within the 460 acre watershed, thereby precluding the need to discharge process water after first treating the water in a two stage lime and aeration process that constitutes best available technology under the federal Clean Water Act. However, as an inactive facility without heat losses to evaporate water, the Piney Point controlled 460 acre watershed annually accumulated about +/-60 million gallons more rainfall and runoff during average rainfall conditions than is lost through natural evapotranspiration. As a result, the Receiver’s team had to address the need to dispose of water from the site. Water consumption requirements were significantly increased by Tropical Storm Gabrielle in September 2001 and El Niño conditions in December 2002 and January 2003, coupled with above average rainfall in calendar year 2002. In order to minimize potential adverse environmental impacts to Bishop Harbor, the Department, at extremely high costs, treated and barge dispersed in the Gulf of Mexico over 248 million gallons of process water and trucked over 86 million gallons of water to area domestic wastewater treatment facilities and another 96 million gallons to industrial facilities for beneficial re-use. In addition, the Department founded the development of the use of reverse osmosis technology to treat phosphate chemical complex process wastewater streams, which resulted in treatment to ultra-pure water quality levels. Water quality improvements were also obtained through double lime treatment and spray evaporation prior to discharge.

5-8
In spite of this consumption, the excessive rainfall levels and events described above generated contaminated rainfall runoff volumes that exceeded the storage capacity of the gypsum stack system at Piney Point, which had been maximized with Department funding in 2001 and 2002. Faced with these circumstances, the Department issued Emergency Final Order Nos. 01-1650 and 02-1054, which authorized the Receiver to utilize the onsite lime wastewater treatment circuit to treat process water and to discharge the treated water through Outfall 003, which then flows through a series of man-made ditches into Bishop Harbor. Discharges of the reverse osmosis, lime, and aeration treated water occurred sporadically during 2001 through 2003 and occurred continuously throughout 2004 until March 2007, after which no discharge from the site has occurred. Daily discharges and constituent concentrations were measured for each water source by the consultants to the Receiver. As of this date, most of the stacks at the facility are closed, with the final stack closure scheduled for this year. The following table details the monthly TN and TP loads discharged from the former Piney Point facility throughout the 2004-2007 study period: Table E-1. Estimated monthly TN and TP loadings discharged from the former Piney Point Phosphates facility, 2004-2007.
Year Month TN Load (kg/month)
TN Load (tons/month)
TP Load (kg/month)
TP Load (tons/month)
2003 1 7497 8.2 54 0.062003 2 13475 14.8 131 0.142003 3 3601 4.0 107 0.122003 4 3299 3.6 71 0.082003 5 4192 4.6 87 0.102003 6 4131 4.5 47 0.052003 7 982 1.1 22 0.022003 8 147 0.2 115 0.132003 9 293 0.3 172 0.192003 10 1308 1.4 19 0.022003 11 105 0.1 8 0.012003 12 3901 4.3 94 0.102004 1 4004 4.4 85 0.092004 2 3101 3.4 162 0.182004 3 2632 2.9 80 0.092004 4 1590 1.7 57 0.062004 5 482 0.5 35 0.042004 6 1012 1.1 34 0.042004 7 890 1.0 25 0.032004 8 571 0.6 30 0.032004 9 683 0.8 28 0.032004 10 795 0.9 17 0.022004 11 507 0.6 13 0.012004 12 702 0.8 13 0.012005 1 883 1.0 30 0.032005 2 1087 1.2 18 0.022005 3 1116 1.2 19 0.022005 4 965 1.1 29 0.03
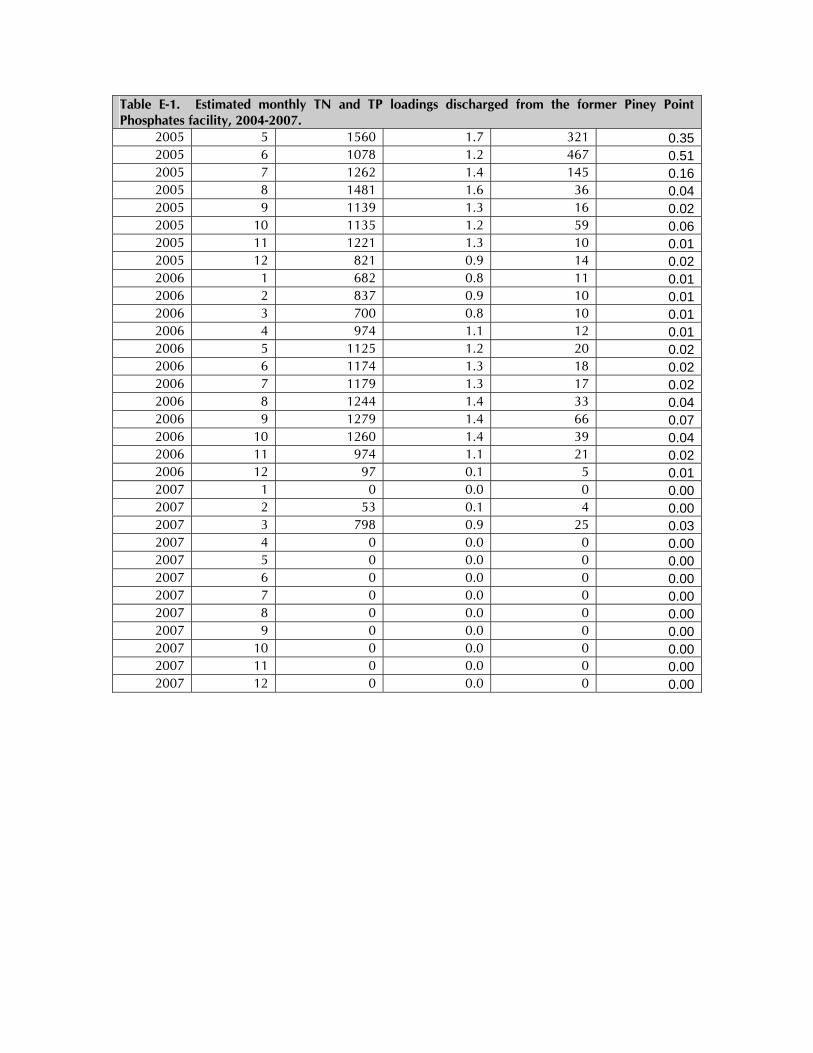
5-9
Table E-1. Estimated monthly TN and TP loadings discharged from the former Piney Point Phosphates facility, 2004-2007.
2005 5 1560 1.7 321 0.352005 6 1078 1.2 467 0.512005 7 1262 1.4 145 0.162005 8 1481 1.6 36 0.042005 9 1139 1.3 16 0.022005 10 1135 1.2 59 0.062005 11 1221 1.3 10 0.012005 12 821 0.9 14 0.022006 1 682 0.8 11 0.012006 2 837 0.9 10 0.012006 3 700 0.8 10 0.012006 4 974 1.1 12 0.012006 5 1125 1.2 20 0.022006 6 1174 1.3 18 0.022006 7 1179 1.3 17 0.022006 8 1244 1.4 33 0.042006 9 1279 1.4 66 0.072006 10 1260 1.4 39 0.042006 11 974 1.1 21 0.022006 12 97 0.1 5 0.012007 1 0 0.0 0 0.002007 2 53 0.1 4 0.002007 3 798 0.9 25 0.032007 4 0 0.0 0 0.002007 5 0 0.0 0 0.002007 6 0 0.0 0 0.002007 7 0 0.0 0 0.002007 8 0 0.0 0 0.002007 9 0 0.0 0 0.002007 10 0 0.0 0 0.002007 11 0 0.0 0 0.002007 12 0 0.0 0 0.00

5-10
APPENDIX F
Summary of Annual TP, TSS, and BOD Loadings,
by Bay Segment and by Source Category

5-11
Old Tampa Bay
Table F-1. Estimated TP loadings (tons/year and percentage of total) by source to Old Tampa Bay.
Source 2004 2005 2006 2007
Atmospheric Deposition 13 (7%)
8 (7%)
6 (5%)
2 (3%)
Domestic Point Sources 54 (28%)
54 (46%)
46 (40%)
45 (51%)
Industrial Point Sources <1 (<1%)
0 (0%)
<1 (<1%)
0 (0%)
Groundwater 5 (3%)
5 (4%)
4 (4%)
6 (7%)
Nonpoint Sources 116 (62%)
52 (44%)
59 (51%)
36 (40%)
TOTAL 188 118 115 90
Table F-2. Estimated TSS loadings (tons/year and percentage of total) by source to Old Tampa Bay.
Source 2004 2005 2006 2007
Domestic Point Sources 28 (<1%)
34 (<1%)
21 (<1%)
19 (<1%)
Industrial Point Sources 15 (<1%)
0 (0%)
6 (<1%)
0 (0%)
Nonpoint Sources 16355 (100%)
7012 (100%)
8597 (100%)
5638 (100%)
TOTAL 16398 7046 8624 5657
Table F-3. Estimated BOD loadings (tons/year and percentage of total) by source to Old Tampa Bay.
Source 2004 2005 2006 2007
Domestic Point Sources 54 (2%)
52 (4%)
55 (3%)
49 (4%)
Industrial Point Sources 16 (<1%)
0 (0%)
6 (<1%)
0 (0%)
Nonpoint Sources 2943 (98%)
1265 (96%)
1534 (96%)
1052 (96%)
TOTAL 3013 1317 1595 1101
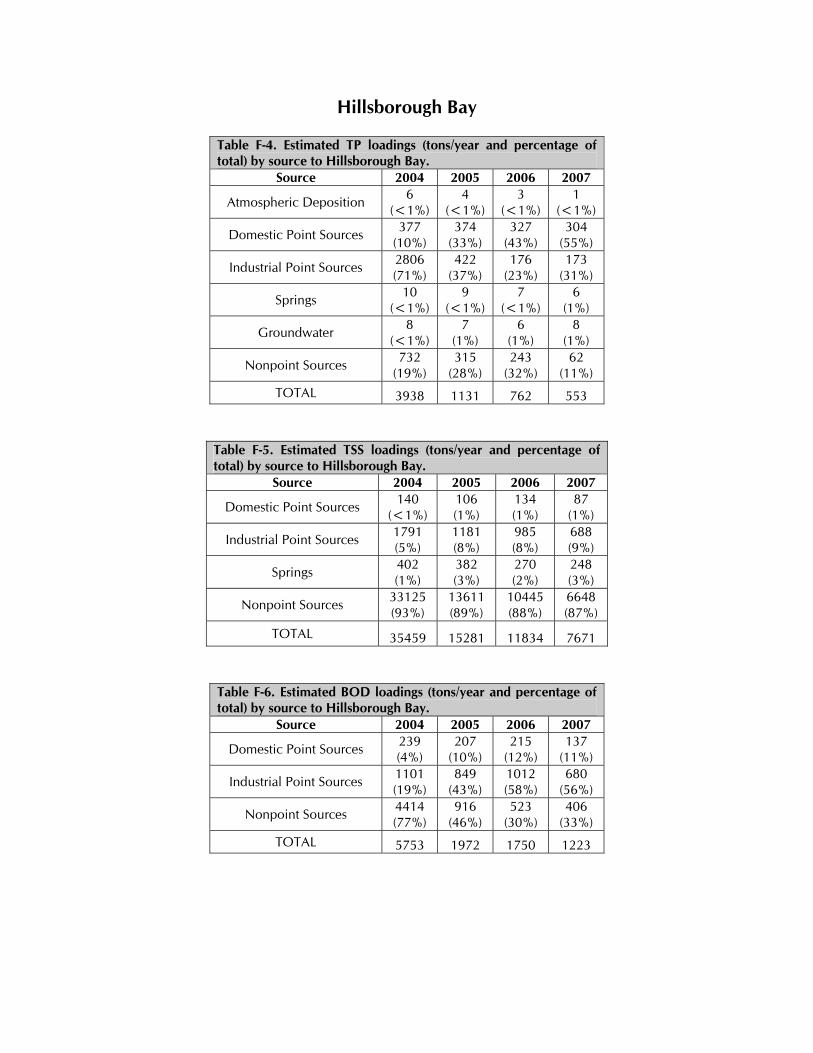
5-12
Hillsborough Bay
Table F-4. Estimated TP loadings (tons/year and percentage of total) by source to Hillsborough Bay.
Source 2004 2005 2006 2007
Atmospheric Deposition 6 (<1%)
4 (<1%)
3 (<1%)
1 (<1%)
Domestic Point Sources 377 (10%)
374 (33%)
327 (43%)
304 (55%)
Industrial Point Sources 2806 (71%)
422 (37%)
176 (23%)
173 (31%)
Springs 10 (<1%)
9 (<1%)
7 (<1%)
6 (1%)
Groundwater 8 (<1%)
7 (1%)
6 (1%)
8 (1%)
Nonpoint Sources 732 (19%)
315 (28%)
243 (32%)
62 (11%)
TOTAL 3938 1131 762 553
Table F-5. Estimated TSS loadings (tons/year and percentage of total) by source to Hillsborough Bay.
Source 2004 2005 2006 2007
Domestic Point Sources 140 (<1%)
106 (1%)
134 (1%)
87 (1%)
Industrial Point Sources 1791 (5%)
1181 (8%)
985 (8%)
688 (9%)
Springs 402 (1%)
382 (3%)
270 (2%)
248 (3%)
Nonpoint Sources 33125 (93%)
13611 (89%)
10445 (88%)
6648 (87%)
TOTAL 35459 15281 11834 7671
Table F-6. Estimated BOD loadings (tons/year and percentage of total) by source to Hillsborough Bay.
Source 2004 2005 2006 2007
Domestic Point Sources 239 (4%)
207 (10%)
215 (12%)
137 (11%)
Industrial Point Sources 1101 (19%)
849 (43%)
1012 (58%)
680 (56%)
Nonpoint Sources 4414 (77%)
916 (46%)
523 (30%)
406 (33%)
TOTAL 5753 1972 1750 1223

5-13
Middle Tampa Bay
Table F-7. Estimated TP loadings (tons/year and percentage of total) by source to Middle Tampa Bay.
Source 2004 2005 2006 2007
Atmospheric Deposition 18 (9%)
11 (9%)
6 (7%)
3 (5%)
Domestic Point Sources 2 (1%)
2 (2%)
3 (3%)
2 (4%)
Industrial Point Sources 84 (39%)
73 (61%)
24 (26%)
39 (68%)
Groundwater <1 (<1%)
1 (<1%)
<1 (<1%)
<1 (<1%)
Nonpoint Sources 109 (51%)
34 (28%)
56 (63%)
13 (22%)
TOTAL 213 121 89 57
Table F-8. Estimated TSS loadings (tons/year and percentage of total) by source to Middle Tampa Bay.
Source 2004 2005 2006 2007
Domestic Point Sources 1 (<1%)
1 (<1%)
1 (<1%)
2 (<1%)
Industrial Point Sources 485 (7%)
557 (24%)
182 (4%)
171 (7%)
Nonpoint Sources 6409 (93%)
1789 (76%)
4579 (96%)
2234 (93%)
TOTAL 6894 2347 4762 2406
Table F-9. Estimated BOD loadings (tons/year and percentage of total) by source to Middle Tampa Bay.
Source 2004 2005 2006 2007
Domestic Point Sources 3 (<1%)
3 (<1%)
3 (<1%)
3 (<1%)
Industrial Point Sources 251 (17%)
294 (55%)
236 (36%)
256 (47%)
Nonpoint Sources 1222 (83%)
234 (44%)
423 (64%)
292 (53%)
TOTAL 1476 531 662 551

5-14
Lower Tampa Bay
Table F-10. Estimated TP loadings (tons/year and percentage of total) by source to Lower Tampa Bay.
Source 2004 2005 2006 2007
Atmospheric Deposition 17 (47%)
10 (45%)
5 (30%)
2 (22%)
Domestic Point Sources <1 (2%)
<1 (3%)
<1 (3%)
<1 (7%)
Industrial Point Sources <1 (2%)
1 (6%)
<1 (2%)
<1 (<1%)
Groundwater <1 (2%)
1 (4%)
<1 (2%)
<1 (3%)
Material Losses <1 (3%)
<1 (4%)
<1 (5%)
<1 (8%)
Nonpoint Sources 15 (44%)
8 (38%)
10 (57%)
7 (60%)
TOTAL 32 20 15 9
Table F-11. Estimated TSS loadings (tons/year and percentage of total) by source to Lower Tampa Bay.
Source 2004 2005 2006 2007
Domestic Point Sources <1 (<1%)
<1 (<1%)
<1 (<1%)
<1 (<1%)
Industrial Point Sources 9 (1%)
7 (2%)
5 (1%)
<1 (<1%)
Nonpoint Sources 840 (99%)
460 (98%)
556 (99%)
376 (100%)
TOTAL 848 468 561 377
Table F-12. Estimated BOD loadings (tons/year and percentage of total) by source to Lower Tampa Bay.
Source 2004 2005 2006 2007
Domestic Point Sources <1 (<1%)
<1 (<1%)
<1 (<1%)
<1 (<1%)
Industrial Point Sources 20 (8%)
17 (12%)
11 (7%)
1 (1%)
Nonpoint Sources 228 (92%)
125 (88%)
151 (93%)
102 (98%)
TOTAL 248 142 162 103

5-15
Boca Ciega Bay
Table F-13. Estimated TP loadings (tons/year and percentage of total) by source to Boca Ciega Bay.
Source 2004 2005 2006 2007
Atmospheric Deposition 6 (9%)
3 (10%)
2 (6%)
<1 (3%)
Domestic Point Sources 14 (22%)
17 (53%)
15 (45%)
10 (35%)
Groundwater <1 (<1%)
<1 (<1%)
<1 (<1%)
<1 (<1%)
Nonpoint Sources 45 (69%)
12 (37%)
17 (49%)
18 (62%)
TOTAL 65 33 34 29
Table F-14. Estimated TSS loadings (tons/year and percentage of total) by source to Boca Ciega Bay.
Source 2004 2005 2006 2007
Domestic Point Sources 30 (<1%)
20 (1%)
16 (<1%)
13 (<1%)
Nonpoint Sources 8768 (100%)
2358 (99%)
3243 (100%)
3422 (100%)
TOTAL 8798 2378 3259 3434
Table F-15. Estimated BOD loadings (tons/year and percentage of total) by source to Boca Ciega Bay.
Source 2004 2005 2006 2007
Domestic Point Sources 65 (4%)
70 (14%)
57 (9%)
29 (5%)
Nonpoint Sources 1581 (96%)
426 (86%)
585 (91%)
617 (95%)
TOTAL 1646 496 642 646
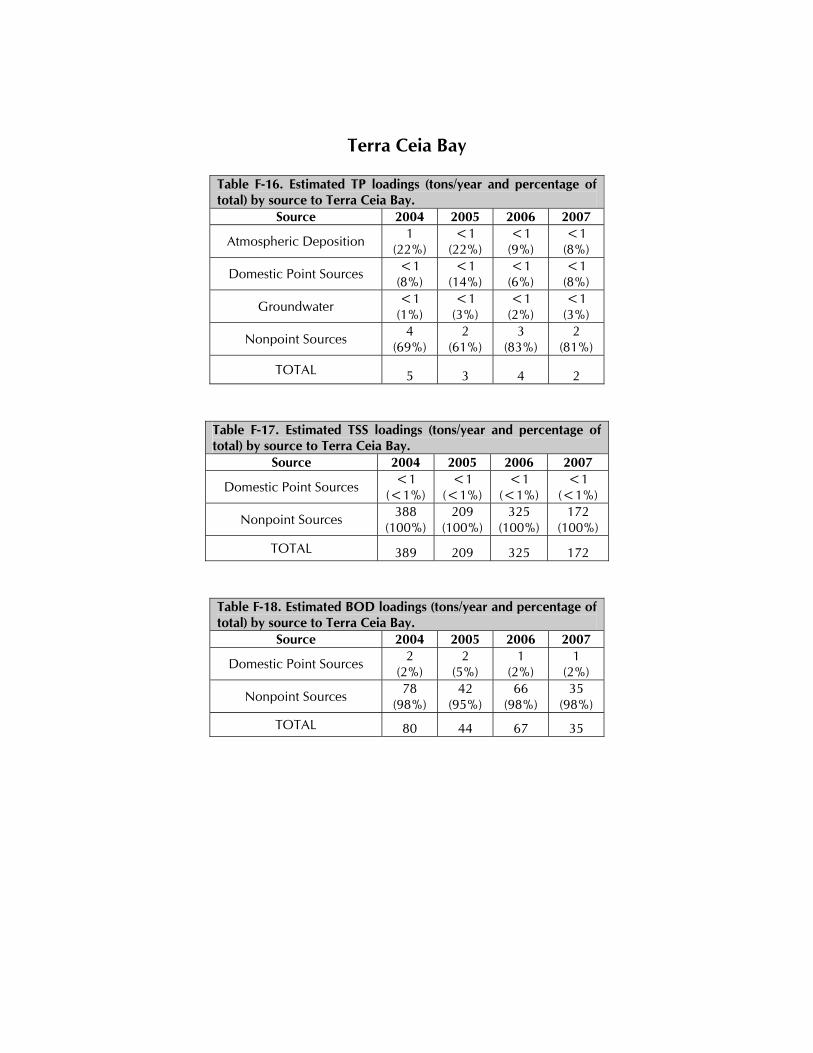
5-16
Terra Ceia Bay
Table F-16. Estimated TP loadings (tons/year and percentage of total) by source to Terra Ceia Bay.
Source 2004 2005 2006 2007
Atmospheric Deposition 1 (22%)
<1 (22%)
<1 (9%)
<1 (8%)
Domestic Point Sources <1 (8%)
<1 (14%)
<1 (6%)
<1 (8%)
Groundwater <1 (1%)
<1 (3%)
<1 (2%)
<1 (3%)
Nonpoint Sources 4 (69%)
2 (61%)
3 (83%)
2 (81%)
TOTAL 5 3 4 2
Table F-17. Estimated TSS loadings (tons/year and percentage of total) by source to Terra Ceia Bay.
Source 2004 2005 2006 2007
Domestic Point Sources <1 (<1%)
<1 (<1%)
<1 (<1%)
<1 (<1%)
Nonpoint Sources 388 (100%)
209 (100%)
325 (100%)
172 (100%)
TOTAL 389 209 325 172
Table F-18. Estimated BOD loadings (tons/year and percentage of total) by source to Terra Ceia Bay.
Source 2004 2005 2006 2007
Domestic Point Sources 2 (2%)
2 (5%)
1 (2%)
1 (2%)
Nonpoint Sources 78 (98%)
42 (95%)
66 (98%)
35 (98%)
TOTAL 80 44 67 35

5-17
Manatee River
Table F-19. Estimated TP loadings (tons/year and percentage of total) by source to Manatee River.
Source 2004 2005 2006 2007
Atmospheric Deposition 3 (2%)
2 (1%)
1 (1%)
<1 (1%)
Domestic Point Sources 3 (2%)
2 (2%)
3 (2%)
2 (4%)
Groundwater <1 (<1%)
<1 (<1%)
<1 (<1%)
<1 (<1%)
Nonpoint Sources 152 (96%)
126 (97%)
105 (97%)
53 (95%)
TOTAL 158 130 109 56
Table F-20. Estimated TSS loadings (tons/year and percentage of total) by source to Manatee River.
Source 2004 2005 2006 2007
Domestic Point Sources 14 (<1%)
10 (<1%)
5 (<1%)
5 (<1%)
Nonpoint Sources 6532 (100%)
4690 (100%)
5800 (100%)
2593 (100%)
TOTAL 6546 4699 5805 2597
Table F-21. Estimated BOD loadings (tons/year and percentage of total) by source to Manatee River.
Source 2004 2005 2006 2007
Domestic Point Sources 19 (1%)
18 (1%)
14 (1%)
13 (2%)
Nonpoint Sources 1907 (99%)
1533 (99%)
1553 (99%)
693 (98%)
TOTAL 1926 1550 1566 705
Related Documents