Estimates of Mortality in Conflict Situations Global Health Fellowship, St. Lukes-Roosevelt Hospital Center

Estimates of Mortality in Conflict Situations
Feb 24, 2016
Estimates of Mortality in Conflict Situations. Global Health Fellowship, St. Lukes -Roosevelt Hospital Center. Changing Profiles of Conflict. Changing Profile of Conflicts. Most conflicts within nat’l borders Poor countries Civil wars with poorly trained armies Asymmetric wars - PowerPoint PPT Presentation
Welcome message from author
This document is posted to help you gain knowledge. Please leave a comment to let me know what you think about it! Share it to your friends and learn new things together.
Transcript
Estimates of Mortality in Conflict
SituationsGlobal Health Fellowship, St.
Lukes-Roosevelt Hospital Center

Changing Profiles of Conflict
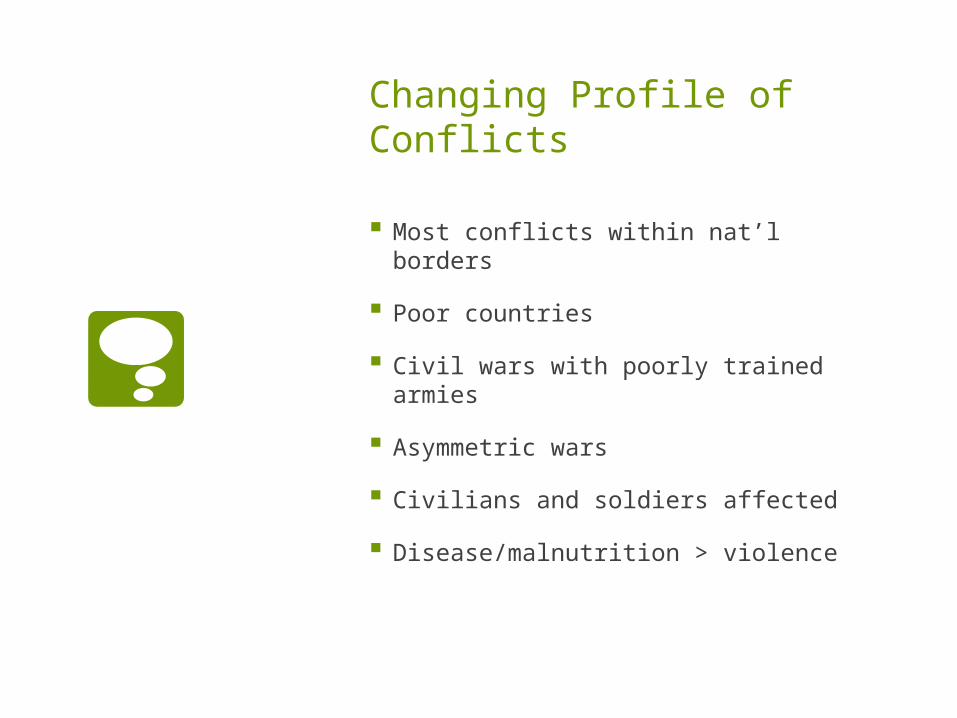
Changing Profile of Conflicts
Most conflicts within nat’l borders Poor countries Civil wars with poorly trained armies Asymmetric wars Civilians and soldiers affected Disease/malnutrition > violence
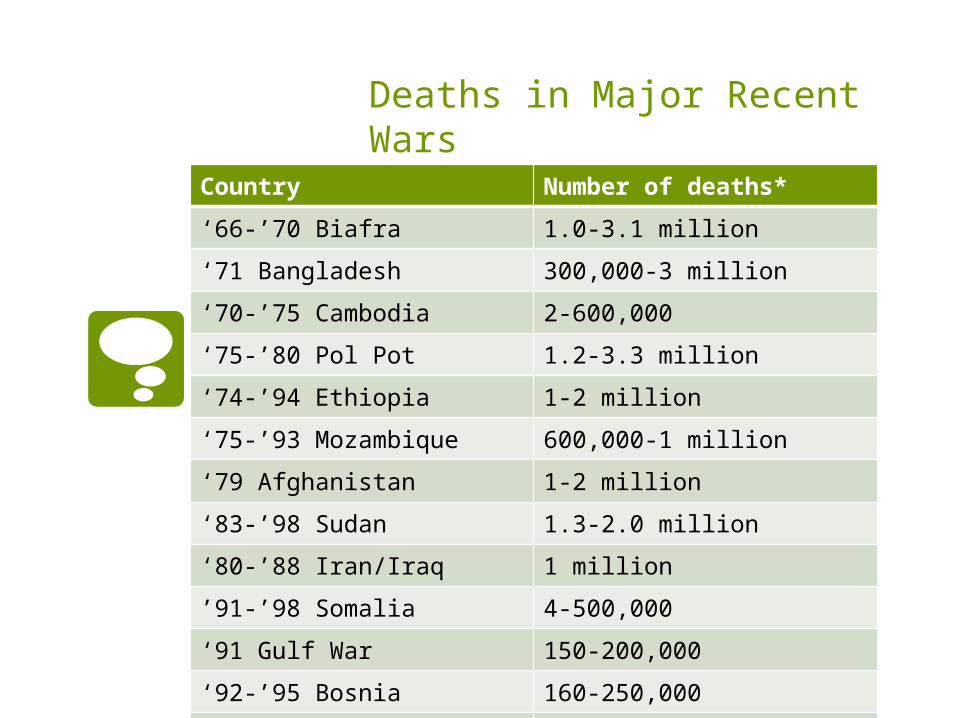
Deaths in Major Recent Wars
Country Number of deaths*‘66-’70 Biafra 1.0-3.1 million‘71 Bangladesh 300,000-3 million‘70-’75 Cambodia 2-600,000‘75-’80 Pol Pot 1.2-3.3 million‘74-’94 Ethiopia 1-2 million‘75-’93 Mozambique 600,000-1 million‘79 Afghanistan 1-2 million‘83-’98 Sudan 1.3-2.0 million‘80-’88 Iran/Iraq 1 million’91-’98 Somalia 4-500,000‘91 Gulf War 150-200,000‘92-’95 Bosnia 160-250,000‘98-’02 DRC 3.3 million
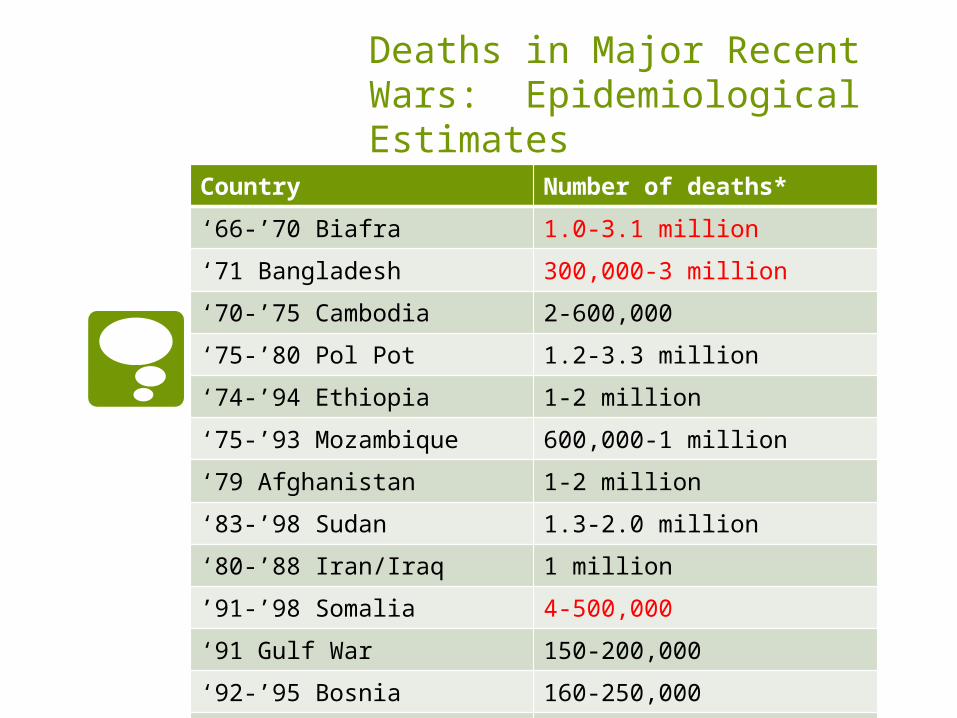
Deaths in Major Recent Wars: Epidemiological Estimates
Country Number of deaths*‘66-’70 Biafra 1.0-3.1 million‘71 Bangladesh 300,000-3 million‘70-’75 Cambodia 2-600,000‘75-’80 Pol Pot 1.2-3.3 million‘74-’94 Ethiopia 1-2 million‘75-’93 Mozambique 600,000-1 million‘79 Afghanistan 1-2 million‘83-’98 Sudan 1.3-2.0 million‘80-’88 Iran/Iraq 1 million’91-’98 Somalia 4-500,000‘91 Gulf War 150-200,000‘92-’95 Bosnia 160-250,000‘98-’02 DRC 3.3 million

Biafra
Dr Karl Western from CDC conducted a convenience sample
Ran around countryside where security would permit
Estimated fraction of children in enclave with small pox vaccination scar
CDC estimated # living, know small pox doses administered Estimated 1 million deaths Estimated 30% of population suffering
from famine edema, 2/3rds with dangerous loss of weight
Bangladesh
Monitored 120,000 people in Matlab Birth rate went down to 7% in year of
war CMR went from 15 to 21/1000/year Assuming population of 70 million,
approx 500,000 excess deaths from war (Curlin GT, et al)
Liberia through ‘92
MSF did survey in part of country Applied rate to entire country Estimated 150,000 excess deaths

DRC
1999 IRC survey in Katana, estimates 15,000 deaths
2000 NYTimes estimates 50,000 excess deaths
IRC does 5 surveys, estimates 1.7 million deaths
2001 IRC 6 surveys estimating 2.5 million
2002 IRC 20 surveys estimating 3.3 million
2004 IRC nationwide survey 3.8 million
Estimates of Mortality
Crude mortality rate (CMR)-total # of deaths that occurred in a population of known size that is at risk of death in a certain period of time
Under 5 mortality rate (U5MR)-age-specific mortality rate with above definition

Crude Mortality Rate
CMR=(number of deaths)/(midterm population at risk X duration of time period) x 10,000 persons
Under 5 Mortality
U5M=(number of deaths)/(midterm population of U5s at risk X duration of time period) X 10,000 persons
Estimates of Mortality
The numerical difference between a “crisis CMR” and the “baseline CMR” is termed the excess mortality
Used for estimating the magnitude of the emergency and monitoring the humanitarian response
Estimates of Mortality
Direct deaths—those caused by war-related injuries and attacks
Indirect deaths—those caused by the worsening of social, economic, and health conditions in the conflict-affected region
Estimating Mortality: direct deaths
Mortality after the 2003 invasion of Iraq: a cross-sectional cluster sample survey
Gilbert Burnham, Riyadh Lafta, Shannon Doocy, Les Roberts
Mortality before and after the 2003 invasion of Iraq: cluster sample survey
Les Roberts, Riyadh Lafta, Richard Garfield, Jamal Khudhairi, Gilbert Burnham
**100,000 excess deaths, violent

Estimating Mortality: indirect deaths
Mortality in the Democratic Republic of Congo: a nationwide survey
Benjamin Coghlan, Richard J Brennan, Pascal Ngoy, David Dofara, Brad Otto, Mark Clements, Tony Stewart
**600,000 excess deaths, 38,000/month, easily preventable and treatable illnesses

Indirect deaths
Potentially holding political and military leaders responsible
Collaboration between epidemiologists, statisticians, human rights organizations
Bolstering of public health system

Challenges of collecting data
Security Breakdown of health infrastructure
Relapsing fever southern Sudan 1998 Marburg hemorrhagic fever in Angola
2005 Hospital records and death certificates
to verify death often absent; alternative verbal autopsy
No baseline data Especially in chronic emergency settings
How to attribute indirect deaths to indirect impacts of conflict

How to estimate mortality in a conflict situation
Retrospective mortality surveys Prospective surveillance Analysis of multiple data sources
**Combination of above
Retrospective Mortality Surveys
The HH is the sampling unit; many of the methods we’ve discussed Simple random sampling Systemic random sampling Cluster sampling—geographic
similarity Usually try to differentiate violent vs
non-violent As with all surveys, bias; survivor and
recall

Retrospective Mortality Surveys: Examples
War and mortality in Kosovo, 1998–99: an epidemiological testimony
Paul B Spiegel, Peter Salama
Two stage cluster survey of 1197 HHs, 8605 people
67 (64%) of 105 deaths from war-related trauma corresponding to 12,000 deaths in total population
CMR increased 2.3 times from pre-conflict
Highest age-specific mortality men 15-49, and older than 50
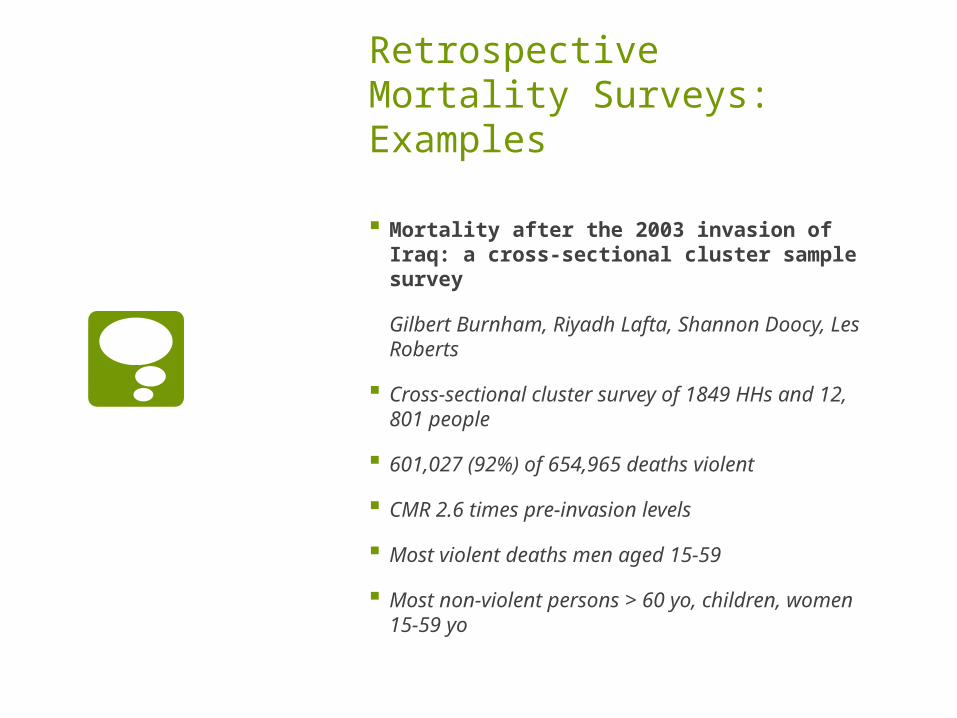
Retrospective Mortality Surveys: Examples
Mortality after the 2003 invasion of Iraq: a cross-sectional cluster sample survey
Gilbert Burnham, Riyadh Lafta, Shannon Doocy, Les Roberts
Cross-sectional cluster survey of 1849 HHs and 12, 801 people
601,027 (92%) of 654,965 deaths violent
CMR 2.6 times pre-invasion levels
Most violent deaths men aged 15-59
Most non-violent persons > 60 yo, children, women 15-59 yo

Retrospective Mortality Surveys: Examples
Mortality in the Democratic Republic of Congo: a nationwide survey
Benjamin Coghlan, Richard J Brennan, Pascal Ngoy, David Dofara, Brad Otto, Mark Clements, Tony Stewart
Stratified three-stage cluster survey of 19,500 HHs
CMR of 2.1 deaths/1000 40% higher than the sub-Saharan region
38,000 excess deaths/month
Most deaths due to preventable causes, malnutrition and IDs
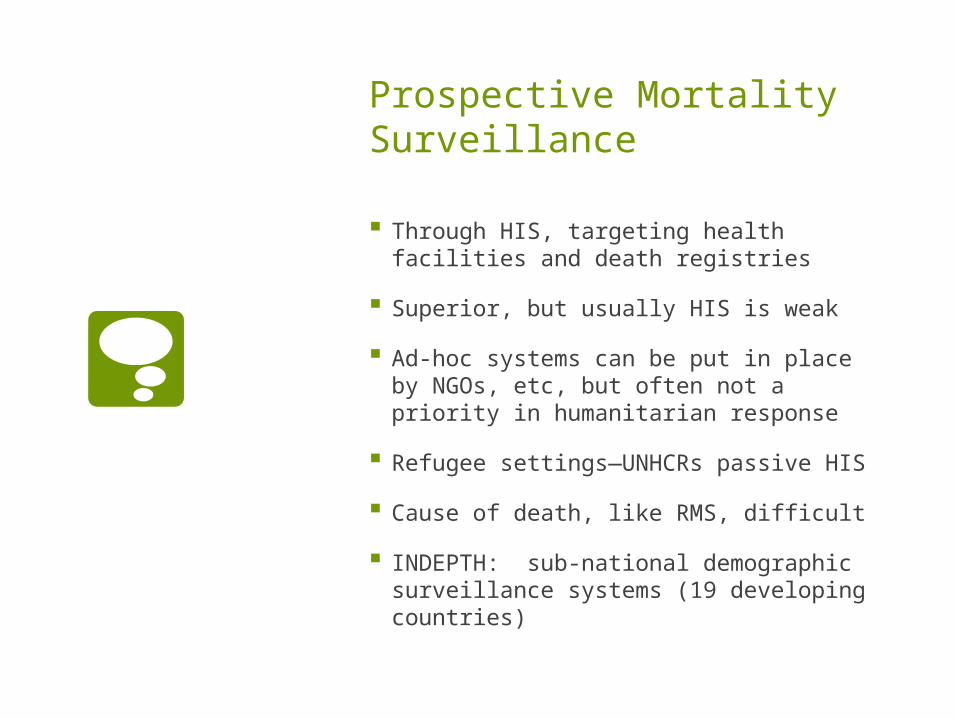
Prospective Mortality Surveillance
Through HIS, targeting health facilities and death registries
Superior, but usually HIS is weak Ad-hoc systems can be put in place by
NGOs, etc, but often not a priority in humanitarian response
Refugee settings—UNHCRs passive HIS Cause of death, like RMS, difficult INDEPTH: sub-national demographic
surveillance systems (19 developing countries)
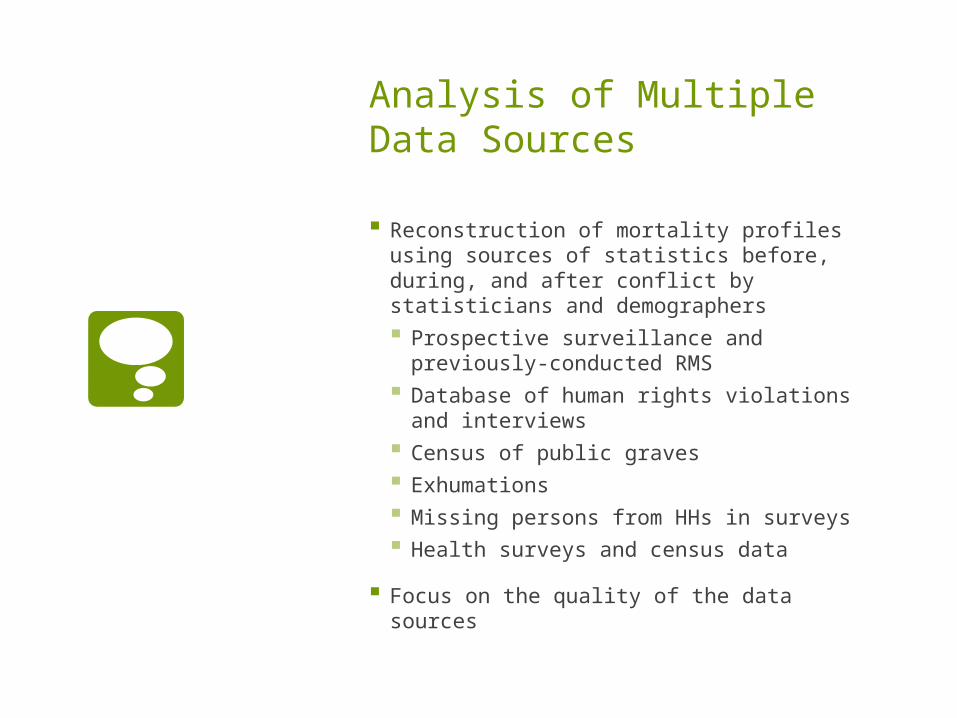
Analysis of Multiple Data Sources
Reconstruction of mortality profiles using sources of statistics before, during, and after conflict by statisticians and demographers Prospective surveillance and previously-
conducted RMS Database of human rights violations
and interviews Census of public graves Exhumations Missing persons from HHs in surveys Health surveys and census data
Focus on the quality of the data sources
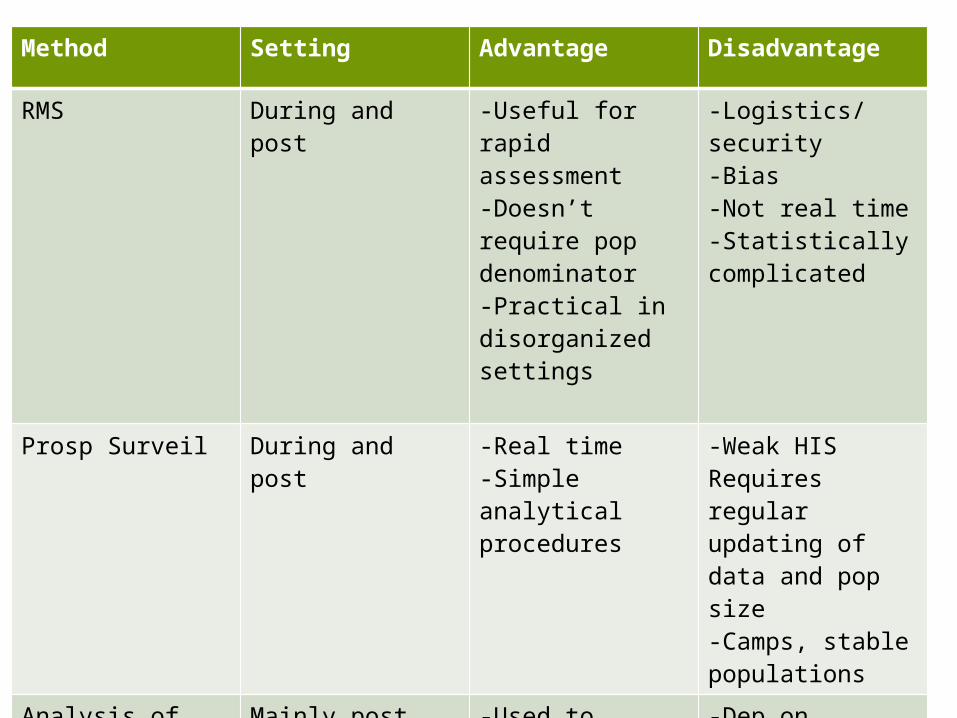
Method Setting Advantage Disadvantage
RMS During and post -Useful for rapid assessment-Doesn’t require pop denominator-Practical in disorganized settings
-Logistics/security-Bias-Not real time-Statistically complicated
Prosp Surveil During and post -Real time-Simple analytical procedures
-Weak HISRequires regular updating of data and pop size-Camps, stable populations
Analysis of multiple data sources
Mainly post -Used to assess quality/strengths of multiple data sources-Statistical tech to employ best aspects of data sources
-Dep on quality, availability, timeliness of primary data sources

Politically controversial?
Related Documents


