Estimates of average hydraulic drivers for sediment and nutrient fluxes in the GBR catchment from SedNet Freeman J. Cook and Anne Kinsey-Henderson CSIRO Land and Water Technical Report No. 15/05 July 2005

Welcome message from author
This document is posted to help you gain knowledge. Please leave a comment to let me know what you think about it! Share it to your friends and learn new things together.
Transcript
Estimates of average hydraulic drivers for sediment and nutrient fluxes in the GBR catchment from SedNet Freeman J. Cook and Anne Kinsey-Henderson CSIRO Land and Water Technical Report No. 15/05 July 2005

Copyright and Disclaimer © 2005 CSIRO To the extent permitted by law, all rights are reserved and no part of this publication covered by copyright may be reproduced or copied in any form or by any means except with the written permission of CSIRO Land and Water.
Important Disclaimer: CSIRO advises that the information contained in this publication comprises general statements based on scientific research. The reader is advised and needs to be aware that such information may be incomplete or unable to be used in any specific situation. No reliance or actions must therefore be made on that information without seeking prior expert professional, scientific and technical advice. To the extent permitted by law, CSIRO (including its employees and consultants) excludes all liability to any person for any consequences, including but not limited to all losses, damages, costs, expenses and any other compensation, arising directly or indirectly from using this publication (in part or in whole) and any information or material contained in it.

Report Title Estimates of average hydraulic drivers for sediment and
nutrient fluxes in the GBR catchments from SedNet Authors F.J. Cook & A. Henderson Affiliations/Misc CSIRO Land & Water
CSIRO Land and Water Technical Report 15/05 July 2005

Technical Report 15/05 Page i
Acknowledgements The authors would like to thank Professor Jim Wallace for refereeing this report and his suggestions for improvement and Ms Glenda Stanton for her formatting. Water for a Healthy Country funded this research and it is appreciated. Dr Alex Smajgl is thanked for his project management and useful discussions.
The Water for a Healthy Country National Research Flagship is a research partnership between CSIRO, state and federal governments, private and public industry and other research providers. The Flagship was established in 2003 as part of the CSIRO National Research Flagship Initiative.

Technical Report 15/05 Page ii
Abstract
This report presents analysis of published SedNet results on the Great Barrier Reef (GBR) catchments to determine erosive potential of particular land uses within and across the catchments. The analysis results in producing values for the combine RKSL factor from the RUSLE model within SedNet. The resulting RKSL values are highly variable and only when residuals are used does this show that the dryer Burdekin and Southern catchments may have less erosive potential. This study suggests that further studies should be undertaken to determine the erosive potential of the catchments and of the uncertainty in SedNet.

Technical Report 15/05 Page iii
Table of Contents
INTRODUCTION.........................................................................................................1
SEDNET BRIEF DESCRIPTION.................................................................................2
METHODS ..................................................................................................................5
RESULTS AND DISCUSSION....................................................................................6
RKSL ..........................................................................................................................8
CONCLUSION ..........................................................................................................16
REFERENCES..........................................................................................................17
APPENDIX I RAW DATA FOR ANALYSIS OF GBR SEDNET DATA.....................18

Technical Report 15/05 Page 1
Introduction
The work presented in this report is an analysis based on previous SedNet (Brodie et al. 2003) modelling of the Great Barrier Reef (GBR) catchments. This work analyses this existing model derived data to determine the hydrological parameters for each land use category within each catchment. The results from this analysis will assist in determining the consequences of shifting land uses from one catchment to another. Previous SedNet work has suggested that 63% of the sediment comes from surface wash or hillslope erosion (Brodie et al. 2003) with gully erosion only being significant in a few catchments. It has been suggested that control of hillslope erosion would have the greatest impact on sediment and nutrient loads to the GBR lagoon. In this report we will concentrate on the hillslope erosion process and in particular the drivers that are associated with the process excluding land cover. The results presented in this report will be used in economic modelling of the consequences of land use change in the GBR catchments.

Technical Report 15/05 Page 2
SedNet brief description
Sediment and nutrients are derived from a number of processes which include: • Runoff on the land, termed surface wash and rill erosion or alternatively hillslope erosion; • Erosion of gullies formed as a result of land clearing or grazing; • Erosion of the banks of streams and rivers; • Erosion of drains; and • Diffuse dissolved losses of nutrients
In many cases one of these processes dominates the others in delivering sediments and nutrients to streams, and the predominant process can vary from one part of a large catchment to another. The basic unit of calculation for constructing a sediment budget is a link in a river network. A link is the stretch of river between any two stream junctions (or nodes; e.g. Figure 1). Each link has an internal watershed, from which sediment is delivered to the stream network by hillslope and gully erosion processes. The internal catchment area is the catchment area added to the link between its upper and lower nodes (Figure 1). For the purpose of the model, the internal catchment area of first order streams is the entire catchment area of the river link. Additional sediment is supplied from bank erosion along the link and from any tributaries to the link. Sediment is transported sequentially through the river network beginning with first order links and terminating at the catchment outlet (commonly the ocean or a major river). The sediment load output from each link is calculated from the supply of sediment from tributary links and the local watershed, less losses though floodplain deposition (fine sediment), bed deposition (coarse sediment), and reservoir deposition (coarse and fine sediment). The sediment yield at the terminating link constitutes the total yield of the river network.
1
1
1
1
4
3
2
Figure 1: SedNet river network showing links, nodes, Shreve magnitude of each link (Shreve, 1966) and internal catchment area of a magnitude one and a magnitude four link.

Technical Report 15/05 Page 3
The SedNet model calculates, among other things:
• the mean annual suspended sediment output from each river link; • the depth of sediment (fine and coarse) accumulated on the river bed
in historical times; • the relative supply of fine sediment from hillslope, gully and bank erosion processes; • the mean annual export of sediment (fine) to the coast; and • the contribution of each watershed to that export. Hillslope erosion from sheet and rill erosion processes is estimated using the Revised Universal Soil Loss Equation (RUSLE; Renard et al., 1997) as applied in the National Land and Water Resource Audit (NLWRA) (Lu et al., 2001). The RUSLE calculates mean annual soil loss (Y, tonnes ha-1 y-1) as a product of six factors: rainfall erosivity (R), soil erodibility (K), hillslope length (L), hillslope gradient (S), ground cover (C) and land use practice factor (P):
Y = R x K x L x S x C x P (1) The rainfall erosivity factor (R, MJ.mm/(ha.h.year) ) is a function of the intensity and energy of storms, measured over a 30 minute period. The R factor can be derived from rainfall stations with 30 minute continuous records. The R factor is a measure of rainfall erosivity and is defined as the mean annual sum of individual storm erosion index values, EI30, where E is the total storm kinetic energy and I30 is the maximum 30-minute rainfall intensity. An empirical relationship is used to estimate EI30 based on the storm measurements of daily rainfall (Lu and Yu, 2002). This was used to interpolate R and measure seasonal values across the region. The empirical relationship was based on 20 years (1980 - 1999) of daily rainfall data mapped to a grid across Australia (Jeffrey et al., 2001). Being an annual average figure this will have associated with it a large coefficient of variation in tropical climates.
Soil erodibility (K) is a measure of the intrinsic susceptibility of the soil to erosion. In the RUSLE, it is a quantitative value determined experimentally. For a particular soil, it is calculated from the rate of soil loss as measured on a unit plot maintained under continuous bare fallow. For the NLWRA, the K factor was estimated from an established relationship with A horizon soil texture, soil clay content and the saturated hydraulic conductivity of the A horizon (Lu et al., 2001). These soil properties were derived from the mapping of the Australian Soil Resource Information System (Henderson et al., 2001).
The topographic factors of slope gradient (S) and slope length (L) were derived as for the NLWRA project (Lu et al. 2001), using scaling rules to estimate the factors from the 9-second DEM available for Australia (AUSLIG, 2000). The scaling rules were derived by comparison of the 9-second DEM with high resolution DEMs and other environmental factors for areas where high resolution DEMs were available (Gallant, 2001). The L factor is only applied to crop land uses as it is used in the prediction of the rill erosion and has an implied assumption of linear increase of runoff with increasing hillslope length. These features are not found on natural land covers or in low intensity grazing systems.
Supporting practice factor (P) accounts for the effects of contour banks, strip-cropping or terracing. It is defined as the ratio of soil loss with a specific supporting practice to the corresponding soil loss with traditional or (commonly used) cultivation practices. Due to a lack of spatial data on existing contour bank locations and other structures, it is assumed that the values of P are 1 everywhere and so in this study is not considered.
Technical Report 15/05 Page 4
The C factor was not considered in this study as this is the controlling variable we wish to leave as an option in the subsequent economic modelling. By choosing the crop and hence C the effect of this crop on estimated Y can be assessed. However, it is important to know how C is estimated. The methods used by Brodie et al. (2003) are given here: “The cover and crop management factor (C) measures the combined effect of all the interrelated cover and crop management variables. It is defined as the ratio of soil loss from land maintained under specified conditions to the corresponding loss from continuous tilled bare fallow. It is an estimate of the combined effects of prior land use, crop canopy cover, surface cover, surface roughness and organic material below the soil surface. The prediction method used in this project was simplified from that used in the NLWRA, where temporal analysis of remote sensing data was used to assess ground and tree cover. Locally, we found underestimates of ground cover in savannah grazing systems, partly as a result of the coarse spatial resolution of the remote sensing and difficulty of estimating ground cover underneath trees. These produced very high estimates of mean annual soil erosion that are not supported by measurements. Consequently we used land use mapping to generate a typical C factor for each cover type, guided by a review of observed soil erosion rates across Australia (Lu et al., 2001). This had the disadvantage of not representing local spatial variation in cover within a land use. The C factor was estimated using variable tillage options between catchments for sugar cane, with 5% trash blanketing in the Burdekin Mill area (Burdekin, Haughton, Don catchments), 30 % trash blanketing in the Bundaberg Mill area (Mary, Burnett, Burrum, Kolan and Baffle catchments) and elsewhere 90-95 % trash blanketing. Three different cover factors were also used for grazed pasture. A C factor of 0.01 was used in dairy farming catchments owing to high quality pastures. In the majority of grazing lands the C factor was set to 0.05, but in Cape York and the Herbert catchments lower value of 0.03 was used to reflect casual observations of better than average ground cover in those areas. ”
Table 1. C factors used in the RUSLE by Brodie et al. (2003).
Land use Region/catchments C factor Rainforest 0.001
Ungrazed savannah/woodland 0.005
Production forestry 0.003
Grazed – dairy Mary, Johnstone, Barron 0.01 Grazed – good cover Endeavour and north, Herbert 0.03 Grazed – normal Remainder 0.05 Sugar (5% TB) Burdekin, Haughton, Don 0.5 Sugar (30% TB) Mary, Burrum, Burnett, Kolan, Baffle 0.2 Sugar (90-95% TB) Remainder 0.1 Grains 0.1
Horticulture 0.1
Bananas 0.1
Mining/bare ground 0.5

Technical Report 15/05 Page 5
The R, S, K and L data can be obtained and a composite parameter RKSL obtained:
RKSL = R x S x L x K (2)
RKSL represents the combined erosion potential neglecting the effect of cover to mitigate this potential. The RKSL will be measured across catchments for all land uses. From this we can determine whether the value of RKSL for a particular land use is consistent across the whole of the GBR, within a catchment and/or different between catchments. This will also determine whether some catchments have a potential erosion risk which is higher than others.
Methods
RKSL was determined on each of the grids at a resolution of 1 km using the existing SedNet data of Brodie et al (2003) to produce a mean annual value for each cell of the grid. These were then sorted by land use (Table 2) within each catchment and minimum, maximum, mean, standard deviation, median, sum, variety, majority, minority of the RKSL values as well as the pixel count and area were calculated (Appendix I gives the raw data). The statistics of the RKSL values across the whole GBR and within catchments were calculated and used to assess whether differences occurred between catchments and or land use categories.
Table 2. Land use codes.
Land use Code Land use 10 Urban 11 Perennial watercourse 12 Non-perennial watercourse 21 Closed forest 22 Open forest 23 Woodland 24 Production forestry, tree crops 25 National Park 31 Cereals (excluding rice) 32 Legumes 33 Other non-cereal crops 34 Oilseeds 35 Non-cereal forage crops 36 Rice 37 Cotton 38 Potatoes 39 Sugar cane 40 Other vegetables 41 Nuts 42 Improved pastures 51 Native pastures 61 Intensive bare ground
Technical Report 15/05 Page 6
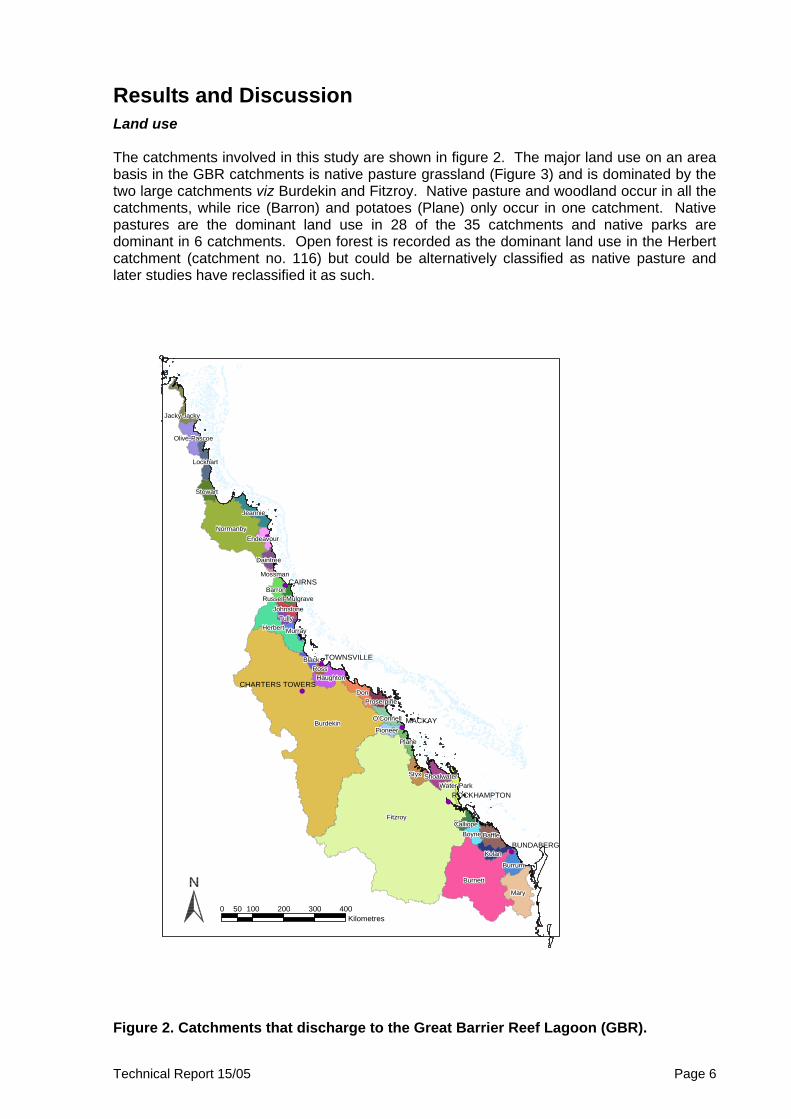
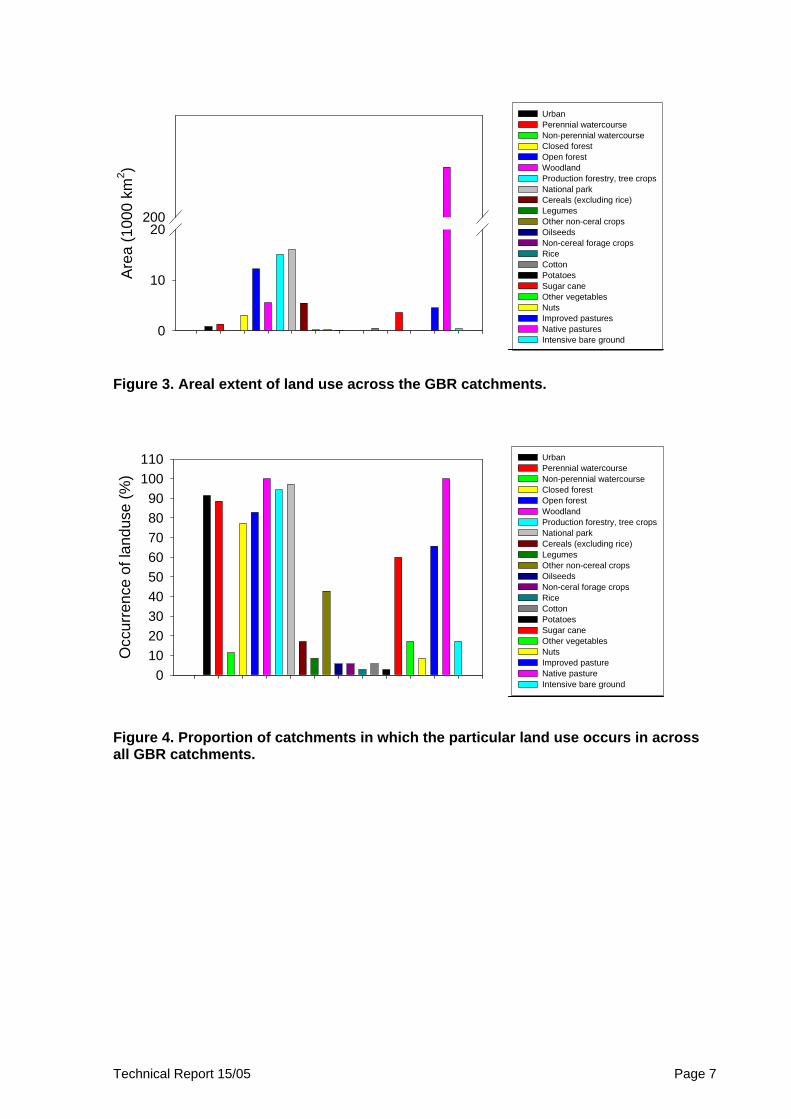
Results and Discussion Land use The catchments involved in this study are shown in figure 2. The major land use on an area basis in the GBR catchments is native pasture grassland (Figure 3) and is dominated by the two large catchments viz Burdekin and Fitzroy. Native pasture and woodland occur in all the catchments, while rice (Barron) and potatoes (Plane) only occur in one catchment. Native pastures are the dominant land use in 28 of the 35 catchments and native parks are dominant in 6 catchments. Open forest is recorded as the dominant land use in the Herbert catchment (catchment no. 116) but could be alternatively classified as native pasture and later studies have reclassified it as such.
Figure 2. Catchments that discharge to the Great Barrier Reef Lagoon (GBR).
•
•
•
•
•
•
•
Fitzroy
Burdekin
Burnett
Normanby
Mary
Herbert
Don
Baffle
Styx
Kolan
Burrum
Jeannie
Haughton
Plane
Boyne
Stewart
Tully
Shoalwater
Barron
Lockhart
Olive-Pascoe
Calliope
Ross
Daintree
O'Connell
Jacky Jacky
Proserpine
Johnstone
Pioneer
Endeavour
Black
Water Park
Murray
Russell-Mulgrave
Mossman
MACKAY
CAIRNS
BUNDABERG
TOWNSVILLE
ROCKHAMPTON
CHARTERS TOWERS
0 100 200 300 40050Kilometres
Technical Report 15/05 Page 7
Are
a (1
000
km2 )
0
10
20200
UrbanPerennial watercourseNon-perennial watercourseClosed forestOpen forestWoodlandProduction forestry, tree cropsNational parkCereals (excluding rice)LegumesOther non-ceral cropsOilseedsNon-cereal forage cropsRiceCottonPotatoesSugar caneOther vegetablesNutsImproved pasturesNative pasturesIntensive bare ground
Figure 3. Areal extent of land use across the GBR catchments.
Occ
urre
nce
of la
ndus
e (%
)
0102030405060708090
100110 Urban
Perennial watercourseNon-perennial watercourseClosed forestOpen forestWoodlandProduction forestry, tree cropsNational parkCereals (excluding rice)LegumesOther non-cereal cropsOilseedsNon-ceral forage cropsRiceCottonPotatoesSugar caneOther vegetablesNutsImproved pastureNative pastureIntensive bare ground
Figure 4. Proportion of catchments in which the particular land use occurs in across all GBR catchments.

Technical Report 15/05 Page 8
RKSL The RKSL values for each land use across all catchments shows that there was no significant difference between land use (figure 6). To overcome what could be bias due to catchments with only a small area of a particular land use, values were weighted by area.
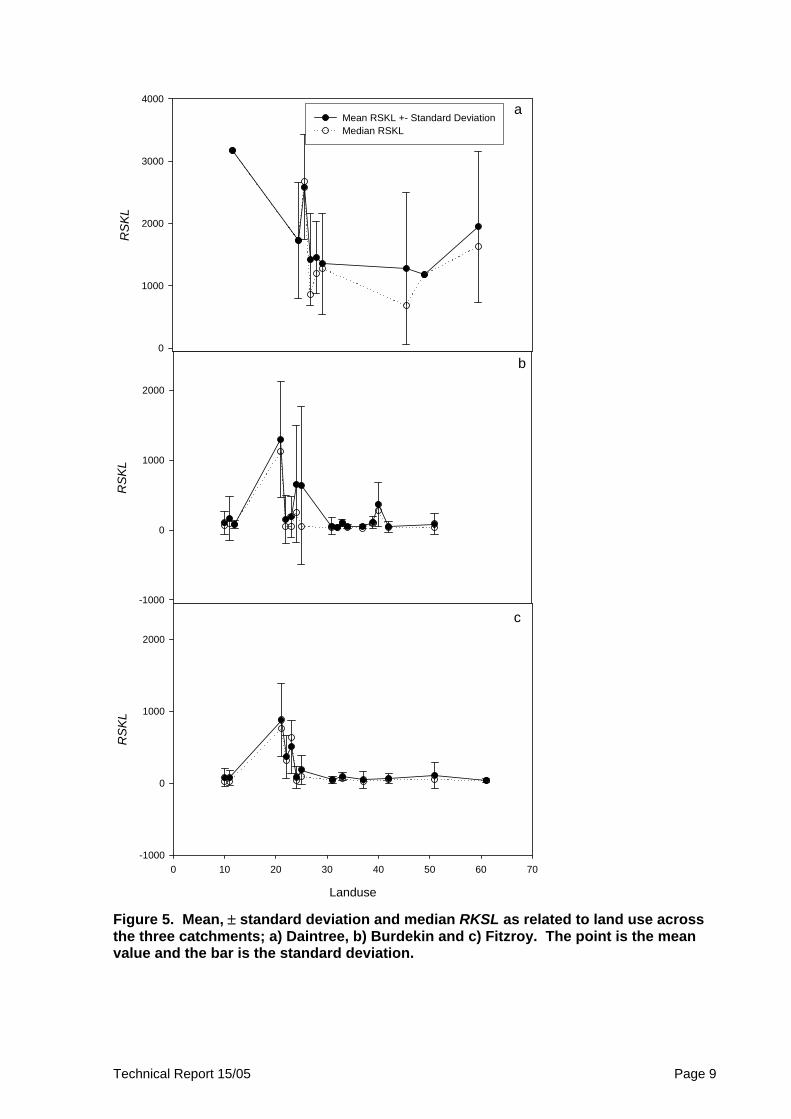
∑∑= lclclclG AARKSLRKSL ,,,, /. (3) where RKSLG,l is either the mean or standard deviation RKSL value across the GBR catchments for a particular land use (l) , RKSLc,l is either the mean or standard deviation of RKSL for a particular catchment (c) and particular land use and Ac,l is the area of land use in that catchment. The coefficients of variation (CV, standard deviation/mean) were high for most land use categories with an average CV of 93% (Appendix I). In 81% of the land use categories the medium value was < the mean which would suggest that the distribution was skewed by some high values (Appendix I). The mean, standard deviation and median values for three catchments; Daintree, Burdekin and Fitzroy, are shown in figure 5. It is also useful to note that because of the form of equation 2 the error in RKSL will be the sum of the percentage errors in each of the component terms i.e. if there was 10% error in each of the R, K, S and L terms then the error in RKSL will be 40%. This propagation of error is something that should be further investigated.
Technical Report 15/05 Page 9
aR
SKL
0
1000
2000
3000
4000
Mean RSKL +- Standard DeviationMedian RSKL
c
Landuse
0 10 20 30 40 50 60 70
RS
KL
-1000
0
1000
2000
b
RS
KL
-1000
0
1000
2000
Figure 5. Mean, ± standard deviation and median RKSL as related to land use across the three catchments; a) Daintree, b) Burdekin and c) Fitzroy. The point is the mean value and the bar is the standard deviation.

Technical Report 15/05 Page 10
Landuse code10 20 30 40 50 60 70
RK
SL
-400-200
0200400600800
1000120014001600
Figure 6. RKSL as related to land use across the GBR. The point is the mean value and the bar is the standard deviation.

Technical Report 15/05 Page 11
The mean and standard deviation of RKSL for all land use categories within a single catchment (catchment codes are in Table 3) show no significant difference (figure 7). This lack of significance is due to the large variance within each catchment. There appears to be an increase in both the mean and standard deviation in the catchments in the northern GBR. Table 3. Catchment name and number for GBR catchments. Catchment Name Catchment number 101 Jacky Jacky 102 Olive-Pascoe 103 Lockhart 104 Stewart 105 Normanby 106 Jeannie 107 Endeavour 108 Daintree 109 Mossman 110 Barron 111 Russell-Mulgrave 112 Johnstone 113 Tully 114 Murray 119 Haughton 116 Herbert 117 Black 118 Ross 120 Burdekin 121 Don 122 Proserpine 124 O'Connell 125 Pioneer 126 Plane 127 Styx 128 Shoalwater 129 Water Park 130 Fitzroy 132 Calliope 133 Boyne 134 Baffle 135 Kolan 136 Burnett 137 Burrum 138 Mary

Technical Report 15/05 Page 12
Catchment No.
RK
SL
0
1000
2000
3000
4000
5000
101
102
103
104105106
107
108
109
111
112
116
113
114
117
118
119
120
121 122
124
125126
127128129
130
132133
134135
136
138
110
137
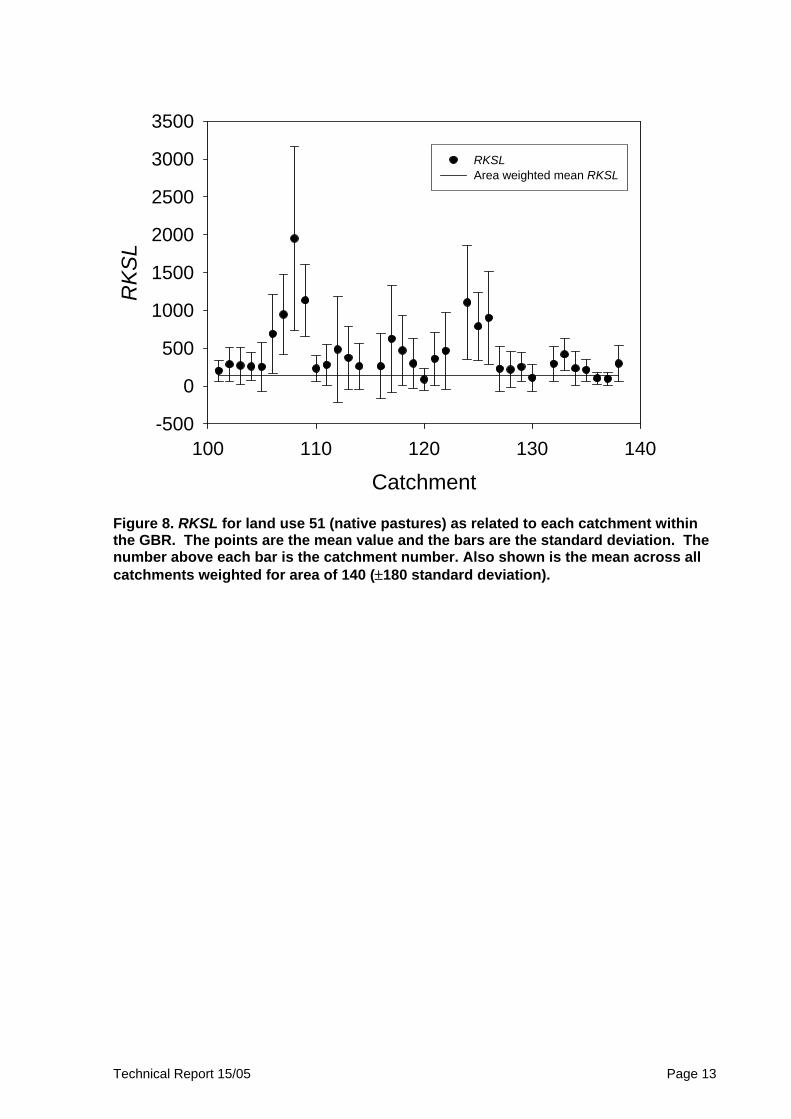
Figure 7. RKSL for all land use as related to each catchment. The points are the mean value and the bars are the standard deviation. The number above each bar is the catchment number. The process of aggregating the data across catchments and land use could cause some of the high variance seen in the results. Thus the land uses that occur across most catchments were native pastures (land use code 51) (Figure 8) and national parks (land use code 25) (Figure 9). These show that there is generally lower variance in RKSL in the southern catchments in the GBR. However, large variance in RKSL will in part be the crude empirical nature of the RUSLE model combined with areal and time averaging producing results which may not be useful for catchment management purposes. When the uncertainty also present in the C factor is included there may be little that can be usefully extracted from this analysis. Below we attempt to derive some information from this analysis.
Technical Report 15/05 Page 13
Catchment100 110 120 130 140
RK
SL
-500
0
500
1000
1500
2000
2500
3000
3500
RKSLArea weighted mean RKSL
Figure 8. RKSL for land use 51 (native pastures) as related to each catchment within the GBR. The points are the mean value and the bars are the standard deviation. The number above each bar is the catchment number. Also shown is the mean across all catchments weighted for area of 140 (±180 standard deviation).

Technical Report 15/05 Page 14
Catchment100 110 120 130 140
RK
SL
-1000
0
1000
2000
3000
4000
5000
RKSLArea weighted mean RKSL
101
102 103
105
106
107108
109
111
112116
113114
117
118
119
120121
124
125126
127
128
129
130 132
133134
135136
138
110
137
Figure 9. RKSL for land use 25 (national park) as related to each catchment within the GBR. The points are the mean value and the bars are the standard deviation. The number above each bar is the catchment number. Also shown is the mean across all catchments weighted for area of 600 (±500 standard deviation). To test to see if the southern catchments were indeed giving consistently lower RKSL values the mean RKSL value for an individual catchment for a particular land use was subtracted from the mean for that land use across all catchments to produce the residual value. The number of residual values that were positive or negative within each catchment were summed and a scale produced. For example if there were 10 land uses in a catchment and there were 6 positive and 4 negative residuals the scale would be 2, whereas if there were 4 positive and 6 negative residuals the scale would be -2. The scale was compared to the number of land use categories within each catchment (figure 10). The results show that for the wet tropic catchments the scale is generally positive surrounding the Burdekin catchment (catchment no. 120, dry tropic catchment). This means that in these catchments the RKSL values are generally greater than the value across the whole of the GBR. The catchments that have significantly negative scale values are the Jacky Jacky (catchment no. 101), Burdekin (catchment no. 120) and southern (catchment no.s 134-138) (except Boyne (catchment no. 133)) GBR catchments. This is possibly due to a lower R value in these dryer catchments but should be investigated further.

Technical Report 15/05 Page 15
Num
ber o
f lan
duse
s, s
cale
-10
0
10
20
ScaleTotal number of landuses in catchment
101102
103104
105
106107
108109
110
111
112
116113114
117
118
119
120
121122
124125
126127
128 129
130
132133
134
135
136
137
138
Figure 10. Number of land uses in a catchment compared to the scale. The number above each bar is the catchment number. The RKSL values show no significant difference with catchment and/or land use across the GBR catchments due to the high variance in the numbers. This suggests that the suggested approach of looking at the effect of the C factor across catchments would have some validity. The high CV means that there will be large uncertainty associated with any estimates. When a scale approach based on residuals is used it indicates that in the wet tropic catchments there are more land uses that produce a value greater than the GBR mean RKSL. While the Burdekin (catchment no. 120) and southern catchments (catchment no. 134-138) consistently gave negative scale values. This would suggest that in the wet tropical catchments the potential erosion is higher, while in the Burdekin (catchment no. 120) and southern catchments (catchment no. 134-138) it is lower. This is most likely due to storm intensity but would need further study to confirm. Investigation to see if this is correct should be undertaken.

Technical Report 15/05 Page 16
Conclusion There is no significant difference in RKSL values with land use across all GBR catchments and/or catchments across the land use within all GBR catchments. This lack of significance is due partly to the high variance in the numbers. This in part is related to the crude empirical areal and time averaging that occurs in deriving the sub components and RKSL factor itself. These results would question the usefulness of such a factor. When a scale approach based on residuals is used it indicates that in the wet tropic catchments there are more land uses that produce a value greater than the GBR mean RKSL. While the Burdekin (catchment no. 120) and southern catchments (catchment no. 134-138) consistently gave negative scale values. This suggests that further investigation is need as this suggests that crops with a higher erosion risk should be grown in the Southern catchments. It should be emphasised that these results are the result of analysing the SedNet model and will encompass the uncertainties and errors associated with this model.

Technical Report 15/05 Page 17
References Brodie, J., McKergow, L., Prosser, I.P, Furnas, M., Hughes, A.O., and Hunter, H. (2003-Draft) Sources of sediment and nutrient exports to the Great Barrier Reef World Heritage Area. ACTFR Report Number 03/11. Henderson, B., Bui, E., Moran, C., Simon, D., Carlile, P. (2001) ASRIS: Continental-scale soil property predictions from point data. Technical Report 28/01, CSIRO Land and Water, Canberra. http://www.clw.csiro.au/publications/technical Jeffrey, S.J., Carter, J.O., Moodie, K.B., Beswick, A.R. (2001) Using spatial interpolation to construct a comprehensive archive of Australian Climate data. Environmental Modelling & Software 16: 309-330 Lu, H., Gallant, J., Prosser, I., Moran, C., Moran, C., and Priestly, G. (2001) Prediction of Sheet and Rill Erosion Over the Australian Continent, Incorporating Monthly Soil Loss Distribution. Canberra, CSIRO Land and Water. http://www.clw.csiro.au/publications/technical2001/tr13-01.pdf Lu, H., Yu, B. 2002. Spatial and seasonal distribution of rainfall erosivity in Australia. Australian Journal of Soil Research 40: 887-901. Lu, H., I.P. Prosser, C.J. Moran, J. Gallant, G. Priestley and J.G Stevenson (2003) Predicting sheetwash and rill erosion over the Australian continent. Australian Journal of Soil Research 41:1037-1062. Renard, K.G., Foster G. A., Weesies D. K., McCool, D.K., and Yoder, D.C. (1997). Predicting Soil Erosion by Water: A Guide to Conservation Planning with the Revised Universal Soil Loss Equation. Agriculture Handbook 703, United States Department of Agriculture, Washington DC. Shreve, R.L. (1966). Statistical law of stream numbers. Journal of Geology, 74:17-37.

Technical Report 15/05 Page 18
Appendix I Raw data for Analysis of GBR SedNet data.
BA
SIN
LAN
DU
SE
PIX
EL
CO
UN
T (1
pix
el =
0.0
1 de
g x
0.01
eg)
AR
EA
(dec
imal
Deg
squ
are)
MIN
MAX
RA
NG
E
ME
AN
STD
SU
M
VA
RIE
TY
MA
JOR
ITY
MIN
OR
ITY
ME
DIA
N
101 10 8 0.0008 28 218 190 115.88 62.90 927 7 28 97 103101 11 5 0.0005 39 115 76 77.60 27.49 388 5 39 39 80101 21 127 0.0127 25 392 367 124.06 82.80 15756 99 33 27 113101 22 209 0.0209 26 402 376 176.18 100.23 36822 152 38 28 194101 23 134 0.0134 27 339 312 132.89 79.27 17807 98 28 38 123101 25 217 0.0217 29 490 461 232.54 111.00 50461 177 49 34 225101 51 962 0.0962 19 627 608 200.70 137.38 193069 321 34 20 234102 10 6 0.0006 58 1263 1205 470.17 383.28 2821 6 58 58 291102 11 4 0.0004 323 924 601 692.50 245.96 2770 4 323 323 616102 21 231 0.0231 24 1974 1950 598.29 383.93 138204 210 146 24 593102 22 6 0.0006 148 622 474 330.17 177.35 1981 6 148 148 254102 23 993 0.0993 23 2003 1980 392.86 338.43 390108 592 34 23 262

Technical Report 15/05 Page 19
102 25 54 0.0054 50 1350 1300 626.28 408.26 33819 54 50 50 573102 42 6 0.0006 207 1443 1236 739.33 461.15 4436 6 207 207 470102 51 1918 0.1918 22 1677 1655 286.65 227.88 549798 599 220 24 251103 10 1 0.0001 118 118 0 118.00 0.00 118 1 118 118 118103 21 668 0.0668 12 2176 2164 666.61 442.91 445296 540 495 12 556103 22 175 0.0175 44 2083 2039 579.38 427.64 101391 156 376 44 450103 23 534 0.0534 17 1952 1935 449.69 420.82 240137 382 99 17 267103 24 309 0.0309 127 1576 1449 620.23 282.09 191651 259 494 127 599103 25 36 0.0036 56 2184 2128 487.53 490.91 17551 36 56 56 329103 42 1 0.0001 310 310 0 310.00 0.00 310 1 310 310 310103 51 166 0.0166 22 1050 1028 269.70 243.29 44770 138 101 22 161104 10 4 0.0004 71 101 30 90.00 12.37 360 3 101 71 87104 11 5 0.0005 49 102 53 84.00 18.76 420 5 49 49 93104 21 129 0.0129 20 2057 2037 760.74 649.17 98135 118 33 20 805104 22 44 0.0044 82 1018 936 208.84 238.85 9189 34 112 82 116104 23 23 0.0023 34 556 522 118.78 115.98 2732 18 81 34 81104 24 578 0.0578 12 2193 2181 378.28 377.51 218644 364 118 12 238104 42 17 0.0017 123 1188 1065 626.53 267.16 10651 17 123 123 586104 51 1258 0.1258 23 1255 1232 258.36 190.30 325011 479 101 23 199105 10 23 0.0023 55 562 507 162.39 138.26 3735 18 66 55 79105 11 87 0.0087 12 663 651 118.11 102.58 10276 63 63 12 77105 12 6 0.0006 52 126 74 73.00 24.17 438 3 65 52 65105 21 100 0.01 11 1558 1547 230.02 360.66 23002 59 65 11 65105 22 238 0.0238 12 2908 2896 722.42 817.87 171935 176 52 12 135105 23 829 0.0829 15 2177 2162 511.82 454.39 424299 499 203 15 275105 24 277 0.0277 11 3378 3367 727.67 873.66 201564 226 100 11 198105 25 4452 0.4452 8 2298 2290 82.97 144.10 369370 314 61 119 61105 31 5 0.0005 54 2172 2118 905.20 879.90 4526 5 54 54 342105 42 6 0.0006 126 293 167 239.33 54.18 1436 6 126 126 249105 51 14370 1.437 9 3368 3359 251.79 326.59 3618291 1400 86 458 118106 10 36 0.0036 15 689 674 142.67 162.39 5136 31 59 15 66106 11 87 0.0087 13 384 371 48.74 53.14 4240 44 34 14 34106 21 194 0.0194 20 2305 2285 418.20 507.00 81130 170 49 22 193106 22 84 0.0084 30 1260 1230 379.08 266.14 31843 78 275 30 332106 23 255 0.0255 12 2511 2499 536.71 701.87 136860 168 12 16 68

Technical Report 15/05 Page 20
106 25 764 0.0764 13 2484 2471 528.13 564.16 403490 530 29 13 306106 42 5 0.0005 571 1203 632 946.00 232.40 4730 5 571 571 928106 51 982 0.0982 14 2827 2813 688.34 517.11 675946 705 244 14 539107 10 1 0.0001 330 330 0 330.00 0.00 330 1 330 330 330107 11 2 0.0002 296 404 108 350.00 54.00 700 2 296 296 296107 21 149 0.0149 29 3153 3124 617.79 635.66 92051 143 87 29 360107 22 65 0.0065 102 2833 2731 1424.32 662.31 92581 64 310 102 1620107 23 336 0.0336 22 3495 3473 1066.72 730.78 358419 309 52 22 1029107 24 99 0.0099 103 3530 3427 1746.70 845.20 172923 96 212 103 1889107 25 183 0.0183 157 3104 2947 1418.91 662.10 259660 172 552 157 1364107 42 7 0.0007 378 2748 2370 1607.14 851.56 11250 7 378 378 1752107 51 776 0.0776 112 3586 3474 944.22 533.58 732711 623 311 112 880108 10 1 0.0001 3172 3172 0 3172.00 0.00 3172 1 3172 3172 3172108 21 62 0.0062 252 3508 3256 1725.76 927.81 106997 62 252 252 1728108 22 11 0.0011 1358 3771 2413 2582.18 841.70 28404 11 1358 1358 2670108 23 6 0.0006 754 2480 1726 1418.50 742.28 8511 6 754 754 860108 24 29 0.0029 845 3262 2417 1451.66 582.26 42098 29 845 845 1200108 25 1383 0.1383 89 4986 4897 1353.43 812.99 1871790 1079 1515 89 1275108 39 36 0.0036 152 4999 4847 1276.19 1225.84 45943 36 152 152 683108 42 1 0.0001 1174 1174 0 1174.00 0.00 1174 1 1174 1174 1174108 51 128 0.0128 252 7322 7070 1948.55 1212.09 249415 125 683 252 1633109 21 17 0.0017 471 1993 1522 1070.41 384.24 18197 16 786 471 908109 22 2 0.0002 565 598 33 581.50 16.50 1163 2 565 565 565109 23 2 0.0002 1754 2201 447 1977.50 223.50 3955 2 1754 1754 1754109 24 16 0.0016 447 1853 1406 942.19 419.44 15075 16 447 447 758109 25 172 0.0172 183 2579 2396 919.18 552.65 158099 161 629 183 667109 39 29 0.0029 311 4803 4492 1246.38 1033.57 36145 29 311 311 1026109 42 12 0.0012 482 1582 1100 1102.92 378.23 13235 12 482 482 1221109 51 14 0.0014 315 1805 1490 1132.00 472.09 15848 14 315 315 1184110 10 55 0.0055 31 1736 1705 752.58 564.55 41392 53 466 31 573110 11 37 0.0037 68 2021 1953 251.22 306.93 9295 35 148 68 187110 21 77 0.0077 170 2185 2015 747.74 506.01 57576 73 262 170 596110 22 69 0.0069 81 1050 969 459.97 237.04 31738 66 172 81 427110 23 22 0.0022 20 1128 1108 399.59 388.88 8791 21 29 20 270110 24 369 0.0369 104 1682 1578 509.46 287.61 187992 304 178 104 453

Technical Report 15/05 Page 21
110 25 378 0.0378 183 2419 2236 774.79 438.82 292872 323 273 183 666110 31 19 0.0019 215 683 468 406.95 153.65 7732 19 215 215 354110 32 6 0.0006 247 426 179 313.00 66.95 1878 6 247 247 269110 33 18 0.0018 84 363 279 198.28 72.31 3569 17 227 84 174110 35 6 0.0006 107 422 315 178.33 109.76 1070 6 107 107 135110 36 1 0.0001 258 258 0 258.00 0.00 258 1 258 258 258110 38 2 0.0002 156 359 203 257.50 101.50 515 2 156 156 156110 39 6 0.0006 71 556 485 266.83 183.59 1601 6 71 71 161110 40 20 0.002 91 305 214 190.20 61.56 3804 19 134 91 171110 41 13 0.0013 110 334 224 166.77 58.97 2168 13 110 110 144110 42 129 0.0129 49 1664 1615 353.50 292.77 45602 119 49 50 252110 51 701 0.0701 33 1122 1089 230.91 166.55 161866 353 67 33 185110 61 3 0.0003 118 178 60 146.33 24.61 439 3 118 118 143111 10 63 0.0063 22 2395 2373 634.97 611.58 40003 60 97 22 382111 11 11 0.0011 80 392 312 186.55 95.40 2052 10 114 80 162111 21 125 0.0125 61 3799 3738 892.12 849.16 111515 119 112 61 614111 22 6 0.0006 147 480 333 288.83 109.42 1733 5 312 147 310111 23 21 0.0021 69 2857 2788 1106.48 934.63 23236 21 69 69 893111 24 30 0.003 196 2818 2622 1381.03 811.87 41431 29 302 196 1225111 25 823 0.0823 121 12918 12797 2217.87 2333.69 1825306 729 362 121 1340111 39 287 0.0287 18 23479 23461 2544.80 3859.63 730358 278 20 18 938111 42 11 0.0011 131 2251 2120 781.64 764.72 8598 10 1533 131 193111 51 41 0.0041 68 1401 1333 278.12 269.76 11403 40 142 68 185112 10 23 0.0023 59 2193 2134 415.61 562.31 9559 21 83 59 179112 11 21 0.0021 32 1332 1300 448.00 424.50 9408 21 32 32 362112 12 1 0.0001 2537 2537 0 2537.00 0.00 2537 1 2537 2537 2537112 21 227 0.0227 81 2663 2582 775.53 621.05 176045 208 97 81 632112 22 14 0.0014 128 882 754 284.71 223.98 3986 14 128 128 190112 23 4 0.0004 800 2541 1741 1490.00 674.85 5960 4 800 800 1013112 24 49 0.0049 52 2364 2312 681.37 626.58 33387 47 111 52 433112 25 793 0.0793 31 6480 6449 1028.32 634.73 815456 647 831 31 945112 31 1 0.0001 134 134 0 134.00 0.00 134 1 134 134 134112 33 1 0.0001 4506 4506 0 4506.00 0.00 4506 1 4506 4506 4506112 39 355 0.0355 24 10950 10926 1026.84 1393.67 364527 324 119 24 536112 42 25 0.0025 42 1836 1794 439.68 448.15 10992 25 42 42 252

Technical Report 15/05 Page 22
112 51 378 0.0378 22 4903 4881 481.94 696.50 182175 286 160 22 215112 61 14 0.0014 39 454 415 153.71 111.23 2152 13 50 39 125113 10 17 0.0017 15 1833 1818 349.65 509.44 5944 16 102 15 104113 11 34 0.0034 16 1637 1621 457.35 497.30 15550 34 16 16 87113 21 31 0.0031 32 2570 2538 794.32 698.71 24624 31 32 32 630113 22 10 0.001 145 1721 1576 811.00 500.35 8110 10 145 145 717113 23 9 0.0009 64 828 764 278.00 215.59 2502 9 64 64 238113 24 59 0.0059 23 2587 2564 756.44 731.37 44630 55 251 23 407113 25 939 0.0939 84 3094 3010 855.41 565.70 803228 715 461 84 714113 39 178 0.0178 16 6775 6759 565.26 1059.83 100617 137 66 16 129113 42 5 0.0005 178 527 349 386.20 144.66 1931 5 178 178 451113 51 209 0.0209 16 2746 2730 370.89 419.57 77516 173 63 23 234114 10 7 0.0007 67 85 18 74.00 6.09 518 7 67 67 71114 11 7 0.0007 49 656 607 164.00 204.21 1148 6 49 56 84114 21 22 0.0022 40 1535 1495 725.86 487.40 15969 22 40 40 728114 22 43 0.0043 45 1323 1278 226.40 252.14 9735 41 45 46 138114 23 9 0.0009 56 1895 1839 306.33 564.39 2757 9 56 56 101114 24 95 0.0095 40 3108 3068 973.66 697.62 92498 94 131 40 785114 25 381 0.0381 21 3047 3026 894.80 549.97 340918 334 558 21 775114 33 3 0.0003 199 1006 807 659.33 339.12 1978 3 199 199 773114 39 48 0.0048 15 1025 1010 250.15 290.37 12007 41 46 15 87114 42 5 0.0005 39 79 40 51.80 14.22 259 5 39 39 45114 51 134 0.0134 12 1884 1872 261.15 301.59 34994 110 36 12 138116 11 118 0.0118 16 1957 1941 203.31 359.24 23991 89 65 16 78116 21 648 0.0648 40 2800 2760 563.18 453.50 364943 503 90 40 423116 22 5305 0.5305 7 3893 3886 267.82 348.34 1420799 1031 50 7 134116 23 32 0.0032 18 188 170 68.72 24.57 2199 20 67 18 67116 24 47 0.0047 65 1842 1777 590.43 471.85 27750 47 65 65 360116 25 1182 0.1182 47 4665 4618 925.71 601.77 1094189 866 520 47 802116 33 61 0.0061 33 1185 1152 217.26 168.21 13253 57 103 33 183116 39 578 0.0578 26 4174 4148 349.99 544.90 202294 322 58 26 142116 42 38 0.0038 75 367 292 194.18 72.72 7379 37 197 75 179116 51 278 0.0278 20 3936 3916 259.47 428.91 72134 187 61 20 113117 10 5 0.0005 102 283 181 174.20 60.65 871 5 102 102 154117 11 1 0.0001 149 149 0 149.00 0.00 149 1 149 149 149
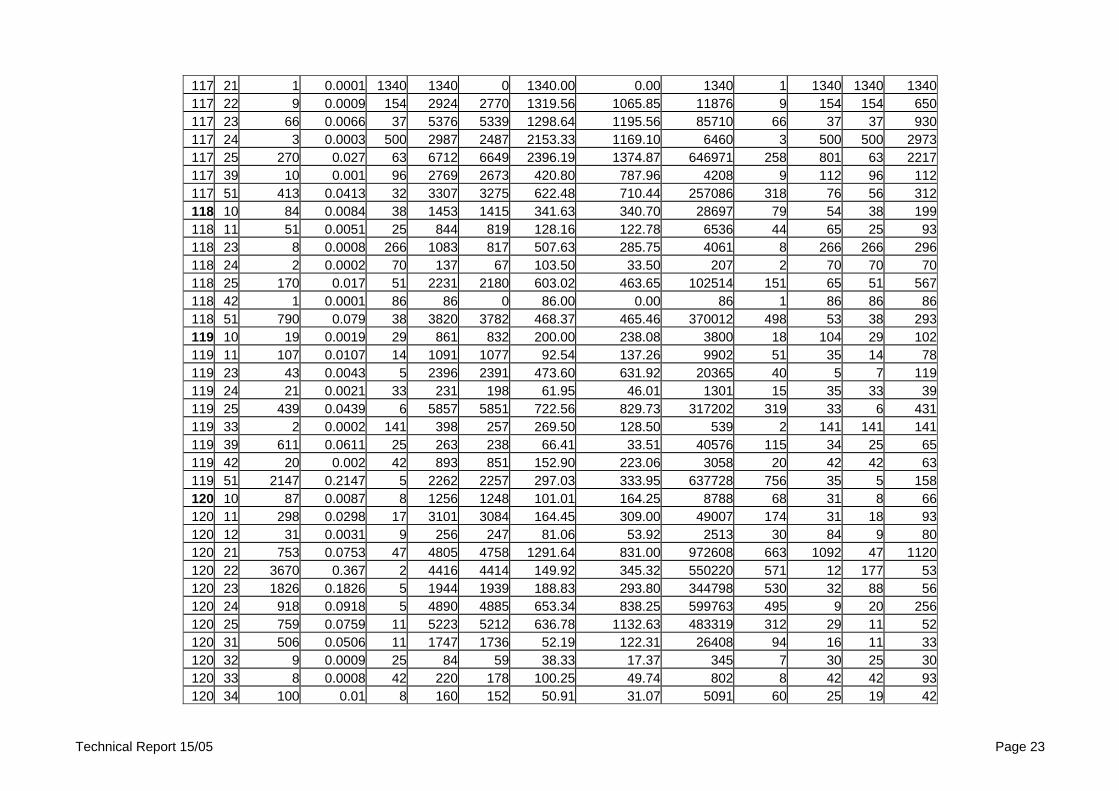
Technical Report 15/05 Page 23
117 21 1 0.0001 1340 1340 0 1340.00 0.00 1340 1 1340 1340 1340117 22 9 0.0009 154 2924 2770 1319.56 1065.85 11876 9 154 154 650117 23 66 0.0066 37 5376 5339 1298.64 1195.56 85710 66 37 37 930117 24 3 0.0003 500 2987 2487 2153.33 1169.10 6460 3 500 500 2973117 25 270 0.027 63 6712 6649 2396.19 1374.87 646971 258 801 63 2217117 39 10 0.001 96 2769 2673 420.80 787.96 4208 9 112 96 112117 51 413 0.0413 32 3307 3275 622.48 710.44 257086 318 76 56 312118 10 84 0.0084 38 1453 1415 341.63 340.70 28697 79 54 38 199118 11 51 0.0051 25 844 819 128.16 122.78 6536 44 65 25 93118 23 8 0.0008 266 1083 817 507.63 285.75 4061 8 266 266 296118 24 2 0.0002 70 137 67 103.50 33.50 207 2 70 70 70118 25 170 0.017 51 2231 2180 603.02 463.65 102514 151 65 51 567118 42 1 0.0001 86 86 0 86.00 0.00 86 1 86 86 86118 51 790 0.079 38 3820 3782 468.37 465.46 370012 498 53 38 293119 10 19 0.0019 29 861 832 200.00 238.08 3800 18 104 29 102119 11 107 0.0107 14 1091 1077 92.54 137.26 9902 51 35 14 78119 23 43 0.0043 5 2396 2391 473.60 631.92 20365 40 5 7 119119 24 21 0.0021 33 231 198 61.95 46.01 1301 15 35 33 39119 25 439 0.0439 6 5857 5851 722.56 829.73 317202 319 33 6 431119 33 2 0.0002 141 398 257 269.50 128.50 539 2 141 141 141119 39 611 0.0611 25 263 238 66.41 33.51 40576 115 34 25 65119 42 20 0.002 42 893 851 152.90 223.06 3058 20 42 42 63119 51 2147 0.2147 5 2262 2257 297.03 333.95 637728 756 35 5 158120 10 87 0.0087 8 1256 1248 101.01 164.25 8788 68 31 8 66120 11 298 0.0298 17 3101 3084 164.45 309.00 49007 174 31 18 93120 12 31 0.0031 9 256 247 81.06 53.92 2513 30 84 9 80120 21 753 0.0753 47 4805 4758 1291.64 831.00 972608 663 1092 47 1120120 22 3670 0.367 2 4416 4414 149.92 345.32 550220 571 12 177 53120 23 1826 0.1826 5 1944 1939 188.83 293.80 344798 530 32 88 56120 24 918 0.0918 5 4890 4885 653.34 838.25 599763 495 9 20 256120 25 759 0.0759 11 5223 5212 636.78 1132.63 483319 312 29 11 52120 31 506 0.0506 11 1747 1736 52.19 122.31 26408 94 16 11 33120 32 9 0.0009 25 84 59 38.33 17.37 345 7 30 25 30120 33 8 0.0008 42 220 178 100.25 49.74 802 8 42 42 93120 34 100 0.01 8 160 152 50.91 31.07 5091 60 25 19 42

Technical Report 15/05 Page 24
120 37 2 0.0002 22 81 59 51.50 29.50 103 2 22 22 22120 39 132 0.0132 37 598 561 112.68 84.21 14874 88 90 38 96120 40 14 0.0014 38 1018 980 367.36 312.19 5143 14 38 38 273120 42 2277 0.2277 2 1178 1176 44.86 73.86 102146 190 21 89 30120 51 101393 10.1393 2 3171 3169 85.97 144.74 8716948 1308 22 452 42121 10 5 0.0005 86 133 47 109.00 15.03 545 5 86 86 109121 11 100 0.01 27 260 233 108.03 44.02 10803 66 90 27 105121 21 2 0.0002 672 1073 401 872.50 200.50 1745 2 672 672 672121 23 72 0.0072 67 1925 1858 516.96 408.72 37221 69 452 67 385121 24 17 0.0017 82 348 266 107.35 60.44 1825 13 82 83 94121 25 14 0.0014 333 3067 2734 1308.86 773.78 18324 14 333 333 1050121 33 76 0.0076 35 395 360 129.18 68.40 9818 58 83 35 97121 39 16 0.0016 100 339 239 195.94 73.05 3135 16 100 100 191121 40 2 0.0002 257 276 19 266.50 9.50 533 2 257 257 257121 51 2558 0.2558 18 3778 3760 359.34 346.88 919195 843 89 18 234122 10 4 0.0004 96 250 154 176.25 60.65 705 4 96 96 142122 11 84 0.0084 44 1737 1693 620.31 512.45 52106 83 44 47 482122 21 1 0.0001 726 726 0 726.00 0.00 726 1 726 726 726122 23 118 0.0118 129 3116 2987 1454.76 623.05 171662 115 1371 129 1472122 24 227 0.0227 356 2834 2478 1656.57 525.53 376041 213 919 356 1646122 25 96 0.0096 90 3264 3174 1428.35 622.99 137122 94 1649 90 1520122 39 215 0.0215 46 6295 6249 718.05 883.18 154381 188 97 46 272122 40 2 0.0002 160 194 34 177.00 17.00 354 2 160 160 160122 51 982 0.0982 44 2715 2671 462.92 512.56 454583 568 46 59 239124 10 10 0.001 105 364 259 192.20 73.06 1922 10 105 105 174124 11 32 0.0032 56 1540 1484 437.50 326.51 14000 31 237 56 354124 21 20 0.002 358 2095 1737 894.45 454.33 17889 20 358 358 778124 23 227 0.0227 343 4114 3771 1582.49 615.98 359225 218 1529 343 1532124 24 167 0.0167 419 4390 3971 1799.39 811.66 300498 162 877 419 1812124 25 136 0.0136 94 3297 3203 1769.88 640.52 240704 131 1646 94 1783124 39 284 0.0284 47 9674 9627 1011.65 967.54 287310 259 51 47 705124 42 4 0.0004 157 942 785 389.75 320.38 1559 4 157 157 216124 51 903 0.0903 63 6723 6660 1103.65 750.52 996600 743 431 63 942124 61 1 0.0001 1409 1409 0 1409.00 0.00 1409 1 1409 1409 1409125 10 11 0.0011 81 686 605 210.09 159.68 2311 11 81 81 180

Technical Report 15/05 Page 25
125 11 9 0.0009 133 1016 883 662.89 238.28 5966 9 133 133 722125 21 28 0.0028 360 1866 1506 753.71 388.58 21104 28 360 360 655125 22 1 0.0001 1250 1250 0 1250.00 0.00 1250 1 1250 1250 1250125 23 131 0.0131 189 2157 1968 1095.23 413.52 143475 125 856 189 1048125 24 310 0.031 267 2043 1776 909.22 385.23 281857 276 548 267 849125 25 109 0.0109 64 3109 3045 864.72 531.98 94254 100 640 64 728125 39 415 0.0415 64 4054 3990 807.28 696.11 335021 365 105 64 647125 51 435 0.0435 71 3138 3067 787.17 448.82 342420 375 514 71 711126 10 7 0.0007 53 979 926 468.43 268.24 3279 7 53 53 457126 11 53 0.0053 56 1084 1028 213.06 212.31 11292 47 174 56 155126 21 8 0.0008 842 1904 1062 1494.63 339.50 11957 8 842 842 1362126 22 1 0.0001 1890 1890 0 1890.00 0.00 1890 1 1890 1890 1890126 23 5 0.0005 148 2294 2146 1194.20 871.78 5971 5 148 148 1188126 24 98 0.0098 595 3025 2430 1407.02 437.46 137888 95 1261 595 1302126 25 5 0.0005 53 1675 1622 841.20 552.26 4206 5 53 53 976126 39 515 0.0515 37 3917 3880 472.57 552.43 243371 379 54 37 262126 42 1 0.0001 1159 1159 0 1159.00 0.00 1159 1 1159 1159 1159126 51 868 0.0868 43 6842 6799 900.71 613.18 781815 685 962 43 866127 10 1 0.0001 98 98 0 98.00 0.00 98 1 98 98 98127 11 74 0.0074 7 753 746 91.59 114.38 6778 60 31 9 40127 21 6 0.0006 642 1384 742 940.67 231.45 5644 5 991 642 834127 22 6 0.0006 601 1087 486 960.00 167.77 5760 6 601 601 1010127 23 383 0.0383 99 1741 1642 787.85 290.35 301746 331 931 99 819127 24 42 0.0042 388 1161 773 874.43 214.15 36726 39 437 388 944127 25 2 0.0002 81 94 13 87.50 6.50 175 2 81 81 81127 51 1840 0.184 7 2009 2002 226.12 297.72 416061 591 42 9 80128 11 119 0.0119 15 234 219 36.53 21.51 4347 42 27 15 33128 22 3 0.0003 277 881 604 616.33 252.17 1849 3 277 277 691128 23 4 0.0004 43 261 218 103.00 91.66 412 3 43 65 43128 24 9 0.0009 255 939 684 694.11 196.25 6247 9 255 255 738128 25 10 0.001 31 433 402 193.40 152.92 1934 10 31 31 78128 42 5 0.0005 89 261 172 201.00 72.79 1005 5 89 89 256128 51 2507 0.2507 5 1328 1323 215.80 239.99 541015 685 24 79 114128 61 2 0.0002 45 46 1 45.50 0.50 91 2 45 45 45129 10 2 0.0002 269 294 25 281.50 12.50 563 2 269 269 269

Technical Report 15/05 Page 26
129 11 32 0.0032 7 456 449 220.16 122.93 7045 30 272 7 230129 22 4 0.0004 279 658 379 444.25 165.49 1777 4 279 279 287129 23 3 0.0003 231 273 42 246.33 18.93 739 3 231 231 235129 24 2 0.0002 442 510 68 476.00 34.00 952 2 442 442 442129 25 53 0.0053 42 1459 1417 429.60 370.51 22769 52 183 42 279129 51 692 0.0692 7 1195 1188 250.66 192.41 173460 401 135 7 187130 10 206 0.0206 11 679 668 73.90 124.11 15223 74 20 11 26130 11 32 0.0032 17 490 473 75.25 105.94 2408 20 18 17 27130 21 48 0.0048 79 2024 1945 877.54 508.61 42122 48 79 79 757130 22 82 0.0082 23 1102 1079 367.18 297.63 30109 75 41 23 320130 23 8 0.0008 12 854 842 507.13 369.00 4057 8 12 12 638130 24 7179 0.7179 2 1571 1569 83.88 151.85 602196 561 11 199 40130 25 4534 0.4534 6 1404 1398 183.17 197.59 830512 703 21 6 92130 31 5849 0.5849 7 900 893 46.71 44.33 273212 243 23 147 36130 33 10 0.001 57 224 167 91.00 53.72 910 9 63 57 63130 37 580 0.058 6 2090 2084 43.83 120.46 25420 101 17 6 24130 42 2190 0.219 5 1090 1085 66.63 69.71 145929 242 32 5 47
130 51 104928 10.4928 2 2933 2931 108.44 181.18 11378695 1534 25 732 49130 61 465 0.0465 8 257 249 39.65 29.01 18435 86 25 14 32132 10 19 0.0019 115 260 145 187.11 45.25 3555 17 193 115 193132 21 1 0.0001 162 162 0 162.00 0.00 162 1 162 162 162132 22 2 0.0002 455 457 2 456.00 1.00 912 2 455 455 455132 23 4 0.0004 182 626 444 386.00 198.96 1544 4 182 182 197132 24 80 0.008 54 740 686 404.73 167.00 32378 78 432 54 400132 25 3 0.0003 238 289 51 257.67 22.40 773 3 238 238 246132 33 1 0.0001 238 238 0 238.00 0.00 238 1 238 238 238132 51 1699 0.1699 22 1405 1383 292.77 233.37 497409 647 26 22 230133 10 6 0.0006 102 234 132 165.17 42.25 991 5 153 102 153133 11 29 0.0029 65 744 679 332.14 186.32 9632 29 65 65 282133 22 22 0.0022 110 832 722 437.95 244.67 9635 22 110 110 375133 23 12 0.0012 364 880 516 643.67 142.08 7724 12 364 364 637133 24 377 0.0377 60 1151 1091 465.63 243.13 175543 306 133 60 435133 25 62 0.0062 122 1074 952 479.90 279.32 29754 60 137 122 472133 33 2 0.0002 96 137 41 116.50 20.50 233 2 96 96 96

Technical Report 15/05 Page 27
133 51 1694 0.1694 43 1402 1359 418.22 212.25 708472 714 337 43 407134 10 1 0.0001 45 45 0 45.00 0.00 45 1 45 45 45134 11 25 0.0025 3 298 295 91.76 83.66 2294 23 28 3 57134 23 51 0.0051 3 826 823 165.00 237.47 8415 38 5 8 23134 24 115 0.0115 40 795 755 236.48 152.80 27195 100 76 40 187134 25 453 0.0453 2 1239 1237 331.07 260.84 149973 325 4 2 296134 33 3 0.0003 3 68 65 45.00 29.74 135 3 3 3 64134 39 5 0.0005 4 155 151 44.20 56.83 221 5 4 4 15134 51 2517 0.2517 2 1153 1151 232.68 223.61 585664 696 35 6 149135 10 1 0.0001 117 117 0 117.00 0.00 117 1 117 117 117135 11 48 0.0048 95 291 196 173.63 44.37 8334 44 101 95 167135 22 21 0.0021 32 547 515 286.95 165.23 6026 20 109 32 375135 23 3 0.0003 36 580 544 220.00 254.58 660 3 36 36 44135 24 478 0.0478 31 1073 1042 323.07 156.95 154428 322 122 31 309135 25 11 0.0011 117 556 439 283.91 139.81 3123 11 117 117 259135 33 1 0.0001 125 125 0 125.00 0.00 125 1 125 125 125135 39 116 0.0116 5 220 215 54.86 45.21 6364 75 21 5 34135 41 1 0.0001 63 63 0 63.00 0.00 63 1 63 63 63135 51 1851 0.1851 14 1271 1257 209.90 145.44 388528 504 118 14 161136 10 233 0.0233 13 399 386 67.40 68.88 15704 93 25 13 49136 11 61 0.0061 14 108 94 67.26 20.79 4103 39 14 26 67136 12 1 0.0001 224 224 0 224.00 0.00 224 1 224 224 224136 21 158 0.0158 15 637 622 186.09 142.00 29403 123 105 15 128136 22 5119 0.5119 5 1041 1036 122.81 108.29 628662 498 65 5 82136 23 108 0.0108 11 522 511 157.13 135.95 16970 88 40 11 88136 24 4366 0.4366 10 834 824 105.21 103.64 459352 460 65 224 66136 25 23 0.0023 42 466 424 186.65 134.90 4293 23 42 42 126136 31 466 0.0466 8 891 883 163.83 133.05 76347 254 88 8 124136 32 183 0.0183 11 621 610 146.73 105.60 26851 132 115 11 117136 33 24 0.0024 54 867 813 239.50 213.07 5748 24 54 54 145136 34 2 0.0002 38 1105 1067 571.50 533.50 1143 2 38 38 38136 35 7 0.0007 50 413 363 212.00 146.55 1484 7 50 50 144136 39 207 0.0207 3 329 326 101.20 75.98 20949 134 20 3 80136 40 3 0.0003 19 37 18 29.33 7.59 88 3 19 19 32136 41 4 0.0004 22 91 69 56.50 30.76 226 4 22 22 30

Technical Report 15/05 Page 28
136 42 874 0.0874 6 482 476 99.33 73.70 86814 247 52 6 73136 51 17957 1.7957 3 867 864 102.12 79.88 1833756 518 58 3 76137 10 22 0.0022 2 167 165 56.05 45.68 1233 20 17 2 35137 11 15 0.0015 1 126 125 59.60 48.12 894 13 1 7 84137 22 3 0.0003 209 567 358 382.67 146.35 1148 3 209 209 372137 23 1 0.0001 26 26 0 26.00 0.00 26 1 26 26 26137 24 681 0.0681 5 414 409 100.43 60.90 68390 195 91 8 92137 25 259 0.0259 2 466 464 73.45 102.65 19023 110 19 32 25137 33 2 0.0002 25 28 3 26.50 1.50 53 2 25 25 25137 39 283 0.0283 4 181 177 59.49 41.94 16835 105 23 4 40137 40 1 0.0001 20 20 0 20.00 0.00 20 1 20 20 20137 51 1362 0.1362 3 732 729 94.78 86.63 129092 287 21 5 77138 10 77 0.0077 12 440 428 109.96 94.56 8467 61 28 14 102138 11 39 0.0039 10 1179 1169 309.72 418.21 12079 31 10 13 40138 21 7 0.0007 13 369 356 155.43 152.17 1088 6 13 14 67138 22 23 0.0023 13 646 633 186.35 206.85 4286 20 15 13 50138 23 669 0.0669 9 1767 1758 284.82 295.84 190544 379 36 43 141138 24 1723 0.1723 9 2173 2164 242.72 233.29 418215 583 84 9 139138 25 818 0.0818 24 1147 1123 384.32 252.54 314371 527 66 24 346138 33 12 0.0012 68 1871 1803 434.33 462.83 5212 11 466 68 281138 39 165 0.0165 11 804 793 72.71 96.01 11997 96 14 11 43138 42 11 0.0011 101 617 516 293.91 170.67 3233 11 101 101 189138 51 4761 0.4761 6 2863 2857 295.83 242.00 1408468 880 81 6 223138 61 2 0.0002 59 67 8 63.00 4.00 126 2 59 59 59
Related Documents