Estimasi Parameter TIP-FTP-UB

Estimasi Parameter
Dec 31, 2015
Estimasi Parameter. TIP-FTP-UB. Statistika Inferensial. Terbagi dua bagian : Estimasi ( estimation ) Uji hipotesis ( test of hypotheses ). Estimasi. Terbagi menjadi dua bagian : Estimasi titik Estimasi interval. Point & Interval Estimation…. - PowerPoint PPT Presentation
Welcome message from author
This document is posted to help you gain knowledge. Please leave a comment to let me know what you think about it! Share it to your friends and learn new things together.
Transcript
Estimasi ParameterTIP-FTP-UB

Statistika Inferensial
Terbagi dua bagian:Estimasi (estimation)Uji hipotesis (test of hypotheses)

Estimasi
Terbagi menjadi dua bagian:Estimasi titikEstimasi interval

10.4
Point & Interval Estimation…For example, suppose we want to estimate the mean summer income of a class of business students. For n=25 students, mean income is calculated to be 400 $/week.
point estimate interval estimate
An alternative statement is:
The mean income is between 380 and 420 $/week.
EstimatorQualities desirable in estimators: UnbiasedAn unbiased estimator of a population parameter is an estimator whose expected value is equal to that parameter.Jadi jika adalah parameter dan adalah estimator unbiased dari parameter apabila dipenuhi . ConsistentAn unbiased estimator is said to be consistent if the difference between the estimator and the parameter grows smaller as the sample size grows larger. Relatively efficientIf there are two unbiased estimators of a parameter, the one whose variance is smaller is said to be relatively efficient.

Estimasi titikSebuah nilai tunggal yang
digunakan untuk mengestimasi sebuah parameter disebut titik estimator (atau cukup estimator), sedangkan proses untuk mengestimasi titik disebut estimasi titik (point estimation).
Estimasi TitikDapat dibuktikan bahwa adalah
estimator tak bias dari dan adalah estimator tak bias dari .
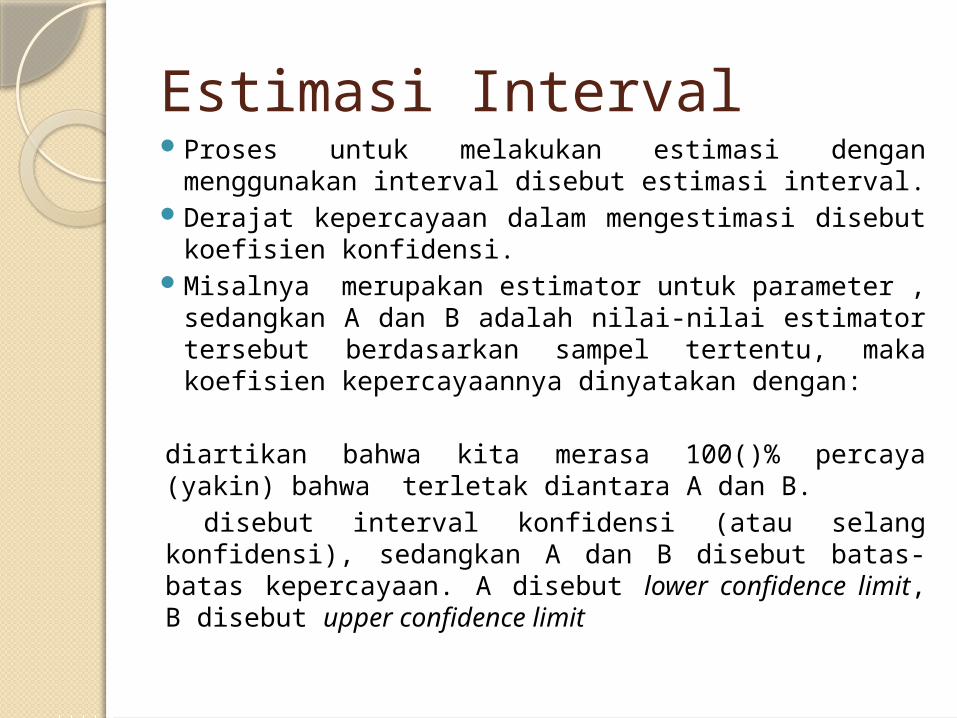
Estimasi Interval Proses untuk melakukan estimasi dengan
menggunakan interval disebut estimasi interval. Derajat kepercayaan dalam mengestimasi disebut
koefisien konfidensi. Misalnya merupakan estimator untuk parameter ,
sedangkan A dan B adalah nilai-nilai estimator tersebut berdasarkan sampel tertentu, maka koefisien kepercayaannya dinyatakan dengan:
diartikan bahwa kita merasa 100()% percaya (yakin) bahwa terletak diantara A dan B. disebut interval konfidensi (atau selang konfidensi), sedangkan A dan B disebut batas-batas kepercayaan. A disebut lower confidence limit, B disebut upper confidence limit
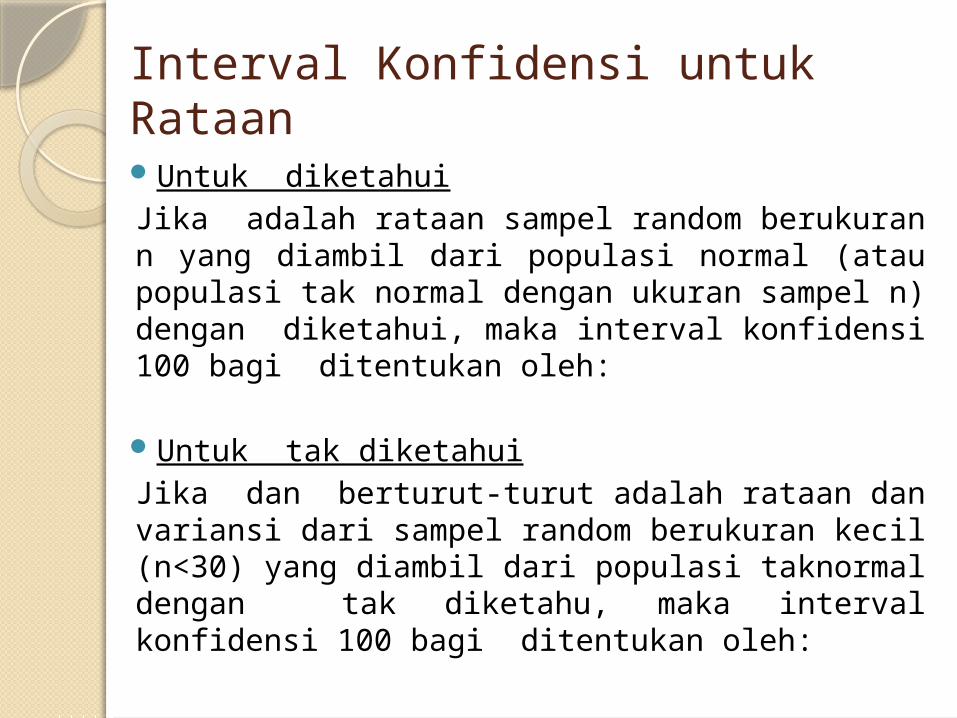
Interval Konfidensi untuk Rataan
Untuk diketahuiJika adalah rataan sampel random berukuran n yang diambil dari populasi normal (atau populasi tak normal dengan ukuran sampel n) dengan diketahui, maka interval konfidensi 100 bagi ditentukan oleh:
Untuk tak diketahuiJika dan berturut-turut adalah rataan dan variansi dari sampel random berukuran kecil (n<30) yang diambil dari populasi taknormal dengan tak diketahu, maka interval konfidensi 100 bagi ditentukan oleh:
10.10
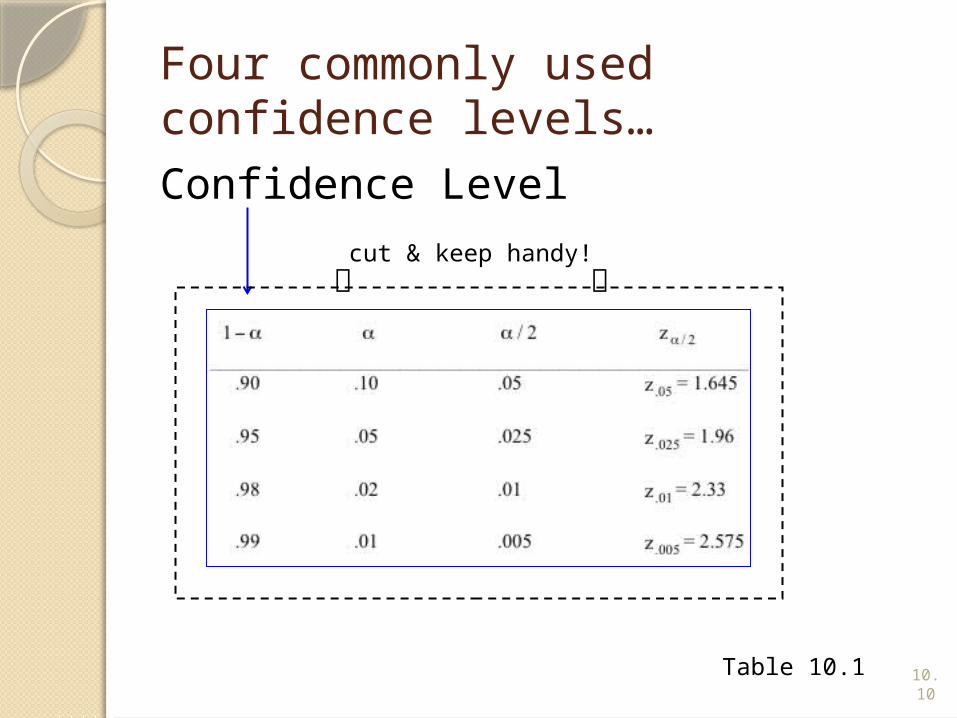
Four commonly used confidence levels…Confidence Level
cut & keep handy!
Table 10.1

10.11
Example 1A computer company samples demand during lead time over 25 time periods:
It is known that the standard deviation of demand over lead time is 75 computers. We want to estimate the mean demand over lead time with 95% confidence in order to set inventory levels…
235 374 309 499 253421 361 514 462 369394 439 348 344 330261 374 302 466 535386 316 296 332 334
10.12
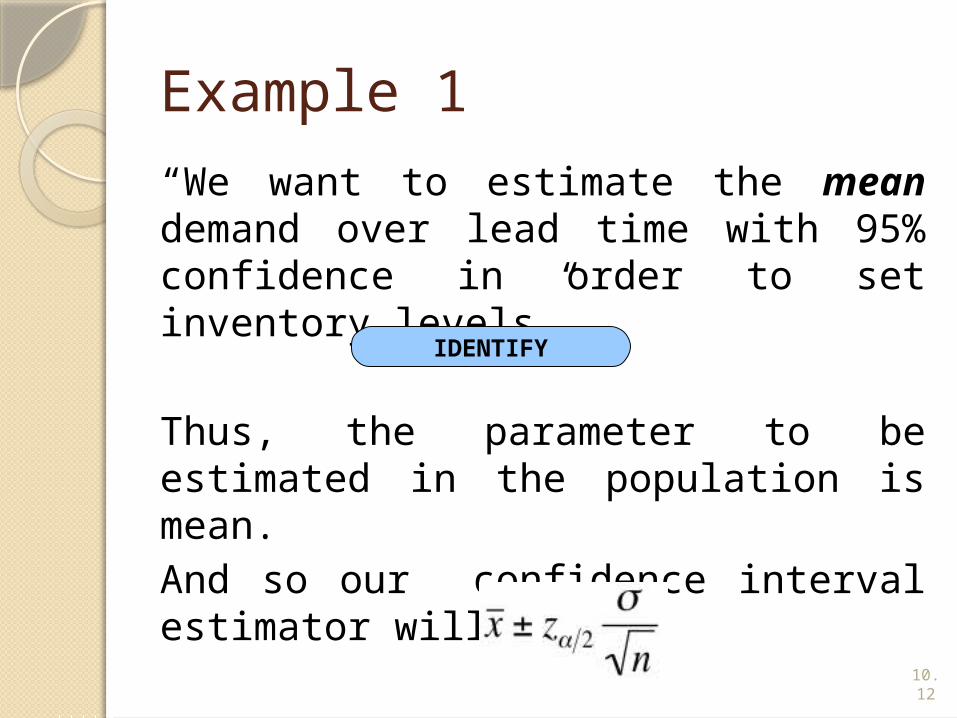
Example 1
“We want to estimate the mean demand over lead time with 95% confidence in order to set inventory levels”
Thus, the parameter to be estimated in the population is mean.And so our confidence interval estimator will be:
IDENTIFY

10.13
Example 1In order to use our confidence interval estimator, we need the following pieces of data:
therefore:
The lower and upper confidence limits are 340.76 and 399.56.
370.16
1.96
75
n 25 Given
Calculated from the data…

10.14
Interval Width…A wide interval provides little information.For example, suppose we estimate with 95% confidence that an accountant’s average starting salary is between $15,000 and $100,000.
Contrast this with: a 95% confidence interval estimate of starting salaries between $42,000 and $45,000.
The second estimate is much narrower, providing accounting students more precise information about starting salaries.
10.15
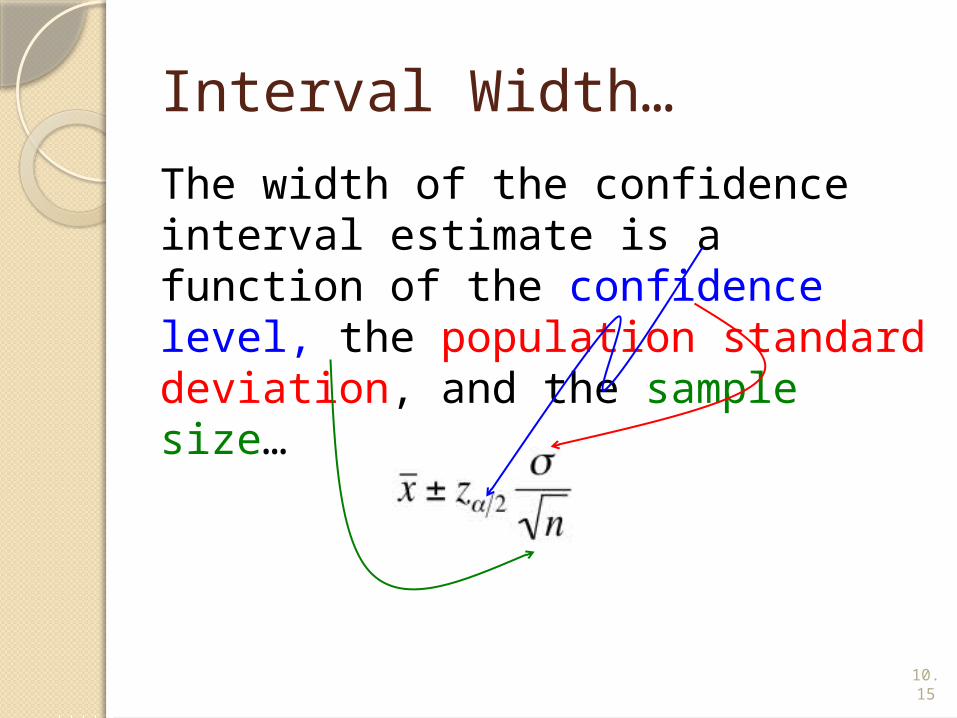
Interval Width…
The width of the confidence interval estimate is a function of the confidence level, the population standard deviation, and the sample size…

10.16
Interval WidthThe width of the confidence interval estimate is a function of the confidence level, the population standard deviation, and the sample size
A larger confidence levelproduces a w i d e r confidence interval:
10.17
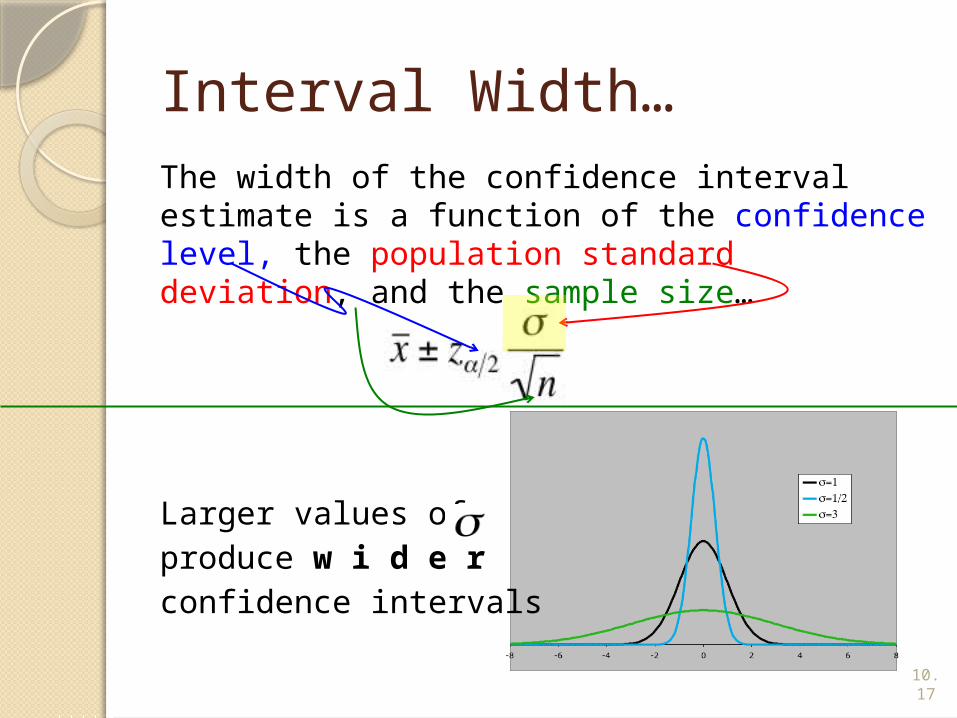
Interval Width…The width of the confidence interval estimate is a function of the confidence level, the population standard deviation, and the sample size…
Larger values of produce w i d e r confidence intervals
10.18
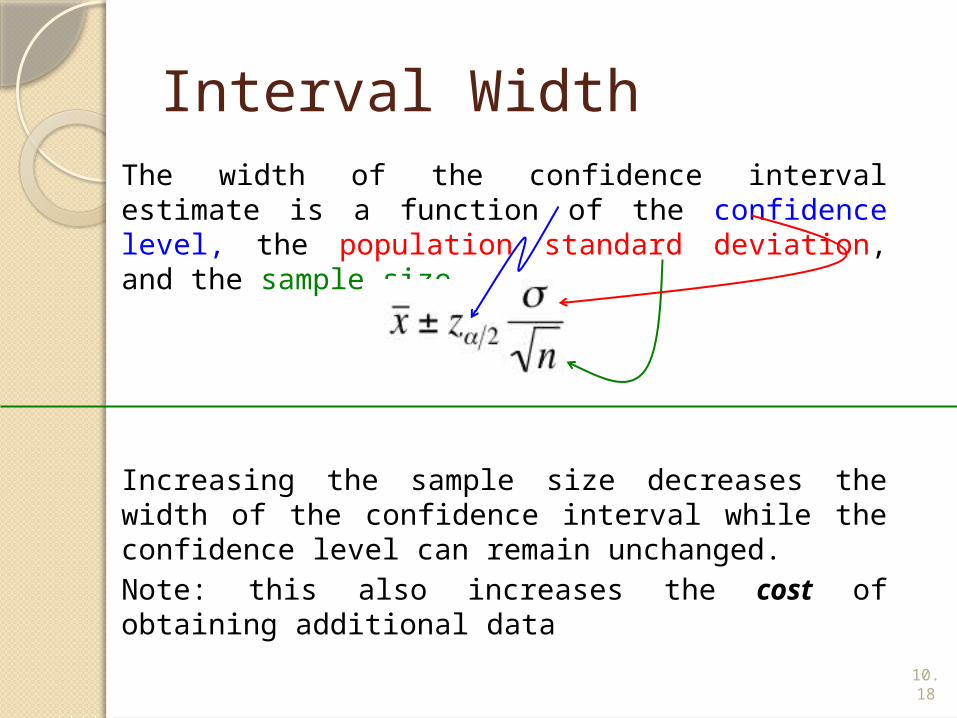
Interval WidthThe width of the confidence interval estimate is a function of the confidence level, the population standard deviation, and the sample size
Increasing the sample size decreases the width of the confidence interval while the confidence level can remain unchanged.Note: this also increases the cost of obtaining additional data
10.19
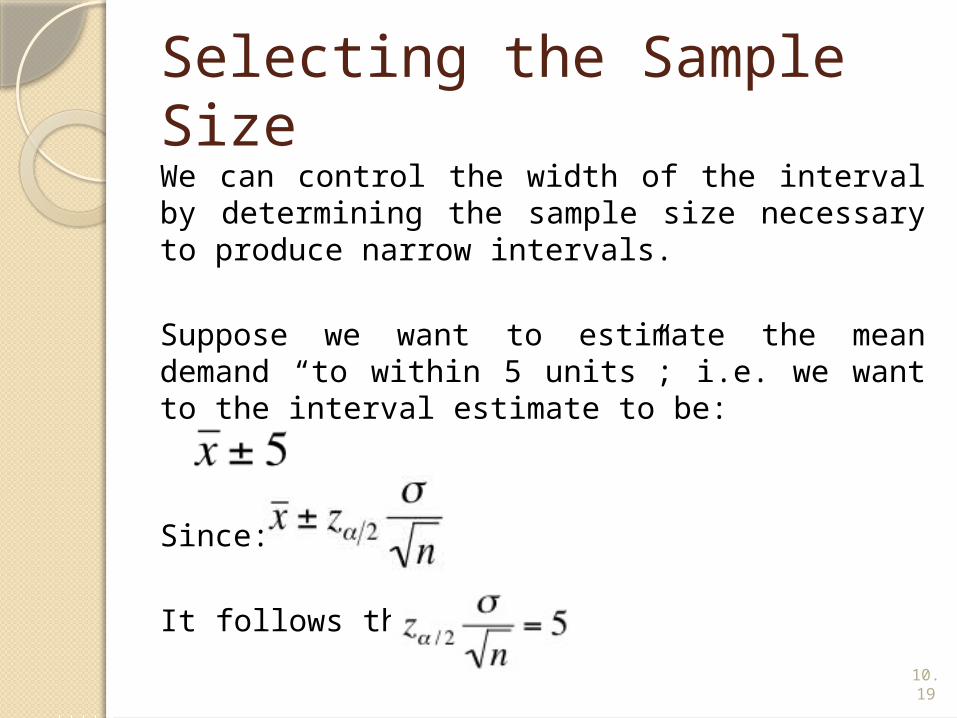
Selecting the Sample SizeWe can control the width of the interval by determining the sample size necessary to produce narrow intervals.
Suppose we want to estimate the mean demand “to within 5 units”; i.e. we want to the interval estimate to be:
Since:
It follows that
10.20
Selecting the Sample Size
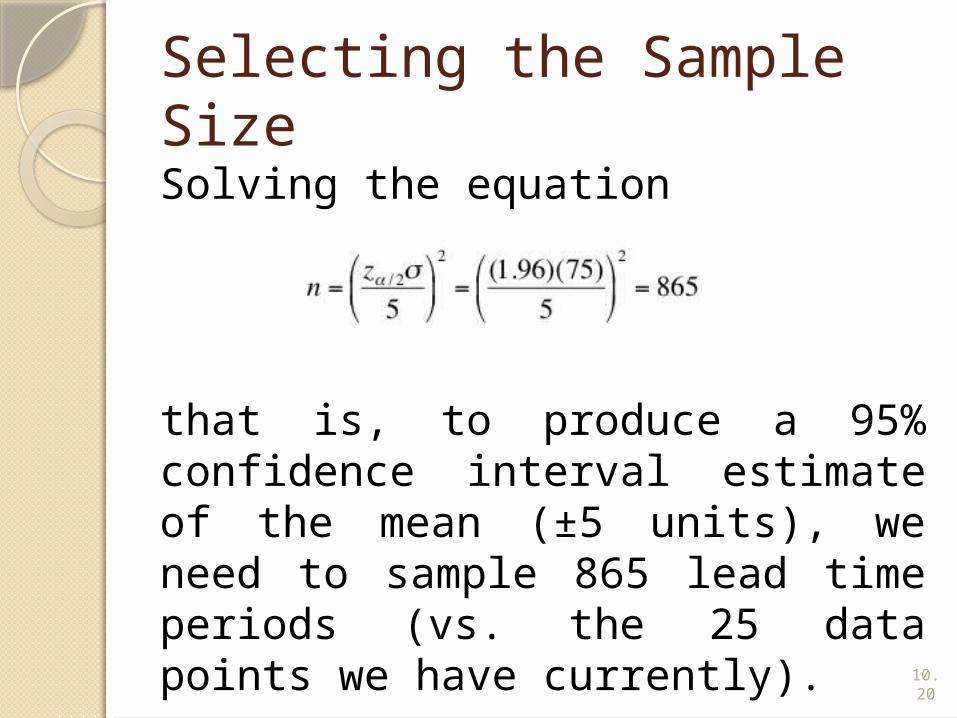
Solving the equation
that is, to produce a 95% confidence interval estimate of the mean (±5 units), we need to sample 865 lead time periods (vs. the 25 data points we have currently).
10.21
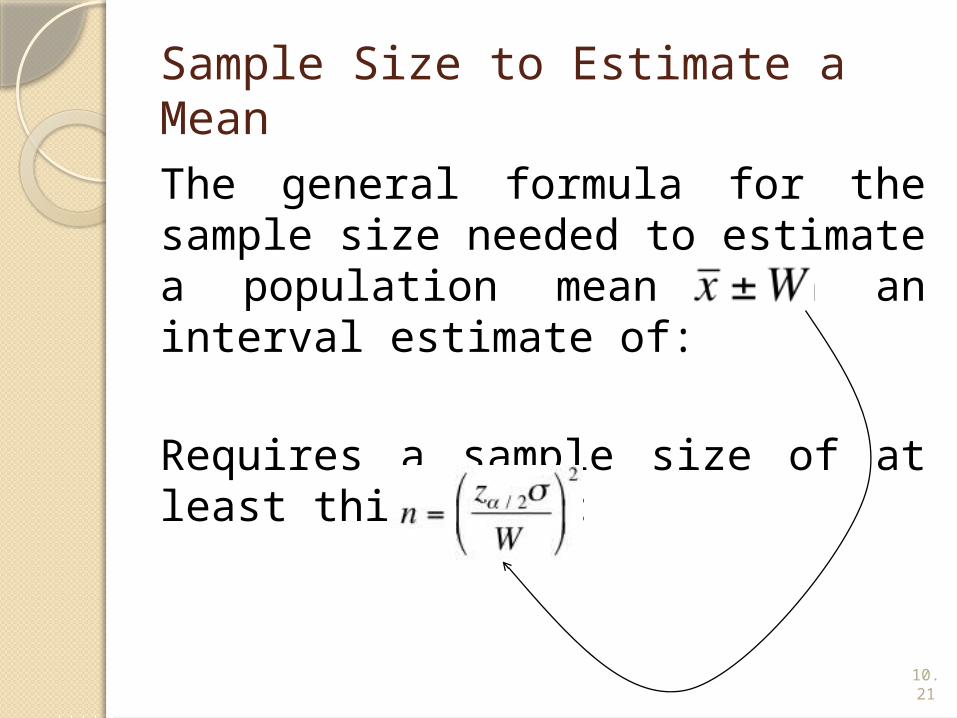
Sample Size to Estimate a Mean
The general formula for the sample size needed to estimate a population mean with an interval estimate of:
Requires a sample size of at least this large:

10.22
Example 2
A lumber company must estimate the mean diameter of trees to determine whether or not there is sufficient lumber to harvest an area of forest. They need to estimate this to within 1 inch at a confidence level of 99%. The tree diameters are normally distributed with a standard deviation of 6 inches.
How many trees need to be sampled?

10.23
Example 2Things we know:
Confidence level = 99%, therefore =.01
We want , hence W=1.
We are given that = 6.
1

10.24
Example 2
We compute
That is, we will need to sample at least 239 trees to have a 99% confidence interval of
1
Related Documents