Esterline explained.

Welcome message from author
This document is posted to help you gain knowledge. Please leave a comment to let me know what you think about it! Share it to your friends and learn new things together.
Transcript
Esterline explained.

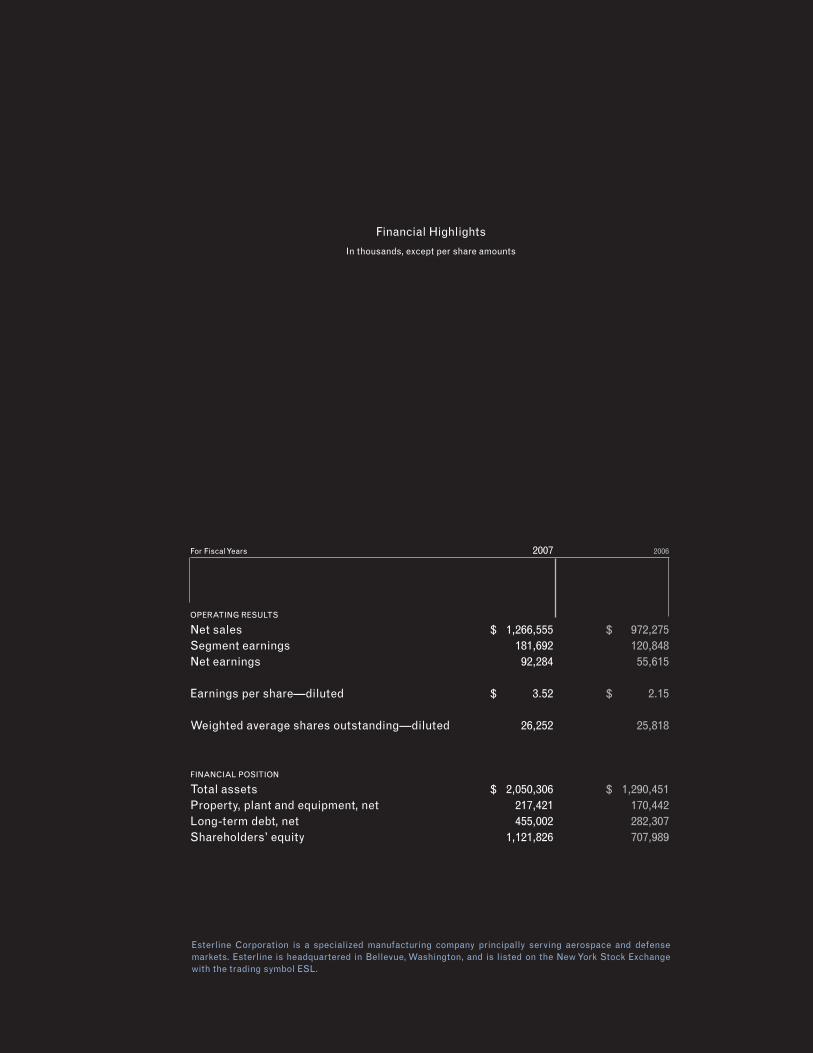
For Fiscal Years 2007 2006
OPERATING RESULTS
Net sales $ 1,266,555 $ 972,275Segment earnings 181,692 120,848Net earnings 92,284 55,615
Earnings per share—diluted $ 3.52 $ 2.15
Weighted average shares outstanding—diluted 26,252 25,818
FINANCIAL POSITION
Total assets $ 2,050,306 $ 1,290,451Property, plant and equipment, net 217,421 170,442Long-term debt, net 455,002 282,307Shareholders’ equity 1,121,826 707,989
Financial Highlights
In thousands, except per share amounts
Esterline Corporation is a specialized manufacturing company principally serving aerospace and defense markets. Esterline is headquartered in Bellevue, Washington, and is listed on the New York Stock Exchange with the trading symbol ESL.

To Our Shareholders
Ten years ago, the senior management team designed a strategy to create the kind of corporation that we would like to invest in. That company would focus its efforts on developing highly en-gineered solutions for aerospace and defense markets. A broad customer base and balanced structure would promise growth and stability in the up and down cycles inherent in these markets. By establishing and following best practices, the company would at-tract and retain the top talent so crucial to ensuring continuous innovation. An unremitting focus on lifelong training and operat-ing effectiveness would enable the company to grow from within. In addition, the company would seek out acquisitions to comple-ment and expand its capabilities. These acquisitions would allow it to better achieve the critical mass necessary to make it a primary source not only for highly engineered components, but for entire subassemblies and systems aimed at market niches in which the company could become a significant and even dominant player. Finally, the strategy would multiply the opportunities for steady growth by shaping the company as a truly global player built spe-cifically to address the emerging business trends that drive its customers. This strategy has been at work for a decade. And the company it has helped build is Esterline.
The realization of our strategy—and the successful transformation of Esterline—began in 1997, when we decided to sell or discontinue eight non-core holdings and essentially shrink our company by more than half, from $350 million to $155 million in sales. Some may have thought this was a bold or even risky move; we believed it was essential.
We understood that we are only as good as our relationships with our cus-tomers. When we looked at the number of industries Esterline was com-peting in, it was apparent to our senior team that we could never become the best-in-class company that we visualized if we continued to spread ourselves over so many diverse markets. We also saw that we could nev-er perform at the level necessary without highly talented and motivated employees capable of meeting and even setting the pace of industry-wide change. We chose to focus on our strongest suits: aerospace and defense. Year by year, we sharpened that focus as we broadened our capabilities, and now Esterline is a comprehensive source for highly specialized solu-tions for cockpits, jet engines, and complex advanced materials.
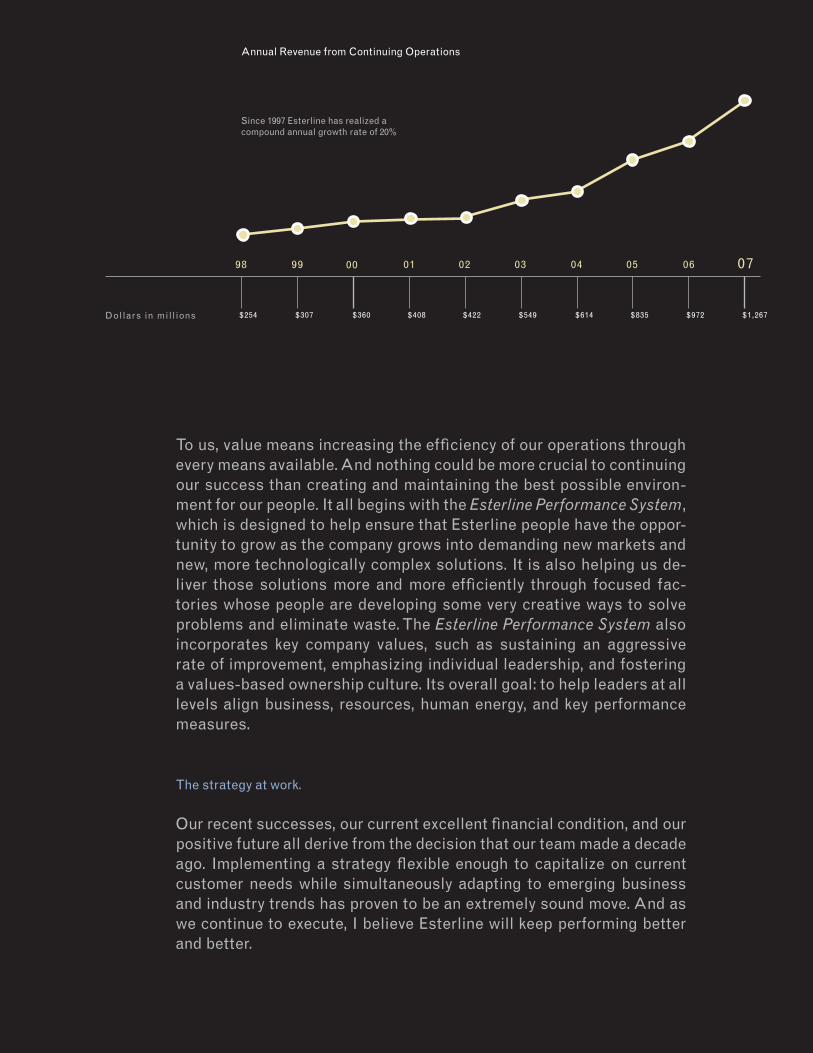
Esterline now combines balance and focus to deliver excellent value to our customers and our investors. The tangible effect of our accomplish-ments is in the numbers. In 2007, Esterline crossed the $1 billion thresh-old, with sales of $1.27 billion. Net earnings were $92.3 million, or $3.52 per diluted share. That performance compares to last year’s net earnings of $55.6 million, or $2.15 per share, on sales of $972.3 million. Our back-log strength, which is one of the indicators we use to measure forward momentum, also grew and now totals $985 million. That’s an increase of nearly 51% over the previous year.
Balance means stability.
With roughly 40% of our revenues coming from commercial aerospace, 40% from defense, and 20% from applying these technologies to primar-ily medical markets, Esterline is a very well balanced company. Our busi-ness is spread across hundreds of programs, with no single platform accounting for more than 3% of revenue. We’re also geographically bal-anced, with about half of our sales originating outside or exported from the United States. In 2007, the bulk of our foreign sales came from the United Kingdom, France, and Canada.
3
Esterline’s largest single customer is the U.S. Department of Defense, which accounted for about 10% of sales in 2007. Our balance extends even here, however, as we are not tied to any one major program. In fact, we supply products to literally hundreds of programs. If the U.S. Depart-ment of Defense authorizes new systems, we’ll expect to be part of them. If it elects instead to retrofit existing systems, we’ll be part of that effort as well. And there is a steadily growing need for our replacement parts.
It’s equally important to remember that one of the key drivers we an-ticipated in reshaping Esterline is the profound change in the way air-frame manufacturers are doing business. It was not so long ago that nearly all development was done by our customers, in house. At that time, Esterline would be given a complete set of plans and told to sim-ply “build it.” But now we are asked to be an active partner in designing and building entire systems, including the software that not only runs our system, but seamlessly integrates it with other systems. As our customers continue to outsource more and more design, engineering, and software development, Esterline is well positioned to benefit.
Current commercial aerospace markets are robust, and we believe this strength will continue as airlines, particularly in the U.S., increase the pace of new orders over the next several years. We anticipate that new-er, more fuel efficient aircraft will prove to have significant competitive advantages, and the increasing demand for new regional jets, business jets, light jets, and commercial helicopters, as well as added pressure to upgrade legacy aircraft, will add up to continued strong demand for everything Esterline does.
4
A constant focus on adding the right capabilities.
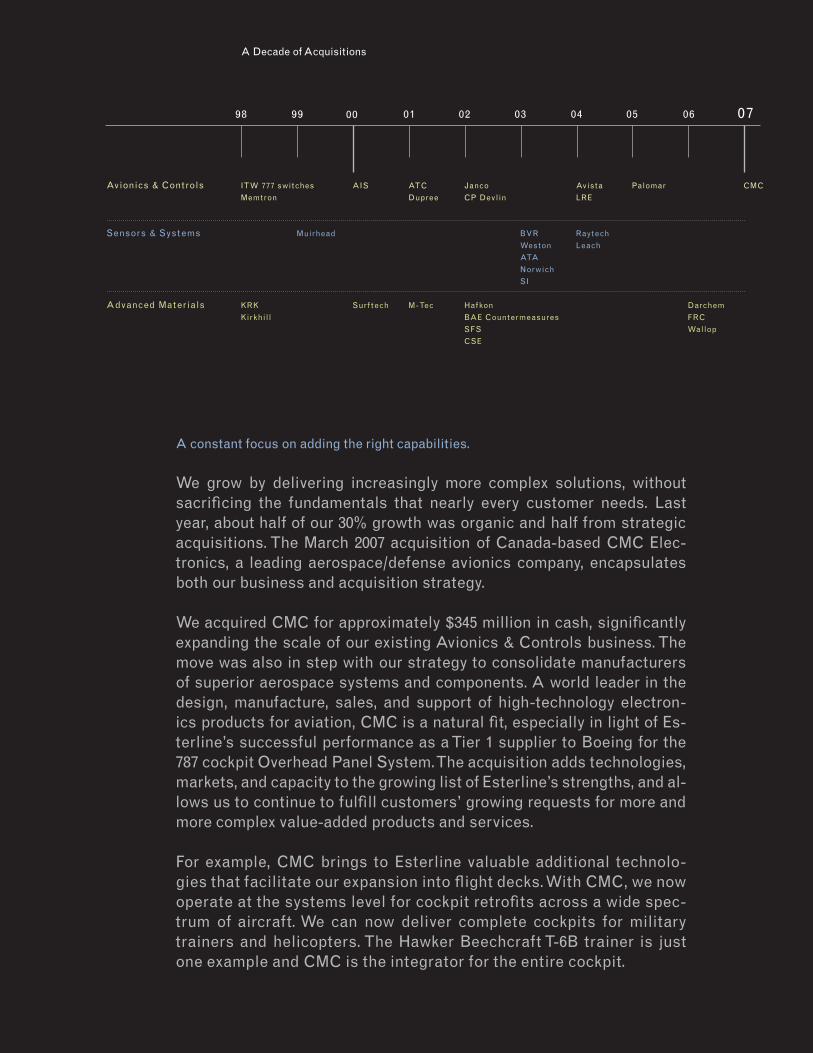
We grow by delivering increasingly more complex solutions, without sacrificing the fundamentals that nearly every customer needs. Last year, about half of our 30% growth was organic and half from strategic acquisitions. The March 2007 acquisition of Canada-based CMC Elec-tronics, a leading aerospace/defense avionics company, encapsulates both our business and acquisition strategy.
We acquired CMC for approximately $345 million in cash, significantly expanding the scale of our existing Avionics & Controls business. The move was also in step with our strategy to consolidate manufacturers of superior aerospace systems and components. A world leader in the design, manufacture, sales, and support of high-technology electron-ics products for aviation, CMC is a natural fit, especially in light of Es-terline’s successful performance as a Tier 1 supplier to Boeing for the 787 cockpit Overhead Panel System. The acquisition adds technologies, markets, and capacity to the growing list of Esterline’s strengths, and al-lows us to continue to fulfill customers’ growing requests for more and more complex value-added products and services.
For example, CMC brings to Esterline valuable additional technolo-gies that facilitate our expansion into flight decks. With CMC, we now operate at the systems level for cockpit retrofits across a wide spec-trum of aircraft. We can now deliver complete cockpits for military trainers and helicopters. The Hawker Beechcraft T-6B trainer is just one example and CMC is the integrator for the entire cockpit.
07060504030201009998
A Decade of Acquisitions
Avionics & Controls ITW 777 switches AIS ATC Janco Avista Palomar CMC
Memtron Dupree CP Devlin LRE
Sensors & Systems Muirhead BVR Raytech
Weston Leach
ATA
Norwich
SI
Advanced Materials KRK Surf tech M-Tec Haf kon Darchem
Kirkhil l BAE Countermeasures FRC
SFS Wallop
CSE
But the real attraction of CMC—and an attribute we look for in every ac-quisition—is that CMC helps us keep offering more complex solutions by adding to our systems integration capability, brainware, and applica-tions engineering. When we offer such integrated services to custom-ers, we dramatically differentiate ourselves. It also fits our strategy of focusing on technology niches we know and can dominate—adding to those we already do. Focusing on what we do best—aerospace and de-fense—enables us to add shipset content, win more outsourced work, and become a true global consolidator.
Adding value in everything we do.
We provide our customers with added value by focusing on products, sys-tems, and services that are critical to the performance of their products. This strategy moves Esterline up the value chain and makes us a more effective and essential partner to our customers. That, in turn, enables us to provide value to our investors by maximizing our many sole and near-sole source positions and by pursuing selective Tier 1 positions.
Each one of these opportunities can lead to others, allowing us to add value in new ways. Our success with the Boeing 787 overhead panel gives us leverage on future narrow-body design assignments. Our work on the Airbus A400M military transport has led to opportunities with Eurocopter. And the solutions we’re providing for both Russia’s and Chi-na’s new regional jets open doors to even broader world markets.
6
To us, value means increasing the efficiency of our operations through every means available. And nothing could be more crucial to continuing our success than creating and maintaining the best possible environ-ment for our people. It all begins with the Esterline Performance System, which is designed to help ensure that Esterline people have the oppor-tunity to grow as the company grows into demanding new markets and new, more technologically complex solutions. It is also helping us de-liver those solutions more and more efficiently through focused fac-tories whose people are developing some very creative ways to solve problems and eliminate waste. The Esterline Performance System also incorporates key company values, such as sustaining an aggressive rate of improvement, emphasizing individual leadership, and fostering a values-based ownership culture. Its overall goal: to help leaders at all levels align business, resources, human energy, and key performance measures.
The strategy at work.
Our recent successes, our current excellent financial condition, and our positive future all derive from the decision that our team made a decade ago. Implementing a strategy flexible enough to capitalize on current customer needs while simultaneously adapting to emerging business and industry trends has proven to be an extremely sound move. And as we continue to execute, I believe Esterline will keep performing better and better.
07060504030201009998
Annual Revenue from Continuing Operations
Since 1997 Esterline has realized a compound annual growth rate of 20%
$972$835$614$549$422$408$360$307$254 $1,267Dollars in mill ions

Looking ahead, I see Esterline extremely well positioned for future growth. Our research and development investments, which peaked in 2007 at around 6% of sales, are now returning to more traditional levels in the 4-5% range. The results vastly transformed the scope of work for which Esterline is now suited, and positioned the company to participate at even higher levels on new and existing platforms—from commercial transports to unmanned military vehicles, and everything in between.
I also see an incredibly talented group of people around the world who are devoted to keeping their customers happy and Esterline at the forefront. While it was the senior management team that developed Esterline’s strategy, it was the dedication and creativity of all Esterline employees that brought it to life. They’re some of the very best at what they do, and I thank them for their imagination, their diligence, and their hard work.
We begin fiscal 2008 with a system that works, with solid long-term plans, with balance and focus—all creating value in hundreds of ways, every day, throughout the world, for our customers and our investors.
Robert W. CreminChairman, President and Chief Executive Officer
8
Esterline explained.
+
40. 40. 20
50/50
=
$
100s
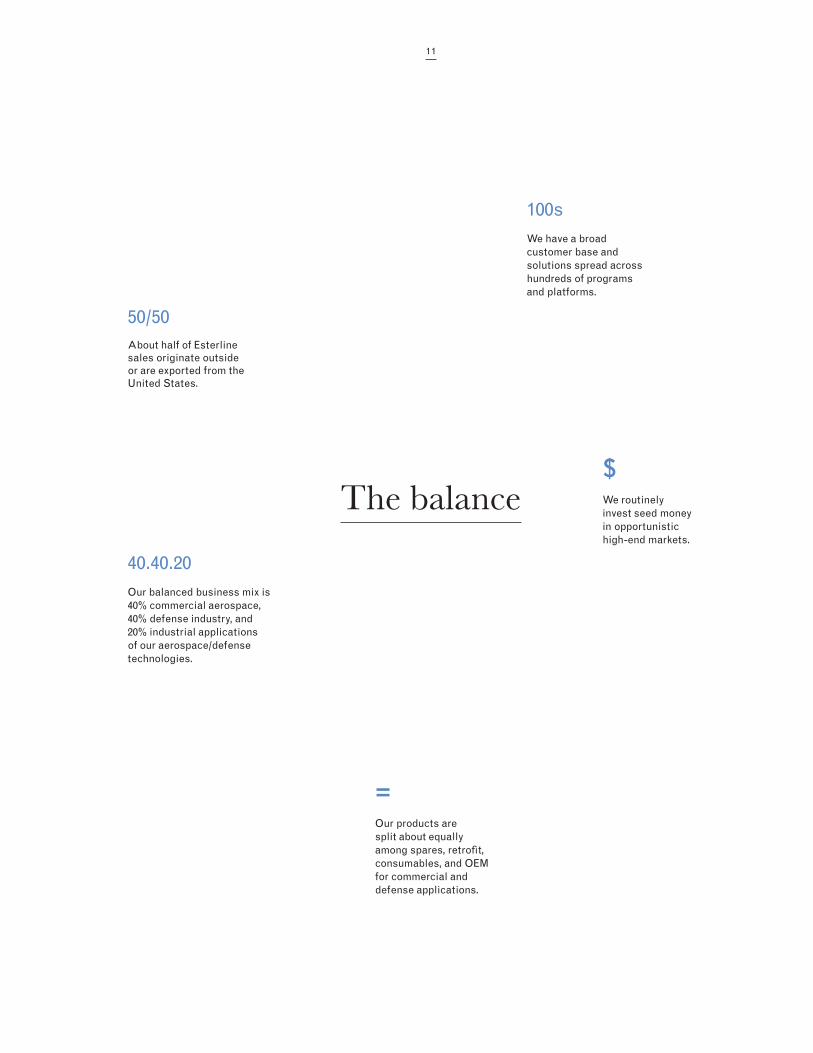
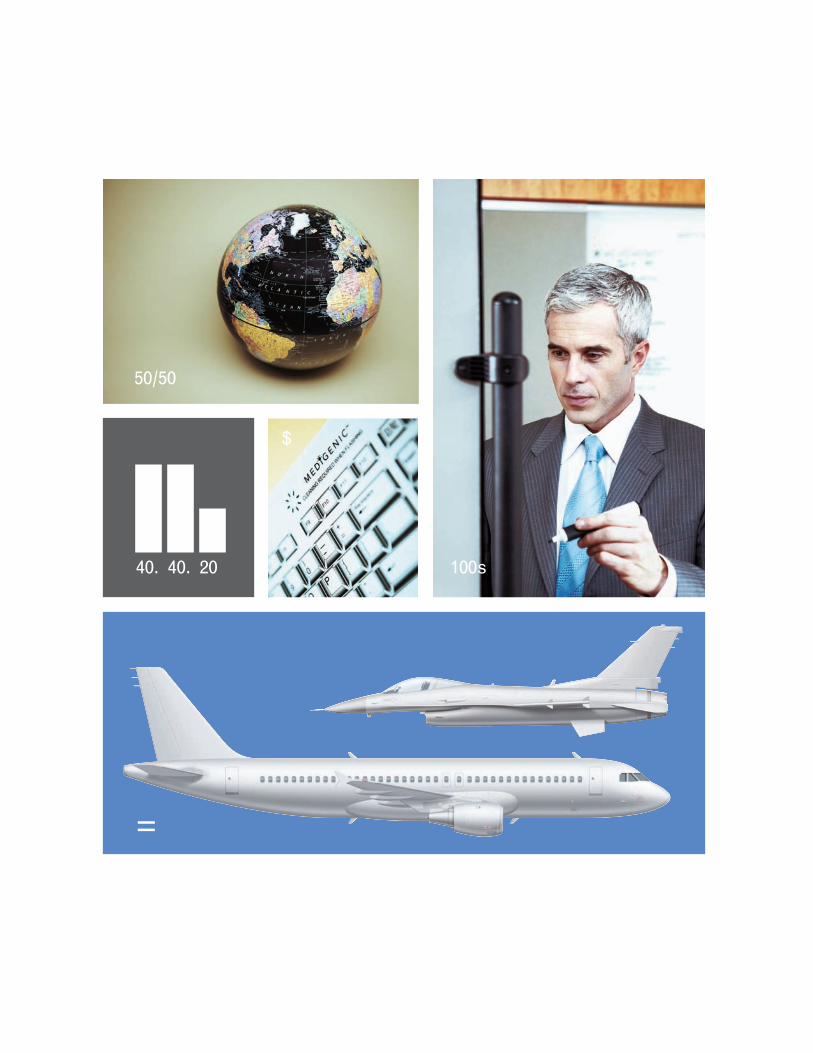
$We routinely invest seed money in opportunistic high-end markets.
The balance
40.40.20Our balanced business mix is 40% commercial aerospace, 40% defense industry, and 20% industrial applications of our aerospace/defensetechnologies.
100sWe have a broad customer base and solutions spread across hundreds of programs and platforms.
=Our products are split about equally among spares, retrofit, consumables, and OEM for commercial and defense applications.
50/50About half of Esterline sales originate outside or are exported from the United States.
11
across businesses, markets and solutions.
Balance is defined as a state of equilibrium or a stable system. That’s exactly what we were aiming for in 1997 when we decided to sell or discontinue eight non-core holdings and begin to focus on our strengths: commercial aerospace and defense.
The idea worked. Most of our revenues—about 80%—are split evenly between these two markets. The rest primarily comes from medical applications that incorporate the advanced tech-nologies we have developed for the aerospace and defense markets. For instance, we have developed an innovative keyboard for use in hospitals to help reduce the serious problem of hospital-acquired infections. This product leverages our experience in specialized human-machine interface technology, as well as our expertise in sensors and advanced materials.
We have a broad customer base and provide solutions for hundreds of platforms, from indi-vidual illuminated pushbutton switches to special-ized elastomers to entire systems, complete with software. This balanced approach—no single program represents more than 3% of our total rev-enue—helps protect us from market fluctuations.
Over the last ten years, we have continu-ally expanded our geographic coverage. Today about half of our sales originate outside or are exported from the United States.
The hundreds of different products that we manufacture fall into three main catego-ries: aircraft cockpits, jet engines, and complex advanced materials. Across these products and categories, we place roughly equal emphasis on aftermarket spare parts, retrofits, consumables, and custom specialized products for original equipment manufacturers, including Boeing, Airbus, and Lockheed Martin. Spreading our product development and manufacturing in this way minimizes the impact of changing customer requirements—we can provide new systems as well as retrofits to existing systems. And we have a robust spare parts business.
Our diversification across end markets, customers, platforms, and geographies is a tangible demonstration of the strategy we devel-oped ten years ago. It’s a balanced model that has proven to be a very effective way to counter the effects of business cycles that are a natural part of the markets we serve.
12

Our balanced approach helps create stability through aerospace and defense market cycles.

>
r&d
+
hi / lo
niches

r&d
By emphasizing research and development around specific customer programs, our internal product teams have helped us gain valuable Tier 1 projects.
The focus>The broader the range of solutions we can provide to our customers, the more Esterline moves up the value chain and becomes a more effective partner.
hi / loOur focused factories specialize in high mix / low volume manufacturing.
+Our emphasis on solving the tough problems for our aerospace and de-fense customers enables us to continually add shipset content.
nichesWe specialize in techno-logical niches we know and either dominate or can become dominant: Avionics & Controls, Sensors & Systems, and Advanced Materials.
15
on R&D, technology and capacity.
We set ourselves apart and establish Esterline as an essential partner by focusing on three technological niches in our commercial and defense businesses: cockpit components, jet engine sensors, and complex advanced materi-als. We don’t just focus on these niches: we dominate them. We currently hold the #1 or #2 market share in each of them.
Our Avionics & Controls segment offers the widest range of cockpit and flight deck products in the industry. This breadth of products, com-bined with their proven quality and reliability, generates annual sales of about $500 million. Just as important, our ability to provide complete integrated solutions has enabled Esterline to gain Tier 1 status on key programs at Airbus and Boeing.
Our Sensors & Systems segment has grown by more than 300% over the last five years. This segment contributed sales of approximately $380 million in 2007 and has achieved a Tier 1 position at Airbus for its work on the A400M military transporter. And, our Advanced Materi-als segment has roughly tripled its revenues in five years, reporting sales of nearly $430 million in 2007.
Part of this growth was a result of our acquisition strategy, which assembles related
companies with excellent engineering capability. This approach provides customers with superior solutions and enables us to win business that would otherwise have been out of reach.
Focusing on areas in which we excel trans-lates into added shipset content on a number of programs. For example, over the last three years Esterline content is up more than 100% on the Boeing 777, 250% on the Airbus A330, and nearly 200% on the Airbus A320. The more we enhance our capabilities and the more solutions we provide, the more opportunities we will have to effectively serve our customers.
We believe in focus in our research and development efforts, too. By determining what our customers need and then targeting our R&D to address those needs, we can offer a more comprehensive toolkit of solutions and move up the value chain while positioning ourselves for major systems integration work and selective Tier 1 positions.
Combining our proprietary technology with a unique manufacturing approach doesn’t just build superior products. It also builds competi-tive barriers. Our focused factories, with their high mix/low volume expertise, deliver what are, in essence, custom solutions for every customer.It’s a combination that’s hard to beat. Very hard.
16

Continually focusing on enhancing the range of capabilities we offer ourcustomers has enabled us to dominate our technological market niches.

+
M&A
EPS
$
IQ
+Focusing on products, systems, and services that are critical to per-formance enables us to gain—and leverage—sole and near-sole source positions.
The value
IQWe continue to evolve from critical components to systems integration by providing our customers with increasingly smarter products.
EPSIt’s not just earnings per share, it’s the Esterline Performance System. EPS is our original approach to keeping our people engaged while increasing efficiency.
1Our decision to pursue selective Tier 1 positions has enabled us to gain work on the Boeing 787 flight deck, Airbus A400M, and China’s ARJ-21.
M&AOur acquisition strategy seeks out companies that complement and expand our talent pool and capabilities.
19
that our strategy creates.
Our strategy is simple: focus on products, systems, and services that are critical to per-formance. It’s a strategy that adds value for our customers while making Esterline an increasing-ly valuable partner. This approach has enabled us to gain and leverage a number of sole and near-sole source positions.
It was a natural evolution to provide our customers with even greater value by deliver-ing not just individual components, but entire subsystems by pursuing selective Tier 1 posi-tions. These projects have the potential to lead to additional work—our work on the Boeing 787 overhead panel enables us to provide similar systems on future narrow-body airplanes, and our work on the Airbus A400M opens doors to similar projects at Eurocopter.
We also add value and increase efficiency with a business management system we call the Esterline Performance System. It’s designed to
help us achieve the highest possible customer, investor, and employee satisfaction while ensur-ing that Esterline platforms, operating units, and individuals conform to the business philosophy and organizational values we have established over the past decade.
In the last ten years, Esterline has suc-cessfully integrated 30 acquisitions with annual revenues exceeding $500 million, while divesting 16 operations with annual revenues of more than $200 million that did not fit our strategy. Our targeted acquisition approach involves growing Esterline’s core aerospace and defense business or acquiring businesses that provide opportunity to migrate our core technologies into high-end industrial markets.
Our acquisitions, as with everything we do, are designed to add value to the solutions we provide to our customers. Simply put, if itdoesn’t add value, we don’t do it.
20

We are always exploring new ways to provide more and better solutions to ourcustomers while operating as efficiently as possible.
Esterline defined.
Balance. Focus. Value. Ten years ago, those three words launched a strategy that redefined a company.
The result is that we are not a company in search of a strategy. We are completely focused on successfully executing the strategy.
A decade later, it continues to be effec-tive. We still maintain a balanced approach with equal emphasis on aerospace and defense. We still focus our efforts on complex, high technol-ogy solutions that provide effective barriers to entry. And we still search ceaselessly for ways to deliver value to our customers.
Case in point. Our Avionics & Controls segment recently shipped its first flight-ready overhead panel for the Boeing 787 Dreamliner after successfully completing certification test-ing. The weight specification was 92 pounds; we delivered a completed product about 20 pounds lighter. An important measure in an environment where every pound cut means fuel saved.
We believe in a steady, long-term approach. We refuse to deviate from our strategy in order to pursue short-term gain. It’s an approach that’s working—in 2007, we had record growth in every key area: sales, net earnings, and earnings per share.
Achieving that kind of growth takes great people. Talented, well-educated, motivated people. We invest heavily in education and train-ing, and we work hard to make sure people in the companies we acquire understand our company and our culture. We’re justifiably proud of the result of these efforts.
Balance, focus, and value. We have used these concepts to build a strong company that keeps getting stronger. A company witha clear strategy that has been tested and proven in some of the toughest markets on earth.
22

07financials
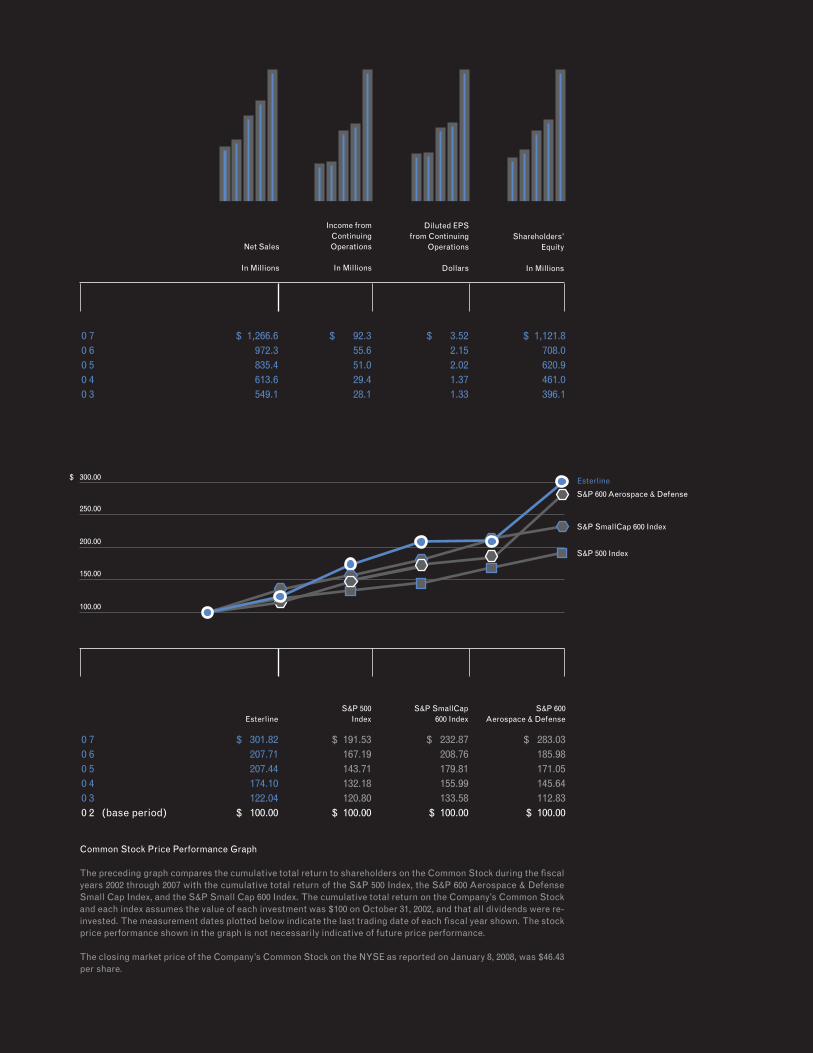
0 7 $ 1,266.6 $ 92.3 $ 3.52 $ 1,121.80 6 972.3 55.6 2.15 708.00 5 835.4 51.0 2.02 620.90 4 613.6 29.4 1.37 461.00 3 549.1 28.1 1.33 396.1
Net Sales
In Millions
Income fromContinuing Operations
In Millions
Diluted EPS from Continuing
Operations
Dollars
Shareholders’ Equity
In Millions
Common Stock Price Performance Graph
The preceding graph compares the cumulative total return to shareholders on the Common Stock during the fiscal years 2002 through 2007 with the cumulative total return of the S&P 500 Index, the S&P 600 Aerospace & Defense Small Cap Index, and the S&P Small Cap 600 Index. The cumulative total return on the Company’s Common Stock and each index assumes the value of each investment was $100 on October 31, 2002, and that all dividends were re-invested. The measurement dates plotted below indicate the last trading date of each fiscal year shown. The stock price performance shown in the graph is not necessarily indicative of future price performance.
The closing market price of the Company’s Common Stock on the NYSE as reported on January 8, 2008, was $46.43 per share.
S&P 500 S&P SmallCap S&P 600
Esterline Index 600 Index Aerospace & Defense
0 7 $ $ $ 301.82 $ 191.53 $ 232.87 $ 283.030 6 8207.71 167.19 208.76 185.980 5 207.44 143.71 179.81 171.050 4 174.10 132.18 155.99 145.640 3 122.04 120.80 133.58 112.830 2 (base period) $ 100.00 $ 100.00 $ 100.00 $ 100.00
Esterline
S&P 500 Index
S&P 600 Aerospace & Defense
S&P SmallCap 600 Index
$ 100.00
$ 300.00
$ 200.00
$ 150.00
$ 250.00

25
Management’s Discussion and Analysis of Financial Condition and Results of Continuing Operations
Overview
We operate our businesses in three segments: Avionics & Controls, Sensors & Systems and Advanced Materials. The Avionics & Controls segment designs and manufactures integrated cockpit systems, technology interface sys-tems for military and commercial aircraft and land- and sea-based military vehicles, secure communications systems, specialized medical equipment, and other industrial applications. The Sensors & Systems segment produces high-precision temperature and pressure sensors, electrical power switching, control and data communication devices, micro-motors, motion control sensors, and other related systems, principally for aerospace and defense customers. The Advanced Materials segment develops and manufactures thermally engineered components and high-perfor-mance elastomer products used in a wide range of commercial aerospace and military applications, combustible ordnance components and electronic warfare countermeasure devices for military customers. All segments include sales to domestic, international, defense and commercial customers.
Our current business and strategic plan focuses on the continued development of our products principally for aerospace and defense markets. We are concentrating our efforts to expand our capabilities in these markets and to anticipate the global needs of our customers and respond to such needs with comprehensive solutions. These efforts focus on continuous research and new product development, acquisitions and establishing strategic realign-ments of operations to expand our capabilities as a more comprehensive supplier to our customers across our entire product offering. On March 14, 2007, we acquired CMC Electronics Inc. (CMC) a manufacturer of high technology avionics including global positioning systems, head-up displays, enhanced vision systems and electronic flight man-agement systems. The acquisition significantly expands the scale of our existing Avionics & Controls business. CMC is included in the Avionics & Controls segment and the results of its operations were included from the effective date of the acquisition. We acquired Wallop Defence Systems Limited (Wallop) and FR Countermeasures on March 24, 2006 and December 23, 2005, respectively. Wallop and FR Countermeasures are manufacturers of military pyro-technic countermeasure devices. The acquisitions strengthen our international and U.S. position in countermeasure devices. Wallop and FR Countermeasures are included in our Advanced Materials segment. On December 16, 2005, we acquired Darchem Holdings Limited (Darchem), a manufacturer of thermally engineered components for critical aerospace applications. Darchem holds a leading position in its niche market and fits our engineered-to-order model and is included in our Advanced Materials segment.
26
Net earnings for fiscal 2007 were $92.3 million, or $3.52 per diluted share, including a $26.2 million, net of tax or $1.00 per diluted share, insurance recovery, compared with $55.6 million, or $2.15 per diluted share, including a $3.4 million, net of tax or $0.13 per diluted share, insurance recovery in fiscal 2006. Avionics & Controls performance was strong compared to the prior-year period, offset by the effect of the shipment of acquired inventory of CMC which was required to be valued at fair market as of the date of acquisition and the impact of a weakening of the U.S. dollar against the Canadian dollar since the acquisition of CMC. Results in Sensors & Systems improved and Advanced Materials earnings reflected strong sales and earnings, as well as the insurance recovery referenced above. Interest expense increased $14.0 million over the prior-year period, reflecting the cost of financing the CMC acquisition. Net earnings for fiscal 2007 reflected an effective tax rate of 19.6% compared to 22.8% for the prior-year period.
Results of Continuing Operations
Fiscal 2007 Compared with Fiscal 2006
Sales for fiscal 2007 increased 30.3% over the prior year. Sales by segment were as follows:
Increase (Decrease)Dollars In Thousands From Prior Year 2007 2006
Avionics & Controls 60.6% $ 454,520 $ 283,011Sensors & Systems 15.1% 383,477 333,257Advanced Materials 20.4% 428,558 356,007 Total $ 1,266,555 $ 972,275
The 60.6% increase in Avionics & Controls reflected incremental sales from the CMC acquisition in the second quarter of fiscal 2007 and higher sales of cockpit controls and medical equipment devices from new OEM programs as well as strong after-market sales.
The 15.1% increase in Sensors & Systems principally reflected growth in OEM programs for temperature sensors and power distribution devices as well as the effect of exchange rates. Sales in fiscal 2007 reflected a stronger U.K. pound and euro relative to the U.S. dollar, as the average exchange rate from the U.K. pound and euro increased from 1.81 and 1.23, respectively, in fiscal 2006, to 1.98 and 1.34, respectively, in fiscal 2007.
The 20.4% increase in Advanced Materials reflected strong sales across the segment. While combustible ord-nance sales were up modestly compared with the prior year, sales of flare countermeasures and elastomer material were strong, reflecting new OEM programs. Sales of flare countermeasures from our Wallop facility were higher in fiscal 2007 compared to fiscal 2006, but less than our expectations due to the continued shut-down in a portion of the facility.
Sales to foreign customers, including export sales by domestic operations, totaled $668.8 million and $437.0 mil-lion, and accounted for 52.8% and 45.0% of our sales for fiscal 2007 and 2006, respectively.
Overall, gross margin as a percentage of sales was 30.8% and 30.9% in fiscal 2007 and 2006, respectively. Avionics & Controls segment gross margin was 32.9% and 35.3% for fiscal 2007 and 2006, respectively, reflecting the shipment of acquired inventory of CMC, which was valued at fair value at acquisition. In addition, CMC’s gross margins were impacted by the effect of a weaker U.S. dollar compared to the Canadian dollar on U.S. dollar-denominated sales and Canadian-denominated cost of sales. Excluding CMC, Avionics & Controls gross margin was 36.4% and 35.3% for fis-cal 2007 and 2006, respectively, reflecting increased after-market spares sales and pricing strength on certain cockpit control devices, partially offset by a $2.0 million unfavorable estimate to complete adjustment on certain firm fixed-price long-term contracts for the development and manufacture of secure military communications products.
Sensors & Systems segment gross margin was 33.3% and 33.9% for fiscal 2007 and 2006, respectively. The de-crease in Sensors & Systems gross margin from fiscal 2006 reflected lower sales of high-margin pressure sensors and the effect of a weaker U.S. dollar compared with the U.K. pound and euro on U.S.-denominated sales and U.K. pound- and euro-denominated cost of sales. We expect to negotiate higher unit selling prices under certain U.S. dollar-denominated long-term agreements, which expire in December 2007, at our U.K. temperature and pressure sensor operations. Additionally, gross margin in fiscal 2007 was impacted by a $2.1 million contract overrun at a small unit which manufactures precision gears and data concentrators. These decreases were partially offset by improved operating efficiencies at our U.K. temperature and pressure sensor operations and pricing strength at our U.S. manu-facturer of power distribution devices.
Advanced Materials segment gross margin was 26.5% and 24.7% for fiscal 2007 and 2006, respectively. The in-crease in Advanced Materials gross margin was due to strong gross margins at our U.S. flare operations resulting from a more favorable mix of product shipments and improved operating efficiencies at our Arkansas countermea-
27
sure flare operation. Additionally, gross margins improved at our elastomer material operations, reflecting increased recovery of fixed expenses due to strong OEM sales and a shift in sales mix to higher margin space and defense products. Comparing fiscal 2007 to 2006, the increase in gross margin also reflected the impact of the shipment of acquired inventories at Darchem, which were valued at fair market at acquisition in 2006. Gross margin in fiscal 2007 was impacted by the continued shut-down of our advanced flare operations at Wallop as a result of the 2006 explosion and the start-up costs at our FR Countermeasures unit acquired in 2005.
Selling, general and administrative expenses (which include corporate expenses) increased to $209.5 million in fiscal 2007 compared with $159.6 million in fiscal 2006. The increase in selling, general and administrative expenses primarily reflected incremental selling, general and administrative expenses from the CMC, Wallop, and FR Counter-measures acquisitions. The increase in corporate expense principally reflected bank fees associated with the modi-fication of our 2013 note indenture, increased incentive compensation, professional fees, and the cost of an option to buy Canadian dollars to cover a portion of the purchase price of CMC. Post-retirement benefit expense increased $2.2 million reflecting the acquisition of CMC and an adjustment to post-retirement benefit expense of $1.6 million at our temperature and pressure sensor operations. These increases were partially offset by a $2.4 million decrease in pen-sion expense. In fiscal 2006, pension expense included a $1.2 million increase in the Leach pension obligation existing as of the acquisition of Leach in August 2004, which was identified during an audit of its pension plan. Additionally, in fiscal 2006, selling, general and administrative expense included a $1.0 million charge as a result of a customer contract termination. As a percentage of sales, selling, general and administrative expenses were 16.5% and 16.4% in fiscal 2007 and 2006, respectively.
Research, development and related engineering spending increased to $70.5 million, or 5.6% of sales, in fiscal 2007 compared with $52.6 million, or 5.4% of sales, in fiscal 2006. The increase in research, development and related engineering largely reflects spending on the T6-B, A400M primary power distribution assembly, TP400 engine sen-sors, 787 overhead panel control and 787 environmental control programs. Research, development and engineering expense in fiscal 2007 and 2006 is net of $6.7 million and $5.2 million, respectively, in government subsidies. Research, development and engineering spending is expected to be about 5% of sales in fiscal 2008.
Segment earnings (which exclude corporate expenses and other income and expense) increased 50.3% during fiscal 2007 to $181.7 million compared to $120.8 million in the prior year. Business interruption insurance recoveries of $37.5 million were a contributor to this growth, partially offset by losses of $7.6 million at CMC.
Avionics & Controls segment earnings were $49.5 million for fiscal 2007 compared with $45.1 million in fiscal 2006 and reflected strong earnings from our cockpit control and medical equipment operations, partially offset by the ship-ment of acquired inventory of CMC, which was valued at fair value at acquisition. CMC’s earnings were impacted by the effect of a weaker U.S. dollar compared with the Canadian dollar on U.S. dollar-denominated sales and Canadian-denominated cost of sales. Since the acquisition of CMC, the U.S. dollar relative to the Canadian dollar has declined 18.2%. Approximately $94.0 million of CMC’s sales of $128.0 million were denominated in U.S. dollars. Additionally, CMC’s earnings were impacted by significant research and development expenses, principally related to the T6-B program. While CMC’s partial-year results of operations were impacted by the above items, the underlying business is performing well and is meeting our expectations as earnings from CMC’s products, including Flight Management Systems, Global Positioning System Receivers, Satcom antennas, and after-market military engine instruments re-main robust.
Sensors & Systems segment earnings were $34.9 million for fiscal 2007 compared with $29.3 million in fiscal 2006. Operating earnings at our power distribution operation reflected improved results from increased sales from new OEM programs, a $1.0 million reimbursement of research, development and engineering expense negotiated with a customer and price increases, which were partially offset by higher research, development and engineering expenses on the A400M program. Earnings at our temperature and pressure sensors operations increased from 2006, reflect-ing the benefit of reduced indirect labor and research, development and engineering costs, and improved operating efficiencies, partially offset by a post-retirement benefit adjustment of $1.6 million. Sensors & Systems earnings were also impacted by $3.4 million in contract overruns and additional research and development expense at a small unit which manufactures precision gears and data concentrators. Comparing fiscal 2007 to 2006, Sensors & Systems earnings in fiscal 2006 were impacted by a $1.2 million increase in the Leach pension obligation explained above and manufacturing inefficiencies and incremental direct labor costs incurred to reduce delinquent shipments at our tem-perature and pressure sensors operations. Sensors & Systems earnings also reflected the impact of a weaker U.S. dollar relative to the euro and the U.K. pound on U.S. dollar-denominated sales and euro- and U.K. pound-based operating expenses.
Advanced Materials segment earnings were $97.3 million for fiscal 2007 compared with $46.5 million for fiscal 2006, principally reflecting $37.5 million in business interruption insurance recoveries, incremental earnings from our Darchem acquisition and improved earnings from our elastomer and Arkansas countermeasure flare operations. Earnings in both years were impacted by start-up costs at our FR Countermeasures unit and low sales at our Wallop
28
operations. The $37.5 million recovery is related to an explosion that occurred at Wallop on June 26, 2006. Although a portion of the facility is expected to be closed for about two years due to the requirements of the Health Safety Executive (HSE) to review the cause of the accident, normal operations are continuing at unaffected portions of the facility. The HSE investigation will not be completed until a Coroner’s Inquest is filed, possibly in 2008. Although it is not possible to determine the results of the HSE investigation or how the Coroner will rule, management does not expect to be found in breach of the Health & Safety Act related to the accident and, accordingly, no amounts have been recorded for any potential fines that may be assessed by the HSE. The HSE will also review and approve the plans and construction of the new flare facility. The $37.5 million insurance recovery is to reimburse the Company for the loss of earnings and damage to a portion of the facility. We expect construction to be completed by the end of fiscal 2008 and in full production following customary start-up and commissioning activities.
Interest expense increased to $35.3 million during fiscal 2007 compared with $21.3 million in the prior year, reflect-ing increased borrowings to finance the CMC acquisition.
Non-operating expenses in the fourth fiscal quarter of 2007 included a $1.1 million write off of debt issuance costs as a result of the prepayment of our $100.0 million U.S. term loan. Non-operating expense in the first fiscal quarter of 2006 included a $2.2 million prepayment penalty arising from the $40.0 million prepayment of our 6.77% Senior Notes. Both prepayments were recorded as a loss on extinguishment of debt.
The effective income tax rate for fiscal 2007 was 19.6% compared with 22.8% in fiscal 2006. The effective tax rate was lower than the statutory rate, as both years benefited from various tax credits and certain foreign interest expense deductions. In addition, in fiscal 2007, we recognized a $3.4 million reduction of previously estimated income tax li-abilities, which was the result of the following items: a $2.8 million net reduction in deferred income tax liabilities as a result of the enactment of tax laws reducing U.K., Canadian and German statutory corporate income tax rates and a $1.0 million tax benefit as a result of the retroactive extension of the U.S. Research and Experimentation tax credit that was signed into law on December 21, 2006. These benefits were offset by $0.4 million of additional income tax result-ing from the reconciliation of prior-years’ U.S. and foreign income tax returns to the provisions for income taxes. The effective tax rate for fiscal 2007 also reflected CMC’s tax credits and other tax efficiencies. In fiscal 2006, we recognized a $4.5 million reduction of previously estimated tax liabilities, which was the result of the following items: $1.6 million due to the expiration of the statute of limitations and adjustments resulting from a reconciliation of the prior year’s U.S. income tax return to the U.S. provision for income taxes, $2.0 million as a result of receiving a Notice of Proposed Adjustment (NOPA) from the State of California Franchise Tax Board covering, among other items, the examination of research and development tax credits for fiscal years 1997 through 2002, and $0.9 million as a result of a favorable conclusion of a tax examination.
New orders for fiscal 2007 were $1.6 billion compared with $1.1 billion for fiscal 2006. Avionics & Controls orders for fiscal 2007 increased 120.0% from the prior-year period, principally reflecting the CMC acquisition. Sensors & Systems orders for fiscal 2007 increased 26.6% from the prior-year period. Advanced Materials orders for fiscal 2007 decreased 4.0% from the prior-year period due to the timing of receiving orders. Backlog at the end of fiscal 2007 was $985.1 million compared with $653.5 million at the end of the prior year. Approximately $253.7 million is scheduled to be delivered after fiscal 2008. Backlog is subject to cancellation until delivery.
Fiscal 2006 Compared with Fiscal 2005
Sales for fiscal 2006 increased 16.4% over the prior year. Sales by segment were as follows:
Increase (Decrease)Dollars In Thousands From Prior Year 2006 2005
Avionics & Controls 8.2% $ 283,011 $ 261,550Sensors & Systems 4.3% 333,257 319,539Advanced Materials 40.0% 356,007 254,314 Total $ 972,275 $ 835,403
The 8.2% increase in Avionics & Controls reflected incremental sales from the Palomar acquisition in the third quarter of fiscal 2005 and higher sales of cockpit controls. These increases were partially offset by decreased sales of diagnostic medical devices.
The 4.3% increase in Sensors & Systems principally reflected growth in OEM programs for temperature and pres-sure sensors and power distribution devices. These increases were partially offset by lower motion control distribu-tion sales to the British Ministry of Defence (British MoD). In addition, pressure sensor sales in the first nine months of fiscal 2005 were enhanced by a retrofit program.
29
The 40.0% increase in Advanced Materials reflected $76.1 million in incremental sales from the acquisitions of Darchem, Wallop and FR Countermeasures and higher sales of flare countermeasure devices, elastomer material and increased sales at our metal finishing unit.
Sales to foreign customers, including export sales by domestic operations, totaled $437.0 million and $345.8 mil-lion, and accounted for 45.0% and 41.4% of our sales for fiscal 2006 and 2005, respectively.
Overall, gross margin as a percentage of sales was 30.9% and 31.4% for fiscal 2006 and 2005, respectively. Avion-ics & Controls segment gross margin was 35.3% and 33.3% for fiscal 2006 and 2005, respectively, reflecting a higher mix of cockpit control and after-market sales and an improved recovery of fixed expenses. The increase also reflects enhanced medical equipment margins.
Sensors & Systems segment gross margin was 33.9% and 34.5% for fiscal 2006 and 2005, respectively. The de-crease in Sensors & Systems gross margin from fiscal 2005 was largely a result of production inefficiencies and incremental direct labor costs incurred to reduce delinquent shipments at our temperature and pressure sensor op-erations. In addition, fiscal 2005 benefited from a retrofit program. Gross margin in fiscal 2005 was impacted by a loss provision on shipments of off-spec power distribution devices. In fiscal 2006, the Company was able to negotiate a favorable settlement with its customer and, accordingly, nearly all of the loss provision recorded in fiscal 2005 was reversed. Gross margin was also impacted by a weaker U.S. dollar compared to the euro and U.K. pound on U.S. dol-lar-denominated sales and euro- and U.K. pound-based cost of sales.
Advanced Materials segment gross margin was 24.7% and 25.3% for fiscal 2006 and 2005, respectively. Gross margin was impacted by the 2006 explosion at our Wallop facility, as explained in Note 2 of the consolidated financial statements, and start-up costs at our FR Countermeasures unit. This decrease in gross margin was partially offset by improved operating efficiencies at our Arkansas flare countermeasure operation. Additionally, gross margins improved at our elastomer material operations, reflecting increased recovery of fixed expenses and a shift in sales mix to higher margin space and defense products.
Selling, general and administrative expenses (which include corporate expenses) increased to $159.6 million in fiscal 2006 compared with $137.4 million in fiscal 2005. Selling, general and administrative expenses include stock option expense of $5.4 million resulting from accounting for stock option expense under Financial Accounting Stan-dards No. 123(R), “Share-Based Payment,” (Statement No. 123(R)). For information on our adoption of Statement No. 123(R), see Note 12 to the consolidated financial statements. In fiscal 2005, we recorded $2.8 million of stock op-tion expense under the variable method of accounting. The increase in selling, general and administrative expenses primarily reflected incremental selling, general and administrative expenses from the Darchem, Wallop, FR Counter-measures and Palomar acquisitions. In addition, pension expense was $4.3 million and $3.0 million in fiscal 2006 and 2005, respectively. Pension expense in fiscal 2006 included a $1.2 million increase in the Leach pension obligation existing as of our acquisition of Leach in August 2004, which was identified during an audit of its pension plan. The increase in selling, general and administrative expense also reflected a $1.0 million charge as a result of a customer contract termination and higher commission expense from increased sales. As a percentage of sales, selling, general and administrative expenses were 16.4% and 16.5% in fiscal 2006 and 2005, respectively.
Research, development and related engineering spending increased to $52.6 million, or 5.4% of sales, in fiscal 2006 compared with $42.2 million, or 5.1% of sales, in fiscal 2005. Darchem’s research, development and engineering spending as a percentage of sales is lower than our other operating units. If research, development and engineering spending as a percentage of sales is calculated excluding Darchem, the percentage is 5.8%, which we consider to be a better comparison to the prior year. The increase in research, development and related engineering largely reflects spending on the A400M primary power distribution assembly, TP400 engine sensors, 787 overhead panel control and 787 environmental control programs. Research, development and engineering expense in fiscal 2006 is net of a $5.2 million government subsidy due from France.
Segment earnings (which exclude corporate expenses and other income and expense) increased 14.2% during fiscal 2006 to $120.8 million compared to $105.8 million in the prior year. Avionics & Controls segment earnings were $45.1 million for fiscal 2006 compared with $37.3 million in fiscal 2005 and reflected incremental earnings from the Palomar acquisition completed in June 2005 and strong earnings from our cockpit control and medical equipment operations.
Sensors & Systems segment earnings were $29.3 million for fiscal 2006 compared with $34.5 million in fiscal 2005. The decrease in Sensors & Systems earnings from fiscal 2005 reflected manufacturing inefficiencies and incremental direct labor costs incurred to reduce delinquent shipments at our temperature and pressure sensors operations. Sensors & Systems earnings were also impacted by a $1.0 million charge as a result of a customer contract termi-nation as well as a $4.6 million increase in research, development and engineering spending which was principally incurred by our Leach units. Sensors & Systems earnings also reflected the impact of a weaker U.S. dollar relative to the euro on U.S. dollar-denominated sales and euro-based operating expenses.
30
Advanced Materials segment earnings were $46.5 million for fiscal 2006 compared with $34.0 million for fiscal 2005. Advanced Materials earnings reflected incremental earnings from the Darchem acquisition and improved earn-ings from our elastomer and Arkansas flare countermeasure operations. Advanced Materials earnings were impact-ed by lower sales and earnings at our combustible ordnance operations, start-up costs at our FR Countermeasures unit and the incident at our Wallop operations described above. Business interruption insurance recoveries of $4.9 million were recorded during fiscal 2006.
Interest income decreased to $2.6 million during fiscal 2006 compared with $4.1 million in fiscal 2005, reflecting lower balances of cash and cash equivalents and short-term investments. Interest expense increased to $21.3 million during fiscal 2006 compared with $18.2 million in the prior year, reflecting increased borrowings to finance acquisi-tions and working capital requirements. In February 2006, we entered into an interest rate swap agreement on the full principal amount of our U.K. £57.0 million term loan, exchanging the variable interest rate for a fixed interest rate of 4.75% plus an additional margin amount determined by reference to the Company’s leverage ratio.
The effective income tax rate for continuing operations for fiscal 2006 was 22.8% compared with 24.1% in fiscal 2005. The effective tax rate was lower than the statutory rate, as both years benefited from various tax credits and deductions. In addition, in fiscal 2006, we recognized a $4.5 million reduction of previously estimated tax liabilities, which was the result of the following items: $1.6 million due to the expiration of the statute of limitations and adjust-ments resulting from a reconciliation of the prior year’s U.S. income tax return to the U.S. income tax return’s provi-sion for income taxes, $2.0 million as a result of receiving a Notice of Proposed Adjustment (NOPA) from the State of California Franchise Tax Board covering, among other items, the examination of research and development tax credits for fiscal years 1997 through 2002 and $0.9 million as a result of a favorable conclusion of a tax examination. In fiscal 2005, we recognized a $2.0 million reduction of previously estimated tax liabilities due to the expiration of the statute of limitations and adjustments resulting from a reconciliation of the prior year’s U.S. income tax return to the U.S. income tax return’s provision for income taxes. While the effective tax rate in fiscal 2006 was impacted by the expiration of the U.S. Research and Experimentation Credit at December 31, 2005, the impact was partially offset by increased benefits from various tax credits and foreign interest deductions.
New orders for fiscal 2006 were $1,143.0 million compared with $894.4 million for fiscal 2005. Avionics & Controls orders for fiscal 2006 increased 7.2% from the prior-year period. Sensors & Systems orders for fiscal 2006 decreased 4.0% from the prior-year period, principally reflecting the timing of receiving orders. Advanced Materials orders for fiscal 2006 increased 92.3% from the prior-year period, principally reflecting the Darchem and Wallop acquisitions. Backlog at the end of fiscal 2006 was $653.5 million compared with $482.8 million at the end of the prior year.
Liquidity and Capital Resources
Working Capital and Statement of Cash Flows
Cash and cash equivalents at the end of fiscal 2007 totaled $147.1 million, an increase of $104.4 million from the prior year. Net working capital increased to $420.1 million at the end of fiscal 2007 from $267.7 million at the end of the prior year. Sources of cash flows from operating activities principally consist of cash received from the sale of products offset by cash payments for material, labor and operating expenses.
Cash flows from operating activities were $121.7 million and $36.7 million in fiscal 2007 and 2006, respectively. The increase principally reflected higher net earnings, which included cash received from our insurance carrier. This increase was partially offset by an increased pension contribution to our U.S. pension plan maintained by Leach, non-U.S. pension plans maintained by CMC, and higher payments for income taxes.
Cash flows used by investing activities were $382.3 million and $153.0 million in fiscal 2007 and 2006, respectively. The increase in the use of cash for investing activities mainly reflected cash paid for acquisitions, partially offset by the proceeds from the sale of short-term investments in fiscal 2006.
Cash flows provided by financing activities were $361.9 million and $39.1 million in fiscal 2007 and 2006, respec-tively. Cash provided by financing activities in fiscal 2007 reflected the issuance of $175.0 million Senior Notes due 2017, a $100.0 million U.S. term loan, and the sale of $187.1 million of common stock, partially offset by the subsequent prepayment of the $100.0 million U.S. term loan in October 2007. In fiscal 2006 cash provided by financing activities reflected our $100.0 million borrowing under our term loan facility, the repayment of our $30.0 million 6.40% Senior Notes in accordance with the terms and the $40.0 million prepayment of our 6.77% Senior Notes in the first fiscal quarter of 2006.
Capital Expenditures
Net property, plant and equipment was $217.4 million at the end of fiscal 2007 compared with $170.4 million at the end of the prior year. Capital expenditures for fiscal 2007 were $30.5 million (excluding acquisitions) and included machin-ery and equipment and enhancements to information technology systems. Capital expenditures are anticipated to

31
approximate $43 million for fiscal 2008. We will continue to support expansion through investments in infrastructure including machinery, equipment, buildings and information systems.
Debt Financing
Total debt increased $179.9 million from the prior year to $475.8 million at the end of fiscal 2007. Total debt outstand-ing, including the fair value of the interest rate swap at the end of fiscal 2007, consisted of $175.0 million of Senior Notes due in 2017, $175.3 million of Senior Subordinated Notes due in 2013, $112.6 million of the GBP Term Loan and $12.9 million in borrowings under our credit facility and various foreign currency debt agreements, including capital lease obligations. The Senior Notes are due March 1, 2017 and bear an interest rate of 6.625%. The Senior Notes are general unsecured senior obligations of the Company. The Senior Notes are guaranteed, jointly and severally on a senior basis, by all the existing and future domestic subsidiaries of the Company unless designated as an “unre-stricted subsidiary,” and those foreign subsidiaries that executed related subsidiary guarantees under the indenture covering the Senior Notes. The Senior Notes are subject to redemption at the option of the Company at any time prior to March 1, 2012 at a price equal to 100% of the principal amount, plus any accrued interest to the date of redemption and a make-whole provision. In addition, before March 1, 2010 the Company may redeem up to 35% of the principal amount at 106.625% plus accrued interest with proceeds of one or more Public Equity Offerings. The Senior Notes are also subject to redemption at the option of the Company, in whole or in part, on or after March 1, 2012 at redemption prices starting at 103.3125% of the principal amount plus accrued interest during the period beginning March 1, 2007 and declining annually to 100% of principal and accrued interest on or after March 1, 2015. The Senior Subordinated Notes are general unsecured obligations of the Company and are subordinated to all existing and future senior debt of the Company. In addition, the Senior Subordinated Notes are effectively subordinated to all existing and future senior debt and other liabilities (including trade payables) of the Company’s foreign subsidiaries. The Senior Subordinated Notes are guaranteed, jointly and severally, by all the existing and future domestic subsidiaries of the Company unless designated as an “unrestricted subsidiary” under the indenture covering the Senior Subordinated Notes. The Senior Subordinated Notes are subject to redemption at the option of the Company, in whole or in part, on or after June 15, 2008, at redemption prices starting at 103.875% of the principal amount plus accrued interest during the period begin-ning June 11, 2003 and declining annually to 100% of principal and accrued interest on June 15, 2011. In September 2003, we entered into an interest rate swap agreement on $75.0 million of our Senior Subordinated Notes due in 2013. The swap agreement exchanged the fixed interest rate for a variable interest rate on $75.0 million of the $175.0 million principal amount outstanding.
On November 15, 2005, $30.0 million of the 6.4% Senior Notes matured and was paid. Additionally, on November 15, 2005, we exercised our option under the terms of the Note Purchase Agreement, dated as of November 1, 1998, to prepay the outstanding principal amount of $40.0 million of the 6.77% Senior Notes due November 15, 2008. Under the terms of the Note Purchase Agreement, we paid an additional $2.0 million to the holders of the 6.77% Senior Notes as a prepayment penalty and wrote off debt issuance costs associated with the 6.77% Senior Notes. The payment of the prepayment penalty and the write off of the debt issuance costs were accounted for as a loss on extinguishment of debt in the first quarter of fiscal 2006.
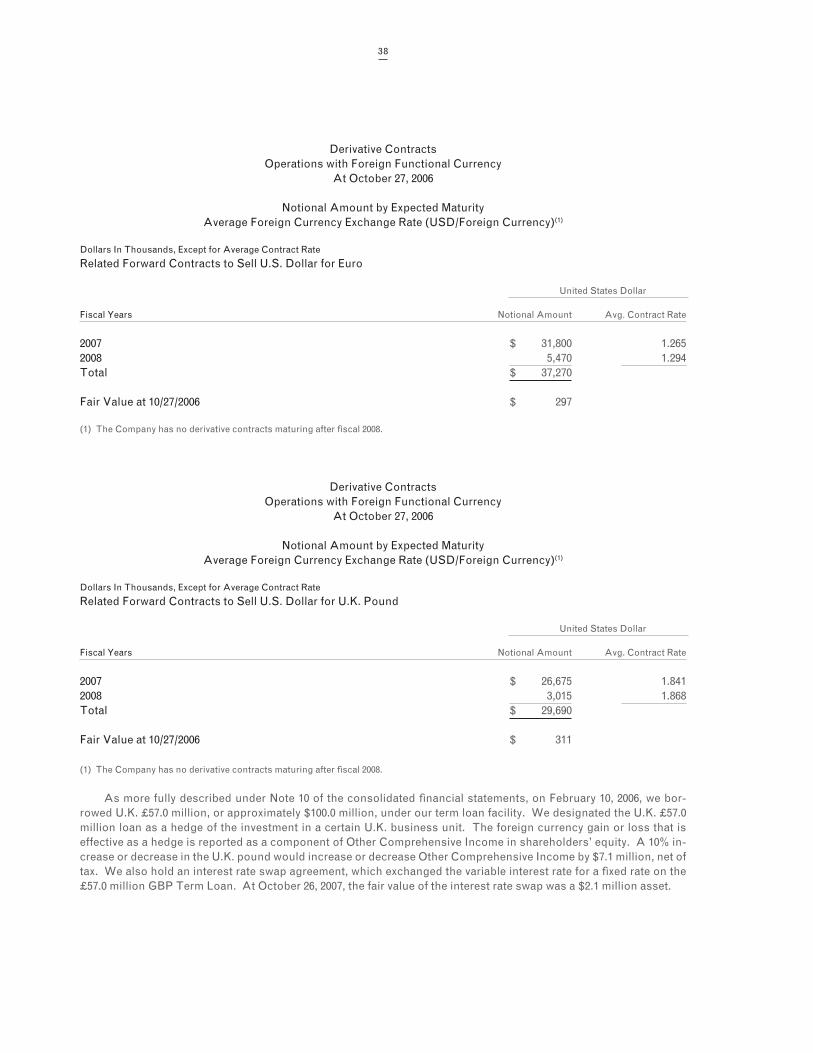
On February 10, 2006, we borrowed U.K. £57.0 million, or approximately $100.0 million, under the term loan facility. We used the proceeds from the loan as working capital for our U.K. operations and to repay a portion of our outstand-ing borrowings under the revolving credit facility. The principal amount of the loan is payable quarterly commencing on March 31, 2007 through the termination date of November 14, 2010, according to a payment schedule by which 1.25% of the principal amount is paid in each quarter of 2007, 2.50% in each quarter of 2008, 5.00% in each quarter of 2009 and 16.25% in each quarter of 2010. The loan accrues interest at a variable rate based on the British Bankers Association Interest Settlement Rate for deposits in U.K. pounds plus an additional margin amount that ranges from 1.13% to 0.50% depending upon the Company’s leverage ratio. As of October 26, 2007, the interest rate on the term loan was 7.22%. We entered into an interest rate swap agreement on the full principal amount by which the variable interest rate was ex-changed for a fixed interest rate of 4.75% plus an additional margin amount determined by reference to the Company’s leverage ratio. At October 26, 2007, the fair value of the interest rate swap was a $2.1 million asset. The interest rate swap is accounted for as a cash flow hedge and the fair value is included in Other Comprehensive Income.
On March 14, 2007, we acquired CMC Electronics Inc. (CMC) for approximately $344.5 million in cash, including acquisition costs. The acquisition was financed in part with the proceeds of the $175 million Senior Notes due March 1, 2017. In addition, on March 13, 2007, we amended our credit agreement to increase the existing revolving credit facil-ity to $200.0 million and to provide an additional $100.0 million U.S. term loan facility. On March 13, 2007, we borrowed $60.0 million under the revolving credit facility and $100.0 million under the U.S. term loan facility to pay a portion of the purchase price of the acquisition of CMC.
On October 12, 2007, we completed an underwritten public offering of 3.45 million shares of common stock, gen-erating net proceeds of $187.1 million. Proceeds from the offering were used to pay off our $100.0 million U.S. term
32
loan facility and pay down our revolving credit facility. We wrote off $1.1 million in debt issuance costs related to the $100.0 million term loan in fiscal 2007 as a result of its pay-off.
We believe cash on hand, funds generated from operations and other available debt facilities are sufficient to fund operating cash requirements and capital expenditures through fiscal 2008; however, we may periodically utilize our lines of credit for working capital requirements. In addition, we believe we have adequate access to capital mar-kets to fund future acquisitions.
Pension and Other Post-Retirement Benefit Obligations
Our pension plans principally include a U.S. pension plan maintained by Esterline, U.S. and non-U.S. plans main-tained by Leach, and non-U.S. plans maintained by CMC. Our principal post-retirement plans include non-U.S. plans maintained by CMC, which are non-contributory healthcare and life insurance plans.
We account for pension expense using the end of the fiscal year as our measurement date and we make actuari-ally computed contributions to our pension plans as necessary to adequately fund benefits. Our funding policy is consistent with the minimum funding requirements of ERISA. In fiscal 2007 and 2006, operating cash flow included $9.7 million and $0.7 million, respectively, of cash funding to these pension plans. We expect pension funding re-quirements to be approximately $4.7 million in fiscal 2008 for the plans maintained by Leach and CMC, and we do not expect the U.S. Esterline pension plan to require any contributions in fiscal 2008. The rate of increase in future com-pensation levels is consistent with our historical experience and salary administration policies. The expected long-term rate of return on plan assets is based on long-term target asset allocations of 70% equity and 30% fixed income. We periodically review allocations of plan assets by investment type and evaluate external sources of information regarding long-term historical returns and expected future returns for each investment type and, accordingly, believe a 7.0 - 8.5% assumed long-term rate of return on plan assets is appropriate. Current allocations are consistent with the long-term targets.
We made the following assumptions with respect to our pension obligation in 2007 and 2006:
2007 2006
Principal assumptions as of fiscal year end:Discount Rate 5.6 - 6.25% 5.75 - 6.0%Rate of increase in future compensation levels 3.5 - 4.5% 4.5%Assumed long-term rate of return on plan assets 7.0 - 8.5% 8.5%
We use a discount rate for expected returns that is a spot rate developed from a yield curve established from high-quality corporate bonds and matched to plan-specific projected benefit payments. Although future changes to the discount rate are unknown, had the discount rate increased or decreased by 25 basis points, pension liabilities in total would have decreased $8.2 million or increased $8.0 million, respectively. If all other assumptions are held constant, the estimated effect on fiscal 2007 pension expense from a hypothetical 25 basis point increase or decrease in both the discount rate and expected long-term rate of return on plan assets would not have a material effect on our pension expense. We are not aware of any legislative or other initiatives or circumstances that will significantly impact our pension obligations in fiscal 2008.
We made the following assumptions with respect to our post-retirement obligation in 2007 and 2006:
2007 2006
Principal assumptions as of fiscal year end:Discount rate 5.6 - 6.25% 6%Initial weighted average health care trend rate 5 - 10% 10%Ultimate weighted average health care trend rate 3.5 - 10% 10%
The assumed health care trend rate has a significant impact on our post-retirement benefit obligations. Our health care trend rate was based on the experience of our plan and expectations for the future. A 100 basis point in-crease in the health care trend rate would increase our post-retirement benefit obligation by $1.6 million. A 100 basis point decrease in the health care trend rate would decrease our post-retirement benefit obligation by $1.2 million. As-suming all other assumptions are held constant, the estimated effect on fiscal 2007 post-retirement benefit expense from a hypothetical 100 basis point increase or decrease in the health care trend rate would not have a material effect on our post-retirement benefit expense.
33
Research and Development Expense
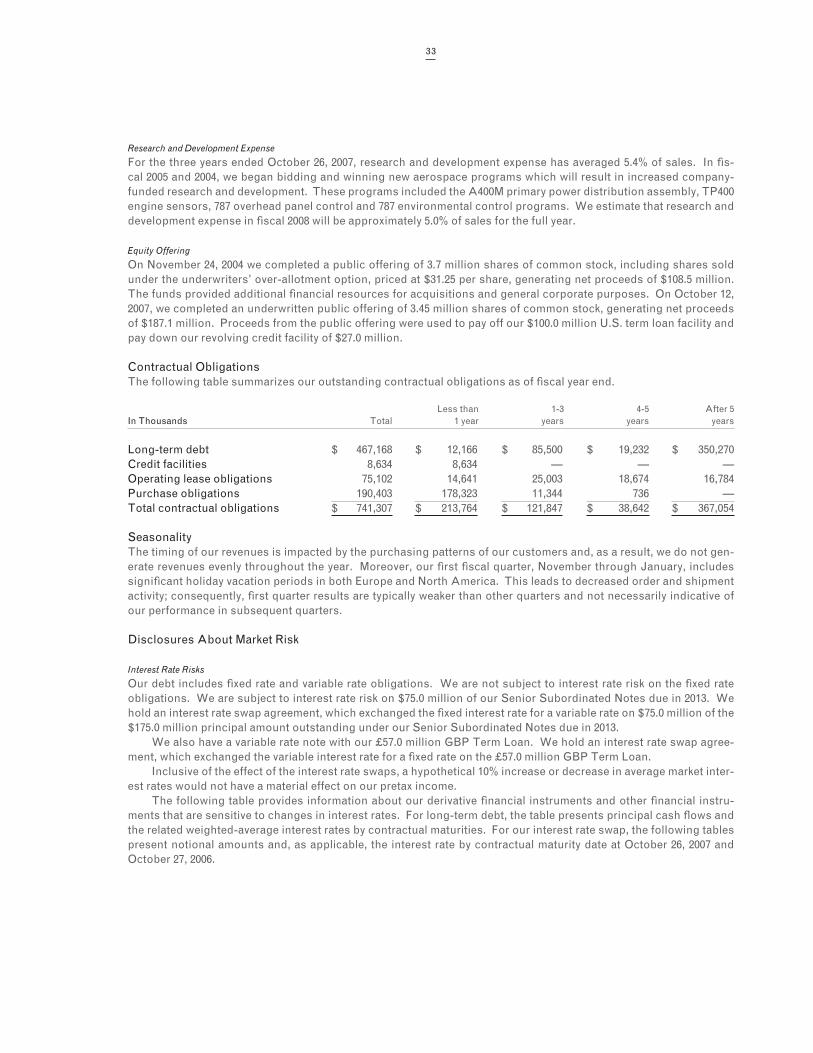
For the three years ended October 26, 2007, research and development expense has averaged 5.4% of sales. In fis-cal 2005 and 2004, we began bidding and winning new aerospace programs which will result in increased company-funded research and development. These programs included the A400M primary power distribution assembly, TP400 engine sensors, 787 overhead panel control and 787 environmental control programs. We estimate that research and development expense in fiscal 2008 will be approximately 5.0% of sales for the full year.
Equity Offering
On November 24, 2004 we completed a public offering of 3.7 million shares of common stock, including shares sold under the underwriters’ over-allotment option, priced at $31.25 per share, generating net proceeds of $108.5 million. The funds provided additional financial resources for acquisitions and general corporate purposes. On October 12, 2007, we completed an underwritten public offering of 3.45 million shares of common stock, generating net proceeds of $187.1 million. Proceeds from the public offering were used to pay off our $100.0 million U.S. term loan facility and pay down our revolving credit facility of $27.0 million.
Contractual ObligationsThe following table summarizes our outstanding contractual obligations as of fiscal year end.
Less than 1-3 4-5 After 5In Thousands Total 1 year years years years
Long-term debt $ 467,168 $ 12,166 $ 85,500 $ 19,232 $ 350,270Credit facilities 8,634 8,634 — — —Operating lease obligations 75,102 14,641 25,003 18,674 16,784Purchase obligations 190,403 178,323 11,344 736 —Total contractual obligations $ 741,307 $ 213,764 $ 121,847 $ 38,642 $ 367,054
SeasonalityThe timing of our revenues is impacted by the purchasing patterns of our customers and, as a result, we do not gen-erate revenues evenly throughout the year. Moreover, our first fiscal quarter, November through January, includes significant holiday vacation periods in both Europe and North America. This leads to decreased order and shipment activity; consequently, first quarter results are typically weaker than other quarters and not necessarily indicative of our performance in subsequent quarters.
Disclosures About Market Risk
Interest Rate Risks
Our debt includes fixed rate and variable rate obligations. We are not subject to interest rate risk on the fixed rate obligations. We are subject to interest rate risk on $75.0 million of our Senior Subordinated Notes due in 2013. We hold an interest rate swap agreement, which exchanged the fixed interest rate for a variable rate on $75.0 million of the $175.0 million principal amount outstanding under our Senior Subordinated Notes due in 2013.
We also have a variable rate note with our £57.0 million GBP Term Loan. We hold an interest rate swap agree-ment, which exchanged the variable interest rate for a fixed rate on the £57.0 million GBP Term Loan.
Inclusive of the effect of the interest rate swaps, a hypothetical 10% increase or decrease in average market inter-est rates would not have a material effect on our pretax income.
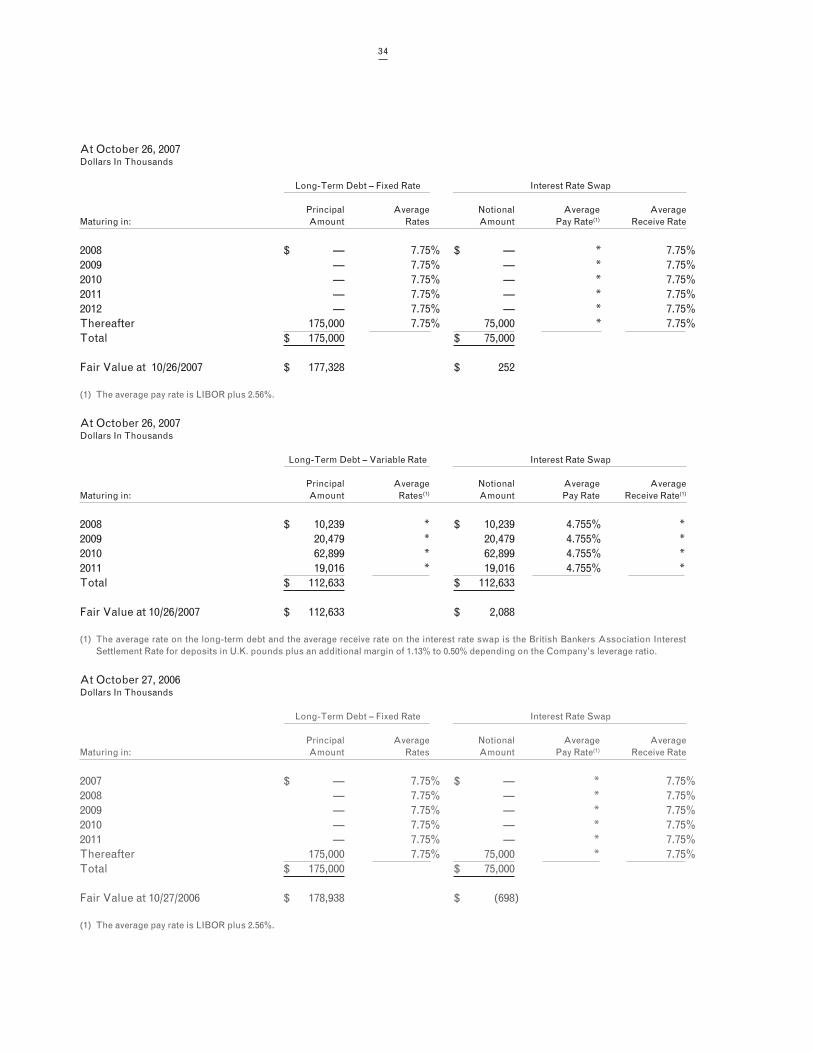
The following table provides information about our derivative financial instruments and other financial instru-ments that are sensitive to changes in interest rates. For long-term debt, the table presents principal cash flows and the related weighted-average interest rates by contractual maturities. For our interest rate swap, the following tables present notional amounts and, as applicable, the interest rate by contractual maturity date at October 26, 2007 and October 27, 2006.
34
At October 26, 2007Dollars In Thousands
Long-Term Debt – Fixed Rate Interest Rate Swap
Principal Average Notional Average AverageMaturing in: Amount Rates Amount Pay Rate(1) Receive Rate
2008 $ — 7.75% $ — * 7.75%2009 — 7.75% — * 7.75%2010 — 7.75% — * 7.75%2011 — 7.75% — * 7.75%2012 — 7.75% — * 7.75%Thereafter 175,000 7.75% 75,000 * 7.75%Total $ 175,000 $ 75,000
Fair Value at 10/26/2007 $ 177,328 $ 252
(1) The average pay rate is LIBOR plus 2.56%.
At October 26, 2007Dollars In Thousands
Long-Term Debt – Variable Rate Interest Rate Swap
Principal Average Notional Average AverageMaturing in: Amount Rates(1) Amount Pay Rate Receive Rate(1)
2008 $ 10,239 * $ 10,239 4.755% *2009 20,479 * 20,479 4.755% *2010 62,899 * 62,899 4.755% *2011 19,016 * 19,016 4.755% * Total $ 112,633 $ 112,633
Fair Value at 10/26/2007 $ 112,633 $ 2,088
(1) The average rate on the long-term debt and the average receive rate on the interest rate swap is the British Bankers Association Interest Settlement Rate for deposits in U.K. pounds plus an additional margin of 1.13% to 0.50% depending on the Company’s leverage ratio.
At October 27, 2006Dollars In Thousands
Long-Term Debt – Fixed Rate Interest Rate Swap
Principal Average Notional Average AverageMaturing in: Amount Rates Amount Pay Rate(1) Receive Rate
2007 $ — 7.75% $ — *% 7.75%2008 — 7.75% — *% 7.75%2009 — 7.75% — *% 7.75%2010 — 7.75% — *% 7.75%2011 — 7.75% — *% 7.75%Thereafter 175,000 7.75% 75,000 *% 7.75%Total $ 175,000 $ 75,000
Fair Value at 10/27/2006 $ 178,938 $ (698)
(1) The average pay rate is LIBOR plus 2.56%.
35
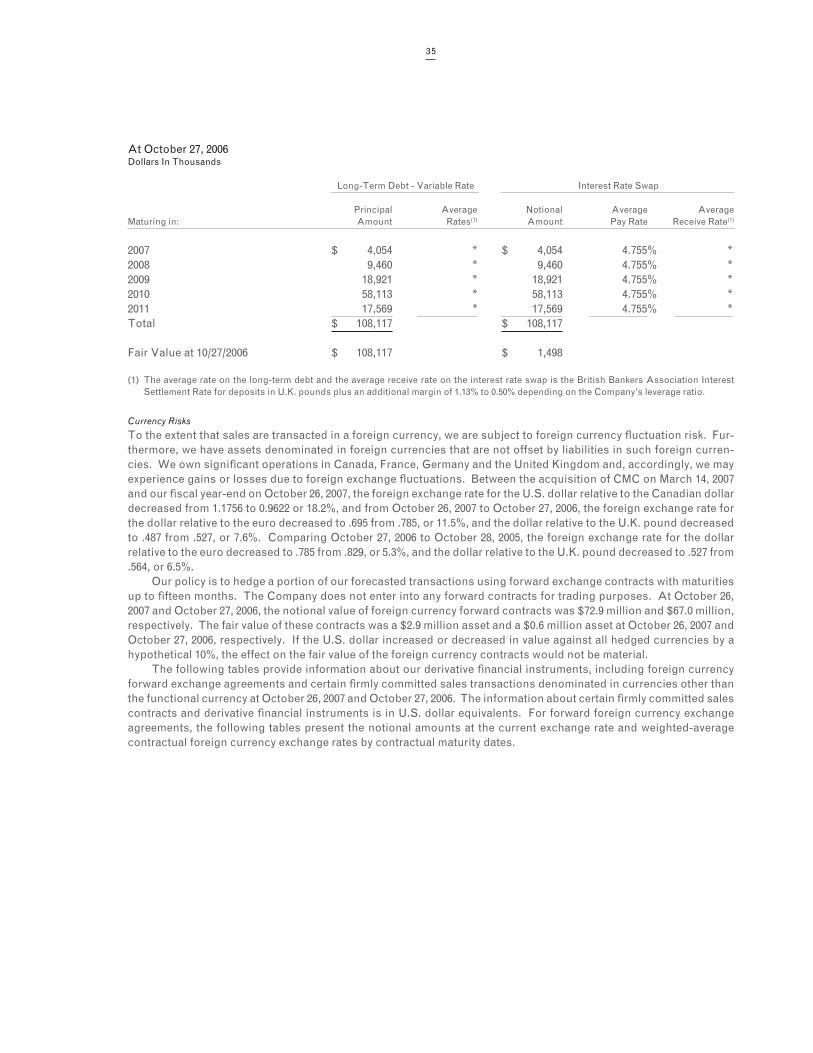
At October 27, 2006Dollars In Thousands
Long-Term Debt - Variable Rate Interest Rate Swap
Principal Average Notional Average AverageMaturing in: Amount Rates(1) Amount Pay Rate Receive Rate(1)
2007 $ 4,054 * $ 4,054 4.755% *2008 9,460 * 9,460 4.755% *2009 18,921 * 18,921 4.755% *2010 58,113 * 58,113 4.755% *2011 17,569 * 17,569 4.755% *Total $ 108,117 $ 108,117
Fair Value at 10/27/2006 $ 108,117 $ 1,498
(1) The average rate on the long-term debt and the average receive rate on the interest rate swap is the British Bankers Association Interest Settlement Rate for deposits in U.K. pounds plus an additional margin of 1.13% to 0.50% depending on the Company’s leverage ratio.
Currency Risks
To the extent that sales are transacted in a foreign currency, we are subject to foreign currency fluctuation risk. Fur-thermore, we have assets denominated in foreign currencies that are not offset by liabilities in such foreign curren-cies. We own significant operations in Canada, France, Germany and the United Kingdom and, accordingly, we may experience gains or losses due to foreign exchange fluctuations. Between the acquisition of CMC on March 14, 2007 and our fiscal year-end on October 26, 2007, the foreign exchange rate for the U.S. dollar relative to the Canadian dollar decreased from 1.1756 to 0.9622 or 18.2%, and from October 26, 2007 to October 27, 2006, the foreign exchange rate for the dollar relative to the euro decreased to .695 from .785, or 11.5%, and the dollar relative to the U.K. pound decreased to .487 from .527, or 7.6%. Comparing October 27, 2006 to October 28, 2005, the foreign exchange rate for the dollar relative to the euro decreased to .785 from .829, or 5.3%, and the dollar relative to the U.K. pound decreased to .527 from .564, or 6.5%.
Our policy is to hedge a portion of our forecasted transactions using forward exchange contracts with maturities up to fifteen months. The Company does not enter into any forward contracts for trading purposes. At October 26, 2007 and October 27, 2006, the notional value of foreign currency forward contracts was $72.9 million and $67.0 million, respectively. The fair value of these contracts was a $2.9 million asset and a $0.6 million asset at October 26, 2007 and October 27, 2006, respectively. If the U.S. dollar increased or decreased in value against all hedged currencies by a hypothetical 10%, the effect on the fair value of the foreign currency contracts would not be material.
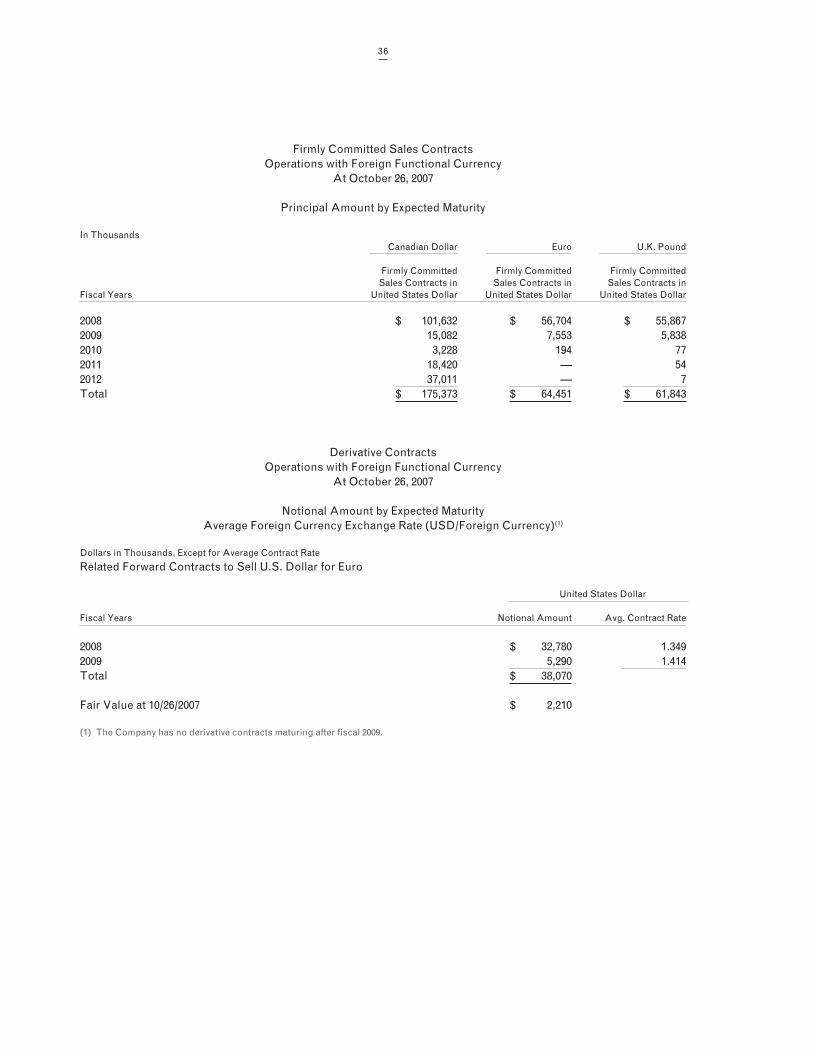
The following tables provide information about our derivative financial instruments, including foreign currency forward exchange agreements and certain firmly committed sales transactions denominated in currencies other than the functional currency at October 26, 2007 and October 27, 2006. The information about certain firmly committed sales contracts and derivative financial instruments is in U.S. dollar equivalents. For forward foreign currency exchange agreements, the following tables present the notional amounts at the current exchange rate and weighted-average contractual foreign currency exchange rates by contractual maturity dates.
36
Firmly Committed Sales ContractsOperations with Foreign Functional Currency
At October 26, 2007
Principal Amount by Expected Maturity
In Thousands Canadian Dollar Euro U.K. Pound
Firmly Committed Firmly Committed Firmly Committed Sales Contracts in Sales Contracts in Sales Contracts inFiscal Years United States Dollar United States Dollar United States Dollar
2008 $ 101,632 $ 56,704 $ 55,8672009 15,082 7,553 5,8382010 3,228 194 772011 18,420 — 542012 37,011 — 7Total $ 175,373 $ 64,451 $ 61,843
Derivative ContractsOperations with Foreign Functional Currency
At October 26, 2007
Notional Amount by Expected MaturityAverage Foreign Currency Exchange Rate (USD/Foreign Currency)(1)
Dollars in Thousands, Except for Average Contract Rate
Related Forward Contracts to Sell U.S. Dollar for Euro
United States Dollar
Fiscal Years Notional Amount Avg. Contract Rate
2008 $ 32,780 1.3492009 5,290 1.414 Total $ 38,070
Fair Value at 10/26/2007 $ 2,210
(1) The Company has no derivative contracts maturing after fiscal 2009.
37
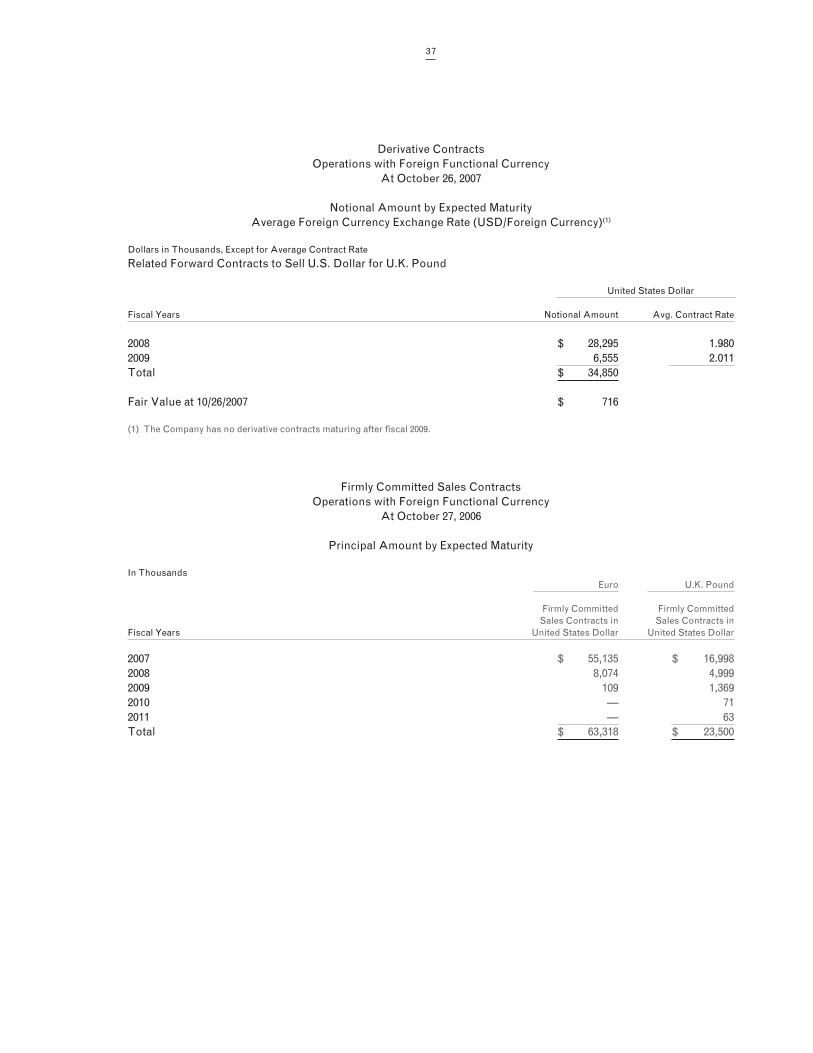
Derivative ContractsOperations with Foreign Functional Currency
At October 26, 2007
Notional Amount by Expected MaturityAverage Foreign Currency Exchange Rate (USD/Foreign Currency)(1)
Dollars in Thousands, Except for Average Contract Rate
Related Forward Contracts to Sell U.S. Dollar for U.K. Pound
United States Dollar
Fiscal Years Notional Amount Avg. Contract Rate
2008 $ 28,295 1.9802009 6,555 2.011 Total $ 34,850
Fair Value at 10/26/2007 $ 716
(1) The Company has no derivative contracts maturing after fiscal 2009.
Firmly Committed Sales ContractsOperations with Foreign Functional Currency
At October 27, 2006
Principal Amount by Expected Maturity
In Thousands Euro U.K. Pound
Firmly Committed Firmly Committed Sales Contracts in Sales Contracts inFiscal Years United States Dollar United States Dollar
2007 $ 55,135 $ 16,9982008 8,074 4,9992009 109 1,3692010 — 712011 — 63Total $ 63,318 $ 23,500
38
Derivative ContractsOperations with Foreign Functional Currency
At October 27, 2006
Notional Amount by Expected MaturityAverage Foreign Currency Exchange Rate (USD/Foreign Currency)(1)
Dollars In Thousands, Except for Average Contract Rate
Related Forward Contracts to Sell U.S. Dollar for Euro
United States Dollar
Fiscal Years Notional Amount Avg. Contract Rate
2007 $ 31,800 1.2652008 5,470 1.294Total $ 37,270
Fair Value at 10/27/2006 $ 297
(1) The Company has no derivative contracts maturing after fiscal 2008.
Derivative ContractsOperations with Foreign Functional Currency
At October 27, 2006
Notional Amount by Expected MaturityAverage Foreign Currency Exchange Rate (USD/Foreign Currency)(1)
Dollars In Thousands, Except for Average Contract Rate
Related Forward Contracts to Sell U.S. Dollar for U.K. Pound
United States Dollar
Fiscal Years Notional Amount Avg. Contract Rate
2007 $ 26,675 1.8412008 3,015 1.868Total $ 29,690
Fair Value at 10/27/2006 $ 311
(1) The Company has no derivative contracts maturing after fiscal 2008.
As more fully described under Note 10 of the consolidated financial statements, on February 10, 2006, we bor-rowed U.K. £57.0 million, or approximately $100.0 million, under our term loan facility. We designated the U.K. £57.0 million loan as a hedge of the investment in a certain U.K. business unit. The foreign currency gain or loss that is effective as a hedge is reported as a component of Other Comprehensive Income in shareholders’ equity. A 10% in-crease or decrease in the U.K. pound would increase or decrease Other Comprehensive Income by $7.1 million, net of tax. We also hold an interest rate swap agreement, which exchanged the variable interest rate for a fixed rate on the £57.0 million GBP Term Loan. At October 26, 2007, the fair value of the interest rate swap was a $2.1 million asset.

39
Critical Accounting PoliciesOur financial statements and accompanying notes are prepared in accordance with U.S. generally accepted account-ing principles. Preparing financial statements requires management to make estimates and assumptions that affect the reported amounts of assets, liabilities, revenues and expenses. Actual results may differ from estimates under different assumptions or conditions. These estimates and assumptions are affected by our application of account-ing policies. Our critical accounting policies include revenue recognition, accounting for the allowance for doubtful accounts receivable, accounting for inventories at the lower of cost or market, accounting for goodwill and intangible assets in business combinations, impairment of goodwill and intangible assets, accounting for legal contingencies, accounting for pension benefits, and accounting for income taxes.
Revenue Recognition
We recognize revenue when the title and risk of loss have passed to the customer, there is persuasive evidence of an agreement, delivery has occurred or services have been rendered, the price is determinable, and the collectibility is reasonably assured. We recognize product revenues at the point of shipment or delivery in accordance with the terms of sale. Sales are net of returns and allowances. Returns and allowances are not significant because products are manufactured to customer specification and are covered by the terms of the product warranty.
Revenues and profits on fixed-price contracts with significant engineering as well as production requirements are recorded based on the achievement of contractual milestones and the ratio of total actual incurred costs to date to total estimated costs for each contract (cost-to-cost method) in accordance with the American Institute of Certi-fied Public Accountants Statement of Position 81-1, “Accounting for Performance of Construction-Type and Certain Production-Type Contracts.” We review cost performance and estimates to complete on our ongoing contracts at least quarterly. The impact of revisions of profit estimates are recognized on a cumulative catch-up basis in the pe-riod in which the revisions are made. Provisions for anticipated losses on contracts are recorded in the period they become evident. Amounts representing contract change orders are included in revenue only when they can be reli-ably estimated and realization is probable, and are determined on a percentage-of-completion basis measured by the cost-to-cost method. Claims are included in revenue only when they are probable of collection.
Allowance for Doubtful Accounts
We establish an allowance for doubtful accounts for losses expected to be incurred on accounts receivable balances. Judgment is required in estimation of the allowance and is based upon specific identification, collection history and creditworthiness of the debtor.
40
Inventories
We account for inventories on a first-in, first-out or average cost method of accounting at the lower of its cost or market. The determination of market requires judgment in estimating future demand, selling prices and cost of dis-posal. Judgment is required when determining inventory reserves. These reserves are provided when inventory is considered to be excess or obsolete based upon an analysis of actual on-hand quantities on a part level basis to fore-casted product demand and historical usage. Inventory reserves are released based upon adjustments to forecasted demand.
Goodwill and Intangible Assets in Business Combinations
We account for business combinations, goodwill and intangible assets in accordance with Financial Accounting Standards No. 141, “Business Combinations,” (Statement No. 141) and Financial Accounting Standards No. 142, “Goodwill and Other Intangible Assets,” (Statement No. 142). Statement No. 141 specifies the types of acquired in-tangible assets that are required to be recognized and reported separately from goodwill.
Impairment of Goodwill and Intangible Assets
Statement No. 142 requires goodwill and indefinite-lived intangible assets to be tested for impairment at least an-nually. We are also required to test goodwill for impairment between annual tests if events occur or circumstances change that would more likely than not reduce our enterprise fair value below its book value. These events or circum-stances could include a significant change in the business climate, including a significant sustained decline in an entity’s market value, legal factors, operating performance indicators, competition, sale or disposition of a significant portion of the business, or other factors.
The valuation of reporting units requires judgment in estimating future cash flows, discount rates and estimated product life cycles. In making these judgments, we evaluate the financial health of the business, including such fac-tors as industry performance, changes in technology and operating cash flows.
Statement No. 142 outlines a two-step process for testing goodwill for impairment. The first step (Step One) of the goodwill impairment test involves estimating the fair value of a reporting unit. Statement No. 142 defines fair value (Fair Value) as “the amount at which an asset (or liability) could be bought (or incurred) or sold (or settled) in a current transaction between willing parties, that is, other than in a forced liquidation sale.” A reporting unit is gener-ally defined at the operating segment level or at the component level one level below the operating segment, if said component constitutes a business. The Fair Value of a reporting unit is then compared to its carrying value, which is defined as the book basis of total assets less total liabilities. In the event a reporting unit’s carrying value exceeds its estimated Fair Value, evidence of potential impairment exists. In such a case, the second step (Step Two) of the impairment test is required, which involves allocating the Fair Value of the reporting unit to all of the assets and li-abilities of that unit, with the excess of Fair Value over allocated net assets representing the Fair Value of goodwill. An impairment loss is measured as the amount by which the carrying value of the reporting unit’s goodwill exceeds the estimated Fair Value of goodwill.
As we have grown through acquisitions, we have accumulated $656.9 million of goodwill and $57.6 million of indefinite-lived intangible assets out of total assets of $2,050.3 million at October 26, 2007. The amount of any annual or interim impairment could be significant and could have a material adverse effect on our reported financial results for the period in which the charge is taken. We performed our impairment review for fiscal 2007 as of July 28, 2007, and our Step One analysis indicates that no impairment of goodwill or other indefinite-lived assets exists at any of our reporting units. We performed an impairment test of one of our indefinite-lived assets, a trade name used by our tem-perature and pressure sensors reporting unit, which has a book value of $6.4 million. We determined that the trade name was not impaired because the discounted cash flows (using a relief from royalty valuation method) of the trade name were greater than the carrying amount of the intangible asset. Our estimated discounted cash flows assume the successful renegotiation and price increase of a U.S. dollar-denominated long-term agreement, expiring in December 2007, the successful start-up of a low-cost country manufacturing operation in fiscal 2008 and 2009, and the successful development and commercialization of new high-margin products. In the event some or all of these initiatives are not successful, an amount up to $6.4 million could be written off.
41
Impairment of Long-lived Assets
We account for the impairment of long-lived assets to be held and used in accordance with Financial Accounting Standards No. 144, “Accounting for the Impairment or Disposal of Long-Lived Assets,” (Statement No. 144). State-ment No. 144 requires that a long-lived asset to be disposed of be reported at the lower of its carrying amount or fair value less cost to sell. An asset (other than goodwill and indefinite-lived intangible assets) is considered impaired when estimated future cash flows are less than the carrying amount of the asset. In the event the carrying amount of such asset is not deemed recoverable, the asset is adjusted to its estimated fair value. Fair value is generally de-termined based upon estimated discounted future cash flows. As we have grown through acquisitions, we have ac-cumulated $307.7 million of definite-lived intangible assets. The amount of any annual or interim impairment could be significant and could have a material adverse effect on our reported financial results for the period in which the charge is taken. We performed an impairment test of an acquired program value of our temperature and pressure sensor reporting unit in the fourth quarter of fiscal 2007 and we determined that the acquired program value was not impaired because the estimated future cash flows of the program were greater than the carrying amount of the intangible asset. Our estimated future cash flows assume the successful renegotiation and price increase of a U.S. dollar-denominated long-term agreement, expiring in December 2007, the successful start up of a low-cost country manufacturing opera-tion in fiscal 2008 and 2009, and the successful development and commercialization of new high-margin products. In the event some or all of these initiatives are not successful, an amount up to $3.6 million could be written off.
Contingencies
We are party to various lawsuits and claims, both as plaintiff and defendant, and have contingent liabilities arising from the conduct of business. We are covered by insurance for general liability, product liability, workers’ compensa-tion and certain environmental exposures, subject to certain deductible limits. We are self-insured for amounts less than our deductible and where no insurance is available. Financial Accounting Standards No. 5, “Accounting for Contingencies,” requires that an estimated loss from a contingency should be accrued by a charge to income if it is probable that an asset has been impaired or a liability has been incurred and the amount of the loss can be reasonably estimated. Disclosure of a contingency is required if there is at least a reasonable possibility that a loss has been incurred. We evaluate, among other factors, the degree of probability of an unfavorable outcome and the ability to make a reasonable estimate of the amount of loss.
Pension and Other Post-Retirement Benefits
We account for employee pension and post-retirement benefit costs in accordance with the applicable statements issued by the Financial Accounting Standards Board. In accordance with these statements, we select appropriate assumptions including discount rate, rate of increase in future compensation levels and assumed long-term rate of return on plan assets and expected annual increases in costs of medical and other healthcare benefits in regard to our post-retirement benefit obligations. Our assumptions are based upon historical results, the current economic environment and reasonable expectations of future events. Actual results which vary from our assumptions are accu-mulated and amortized over future periods and, accordingly, are recognized in expense in these periods. Significant differences between our assumptions and actual experience or significant changes in assumptions could impact the pension costs and the pension obligation.
42
Income Taxes
We account for income taxes in accordance with Financial Accounting Standards No. 109, “Accounting for Income Taxes.” The objectives of accounting for income taxes are to recognize the amount of taxes payable or refundable for the current year and deferred tax liabilities and assets for the future tax consequences of events that have been rec-ognized in our financial statements or tax returns. Judgment is required in assessing the future tax consequences of events that have been recognized in our financial statements or tax returns. Variations in the actual outcome of these future tax consequences could materially impact our financial position and results of operations.
Recent Accounting PronouncementsOn December 4, 2007, the Financial Accounting Standards Board issued Financial Accounting Standard No. 141(R), “Business Combinations,” (Statement No. 141(R)) and Statement No. 160, “Accounting and Reporting of Non-con-trolling Interest in Consolidated Financial Statements, an amendment of ARB No. 51,” (Statement No. 160). These new standards will significantly change the accounting for and reporting of business combination transactions and non-controlling (minority) interests in consolidated financial statements. Statement No. 141(R) and Statement No. 160 are required to be adopted simultaneously and are effective for fiscal 2010.
The significant changes in the accounting for business combination transactions under Statement No. 141(R) include:
• Recognition, with certain exceptions, of 100% of the fair values of assets acquired, liabilities assumed, and non-controlling interests of acquired businesses.
• Measurement of all acquirer shares issued in consideration for a business combination at fair value on the acqui-sition date. With the effectiveness of Statement No. 141(R), the “agreement and announcement date” measure-ment principles in EITF Issue 99-12 will be nullified.
• Recognition of contingent consideration arrangements at their acquisition-date fair values, with subsequent changes in fair value generally reflected in earnings.
• With the one exception described in the last sentence of this section, recognition of pre-acquisition gain and loss contingencies at their acquisition-date fair values. Subsequent accounting for pre-acquisition loss contingen-cies is based on the greater of acquisition-date fair value or the amount calculated pursuant to FASB Statement No. 5, “Accounting for Contingencies,” (Statement No. 5). Subsequent accounting for pre-acquisition gain contingen-cies is based on the lesser of acquisition-date fair value or the best estimate of the future settlement amount. Adjustments after the acquisition date are made only upon the receipt of new information on the possible outcome of the contingency, and changes to the measurement of pre-acquisition contingencies are recognized in ongoing results of operations. Absent new information, no adjustments to the acquisition-date fair value are made until the contingency is resolved. Pre-acquisition contingencies that are both (1) non-contractual and (2) as of the acquisi-tion date are “not more likely than not” of materializing are not recognized in acquisition accounting and, instead, are accounted for based on the guidance in Statement No. 5, “Accounting for Contingencies.”
• Capitalization of in-process research and development (IPR&D) assets acquired at acquisition date fair value. After acquisition, apply the indefinite-lived impairment model (lower of basis or fair value) through the develop-ment period to capitalized IPR&D without amortization. Charge development costs incurred after acquisition to results of operations. Upon completion of a successful development project, assign an estimated useful life to the amount then capitalized, amortize over that life, and consider the asset a definite-lived asset for impairment accounting purposes.
• Recognition of acquisition-related transaction costs as expense when incurred. • Recognition of acquisition-related restructuring cost accruals in acquisition accounting only if the criteria in
Statement No. 146 are met as of the acquisition date. With the effectiveness of Statement No. 141(R), the EITF Issue 95-3 concepts of “assessing, formulating, finalizing and committing/communicating” that currently pertain to recognition in purchase accounting of an acquisition-related restructuring plan will be nullified.
• Recognition of changes in the acquirer’s income tax valuation allowance resulting from the business combina-tion separately from the business combination as adjustments to income tax expense. Also, changes after the acquisition date in an acquired entity’s valuation allowance or tax uncertainty established at the acquisition date are accounted for as adjustments to income tax expense.
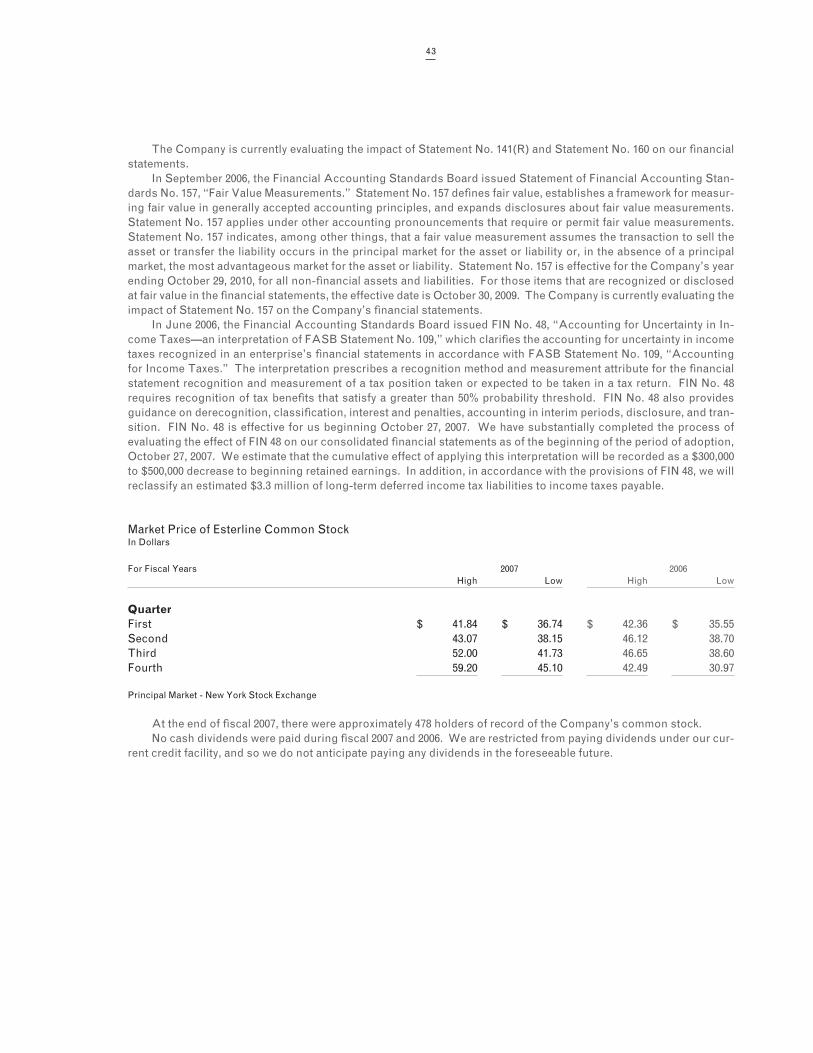
43
The Company is currently evaluating the impact of Statement No. 141(R) and Statement No. 160 on our financial statements.
In September 2006, the Financial Accounting Standards Board issued Statement of Financial Accounting Stan-dards No. 157, “Fair Value Measurements.” Statement No. 157 defines fair value, establishes a framework for measur-ing fair value in generally accepted accounting principles, and expands disclosures about fair value measurements. Statement No. 157 applies under other accounting pronouncements that require or permit fair value measurements. Statement No. 157 indicates, among other things, that a fair value measurement assumes the transaction to sell the asset or transfer the liability occurs in the principal market for the asset or liability or, in the absence of a principal market, the most advantageous market for the asset or liability. Statement No. 157 is effective for the Company’s year ending October 29, 2010, for all non-financial assets and liabilities. For those items that are recognized or disclosed at fair value in the financial statements, the effective date is October 30, 2009. The Company is currently evaluating the impact of Statement No. 157 on the Company’s financial statements.
In June 2006, the Financial Accounting Standards Board issued FIN No. 48, “Accounting for Uncertainty in In-come Taxes—an interpretation of FASB Statement No. 109,” which clarifies the accounting for uncertainty in income taxes recognized in an enterprise’s financial statements in accordance with FASB Statement No. 109, “Accounting for Income Taxes.” The interpretation prescribes a recognition method and measurement attribute for the financial statement recognition and measurement of a tax position taken or expected to be taken in a tax return. FIN No. 48 requires recognition of tax benefits that satisfy a greater than 50% probability threshold. FIN No. 48 also provides guidance on derecognition, classification, interest and penalties, accounting in interim periods, disclosure, and tran-sition. FIN No. 48 is effective for us beginning October 27, 2007. We have substantially completed the process of evaluating the effect of FIN 48 on our consolidated financial statements as of the beginning of the period of adoption, October 27, 2007. We estimate that the cumulative effect of applying this interpretation will be recorded as a $300,000 to $500,000 decrease to beginning retained earnings. In addition, in accordance with the provisions of FIN 48, we will reclassify an estimated $3.3 million of long-term deferred income tax liabilities to income taxes payable.
Market Price of Esterline Common StockIn Dollars
For Fiscal Years 2007 2006 High Low High Low
QuarterFirst $ 41.84 $ 36.74 $ 42.36 $ 35.55Second 43.07 38.15 46.12 38.70Third 52.00 41.73 46.65 38.60Fourth 59.20 45.10 42.49 30.97
Principal Market - New York Stock Exchange
At the end of fiscal 2007, there were approximately 478 holders of record of the Company’s common stock.No cash dividends were paid during fiscal 2007 and 2006. We are restricted from paying dividends under our cur-
rent credit facility, and so we do not anticipate paying any dividends in the foreseeable future.
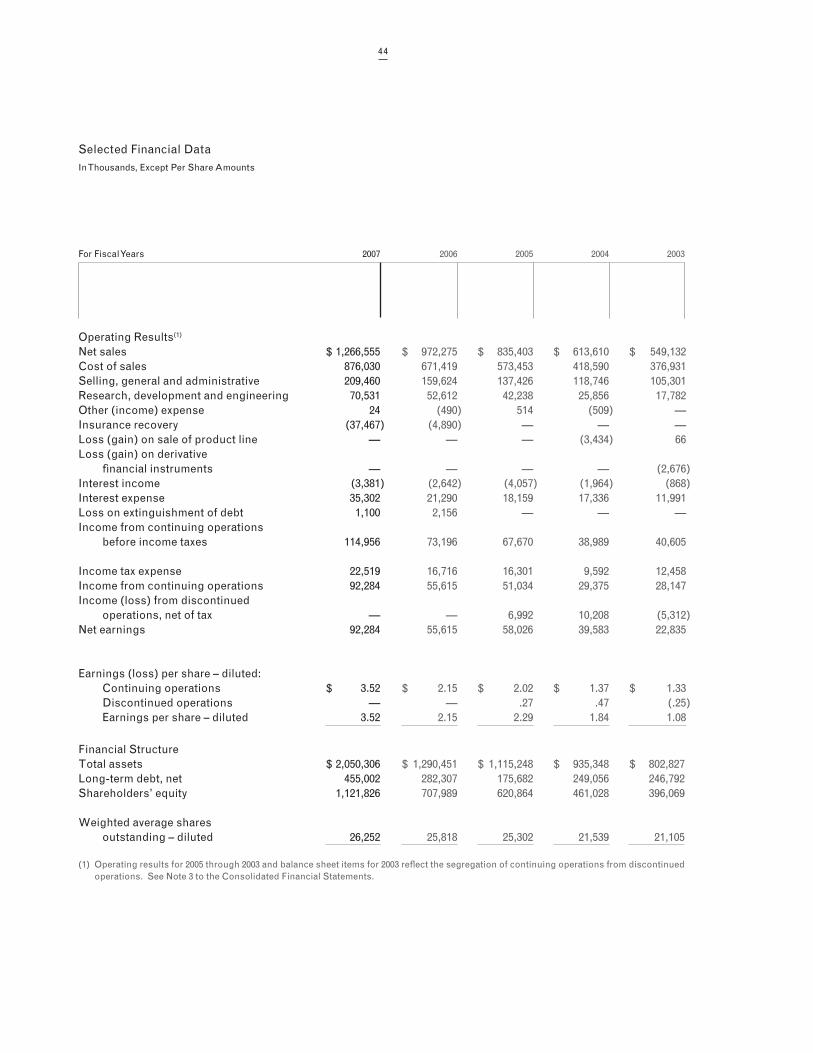
44
Selected Financial DataIn Thousands, Except Per Share Amounts
For Fiscal Years 2007 2006 2005 2004 2003
Operating Results(1)
Net sales $ 1,266,555 $ 972,275 $ 835,403 $ 613,610 $ 549,132Cost of sales 876,030 671,419 573,453 418,590 376,931Selling, general and administrative 209,460 159,624 137,426 118,746 105,301Research, development and engineering 70,531 52,612 42,238 25,856 17,782Other (income) expense 24 (490) 514 (509) —Insurance recovery (37,467) (4,890) — — —Loss (gain) on sale of product line — — — (3,434) 66Loss (gain) on derivative financial instruments — — — — (2,676)Interest income (3,381) (2,642) (4,057) (1,964) (868)Interest expense 35,302 21,290 18,159 17,336 11,991Loss on extinguishment of debt 1,100 2,156 — — —Income from continuing operations before income taxes 114,956 73,196 67,670 38,989 40,605
Income tax expense 22,519 16,716 16,301 9,592 12,458Income from continuing operations 92,284 55,615 51,034 29,375 28,147Income (loss) from discontinued operations, net of tax — — 6,992 10,208 (5,312)Net earnings 92,284 55,615 58,026 39,583 22,835
Earnings (loss) per share – diluted: Continuing operations $ 3.52 $ 2.15 $ 2.02 $ 1.37 $ 1.33 Discontinued operations — — .27 .47 (.25) Earnings per share – diluted 3.52 2.15 2.29 1.84 1.08
Financial StructureTotal assets $ 2,050,306 $ 1,290,451 $ 1,115,248 $ 935,348 $ 802,827Long-term debt, net 455,002 282,307 175,682 249,056 246,792Shareholders’ equity 1,121,826 707,989 620,864 461,028 396,069
Weighted average shares outstanding – diluted 26,252 25,818 25,302 21,539 21,105
(1) Operating results for 2005 through 2003 and balance sheet items for 2003 reflect the segregation of continuing operations from discontinued operations. See Note 3 to the Consolidated Financial Statements.
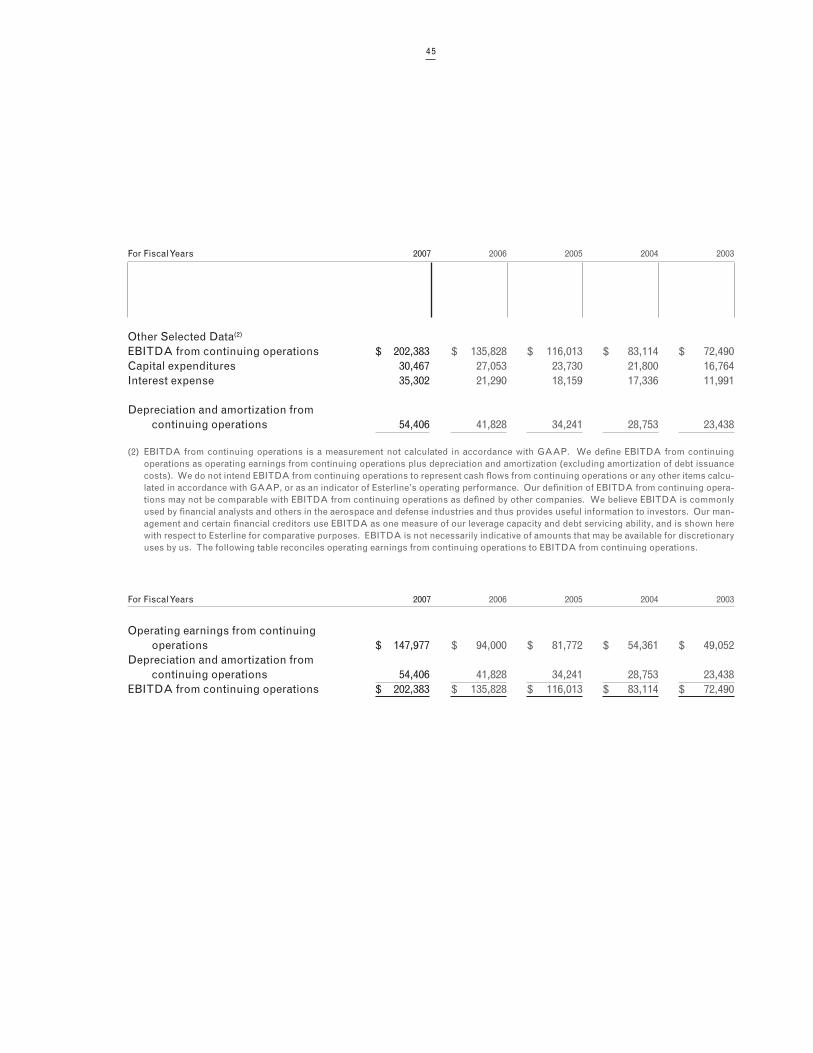
45
For Fiscal Years 2007 2006 2005 2004 2003
Other Selected Data(2)
EBITDA from continuing operations $ 202,383 $ 135,828 $ 116,013 $ 83,114 $ 72,490Capital expenditures 30,467 27,053 23,730 21,800 16,764Interest expense 35,302 21,290 18,159 17,336 11,991
Depreciation and amortization from continuing operations 54,406 41,828 34,241 28,753 23,438
(2) EBITDA from continuing operations is a measurement not calculated in accordance with GAAP. We define EBITDA from continuing operations as operating earnings from continuing operations plus depreciation and amortization (excluding amortization of debt issuance costs). We do not intend EBITDA from continuing operations to represent cash flows from continuing operations or any other items calcu-lated in accordance with GAAP, or as an indicator of Esterline’s operating performance. Our definition of EBITDA from continuing opera-tions may not be comparable with EBITDA from continuing operations as defined by other companies. We believe EBITDA is commonly used by financial analysts and others in the aerospace and defense industries and thus provides useful information to investors. Our man-agement and certain financial creditors use EBITDA as one measure of our leverage capacity and debt servicing ability, and is shown here with respect to Esterline for comparative purposes. EBITDA is not necessarily indicative of amounts that may be available for discretionary uses by us. The following table reconciles operating earnings from continuing operations to EBITDA from continuing operations.
For Fiscal Years 2007 2006 2005 2004 2003
Operating earnings from continuing operations $ 147,977 $ 94,000 $ 81,772 $ 54,361 $ 49,052Depreciation and amortization from continuing operations 54,406 41,828 34,241 28,753 23,438EBITDA from continuing operations $ 202,383 $ 135,828 $ 116,013 $ 83,114 $ 72,490
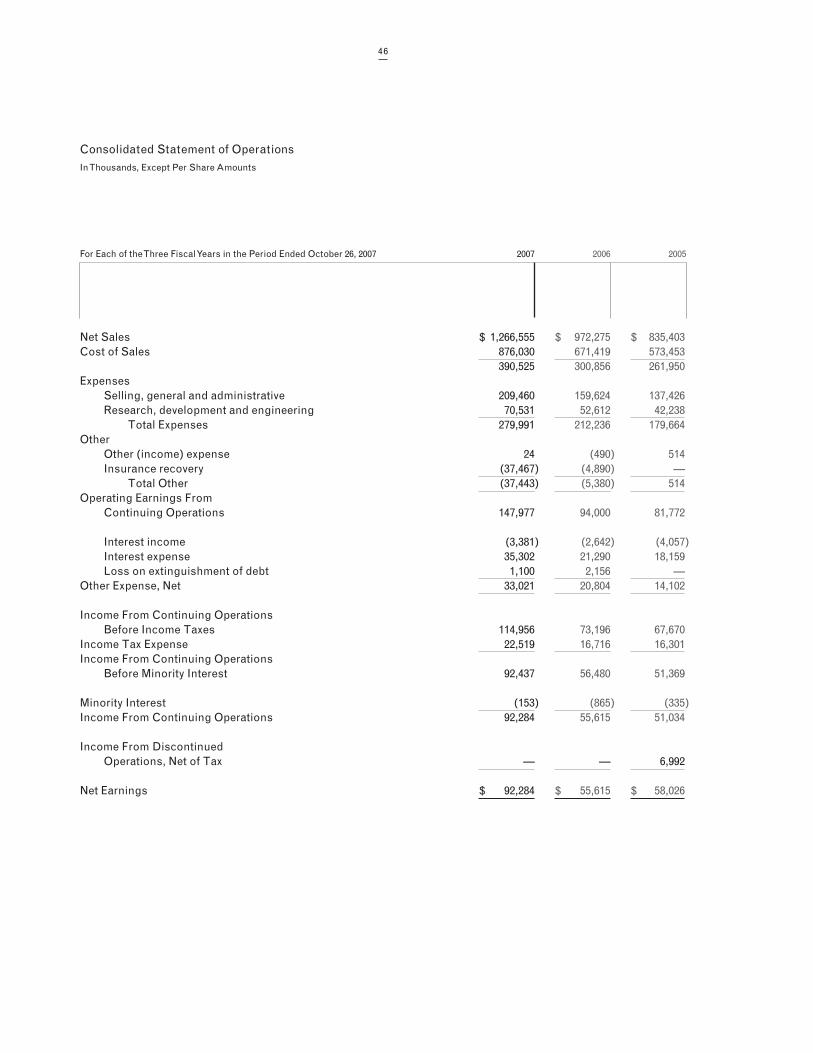
46
Consolidated Statement of OperationsIn Thousands, Except Per Share Amounts
For Each of the Three Fiscal Years in the Period Ended October 26, 2007 2007 2006 2005
Net Sales $ 1,266,555 $ 972,275 $ 835,403Cost of Sales 876,030 671,419 573,453 390,525 300,856 261,950Expenses Selling, general and administrative 209,460 159,624 137,426 Research, development and engineering 70,531 52,612 42,238 Total Expenses 279,991 212,236 179,664Other Other (income) expense 24 (490) 514 Insurance recovery (37,467) (4,890) — Total Other (37,443) (5,380) 514Operating Earnings From Continuing Operations 147,977 94,000 81,772
Interest income (3,381) (2,642) (4,057) Interest expense 35,302 21,290 18,159 Loss on extinguishment of debt 1,100 2,156 —Other Expense, Net 33,021 20,804 14,102
Income From Continuing Operations Before Income Taxes 114,956 73,196 67,670Income Tax Expense 22,519 16,716 16,301Income From Continuing Operations Before Minority Interest 92,437 56,480 51,369
Minority Interest (153) (865) (335)Income From Continuing Operations 92,284 55,615 51,034
Income From Discontinued Operations, Net of Tax — — 6,992
Net Earnings $ 92,284 $ 55,615 $ 58,026
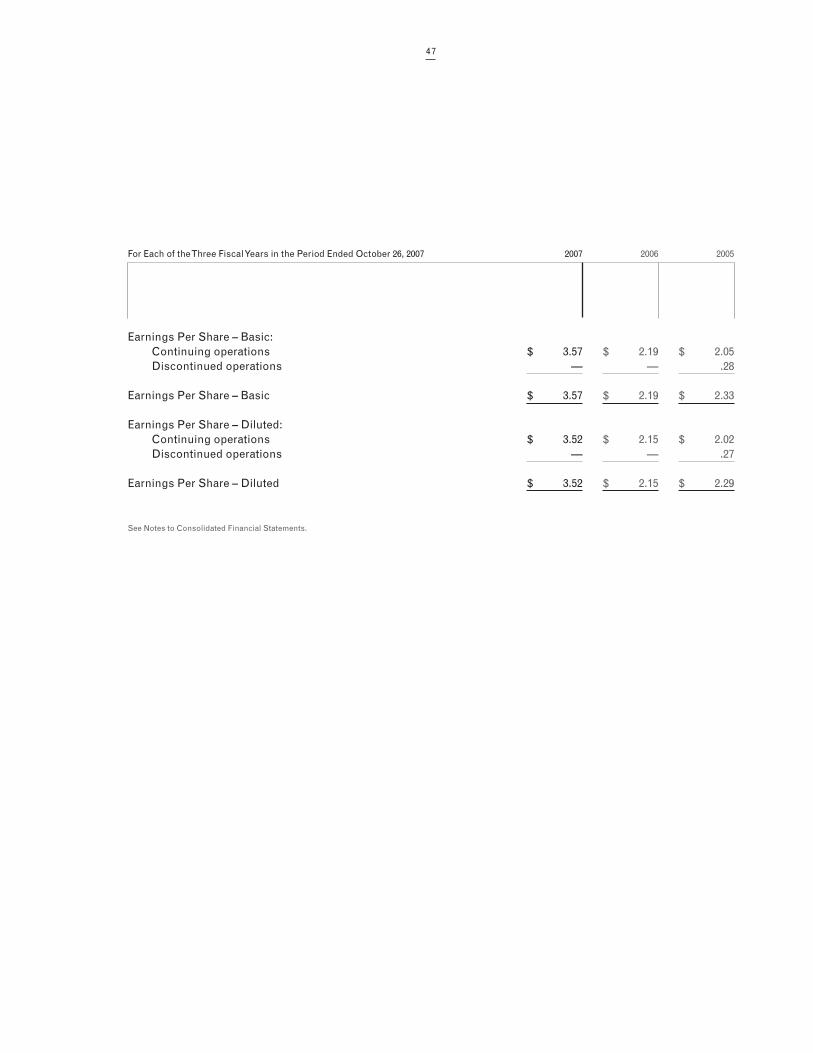
47
For Each of the Three Fiscal Years in the Period Ended October 26, 2007 2007 2006 2005
Earnings Per Share – Basic: Continuing operations $ 3.57 $ 2.19 $ 2.05 Discontinued operations — — .28
Earnings Per Share – Basic $ 3.57 $ 2.19 $ 2.33
Earnings Per Share – Diluted: Continuing operations $ 3.52 $ 2.15 $ 2.02 Discontinued operations — — .27
Earnings Per Share – Diluted $ 3.52 $ 2.15 $ 2.29
See Notes to Consolidated Financial Statements.
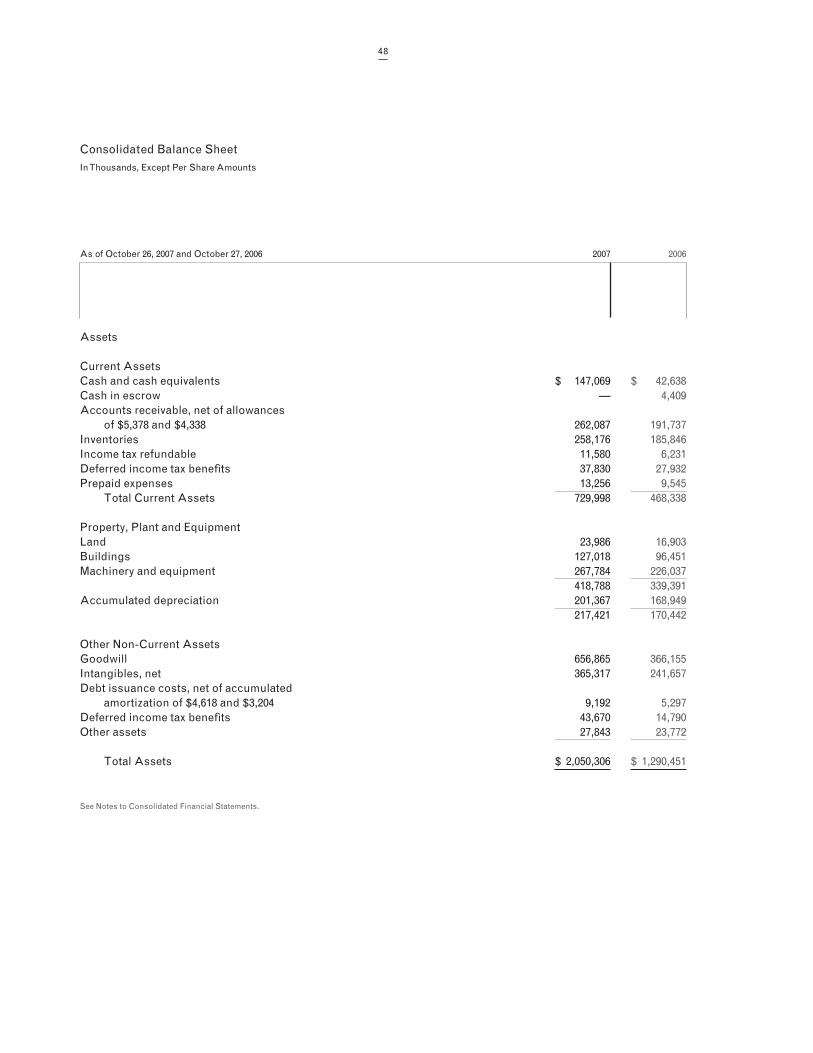
48
Consolidated Balance SheetIn Thousands, Except Per Share Amounts
As of October 26, 2007 and October 27, 2006 2007 2006
Assets
Current AssetsCash and cash equivalents $ 147,069 $ 42,638Cash in escrow — 4,409Accounts receivable, net of allowances of $5,378 and $4,338 262,087 191,737Inventories 258,176 185,846Income tax refundable 11,580 6,231Deferred income tax benefits 37,830 27,932Prepaid expenses 13,256 9,545 Total Current Assets 729,998 468,338
Property, Plant and EquipmentLand 23,986 16,903Buildings 127,018 96,451Machinery and equipment 267,784 226,037 418,788 339,391Accumulated depreciation 201,367 168,949 217,421 170,442
Other Non-Current AssetsGoodwill 656,865 366,155Intangibles, net 365,317 241,657Debt issuance costs, net of accumulated amortization of $4,618 and $3,204 9,192 5,297Deferred income tax benefits 43,670 14,790Other assets 27,843 23,772
Total Assets $ 2,050,306 $ 1,290,451
See Notes to Consolidated Financial Statements.
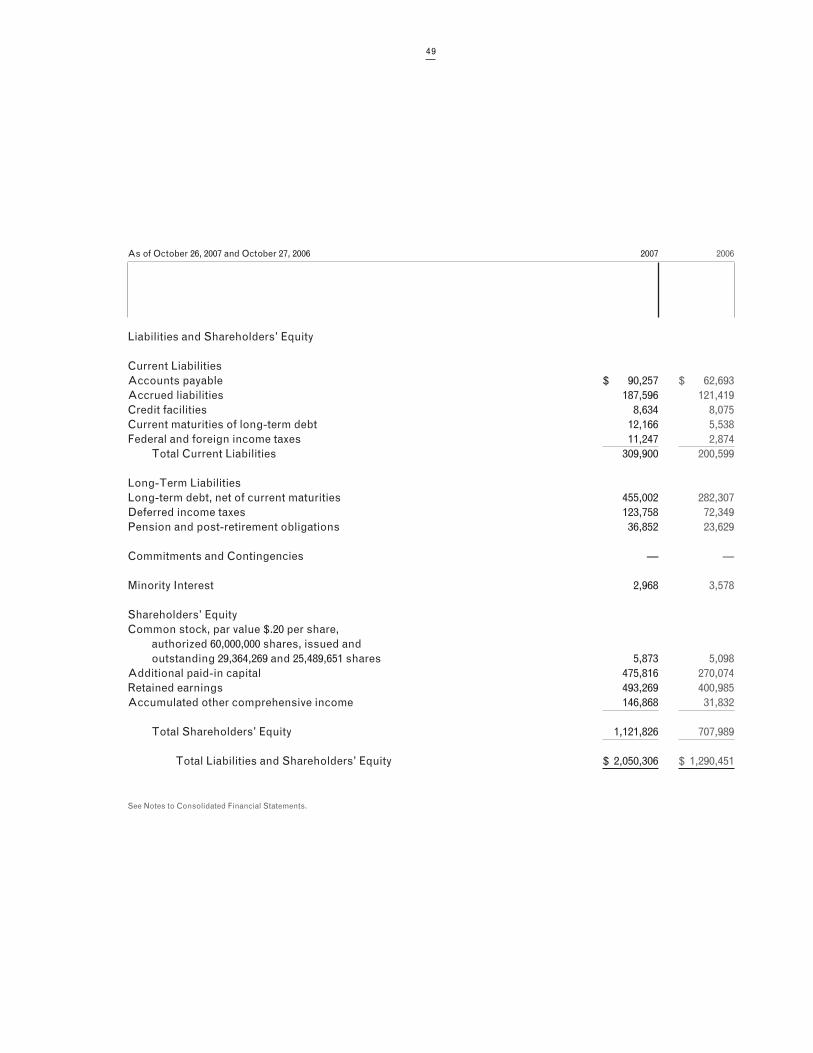
49
As of October 26, 2007 and October 27, 2006 2007 2006
Liabilities and Shareholders’ Equity
Current LiabilitiesAccounts payable $ 90,257 $ 62,693Accrued liabilities 187,596 121,419Credit facilities 8,634 8,075Current maturities of long-term debt 12,166 5,538Federal and foreign income taxes 11,247 2,874 Total Current Liabilities 309,900 200,599
Long-Term LiabilitiesLong-term debt, net of current maturities 455,002 282,307Deferred income taxes 123,758 72,349Pension and post-retirement obligations 36,852 23,629
Commitments and Contingencies — —
Minority Interest 2,968 3,578
Shareholders’ EquityCommon stock, par value $.20 per share, authorized 60,000,000 shares, issued and outstanding 29,364,269 and 25,489,651 shares 5,873 5,098Additional paid-in capital 475,816 270,074Retained earnings 493,269 400,985Accumulated other comprehensive income 146,868 31,832
Total Shareholders’ Equity 1,121,826 707,989
Total Liabilities and Shareholders’ Equity $ 2,050,306 $ 1,290,451
See Notes to Consolidated Financial Statements.
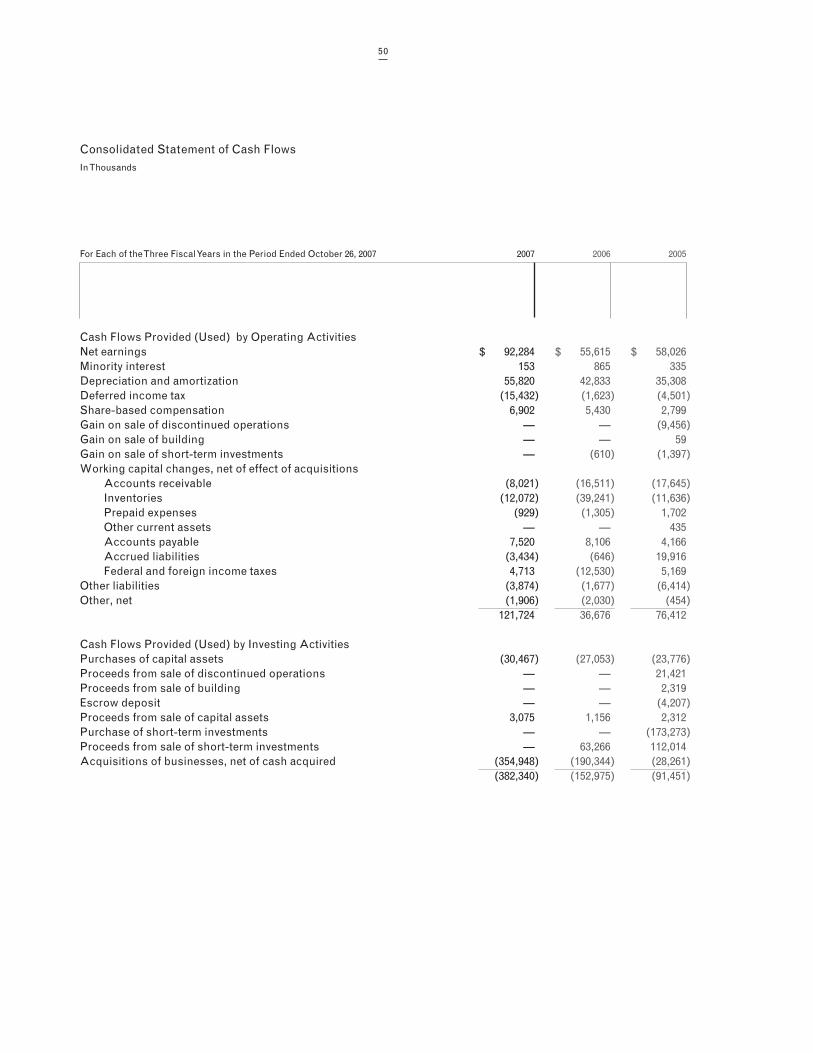
50
Consolidated Statement of Cash FlowsIn Thousands
For Each of the Three Fiscal Years in the Period Ended October 26, 2007 2007 2006 2005
Cash Flows Provided (Used) by Operating ActivitiesNet earnings $ 92,284 $ 55,615 $ 58,026Minority interest 153 865 335Depreciation and amortization 55,820 42,833 35,308Deferred income tax (15,432) (1,623) (4,501)Share-based compensation 6,902 5,430 2,799Gain on sale of discontinued operations — — (9,456)Gain on sale of building — — 59Gain on sale of short-term investments — (610) (1,397)Working capital changes, net of effect of acquisitions Accounts receivable (8,021) (16,511) (17,645) Inventories (12,072) (39,241) (11,636) Prepaid expenses (929) (1,305) 1,702 Other current assets — — 435 Accounts payable 7,520 8,106 4,166 Accrued liabilities (3,434) (646) 19,916 Federal and foreign income taxes 4,713 (12,530) 5,169Other liabilities (3,874) (1,677) (6,414)Other, net (1,906) (2,030) (454) 121,724 36,676 76,412
Cash Flows Provided (Used) by Investing ActivitiesPurchases of capital assets (30,467) (27,053) (23,776)Proceeds from sale of discontinued operations — — 21,421Proceeds from sale of building — — 2,319Escrow deposit — — (4,207)Proceeds from sale of capital assets 3,075 1,156 2,312Purchase of short-term investments — — (173,273)Proceeds from sale of short-term investments — 63,266 112,014Acquisitions of businesses, net of cash acquired (354,948) (190,344) (28,261) (382,340) (152,975) (91,451)
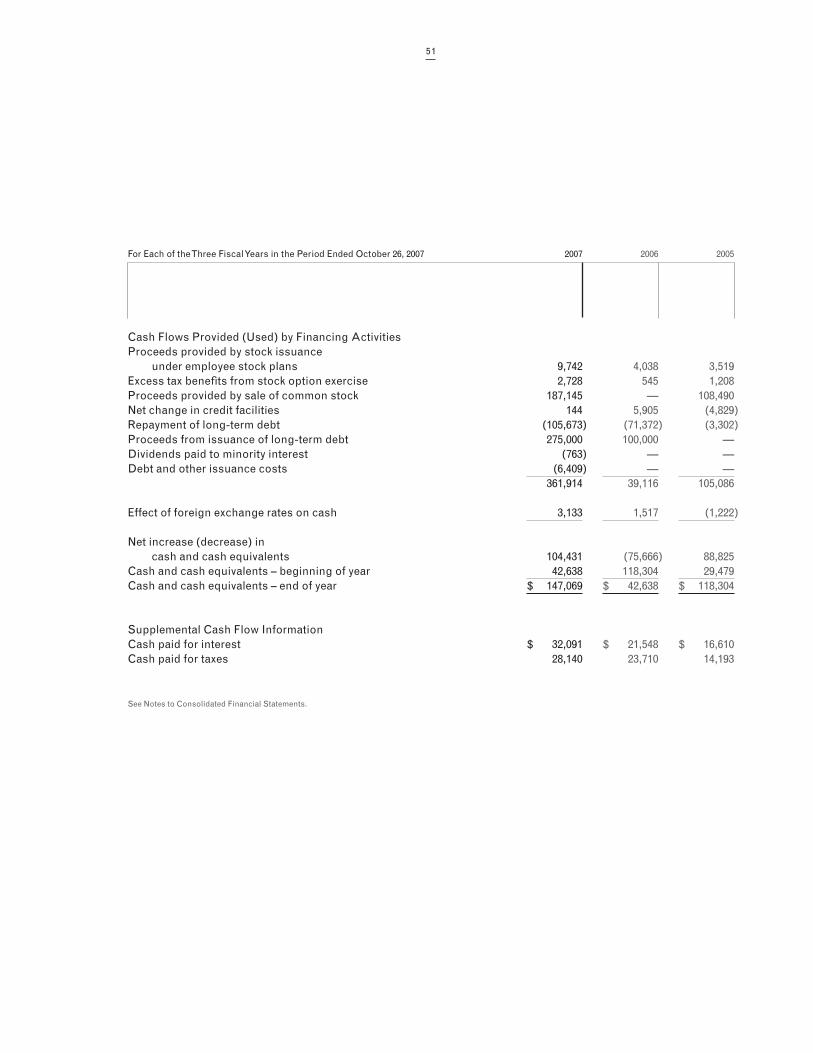
51
C
For Each of the Three Fiscal Years in the Period Ended October 26, 2007 2007 2006 2005
Cash Flows Provided (Used) by Financing ActivitiesProceeds provided by stock issuance under employee stock plans 9,742 4,038 3,519Excess tax benefits from stock option exercise 2,728 545 1,208Proceeds provided by sale of common stock 187,145 — 108,490Net change in credit facilities 144 5,905 (4,829)Repayment of long-term debt (105,673) (71,372) (3,302)Proceeds from issuance of long-term debt 275,000 100,000 —Dividends paid to minority interest (763) — —Debt and other issuance costs (6,409) — — 361,914 39,116 105,086
Effect of foreign exchange rates on cash 3,133 1,517 (1,222)
Net increase (decrease) in cash and cash equivalents 104,431 (75,666) 88,825Cash and cash equivalents – beginning of year 42,638 118,304 29,479Cash and cash equivalents – end of year $ 147,069 $ 42,638 $ 118,304
Supplemental Cash Flow InformationCash paid for interest $ 32,091 $ 21,548 $ 16,610Cash paid for taxes 28,140 23,710 14,193
See Notes to Consolidated Financial Statements.
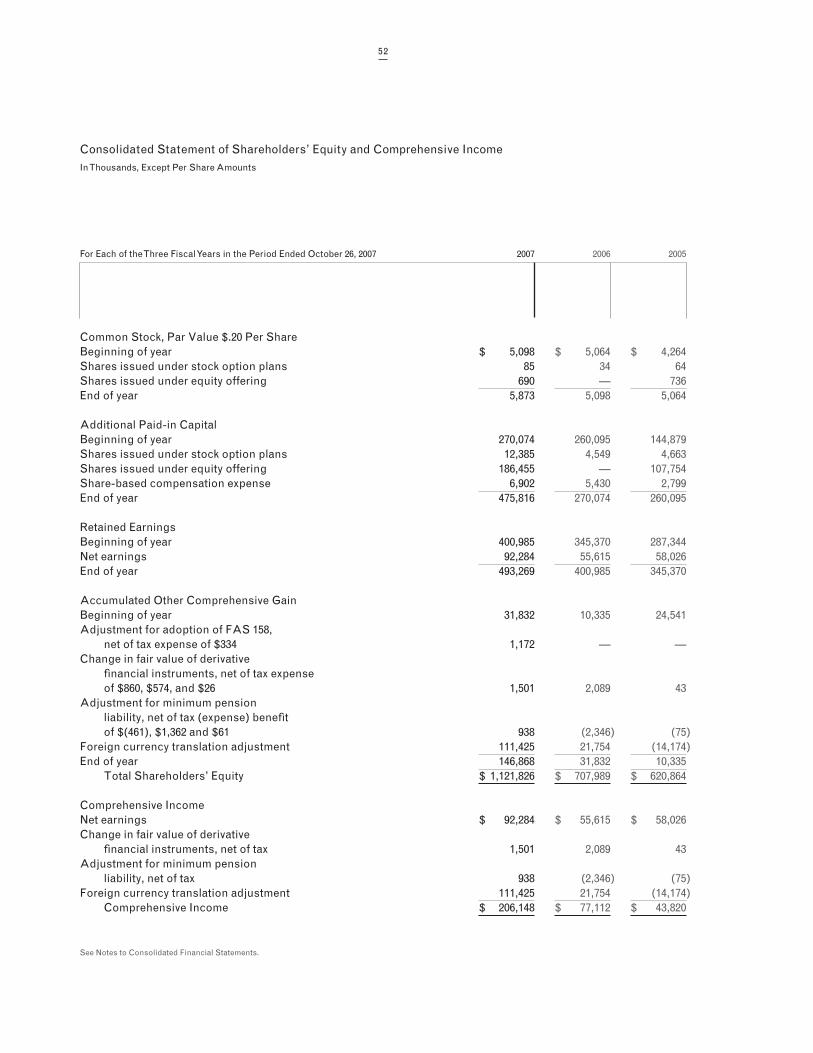
52
Consolidated Statement of Shareholders’ Equity and Comprehensive IncomeIn Thousands, Except Per Share Amounts
For Each of the Three Fiscal Years in the Period Ended October 26, 2007 2007 2006 2005
Common Stock, Par Value $.20 Per ShareBeginning of year $ 5,098 $ 5,064 $ 4,264Shares issued under stock option plans 85 34 64Shares issued under equity offering 690 — 736End of year 5,873 5,098 5,064
Additional Paid-in CapitalBeginning of year 270,074 260,095 144,879Shares issued under stock option plans 12,385 4,549 4,663Shares issued under equity offering 186,455 — 107,754Share-based compensation expense 6,902 5,430 2,799End of year 475,816 270,074 260,095
Retained EarningsBeginning of year 400,985 345,370 287,344Net earnings 92,284 55,615 58,026End of year 493,269 400,985 345,370
Accumulated Other Comprehensive GainBeginning of year 31,832 10,335 24,541Adjustment for adoption of FAS 158, net of tax expense of $334 1,172 — —Change in fair value of derivative financial instruments, net of tax expense of $860, $574, and $26 1,501 2,089 43Adjustment for minimum pension liability, net of tax (expense) benefit of $(461), $1,362 and $61 938 (2,346) (75)Foreign currency translation adjustment 111,425 21,754 (14,174)End of year 146,868 31,832 10,335 Total Shareholders’ Equity $ 1,121,826 $ 707,989 $ 620,864
Comprehensive IncomeNet earnings $ 92,284 $ 55,615 $ 58,026Change in fair value of derivative financial instruments, net of tax 1,501 2,089 43Adjustment for minimum pension liability, net of tax 938 (2,346) (75)Foreign currency translation adjustment 111,425 21,754 (14,174) Comprehensive Income $ 206,148 $ 77,112 $ 43,820
See Notes to Consolidated Financial Statements.
53
Notes to Consolidated Financial Statements
Note 1 : Accounting Policies
Nature of OperationsEsterline Technologies Corporation (the Company) designs, manufactures and markets highly engineered products. The Company serves the aerospace and defense industry, primarily in the United States and Europe. The Company also serves the industrial/commercial and medical markets.
Principles of Consolidation and Basis of PresentationThe consolidated financial statements include the accounts of the Company and all subsidiaries. All significant in-tercompany accounts and transactions have been eliminated. Classifications have been changed for certain amounts in prior periods to conform with the current year’s presentation. The Company’s fiscal year ends on the last Friday of October.
Management EstimatesTo prepare financial statements in conformity with U.S. generally accepted accounting principles, management is required to make estimates and assumptions that affect the reported amounts of assets and liabilities, disclosure of contingent assets and liabilities at the date of the financial statements, and the reported amounts of revenues and expenses during the reporting period. Actual results could differ from those estimates.
Concentration of RisksThe Company’s products are principally focused on the aerospace and defense industry, which includes military and commercial aircraft original equipment manufacturers and their suppliers, commercial airlines, and the United States and foreign governments. Accordingly, the Company’s current and future financial performance is dependent on the economic condition of the aerospace and defense industry. The commercial aerospace market has historically been subject to cyclical downturns during periods of weak economic conditions or material changes arising from domestic or international events. Management believes that the Company’s sales are fairly well balanced across its customer base, which includes not only aerospace and defense customers but also medical and industrial commercial custom-ers. However, material changes in the economic conditions of the aerospace industry could have a material effect on the Company’s results of operations, financial position or cash flows.

54
Revenue RecognitionThe Company recognizes revenue when the title and risk of loss have passed to the customer, there is persuasive evidence of an agreement, delivery has occurred or services have been rendered, the price is determinable, and the collectibility is reasonably assured. The Company recognizes product revenues at the point of shipment or delivery in accordance with the terms of sale. Sales are net of returns and allowances. Returns and allowances are not significant because products are manufactured to customer specification and are covered by the terms of the product warranty.
Revenues and profits on fixed-price contracts with significant engineering as well as production requirements are recorded based on the achievement of contractual milestones and the ratio of total actual incurred costs to date to total estimated costs for each contract (cost-to-cost method) in accordance with the American Institute of Certified Public Accountants Statement of Position 81-1, “Accounting for Performance of Construction-Type and Certain Production-Type Contracts.” Types of milestones include design review and prototype completion. The Company reviews cost performance and estimates to complete on its ongoing contracts at least quarterly. The impact of revisions of profit estimates are recognized on a cumulative catch-up basis in the period in which the revisions are made. Provisions for anticipated losses on contracts are recorded in the period they become evident. Amounts representing contract change orders are included in revenue only when they can be reliably estimated and realization is probable, and are determined on a percentage-of-completion basis measured by the cost-to-cost method. Claims are included in revenue only when they are probable of collection.
Research and DevelopmentExpenditures for internally-funded research and development are expensed as incurred. Customer-funded research and development projects performed under contracts are accounted for as work in process as work is performed and recognized as cost of sales and sales when contract milestones are achieved. Research and development expenditures are net of government assistance and tax subsidies, which are not contingent upon paying income tax.
Financial InstrumentsFair Value of Financial Instruments
The Company’s financial instruments consist primarily of cash and cash equivalents, accounts receivable, ac-counts payable, short-term borrowings, long-term debt, foreign currency forward contracts, and interest rate swap agreements. The carrying amounts of cash and cash equivalents, accounts receivable, and accounts payable ap-proximate their respective fair values because of the short-term maturities or expected settlement dates of these instruments. The fair market value of the Company’s long-term debt and short-term borrowings was estimated at $469.5 million and $300.6 million at fiscal year end 2007 and 2006, respectively. These estimates were derived us-ing discounted cash flows with interest rates currently available to the Company for issuance of debt with similar terms and remaining maturities.
Foreign Currency Exchange Risk Management
The Company is subject to risks associated with fluctuations in foreign currency exchange rates from the sale of products in currencies other than its functional currency. The Company’s policy is to hedge a portion of its forecasted transactions using forward exchange contracts, with maturities up to fifteen months. These forward contracts have been designated as cash flow hedges. The portion of the net gain or loss on a derivative instrument that is effective as a hedge is reported as a component of other comprehensive income in shareholders’ equity and is reclassified into earnings in the same period during which the hedged transaction affects earnings. The remaining net gain or loss on the derivative in excess of the present value of the expected cash flows of the hedged transaction is recorded in earnings immediately. If a derivative does not qualify for hedge accounting, or a portion of the hedge is deemed ineffective, the change in fair value is recorded in earnings. The amount of hedge inef-fectiveness has not been material in any of the three fiscal years in the period ended October 26, 2007. At October 26, 2007 and October 27, 2006, the notional value of foreign currency forward contracts accounted for as a cash flow hedge was $54.2 million and $52.8 million, respectively. The fair value of these contracts was a $2.6 million asset and a $0.8 million asset at October 26, 2007 and October 27, 2006, respectively. The Company does not enter into any forward contracts for trading purposes.
In February 2006, the Company entered into a term loan for U.K. £57.0 million. The Company designated the term loan as a hedge of the investment in a certain U.K. business unit. The foreign currency gain or loss that is effective as a hedge is reported as a component of other comprehensive income in shareholders’ equity. The amount of foreign currency translation loss included in Other Comprehensive Income was $5.6 million and $5.1 million net of taxes at October 26, 2007 and October 27, 2006, respectively. To the extent that this hedge is ineffec-tive, the foreign currency gain or loss is recorded in earnings. There was no ineffectiveness in 2007.
55
Interest Rate Risk Management
Depending on the interest rate environment, the Company may enter into interest rate swap agreements to convert the fixed interest rates on notes payable to variable interest rates or terminate any swap agreements in place. These interest rate swap agreements have been designated as fair value hedges. Accordingly, gain or loss on swap agree-ments as well as the offsetting loss or gain on the hedged portion of notes payable are recognized in interest expense during the period of the change in fair values. The Company attempts to manage exposure to counterparty credit risk by only entering into agreements with major financial institutions which are expected to be able to fully perform under the terms of the agreement. In September 2003, the Company entered into an interest rate swap agreement on $75.0 million of its Senior Subordinated Notes due in 2013. The swap agreement exchanged the fixed interest rate for a variable interest rate on $75.0 million of the $175.0 million principal amount outstanding. The fair market value of the Company’s interest rate swap was an asset of $0.3 million and a liability of $0.7 million at October 26, 2007 and October 27, 2006, respectively.
Depending on the interest rate environment, the Company may enter into interest rate swap agreements to con-vert the variable interest rates on notes payable to fixed interest rates. These swap agreements are accounted for as cash flow hedges and the fair market value of the hedge instrument is included in Other Comprehensive Income. In February 2006, the Company entered into an interest rate swap agreement on the full principal amount of its U.K. £57.0 million term loan facility. The swap agreement exchanged the variable interest rate for a fixed interest rate of 4.75% plus an additional margin amount determined by reference to the Company’s leverage ratio. The fair value of the inter-est rate swap was an asset of $2.1 million and $1.5 million at October 26, 2007 and October 27, 2006, respectively.
The fair market value of the interest rate swaps was estimated by discounting expected cash flows using quoted market interest rates.
Foreign Currency TranslationForeign currency assets and liabilities are translated into their U.S. dollar equivalents based on year-end exchange rates. Revenue and expense accounts are translated at average exchange rates. Aggregate exchange gains and loss-es arising from the translation of foreign assets and liabilities are included in shareholders’ equity as a component of comprehensive income. Accumulated foreign currency translation adjustment was $155.7 million, $38.5 million and $16.7 million as of the fiscal years ended October 26, 2007, October 27, 2006 and October 28, 2005, respectively. Foreign currency transaction gains and losses are included in results of operations. These transactions resulted in a $6.1 mil-lion and $0.5 million loss in fiscal 2007 and 2006, respectively, and a $1.2 million gain in fiscal 2005.
Cash Equivalents and Cash in EscrowCash equivalents consist of highly liquid investments with maturities of three months or less at the date of purchase. Fair value of cash equivalents approximates carrying value. Cash in escrow represents amounts held in escrow pend-ing finalization of a purchase transaction. Cash equivalents include $10.0 million in cash under a letter of credit facility at October 26, 2007 and October 27, 2006.
Accounts ReceivableAccounts receivable are recorded at the net invoice price for sales billed to customers. Accounts receivable are considered past due when outstanding more than normal trade terms allow. An allowance for doubtful accounts is established when losses are expected to be incurred. Accounts receivable are written off to the allowance for doubt-ful accounts when the balance is considered to be uncollectible.
InventoriesInventories are stated at the lower of cost or market using the first-in, first-out (FIFO) or average cost method. Inven-tory cost includes material, labor and factory overhead. The Company defers pre-production engineering costs as work-in-process inventory in connection with long-term supply arrangements that include contractual guarantees for reimbursement from the customer. Inventory reserves are provided when inventory is considered to be excess or obsolete based upon an analysis of actual on-hand quantities on a part level basis to forecasted product demand and historical usage. Inventory reserves are released based upon adjustments to forecasted demand.
Property, Plant and Equipment, and DepreciationProperty, plant and equipment is carried at cost and includes expenditures for major improvements. Depreciation is generally provided on the straight-line method based upon estimated useful lives ranging from 15 to 30 years for

56
buildings, and 3 to 10 years for machinery and equipment. Depreciation expense was $34,273,000, $26,757,000 and $23,578,000 for fiscal years 2007, 2006 and 2005, respectively. The fair value of liabilities related to the retirement of property is recorded when there is a legal or contractual obligation to incur asset retirement costs and the costs can be estimated. The Company records the asset retirement cost by increasing the carrying cost of the underlying property by the amount of the asset retirement obligation. The asset retirement cost is depreciated over the estimated useful life of the underlying property.
Debt Issuance CostsCosts incurred to issue debt are deferred and amortized as interest expense over the term of the related debt using a method that approximates the effective interest method.
Long-lived AssetsThe carrying amount of long-lived assets is reviewed periodically for impairment. An asset (other than goodwill and indefinite-lived intangible assets) is considered impaired when estimated future cash flows are less than the carrying amount of the asset. In the event the carrying amount of such asset is not deemed recoverable, the asset is adjusted to its estimated fair value. Fair value is generally determined based upon estimated discounted future cash flows.
Goodwill and IntangiblesGoodwill is not amortized under Statement No. 142, but is tested for impairment at least annually. A reporting unit is generally defined at the operating segment level or at the component level one level below the operating segment, if said component constitutes a business. Goodwill and intangible assets are allocated to reporting units based upon the purchase price of the acquired unit, the valuation of acquired tangible and intangible assets, and liabilities as-sumed. When a reporting unit’s carrying value exceeds its estimated fair value, an impairment test is required. This test involves allocating the fair value of the reporting unit to all of the assets and liabilities of that unit, with the excess of fair value over allocated net assets representing the fair value of goodwill. An impairment loss is measured as the amount by which the carrying value of goodwill exceeds the estimated fair value of goodwill.
Intangible assets are amortized using the straight-line method over their estimated period of benefit, ranging from 2 to 20 years. The Company periodically evaluates the recoverability of intangible assets and takes into account events or circumstances that warrant revised estimates of useful lives or that indicate that an impairment exists.
Indefinite-lived intangible assets (other than goodwill) are tested annually for impairment or more frequently on an interim basis if circumstances require. This test is comparable to the impairment test for goodwill described above.
EnvironmentalEnvironmental exposures are provided for at the time they are known to exist or are considered probable and reason-ably estimable. No provision has been recorded for environmental remediation costs which could result from changes in laws or other circumstances currently not contemplated by the Company. Costs provided for future expenditures on environmental remediation are not discounted to present value.
Pension Plan and Post-Retirement Benefit Plan ObligationsThe Company accounts for the obligations of its employee pension benefit costs and post-retirement benefits in accordance with the applicable statements issued by the Financial Accounting Standards Board. In accordance with these statements, management selects appropriate assumptions including discount rate, rate of increase in future compensation levels and assumed long-term rate of return on plan assets and expected annual increases in costs of medical and other healthcare benefits in regard to the Company’s post-retirement benefit obligations. These assumptions are based upon historical results, the current economic environment and reasonable expectations of future events. Actual results which vary from assumptions are accumulated and amortized over future periods and, accordingly, are recognized in expense in these periods. Significant differences between our assumptions and actual experience or significant changes in assumptions could impact the pension costs and the pension obligation.
Share-Based CompensationEffective October 29, 2005, the Company adopted Statement of Financial Accounting Standards No. 123 (revised 2004), “Share-Based Payment” (Statement No. 123(R)), which requires the Company to measure the cost of employee ser-vices received in exchange for an award of equity instruments based on the grant-date fair value of the award. The Company adopted Statement No. 123(R) using the modified prospective method effective October 29, 2005. The cu-mulative effect of the change in accounting principle upon adoption of Statement No. 123(R) was included in selling, general and administrative expense as the amount was not significant.
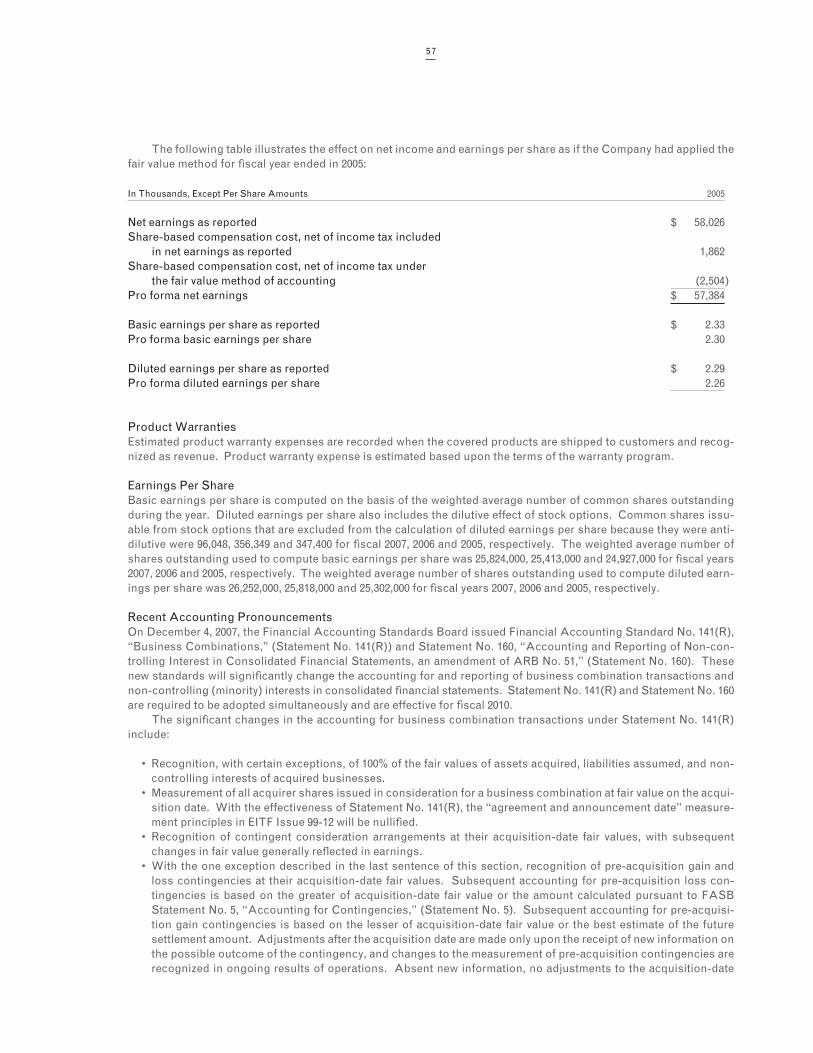
57
The following table illustrates the effect on net income and earnings per share as if the Company had applied the fair value method for fiscal year ended in 2005:
In Thousands, Except Per Share Amounts 2005
Net earnings as reported $ 58,026Share-based compensation cost, net of income tax included in net earnings as reported 1,862Share-based compensation cost, net of income tax under the fair value method of accounting (2,504)Pro forma net earnings $ 57,384
Basic earnings per share as reported $ 2.33Pro forma basic earnings per share 2.30
Diluted earnings per share as reported $ 2.29Pro forma diluted earnings per share 2.26
Product WarrantiesEstimated product warranty expenses are recorded when the covered products are shipped to customers and recog-nized as revenue. Product warranty expense is estimated based upon the terms of the warranty program.
Earnings Per ShareBasic earnings per share is computed on the basis of the weighted average number of common shares outstanding during the year. Diluted earnings per share also includes the dilutive effect of stock options. Common shares issu-able from stock options that are excluded from the calculation of diluted earnings per share because they were anti-dilutive were 96,048, 356,349 and 347,400 for fiscal 2007, 2006 and 2005, respectively. The weighted average number of shares outstanding used to compute basic earnings per share was 25,824,000, 25,413,000 and 24,927,000 for fiscal years 2007, 2006 and 2005, respectively. The weighted average number of shares outstanding used to compute diluted earn-ings per share was 26,252,000, 25,818,000 and 25,302,000 for fiscal years 2007, 2006 and 2005, respectively.
Recent Accounting PronouncementsOn December 4, 2007, the Financial Accounting Standards Board issued Financial Accounting Standard No. 141(R), “Business Combinations,” (Statement No. 141(R)) and Statement No. 160, “Accounting and Reporting of Non-con-trolling Interest in Consolidated Financial Statements, an amendment of ARB No. 51,” (Statement No. 160). These new standards will significantly change the accounting for and reporting of business combination transactions and non-controlling (minority) interests in consolidated financial statements. Statement No. 141(R) and Statement No. 160 are required to be adopted simultaneously and are effective for fiscal 2010.
The significant changes in the accounting for business combination transactions under Statement No. 141(R) include:
• Recognition, with certain exceptions, of 100% of the fair values of assets acquired, liabilities assumed, and non-controlling interests of acquired businesses.
• Measurement of all acquirer shares issued in consideration for a business combination at fair value on the acqui-sition date. With the effectiveness of Statement No. 141(R), the “agreement and announcement date” measure-ment principles in EITF Issue 99-12 will be nullified.
• Recognition of contingent consideration arrangements at their acquisition-date fair values, with subsequent changes in fair value generally reflected in earnings.
• With the one exception described in the last sentence of this section, recognition of pre-acquisition gain and loss contingencies at their acquisition-date fair values. Subsequent accounting for pre-acquisition loss con-tingencies is based on the greater of acquisition-date fair value or the amount calculated pursuant to FASB Statement No. 5, “Accounting for Contingencies,” (Statement No. 5). Subsequent accounting for pre-acquisi-tion gain contingencies is based on the lesser of acquisition-date fair value or the best estimate of the future settlement amount. Adjustments after the acquisition date are made only upon the receipt of new information on the possible outcome of the contingency, and changes to the measurement of pre-acquisition contingencies are recognized in ongoing results of operations. Absent new information, no adjustments to the acquisition-date

58
fair value are made until the contingency is resolved. Pre-acquisition contingencies that are both (1) non-con-tractual and (2) as of the acquisition date are “not more likely than not” of materializing are not recognized in acquisition accounting and, instead, are accounted for based on the guidance in Statement No. 5, “Accounting for Contingencies.”
• Capitalization of in-process research and development (IPR&D) assets acquired at acquisition date fair value. After acquisition, apply the indefinite-lived impairment model (lower of basis or fair value) through the develop-ment period to capitalized IPR&D without amortization. Charge development costs incurred after acquisition to results of operations. Upon completion of a successful development project, assign an estimated useful life to the amount then capitalized, amortize over that life, and consider the asset a definite-lived asset for impairment accounting purposes.
• Recognition of acquisition-related transaction costs as expense when incurred.• Recognition of acquisition-related restructuring cost accruals in acquisition accounting only if the criteria in
Statement No. 146 are met as of the acquisition date. With the effectiveness of Statement No. 141(R), the EITF Issue 95-3 concepts of “assessing, formulating, finalizing and committing/communicating” that currently pertain to recognition in purchase accounting of an acquisition-related restructuring plan will be nullified.
• Recognition of changes in the acquirer’s income tax valuation allowance resulting from the business combina-tion separately from the business combination as adjustments to income tax expense. Also, changes after the acquisition date in an acquired entity’s valuation allowance or tax uncertainty established at the acquisition date are accounted for as adjustments to income tax expense.
The Company is currently evaluating the impact of Statement No. 141(R) and Statement No. 160 on the Company’s financial statements.
In September 2006, the Financial Accounting Standards Board issued Statement of Financial Accounting Stan-dards No. 157, “Fair Value Measurements.” Statement No. 157 defines fair value, establishes a framework for measur-ing fair value in generally accepted accounting principles, and expands disclosures about fair value measurements. Statement No. 157 applies under other accounting pronouncements that require or permit fair value measurements. Statement No. 157 indicates, among other things, that a fair value measurement assumes the transaction to sell the asset or transfer the liability occurs in the principal market for the asset or liability or, in the absence of a principal market, the most advantageous market for the asset or liability. Statement No. 157 is effective for the Company’s year ending October 29, 2010, for all non-financial assets and liabilities. For those items that are recognized or disclosed at fair value in the financial statements, the effective date is October 30, 2009. The Company is currently evaluating the impact of Statement No. 157 on the Company’s financial statements.
In June 2006, the Financial Accounting Standards Board issued FIN No. 48, “Accounting for Uncertainty in In-come Taxes—an interpretation of FASB Statement No. 109,” which clarifies the accounting for uncertainty in income taxes recognized in an enterprises’ financial statements in accordance with FASB Statement No. 109, “Accounting for Income Taxes.” The interpretation prescribes a recognition method and measurement attribute for the financial statement recognition and measurement of a tax position taken or expected to be taken in a tax return. FIN No. 48 requires recognition of tax benefits that satisfy a greater than 50% probability threshold. FIN No. 48 also provides guidance on derecognition, classification, interest and penalties, accounting in interim periods, disclosure, and tran-sition. FIN No. 48 is effective for the Company beginning October 27, 2007. The Company has substantially completed the process of evaluating the effect of FIN 48 on its consolidated financial statements as of the beginning of the period of adoption, October 27, 2007. The Company estimates that the cumulative effect of applying this interpretation will be recorded as a $300,000 to $500,000 decrease to beginning retained earnings. In addition, in accordance with the provisions of FIN 48, the Company will reclassify an estimated $3.3 million of long-term deferred income tax liabilities to income taxes payable.
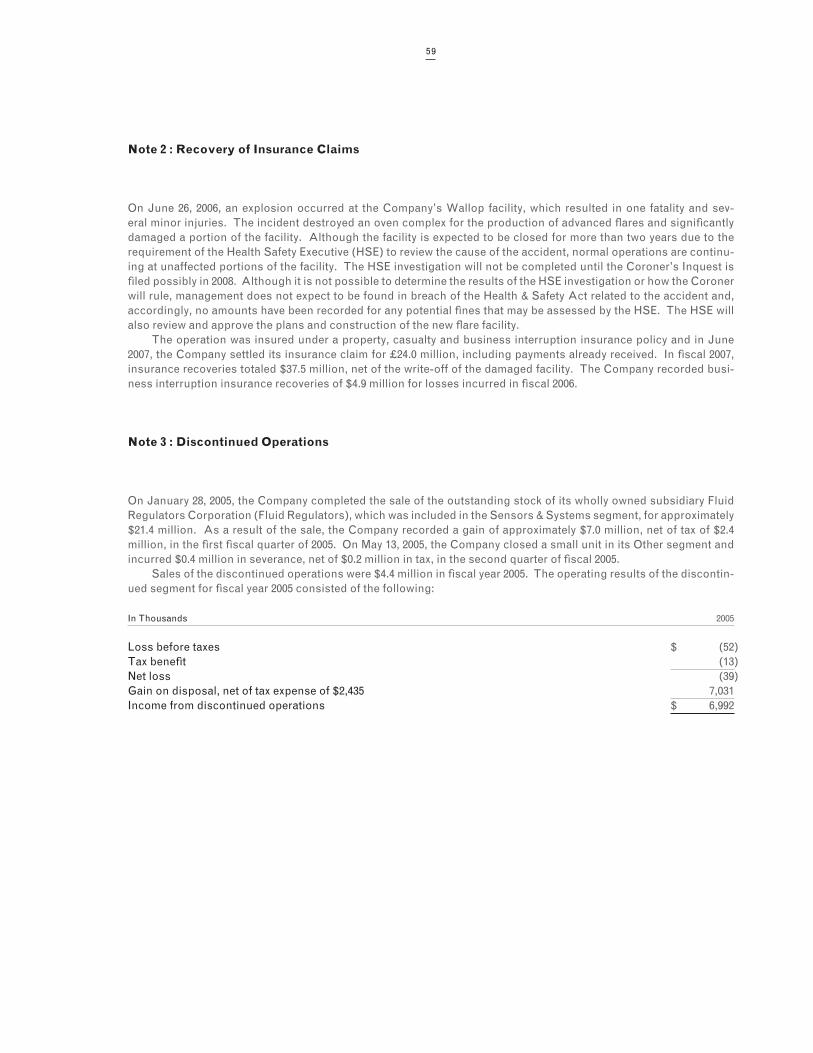
59
Note 2 : Recovery of Insurance Claims
On June 26, 2006, an explosion occurred at the Company’s Wallop facility, which resulted in one fatality and sev-eral minor injuries. The incident destroyed an oven complex for the production of advanced flares and significantly damaged a portion of the facility. Although the facility is expected to be closed for more than two years due to the requirement of the Health Safety Executive (HSE) to review the cause of the accident, normal operations are continu-ing at unaffected portions of the facility. The HSE investigation will not be completed until the Coroner’s Inquest is filed possibly in 2008. Although it is not possible to determine the results of the HSE investigation or how the Coroner will rule, management does not expect to be found in breach of the Health & Safety Act related to the accident and, accordingly, no amounts have been recorded for any potential fines that may be assessed by the HSE. The HSE will also review and approve the plans and construction of the new flare facility.
The operation was insured under a property, casualty and business interruption insurance policy and in June 2007, the Company settled its insurance claim for £24.0 million, including payments already received. In fiscal 2007, insurance recoveries totaled $37.5 million, net of the write-off of the damaged facility. The Company recorded busi-ness interruption insurance recoveries of $4.9 million for losses incurred in fiscal 2006.
Note 3 : Discontinued Operations
On January 28, 2005, the Company completed the sale of the outstanding stock of its wholly owned subsidiary Fluid Regulators Corporation (Fluid Regulators), which was included in the Sensors & Systems segment, for approximately $21.4 million. As a result of the sale, the Company recorded a gain of approximately $7.0 million, net of tax of $2.4 million, in the first fiscal quarter of 2005. On May 13, 2005, the Company closed a small unit in its Other segment and incurred $0.4 million in severance, net of $0.2 million in tax, in the second quarter of fiscal 2005.
Sales of the discontinued operations were $4.4 million in fiscal year 2005. The operating results of the discontin-ued segment for fiscal year 2005 consisted of the following:
In Thousands 2005
Loss before taxes $ (52)Tax benefit (13)Net loss (39)Gain on disposal, net of tax expense of $2,435 7,031Income from discontinued operations $ 6,992
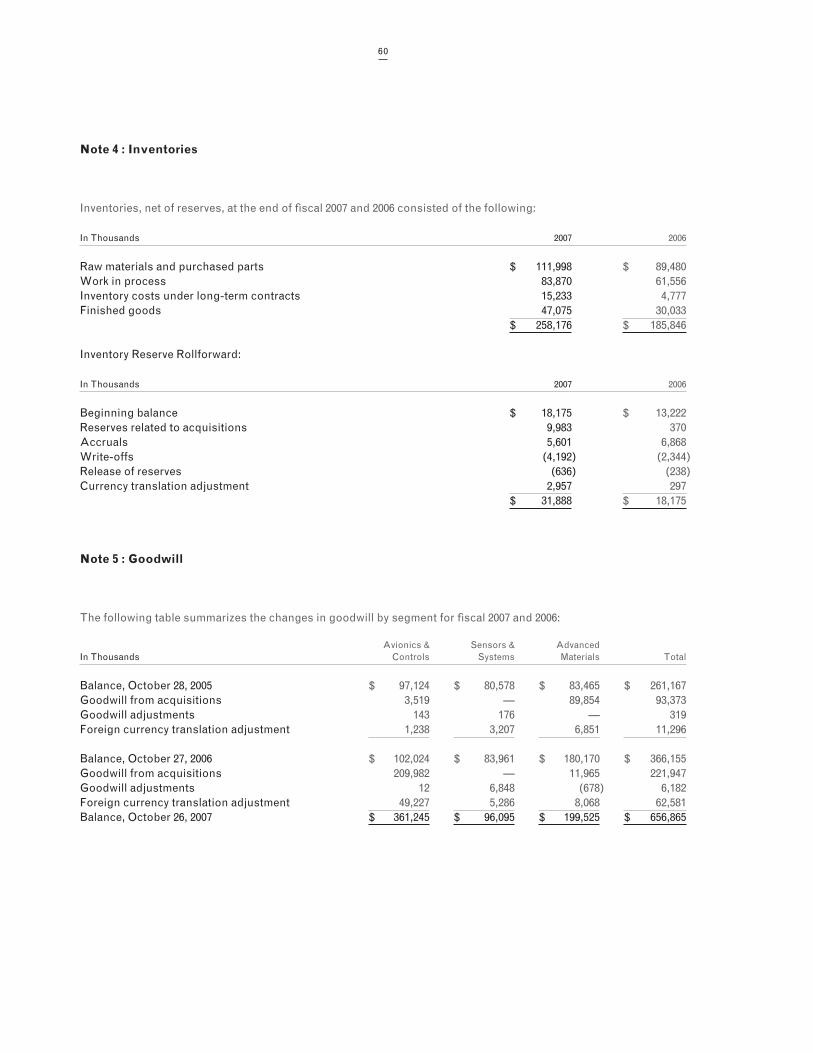
60
Note 4 : Inventories
Inventories, net of reserves, at the end of fiscal 2007 and 2006 consisted of the following:
In Thousands 2007 2006
Raw materials and purchased parts $ 111,998 $ 89,480Work in process 83,870 61,556Inventory costs under long-term contracts 15,233 4,777Finished goods 47,075 30,033 $ 258,176 $ 185,846
Inventory Reserve Rollforward:
In Thousands 2007 2006
Beginning balance $ 18,175 $ 13,222Reserves related to acquisitions 9,983 370Accruals 5,601 6,868Write-offs (4,192) (2,344)Release of reserves (636) (238)Currency translation adjustment 2,957 297 $ 31,888 $ 18,175
Note 5 : Goodwill
The following table summarizes the changes in goodwill by segment for fiscal 2007 and 2006:
Avionics & Sensors & AdvancedIn Thousands Controls Systems Materials Total
Balance, October 28, 2005 $ 97,124 $ 80,578 $ 83,465 $ 261,167Goodwill from acquisitions 3,519 — 89,854 93,373Goodwill adjustments 143 176 — 319Foreign currency translation adjustment 1,238 3,207 6,851 11,296
Balance, October 27, 2006 $ 102,024 $ 83,961 $ 180,170 $ 366,155Goodwill from acquisitions 209,982 — 11,965 221,947Goodwill adjustments 12 6,848 (678) 6,182Foreign currency translation adjustment 49,227 5,286 8,068 62,581Balance, October 26, 2007 $ 361,245 $ 96,095 $ 199,525 $ 656,865
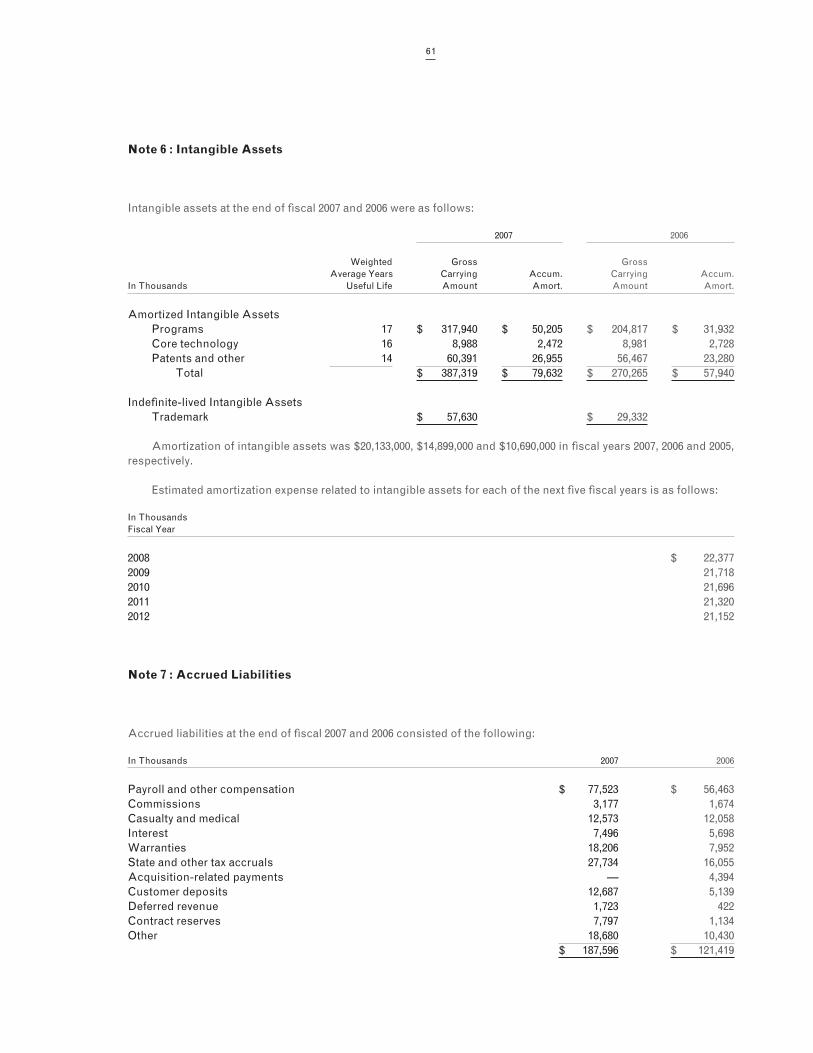
61
Note 6 : Intangible Assets
Intangible assets at the end of fiscal 2007 and 2006 were as follows:
2007 2006
Weighted Gross Gross Average Years Carrying Accum. Carrying Accum.In Thousands Useful Life Amount Amort. Amount Amort.
Amortized Intangible Assets Programs 17 $ 317,940 $ 50,205 $ 204,817 $ 31,932 Core technology 16 8,988 2,472 8,981 2,728 Patents and other 14 60,391 26,955 56,467 23,280 Total $ 387,319 $ 79,632 $ 270,265 $ 57,940
Indefinite-lived Intangible Assets Trademark $ 57,630 $ 29,332
Amortization of intangible assets was $20,133,000, $14,899,000 and $10,690,000 in fiscal years 2007, 2006 and 2005, respectively.
Estimated amortization expense related to intangible assets for each of the next five fiscal years is as follows:
In ThousandsFiscal Year
2008 $ 22,3772009 21,7182010 21,6962011 21,3202012 21,152
Note 7 : Accrued Liabilities
Accrued liabilities at the end of fiscal 2007 and 2006 consisted of the following:
In Thousands 2007 2006
Payroll and other compensation $ 77,523 $ 56,463Commissions 3,177 1,674Casualty and medical 12,573 12,058Interest 7,496 5,698Warranties 18,206 7,952State and other tax accruals 27,734 16,055Acquisition-related payments — 4,394Customer deposits 12,687 5,139Deferred revenue 1,723 422Contract reserves 7,797 1,134Other 18,680 10,430 $ 187,596 $ 121,419
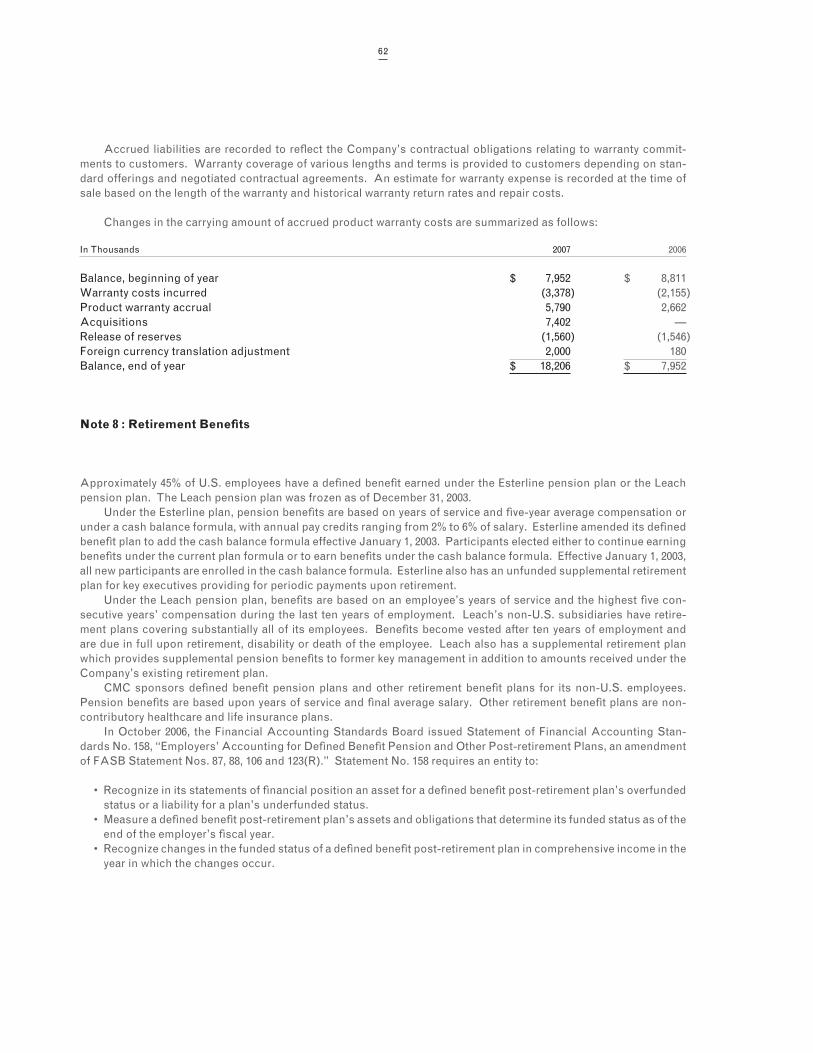
62
Accrued liabilities are recorded to reflect the Company’s contractual obligations relating to warranty commit-ments to customers. Warranty coverage of various lengths and terms is provided to customers depending on stan-dard offerings and negotiated contractual agreements. An estimate for warranty expense is recorded at the time of sale based on the length of the warranty and historical warranty return rates and repair costs.
Changes in the carrying amount of accrued product warranty costs are summarized as follows:
In Thousands 2007 2006
Balance, beginning of year $ 7,952 $ 8,811Warranty costs incurred (3,378) (2,155)Product warranty accrual 5,790 2,662Acquisitions 7,402 —Release of reserves (1,560) (1,546)Foreign currency translation adjustment 2,000 180Balance, end of year $ 18,206 $ 7,952
Note 8 : Retirement Benefits
Approximately 45% of U.S. employees have a defined benefit earned under the Esterline pension plan or the Leach pension plan. The Leach pension plan was frozen as of December 31, 2003.
Under the Esterline plan, pension benefits are based on years of service and five-year average compensation or under a cash balance formula, with annual pay credits ranging from 2% to 6% of salary. Esterline amended its defined benefit plan to add the cash balance formula effective January 1, 2003. Participants elected either to continue earning benefits under the current plan formula or to earn benefits under the cash balance formula. Effective January 1, 2003, all new participants are enrolled in the cash balance formula. Esterline also has an unfunded supplemental retirement plan for key executives providing for periodic payments upon retirement.
Under the Leach pension plan, benefits are based on an employee’s years of service and the highest five con-secutive years’ compensation during the last ten years of employment. Leach’s non-U.S. subsidiaries have retire-ment plans covering substantially all of its employees. Benefits become vested after ten years of employment and are due in full upon retirement, disability or death of the employee. Leach also has a supplemental retirement plan which provides supplemental pension benefits to former key management in addition to amounts received under the Company’s existing retirement plan.
CMC sponsors defined benefit pension plans and other retirement benefit plans for its non-U.S. employees. Pension benefits are based upon years of service and final average salary. Other retirement benefit plans are non-contributory healthcare and life insurance plans.
In October 2006, the Financial Accounting Standards Board issued Statement of Financial Accounting Stan-dards No. 158, “Employers’ Accounting for Defined Benefit Pension and Other Post-retirement Plans, an amendment of FASB Statement Nos. 87, 88, 106 and 123(R).” Statement No. 158 requires an entity to:
• Recognize in its statements of financial position an asset for a defined benefit post-retirement plan’s overfunded status or a liability for a plan’s underfunded status.
• Measure a defined benefit post-retirement plan’s assets and obligations that determine its funded status as of the end of the employer’s fiscal year.
• Recognize changes in the funded status of a defined benefit post-retirement plan in comprehensive income in the year in which the changes occur.
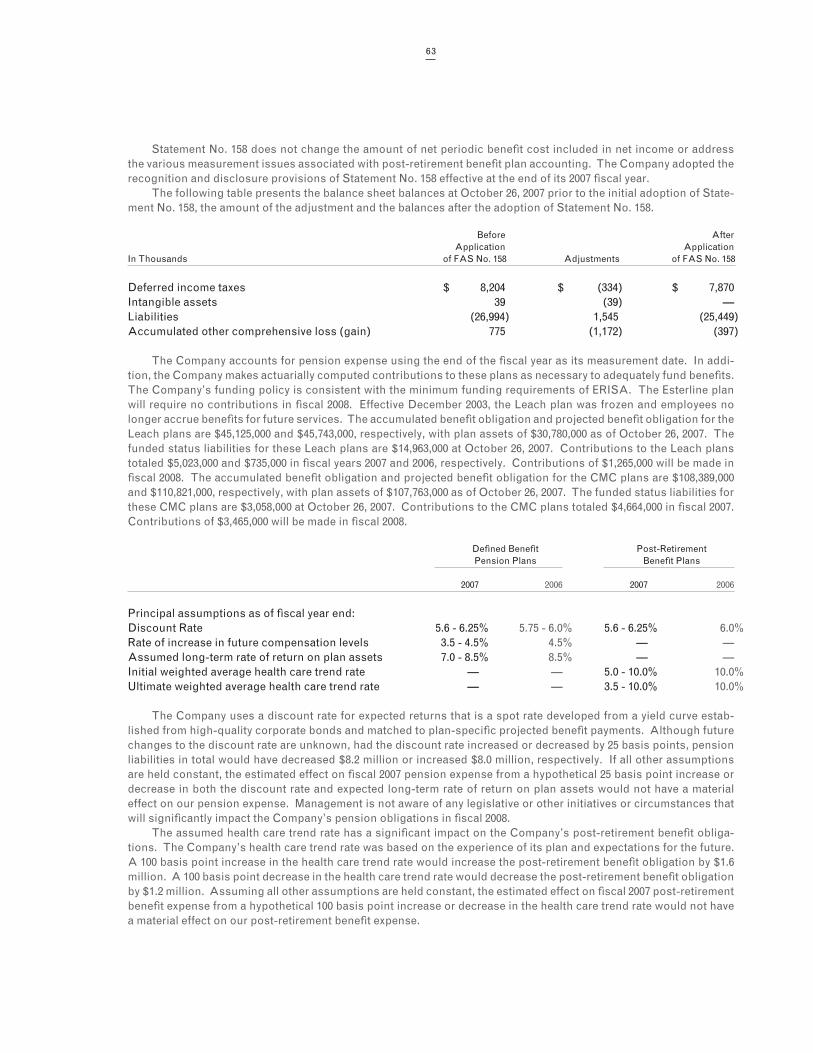
63
Statement No. 158 does not change the amount of net periodic benefit cost included in net income or address the various measurement issues associated with post-retirement benefit plan accounting. The Company adopted the recognition and disclosure provisions of Statement No. 158 effective at the end of its 2007 fiscal year.
The following table presents the balance sheet balances at October 26, 2007 prior to the initial adoption of State-ment No. 158, the amount of the adjustment and the balances after the adoption of Statement No. 158.
Before After Application Application In Thousands of FAS No. 158 Adjustments of FAS No. 158
Deferred income taxes $ 8,204 $ (334) $ 7,870Intangible assets 39 (39) —Liabilities (26,994) 1,545 (25,449)Accumulated other comprehensive loss (gain) 775 (1,172) (397)
The Company accounts for pension expense using the end of the fiscal year as its measurement date. In addi-tion, the Company makes actuarially computed contributions to these plans as necessary to adequately fund benefits. The Company’s funding policy is consistent with the minimum funding requirements of ERISA. The Esterline plan will require no contributions in fiscal 2008. Effective December 2003, the Leach plan was frozen and employees no longer accrue benefits for future services. The accumulated benefit obligation and projected benefit obligation for the Leach plans are $45,125,000 and $45,743,000, respectively, with plan assets of $30,780,000 as of October 26, 2007. The funded status liabilities for these Leach plans are $14,963,000 at October 26, 2007. Contributions to the Leach plans totaled $5,023,000 and $735,000 in fiscal years 2007 and 2006, respectively. Contributions of $1,265,000 will be made in fiscal 2008. The accumulated benefit obligation and projected benefit obligation for the CMC plans are $108,389,000 and $110,821,000, respectively, with plan assets of $107,763,000 as of October 26, 2007. The funded status liabilities for these CMC plans are $3,058,000 at October 26, 2007. Contributions to the CMC plans totaled $4,664,000 in fiscal 2007. Contributions of $3,465,000 will be made in fiscal 2008.
Defined Benefit Post-Retirement Pension Plans Benefit Plans
2007 2006 2007 2006
Principal assumptions as of fiscal year end:Discount Rate 5.6 - 6.25% 5.75 - 6.0% 5.6 - 6.25% 6.0%Rate of increase in future compensation levels 3.5 - 4.5% 4.5% — —Assumed long-term rate of return on plan assets 7.0 - 8.5% 8.5% — —Initial weighted average health care trend rate — — 5.0 - 10.0% 10.0%Ultimate weighted average health care trend rate — — 3.5 - 10.0% 10.0%
The Company uses a discount rate for expected returns that is a spot rate developed from a yield curve estab-lished from high-quality corporate bonds and matched to plan-specific projected benefit payments. Although future changes to the discount rate are unknown, had the discount rate increased or decreased by 25 basis points, pension liabilities in total would have decreased $8.2 million or increased $8.0 million, respectively. If all other assumptions are held constant, the estimated effect on fiscal 2007 pension expense from a hypothetical 25 basis point increase or decrease in both the discount rate and expected long-term rate of return on plan assets would not have a material effect on our pension expense. Management is not aware of any legislative or other initiatives or circumstances that will significantly impact the Company’s pension obligations in fiscal 2008.
The assumed health care trend rate has a significant impact on the Company’s post-retirement benefit obliga-tions. The Company’s health care trend rate was based on the experience of its plan and expectations for the future. A 100 basis point increase in the health care trend rate would increase the post-retirement benefit obligation by $1.6 million. A 100 basis point decrease in the health care trend rate would decrease the post-retirement benefit obligation by $1.2 million. Assuming all other assumptions are held constant, the estimated effect on fiscal 2007 post-retirement benefit expense from a hypothetical 100 basis point increase or decrease in the health care trend rate would not have a material effect on our post-retirement benefit expense.
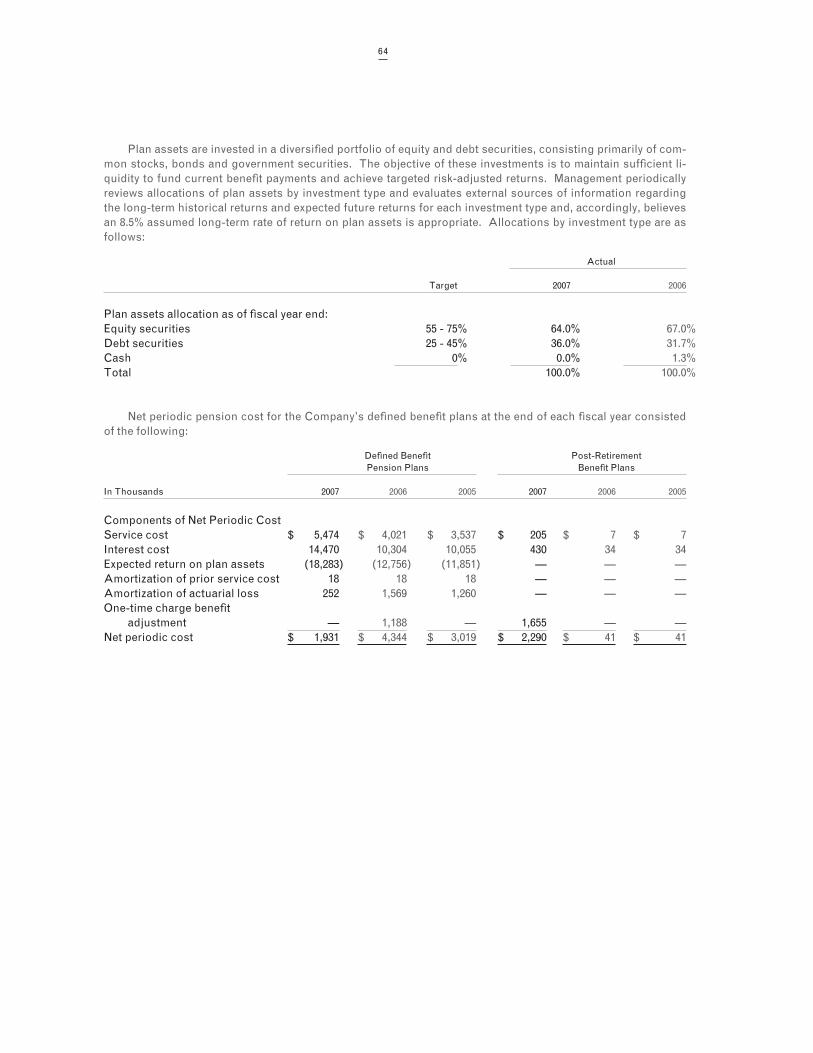
64
Plan assets are invested in a diversified portfolio of equity and debt securities, consisting primarily of com-mon stocks, bonds and government securities. The objective of these investments is to maintain sufficient li-quidity to fund current benefit payments and achieve targeted risk-adjusted returns. Management periodically reviews allocations of plan assets by investment type and evaluates external sources of information regarding the long-term historical returns and expected future returns for each investment type and, accordingly, believes an 8.5% assumed long-term rate of return on plan assets is appropriate. Allocations by investment type are as follows:
Actual
Target 2007 2006
Plan assets allocation as of fiscal year end:Equity securities 55 - 75% 64.0% 67.0%Debt securities 25 - 45% 36.0% 31.7%Cash 0% 0.0% 1.3%Total 100.0% 100.0%
Net periodic pension cost for the Company’s defined benefit plans at the end of each fiscal year consisted of the following:
Defined Benefit Post-Retirement Pension Plans Benefit Plans
In Thousands 2007 2006 2005 2007 2006 2005
Components of Net Periodic CostService cost $ 5,474 $ 4,021 $ 3,537 $ 205 $ 7 $ 7Interest cost 14,470 10,304 10,055 430 34 34Expected return on plan assets (18,283) (12,756) (11,851) — — —Amortization of prior service cost 18 18 18 — — —Amortization of actuarial loss 252 1,569 1,260 — — —One-time charge benefit adjustment — 1,188 — 1,655 — —Net periodic cost $ 1,931 $ 4,344 $ 3,019 $ 2,290 $ 41 $ 41
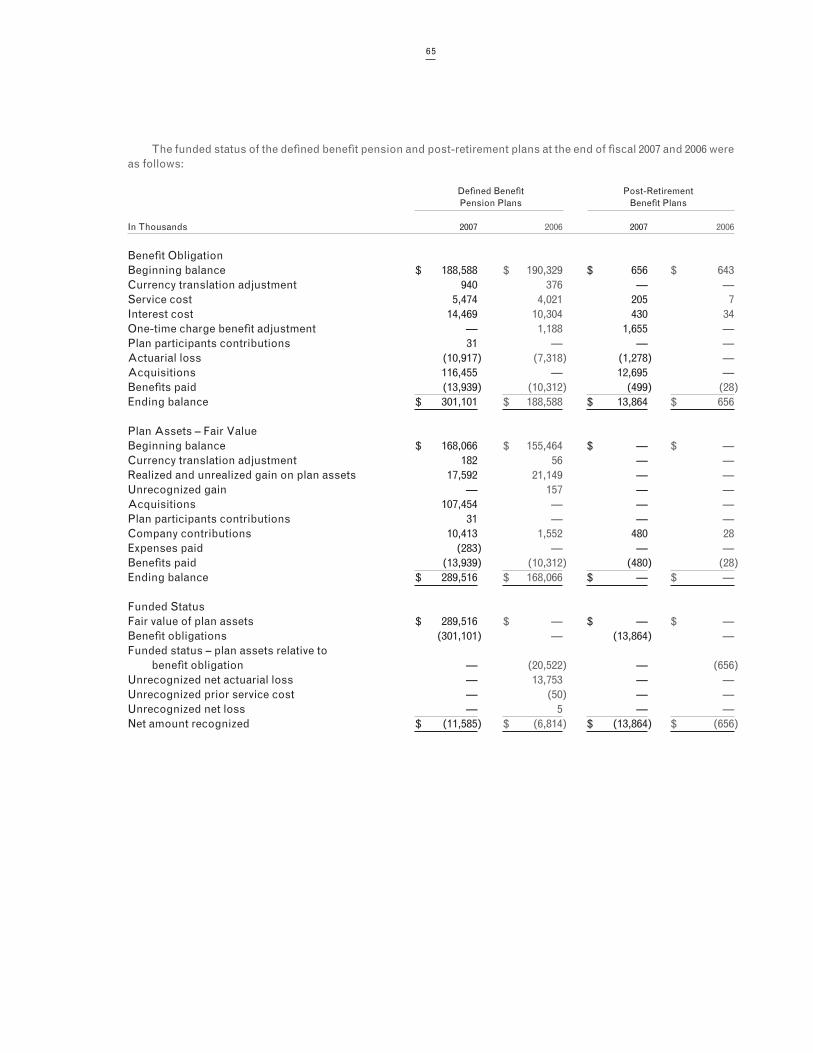
65
The funded status of the defined benefit pension and post-retirement plans at the end of fiscal 2007 and 2006 were as follows:
Defined Benefit Post-Retirement Pension Plans Benefit Plans
In Thousands 2007 2006 2007 2006
Benefit ObligationBeginning balance $ 188,588 $ 190,329 $ 656 $ 643Currency translation adjustment 940 376 — —Service cost 5,474 4,021 205 7Interest cost 14,469 10,304 430 34One-time charge benefit adjustment — 1,188 1,655 —Plan participants contributions 31 — — —Actuarial loss (10,917) (7,318) (1,278) —Acquisitions 116,455 — 12,695 —Benefits paid (13,939) (10,312) (499) (28)Ending balance $ 301,101 $ 188,588 $ 13,864 $ 656
Plan Assets – Fair Value Beginning balance $ 168,066 $ 155,464 $ — $ —Currency translation adjustment 182 56 — —Realized and unrealized gain on plan assets 17,592 21,149 — —Unrecognized gain — 157 — —Acquisitions 107,454 — — —Plan participants contributions 31 — — —Company contributions 10,413 1,552 480 28Expenses paid (283) — — —Benefits paid (13,939) (10,312) (480) (28)Ending balance $ 289,516 $ 168,066 $ — $ —
Funded StatusFair value of plan assets $ 289,516 $ — $ — $ —Benefit obligations (301,101) — (13,864) —Funded status – plan assets relative to benefit obligation — (20,522) — (656)Unrecognized net actuarial loss — 13,753 — —Unrecognized prior service cost — (50) — —Unrecognized net loss — 5 — —Net amount recognized $ (11,585) $ (6,814) $ (13,864) $ (656)
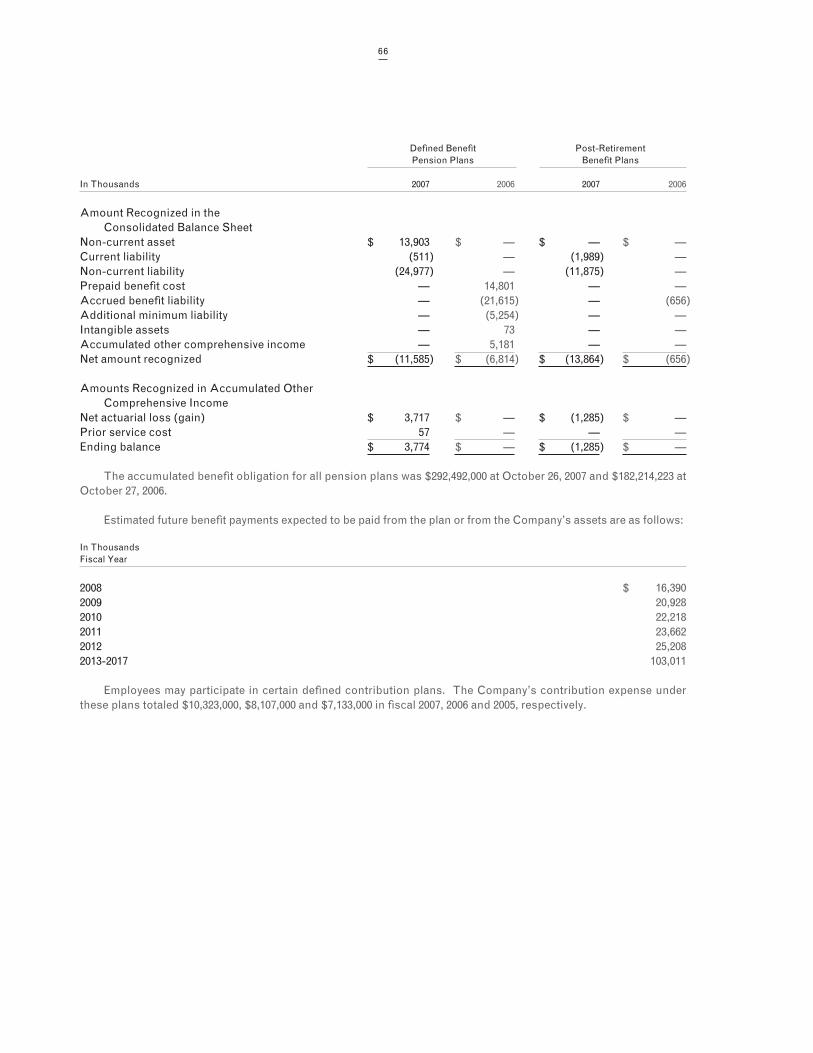
66
Defined Benefit Post-Retirement Pension Plans Benefit Plans
In Thousands 2007 2006 2007 2006
Amount Recognized in the Consolidated Balance SheetNon-current asset $ 13,903 $ — $ — $ —Current liability (511) — (1,989) —Non-current liability (24,977) — (11,875) —Prepaid benefit cost — 14,801 — —Accrued benefit liability — (21,615) — (656)Additional minimum liability — (5,254) — —Intangible assets — 73 — —Accumulated other comprehensive income — 5,181 — —Net amount recognized $ (11,585) $ (6,814) $ (13,864) $ (656)
Amounts Recognized in Accumulated Other Comprehensive IncomeNet actuarial loss (gain) $ 3,717 $ — $ (1,285) $ —Prior service cost 57 — — —Ending balance $ 3,774 $ — $ (1,285) $ —
The accumulated benefit obligation for all pension plans was $292,492,000 at October 26, 2007 and $182,214,223 at October 27, 2006.
Estimated future benefit payments expected to be paid from the plan or from the Company’s assets are as follows:
In ThousandsFiscal Year
2008 $ 16,3902009 20,9282010 22,2182011 23,6622012 25,2082013-2017 103,011
Employees may participate in certain defined contribution plans. The Company’s contribution expense under these plans totaled $10,323,000, $8,107,000 and $7,133,000 in fiscal 2007, 2006 and 2005, respectively.
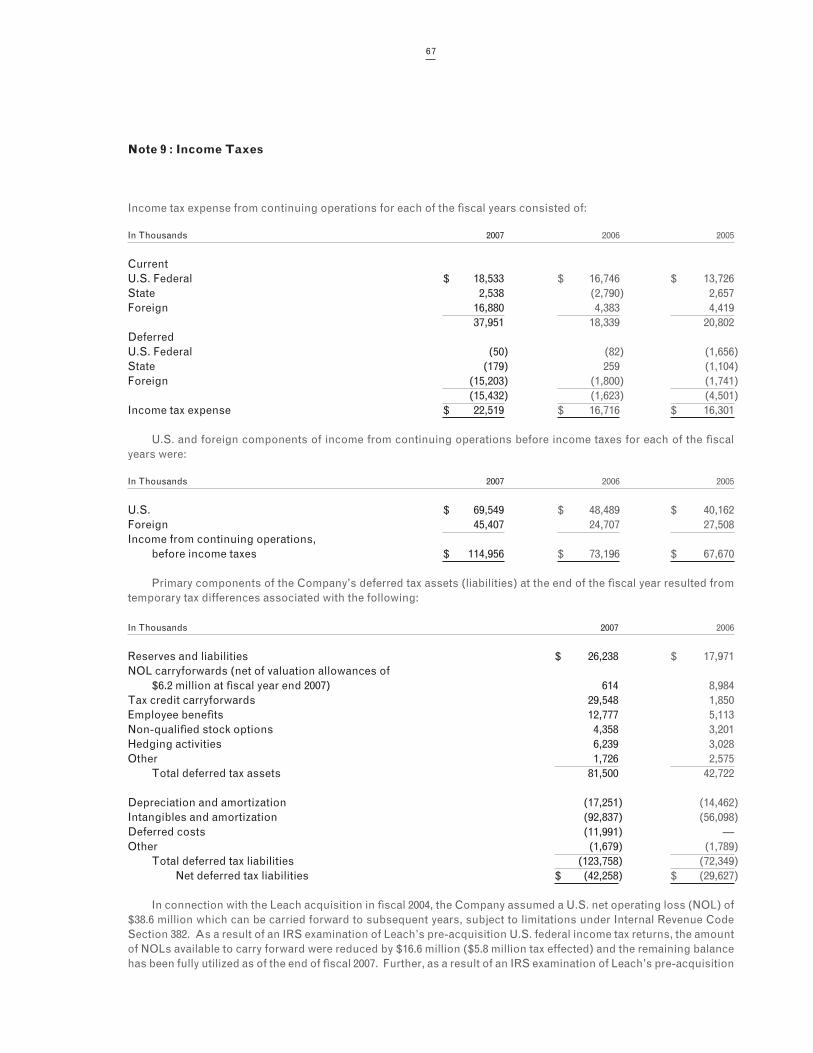
67
Note 9 : Income Taxes
Income tax expense from continuing operations for each of the fiscal years consisted of:
In Thousands 2007 2006 2005
CurrentU.S. Federal $ 18,533 $ 16,746 $ 13,726State 2,538 (2,790) 2,657Foreign 16,880 4,383 4,419 37,951 18,339 20,802DeferredU.S. Federal (50) (82) (1,656)State (179) 259 (1,104)Foreign (15,203) (1,800) (1,741) (15,432) (1,623) (4,501)Income tax expense $ 22,519 $ 16,716 $ 16,301
U.S. and foreign components of income from continuing operations before income taxes for each of the fiscal years were:
In Thousands 2007 2006 2005
U.S. $ 69,549 $ 48,489 $ 40,162Foreign 45,407 24,707 27,508Income from continuing operations, before income taxes $ 114,956 $ 73,196 $ 67,670
Primary components of the Company’s deferred tax assets (liabilities) at the end of the fiscal year resulted from temporary tax differences associated with the following:
In Thousands 2007 2006
Reserves and liabilities $ 26,238 $ 17,971NOL carryforwards (net of valuation allowances of $6.2 million at fiscal year end 2007) 614 8,984Tax credit carryforwards 29,548 1,850Employee benefits 12,777 5,113Non-qualified stock options 4,358 3,201Hedging activities 6,239 3,028Other 1,726 2,575 Total deferred tax assets 81,500 42,722
Depreciation and amortization (17,251) (14,462)Intangibles and amortization (92,837) (56,098)Deferred costs (11,991) —Other (1,679) (1,789) Total deferred tax liabilities (123,758) (72,349) Net deferred tax liabilities $ (42,258) $ (29,627)
In connection with the Leach acquisition in fiscal 2004, the Company assumed a U.S. net operating loss (NOL) of $38.6 million which can be carried forward to subsequent years, subject to limitations under Internal Revenue Code Section 382. As a result of an IRS examination of Leach’s pre-acquisition U.S. federal income tax returns, the amount of NOLs available to carry forward were reduced by $16.6 million ($5.8 million tax effected) and the remaining balance has been fully utilized as of the end of fiscal 2007. Further, as a result of an IRS examination of Leach’s pre-acquisition
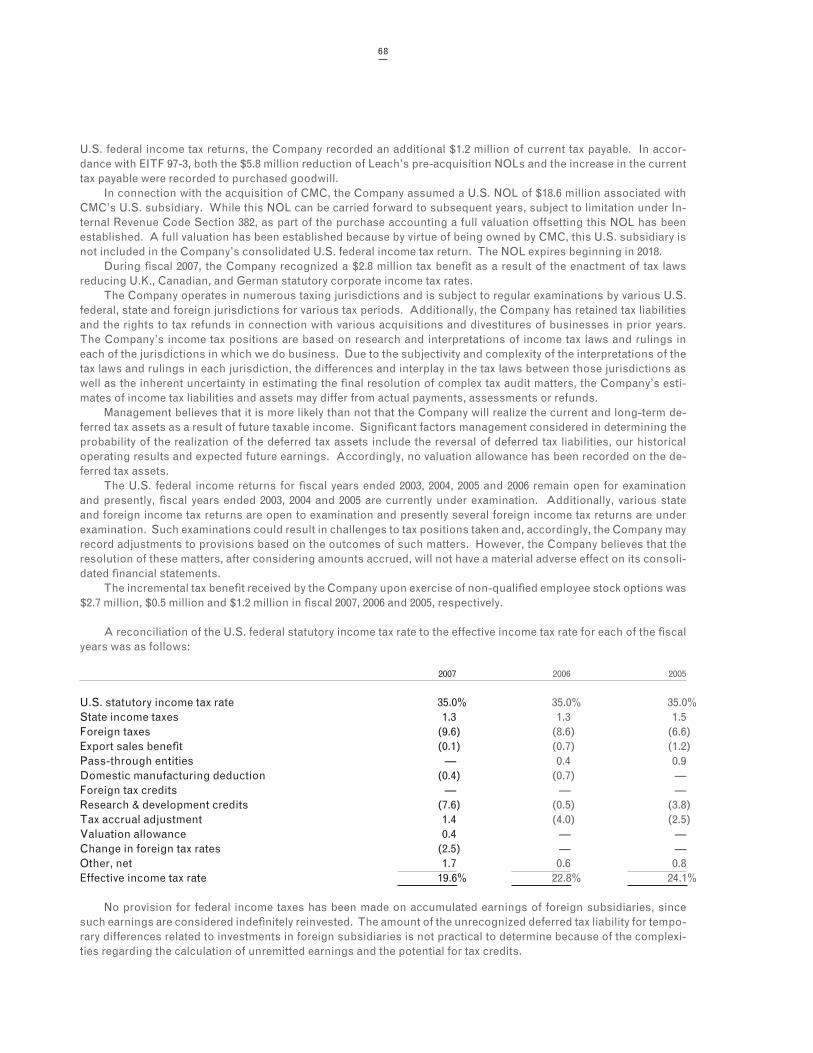
68
U.S. federal income tax returns, the Company recorded an additional $1.2 million of current tax payable. In accor-dance with EITF 97-3, both the $5.8 million reduction of Leach’s pre-acquisition NOLs and the increase in the current tax payable were recorded to purchased goodwill.
In connection with the acquisition of CMC, the Company assumed a U.S. NOL of $18.6 million associated with CMC’s U.S. subsidiary. While this NOL can be carried forward to subsequent years, subject to limitation under In-ternal Revenue Code Section 382, as part of the purchase accounting a full valuation offsetting this NOL has been established. A full valuation has been established because by virtue of being owned by CMC, this U.S. subsidiary is not included in the Company’s consolidated U.S. federal income tax return. The NOL expires beginning in 2018.
During fiscal 2007, the Company recognized a $2.8 million tax benefit as a result of the enactment of tax laws reducing U.K., Canadian, and German statutory corporate income tax rates.
The Company operates in numerous taxing jurisdictions and is subject to regular examinations by various U.S. federal, state and foreign jurisdictions for various tax periods. Additionally, the Company has retained tax liabilities and the rights to tax refunds in connection with various acquisitions and divestitures of businesses in prior years. The Company’s income tax positions are based on research and interpretations of income tax laws and rulings in each of the jurisdictions in which we do business. Due to the subjectivity and complexity of the interpretations of the tax laws and rulings in each jurisdiction, the differences and interplay in the tax laws between those jurisdictions as well as the inherent uncertainty in estimating the final resolution of complex tax audit matters, the Company’s esti-mates of income tax liabilities and assets may differ from actual payments, assessments or refunds.
Management believes that it is more likely than not that the Company will realize the current and long-term de-ferred tax assets as a result of future taxable income. Significant factors management considered in determining the probability of the realization of the deferred tax assets include the reversal of deferred tax liabilities, our historical operating results and expected future earnings. Accordingly, no valuation allowance has been recorded on the de-ferred tax assets.
The U.S. federal income returns for fiscal years ended 2003, 2004, 2005 and 2006 remain open for examination and presently, fiscal years ended 2003, 2004 and 2005 are currently under examination. Additionally, various state and foreign income tax returns are open to examination and presently several foreign income tax returns are under examination. Such examinations could result in challenges to tax positions taken and, accordingly, the Company may record adjustments to provisions based on the outcomes of such matters. However, the Company believes that the resolution of these matters, after considering amounts accrued, will not have a material adverse effect on its consoli-dated financial statements.
The incremental tax benefit received by the Company upon exercise of non-qualified employee stock options was $2.7 million, $0.5 million and $1.2 million in fiscal 2007, 2006 and 2005, respectively.
A reconciliation of the U.S. federal statutory income tax rate to the effective income tax rate for each of the fiscal years was as follows:
2007 2006 2005
U.S. statutory income tax rate 35.0% 35.0% 35.0%State income taxes 1.3 1.3 1.5Foreign taxes (9.6) (8.6) (6.6)Export sales benefit (0.1) (0.7) (1.2)Pass-through entities — 0.4 0.9Domestic manufacturing deduction (0.4) (0.7) —Foreign tax credits — — —Research & development credits (7.6) (0.5) (3.8)Tax accrual adjustment 1.4 (4.0) (2.5)Valuation allowance 0.4 — —Change in foreign tax rates (2.5) — —Other, net 1.7 0.6 0.8Effective income tax rate 19.6% 22.8% 24.1%
No provision for federal income taxes has been made on accumulated earnings of foreign subsidiaries, since such earnings are considered indefinitely reinvested. The amount of the unrecognized deferred tax liability for tempo-rary differences related to investments in foreign subsidiaries is not practical to determine because of the complexi-ties regarding the calculation of unremitted earnings and the potential for tax credits.
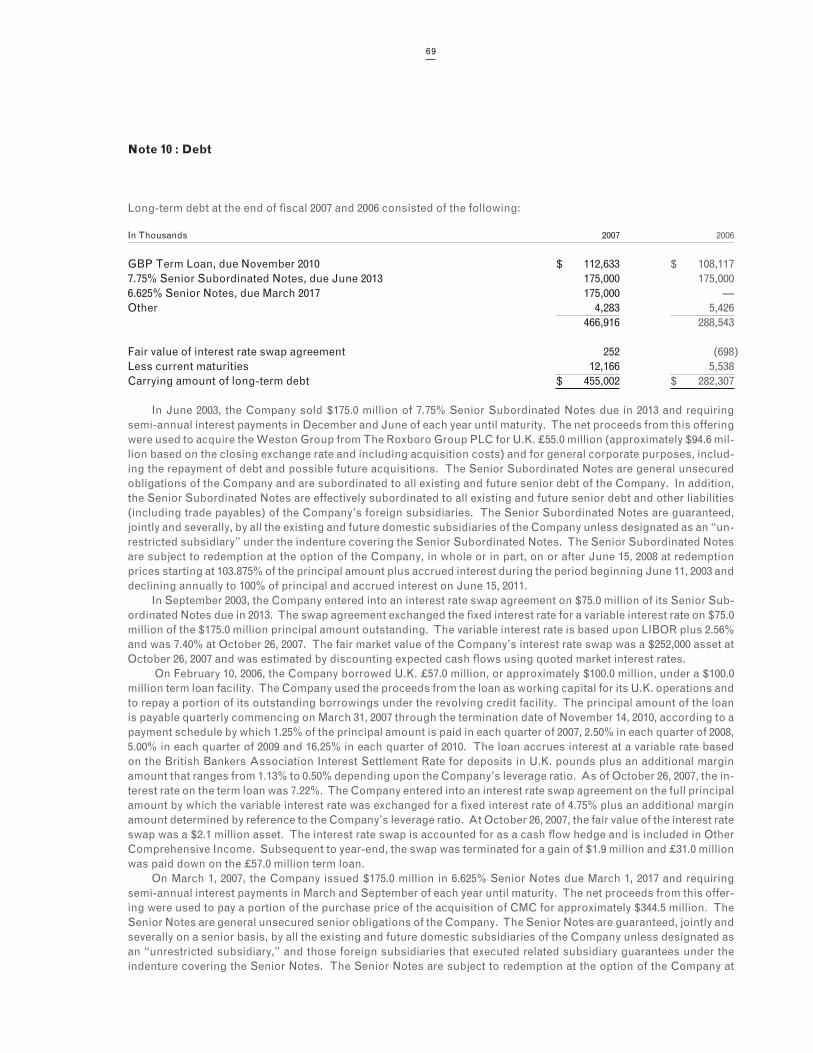
69
Note 10 : Debt
Long-term debt at the end of fiscal 2007 and 2006 consisted of the following:
In Thousands 2007 2006
GBP Term Loan, due November 2010 $ 112,633 $ 108,1177.75% Senior Subordinated Notes, due June 2013 175,000 175,0006.625% Senior Notes, due March 2017 175,000 —Other 4,283 5,426 466,916 288,543
Fair value of interest rate swap agreement 252 (698)Less current maturities 12,166 5,538Carrying amount of long-term debt $ 455,002 $ 282,307
In June 2003, the Company sold $175.0 million of 7.75% Senior Subordinated Notes due in 2013 and requiring semi-annual interest payments in December and June of each year until maturity. The net proceeds from this offering were used to acquire the Weston Group from The Roxboro Group PLC for U.K. £55.0 million (approximately $94.6 mil-lion based on the closing exchange rate and including acquisition costs) and for general corporate purposes, includ-ing the repayment of debt and possible future acquisitions. The Senior Subordinated Notes are general unsecured obligations of the Company and are subordinated to all existing and future senior debt of the Company. In addition, the Senior Subordinated Notes are effectively subordinated to all existing and future senior debt and other liabilities (including trade payables) of the Company’s foreign subsidiaries. The Senior Subordinated Notes are guaranteed, jointly and severally, by all the existing and future domestic subsidiaries of the Company unless designated as an “un-restricted subsidiary” under the indenture covering the Senior Subordinated Notes. The Senior Subordinated Notes are subject to redemption at the option of the Company, in whole or in part, on or after June 15, 2008 at redemption prices starting at 103.875% of the principal amount plus accrued interest during the period beginning June 11, 2003 and declining annually to 100% of principal and accrued interest on June 15, 2011.
In September 2003, the Company entered into an interest rate swap agreement on $75.0 million of its Senior Sub-ordinated Notes due in 2013. The swap agreement exchanged the fixed interest rate for a variable interest rate on $75.0 million of the $175.0 million principal amount outstanding. The variable interest rate is based upon LIBOR plus 2.56% and was 7.40% at October 26, 2007. The fair market value of the Company’s interest rate swap was a $252,000 asset at October 26, 2007 and was estimated by discounting expected cash flows using quoted market interest rates.
On February 10, 2006, the Company borrowed U.K. £57.0 million, or approximately $100.0 million, under a $100.0 million term loan facility. The Company used the proceeds from the loan as working capital for its U.K. operations and to repay a portion of its outstanding borrowings under the revolving credit facility. The principal amount of the loan is payable quarterly commencing on March 31, 2007 through the termination date of November 14, 2010, according to a payment schedule by which 1.25% of the principal amount is paid in each quarter of 2007, 2.50% in each quarter of 2008, 5.00% in each quarter of 2009 and 16.25% in each quarter of 2010. The loan accrues interest at a variable rate based on the British Bankers Association Interest Settlement Rate for deposits in U.K. pounds plus an additional margin amount that ranges from 1.13% to 0.50% depending upon the Company’s leverage ratio. As of October 26, 2007, the in-terest rate on the term loan was 7.22%. The Company entered into an interest rate swap agreement on the full principal amount by which the variable interest rate was exchanged for a fixed interest rate of 4.75% plus an additional margin amount determined by reference to the Company’s leverage ratio. At October 26, 2007, the fair value of the interest rate swap was a $2.1 million asset. The interest rate swap is accounted for as a cash flow hedge and is included in Other Comprehensive Income. Subsequent to year-end, the swap was terminated for a gain of $1.9 million and £31.0 million was paid down on the £57.0 million term loan.
On March 1, 2007, the Company issued $175.0 million in 6.625% Senior Notes due March 1, 2017 and requiring semi-annual interest payments in March and September of each year until maturity. The net proceeds from this offer-ing were used to pay a portion of the purchase price of the acquisition of CMC for approximately $344.5 million. The Senior Notes are general unsecured senior obligations of the Company. The Senior Notes are guaranteed, jointly and severally on a senior basis, by all the existing and future domestic subsidiaries of the Company unless designated as an “unrestricted subsidiary,” and those foreign subsidiaries that executed related subsidiary guarantees under the indenture covering the Senior Notes. The Senior Notes are subject to redemption at the option of the Company at
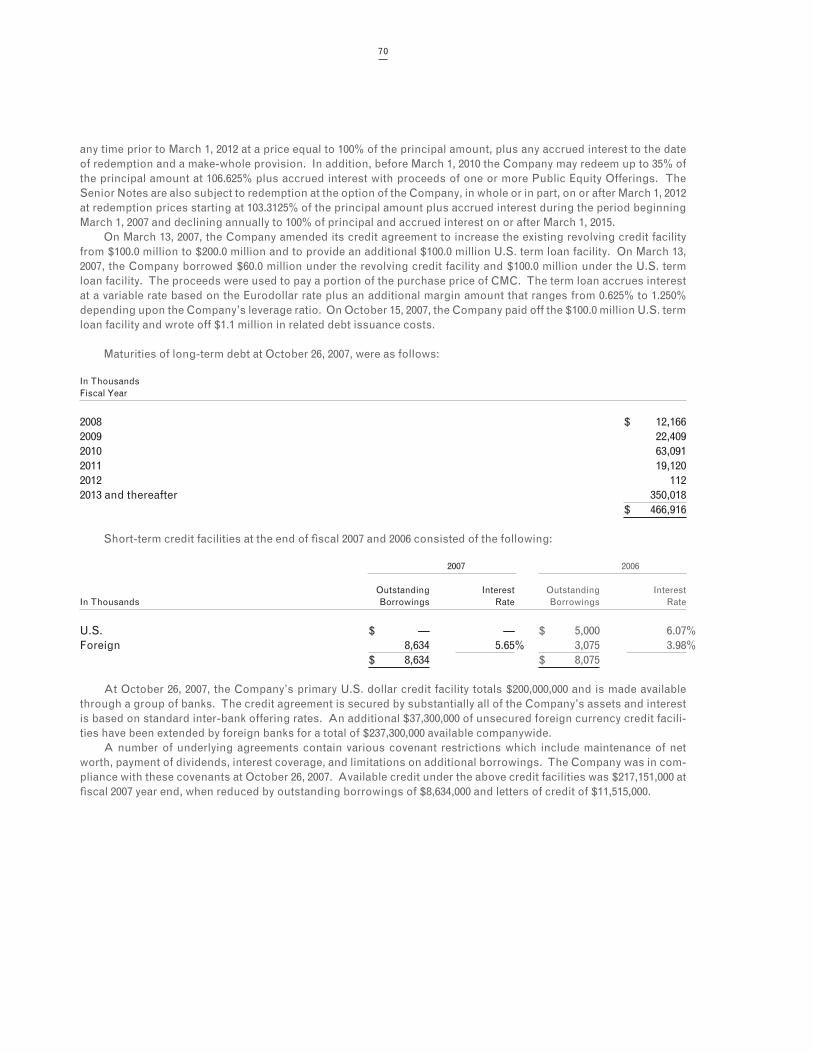
70
any time prior to March 1, 2012 at a price equal to 100% of the principal amount, plus any accrued interest to the date of redemption and a make-whole provision. In addition, before March 1, 2010 the Company may redeem up to 35% of the principal amount at 106.625% plus accrued interest with proceeds of one or more Public Equity Offerings. The Senior Notes are also subject to redemption at the option of the Company, in whole or in part, on or after March 1, 2012 at redemption prices starting at 103.3125% of the principal amount plus accrued interest during the period beginning March 1, 2007 and declining annually to 100% of principal and accrued interest on or after March 1, 2015.
On March 13, 2007, the Company amended its credit agreement to increase the existing revolving credit facility from $100.0 million to $200.0 million and to provide an additional $100.0 million U.S. term loan facility. On March 13, 2007, the Company borrowed $60.0 million under the revolving credit facility and $100.0 million under the U.S. term loan facility. The proceeds were used to pay a portion of the purchase price of CMC. The term loan accrues interest at a variable rate based on the Eurodollar rate plus an additional margin amount that ranges from 0.625% to 1.250% depending upon the Company’s leverage ratio. On October 15, 2007, the Company paid off the $100.0 million U.S. term loan facility and wrote off $1.1 million in related debt issuance costs.
Maturities of long-term debt at October 26, 2007, were as follows:
In ThousandsFiscal Year
2008 $ 12,1662009 22,4092010 63,0912011 19,1202012 1122013 and thereafter 350,018 $ 466,916
Short-term credit facilities at the end of fiscal 2007 and 2006 consisted of the following:
2007 2006
Outstanding Interest Outstanding InterestIn Thousands Borrowings Rate Borrowings Rate
U.S. $ — — $ 5,000 6.07%Foreign 8,634 5.65% 3,075 3.98% $ 8,634 $ 8,075
At October 26, 2007, the Company’s primary U.S. dollar credit facility totals $200,000,000 and is made available through a group of banks. The credit agreement is secured by substantially all of the Company’s assets and interest is based on standard inter-bank offering rates. An additional $37,300,000 of unsecured foreign currency credit facili-ties have been extended by foreign banks for a total of $237,300,000 available companywide.
A number of underlying agreements contain various covenant restrictions which include maintenance of net worth, payment of dividends, interest coverage, and limitations on additional borrowings. The Company was in com-pliance with these covenants at October 26, 2007. Available credit under the above credit facilities was $217,151,000 at fiscal 2007 year end, when reduced by outstanding borrowings of $8,634,000 and letters of credit of $11,515,000.
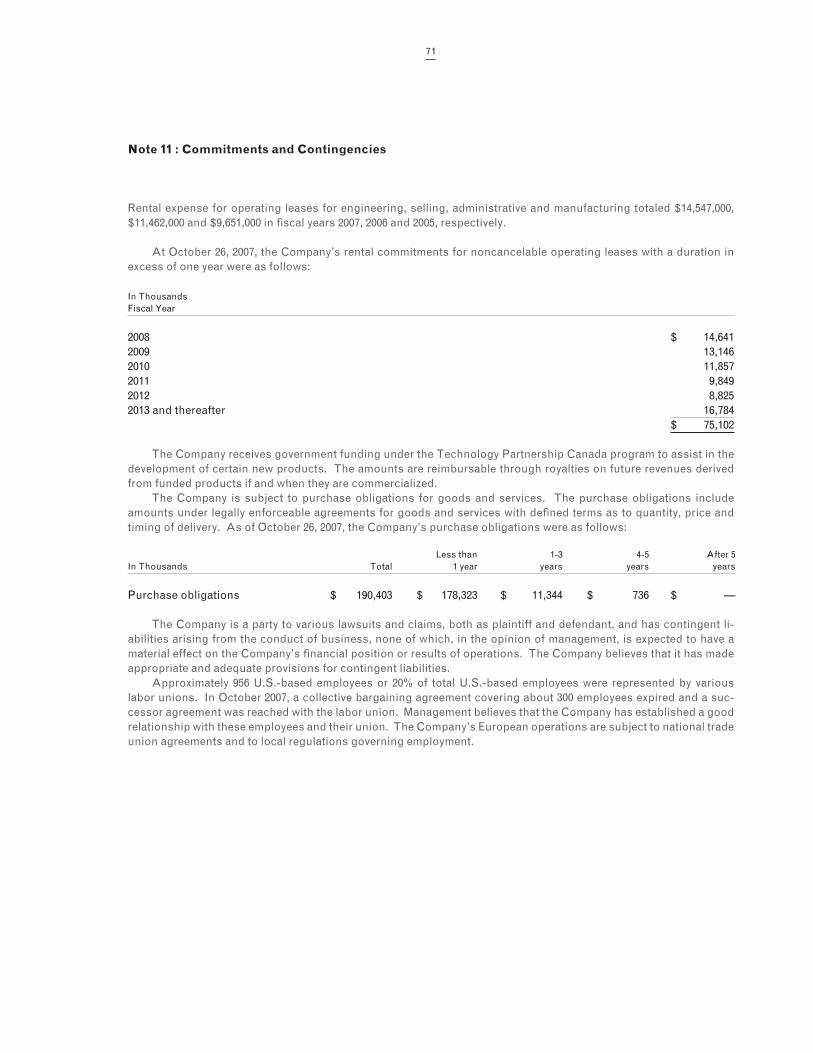
71
Note 11 : Commitments and Contingencies
Rental expense for operating leases for engineering, selling, administrative and manufacturing totaled $14,547,000, $11,462,000 and $9,651,000 in fiscal years 2007, 2006 and 2005, respectively.
At October 26, 2007, the Company’s rental commitments for noncancelable operating leases with a duration in excess of one year were as follows:
In ThousandsFiscal Year
2008 $ 14,6412009 13,1462010 11,8572011 9,8492012 8,8252013 and thereafter 16,784 $ 75,102
The Company receives government funding under the Technology Partnership Canada program to assist in the development of certain new products. The amounts are reimbursable through royalties on future revenues derived from funded products if and when they are commercialized.
The Company is subject to purchase obligations for goods and services. The purchase obligations include amounts under legally enforceable agreements for goods and services with defined terms as to quantity, price and timing of delivery. As of October 26, 2007, the Company’s purchase obligations were as follows:
Less than 1-3 4-5 After 5In Thousands Total 1 year years years years
Purchase obligations $ 190,403 $ 178,323 $ 11,344 $ 736 $ —
The Company is a party to various lawsuits and claims, both as plaintiff and defendant, and has contingent li-abilities arising from the conduct of business, none of which, in the opinion of management, is expected to have a material effect on the Company’s financial position or results of operations. The Company believes that it has made appropriate and adequate provisions for contingent liabilities.
Approximately 956 U.S.-based employees or 20% of total U.S.-based employees were represented by various labor unions. In October 2007, a collective bargaining agreement covering about 300 employees expired and a suc-cessor agreement was reached with the labor union. Management believes that the Company has established a good relationship with these employees and their union. The Company’s European operations are subject to national trade union agreements and to local regulations governing employment.
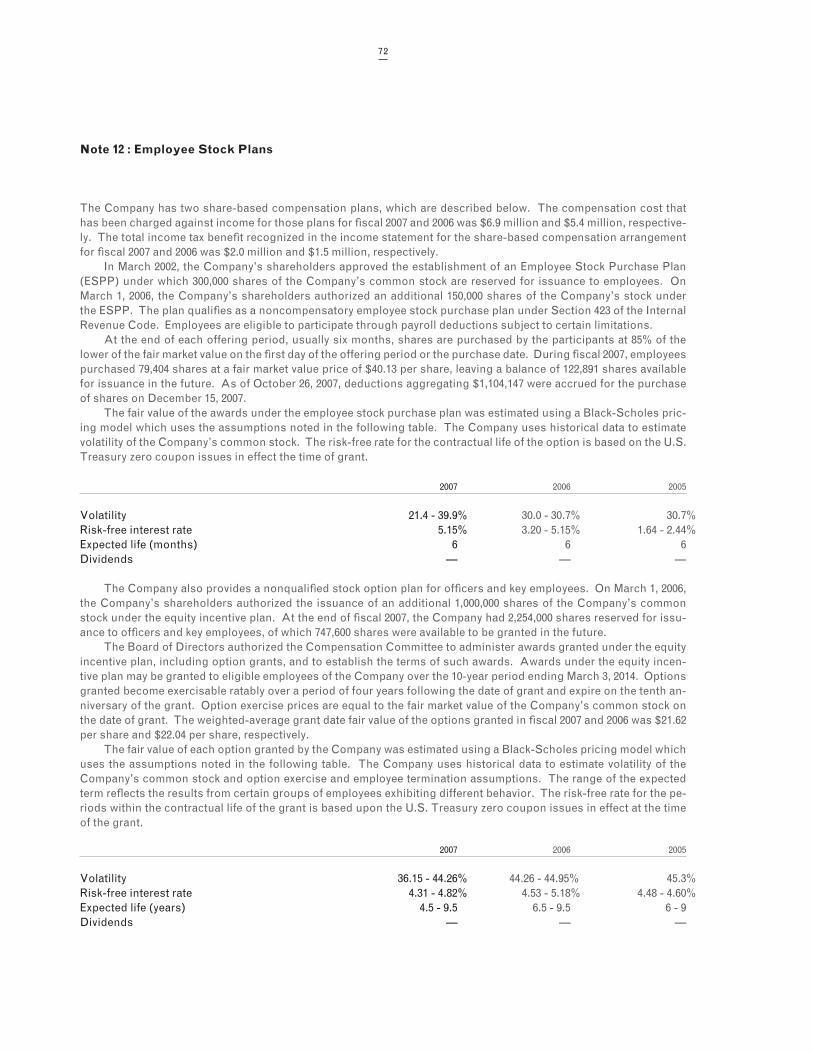
72
Note 12 : Employee Stock Plans
The Company has two share-based compensation plans, which are described below. The compensation cost that has been charged against income for those plans for fiscal 2007 and 2006 was $6.9 million and $5.4 million, respective-ly. The total income tax benefit recognized in the income statement for the share-based compensation arrangement for fiscal 2007 and 2006 was $2.0 million and $1.5 million, respectively.
In March 2002, the Company’s shareholders approved the establishment of an Employee Stock Purchase Plan (ESPP) under which 300,000 shares of the Company’s common stock are reserved for issuance to employees. On March 1, 2006, the Company’s shareholders authorized an additional 150,000 shares of the Company’s stock under the ESPP. The plan qualifies as a noncompensatory employee stock purchase plan under Section 423 of the Internal Revenue Code. Employees are eligible to participate through payroll deductions subject to certain limitations.
At the end of each offering period, usually six months, shares are purchased by the participants at 85% of the lower of the fair market value on the first day of the offering period or the purchase date. During fiscal 2007, employees purchased 79,404 shares at a fair market value price of $40.13 per share, leaving a balance of 122,891 shares available for issuance in the future. As of October 26, 2007, deductions aggregating $1,104,147 were accrued for the purchase of shares on December 15, 2007.
The fair value of the awards under the employee stock purchase plan was estimated using a Black-Scholes pric-ing model which uses the assumptions noted in the following table. The Company uses historical data to estimate volatility of the Company’s common stock. The risk-free rate for the contractual life of the option is based on the U.S. Treasury zero coupon issues in effect the time of grant.
2007 2006 2005
Volatility 21.4 - 39.9% 30.0 - 30.7% 30.7%Risk-free interest rate 5.15% 3.20 - 5.15% 1.64 - 2.44%Expected life (months) 6 6 6Dividends — — —
The Company also provides a nonqualified stock option plan for officers and key employees. On March 1, 2006, the Company’s shareholders authorized the issuance of an additional 1,000,000 shares of the Company’s common stock under the equity incentive plan. At the end of fiscal 2007, the Company had 2,254,000 shares reserved for issu-ance to officers and key employees, of which 747,600 shares were available to be granted in the future.
The Board of Directors authorized the Compensation Committee to administer awards granted under the equity incentive plan, including option grants, and to establish the terms of such awards. Awards under the equity incen-tive plan may be granted to eligible employees of the Company over the 10-year period ending March 3, 2014. Options granted become exercisable ratably over a period of four years following the date of grant and expire on the tenth an-niversary of the grant. Option exercise prices are equal to the fair market value of the Company’s common stock on the date of grant. The weighted-average grant date fair value of the options granted in fiscal 2007 and 2006 was $21.62 per share and $22.04 per share, respectively.
The fair value of each option granted by the Company was estimated using a Black-Scholes pricing model which uses the assumptions noted in the following table. The Company uses historical data to estimate volatility of the Company’s common stock and option exercise and employee termination assumptions. The range of the expected term reflects the results from certain groups of employees exhibiting different behavior. The risk-free rate for the pe-riods within the contractual life of the grant is based upon the U.S. Treasury zero coupon issues in effect at the time of the grant.
2007 2006 2005
Volatility 36.15 - 44.26% 44.26 - 44.95% 45.3%Risk-free interest rate 4.31 - 4.82% 4.53 - 5.18% 4.48 - 4.60%Expected life (years) 4.5 - 9.5 6.5 - 9.5 6 - 9Dividends — — —
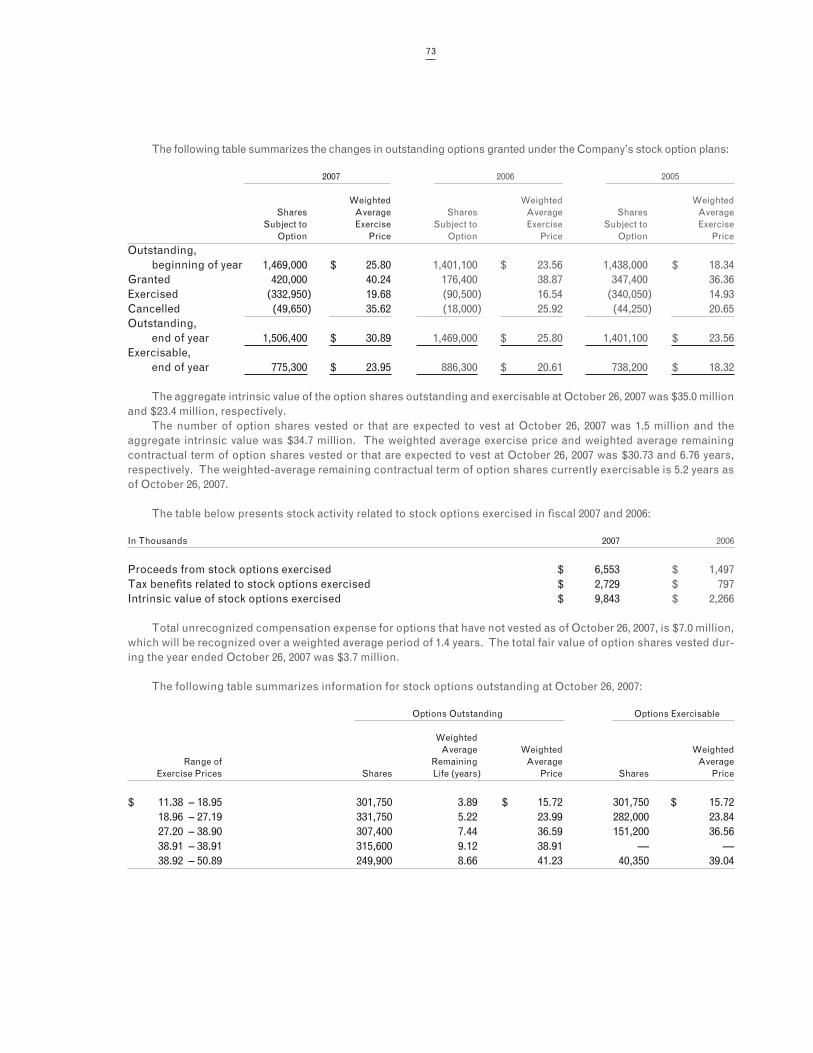
73
The following table summarizes the changes in outstanding options granted under the Company’s stock option plans:
2007 2006 2005
Weighted Weighted Weighted Shares Average Shares Average Shares Average Subject to Exercise Subject to Exercise Subject to Exercise Option Price Option Price Option Price
Outstanding, beginning of year 1,469,000 $ 25.80 1,401,100 $ 23.56 1,438,000 $ 18.34Granted 420,000 40.24 176,400 38.87 347,400 36.36Exercised (332,950) 19.68 (90,500) 16.54 (340,050) 14.93Cancelled (49,650) 35.62 (18,000) 25.92 (44,250) 20.65Outstanding, end of year 1,506,400 $ 30.89 1,469,000 $ 25.80 1,401,100 $ 23.56Exercisable, end of year 775,300 $ 23.95 886,300 $ 20.61 738,200 $ 18.32
The aggregate intrinsic value of the option shares outstanding and exercisable at October 26, 2007 was $35.0 million and $23.4 million, respectively.
The number of option shares vested or that are expected to vest at October 26, 2007 was 1.5 million and the aggregate intrinsic value was $34.7 million. The weighted average exercise price and weighted average remaining contractual term of option shares vested or that are expected to vest at October 26, 2007 was $30.73 and 6.76 years, respectively. The weighted-average remaining contractual term of option shares currently exercisable is 5.2 years as of October 26, 2007.
The table below presents stock activity related to stock options exercised in fiscal 2007 and 2006:
In Thousands 2007 2006
Proceeds from stock options exercised $ 6,553 $ 1,497Tax benefits related to stock options exercised $ 2,729 $ 797Intrinsic value of stock options exercised $ 9,843 $ 2,266
Total unrecognized compensation expense for options that have not vested as of October 26, 2007, is $7.0 million, which will be recognized over a weighted average period of 1.4 years. The total fair value of option shares vested dur-ing the year ended October 26, 2007 was $3.7 million.
The following table summarizes information for stock options outstanding at October 26, 2007:
Options Outstanding Options Exercisable
Weighted Average Weighted Weighted Range of Remaining Average Average Exercise Prices Shares Life (years) Price Shares Price
$ 11.38 – 18.95 301,750 3.89 $ 15.72 301,750 $ 15.72 18.96 – 27.19 331,750 5.22 23.99 282,000 23.84 27.20 – 38.90 307,400 7.44 36.59 151,200 36.56 38.91 – 38.91 315,600 9.12 38.91 — — 38.92 – 50.89 249,900 8.66 41.23 40,350 39.04
74
Note 13 : Capital Stock
The authorized capital stock of the Company consists of 25,000 shares of preferred stock ($100 par value), 475,000 shares of serial preferred stock ($1.00 par value), each issuable in series, and 60,000,000 shares of common stock ($.20 par value). At the end of fiscal 2007, there were no shares of preferred stock or serial preferred stock outstanding.
On October 12, 2007, the Company completed an underwritten public offering of 3.45 million shares of common stock, generating proceeds of $187.1 million. Proceeds from the offering were used to pay off its $100.0 million U.S. term loan facility and pay down a revolving credit facility of $27.0 million. On November 24, 2004, the Company com-pleted a public offering of 3.7 million shares of common stock, including shares sold under the underwriters’ over-al-lotment option, priced at $31.25 per share, generating net proceeds of approximately $109 million, of which $5.0 million was used to pay off existing credit facilities. The funds provided additional financial resources for acquisitions and general corporate purposes.
Effective December 5, 2002, the Board of Directors adopted a Shareholder Rights Plan, providing for the distribu-tion of one Series B Serial Preferred Stock Purchase Right (Right) for each share of common stock held as of De-cember 23, 2002. Each Right entitles the holder to purchase one one-hundredth of a share of Series B Serial Preferred Stock at an exercise price of $161.00, as may be adjusted from time to time.
The Right to purchase shares of Series B Serial Preferred Stock is triggered once a person or entity (together with such person’s or entity’s affiliates) beneficially owns 15% or more of the outstanding shares of common stock of the Company (such person or entity, an Acquiring Person). When the Right is triggered, the holder may purchase one one-hundredth of a share of Series B Serial Preferred Stock at an exercise price of $161.00 per share. If after the Rights are triggered, (i) the Company is the surviving corporation in a merger or similar transaction with an Acquir-ing Person, (ii) the Acquiring Person beneficially owns more than 15% of the outstanding shares of common stock or (iii) the Acquiring Person engages in other “self-dealing” transactions, holders of the Rights can elect to purchase shares of common stock of the Company with a market value of twice the exercise price. Similarly, if after the Rights are triggered, the Company is not the surviving corporation of a merger or similar transaction or the Company sells 50% or more of its assets to another person or entity, holders of the Rights may elect to purchase shares of common stock of the surviving corporation or that person or entity who purchased the Company’s assets with a market value of twice the exercise price.
Note 14 : Acquisitions
On March 14, 2007, the Company acquired all of the outstanding capital stock of CMC Electronics Inc. (CMC), a lead-ing aerospace/defense avionics company, for approximately $344.5 million in cash, including acquisition costs and an adjustment based on the amount of cash and net working capital as of closing. The acquisition significantly expands the scale of the Company’s existing Avionics & Controls business. CMC is included in the Avionics & Controls seg-ment.
The following summarizes the estimated fair market value of the assets acquired and liabilities assumed at the date of acquisition. The allocation of the purchase price was based upon a preliminary independent valuation report. The Company has not finalized the allocation of the purchase price to tangible and intangible assets and acquired net operating losses, unused tax credits and tax basis of acquired assets and liabilities. The purchase price includes the value of future development of existing technologies, the introduction of new technologies, and the addition of new customers. These factors resulted in the recording of goodwill of $212.7 million. The amount allocated to goodwill is not expected to be deductible for income tax purposes.
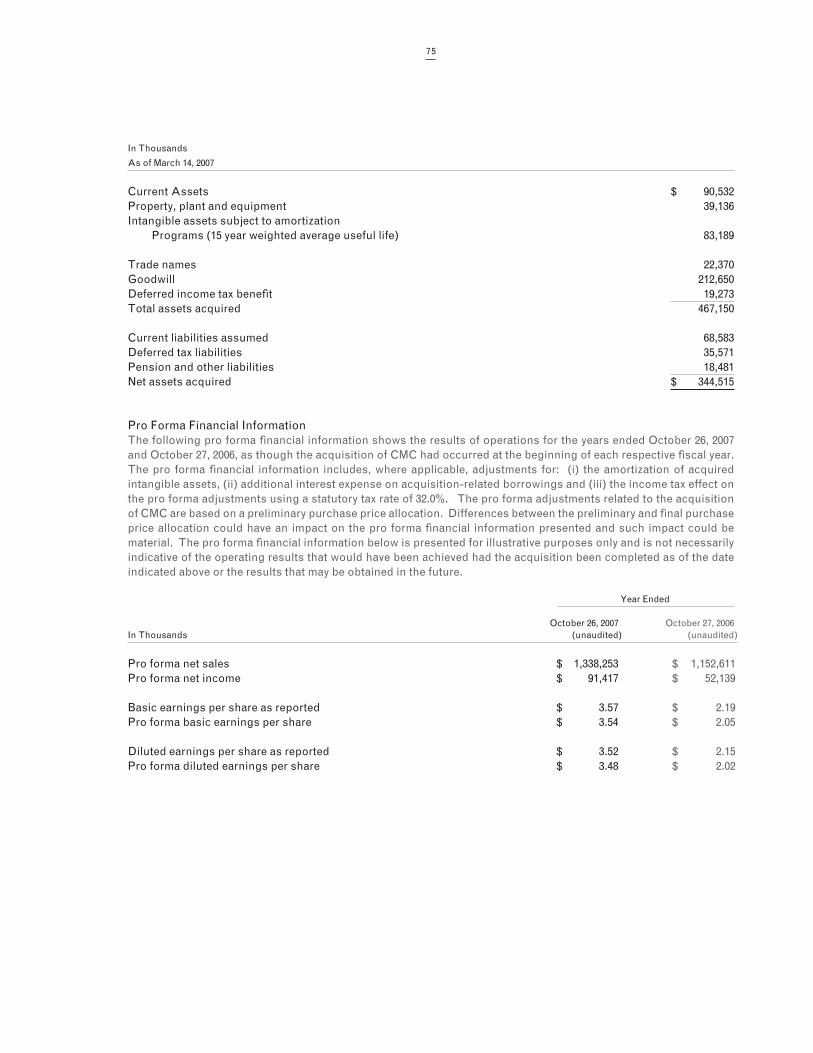
75
In Thousands
As of March 14, 2007
Current Assets $ 90,532Property, plant and equipment 39,136Intangible assets subject to amortization Programs (15 year weighted average useful life) 83,189
Trade names 22,370Goodwill 212,650Deferred income tax benefit 19,273Total assets acquired 467,150
Current liabilities assumed 68,583Deferred tax liabilities 35,571Pension and other liabilities 18,481Net assets acquired $ 344,515
Pro Forma Financial InformationThe following pro forma financial information shows the results of operations for the years ended October 26, 2007 and October 27, 2006, as though the acquisition of CMC had occurred at the beginning of each respective fiscal year. The pro forma financial information includes, where applicable, adjustments for: (i) the amortization of acquired intangible assets, (ii) additional interest expense on acquisition-related borrowings and (iii) the income tax effect on the pro forma adjustments using a statutory tax rate of 32.0%. The pro forma adjustments related to the acquisition of CMC are based on a preliminary purchase price allocation. Differences between the preliminary and final purchase price allocation could have an impact on the pro forma financial information presented and such impact could be material. The pro forma financial information below is presented for illustrative purposes only and is not necessarily indicative of the operating results that would have been achieved had the acquisition been completed as of the date indicated above or the results that may be obtained in the future.
Year Ended
October 26, 2007 October 27, 2006In Thousands (unaudited) (unaudited)
Pro forma net sales $ 1,338,253 $ 1,152,611Pro forma net income $ 91,417 $ 52,139
Basic earnings per share as reported $ 3.57 $ 2.19Pro forma basic earnings per share $ 3.54 $ 2.05
Diluted earnings per share as reported $ 3.52 $ 2.15Pro forma diluted earnings per share $ 3.48 $ 2.02
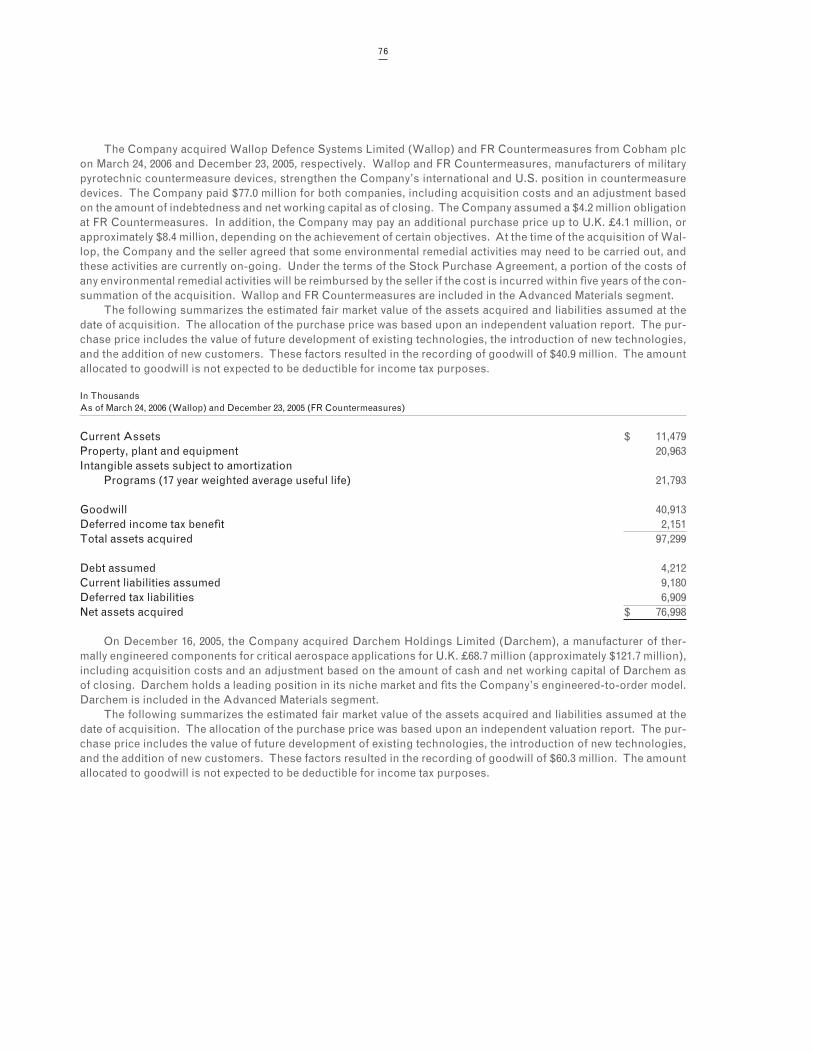
76
The Company acquired Wallop Defence Systems Limited (Wallop) and FR Countermeasures from Cobham plc on March 24, 2006 and December 23, 2005, respectively. Wallop and FR Countermeasures, manufacturers of military pyrotechnic countermeasure devices, strengthen the Company’s international and U.S. position in countermeasure devices. The Company paid $77.0 million for both companies, including acquisition costs and an adjustment based on the amount of indebtedness and net working capital as of closing. The Company assumed a $4.2 million obligation at FR Countermeasures. In addition, the Company may pay an additional purchase price up to U.K. £4.1 million, or approximately $8.4 million, depending on the achievement of certain objectives. At the time of the acquisition of Wal-lop, the Company and the seller agreed that some environmental remedial activities may need to be carried out, and these activities are currently on-going. Under the terms of the Stock Purchase Agreement, a portion of the costs of any environmental remedial activities will be reimbursed by the seller if the cost is incurred within five years of the con-summation of the acquisition. Wallop and FR Countermeasures are included in the Advanced Materials segment.
The following summarizes the estimated fair market value of the assets acquired and liabilities assumed at the date of acquisition. The allocation of the purchase price was based upon an independent valuation report. The pur-chase price includes the value of future development of existing technologies, the introduction of new technologies, and the addition of new customers. These factors resulted in the recording of goodwill of $40.9 million. The amount allocated to goodwill is not expected to be deductible for income tax purposes.
In ThousandsAs of March 24, 2006 (Wallop) and December 23, 2005 (FR Countermeasures)
Current Assets $ 11,479Property, plant and equipment 20,963Intangible assets subject to amortization Programs (17 year weighted average useful life) 21,793
Goodwill 40,913Deferred income tax benefit 2,151Total assets acquired 97,299
Debt assumed 4,212Current liabilities assumed 9,180Deferred tax liabilities 6,909Net assets acquired $ 76,998
On December 16, 2005, the Company acquired Darchem Holdings Limited (Darchem), a manufacturer of ther-mally engineered components for critical aerospace applications for U.K. £68.7 million (approximately $121.7 million), including acquisition costs and an adjustment based on the amount of cash and net working capital of Darchem as of closing. Darchem holds a leading position in its niche market and fits the Company’s engineered-to-order model. Darchem is included in the Advanced Materials segment.
The following summarizes the estimated fair market value of the assets acquired and liabilities assumed at the date of acquisition. The allocation of the purchase price was based upon an independent valuation report. The pur-chase price includes the value of future development of existing technologies, the introduction of new technologies, and the addition of new customers. These factors resulted in the recording of goodwill of $60.3 million. The amount allocated to goodwill is not expected to be deductible for income tax purposes.

77
In ThousandsAs of December 16, 2005
Current Assets $ 21,864Property, plant and equipment 8,499Intangible assets subject to amortization Programs (18 year weighted average useful life) 46,441 Customer relationships (6 year weighted useful life) 2,215 Patents (11 year weighted average useful life) 3,083 Other (1 year useful life) 284 52,023
Trade name 6,219Other 171Goodwill 60,313Total assets acquired 149,089
Current liabilities assumed 8,499Deferred tax liabilities 18,933Net assets acquired $ 121,657
On June 3, 2005, the Company acquired Palomar Products, Inc. (Palomar), a California-based manufacturer of secure military communications products, for $29.2 million. Palomar’s products extend the Company’s avionics and controls product lines. Palomar is included in the Avionics & Controls segment.
The following summarizes the estimated fair market value of the assets acquired and liabilities assumed at the date of acquisition. The allocation of the purchase price was based upon an independent valuation report. The pur-chase price includes the value of future development of existing technologies, the introduction of new technologies, and the addition of new customers. These factors resulted in the recording of goodwill of $17.2 million. The amount allocated to goodwill is not expected to be deductible for income tax purposes.
In ThousandsAs of June 3, 2005
Current Assets $ 8,079Property, plant and equipment 2,151Intangible assets subject to amortization Programs (16 year weighted average useful life) 9,001 Patents (15 year weighted average useful life) 2,082 Other (3 year useful life) 5 11,088
Deferred income tax benefits 1,526Goodwill 17,201Total assets acquired 40,045
Current liabilities assumed 6,571Deferred tax liabilities 4,317Net assets acquired $ 29,157
The above acquisitions were accounted for under the purchase method of accounting and the results of opera-tions were included from the effective date of each acquisition.

78
Note 15 : Business Segment Information
The Company’s businesses are organized and managed in three reporting segments: Avionics & Controls, Sensors & Systems and Advanced Materials. Operating segments within each reporting segment are aggregated. Operations within the Avionics & Controls segment focus on integrated cockpit systems, technology interface systems for com-mercial and military aircraft, and similar devices for land- and sea-based military vehicles, secure communications systems, specialized medical equipment and other industrial applications. Sensors & Systems includes operations that produce high-precision temperature and pressure sensors, electrical power switching, control and data com-munication devices, motion control components and other related systems principally for aerospace and defense customers. The Advanced Materials segment focuses on thermally engineered components for critical aerospace applications, high-performance elastomer products used in a wide range of commercial aerospace and military ap-plications, and combustible ordnance and electronic warfare countermeasure devices. All segments include sales to domestic, international, defense and commercial customers.
Geographic sales information is based on product origin. The Company evaluates these segments based on segment profits prior to net interest, other income/expense, corporate expenses and federal/foreign income taxes.
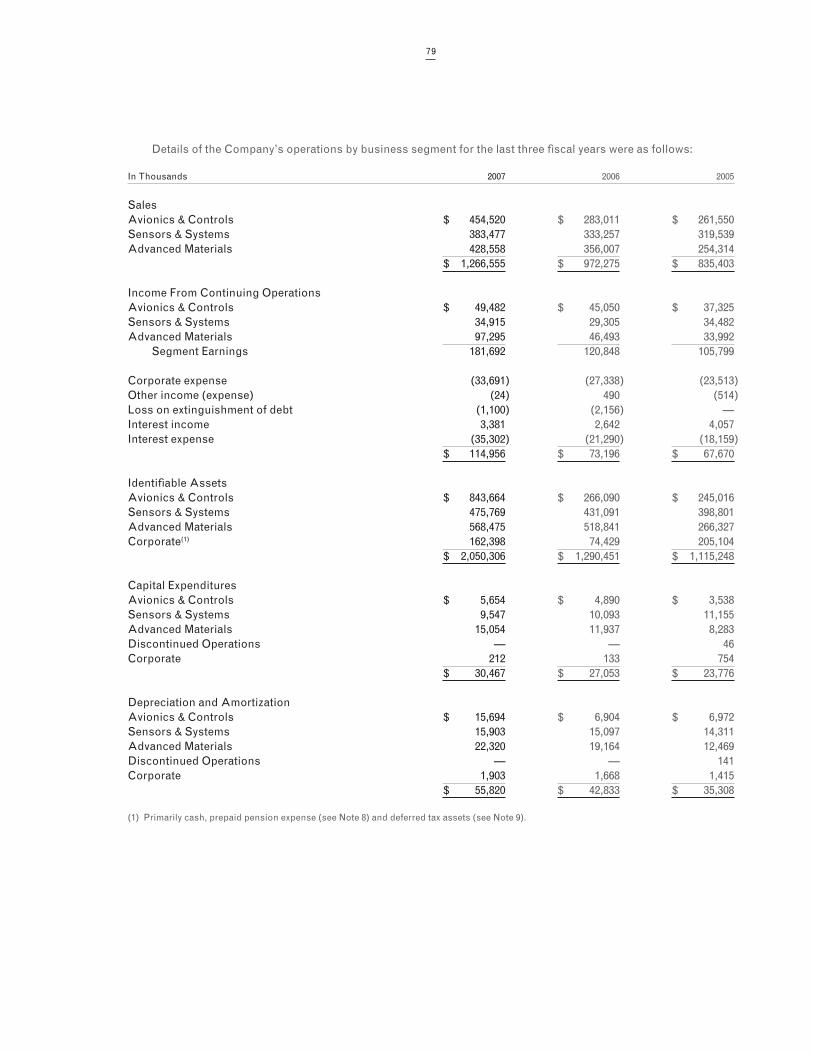
79
Details of the Company’s operations by business segment for the last three fiscal years were as follows:
In Thousands 2007 2006 2005
SalesAvionics & Controls $ 454,520 $ 283,011 $ 261,550Sensors & Systems 383,477 333,257 319,539Advanced Materials 428,558 356,007 254,314 $ 1,266,555 $ 972,275 $ 835,403
Income From Continuing OperationsAvionics & Controls $ 49,482 $ 45,050 $ 37,325Sensors & Systems 34,915 29,305 34,482Advanced Materials 97,295 46,493 33,992 Segment Earnings 181,692 120,848 105,799
Corporate expense (33,691) (27,338) (23,513)Other income (expense) (24) 490 (514)Loss on extinguishment of debt (1,100) (2,156) —Interest income 3,381 2,642 4,057Interest expense (35,302) (21,290) (18,159) $ 114,956 $ 73,196 $ 67,670
Identifiable AssetsAvionics & Controls $ 843,664 $ 266,090 $ 245,016Sensors & Systems 475,769 431,091 398,801Advanced Materials 568,475 518,841 266,327Corporate(1) 162,398 74,429 205,104 $ 2,050,306 $ 1,290,451 $ 1,115,248
Capital ExpendituresAvionics & Controls $ 5,654 $ 4,890 $ 3,538Sensors & Systems 9,547 10,093 11,155Advanced Materials 15,054 11,937 8,283Discontinued Operations — — 46Corporate 212 133 754 $ 30,467 $ 27,053 $ 23,776
Depreciation and AmortizationAvionics & Controls $ 15,694 $ 6,904 $ 6,972Sensors & Systems 15,903 15,097 14,311Advanced Materials 22,320 19,164 12,469Discontinued Operations — — 141Corporate 1,903 1,668 1,415 $ 55,820 $ 42,833 $ 35,308
(1) Primarily cash, prepaid pension expense (see Note 8) and deferred tax assets (see Note 9).
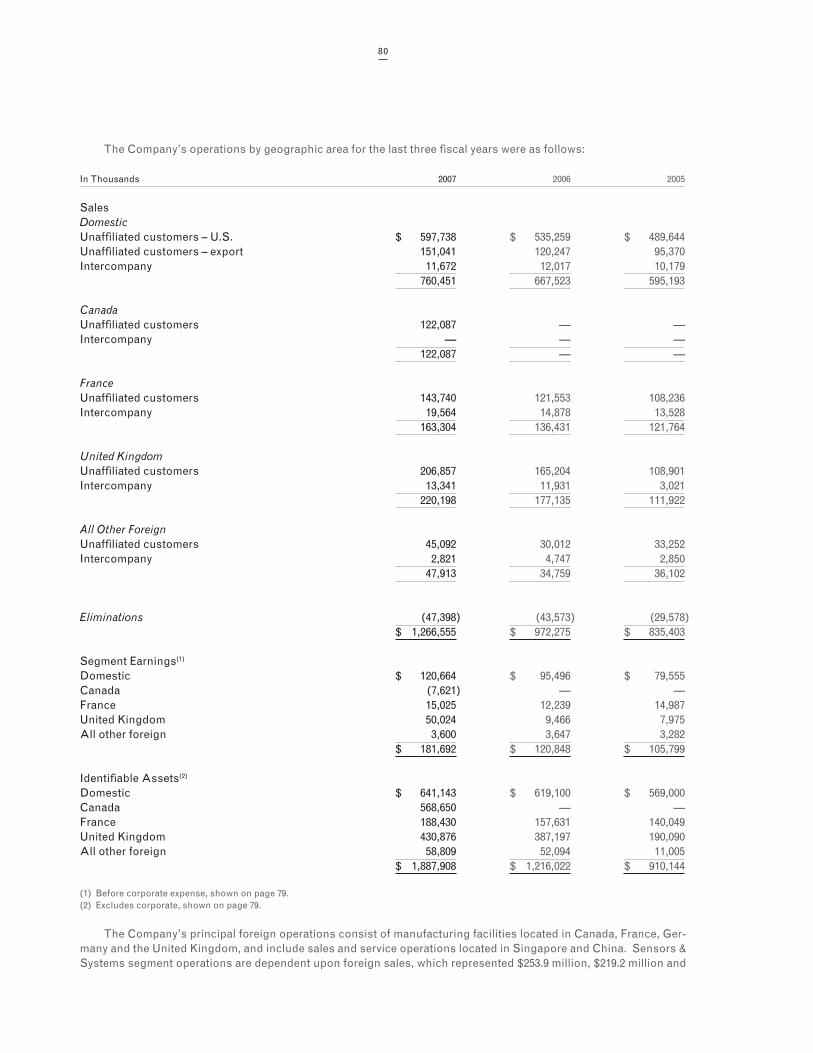
80
The Company’s operations by geographic area for the last three fiscal years were as follows:
In Thousands 2007 2006 2005
SalesDomesticUnaffiliated customers – U.S. $ 597,738 $ 535,259 $ 489,644Unaffiliated customers – export 151,041 120,247 95,370Intercompany 11,672 12,017 10,179 760,451 667,523 595,193
CanadaUnaffiliated customers 122,087 — —Intercompany — — — 122,087 — —
FranceUnaffiliated customers 143,740 121,553 108,236Intercompany 19,564 14,878 13,528 163,304 136,431 121,764
United KingdomUnaffiliated customers 206,857 165,204 108,901Intercompany 13,341 11,931 3,021 220,198 177,135 111,922
All Other ForeignUnaffiliated customers 45,092 30,012 33,252Intercompany 2,821 4,747 2,850 47,913 34,759 36,102
Eliminations (47,398) (43,573) (29,578) $ 1,266,555 $ 972,275 $ 835,403
Segment Earnings(1)
Domestic $ 120,664 $ 95,496 $ 79,555Canada (7,621) — —France 15,025 12,239 14,987United Kingdom 50,024 9,466 7,975All other foreign 3,600 3,647 3,282 $ 181,692 $ 120,848 $ 105,799
Identifiable Assets(2)
Domestic $ 641,143 $ 619,100 $ 569,000Canada 568,650 — —France 188,430 157,631 140,049United Kingdom 430,876 387,197 190,090All other foreign 58,809 52,094 11,005 $ 1,887,908 $ 1,216,022 $ 910,144
(1) Before corporate expense, shown on page 79.(2) Excludes corporate, shown on page 79.
The Company’s principal foreign operations consist of manufacturing facilities located in Canada, France, Ger-many and the United Kingdom, and include sales and service operations located in Singapore and China. Sensors & Systems segment operations are dependent upon foreign sales, which represented $253.9 million, $219.2 million and
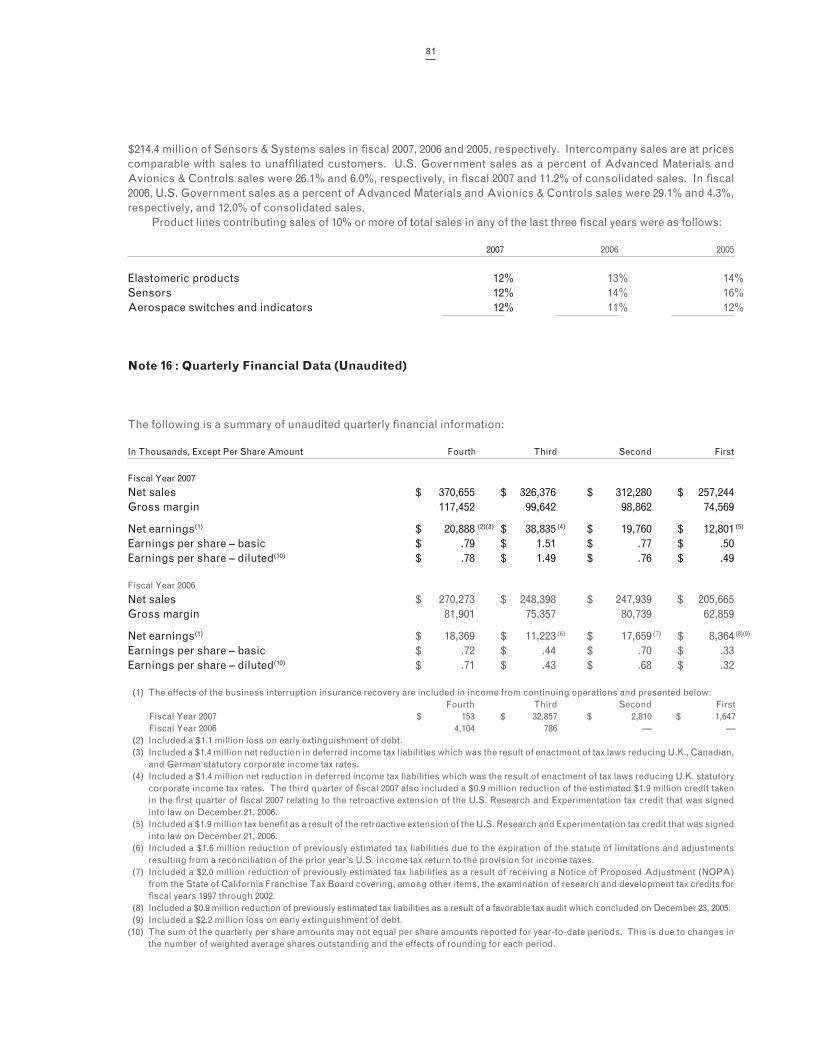
81
$214.4 million of Sensors & Systems sales in fiscal 2007, 2006 and 2005, respectively. Intercompany sales are at prices comparable with sales to unaffiliated customers. U.S. Government sales as a percent of Advanced Materials and Avionics & Controls sales were 26.1% and 6.0%, respectively, in fiscal 2007 and 11.2% of consolidated sales. In fiscal 2006, U.S. Government sales as a percent of Advanced Materials and Avionics & Controls sales were 29.1% and 4.3%, respectively, and 12.0% of consolidated sales.
Product lines contributing sales of 10% or more of total sales in any of the last three fiscal years were as follows:
2007 2006 2005
Elastomeric products 12% 13% 14%Sensors 12% 14% 16%Aerospace switches and indicators 12% 11% 12%
Note 16 : Quarterly Financial Data (Unaudited)
The following is a summary of unaudited quarterly financial information:
In Thousands, Except Per Share Amount Fourth Third Second First
Fiscal Year 2007
Net sales $ 370,655 $ 326,376 $ 312,280 $ 257,244Gross margin 117,452 99,642 98,862 74,569
Net earnings(1) $ 20,888 (2)(3) $ 38,835 (4) $ 19,760 $ 12,801 (5)
Earnings per share – basic $ .79 $ 1.51 $ .77 $ .50Earnings per share – diluted(10) $ .78 $ 1.49 $ .76 $ .49
Fiscal Year 2006
Net sales $ 270,273 $ 248,398 $ 247,939 $ 205,665Gross margin 81,901 75,357 80,739 62,859
Net earnings(1) $ 18,369 $ 11,223 (6) $ 17,659 (7) $ 8,364 (8)(9)
Earnings per share – basic $ .72 $ .44 $ .70 $ .33Earnings per share – diluted(10) $ .71 $ .43 $ .68 $ .32
(1) The effects of the business interruption insurance recovery are included in income from continuing operations and presented below: Fourth Third Second First Fiscal Year 2007 $ 153 $ 32,857 $ 2,810 $ 1,647 Fiscal Year 2006 4,104 786 — — (2) Included a $1.1 million loss on early extinguishment of debt. (3) Included a $1.4 million net reduction in deferred income tax liabilities which was the result of enactment of tax laws reducing U.K., Canadian,
and German statutory corporate income tax rates. (4) Included a $1.4 million net reduction in deferred income tax liabilities which was the result of enactment of tax laws reducing U.K. statutory
corporate income tax rates. The third quarter of fiscal 2007 also included a $0.9 million reduction of the estimated $1.9 million credit taken in the first quarter of fiscal 2007 relating to the retroactive extension of the U.S. Research and Experimentation tax credit that was signed into law on December 21, 2006.
(5) Included a $1.9 million tax benefit as a result of the retroactive extension of the U.S. Research and Experimentation tax credit that was signed into law on December 21, 2006.
(6) Included a $1.6 million reduction of previously estimated tax liabilities due to the expiration of the statute of limitations and adjustments resulting from a reconciliation of the prior year’s U.S. income tax return to the provision for income taxes.
(7) Included a $2.0 million reduction of previously estimated tax liabilities as a result of receiving a Notice of Proposed Adjustment (NOPA) from the State of California Franchise Tax Board covering, among other items, the examination of research and development tax credits for fiscal years 1997 through 2002.
(8) Included a $0.9 million reduction of previously estimated tax liabilities as a result of a favorable tax audit which concluded on December 23, 2005. (9) Included a $2.2 million loss on early extinguishment of debt.(10) The sum of the quarterly per share amounts may not equal per share amounts reported for year-to-date periods. This is due to changes in
the number of weighted average shares outstanding and the effects of rounding for each period.

82
Note 17 : Guarantors
The following schedules set forth condensed consolidating financial information as required by Rule 3-10 of Securi-ties and Exchange Commission Regulation S-X for fiscal 2007, 2006 and 2005 for (a) Esterline Technologies Corpora-tion (the Parent); (b) on a combined basis, the subsidiary guarantors (Guarantor Subsidiaries) of the Senior Notes and Senior Subordinated Notes which include Advanced Input Devices, Inc., Amtech Automated Manufacturing Technology, Angus Electronics Co., Armtec Countermeasures Co., Armtec Countermeasures TNO Co., Armtec De-fense Products Co., AVISTA, Incorporated, BVR Technologies Co., CMC DataComm Inc., CMC Electronics Acton Inc., CMC Electronics Aurora Inc., EA Technologies Corporation, Equipment Sales Co., Esterline Canadian Holding Co., Esterline Sensors Services Americas, Inc., Esterline Technologies Holdings Limited, Esterline Technologies Ltd. (England), H.A. Sales Co., Hauser Inc., Hytek Finishes Co., Janco Corporation, Kirkhill-TA Co., Korry Electron-ics Co., Leach Holding Corporation, Leach International Corporation, Leach International Mexico S. de R.L. de C.V. (Mexico), Leach Technology Group, Inc., Mason Electric Co., MC Tech Co., Memtron Technologies Co., Norwich Aero Products, Inc., Palomar Products, Inc., Pressure Systems, Inc., Pressure Systems International, Inc., Surftech Finishes Co., UMM Electronics Inc., and (c) on a combined basis, the subsidiary non-guarantors (Non-Guarantor Subsidiaries), which include Advanced Input Devices Ltd. (U.K.), Auxitrol S.A., BAE Systems Canada/Air TV LLC, Beacon Electronics Inc., CMC Electronics Inc., Darchem Engineering Limited, Darchem Holdings Ltd., Darchem In-sulation Systems Limited, Esterline Acquisition Ltd. (U.K.), Esterline Canadian Acquisition Company, Esterline Ca-nadian Limited Partnership, Esterline Foreign Sales Corporation (U.S. Virgin Islands), Esterline Input Devices Asia Ltd. (Barbados), Esterline Input Devices Ltd. (Shanghai), Esterline Sensors Services Asia PTE, Ltd. (Singapore), Esterline Technologies Denmark ApS (Denmark), Guizhou Leach-Tianyi Aviation Electrical Company Ltd. (China), Leach International Asia-Pacific Ltd. (Hong Kong), Leach International Europe S.A. (France), Leach International Germany GmbH (Germany), Leach International U.K. (England), Leach Italia Srl. (Italy), LRE Medical GmbH (Ger-many), Wallop Industries Limited (U.K.), Muirhead Aerospace Ltd., Norcroft Dynamics Ltd., Pressure Systems Inter-national Ltd., TA Mfg. Limited (U.K.), Wallop Defence Systems Limited, Weston Aero Ltd. (England), and Weston Aerospace Ltd. (England). Adjustments have been made to prior-year reported financial statements of the parent, guarantor, non-guarantor and eliminations to conform with the current year’s presentation due to certain reclassifica-tions of guarantor and non-guarantor subsidiaries and to apply the equity method of accounting for certain guarantor subsidiaries. At October 27, 2006, total assets of guarantors increased $95.5 million, total liabilities increased $24.4 million, and total equity increased $71.1 million. Total assets of non-guarantors increased $10.8 million, total liabili-ties decreased by $110.1 million, and total equity increased $120.9 million. For the fiscal year ended October 27, 2006, net earnings of guarantors increased $2.1 million. Net loss of non-guarantors decreased $1.9 million. The guarantor subsidiaries are direct and indirect wholly-owned subsidiaries of Esterline Technologies and have fully and uncondi-tionally, jointly and severally, guaranteed the Senior Notes and Senior Subordinated Notes.
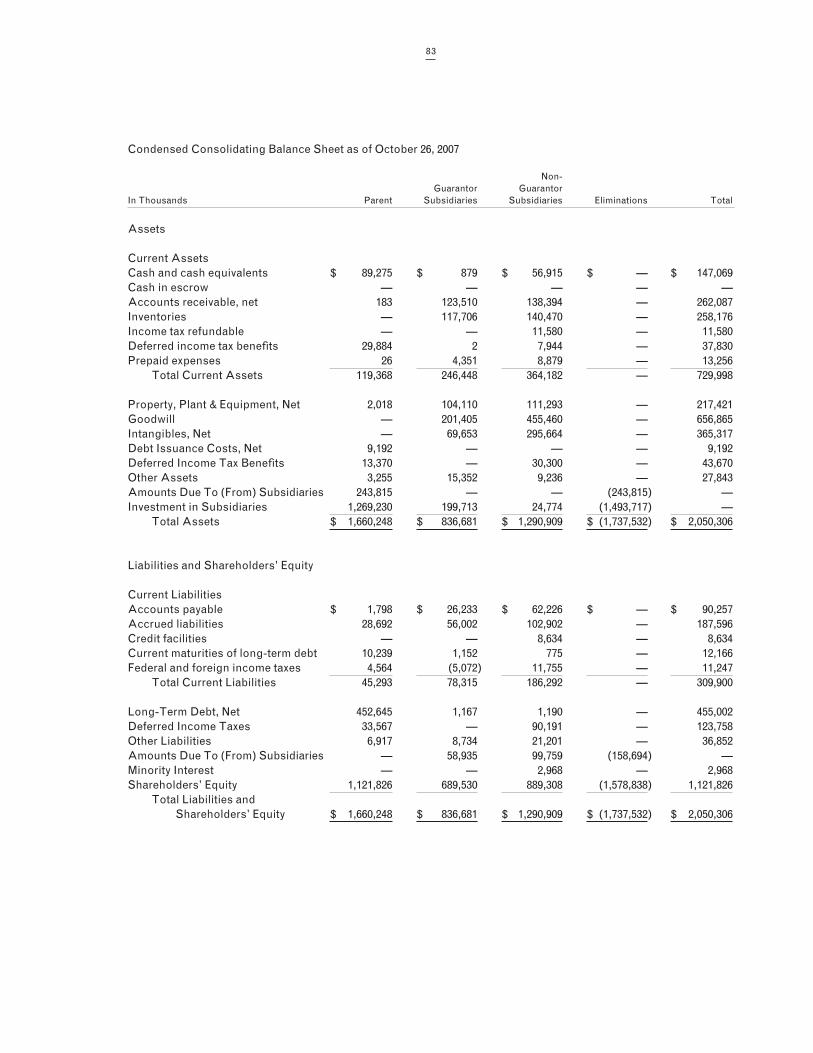
83
Condensed Consolidating Balance Sheet as of October 26, 2007
Non- Guarantor Guarantor In Thousands Parent Subsidiaries Subsidiaries Eliminations Total
Assets
Current AssetsCash and cash equivalents $ 89,275 $ 879 $ 56,915 $ — $ 147,069Cash in escrow — — — — —Accounts receivable, net 183 123,510 138,394 — 262,087Inventories — 117,706 140,470 — 258,176Income tax refundable — — 11,580 — 11,580Deferred income tax benefits 29,884 2 7,944 — 37,830Prepaid expenses 26 4,351 8,879 — 13,256 Total Current Assets 119,368 246,448 364,182 — 729,998
Property, Plant & Equipment, Net 2,018 104,110 111,293 — 217,421Goodwill — 201,405 455,460 — 656,865Intangibles, Net — 69,653 295,664 — 365,317Debt Issuance Costs, Net 9,192 — — — 9,192Deferred Income Tax Benefits 13,370 — 30,300 — 43,670Other Assets 3,255 15,352 9,236 — 27,843Amounts Due To (From) Subsidiaries 243,815 — — (243,815) —Investment in Subsidiaries 1,269,230 199,713 24,774 (1,493,717) — Total Assets $ 1,660,248 $ 836,681 $ 1,290,909 $ (1,737,532) $ 2,050,306
Liabilities and Shareholders’ Equity
Current LiabilitiesAccounts payable $ 1,798 $ 26,233 $ 62,226 $ — $ 90,257Accrued liabilities 28,692 56,002 102,902 — 187,596Credit facilities — — 8,634 — 8,634Current maturities of long-term debt 10,239 1,152 775 — 12,166Federal and foreign income taxes 4,564 (5,072) 11,755 — 11,247 Total Current Liabilities 45,293 78,315 186,292 — 309,900
Long-Term Debt, Net 452,645 1,167 1,190 — 455,002Deferred Income Taxes 33,567 — 90,191 — 123,758Other Liabilities 6,917 8,734 21,201 — 36,852Amounts Due To (From) Subsidiaries — 58,935 99,759 (158,694) —Minority Interest — — 2,968 — 2,968Shareholders’ Equity 1,121,826 689,530 889,308 (1,578,838) 1,121,826 Total Liabilities and Shareholders’ Equity $ 1,660,248 $ 836,681 $ 1,290,909 $ (1,737,532) $ 2,050,306
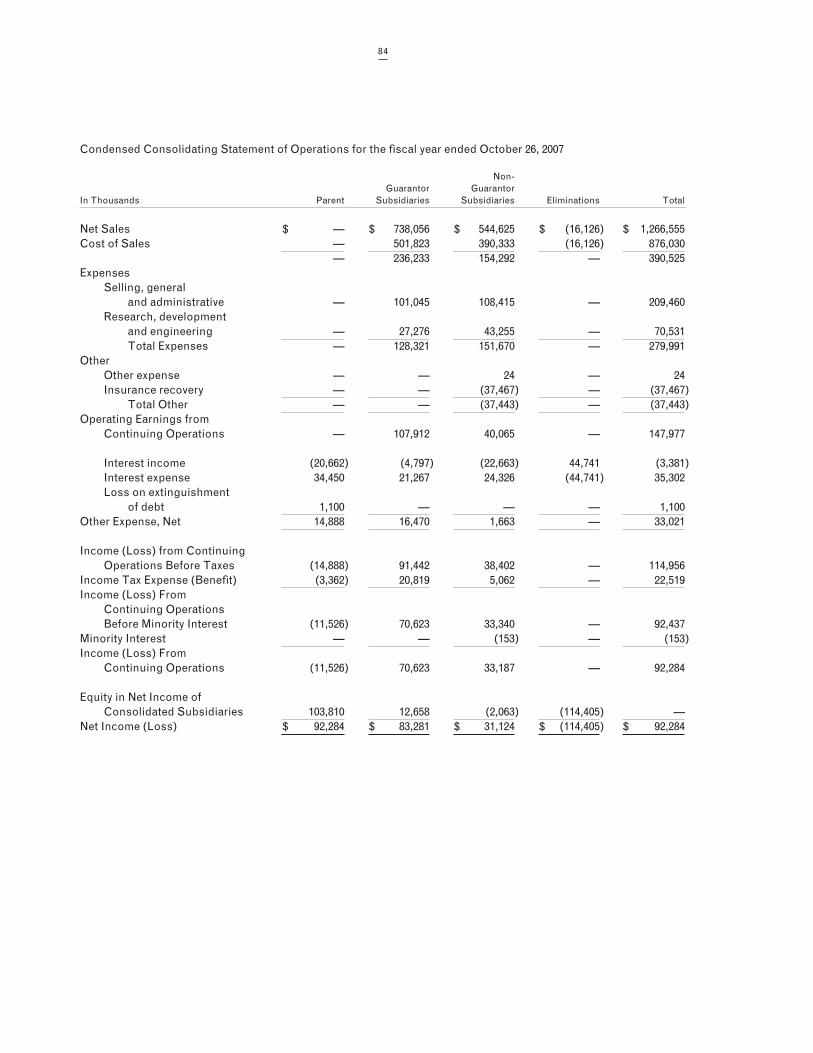
84
Condensed Consolidating Statement of Operations for the fiscal year ended October 26, 2007
Non- Guarantor Guarantor In Thousands Parent Subsidiaries Subsidiaries Eliminations Total
Net Sales $ — $ 738,056 $ 544,625 $ (16,126) $ 1,266,555Cost of Sales — 501,823 390,333 (16,126) 876,030 — 236,233 154,292 — 390,525Expenses Selling, general and administrative — 101,045 108,415 — 209,460 Research, development and engineering — 27,276 43,255 — 70,531 Total Expenses — 128,321 151,670 — 279,991Other Other expense — — 24 — 24 Insurance recovery — — (37,467) — (37,467) Total Other — — (37,443) — (37,443)Operating Earnings from Continuing Operations — 107,912 40,065 — 147,977
Interest income (20,662) (4,797) (22,663) 44,741 (3,381) Interest expense 34,450 21,267 24,326 (44,741) 35,302 Loss on extinguishment of debt 1,100 — — — 1,100Other Expense, Net 14,888 16,470 1,663 — 33,021
Income (Loss) from Continuing Operations Before Taxes (14,888) 91,442 38,402 — 114,956Income Tax Expense (Benefit) (3,362) 20,819 5,062 — 22,519Income (Loss) From Continuing Operations Before Minority Interest (11,526) 70,623 33,340 — 92,437Minority Interest — — (153) — (153)Income (Loss) From Continuing Operations (11,526) 70,623 33,187 — 92,284
Equity in Net Income of Consolidated Subsidiaries 103,810 12,658 (2,063) (114,405) —Net Income (Loss) $ 92,284 $ 83,281 $ 31,124 $ (114,405) $ 92,284
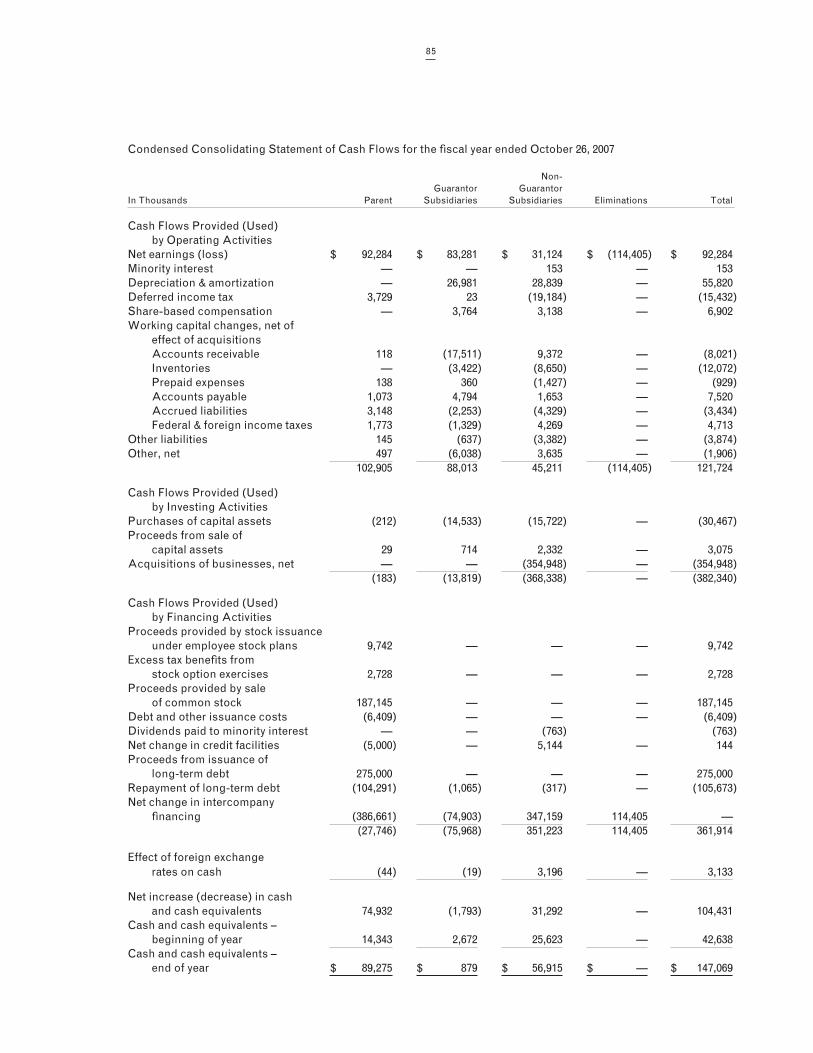
85
Condensed Consolidating Statement of Cash Flows for the fiscal year ended October 26, 2007
Non- Guarantor Guarantor In Thousands Parent Subsidiaries Subsidiaries Eliminations Total
Cash Flows Provided (Used) by Operating ActivitiesNet earnings (loss) $ 92,284 $ 83,281 $ 31,124 $ (114,405) $ 92,284Minority interest — — 153 — 153Depreciation & amortization — 26,981 28,839 — 55,820Deferred income tax 3,729 23 (19,184) — (15,432)Share-based compensation — 3,764 3,138 — 6,902Working capital changes, net of effect of acquisitions Accounts receivable 118 (17,511) 9,372 — (8,021) Inventories — (3,422) (8,650) — (12,072) Prepaid expenses 138 360 (1,427) — (929) Accounts payable 1,073 4,794 1,653 — 7,520 Accrued liabilities 3,148 (2,253) (4,329) — (3,434) Federal & foreign income taxes 1,773 (1,329) 4,269 — 4,713Other liabilities 145 (637) (3,382) — (3,874)Other, net 497 (6,038) 3,635 — (1,906) 102,905 88,013 45,211 (114,405) 121,724
Cash Flows Provided (Used) by Investing ActivitiesPurchases of capital assets (212) (14,533) (15,722) — (30,467)Proceeds from sale of capital assets 29 714 2,332 — 3,075Acquisitions of businesses, net — — (354,948) — (354,948) (183) (13,819) (368,338) — (382,340)
Cash Flows Provided (Used) by Financing ActivitiesProceeds provided by stock issuance under employee stock plans 9,742 — — — 9,742Excess tax benefits from stock option exercises 2,728 — — — 2,728Proceeds provided by sale of common stock 187,145 — — — 187,145Debt and other issuance costs (6,409) — — — (6,409)Dividends paid to minority interest — — (763) (763)Net change in credit facilities (5,000) — 5,144 — 144Proceeds from issuance of long-term debt 275,000 — — — 275,000Repayment of long-term debt (104,291) (1,065) (317) — (105,673)Net change in intercompany financing (386,661) (74,903) 347,159 114,405 — (27,746) (75,968) 351,223 114,405 361,914
Effect of foreign exchange rates on cash (44) (19) 3,196 — 3,133
Net increase (decrease) in cash and cash equivalents 74,932 (1,793) 31,292 — 104,431Cash and cash equivalents – beginning of year 14,343 2,672 25,623 — 42,638Cash and cash equivalents – end of year $ 89,275 $ 879 $ 56,915 $ — $ 147,069

86
Condensed Consolidating Balance Sheet as of October 27, 2006
Non- Guarantor Guarantor In Thousands Parent Subsidiaries Subsidiaries Eliminations Total
Assets
Current AssetsCash and cash equivalents $ 14,343 $ 2,672 $ 25,623 $ — $ 42,638Cash in escrow 4,409 — — — 4,409Accounts receivable, net 301 105,584 85,852 — 191,737Inventories — 107,864 77,982 — 185,846Income tax refundable — 3,394 2,837 — 6,231Deferred income tax benefits 25,227 5 2,700 — 27,932Prepaid expenses 164 4,480 4,901 — 9,545 Total Current Assets 44,444 223,999 199,895 — 468,338
Property, Plant & Equipment, Net 2,324 95,070 73,048 — 170,442Goodwill — 195,474 170,681 — 366,155Intangibles, Net 73 75,928 165,656 — 241,657Debt Issuance Costs, Net 5,297 — — — 5,297Deferred Income Tax Benefits 13,531 — 1,259 — 14,790Other Assets 2,708 15,344 5,720 — 23,772Amounts Due To (From) Subsidiaries 168,889 — — (168,889) —Investment in Subsidiaries 826,622 192,010 — (1,018,632) — Total Assets $ 1,063,888 $ 797,825 $ 616,259 $ (1,187,521) $ 1,290,451
Liabilities and Shareholders’ Equity
Current LiabilitiesAccounts payable $ 725 $ 20,678 $ 41,290 $ — $ 62,693Accrued liabilities 30,651 57,455 33,313 — 121,419Credit facilities 5,000 — 3,075 — 8,075Current maturities of long-term debt 4,054 — 1,484 — 5,538Federal and foreign income taxes 2,791 72 11 — 2,874 Total Current Liabilities 43,221 78,205 79,173 — 200,599
Long-Term Debt, Net 278,365 — 3,942 — 282,307Deferred Income Taxes 27,942 (20) 44,427 — 72,349Other Liabilities 6,371 9,998 7,260 — 23,629Amounts Due To (From) Subsidiaries — 28,228 187,381 (215,609) —Minority Interest — — 3,578 — 3,578Shareholders’ Equity 707,989 681,414 290,498 (971,912) 707,989 Total Liabilities and Shareholders’ Equity $ 1,063,888 $ 797,825 $ 616,259 $ (1,187,521) $ 1,290,451
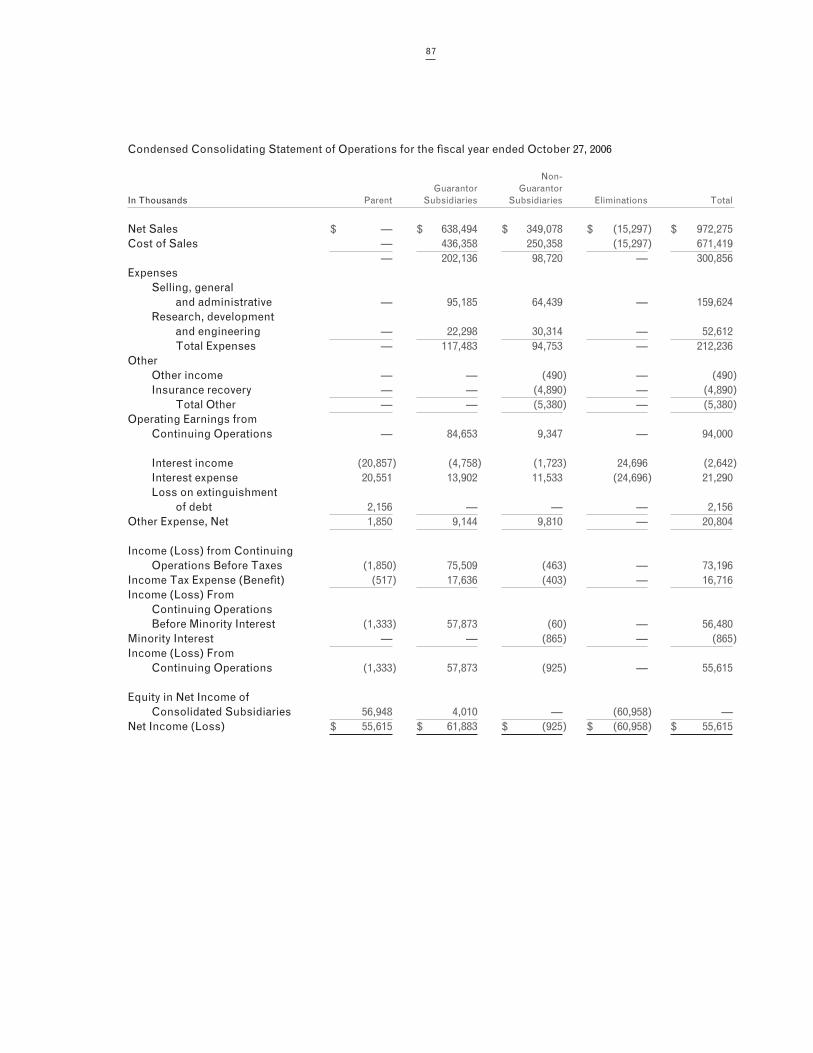
87
Condensed Consolidating Statement of Operations for the fiscal year ended October 27, 2006
Non- Guarantor Guarantor In Thousands Parent Subsidiaries Subsidiaries Eliminations Total
Net Sales $ — $ 638,494 $ 349,078 $ (15,297) $ 972,275Cost of Sales — 436,358 250,358 (15,297) 671,419 — 202,136 98,720 — 300,856Expenses Selling, general and administrative — 95,185 64,439 — 159,624 Research, development and engineering — 22,298 30,314 — 52,612 Total Expenses — 117,483 94,753 — 212,236Other Other income — — (490) — (490) Insurance recovery — — (4,890) — (4,890) Total Other — — (5,380) — (5,380)Operating Earnings from Continuing Operations — 84,653 9,347 — 94,000
Interest income (20,857) (4,758) (1,723) 24,696 (2,642) Interest expense 20,551 13,902 11,533 (24,696) 21,290 Loss on extinguishment of debt 2,156 — — — 2,156Other Expense, Net 1,850 9,144 9,810 — 20,804
Income (Loss) from Continuing Operations Before Taxes (1,850) 75,509 (463) — 73,196Income Tax Expense (Benefit) (517) 17,636 (403) — 16,716Income (Loss) From Continuing Operations Before Minority Interest (1,333) 57,873 (60) — 56,480Minority Interest — — (865) — (865)Income (Loss) From Continuing Operations (1,333) 57,873 (925) — 55,615
Equity in Net Income of Consolidated Subsidiaries 56,948 4,010 — (60,958) —Net Income (Loss) $ 55,615 $ 61,883 $ (925) $ (60,958) $ 55,615
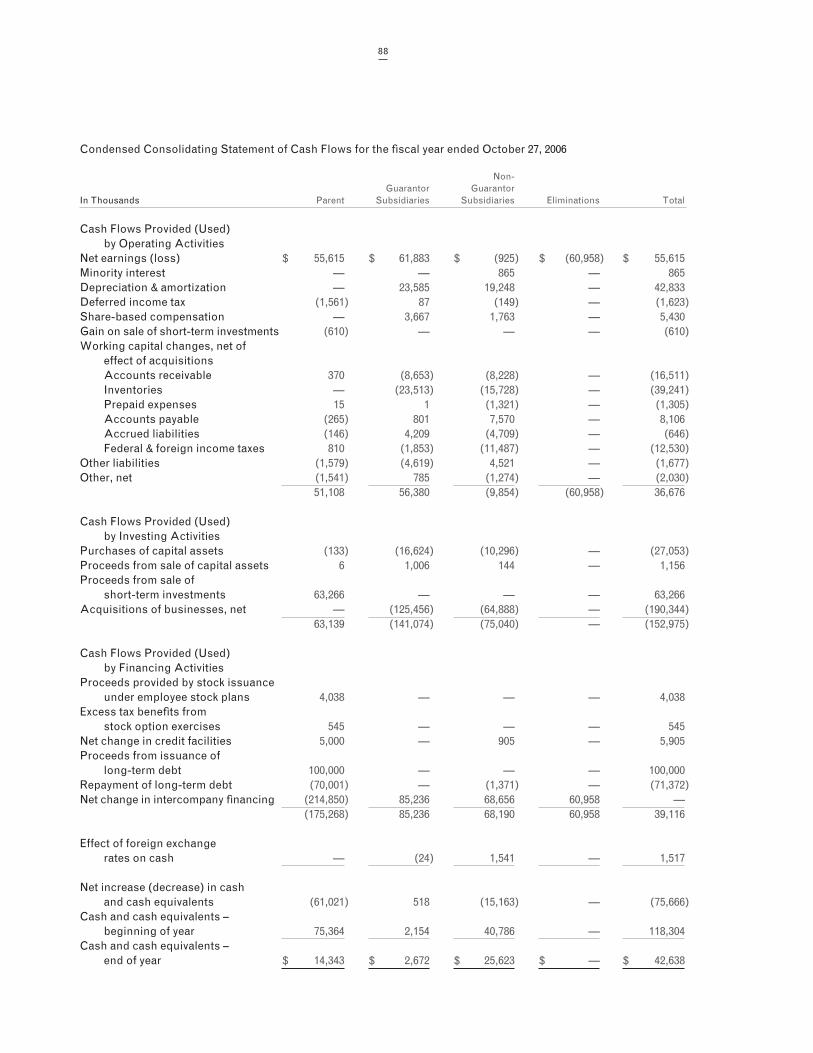
88
Condensed Consolidating Statement of Cash Flows for the fiscal year ended October 27, 2006
Non- Guarantor Guarantor In Thousands Parent Subsidiaries Subsidiaries Eliminations Total
Cash Flows Provided (Used) by Operating ActivitiesNet earnings (loss) $ 55,615 $ 61,883 $ (925) $ (60,958) $ 55,615Minority interest — — 865 — 865Depreciation & amortization — 23,585 19,248 — 42,833Deferred income tax (1,561) 87 (149) — (1,623)Share-based compensation — 3,667 1,763 — 5,430Gain on sale of short-term investments (610) — — — (610)Working capital changes, net of effect of acquisitions Accounts receivable 370 (8,653) (8,228) — (16,511) Inventories — (23,513) (15,728) — (39,241) Prepaid expenses 15 1 (1,321) — (1,305) Accounts payable (265) 801 7,570 — 8,106 Accrued liabilities (146) 4,209 (4,709) — (646) Federal & foreign income taxes 810 (1,853) (11,487) — (12,530)Other liabilities (1,579) (4,619) 4,521 — (1,677)Other, net (1,541) 785 (1,274) — (2,030) 51,108 56,380 (9,854) (60,958) 36,676
Cash Flows Provided (Used) by Investing ActivitiesPurchases of capital assets (133) (16,624) (10,296) — (27,053)Proceeds from sale of capital assets 6 1,006 144 — 1,156Proceeds from sale of short-term investments 63,266 — — — 63,266Acquisitions of businesses, net — (125,456) (64,888) — (190,344) 63,139 (141,074) (75,040) — (152,975)
Cash Flows Provided (Used) by Financing ActivitiesProceeds provided by stock issuance under employee stock plans 4,038 — — — 4,038Excess tax benefits from stock option exercises 545 — — — 545Net change in credit facilities 5,000 — 905 — 5,905Proceeds from issuance of long-term debt 100,000 — — — 100,000Repayment of long-term debt (70,001) — (1,371) — (71,372)Net change in intercompany financing (214,850) 85,236 68,656 60,958 — (175,268) 85,236 68,190 60,958 39,116
Effect of foreign exchange rates on cash — (24) 1,541 — 1,517
Net increase (decrease) in cash and cash equivalents (61,021) 518 (15,163) — (75,666)Cash and cash equivalents – beginning of year 75,364 2,154 40,786 — 118,304Cash and cash equivalents – end of year $ 14,343 $ 2,672 $ 25,623 $ — $ 42,638
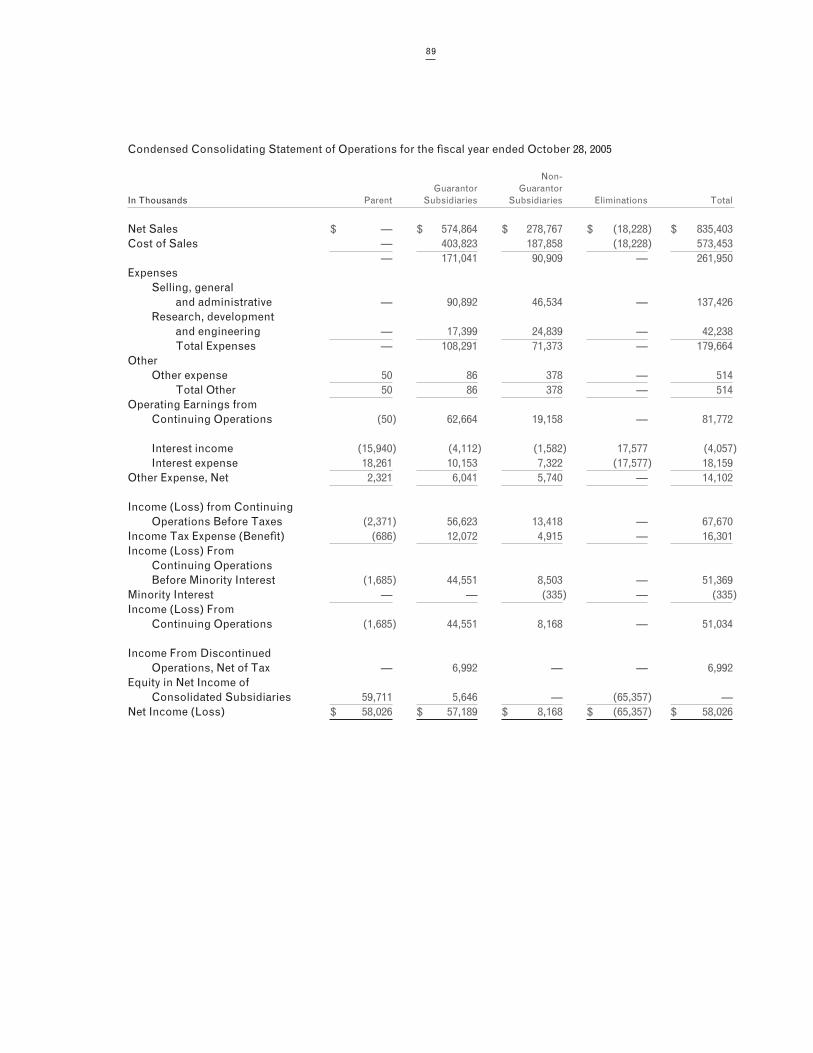
89
Condensed Consolidating Statement of Operations for the fiscal year ended October 28, 2005
Non- Guarantor Guarantor In Thousands Parent Subsidiaries Subsidiaries Eliminations Total
Net Sales $ — $ 574,864 $ 278,767 $ (18,228) $ 835,403Cost of Sales — 403,823 187,858 (18,228) 573,453 — 171,041 90,909 — 261,950Expenses Selling, general and administrative — 90,892 46,534 — 137,426 Research, development and engineering — 17,399 24,839 — 42,238 Total Expenses — 108,291 71,373 — 179,664Other Other expense 50 86 378 — 514 Total Other 50 86 378 — 514Operating Earnings from Continuing Operations (50) 62,664 19,158 — 81,772
Interest income (15,940) (4,112) (1,582) 17,577 (4,057) Interest expense 18,261 10,153 7,322 (17,577) 18,159Other Expense, Net 2,321 6,041 5,740 — 14,102
Income (Loss) from Continuing Operations Before Taxes (2,371) 56,623 13,418 — 67,670Income Tax Expense (Benefit) (686) 12,072 4,915 — 16,301Income (Loss) From Continuing Operations Before Minority Interest (1,685) 44,551 8,503 — 51,369Minority Interest — — (335) — (335)Income (Loss) From Continuing Operations (1,685) 44,551 8,168 — 51,034
Income From Discontinued Operations, Net of Tax — 6,992 — — 6,992Equity in Net Income of Consolidated Subsidiaries 59,711 5,646 — (65,357) —Net Income (Loss) $ 58,026 $ 57,189 $ 8,168 $ (65,357) $ 58,026
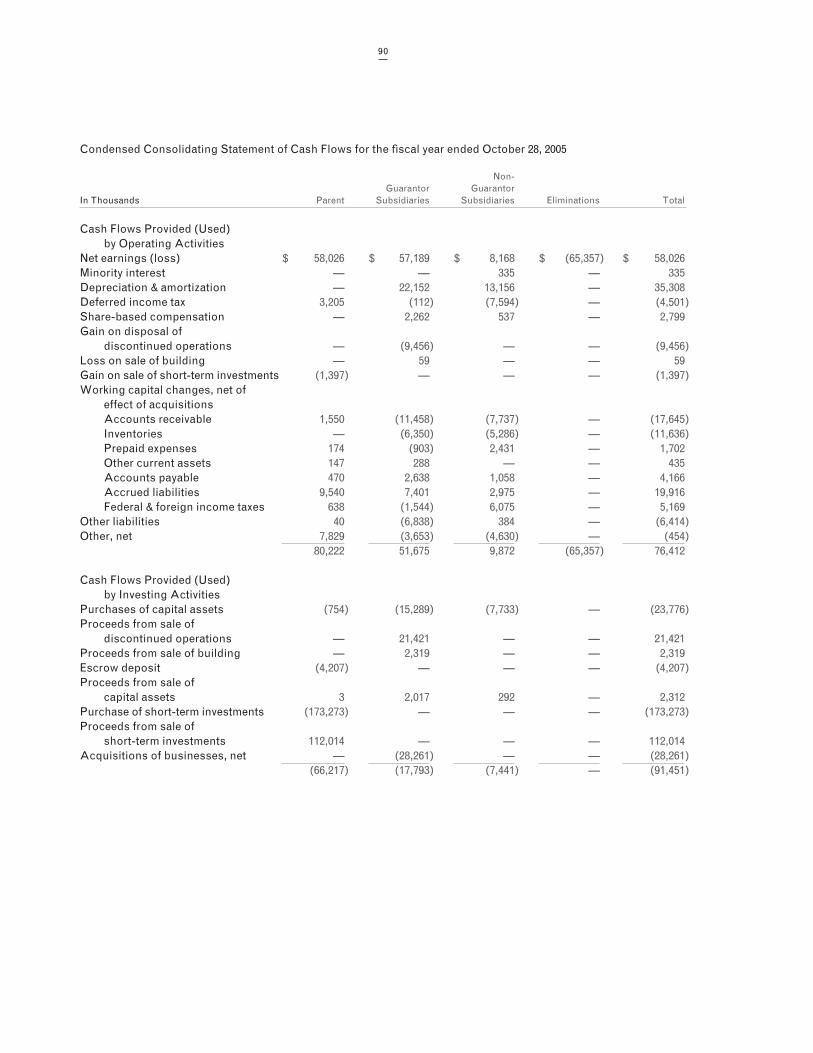
90
Condensed Consolidating Statement of Cash Flows for the fiscal year ended October 28, 2005
Non- Guarantor Guarantor In Thousands Parent Subsidiaries Subsidiaries Eliminations Total
Cash Flows Provided (Used) by Operating ActivitiesNet earnings (loss) $ 58,026 $ 57,189 $ 8,168 $ (65,357) $ 58,026Minority interest — — 335 — 335Depreciation & amortization — 22,152 13,156 — 35,308Deferred income tax 3,205 (112) (7,594) — (4,501)Share-based compensation — 2,262 537 — 2,799Gain on disposal of discontinued operations — (9,456) — — (9,456)Loss on sale of building — 59 — — 59Gain on sale of short-term investments (1,397) — — — (1,397)Working capital changes, net of effect of acquisitions Accounts receivable 1,550 (11,458) (7,737) — (17,645) Inventories — (6,350) (5,286) — (11,636) Prepaid expenses 174 (903) 2,431 — 1,702 Other current assets 147 288 — — 435 Accounts payable 470 2,638 1,058 — 4,166 Accrued liabilities 9,540 7,401 2,975 — 19,916 Federal & foreign income taxes 638 (1,544) 6,075 — 5,169Other liabilities 40 (6,838) 384 — (6,414)Other, net 7,829 (3,653) (4,630) — (454) 80,222 51,675 9,872 (65,357) 76,412
Cash Flows Provided (Used) by Investing ActivitiesPurchases of capital assets (754) (15,289) (7,733) — (23,776)Proceeds from sale of discontinued operations — 21,421 — — 21,421Proceeds from sale of building — 2,319 — — 2,319Escrow deposit (4,207) — — — (4,207)Proceeds from sale of capital assets 3 2,017 292 — 2,312Purchase of short-term investments (173,273) — — — (173,273)Proceeds from sale of short-term investments 112,014 — — — 112,014Acquisitions of businesses, net — (28,261) — — (28,261) (66,217) (17,793) (7,441) — (91,451)
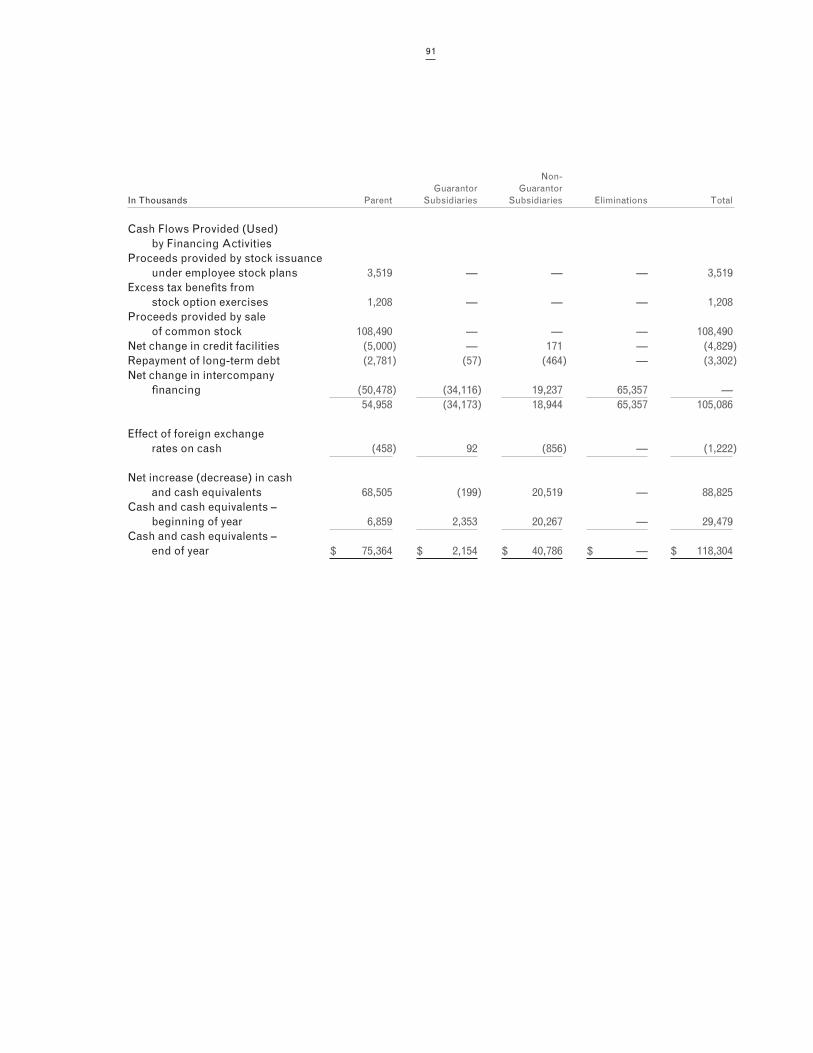
91
Condensed Consolidating Statement of Cash Flows for the fiscal year ended October 28, 2005
Non- Guarantor Guarantor In Thousands Parent Subsidiaries Subsidiaries Eliminations Total
Cash Flows Provided (Used) by Financing ActivitiesProceeds provided by stock issuance under employee stock plans 3,519 — — — 3,519Excess tax benefits from stock option exercises 1,208 — — — 1,208Proceeds provided by sale of common stock 108,490 — — — 108,490Net change in credit facilities (5,000) — 171 — (4,829)Repayment of long-term debt (2,781) (57) (464) — (3,302)Net change in intercompany financing (50,478) (34,116) 19,237 65,357 — 54,958 (34,173) 18,944 65,357 105,086
Effect of foreign exchange rates on cash (458) 92 (856) — (1,222)
Net increase (decrease) in cash and cash equivalents 68,505 (199) 20,519 — 88,825Cash and cash equivalents – beginning of year 6,859 2,353 20,267 — 29,479Cash and cash equivalents – end of year $ 75,364 $ 2,154 $ 40,786 $ — $ 118,304
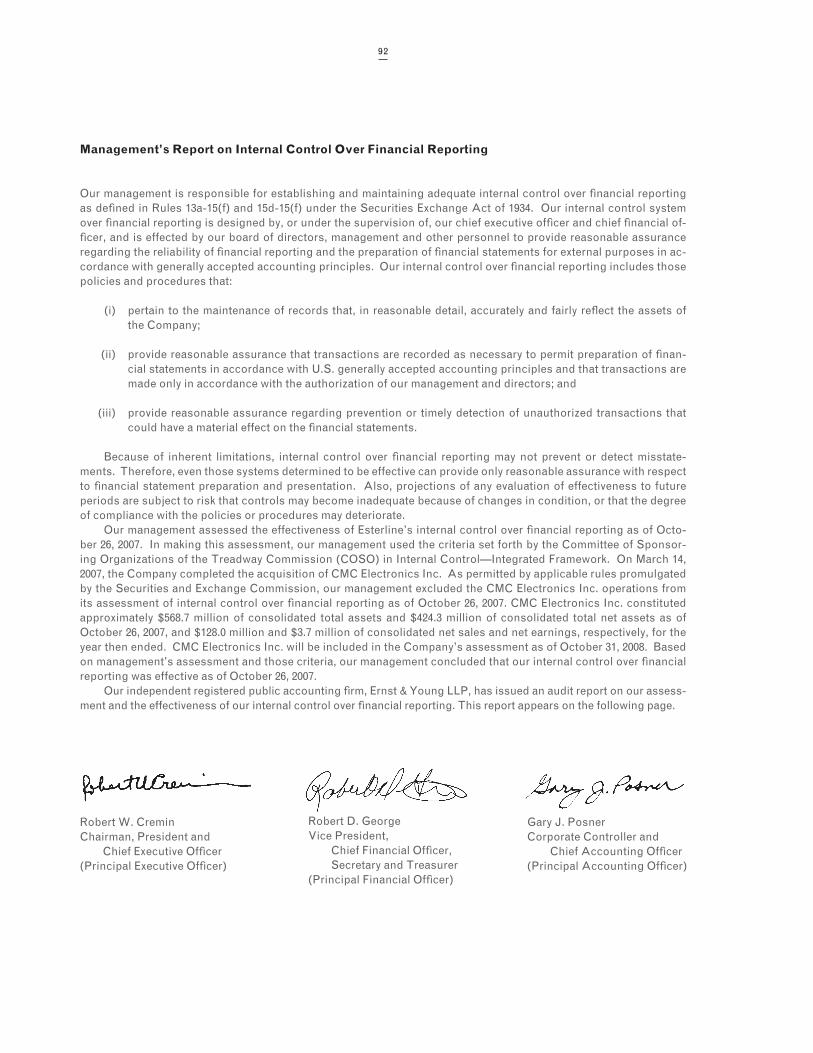
92
Management’s Report on Internal Control Over Financial Reporting
Our management is responsible for establishing and maintaining adequate internal control over financial reporting as defined in Rules 13a-15(f) and 15d-15(f) under the Securities Exchange Act of 1934. Our internal control system over financial reporting is designed by, or under the supervision of, our chief executive officer and chief financial of-ficer, and is effected by our board of directors, management and other personnel to provide reasonable assurance regarding the reliability of financial reporting and the preparation of financial statements for external purposes in ac-cordance with generally accepted accounting principles. Our internal control over financial reporting includes those policies and procedures that:
(i) pertain to the maintenance of records that, in reasonable detail, accurately and fairly reflect the assets of the Company;
(ii) provide reasonable assurance that transactions are recorded as necessary to permit preparation of finan-cial statements in accordance with U.S. generally accepted accounting principles and that transactions are made only in accordance with the authorization of our management and directors; and
(iii) provide reasonable assurance regarding prevention or timely detection of unauthorized transactions that could have a material effect on the financial statements.
Because of inherent limitations, internal control over financial reporting may not prevent or detect misstate-ments. Therefore, even those systems determined to be effective can provide only reasonable assurance with respect to financial statement preparation and presentation. Also, projections of any evaluation of effectiveness to future periods are subject to risk that controls may become inadequate because of changes in condition, or that the degree of compliance with the policies or procedures may deteriorate.
Our management assessed the effectiveness of Esterline’s internal control over financial reporting as of Octo-ber 26, 2007. In making this assessment, our management used the criteria set forth by the Committee of Sponsor-ing Organizations of the Treadway Commission (COSO) in Internal Control—Integrated Framework. On March 14, 2007, the Company completed the acquisition of CMC Electronics Inc. As permitted by applicable rules promulgated by the Securities and Exchange Commission, our management excluded the CMC Electronics Inc. operations from its assessment of internal control over financial reporting as of October 26, 2007. CMC Electronics Inc. constituted approximately $568.7 million of consolidated total assets and $424.3 million of consolidated total net assets as of October 26, 2007, and $128.0 million and $3.7 million of consolidated net sales and net earnings, respectively, for the year then ended. CMC Electronics Inc. will be included in the Company’s assessment as of October 31, 2008. Based on management’s assessment and those criteria, our management concluded that our internal control over financial reporting was effective as of October 26, 2007.
Our independent registered public accounting firm, Ernst & Young LLP, has issued an audit report on our assess-ment and the effectiveness of our internal control over financial reporting. This report appears on the following page.
Robert D. GeorgeVice President, Chief Financial Officer, Secretary and Treasurer(Principal Financial Officer)
Gary J. PosnerCorporate Controller and Chief Accounting Officer(Principal Accounting Officer)
Robert W. CreminChairman, President and Chief Executive Officer(Principal Executive Officer)
93
Report of Independent Registered Public Accounting Firm
The Board of Directors and ShareholdersEsterline Technologies CorporationBellevue, Washington
We have audited Esterline Technologies Corporation’s internal control over financial reporting as of October 26, 2007, based on criteria established in Internal Control—Integrated Framework issued by the Committee of Spon-soring Organizations of the Treadway Commission (the COSO criteria). Esterline Technologies Corporation’s management is responsible for maintaining effective internal control over financial reporting, and for its assess-ment of the effectiveness of internal control over financial reporting included in the accompanying Management’s Report on Internal Control Over Financial Reporting. Our responsibility is to express an opinion on the company’s internal control over financial reporting based on our audit.
We conducted our audit in accordance with the standards of the Public Company Accounting Oversight Board (United States). Those standards require that we plan and perform the audit to obtain reasonable assur-ance about whether effective internal control over financial reporting was maintained in all material respects. Our audit included obtaining an understanding of internal control over financial reporting, assessing the risk that a material weakness exists, testing and evaluating the design and operating effectiveness of internal control based on the assessed risk, and performing such other procedures as we considered necessary in the circumstances. We believe that our audit provides a reasonable basis for our opinion.
A company’s internal control over financial reporting is a process designed to provide reasonable assurance regarding the reliability of financial reporting and the preparation of financial statements for external purposes in accordance with generally accepted accounting principles. A company’s internal control over financial reporting includes those policies and procedures that (1) pertain to the maintenance of records that, in reasonable detail, accurately and fairly reflect the transactions and dispositions of the assets of the company; (2) provide reasonable assurance that transactions are recorded as necessary to permit preparation of financial statements in accordance with generally accepted accounting principles, and that receipts and expenditures of the company are being made only in accordance with authorizations of management and directors of the company; and (3) provide reasonable assurance regarding prevention or timely detection of unauthorized acquisition, use, or disposition of the compa-ny’s assets that could have a material effect on the financial statements.
Because of its inherent limitations, internal control over financial reporting may not prevent or detect mis-statements. Also, projections of any evaluation of effectiveness to future periods are subject to the risk that con-trols may become inadequate because of changes in conditions, or that the degree of compliance with the policies or procedures may deteriorate.
As indicated in the accompanying Management’s Report on Internal Control Over Financial Reporting, man-agement’s assessment of and conclusion on the effectiveness of internal control over financial reporting did not include the internal controls of CMC Electronics Inc., which is included in the 2007 consolidated financial state-ments of Esterline Technologies Corporation and constituted $568.7 million and $424.3 million of total and net assets, respectively, as of October 26, 2007 and $128.0 million and $3.7 million of revenues and net earnings, respec-tively, for the year then ended. Our audit of internal control over financial reporting of Esterline Technologies Cor-poration also did not include an evaluation of the internal control over financial reporting of CMC Electronics Inc.
In our opinion, Esterline Technologies Corporation maintained, in all material respects, effective internal con-trol over financial reporting as of October 26, 2007 based on the COSO criteria.
We also have audited, in accordance with the standards of the Public Company Accounting Oversight Board (United States), the accompanying consolidated balance sheets of Esterline Technologies Corporation as of Octo-ber 26, 2007 and October 27, 2006, and the related consolidated statements of operations, shareholders’ equity and comprehensive income, and cash flows for each of the three years in the period ended October 26, 2007 of Esterline Technologies Corporation and our report dated December 18, 2007 expressed an unqualified opinion thereon.
Seattle, WashingtonDecember 18, 2007
94
Report of Independent Registered Public Accounting Firm
The Board of Directors and Shareholders Esterline Technologies CorporationBellevue, Washington
We have audited the accompanying consolidated balance sheets of Esterline Technologies Corporation as of October 26, 2007 and October 27, 2006, and the related consolidated statements of operations, shareholders’ equity and comprehensive income, and cash flows for each of the three years in the period ended October 26, 2007. These financial statements are the responsibility of the Company’s management. Our responsibility is to express an opinion on these financial statements based on our audits.
We conducted our audits in accordance with the standards of the Public Company Accounting Oversight Board (United States). Those standards require that we plan and perform the audit to obtain reasonable assurance about whether the financial statements are free of material misstatement. An audit includes examining, on a test basis, evidence supporting the amounts and disclosures in the financial statements. An audit also includes as-sessing the accounting principles used and significant estimates made by management, as well as evaluating the overall financial statement presentation. We believe that our audits provide a reasonable basis for our opinion.
In our opinion, the financial statements referred to above present fairly, in all material respects, the consoli-dated financial position of Esterline Technologies Corporation at October 26, 2007 and October 27, 2006, and the consolidated results of its operations and its cash flows for each of the three years in the period ended October 26, 2007, in conformity with U.S. generally accepted accounting principles.
As discussed in Note 8 to the financial statements, in 2007 the Company changed its method of accounting for defined pension and other postretirement plans in accordance with FASB Statement No. 158. Also as discussed in Note 1 to the financial statements, in 2006 the Company changed its method of accounting for share-based pay-ments in accordance with FASB Statement No. 123(R).
We also have audited, in accordance with the standards of the Public Company Accounting Oversight Board (United States), the effectiveness of Esterline Technologies Corporation’s internal control over financial report-ing as of October 26, 2007, based on criteria established in Internal Control—Integrated Framework issued by the Committee of Sponsoring Organizations of the Treadway Commission and our report dated December 18, 2007 expressed an unqualified opinion thereon.
Seattle, WashingtonDecember 18, 2007

Directors
Robert W. CreminChairman, Presidentand Chief Executive OfficerEsterline Technologies
Lewis E. BurnsPresident and Chief Executive Officer (Retired)Dover Industries, Inc.
John F. ClearmanSpecial Advisor to the Board(Retired)Milliman USA
Robert S. ClineChairman and Chief Executive Officer (Retired)Airborne Freight Corporation
Anthony P. FranceschiniDirector, Presidentand Chief Executive OfficerStantec Inc.
Paul V. HaackSenior Partner (Retired)Deloitte & Touche LLP
Charles R. LarsonAdmiral (Retired)United States Navy Jerry D. LeitmanChairman (Retired)FuelCell Energy, Inc.
James J. MorrisVice President, Engineeringand Manufacturing (Retired)The Boeing Company
James L. PierceChairman (Retired)ARINC Incorporated
Officers
Robert W. CreminChairman, Presidentand Chief Executive Officer
Robert D. GeorgeVice President,Chief Financial Officer,Secretary and Treasurer
Marcia J. M. GreenbergVice PresidentHuman Resources
Frank E. HoustonGroup Vice President
Larry A. KringSr. Group Vice President
Stephen R. LarsonVice PresidentStrategy and Technology
R. Brad LawrenceGroup Vice President
Gary J. PosnerCorporate Controller andChief Accounting Officer
Investor Information
Corporate Headquarters500 108th Avenue N.E.Bellevue, WA 98004(425) [email protected]
Stock Exchange ListingNew York Stock ExchangeSymbol – ESL
Transfer Agent and RegistrarMellon Investor ServicesShareholder Services L.L.C.www.mellon-investor.com
Shareholder Relations(800) 522-6645
Outside of the U.S. (201) 329-8660
TDD Hearing Impaired(800) 231-5469
TDD Hearing ImpairedOutside of the U.S.(201) 329-8534
Shareholder CorrespondenceP.O. Box 3315 South Hackensack, NJ 07606
Overnight Delivery85 Challenger RoadRidgefield Park, NJ 07660
Annual Meeting of ShareholdersThe annual meeting will be held on March 5, 2008 at the Bellevue Club in Bellevue, WA, located at 11200 SE 6th St. Bellevue, WA 98004.The meeting will start at 10:00 a.m.
10-K reportA copy of Esterline’s annual report on Form 10-K filed with the Securities and Exchange Commission will be provided without charge upon written request to the corporate headquarters, attention: Director, Corporate Communications or through our website: www.esterline.com
Stock Held in Street NameEsterline maintains a direct mailing list to help ensure that shareholders whose stock is held in street name (broker or similar ac-counts) receive information on a timely basis. If you would like your name added to this list, please send your request to the corporate headquarters, attention: Director, Corporate Communications.
Stock Exchange CertificationsEsterline has filed the CEO and CFO certifications required by Section 302 of the Sarbanes-Oxley Act of 2002 as exhibits to its Annual Report on Form 10-K for the fiscal year ended October 26, 2007 and has submit-ted to the NYSE the annual CEO certification required by Section 303A.12 (a) of the NYSE listing standards.
95
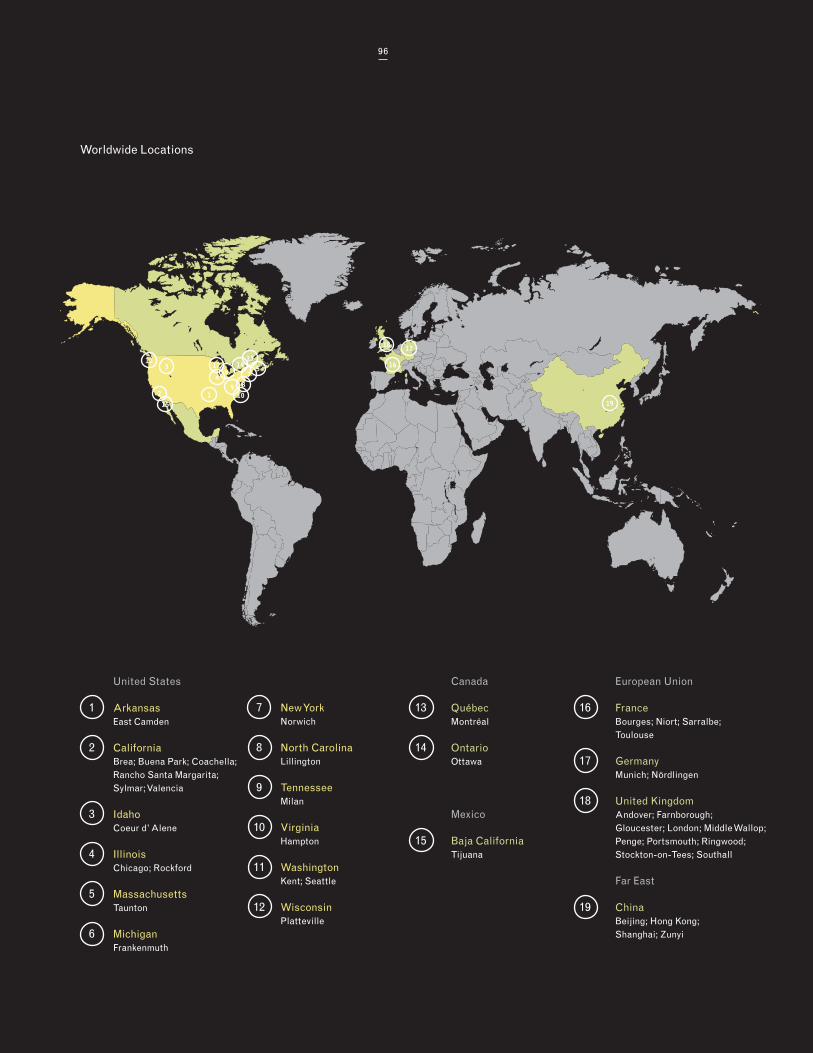
2 1
3
456 7
89
1211
10
16
1718
19
United States
1 Arkansas East Camden 2 California Brea; Buena Park; Coachella; Rancho Santa Margarita; Sylmar; Valencia 3 Idaho Coeur d’ Alene
4 Illinois Chicago; Rockford
5 Massachusetts Taunton
6 Michigan Frankenmuth
7 New York Norwich
8 North Carolina Lillington
9 Tennessee Milan
10 Virginia Hampton 11 Washington Kent; Seattle
12 Wisconsin Platteville
Canada
13 Québec Montréal
14 Ontario Ottawa
Mexico
15 Baja California Tijuana
Worldwide Locations
European Union
16 France Bourges; Niort; Sarralbe; Toulouse
17 Germany Munich; Nördlingen 18 United Kingdom Andover; Farnborough; Gloucester; London; Middle Wallop; Penge; Portsmouth; Ringwood; Stockton-on-Tees; Southall
Far East
19 China Beijing; Hong Kong; Shanghai; Zunyi
15
1413
96


Related Documents