IESAM PRESENTATION

Welcome message from author
This document is posted to help you gain knowledge. Please leave a comment to let me know what you think about it! Share it to your friends and learn new things together.
Transcript

IESAM PRESENTATION

2
The Belém MarketLocation Status
Higher studentconcentration
Lower concentration
Greenfield address– Ver-o-Peso
Ananindeuapopulation: 470k
Belémpopulation: 1.4
million
The Pará state is the 19th largest post-secondary market in terms of enrollments and 10th in relation to new students The number of entrants increased 29% in Pará between 2010-11
Among the capitals in Brazil, Belém is the 16th in relation to the number ofnew entrants
Belém has 70% of Pará’s post-secondary students
IESAM competes with 16 other institutions. The competitorshave an average of 2,433 and a median of 2,046 enrolledstudents.
The number of new entrants grew by 14% between 2010 and2011 This is the 3rd highest growth in the location
IESAM has a 12% market share 9% share of new entrants

3
BelémPositioning
11,400
9,500
5,700
4,500
3,800 3,700
3,0002,600
2,200 2,100
Unama Esamaz Cesupa FACI Ipiranga Fibra Esmac Famaz Fapan
26% 19% 16% 12% 12% 10% 8% 8% 7% 6% 31% 28% 16% 12% 10% 8% 8% 7% 6% 6%
Mkt Share
Mkt Share
9,500
6,900
5,700
4,500 4,500
3,800 3,700
3,0002,600
2,200
Unama Esamaz Cesupa FACI Ipiranga Fibra Esmac Famaz
1,100
10,600
+ FMN

4
IESAMAt-a-glance
• Located in Belém
• Controlling Institution: Organização Paraense Educacional e de Empreendimentos Ltda.
• Higher Education Institution: Instituto de estudos Superiores da Amazônia -IESAM
• For-profit institution (limited company)
• 23 undergraduate courses
• 9 in Engineering
• 7 in Management
• 6 Technological
• 18 graduate courses
• 4 in Finance and Management
• 3 in Communication and Design
• 7 in Engineering
• 4 in Technology
• Net Revenue (2013A): R$31 millionNet Revenue (2014E): R$33 million
• Student base (2013): 4,000Student base (2014) (MoU): 4,500
• IESAM’s Net Average Ticket: R$654Estácio’s Net Average Ticket: R$552
The Company
+19%
Index Grade Year
CI - Institutional Concept 3 2009
IGC -General Course Index 3 2012
Continuous IGC 2,12 2012
MEC’s Evaluation

5
IESAMOperational Information
Morning47.7%
Afternoon 3.1%
Night 49.1%
Shift Distribution
12.9%
41.5%
79.3%
46.2%
7.8% 12.3%
Matrículas (2014/01) Vagas Ociosas
Student Base
Gestão Engenharia Tecnólogos
1,405 1,5822,001
2,614452 393
620
773
791 645
538
417
435 428
423
369
2010 2011 2012 2013
Student Base Evolution – Subject Area
Engenharias Pós-graduação Gestão Tecnólogos
Regulatory
Course ENADE CPC CC
Business Administration 2 3 4
Accounting 2 2 5
Multimedia 2 3 5
Public Relations - - 3
Design: Products 4 4 -
Environmental Engineering - - 4
Electrical Engineering - - 3
Computer Engineering 1 2 5
Control and Automation Eng. 2 2 4
Telecommunications Engineering 3 3 5
Mechanical Engineering - - 3
Civil Engineering - - 4
Production Engineering - - -
Architecture - - -
Industrial Maintenance 2 2 3
Computer Networks - - 3
Digital Games - - -
Workplace Safety - - 3
Information System 1 2 4
Metallurgical Engineering - - 3
Construction Control - - -
Audiovisual production - - -
Tourism 3 SC 3
Idle SeatsEnrollments (14.1)
TechnologicalMgmtGraduateEngineering
Mgmt Eng. Technological

6
IESAMSeats - Idleness
3,894
11,546
Total Seats
Matrículas (2014/01) Vagas Ociosas
92%
66%84%
Gestão Engenharia Tecnólogos
Idleness by Subject Area
Regulatory
CourseAnnual
Seats
Duration
(Years)Total
Enrollments
(2014/01)
Idleness
(%)
400 4 1.600 50 97%
200 4 800 58 93%
150 4 600 118 80%
150 4 600 20 97%
150 4 600 84 86%
180 5 900 364 60%
180 5 900 524 42%
200 5 1,000 334 67%
150 5 750 395 47%
200 5 1,000 140 86%
180 5 900 435 52%
120 5 600 291 52%
120 5 600 188 69%
150 5 750 125 83%
100 3 300 104 65%
120 3 300 55 82%
120 3 360 62 83%
120 3 360 54 85%
150 4 600 126 79%
180 5 900 0 100%
60 3 180 0 100%
120 2 240 0 100%
150 4 600 0 100%
Graduate na na na na na
Total 3,650 15,440 3,527 77%
Idle SeatsEnrollments (14.1)
Business Administration
Accounting
Multimedia
Public Relations
Design: Product DesignEnvironmental Engineering
Electrical Engineering
Computer EngineeringControl and Automation Eng.Telecommunications EngineeringMechanical Engineering
Civil EngineeringProduction EngineeringArchitecture
Industrial MaintenanceComputer Networks
Digital GamesWorkplace Safety
Information System
Metallurgical Engineering
Construction ControlAudiovisual productionTourism
Mgmt Engineering Technological
7
IESAMStrategic Rationale / Attention Point
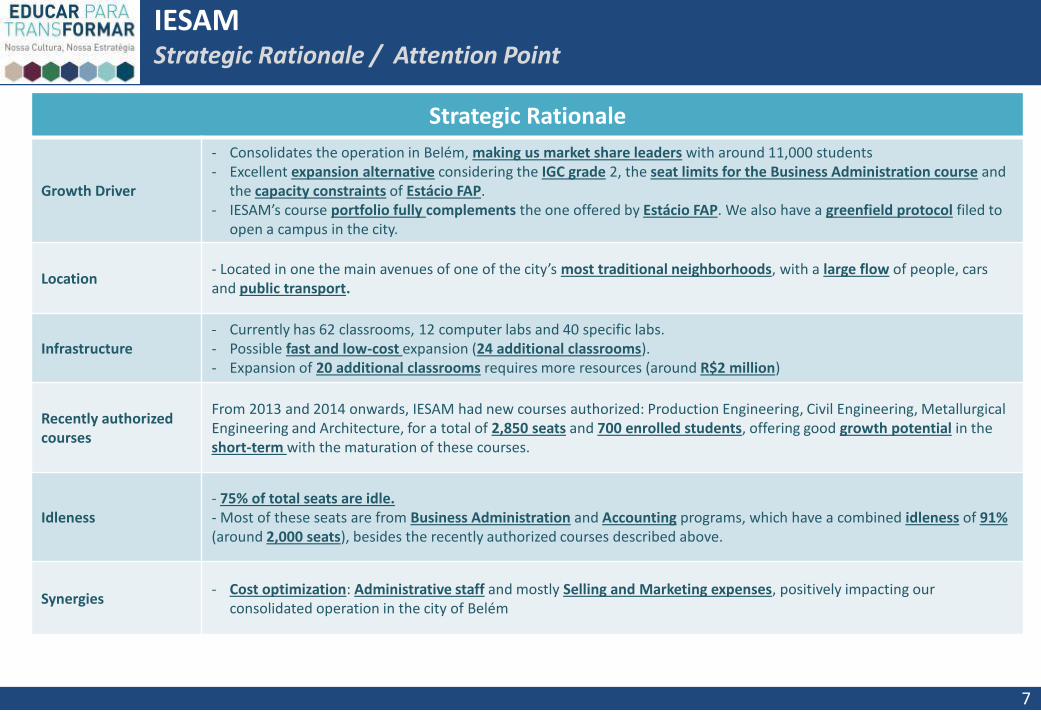
Strategic Rationale
Growth Driver
- Consolidates the operation in Belém, making us market share leaders with around 11,000 students - Excellent expansion alternative considering the IGC grade 2, the seat limits for the Business Administration course and
the capacity constraints of Estácio FAP. - IESAM’s course portfolio fully complements the one offered by Estácio FAP. We also have a greenfield protocol filed to
open a campus in the city.
Location- Located in one the main avenues of one of the city’s most traditional neighborhoods, with a large flow of people, cars and public transport.
Infrastructure- Currently has 62 classrooms, 12 computer labs and 40 specific labs. - Possible fast and low-cost expansion (24 additional classrooms).- Expansion of 20 additional classrooms requires more resources (around R$2 million)
Recently authorized courses
From 2013 and 2014 onwards, IESAM had new courses authorized: Production Engineering, Civil Engineering, Metallurgical Engineering and Architecture, for a total of 2,850 seats and 700 enrolled students, offering good growth potential in the short-term with the maturation of these courses.
Idleness- 75% of total seats are idle.- Most of these seats are from Business Administration and Accounting programs, which have a combined idleness of 91% (around 2,000 seats), besides the recently authorized courses described above.
Synergies- Cost optimization: Administrative staff and mostly Selling and Marketing expenses, positively impacting our
consolidated operation in the city of Belém

8
IESAMValuation
Result
• PV - 2024 R$ 56.2 million
• PV – Perpet.:R$ 64.4 million
• Total EV:R$ 120.6 million
• IRR: 28.4%
P&L Statement 2014-02 2015 2016 2017 2018 2019 2020 2021 2022 2023 2024 CAGR
Average Student Base 4,865 6,154 7,122 7,872 8,364 8,485 8,596 8,707 8,820 8,934 9,050 7.8%
YoY 22.6% 26.5% 15.7% 10.5% 6.3% 1.5% 1.3% 1.3% 1.3% 1.3% 1.3%
Net Revenue 19.5 48.2 50.6 54.4 60.8 64.8 68.9 73.8 79.0 84.7 90.7 10.3%
Personnel (10.5) (23.2) (23.1) (23.5) (23.5) (25.0) (26.5) (27.4) (29.3) (31.4) (33.6)
Administrative Staff (3.8) (8.5) (7.8) (7.2) (5.5) (5.8) (6.2) (6.6) (7.1) (7.6) (8.2)
Faculty (5.5) (13.5) (14.2) (15.3) (17.1) (18.2) (19.3) (20.7) (22.2) (23.8) (25.4)
Other G&A (2.9) (6.7) (6.6) (6.5) (7.3) (7.8) (8.3) (8.9) (9.5) (10.2) (10.9)
Rentals (1.1) (4.5) (4.7) (5.0) (5.2) (5.5) (5.7) (6.0) (6.3) (6.6) (7.0)
Selling and Marketing (1.3) (3.1) (3.3) (3.5) (4.0) (4.2) (4.5) (4.8) (5.1) (5.5) (5.9)
PDA (1.2) (2.9) (3.0) (3.3) (3.6) (3.9) (4.1) (4.4) (4.7) (5.1) (5.4)EBITDA 2.5 7.8 9.9 12.6 17.2 18.4 19.7 22.3 24.0 25.9 27.9 10.4%
Free Cash Flow for the Firm 2014-02 2015 2016 2017 2018 2019 2020 2021 2022 2023 2024
EBIT 2.5 7.8 9.9 12.6 17.2 18.4 19.7 22.3 24.0 25.9 27.9
Tax (4.5) (0,3) (0,4) (0,6) (0,8) (0,8) (0,9) (1,0) (1,1) (1,2) (1,3)
NOPAT (2.0) 7.4 9.4 12.1 16.4 17.6 18.9 21.3 23.0 24.7 26.6
Working Capital (0.8) (1.0) (1.0) (1.1) (1.2) (1.3) (1.4) (1.5) (1.6) (1.7) (1.8)
Capex (1.2) (2.9) (2.5) (2.7) (2.4) (2.6) (2.1) (1.5) (1.6) (1.7) (1.8) Perp.
FCFF (4.0) 3.6 5.9 8.2 12.7 13.7 15.4 18.4 19.8 21.3 23.0 251.4
P&L Statement 2014-02 2015 2016 2017 2018 2019 2020 2021 2022 2023 2024
Net Revenue 100% 100% 100% 100% 100% 100% 100,0% 100,0% 100,0% 100,0% 100,0%
Personnel -47.8% -45.6% -43.5% -41.4% -37.1% -37.1% -37.1% -37.1% -37.1% -37.1% -37.1%
Administrative -19.7% -17.6% -15.4% -13.3% -9.0% -9.0% -9.0% -9.0% -9.0% -9.0% -9.0%
Faculty -28.1% -28.1% -28.1% -28.1% -28.1% -28.1% -28.1% -28.1% -28.1% -28.1% -28.1%
Other G&A -15.0% -14.0% -13.0% -12.0% -12.0% -12.0% -12.0% -12.0% -12.0% -12.0% -12.0%
Rentals -5.7% -9.3% -9.3% -9.1% -8.6% -8.4% -8.3% -8.2% -8.0% -7.8% -7.7%
Selling and Marketing -6.5% -6.5% -6.5% -6,5% -6.5% -6.5% -6.5% -6.5% -6.5% -6.5% -6.5%
PDA -6.0% -6.0% -6.0% -6.0% -6.0% -6.0% -6.0% -6.0% -6.0% -6.0% -6.0%
EBITDA Margin 12.8% 16.1% 19.5% 23.2% 28.2% 28.4% 28.6% 30.3% 30.4% 30.6% 30.7%
Free Cash Flow for the Firm 2014-02 2015 2016 2017 2018 2019 2020 2021 2022 2023 2024
Working Capital (% of Net Revenue) 4.0% 2.0% 2.0% 2.0% 2.0% 2.0% 2.0% 2.0% 2.0% 2.0% 2.0%
Capex (% of Net Revenue) 6.0% 6.0% 5.0% 5.0% 4.0% 4.0% 3.0% 2.0% 2.0% 2.0% 2.0%
Related Documents


![[Estácio - IESAM] Automatizando Tarefas com Gulp.js](https://static.cupdf.com/doc/110x72/5881899c1a28ab0b398b6e87/estacio-iesam-automatizando-tarefas-com-gulpjs.jpg)
