160 Environmental Geology 35 (2–3) August 1998 7 Q Springer-Verlag Establishing the frequency and magnitude of landslide-triggering rainstorm events in New Zealand Thomas Glade Received: 15 Ocotober 1997 7 Accepted: 25 June 1997 T. Glade Research School of Earh Science, Department of Geography, Victoria University of Wellington, Wellington, New Zealand Abstract Landslide erosion has an established his- tory in New Zealand. Some broad estimates of eco- nomic costs for short-term event damage, long- term landslide damage, and proactive measures are provided and compared on a national and interna- tional level. Frequency and magnitude analysis based on historical records of landslide-triggering rainstorms demonstrates that 1) landslides are a nationwide problem, 2) recognition and recording of these events is dependent on public awareness and therefore related to population distribution and extent of urbanized areas, and 3) deforestation increases the frequency of landslide events, but not necessarily the total magnitude of their impact. However, some regions such as Northland and Wellington in the North Island and Greymouth and North Otago in the South Island are more frequent- ly and more strongly affected than others. Land- slide occurrence in time and space, within repre- sentative study areas in Hawke’s Bay, Wairarapa, and Wellington, is correlated with the climatic vari- able daily precipitation. Different regional hydro- logical thresholds for landslide triggering are estab- lished. Key words Landslides recognition 7 Deforestation 7 Frequency 7 Magnitude 7 Rainfall thresholds Introduction This study aims to demonstrate the significant influence of the landsliding process on New Zealand hill country. Firstly, it assesses the cost of actual landslide damage for specific regions as well as for all of New Zealand, and compares this information with international figures. Sec- ondly, a compiled national landslide database is analysed Fig. 1 Diffused landsliding in the Hawke’s Bay hill country (Photograph: Hawke’s Bay Catchment Board) with respect to: 1) population size and distribution, 2) forest removal, and 3) vegetation cover in relation to var- ious landslide parameters (such as landslide density and affected area). Thirdly, frequencies of landslide-triggering rainstorms are defined on a regional scale by analysing a landslide database compiled from available records. The recorded landslide-triggering rainstorm is defined in this study as precipitation which is mentioned in landslide re- ports as a trigger of at least one landslide in a given re- gion. Fourthly, regional rainfall thresholds for landslide initiation are established on the basis of daily rainfall measurements in three study areas. Landslides triggered by rainstorms are a nationwide problem in New Zealand (Eyles 1983; Harmsworth and Page 1991; Fig. 1). They cause different types of damage to affected people, organizations and institutions as well as to the environment. In the first instance, this damage can be represented by purely economic costs. One focus of this project is to place New Zealand costs in a context of worldwide landslide damage. An internation- al overview of landslide damage costs on event or yearly average basis is given in Table 1. For better comparison between countries, all total damage costs are expressed in US$ for the time at which they were originally deter- mined and also are related to the population size at the

Welcome message from author
This document is posted to help you gain knowledge. Please leave a comment to let me know what you think about it! Share it to your friends and learn new things together.
Transcript
160 Environmental Geology 35 (2–3) August 1998 7 Q Springer-Verlag
Establishing the frequency andmagnitude of landslide-triggeringrainstorm events in New ZealandThomas Glade
Received: 15 Ocotober 1997 7 Accepted: 25 June 1997
T. GladeResearch School of Earh Science, Department of Geography,Victoria University of Wellington, Wellington, New Zealand
Abstract Landslide erosion has an established his-tory in New Zealand. Some broad estimates of eco-nomic costs for short-term event damage, long-term landslide damage, and proactive measures areprovided and compared on a national and interna-tional level. Frequency and magnitude analysisbased on historical records of landslide-triggeringrainstorms demonstrates that 1) landslides are anationwide problem, 2) recognition and recordingof these events is dependent on public awarenessand therefore related to population distributionand extent of urbanized areas, and 3) deforestationincreases the frequency of landslide events, but notnecessarily the total magnitude of their impact.However, some regions such as Northland andWellington in the North Island and Greymouth andNorth Otago in the South Island are more frequent-ly and more strongly affected than others. Land-slide occurrence in time and space, within repre-sentative study areas in Hawke’s Bay, Wairarapa,and Wellington, is correlated with the climatic vari-able daily precipitation. Different regional hydro-logical thresholds for landslide triggering are estab-lished.
Key words Landslides recognition 7 Deforestation 7Frequency 7 Magnitude 7 Rainfall thresholds
Introduction
This study aims to demonstrate the significant influenceof the landsliding process on New Zealand hill country.Firstly, it assesses the cost of actual landslide damage forspecific regions as well as for all of New Zealand, andcompares this information with international figures. Sec-ondly, a compiled national landslide database is analysed
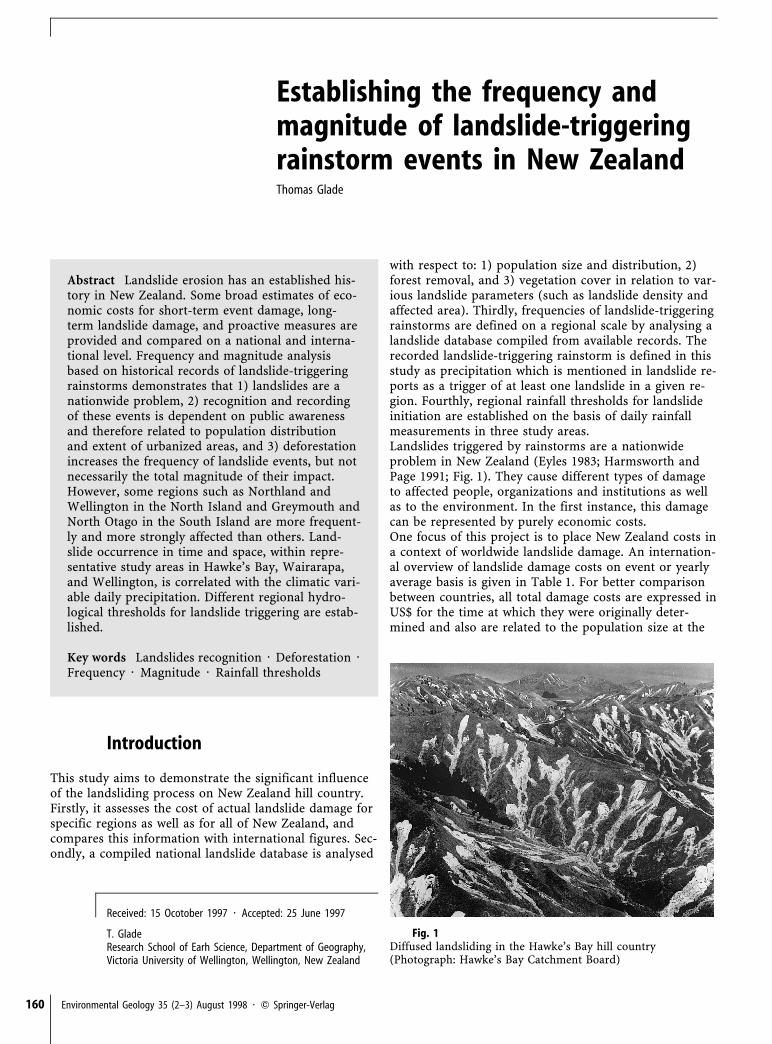
Fig. 1Diffused landsliding in the Hawke’s Bay hill country(Photograph: Hawke’s Bay Catchment Board)
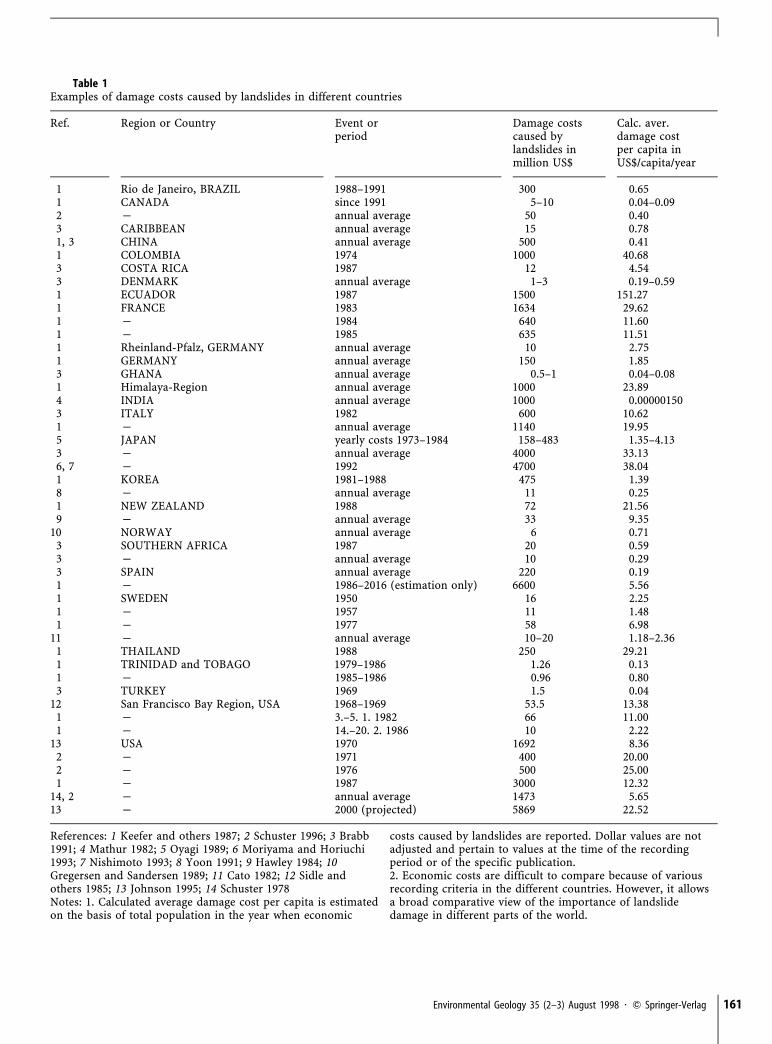
with respect to: 1) population size and distribution, 2)forest removal, and 3) vegetation cover in relation to var-ious landslide parameters (such as landslide density andaffected area). Thirdly, frequencies of landslide-triggeringrainstorms are defined on a regional scale by analysing alandslide database compiled from available records. Therecorded landslide-triggering rainstorm is defined in thisstudy as precipitation which is mentioned in landslide re-ports as a trigger of at least one landslide in a given re-gion. Fourthly, regional rainfall thresholds for landslideinitiation are established on the basis of daily rainfallmeasurements in three study areas.Landslides triggered by rainstorms are a nationwideproblem in New Zealand (Eyles 1983; Harmsworth andPage 1991; Fig. 1). They cause different types of damageto affected people, organizations and institutions as wellas to the environment. In the first instance, this damagecan be represented by purely economic costs.One focus of this project is to place New Zealand costs ina context of worldwide landslide damage. An internation-al overview of landslide damage costs on event or yearlyaverage basis is given in Table 1. For better comparisonbetween countries, all total damage costs are expressed inUS$ for the time at which they were originally deter-mined and also are related to the population size at the
Environmental Geology 35 (2–3) August 1998 7 Q Springer-Verlag 161
Table 1Examples of damage costs caused by landslides in different countries
Ref. Region or Country Event orperiod
Damage costscaused bylandslides inmillion US$
Calc. aver.damage costper capita inUS$/capita/year
1 Rio de Janeiro, BRAZIL 1988–1991 300 0.651 CANADA since 1991 5–10 0.04–0.092 P annual average 50 0.403 CARIBBEAN annual average 15 0.781, 3 CHINA annual average 500 0.411 COLOMBIA 1974 1000 40.683 COSTA RICA 1987 12 4.543 DENMARK annual average 1–3 0.19–0.591 ECUADOR 1987 1500 151.271 FRANCE 1983 1634 29.621 P 1984 640 11.601 P 1985 635 11.511 Rheinland-Pfalz, GERMANY annual average 10 2.751 GERMANY annual average 150 1.853 GHANA annual average 0.5–1 0.04–0.081 Himalaya-Region annual average 1000 23.894 INDIA annual average 1000 0.000001503 ITALY 1982 600 10.621 P annual average 1140 19.955 JAPAN yearly costs 1973–1984 158–483 1.35–4.133 P annual average 4000 33.136, 7 P 1992 4700 38.041 KOREA 1981–1988 475 1.398 P annual average 11 0.251 NEW ZEALAND 1988 72 21.569 P annual average 33 9.35
10 NORWAY annual average 6 0.713 SOUTHERN AFRICA 1987 20 0.593 P annual average 10 0.293 SPAIN annual average 220 0.191 P 1986–2016 (estimation only) 6600 5.561 SWEDEN 1950 16 2.251 P 1957 11 1.481 P 1977 58 6.98
11 P annual average 10–20 1.18–2.361 THAILAND 1988 250 29.211 TRINIDAD and TOBAGO 1979–1986 1.26 0.131 P 1985–1986 0.96 0.803 TURKEY 1969 1.5 0.04
12 San Francisco Bay Region, USA 1968–1969 53.5 13.381 P 3.–5. 1. 1982 66 11.001 P 14.–20. 2. 1986 10 2.22
13 USA 1970 1692 8.362 P 1971 400 20.002 P 1976 500 25.001 P 1987 3000 12.32
14, 2 P annual average 1473 5.6513 P 2000 (projected) 5869 22.52
References: 1 Keefer and others 1987; 2 Schuster 1996; 3 Brabb1991; 4 Mathur 1982; 5 Oyagi 1989; 6 Moriyama and Horiuchi1993; 7 Nishimoto 1993; 8 Yoon 1991; 9 Hawley 1984; 10Gregersen and Sandersen 1989; 11 Cato 1982; 12 Sidle andothers 1985; 13 Johnson 1995; 14 Schuster 1978Notes: 1. Calculated average damage cost per capita is estimatedon the basis of total population in the year when economic
costs caused by landslides are reported. Dollar values are notadjusted and pertain to values at the time of the recordingperiod or of the specific publication.2. Economic costs are difficult to compare because of variousrecording criteria in the different countries. However, it allowsa broad comparative view of the importance of landslidedamage in different parts of the world.
162 Environmental Geology 35 (2–3) August 1998 7 Q Springer-Verlag
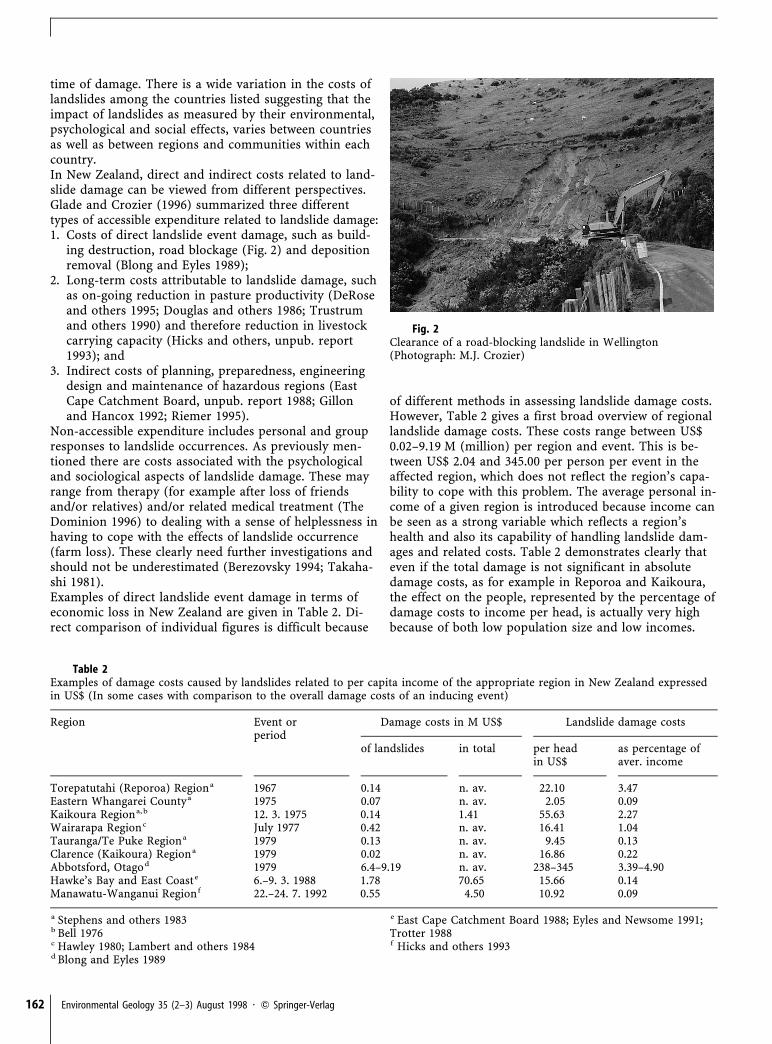
Fig. 2Clearance of a road-blocking landslide in Wellington(Photograph: M.J. Crozier)
Table 2Examples of damage costs caused by landslides related to per capita income of the appropriate region in New Zealand expressedin US$ (In some cases with comparison to the overall damage costs of an inducing event)
Region Event orperiod
Damage costs in M US$ Landslide damage costs
of landslides in total per headin US$
as percentage ofaver. income
Torepatutahi (Reporoa) Regiona 1967 0.14 n. av. 22.10 3.47Eastern Whangarei Countya 1975 0.07 n. av. 2.05 0.09Kaikoura Regiona, b 12. 3. 1975 0.14 1.41 55.63 2.27Wairarapa Regionc July 1977 0.42 n. av. 16.41 1.04Tauranga/Te Puke Regiona 1979 0.13 n. av. 9.45 0.13Clarence (Kaikoura) Regiona 1979 0.02 n. av. 16.86 0.22Abbotsford, Otagod 1979 6.4–9.19 n. av. 238–345 3.39–4.90Hawke’s Bay and East Coaste 6.–9. 3. 1988 1.78 70.65 15.66 0.14Manawatu-Wanganui Regionf 22.–24. 7. 1992 0.55 4.50 10.92 0.09
a Stephens and others 1983b Bell 1976c Hawley 1980; Lambert and others 1984d Blong and Eyles 1989
e East Cape Catchment Board 1988; Eyles and Newsome 1991;Trotter 1988f Hicks and others 1993
time of damage. There is a wide variation in the costs oflandslides among the countries listed suggesting that theimpact of landslides as measured by their environmental,psychological and social effects, varies between countriesas well as between regions and communities within eachcountry.In New Zealand, direct and indirect costs related to land-slide damage can be viewed from different perspectives.Glade and Crozier (1996) summarized three differenttypes of accessible expenditure related to landslide damage:1. Costs of direct landslide event damage, such as build-
ing destruction, road blockage (Fig. 2) and depositionremoval (Blong and Eyles 1989);
2. Long-term costs attributable to landslide damage, suchas on-going reduction in pasture productivity (DeRoseand others 1995; Douglas and others 1986; Trustrumand others 1990) and therefore reduction in livestockcarrying capacity (Hicks and others, unpub. report1993); and
3. Indirect costs of planning, preparedness, engineeringdesign and maintenance of hazardous regions (EastCape Catchment Board, unpub. report 1988; Gillonand Hancox 1992; Riemer 1995).
Non-accessible expenditure includes personal and groupresponses to landslide occurrences. As previously men-tioned there are costs associated with the psychologicaland sociological aspects of landslide damage. These mayrange from therapy (for example after loss of friendsand/or relatives) and/or related medical treatment (TheDominion 1996) to dealing with a sense of helplessness inhaving to cope with the effects of landslide occurrence(farm loss). These clearly need further investigations andshould not be underestimated (Berezovsky 1994; Takaha-shi 1981).Examples of direct landslide event damage in terms ofeconomic loss in New Zealand are given in Table 2. Di-rect comparison of individual figures is difficult because
of different methods in assessing landslide damage costs.However, Table 2 gives a first broad overview of regionallandslide damage costs. These costs range between US$0.02–9.19 M (million) per region and event. This is be-tween US$ 2.04 and 345.00 per person per event in theaffected region, which does not reflect the region’s capa-bility to cope with this problem. The average personal in-come of a given region is introduced because income canbe seen as a strong variable which reflects a region’shealth and also its capability of handling landslide dam-ages and related costs. Table 2 demonstrates clearly thateven if the total damage is not significant in absolutedamage costs, as for example in Reporoa and Kaikoura,the effect on the people, represented by the percentage ofdamage costs to income per head, is actually very highbecause of both low population size and low incomes.

Environmental Geology 35 (2–3) August 1998 7 Q Springer-Verlag 163
However, if landslide-triggering rainstorms are largeenough, such as Cyclone Bola in 1988 which damagedwide areas in Hawke’s Bay and East Cape, the impact onthe affected population is very high, as reflected again inhigh percentage values (Table 2).Another example of direct costs is the number of claimsmade to the New Zealand Earthquake Commission as thecompulsory insurer of landslip damage. This organizationhas paid US$ 14.8 M for landslip claims within the last 22years, on average US$ 0.67 M per year (Glade and Crozier1996). In addition to direct short-term costs, long-termcosts for the whole of New Zealand were calculated byHawley (1984) as a yearly average expenditure of US$2.12 M for urban landslides and US$ 21.20 M for rurallandslides. Indirect costs for preventative and remedialactions are indicated by the yearly expenditure of Re-gional Councils throughout New Zealand. These measurescover expenses on soil conservation, erosion control, aswell as sustainable land management programmes andeducation and amount to US$ 38.15 M for the 5-year pe-riod 1990–1995 (Glade and Crozier 1996).Other countries have programmes to reduce landslidehazard. In the United States, US$ 5 M was spent for land-slide research (U.S. Committee on Ground Failure Haz-ards 1985). Geotechnical studies and landslide-preventa-tive works with an annual expenditure of US$ 25 M werefunded by the Hong Kong government (Brand 1989), andJapan spends approximately US$ 4 billion per year onlandslide control works (Oyagi 1989). Figures for othercountries were not available for this study, although it isobvious from Table 2 and from Brabb and Harrod (1989)that they do have significant slope stability problems.Both Tables 1 and 2 show from an international and na-tional perspective the influences of landslide occurrenceon countries and societies in terms of direct damagecosts. Over time, such measures of damage may betreated as indicators of change in various conditions, in-cluding the level of reporting, the number of assets atrisk and their vulnerability, as well as the physical condi-tions affecting slope stability. Conditions for landslide re-cognition and recording are influenced by populationsize, spatial population distribution, temporal populationgrowth as well as public and official (e.g. regional coun-cils) awareness of the landslide problem. Crozier (1989)indicated important environmental conditions for slopefailure as follows: 1) preparatory factors which disposethe slope to movement (such as forest removal); 2) con-trolling factors which dictate the condition of the actualmovement (such as vegetation cover or soil depth); and3) triggering factors which initiate movement (such asprecipitation).In this study all previously mentioned conditions andfactors which influence the landslide problem as a wholeare examined at different scales throughout New Zealand.Main attention is given to landslides in relation to tem-poral and spatial change of population conditions, totemporal change of forest cover as a preparatory factor,and to spatial differences in daily precipitation as a trig-gering agent.
Clearly, personal costs such as psychological effects andsociological influences (Berezovsky 1994) should also beconsidered in a full assessment of costs. However, isola-tion of personal or economic costs resulting from land-sliding is difficult, and their evaluation even more so, be-cause landslide damage is often related to other simulta-neously occurring natural hazards such as floods. Al-though psychological and sociological aspects are veryimportant in a comprehensive landslide hazard study,these factors do not come within the scope of the currentstudy.
Methods
For the development of a national landslide database, allavailable and accessible landslide records were compiled.The availability, accessibility, format and compilation oflandslide records, including all associated problems, arediscussed by Glade and Crozier (1996).The landslide database developed for this study is ana-lysed at a national scale with respect to different parame-ters, such as date and place of occurrence, recorded dailyrainfall, vegetation cover, landslide area, landslide densityand landslide volume per hectare. Analysis of date andplace of landslide occurrence provides a picture of thespatial distribution and a regional frequency of recordedlandslide-triggering rainstorms. The problem of landsliderecording is highlighted in relation to both populationgrowth and to changes in forest cover. Both variables arecompiled from the Official New Zealand Yearbook, firstpublished in 1893. The landslide database allows an as-sessment of the influence of different types of vegetationcover on landslide parameters, such as affected area, vol-ume per hectare, and landslide density. A purely statisti-cal description of this empirical relationship is carriedout in this study.The daily rainfall associated with each landslide event iscompared with the long-term daily rainfall record on aregional basis. The climatic data were provided by NIWA(National Institute of Water and Atmospheric ResearchLtd.). This regional analysis is carried out for three typ-ical landslide-prone areas of the North Island of NewZealand: Hawke’s Bay, Wairarapa, and Wellington. Theresulting relationship between daily measured rainfalland recorded landslide-triggering rainfall leads to region-al probability thresholds of landslide-triggering rainfall,including probability of landslide occurrence associatedwith a given 24-h peroid rainfall magnitude.
Results
Information sourcesFor compiling all available landslide information, the ex-isting institutional database was evaluated. Differenttypes of information sources were accessed and compiled
164 Environmental Geology 35 (2–3) August 1998 7 Q Springer-Verlag
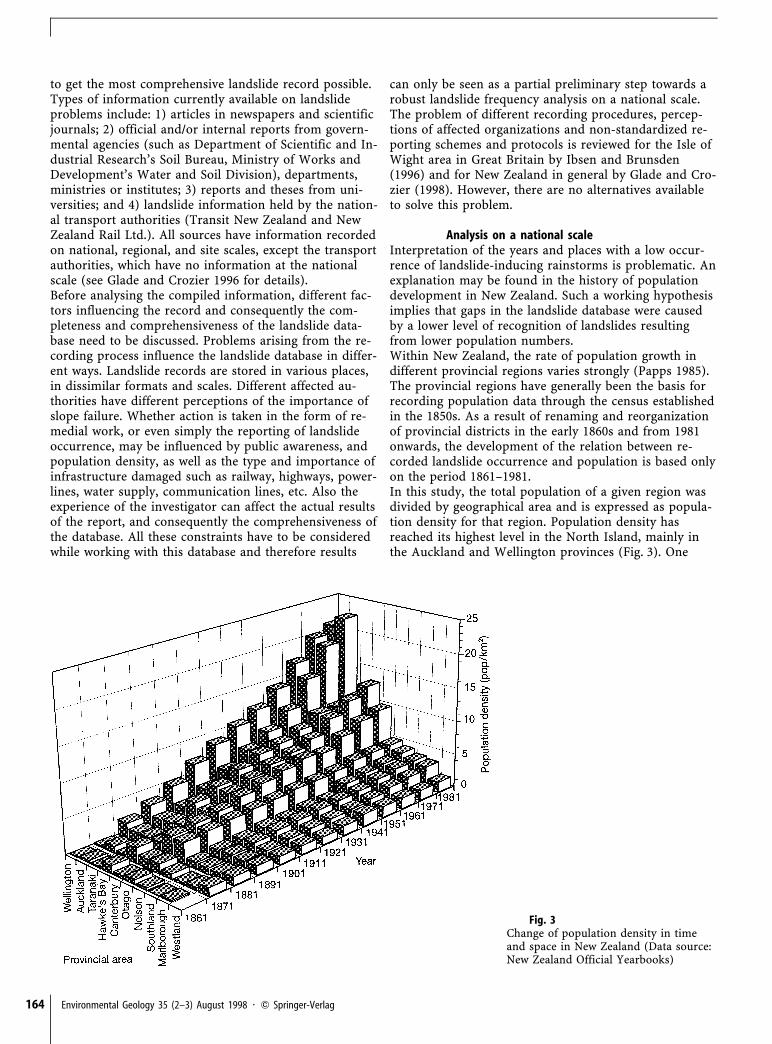
Fig. 3Change of population density in timeand space in New Zealand (Data source:New Zealand Official Yearbooks)
to get the most comprehensive landslide record possible.Types of information currently available on landslideproblems include: 1) articles in newspapers and scientificjournals; 2) official and/or internal reports from govern-mental agencies (such as Department of Scientific and In-dustrial Research’s Soil Bureau, Ministry of Works andDevelopment’s Water and Soil Division), departments,ministries or institutes; 3) reports and theses from uni-versities; and 4) landslide information held by the nation-al transport authorities (Transit New Zealand and NewZealand Rail Ltd.). All sources have information recordedon national, regional, and site scales, except the transportauthorities, which have no information at the nationalscale (see Glade and Crozier 1996 for details).Before analysing the compiled information, different fac-tors influencing the record and consequently the com-pleteness and comprehensiveness of the landslide data-base need to be discussed. Problems arising from the re-cording process influence the landslide database in differ-ent ways. Landslide records are stored in various places,in dissimilar formats and scales. Different affected au-thorities have different perceptions of the importance ofslope failure. Whether action is taken in the form of re-medial work, or even simply the reporting of landslideoccurrence, may be influenced by public awareness, andpopulation density, as well as the type and importance ofinfrastructure damaged such as railway, highways, power-lines, water supply, communication lines, etc. Also theexperience of the investigator can affect the actual resultsof the report, and consequently the comprehensiveness ofthe database. All these constraints have to be consideredwhile working with this database and therefore results
can only be seen as a partial preliminary step towards arobust landslide frequency analysis on a national scale.The problem of different recording procedures, percep-tions of affected organizations and non-standardized re-porting schemes and protocols is reviewed for the Isle ofWight area in Great Britain by Ibsen and Brunsden(1996) and for New Zealand in general by Glade and Cro-zier (1998). However, there are no alternatives availableto solve this problem.
Analysis on a national scaleInterpretation of the years and places with a low occur-rence of landslide-inducing rainstorms is problematic. Anexplanation may be found in the history of populationdevelopment in New Zealand. Such a working hypothesisimplies that gaps in the landslide database were causedby a lower level of recognition of landslides resultingfrom lower population numbers.Within New Zealand, the rate of population growth indifferent provincial regions varies strongly (Papps 1985).The provincial regions have generally been the basis forrecording population data through the census establishedin the 1850s. As a result of renaming and reorganizationof provincial districts in the early 1860s and from 1981onwards, the development of the relation between re-corded landslide occurrence and population is based onlyon the period 1861–1981.In this study, the total population of a given region wasdivided by geographical area and is expressed as popula-tion density for that region. Population density hasreached its highest level in the North Island, mainly inthe Auckland and Wellington provinces (Fig. 3). One
Environmental Geology 35 (2–3) August 1998 7 Q Springer-Verlag 165
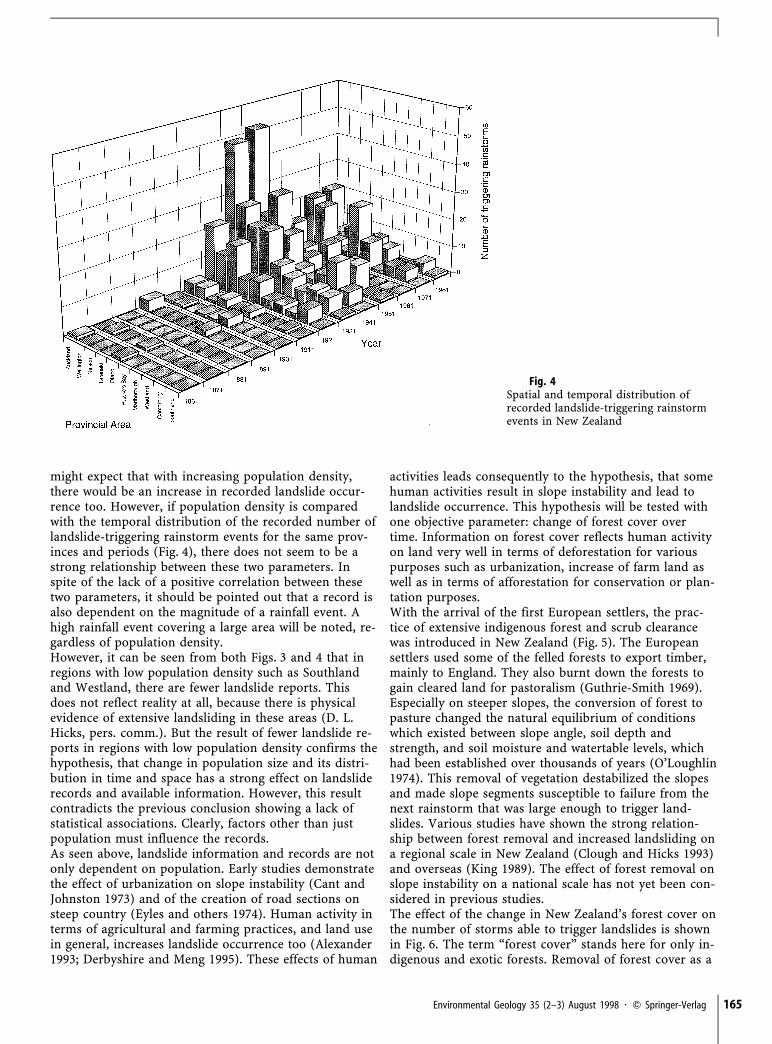
Fig. 4Spatial and temporal distribution ofrecorded landslide-triggering rainstormevents in New Zealand
might expect that with increasing population density,there would be an increase in recorded landslide occur-rence too. However, if population density is comparedwith the temporal distribution of the recorded number oflandslide-triggering rainstorm events for the same prov-inces and periods (Fig. 4), there does not seem to be astrong relationship between these two parameters. Inspite of the lack of a positive correlation between thesetwo parameters, it should be pointed out that a record isalso dependent on the magnitude of a rainfall event. Ahigh rainfall event covering a large area will be noted, re-gardless of population density.However, it can be seen from both Figs. 3 and 4 that inregions with low population density such as Southlandand Westland, there are fewer landslide reports. Thisdoes not reflect reality at all, because there is physicalevidence of extensive landsliding in these areas (D. L.Hicks, pers. comm.). But the result of fewer landslide re-ports in regions with low population density confirms thehypothesis, that change in population size and its distri-bution in time and space has a strong effect on landsliderecords and available information. However, this resultcontradicts the previous conclusion showing a lack ofstatistical associations. Clearly, factors other than justpopulation must influence the records.As seen above, landslide information and records are notonly dependent on population. Early studies demonstratethe effect of urbanization on slope instability (Cant andJohnston 1973) and of the creation of road sections onsteep country (Eyles and others 1974). Human activity interms of agricultural and farming practices, and land usein general, increases landslide occurrence too (Alexander1993; Derbyshire and Meng 1995). These effects of human
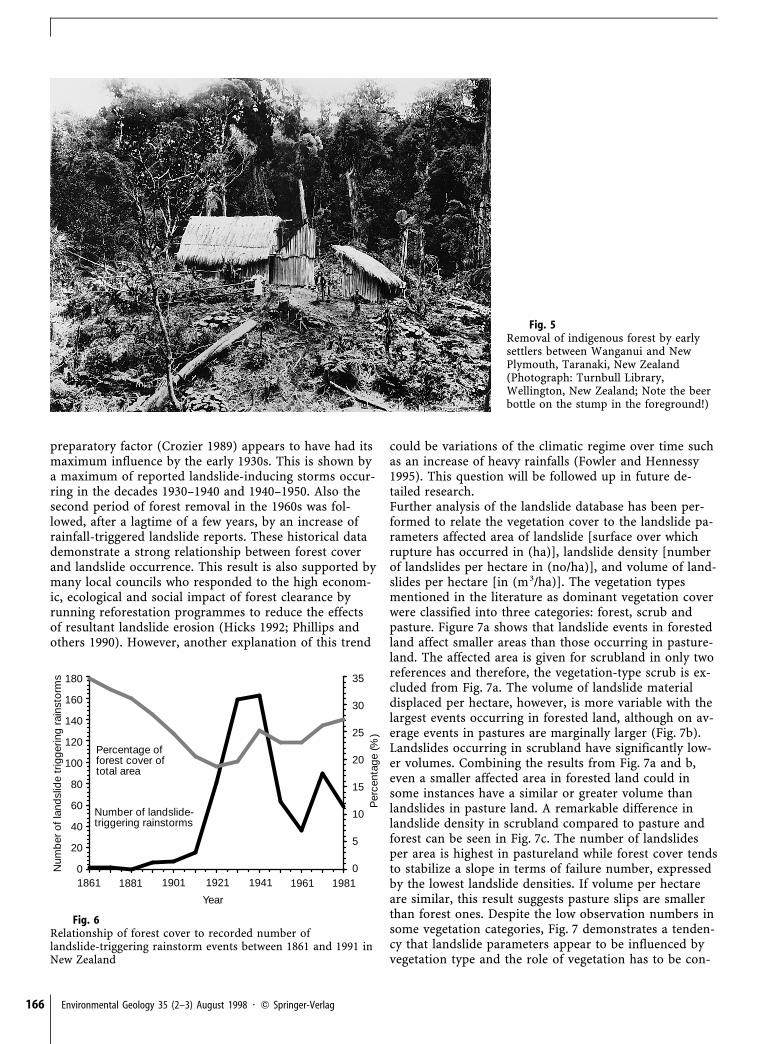
activities leads consequently to the hypothesis, that somehuman activities result in slope instability and lead tolandslide occurrence. This hypothesis will be tested withone objective parameter: change of forest cover overtime. Information on forest cover reflects human activityon land very well in terms of deforestation for variouspurposes such as urbanization, increase of farm land aswell as in terms of afforestation for conservation or plan-tation purposes.With the arrival of the first European settlers, the prac-tice of extensive indigenous forest and scrub clearancewas introduced in New Zealand (Fig. 5). The Europeansettlers used some of the felled forests to export timber,mainly to England. They also burnt down the forests togain cleared land for pastoralism (Guthrie-Smith 1969).Especially on steeper slopes, the conversion of forest topasture changed the natural equilibrium of conditionswhich existed between slope angle, soil depth andstrength, and soil moisture and watertable levels, whichhad been established over thousands of years (O’Loughlin1974). This removal of vegetation destabilized the slopesand made slope segments susceptible to failure from thenext rainstorm that was large enough to trigger land-slides. Various studies have shown the strong relation-ship between forest removal and increased landsliding ona regional scale in New Zealand (Clough and Hicks 1993)and overseas (King 1989). The effect of forest removal onslope instability on a national scale has not yet been con-sidered in previous studies.The effect of the change in New Zealand’s forest cover onthe number of storms able to trigger landslides is shownin Fig. 6. The term “forest cover” stands here for only in-digenous and exotic forests. Removal of forest cover as a
166 Environmental Geology 35 (2–3) August 1998 7 Q Springer-Verlag
Fig. 5Removal of indigenous forest by earlysettlers between Wanganui and NewPlymouth, Taranaki, New Zealand(Photograph: Turnbull Library,Wellington, New Zealand; Note the beerbottle on the stump in the foreground!)
Percentage offorest cover oftotal area
Number of landslide-triggering rainstorms
180
160
140
120
100
80
60
40
20
0Num
ber
of l
and
slid
e tr
igge
ring
rain
stor
ms
Per
cent
age
(%)
35
30
25
20
15
10
5
01861 1881 1901 1921 1941 19811961
Year
Fig. 6Relationship of forest cover to recorded number oflandslide-triggering rainstorm events between 1861 and 1991 inNew Zealand
preparatory factor (Crozier 1989) appears to have had itsmaximum influence by the early 1930s. This is shown bya maximum of reported landslide-inducing storms occur-ring in the decades 1930–1940 and 1940–1950. Also thesecond period of forest removal in the 1960s was fol-lowed, after a lagtime of a few years, by an increase ofrainfall-triggered landslide reports. These historical datademonstrate a strong relationship between forest coverand landslide occurrence. This result is also supported bymany local councils who responded to the high econom-ic, ecological and social impact of forest clearance byrunning reforestation programmes to reduce the effectsof resultant landslide erosion (Hicks 1992; Phillips andothers 1990). However, another explanation of this trend
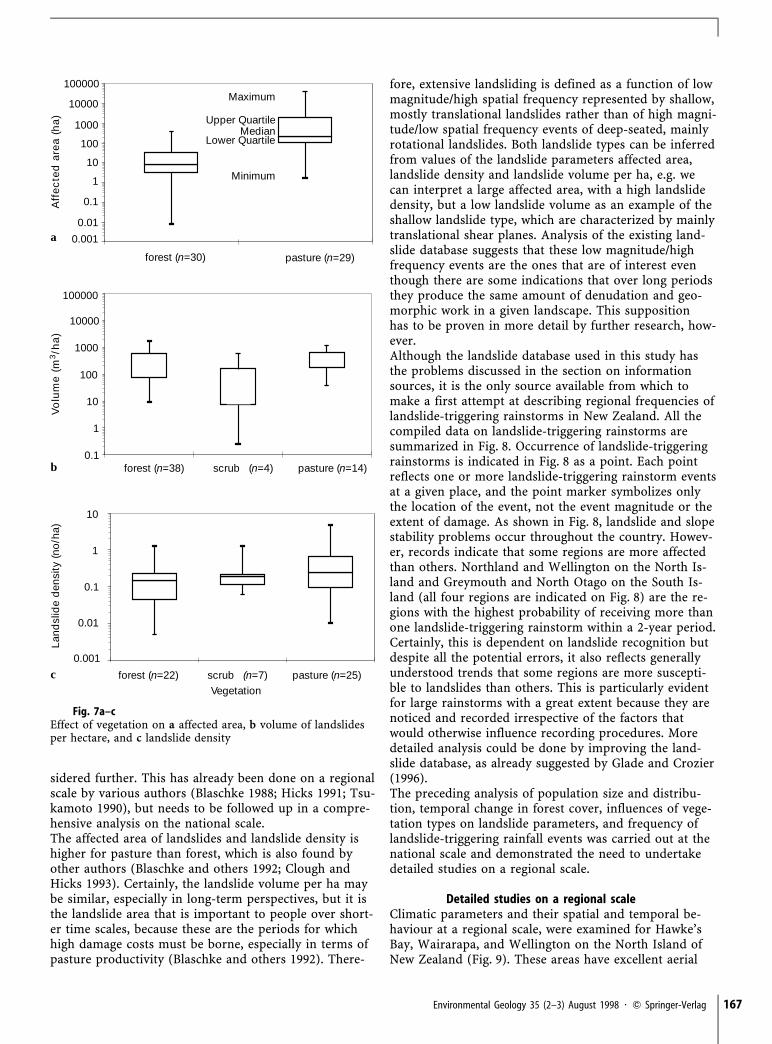
could be variations of the climatic regime over time suchas an increase of heavy rainfalls (Fowler and Hennessy1995). This question will be followed up in future de-tailed research.Further analysis of the landslide database has been per-formed to relate the vegetation cover to the landslide pa-rameters affected area of landslide [surface over whichrupture has occurred in (ha)], landslide density [numberof landslides per hectare in (no/ha)], and volume of land-slides per hectare [in (m3/ha)]. The vegetation typesmentioned in the literature as dominant vegetation coverwere classified into three categories: forest, scrub andpasture. Figure 7a shows that landslide events in forestedland affect smaller areas than those occurring in pasture-land. The affected area is given for scrubland in only tworeferences and therefore, the vegetation-type scrub is ex-cluded from Fig. 7a. The volume of landslide materialdisplaced per hectare, however, is more variable with thelargest events occurring in forested land, although on av-erage events in pastures are marginally larger (Fig. 7b).Landslides occurring in scrubland have significantly low-er volumes. Combining the results from Fig. 7a and b,even a smaller affected area in forested land could insome instances have a similar or greater volume thanlandslides in pasture land. A remarkable difference inlandslide density in scrubland compared to pasture andforest can be seen in Fig. 7c. The number of landslidesper area is highest in pastureland while forest cover tendsto stabilize a slope in terms of failure number, expressedby the lowest landslide densities. If volume per hectareare similar, this result suggests pasture slips are smallerthan forest ones. Despite the low observation numbers insome vegetation categories, Fig. 7 demonstrates a tenden-cy that landslide parameters appear to be influenced byvegetation type and the role of vegetation has to be con-
Environmental Geology 35 (2–3) August 1998 7 Q Springer-Verlag 167
109.9
0.1
1
10
100
1000
10000
100000
forest (n=38) scrub (n=4) pasture (n=14)
100000
0.1
0.01
0.001
1000
100
10
1
Maximum
Upper QuartileMedian
Lower Quartile
Minimum
pasture (n=29)
forest (n=22) scrub (n=7) pasture (n=25)
10
1
0.1
0.01
0.001
c
b
Land
slid
e d
ensi
ty (n
o/h
a)
Vegetation
Vo
lum
e (
m3/h
a)
Aff
ec
ted
are
a (
ha
)
10000
forest (n=30)
a
Fig. 7a–cEffect of vegetation on a affected area, b volume of landslidesper hectare, and c landslide density
sidered further. This has already been done on a regionalscale by various authors (Blaschke 1988; Hicks 1991; Tsu-kamoto 1990), but needs to be followed up in a compre-hensive analysis on the national scale.The affected area of landslides and landslide density ishigher for pasture than forest, which is also found byother authors (Blaschke and others 1992; Clough andHicks 1993). Certainly, the landslide volume per ha maybe similar, especially in long-term perspectives, but it isthe landslide area that is important to people over short-er time scales, because these are the periods for whichhigh damage costs must be borne, especially in terms ofpasture productivity (Blaschke and others 1992). There-
fore, extensive landsliding is defined as a function of lowmagnitude/high spatial frequency represented by shallow,mostly translational landslides rather than of high magni-tude/low spatial frequency events of deep-seated, mainlyrotational landslides. Both landslide types can be inferredfrom values of the landslide parameters affected area,landslide density and landslide volume per ha, e.g. wecan interpret a large affected area, with a high landslidedensity, but a low landslide volume as an example of theshallow landslide type, which are characterized by mainlytranslational shear planes. Analysis of the existing land-slide database suggests that these low magnitude/highfrequency events are the ones that are of interest eventhough there are some indications that over long periodsthey produce the same amount of denudation and geo-morphic work in a given landscape. This suppositionhas to be proven in more detail by further research, how-ever.Although the landslide database used in this study hasthe problems discussed in the section on informationsources, it is the only source available from which tomake a first attempt at describing regional frequencies oflandslide-triggering rainstorms in New Zealand. All thecompiled data on landslide-triggering rainstorms aresummarized in Fig. 8. Occurrence of landslide-triggeringrainstorms is indicated in Fig. 8 as a point. Each pointreflects one or more landslide-triggering rainstorm eventsat a given place, and the point marker symbolizes onlythe location of the event, not the event magnitude or theextent of damage. As shown in Fig. 8, landslide and slopestability problems occur throughout the country. Howev-er, records indicate that some regions are more affectedthan others. Northland and Wellington on the North Is-land and Greymouth and North Otago on the South Is-land (all four regions are indicated on Fig. 8) are the re-gions with the highest probability of receiving more thanone landslide-triggering rainstorm within a 2-year period.Certainly, this is dependent on landslide recognition butdespite all the potential errors, it also reflects generallyunderstood trends that some regions are more suscepti-ble to landslides than others. This is particularly evidentfor large rainstorms with a great extent because they arenoticed and recorded irrespective of the factors thatwould otherwise influence recording procedures. Moredetailed analysis could be done by improving the land-slide database, as already suggested by Glade and Crozier(1996).The preceding analysis of population size and distribu-tion, temporal change in forest cover, influences of vege-tation types on landslide parameters, and frequency oflandslide-triggering rainfall events was carried out at thenational scale and demonstrated the need to undertakedetailed studies on a regional scale.
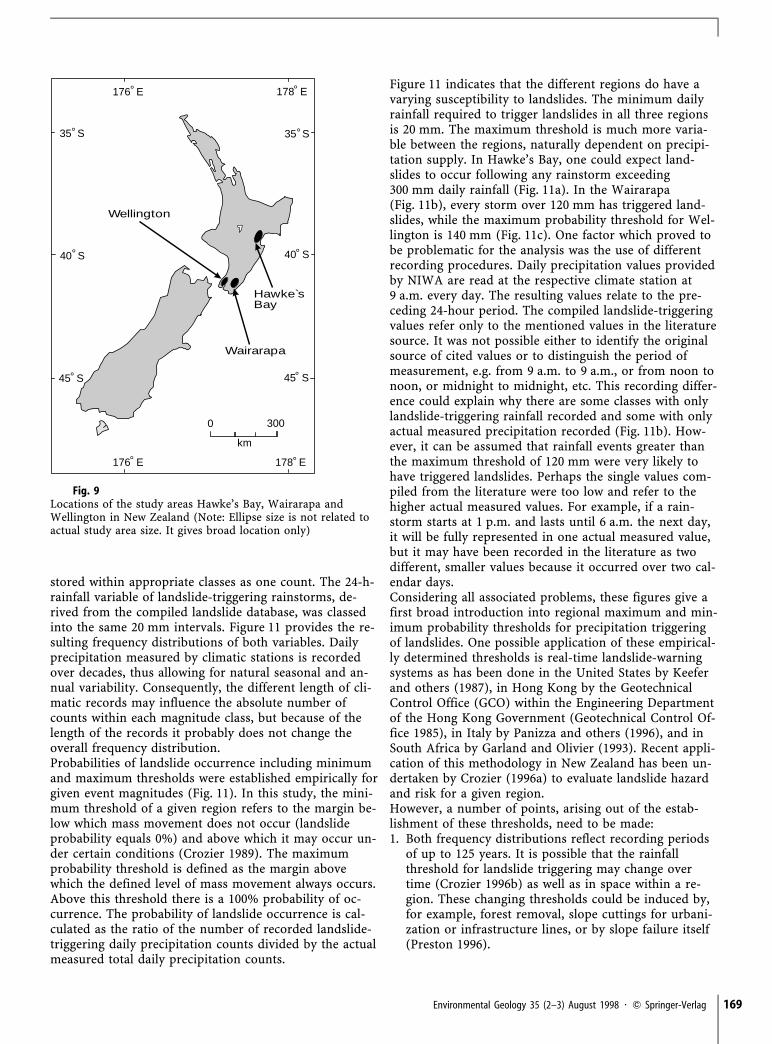
Detailed studies on a regional scaleClimatic parameters and their spatial and temporal be-haviour at a regional scale, were examined for Hawke’sBay, Wairarapa, and Wellington on the North Island ofNew Zealand (Fig. 9). These areas have excellent aerial

168 Environmental Geology 35 (2–3) August 1998 7 Q Springer-Verlag
NorthlandN
0 125 250 km
Wellington
Greymouth
NorthOtago
0–2.0 = More than one storm every 2 years
2.1–4.0 = One storm every 2–4 years
4.1–6.0 = One storm every 4–6 years
6.1–8.0 = One storm every 6–8 years
8.1–10.0= One storm every 8–10 years
>10.0 = Less than one storm every 10 years
Fig. 8Frequency of recordedlandslide-triggering rainstormsin different regions between1870 and 1995 in New Zealand(Note: Point may reflect morethan one landslide-triggeringrainstorm event. The pointmarker symbolizes only thelocation of the event, not theevent magnitude or the extentof damage)
photo coverages made after highly damaging landslide-triggering rainstorms, comprehensive historical recordson landslide-triggering events, complete climatic recordsin terms of a high density of climatic stations and longrecording periods, and distinctive differences in the phy-sical environment.
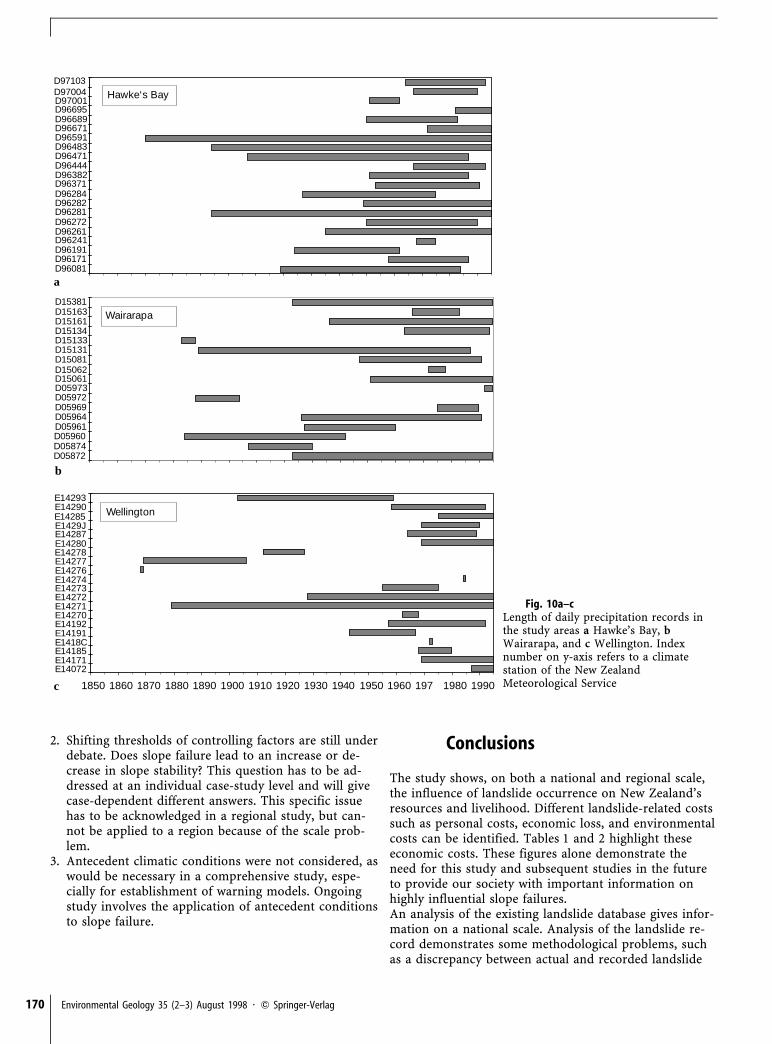
Regional analysis is focused on daily precipitation and itsrelation to historical records of landslide occurrence(Omura and Hicks 1991). Years when 24-h-rainfall re-cords are available for the three study areas are shown inFig. 10. Daily precipitation data of the climatic time serieshave been categorized in 20 mm intervals and values are
Environmental Geology 35 (2–3) August 1998 7 Q Springer-Verlag 169
l ll l
0 300
km
176 E
176 E
°
°
35 S35 S °°
°
°
178 E
178 E
°
°
45 S
40 S
45 S
40 S
°
°
Wellington
Hawke`sBay
Wairarapa
Fig. 9Locations of the study areas Hawke’s Bay, Wairarapa andWellington in New Zealand (Note: Ellipse size is not related toactual study area size. It gives broad location only)
stored within appropriate classes as one count. The 24-h-rainfall variable of landslide-triggering rainstorms, de-rived from the compiled landslide database, was classedinto the same 20 mm intervals. Figure 11 provides the re-sulting frequency distributions of both variables. Dailyprecipitation measured by climatic stations is recordedover decades, thus allowing for natural seasonal and an-nual variability. Consequently, the different length of cli-matic records may influence the absolute number ofcounts within each magnitude class, but because of thelength of the records it probably does not change theoverall frequency distribution.Probabilities of landslide occurrence including minimumand maximum thresholds were established empirically forgiven event magnitudes (Fig. 11). In this study, the mini-mum threshold of a given region refers to the margin be-low which mass movement does not occur (landslideprobability equals 0%) and above which it may occur un-der certain conditions (Crozier 1989). The maximumprobability threshold is defined as the margin abovewhich the defined level of mass movement always occurs.Above this threshold there is a 100% probability of oc-currence. The probability of landslide occurrence is cal-culated as the ratio of the number of recorded landslide-triggering daily precipitation counts divided by the actualmeasured total daily precipitation counts.
Figure 11 indicates that the different regions do have avarying susceptibility to landslides. The minimum dailyrainfall required to trigger landslides in all three regionsis 20 mm. The maximum threshold is much more varia-ble between the regions, naturally dependent on precipi-tation supply. In Hawke’s Bay, one could expect land-slides to occur following any rainstorm exceeding300 mm daily rainfall (Fig. 11a). In the Wairarapa(Fig. 11b), every storm over 120 mm has triggered land-slides, while the maximum probability threshold for Wel-lington is 140 mm (Fig. 11c). One factor which proved tobe problematic for the analysis was the use of differentrecording procedures. Daily precipitation values providedby NIWA are read at the respective climate station at9 a.m. every day. The resulting values relate to the pre-ceding 24-hour period. The compiled landslide-triggeringvalues refer only to the mentioned values in the literaturesource. It was not possible either to identify the originalsource of cited values or to distinguish the period ofmeasurement, e.g. from 9 a.m. to 9 a.m., or from noon tonoon, or midnight to midnight, etc. This recording differ-ence could explain why there are some classes with onlylandslide-triggering rainfall recorded and some with onlyactual measured precipitation recorded (Fig. 11b). How-ever, it can be assumed that rainfall events greater thanthe maximum threshold of 120 mm were very likely tohave triggered landslides. Perhaps the single values com-piled from the literature were too low and refer to thehigher actual measured values. For example, if a rain-storm starts at 1 p.m. and lasts until 6 a.m. the next day,it will be fully represented in one actual measured value,but it may have been recorded in the literature as twodifferent, smaller values because it occurred over two cal-endar days.Considering all associated problems, these figures give afirst broad introduction into regional maximum and min-imum probability thresholds for precipitation triggeringof landslides. One possible application of these empirical-ly determined thresholds is real-time landslide-warningsystems as has been done in the United States by Keeferand others (1987), in Hong Kong by the GeotechnicalControl Office (GCO) within the Engineering Departmentof the Hong Kong Government (Geotechnical Control Of-fice 1985), in Italy by Panizza and others (1996), and inSouth Africa by Garland and Olivier (1993). Recent appli-cation of this methodology in New Zealand has been un-dertaken by Crozier (1996a) to evaluate landslide hazardand risk for a given region.However, a number of points, arising out of the estab-lishment of these thresholds, need to be made:1. Both frequency distributions reflect recording periods
of up to 125 years. It is possible that the rainfallthreshold for landslide triggering may change overtime (Crozier 1996b) as well as in space within a re-gion. These changing thresholds could be induced by,for example, forest removal, slope cuttings for urbani-zation or infrastructure lines, or by slope failure itself(Preston 1996).
170 Environmental Geology 35 (2–3) August 1998 7 Q Springer-Verlag
1850 1860 1870 1880 1890 1900 1910 1920 1930 1940 1950 1960 197 1980 1990
Hawke‘s Bay
Wellington
E14072E14171E14185E1418CE14191E14192E14270E14271E14272E14273E14274E14276E14277E14278E14280E14287E1429JE14285E14290E14293
D05872D05874D05960D05961D05964D05969D05972D05973D15061D15062D15081D15131D15133D15134D15161D15163D15381
Wairarapa
D96081D96171D96191D96241D96261D96272D96281D96282D96284D96371D96382D96444D96471D96483
D96671D96689D96695D97001D97004D97103
D96591
a
b
c
Fig. 10a–cLength of daily precipitation records inthe study areas a Hawke’s Bay, bWairarapa, and c Wellington. Indexnumber on y-axis refers to a climatestation of the New ZealandMeteorological Service
2. Shifting thresholds of controlling factors are still underdebate. Does slope failure lead to an increase or de-crease in slope stability? This question has to be ad-dressed at an individual case-study level and will givecase-dependent different answers. This specific issuehas to be acknowledged in a regional study, but can-not be applied to a region because of the scale prob-lem.
3. Antecedent climatic conditions were not considered, aswould be necessary in a comprehensive study, espe-cially for establishment of warning models. Ongoingstudy involves the application of antecedent conditionsto slope failure.
Conclusions
The study shows, on both a national and regional scale,the influence of landslide occurrence on New Zealand’sresources and livelihood. Different landslide-related costssuch as personal costs, economic loss, and environmentalcosts can be identified. Tables 1 and 2 highlight theseeconomic costs. These figures alone demonstrate theneed for this study and subsequent studies in the futureto provide our society with important information onhighly influential slope failures.An analysis of the existing landslide database gives infor-mation on a national scale. Analysis of the landslide re-cord demonstrates some methodological problems, suchas a discrepancy between actual and recorded landslide

Environmental Geology 35 (2–3) August 1998 7 Q Springer-Verlag 171
1,000,000
100,000
10,000
1,000
100
10
1
0.1
Wellington 1903 – 1995
1,000,000
100,000
10,000
1,000
100
10
1
0.1
Precipitation classes (mm)
Wairarapa 1880 – 1995
Hawke‘s Bay 1870 – 1995
1,000,000
100,000
10,000
1,000
100
10
1
0.1
0
0.10.2
0.40.7 0.9
5.1 6.5 3.3 10.7 29.4 16.7
50.0 016.7 100
0
0.0010.3
1.42.9
0
100 100
100
100 100
0
0.31.6
4.313.0 20.7
40.0 100100
100
Recorded landslide-triggering daily precipitation Actual daily precipitation
Minimum probability threshold Maximum probability thresholdLandslide probability range
Num
ber
of c
ount
sN
umbe
r of
cou
nts
Num
ber
of c
ount
s
0.1–
20.0
40.1
–60.
0
60.1
–80.
0
80.1
–100
.0
120.
1–14
0.0
140.
1–16
0.0
160.
1–18
0.0
180.
1–20
0.0
200.
1–22
0.0
220.
1–24
0.0
240.
1–26
0.0
260.
1–28
0.0
280.
1–30
0.0
> 3
00.1
100.
1–12
0.0
20.1
–40.
0
a
b
cFig. 11a–c
Probabilities (%) of landslide occurrenceassociated with rainfall of a givenmagnitude in the study areas a Hawke’sBay, b Wairarapa, and c Wellington. Forexample, a value of 50 means 50% of allmeasured daily rainfalls in a givencategory produced landslides in the past
occurrence, various recording procedures, different per-ceptions of importance from individual investigators and/or organizations, and storage at various places, in differ-ent formats and scales. Despite these limitations of thedatabase, it is the most comprehensive source availablefor a national analysis of rainfall-triggered landslides inNew Zealand. Therefore it is used in further analysis.The problem of landslide recognition is highlighted withrespect to changes in population size and distribution intime and space in New Zealand (Figs. 3 and 4). Higherpopulation influences the database by enabling more pre-
cise landslide recognition while less-populated regionshave fewer landslide reports, which does not reflect real-ity at all. Also natural environmental factors are consid-ered with the example of temporal change of forest cover.Strong correlations between degree of forest cover andcounts of landslide-triggering rainstorms are recognized(Fig. 6). This relates mainly to an increase in rainfall-trig-gered landslides after deforestation with a lagtime of oneor two decades and a decrease in landslide occurrenceafter afforestation. Despite the good correlation betweenchanges in forest cover and the incidence of landslides

172 Environmental Geology 35 (2–3) August 1998 7 Q Springer-Verlag
there remains a possibility that variation in the climaticregime through time may be another factor explainingthis trend. The different vegetation types, forest, scrub,and pasture, are compared by landslide parameters(Fig. 7). Lowest values of affected area (0.008 ha) andlandslide density (0.001 landslides/ha) are found in for-ested land. Numerous shallow landslides mainly occur inpastureland, while deep-seated landslides with high vol-umes occur, less frequently, in forested land. This is con-sistent with the commonly held view that geomorphicwork and denudation by landslides is for the long-termtimescale the same under both forest and pasture cover.However, this magnitude/frequency issue has to be ad-dressed in more detail in further studies. Regional fre-quencies of landslide-triggering rainstorms on the basisof reported information are calculated (Fig. 8). Althoughlandslide recognition problems as discussed earlier haveto be considered, it appears that the regions Northlandand Wellington on the North Island and Greymouth andNorth Otago on the South Island of New Zealand aremore affected by landslide-triggering rainstorms thanothers.Regional scale analyses were carried out in the threestudy areas Hawke’s Bay, Wairarapa and Wellington(Fig. 9). Correlation of daily precipitation with landslide-triggering 24-h-rainfall values cited from the literaturegives probability margins for the landslide-triggering pre-cipitation. Regional thresholds are established and com-pared (Fig. 11). The minimum probability threshold of alandslide-triggering rainstorm is 20 mm daily precipita-tion in all three study areas. The maximum probabilitythreshold is much more variable between the regions andis in Hawke’s Bay 300 mm/24 h, Wairarapa 120 mm/24 h,and in Wellington 140 mm/24 h. These conditions arelikely to be influenced by shifting thresholds over timeand area. However, the establishment of regional rainfallthresholds is useful and provides important informationfor any landslide warning system. A test study has evendemonstrated the possibility of using these defined rain-fall thresholds to predict landslide hazard in a given re-gion in the near future.The questions raised in this study will be followed up inongoing research. These forthcoming studies will be fo-cused on:1. The development of a standardized reporting scheme
to provide a similar recording basis;2. The consideration of antecedent soil moisture condi-
tions of landslide-triggering rainfalls;3. Shifting thresholds in time and space in respect to
both human activity and physical environment, in-fluenced by the erosion process itself;
4. The role of controlling factors such as geology, regol-ith type and depth, vegetation, geometric slope param-eters;
5. The landslide hazard assessment for given regions; and6. The downscaling of landslide warning information
from the regional scale to the site level by couplinghydrological and mass movement models.
Acknowledgements The author would like to thank MichaelCrozier for his support and encouragement while I undertookthis study. He and Nicholas Preston reviewed the manuscriptand provided helpful comments on this paper. Thanks are alsogiven to the Internal Grant Committee of Victoria University ofWellington for providing financial support and to both theGeography Department of Victoria University of Wellingtonand the Earthquake Commission for partly covering travel ex-penses enabling me to attend the European Geophysical Socie-ty’s XXI General Assembly Conference in The Hague, The Ne-therlands, May 1996. This paper was presented in the sessionHS2/NH1 titled Hydrological Trigger of Diffused Landsliding.Thanks are also due to all, unfortunately mostly personally un-known, authors of landslide related publications in New Zea-land. Without their field work, it would have never been possi-ble to conduct this research. Thanks for reviewing this articleare owed to an anonymous referee and to Earl Brabb, U.S. Geo-logical Survey in the United States, who gave helpful comments.
References
Alexander DE (1993) Landslides as polycausal phenomena. In:Nemec J, Nigg JM, Siccardi F (eds) Prediction and perceptionof natural hazards: advances in natural and technological haz-ards research. Kluwer, Dordrecht, pp 93–99
Bell DH (1976) High intensity rainstorms and geological haz-ards: Cyclone Alison, March 1975, Kaikoura, New Zealand.Bull Int Assoc Eng Geol 14 : 189–200
Berezovsky O (1994) Landslide impact on Pakihikura Valley.B.A. (Hons) thesis, Victoria University of Wellington, Wel-lington, New Zealand
Blaschke PM (1988) Vegetation and landscape dynamics ineastern Taranaki, North Island, New Zealand. PhD thesis,Victoria University of Wellington, Wellington, New Zealand
Blaschke PM, Trustrum NA, DeRose RC (1992) Ecosystemprocesses and sustainable land use in New Zealand stee-plands. Agric, Ecosystems Environ 41 : 153–178
Blong RJ, Eyles GO (1989) Landslides: extent and economicsignificance in Australia, New Zealand and Papua New Gui-nea. In: Brabb EE, Harrod BL (eds) Landslides: extent andeconomic significance. Balkema, Rotterdam, pp 343–355
Brabb EE (1991) The world landslide problem. Episodes14 : 52–61
Brabb EE, Harrod BL (eds) (1989) Landslides: extent and eco-nomic significance. In: Proceedings of the 28th InternationalGeological Congress: Symposium on Landslides, WashingtonD.C. Balkema, Rotterdam
Brand EW (1989) Occurrence and significance of landslides inSoutheast Asia. In: Brabb EE, Harrod BL (eds) Landslides –extent and economic significance. Balkema, Rotterdam,pp 303–324
Cant RG, Johnston RJ (1973) Regional development patterns.In: Johnston RJ (ed) Urbanisation in New Zealand. Reed Edu-cation, Wellington, New Zealand, pp 15–40
Cato I (1982) Landslide at Tuve and the complex origin ofclays in South-Western Sweden. In: Sheko AI (ed) Landslidesand mudflows – reports of the Alma-Ata International Semi-nar, October 1981. Centre of International Projects, GKNT,Moscow, pp 279–289
Clough P, Hicks D (1993) Soil conservation and the ResourceManagement Act. Policy Technical Report 93/2, Ministry ofAgriculture & Fisheries, Wellington, New Zealand
Crozier MJ (1989) Landslides: causes, consequences and envi-ronment. 2nd edn. Routledge, London & New York

Environmental Geology 35 (2–3) August 1998 7 Q Springer-Verlag 173
Crozier MJ (1996a) Hi-tech pinpoints landslide threat. TheDominion, 23. 9. 96, Wellington, New Zealand, p 3
Crozier MJ (1996b) Magnitude/frequency issues in landslidehazard assessment. In: Mäusbacher R, Schulte A (eds) Bei-träge zur Physiogeographie – Festschrift für Dietrich Barsch.Heidelberger Geographische Arbeiten. Selbstverlag des Geo-graphischen Instituts der Universität Heidelberg, Heidelberg,pp 221–236
Derbyshire E, Meng X (1995) The landslide hazard in NorthChina: characteristics and remedial measures at the Jiashu-wan and Taishanmiao slides in Tian Shui City, Gansu Prov-ince. In: McGregor DFM, Thompson DA (eds) Geomorpholo-gy and land management in a changing environment. Sympo-sia Series. Wiley, Chichester, pp 89–104
DeRose RC, Trustrum NA, Thomson NA, Roberts AHC
(1995) Effect of landslide erosion on Taranaki hill pastureproduction and composition. N Z J Agric Res 38 : 457–471
Douglas GB, Trustrum NA, Brown IC (1986) Effect of soilslip erosion on Wairoa hill pasture production and composi-tion. N Z J Agric Res 29 : 183–192
East Cape Catchment Board (1988) Waihora Catchment:Cyclone Bola storm damage survey. Unpublished report, EastCape Catchment Board, Gisborne, New Zealand
Eyles GO (1983) The distribution and severity of present soliderosion in New Zealand. N Z Geogr 39 : 12–28
Eyles GO, Newsome PF (1991) A soil conservation approachto sustainable land use. In: Proceedings of the InternationalConference on Sustainable Land Management, National Waterand Soil Conservation Organisation, Napier, New Zealand,pp 216–220
Eyles RJ, Crozier MJ, Wheeler RH (1974) Landslides in Wel-lington City, 1974. Soil Water 11 : 17–20
Fowler AM, Hennessy KJ (1995) Potential impacts of globalwarming on the frequency and magnitude of heavy precipita-tion. Nat Hazards 11 : 283–303
Garland GG, Olivier MJ (1993) Predicting landslides fromrainfall in a humid, sub-tropical region. Geomorphology8 : 165–173
Geotechnical Control Office (1985) Description of theGeotechnical Control Office Engineering Development De-partment. (Not published) Hong Kong
Gillon MD, Hancox GT (1992) Cromwell Gorge landslides – ageneral overview. In: Bell DH (ed) Landslides. Balkema, Rot-terdam, pp 83–120
Glade T, Crozier MJ (1996) Towards a national landslide in-formation base for New Zealand. N Z Geogr 52 : 29–40
Glade T, Crozier MJ (1998) The current status of landslideinformation systems in New Zealand. In: New Zealand Geo-graphical Society Anniversary Conference, 27–30 August 1995(in press)
Gregersen O, Sandersen F (1989) Landslides: extent and eco-nomic significance in Norway. In: Brabb EE, Harrod BL (eds)Landslides: extent and economic significance. Balkema, Rot-terdam, pp 133–139
Guthrie-Smith WH (1969) Tutira – the story of a New Zea-land sheep station, 4th edn. William Blackwood and SonsLtd., Wellington, New Zealand
Harmsworth GR, Page MJ (1991) A review of selected stormdamage assessments in New Zealand. Scientific Report 9,DSIR Land Resources, Lower Hutt, New Zealand
Hawley JG (1980) Introduction. In: Aokantere Science Centre,Workshop on the influence of soil slip erosion on hill countrypastoral productivity, Internal Report 21, Water and Soil Div-ision, Ministry of Works and Development, Wellington, NewZealand, pp 4–6
Hawley JG (1984) Slope instability in New Zealand. In: SpedenIG, Crozier MJ (eds) Natural hazards in New Zealand.UNESCO, Wellington, pp 88–133
Hicks DL (1991) Erosion under pasture, pine plantations, scruband indigenous forest: a comparison from Cyclone Bola. N ZFor 36 : 21–22
Hicks DL (1992) Impact of soil conservation on storm-dam-aged hill grazing lands in New Zealand. Austr J Soil WaterConserv 5 : 34–40
Hicks DL, Fletcher JR, Eyles GO, McPhail CR, Watson M
(1993) Erosion of hill country in the Manawatu-Wanganui re-gion 1992 : impacts and options for sustainable land use. Un-published contract report LC 9394/51, Landcare Research
Ibsen ML, Brunsden D (1996) The nature, use and problemsof historical achieves for the temporal occurrence of land-slides, with specific reference to the south coast of Britain,Ventnor, Isle of Wight. Geomorphology 15 : 241–258
Johnson GO (1995) GIS applications in emergency manage-ment. In: Beroggi GEG, Wallace WA (eds) Computer sup-ported risk management: topics in safety, risk, reliability andquality. Kluwer, Dordrecht, The Netherlands, pp 133–144
Keefer DK, Wilson RC, Mark RK, Brabb EE, Brown WM
III, Ellen SD, Harp EL, Wieczorek GF, Alger CS, Zatkin
RS (1987) Real-time landslide warning during heavy rainfall.Science 238 : 921–925
King AP (1989) Landslides: extent and economic significance inHonduras. In: Brabb EE, Harrod BL (eds) Landslides: extentand economic significance. Balkema, Rotterdam, pp 81–91
Lambert MG, Trustrum NA, Costall DA (1984) Effect ofsoil slip erosion on seasonally dry Wairarapa hill pastures. NZ J Agric Res 27 : 57–64
Mathur HN (1982) Influence of human activities on landslides,mudflows and slope movements in India and efforts at reduc-ing their negative impact. In: Sheko AI (ed) Landslides andmudflows – reports of the Alma-Ata International Seminar,October 1981. Centre of International Projects, GKNT, Mos-cow, pp 20–44
Moriyama Y, Horiuchi S (1993) The budget for fiscal 1993 (inJapanese). Sabo Flood Control 25 : 60–64
Nishimoto H (1993) The supplementary budget for fiscal 1992.Sabo Flood Control 25 : 68–69
O’Loughlin CJ (1974) The effect of timber removal on the sta-bility of forest soils. J Hydrol (N.Z.) 13 : 121–134
Omura H, Hicks DL (1991) Probability of landslides in hillcountry. In: Bell DH (ed) Landslides. Balkema, Rotterdam,pp 1045–1049
Oyagi N (1989) Geological and economic extent of landslidesin Japan and Korea. In: Brabb EE, Harrod BL (eds) Land-slides: extent and economic significance. Balkema, Rotterdam,pp 289–302
Panizza M, Pasuto A, Silvano S, Soldati M (1996) Tempo-ral occurrence and activity of landslides in the area of Corti-na d’Ampezzo (Dolomites, Italy). Geomorphology 15 : 311–326
Papps TOH (1985) Growth and distribution of population: his-torical trends. In: United Nations (ed) Population of NewZealand. Country Monograph Series No.12. United Nations,New York, pp 10–28
Phillips C, Marden M, Pearce AJ (1990) Effectiveness of re-forestation in prevention and control of landsliding duringlarge cyclonic storms. In: Proceedings of the 19th World Con-gress, Montreal, Canada, 5.–11. 8. 1990, International Unionof Forest Research Organizations. Vol I, Part I, pp 340–350
Preston NJ (1996) Spatial and temporal changes in terrain re-sistance to shallow translational regolith landsliding. MA(Hons) thesis, Victoria University of Wellington, Wellington,New Zealand

174 Environmental Geology 35 (2–3) August 1998 7 Q Springer-Verlag
Riemer W (1995) Keynote paper: Landslides and reservoirs. In:Bell DH (ed) Landslides, Proceedings of Sixth InternationalSymposium on Landslides, Christchurch, New Zealand. Balke-ma, Rotterdam, pp 1973–2004
Schuster RL (1978) Introduction. In: Schuster RL, Krizek RJ(eds) Landslides analysis and control. National Academy ofSciences, Washington, DC, pp 1–10
Schuster RL (1996) Socioeconomic significance of landslides.In: Turner AK, Schuster RL (eds) Landslides – investigationand mitigation. Special Report. National Academy Press,Washington, DC, pp 12–35
Sidle RC, Pearce AJ, O’Loughlin L (1985) Hillslope stabilityand land use. Water Resources Monograph 11, AmericanGeophysical Union, Washington, DC
Stephens PR, Trustrum NA, Hicks DL (1983) Experimentalaerial photographic survey of erosion and catchment condi-tion, Gladstone district, Wairarapa. In: Stephens PR (ed) Re-mote sensing for soil conservation. Water & Soil Miscella-neous Publication No. 52, Soil Conservation Centre, Ministryof Works and Development, Palmerston North, New Zealand,pp 129–154
Takahashi T (1981) Debris flows. Ann Rev Fluid Mech13 : 57–77
The Dominian (1996) Town struggles to cope after rockfall.30. 9. 96, Wellington, New Zealand, p 6
Trotter C (1988) Cyclone Bola: the inevitable disaster. N ZEng July 1 : 13–16
Trustrum NA, Blaschke PM, DeRose RC, West AW (1990)Regolith changes and pastoral productivity declines followingdeforestation in steeplands of North Island, New Zealand. In:Transactions 14th International Soil Science Congress, Kyoto,Japan. Section 1, pp 125–130
Tsukamoto Y (1990) Effect of vegetation on debris slide occur-rences on steep forested slopes in Japan Islands. In: ZiemerRR, O’Loughlin CL, Hamilton LS (eds) Research needs andapplications to reduce erosion and sedimentation in tropicalsteeplands. International Association of HydrologicalSciences, pp 183–191
U.S. Committee on Ground Failure Hazards (1985) Reduc-ing losses from landsliding in the United States. U.S. NationalResearch Council, Washington, DC
Yoon GG (1991) Extent and economic significance of landslidesin Korea. In: Bell DH (ed) Landslides. Balkema, Rotterdam,pp 1071–1076
Related Documents