This article appeared in a journal published by Elsevier. The attached copy is furnished to the author for internal non-commercial research and education use, including for instruction at the authors institution and sharing with colleagues. Other uses, including reproduction and distribution, or selling or licensing copies, or posting to personal, institutional or third party websites are prohibited. In most cases authors are permitted to post their version of the article (e.g. in Word or Tex form) to their personal website or institutional repository. Authors requiring further information regarding Elsevier’s archiving and manuscript policies are encouraged to visit: http://www.elsevier.com/copyright

Welcome message from author
This document is posted to help you gain knowledge. Please leave a comment to let me know what you think about it! Share it to your friends and learn new things together.
Transcript

This article appeared in a journal published by Elsevier. The attachedcopy is furnished to the author for internal non-commercial researchand education use, including for instruction at the authors institution
and sharing with colleagues.
Other uses, including reproduction and distribution, or selling orlicensing copies, or posting to personal, institutional or third party
websites are prohibited.
In most cases authors are permitted to post their version of thearticle (e.g. in Word or Tex form) to their personal website orinstitutional repository. Authors requiring further information
regarding Elsevier’s archiving and manuscript policies areencouraged to visit:
http://www.elsevier.com/copyright
Author's personal copy
Research paper
Establishing a luminescence chronology for a palaeosol-loess profile at Tokaj(Hungary): A comparison of quartz OSL and polymineral IRSL signals
Ann-Kathrin Schatz a,b,*, Jan-Pieter Buylaert b,c, Andrew Murray b, Thomas Stevens d,e, Thomas Scholten a
a Soil Science and Geomorphology Work Group, Department of Geosciences, University of Tübingen, Rümelinstrasse 19-23, D-72070 Tübingen, GermanybNordic Laboratory for Luminescence Dating, Department of Earth Sciences, University of Aarhus, Risø DTU, 4000 Roskilde, DenmarkcRadiation Research Division, Risø National Laboratory for Sustainable Energy, Risø DTU, 4000 Roskilde, DenmarkdCentre for Quaternary Research, Department of Geography, Royal Holloway, University of London, Egham, Surrey TW20 0EX, UKe Faculty of Sciences, University of Novi Sad, Trg Dositeja Obradovi�ca 3, 21000 Novi Sad, Serbia
a r t i c l e i n f o
Article history:Received 14 October 2011Received in revised form17 February 2012Accepted 18 February 2012Available online 2 March 2012
Keywords:LoessHungaryOSLSARPost-IR IRSLBleaching
a b s t r a c t
We present a comparative study of quartz OSL, polymineral IRSL at low temperature (50 �C, IR50) andpost-IR elevated temperature (290 �C) IRSL (pIRIR290) feldspar dating on nine samples from the Tokajloess section in NE Hungary (SE Europe). Preheat plateau tests show a drop in quartz OSL De between 160and 240 �C but above 240 �C a clear De plateau is present. Quartz OSL SAR is shown to be generallyappropriate to these samples (recycling, recuperation) but a satisfactory dose recovery result was onlyobtained when a dose was added to a sample without any prior optical or thermal pre-treatment; thisgave a dose recovery ratio of 1.04 � 0.05 after subtracting the natural dose from the measured dose. ThepIRIR290 SAR protocol also results in acceptable dose recovery results for the pIRIR290 signal (1.08 � 0.01)when a large dose is added to the natural dose. Bleaching experiments suggest a detectable non-bleachable residual pIRIR290 dose of 10 � 4 Gy. Agreement with quartz OSL ages is best achieved bycorrecting the IR50 ages for fading; however this is not necessary when using the pIRIR290 signal. Withrespect to Hungarian Late Quaternary geology our results indicate that the major part of the Tokaj loesshas been deposited during MIS 3 (60e24 ka), with periods of soil formation occurring during the onset ofMIS 3 (�58 ka) and between about 35 and 25 ka. Our results also indicate episodic deposition of loessand varying, non-linear sedimentation rates during MIS 3. Proxy analyses in the literature are based onthe traditional concept of continuous deposition; in the light of our new data the use of such simpleassumptions must be reconsidered.
� 2012 Elsevier B.V. All rights reserved.
1. Introduction
Loess-palaeosol sequences are an important terrestrial archiveof Quaternary climate fluctuations and an essential tool for deci-phering the impact of climate change on local and regional land-scapes and ecosystems. Several recent studies have focused on theCarpathian Basin in SE Europe because of its favourable geomor-phological setting and multiple loess-palaeosol sequences; itpreserves well-resolved spatial and temporal records of the Euro-pean late Quaternary history (Markovi�c et al., 2008; Sümegi andKrolopp, 2002; Újvári et al., 2010; Willis et al., 2000). Besidesproviding information about local and regional palaeoclimate and
palaeoenvironment, these records can also be compared with otherextensive loess deposits such as in the Chinese Loess Plateau andother regions in the Eurasian loess belt (Frechen and Dodonov,1998; Frechen et al., 2009; Machalett et al., 2008; Stevens et al.,2007), or correlated with marine and ice core records (Stevenset al., 2008, 2011).
The Tokaj section in NE Hungary (see supplementary section;Fig. S1) is one of the key Hungarian loess sections for palaeoclimaticreconstructions. Detailed palaeontological (molluscs, charcoal),sedimentological and geochemical studies (biomarkers, stableisotopes) have been carried out at this site (Rudner and Sümegi,2001; Schatz et al., 2011; Sümegi and Hertelendi, 1998; Sümegiand Rudner, 2001). However, the current chronostratigraphy ofthe profile is fragmentary and based on uncalibrated radiocarbonages obtained from mollusc shells and charcoal recovered from anadjacent section, as well as on stratigraphic correlations with otherHungarian profiles (Sümegi and Hertelendi, 1998). Detailed andreliable numerical age control is lacking, limiting the interpretation
* Corresponding author. Soil Science and Geomorphology Work Group, Depart-ment of Geosciences, University of Tübingen, Rümelinstrasse 19-23, D-72070Tübingen, Germany.
E-mail addresses: [email protected], [email protected] (A.-K. Schatz).
Contents lists available at SciVerse ScienceDirect
Quaternary Geochronology
journal homepage: www.elsevier .com/locate/quageo
1871-1014/$ e see front matter � 2012 Elsevier B.V. All rights reserved.doi:10.1016/j.quageo.2012.02.018
Quaternary Geochronology 10 (2012) 68e74
Author's personal copy
of palaeoclimatic and palaeoenvironmental information andrestricting the correlation of this record with other loess-palaeosolprofiles of the Carpathian Basin and with marine archives.
The post-IR IRSL signal of feldspar (Thomsen et al., 2008) hasbeen shown to be more stable than the conventional IRSL signalusually measured at w50 �C (Buylaert et al., 2008). In the post-IRIRSL method the samples are, after a preheat, first stimulatedwith IR at low temperature (typically 50 �C, IR50) and subsequentlyIR stimulated at an elevated temperature to record a more stablepost-IR IRSL signal (pIRIRelevT) In this paper we establish the firstluminescence chronology for the Tokaj profile by comparing fine-grained quartz OSL ages with polymineral fine-grain IR50 andpIRIR290 ages obtained following Thiel et al. (2011a) and Buylaertet al. (2012). The resulting ages and calculated sedimentationrates are presented in the context of other Hungarian sections andimplications for previously published palaeoenvironmental proxyinformation are discussed.
2. Geological setting
Tokaj is situated in the northeast of the Carpathian Basin,a region of approximately 300,000 km2 surrounded by major
mountain ranges (Fig. S1). The area around Tokaj has been sug-gested as one of the rare refuges for deciduous and coniferous treesduring the last glacial and has, as a result, received considerableattention (Rudner and Sümegi, 2001; Schatz et al., 2011; Sümegiand Hertelendi, 1998; Sümegi and Krolopp, 2002; Sümegi andRudner, 2001; Willis et al., 2000). The study site itself is situatedon the eastern slopes of Kopasz Hill (Patkó quarry; 100 m a.s.l.,48,070N, 21,240E; Fig. S1), in the southernmost part of the TokajMountains where the river Bodrog discharges into the Tisza.
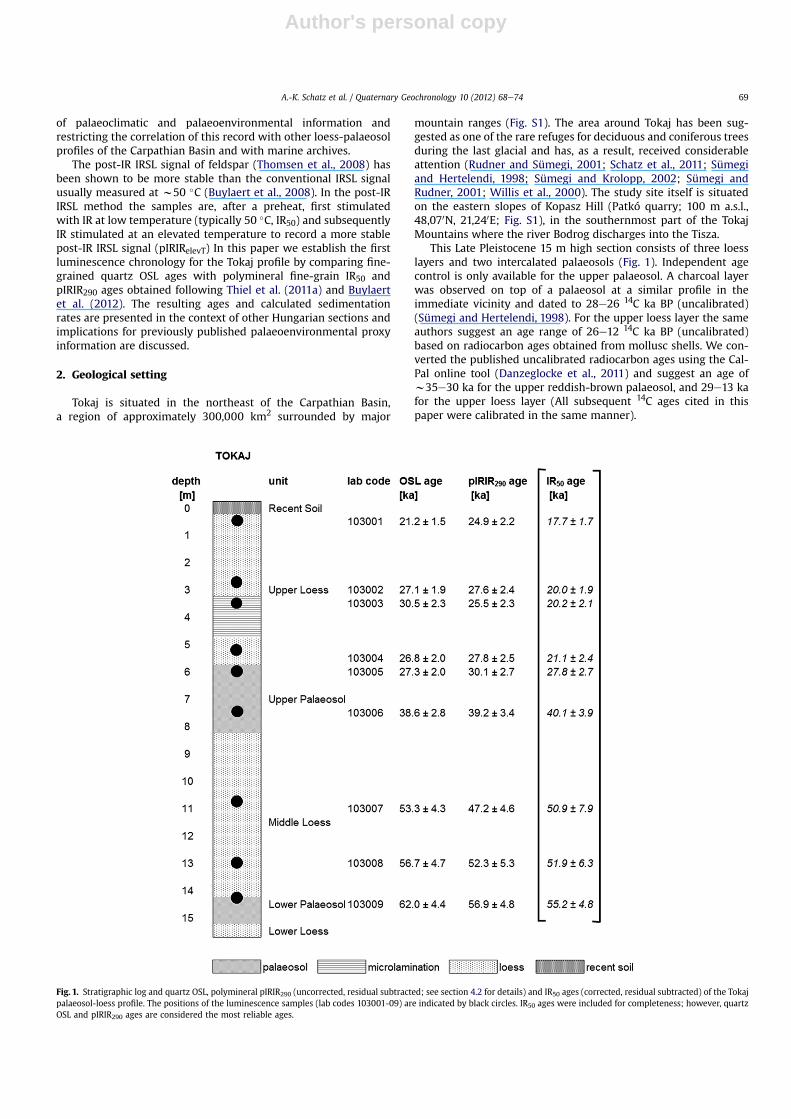
This Late Pleistocene 15 m high section consists of three loesslayers and two intercalated palaeosols (Fig. 1). Independent agecontrol is only available for the upper palaeosol. A charcoal layerwas observed on top of a palaeosol at a similar profile in theimmediate vicinity and dated to 28e26 14C ka BP (uncalibrated)(Sümegi and Hertelendi, 1998). For the upper loess layer the sameauthors suggest an age range of 26e12 14C ka BP (uncalibrated)based on radiocarbon ages obtained from mollusc shells. We con-verted the published uncalibrated radiocarbon ages using the Cal-Pal online tool (Danzeglocke et al., 2011) and suggest an age ofw35e30 ka for the upper reddish-brown palaeosol, and 29e13 kafor the upper loess layer (All subsequent 14C ages cited in thispaper were calibrated in the same manner).
Fig. 1. Stratigraphic log and quartz OSL, polymineral pIRIR290 (uncorrected, residual subtracted; see section 4.2 for details) and IR50 ages (corrected, residual subtracted) of the Tokajpalaeosol-loess profile. The positions of the luminescence samples (lab codes 103001-09) are indicated by black circles. IR50 ages were included for completeness; however, quartzOSL and pIRIR290 ages are considered the most reliable ages.
A.-K. Schatz et al. / Quaternary Geochronology 10 (2012) 68e74 69
Author's personal copy
3. Sample preparation, measurement facilities and dosimetry
Nine samples were taken during a field campaign in 2009 (labcodes: 103001-103009; Fig. 1). All samples for equivalent dose (De)determination were treated under subdued red laboratory light.Polymineral fine-grains (4e11 mm) were separated from bulksediment using conventional sample preparation techniques (10%HCl, 10% H2O2, Stokes’ settling). A portion of this material wasetched for 5e7 days with H2SiF6 to obtain fine-grained quartz. Thepurity of this quartz extract was confirmed by the absence ofa significant IRSL signal (<3% of the corresponding blue lightstimulated luminescence) and OSL-IR depletion ratios (Duller,2003) within 10% of unity. Both polymineral and quartz fine-grains were settled on aluminium discs from an acetone suspension(2 mg/ml).
A Risø TL/OSL DA-20 reader equipped with blue LEDs (470 nm,w80 mW/cm2) and IR diodes (875 nm, w135 mW/cm2) was usedfor all measurements. Quartz measurements were made with a U-340 filter and feldspar emission was detected through a blue filterpack (Schott BG39/Corning 7/59).
High resolution laboratory gamma spectrometry (Murray et al.,1987) was used to determine the dose rates. Dose rates for fine-grained quartz (assuming a-value of 0.04 � 0.01, Rees-Jones,1995) do not vary much down the section and range from 3.37 to3.87 Gy/ka. For the polymineral fine-grains an a-value of0.08 � 0.02 was used (Rees-Jones, 1995). The concentrations ofuranium, thorium and potassium were converted into dose ratesusing the dose rate conversion factors of Olley et al. (1996) andwater-content attenuation factors (Aitken, 1985). From an exami-nation of the European loess literature (Frechen et al., 1997;Novothny et al., 2010; Stevens et al., 2011) and a consideration ofthe setting of our section, we have adopted a life-time averagewater content of 15 � 5% for all our samples. Radionuclideconcentrations and the total dose rates are given in Table S2.
There is no unambiguous evidence for disequilibrium between238U and 226Ra in any single sample (Table S2) and the mean 238U to226Ra ratio is 0.97 � 0.06 (n ¼ 9). We assume secular equilibriumhas persisted throughout the life-time of the site with the possibleexception of some 222Rn loss which we assume to be 20 � 10%.
4. Luminescence measurements
4.1. Quartz OSL measurements
All quartz dose measurements were performed using a SARprotocol with a preheat of 260 �C for 10 s, a cut-heat of 240 �C anda blue-light cleanout for 40 s at 280 �C (Murray and Wintle, 2003).Stimulation with blue LEDs was for 40 s at 125 �C. All calculationswere made using the first 0.32 s of the decay curve minus a back-ground derived from the interval 0.8e1.6 s (early backgroundsubtraction, Ballarini et al., 2007).
A typical dose response curve and the results of a preheatplateau test for two samples are shown in Figs. S3 and S4(supplementary section), respectively. The quartz OSL signal isclearly dominated by a fast component (inset Fig. S3) and the doseresponse curve is well-represented by a single saturating expo-nential. The mean D0, estimated using the oldest sample (103009),is 173 � 9 Gy (n ¼ 12).
From Fig. S4a it can be seen that that the De is independent oftemperature for preheats >240 �C. Recycling ratios are all satis-factory, i.e. within 10% of unity, especially for higher preheattemperatures (Fig. S4a, Table S5). Recuperation is below 5% of thenatural signal for all samples and over the entire temperature range(Table S5, Fig. S4b). A preheat/cut-heat combination of 260 �C(10 s)/240 �C was chosen, and dose recovery tests were then
undertaken using sample 103005. Three natural aliquots werebleached twice with blue light for 100 s at room temperature (witha 10 ks pause in between) and another set of three aliquots receiveda 5 min Hönle SOL2 solar simulator bleach to remove the naturalsignal. A beta dose of w90 Gy was then given in the reader andmeasured as usual. These optical treatments gave rather poormeasured to given dose values of 1.29 � 0.06 and 1.88 � 0.34 forblue LED and SOL2 bleach respectively. A further dose recovery testwas then carried out using the same preheat settings but now byadding a large dose (w100 Gy) on top of the natural dose of theyoungest sample (103,001; De ¼ 71� 2 Gy); after subtraction of thenatural De from the measured dose the dose recovery ratio wassatisfactory (1.04 � 0.05, n ¼ 6), suggesting that the protocol canrecover a known dose given before any optical or thermal pre-treatment.
4.2. Post-IR IRSL on polymineral fine-grains
4.2.1. Measurement of doseAll measurements on polymineral fine-grains were made using
a recently proposed post-IR IRSL protocol (Thiel et al., 2011a;Buylaert et al., 2012) (Table S6). There is increasing evidence thatthe pIRIR290 signal measured in steps 4 and 8 does not fadesignificantly (Buylaert et al., 2012; Thiel et al., 2011b; Thomsenet al., 2011). The initial w2 s of signal less a background derivedfrom the last w40 s of the decay curves was used for calculations.
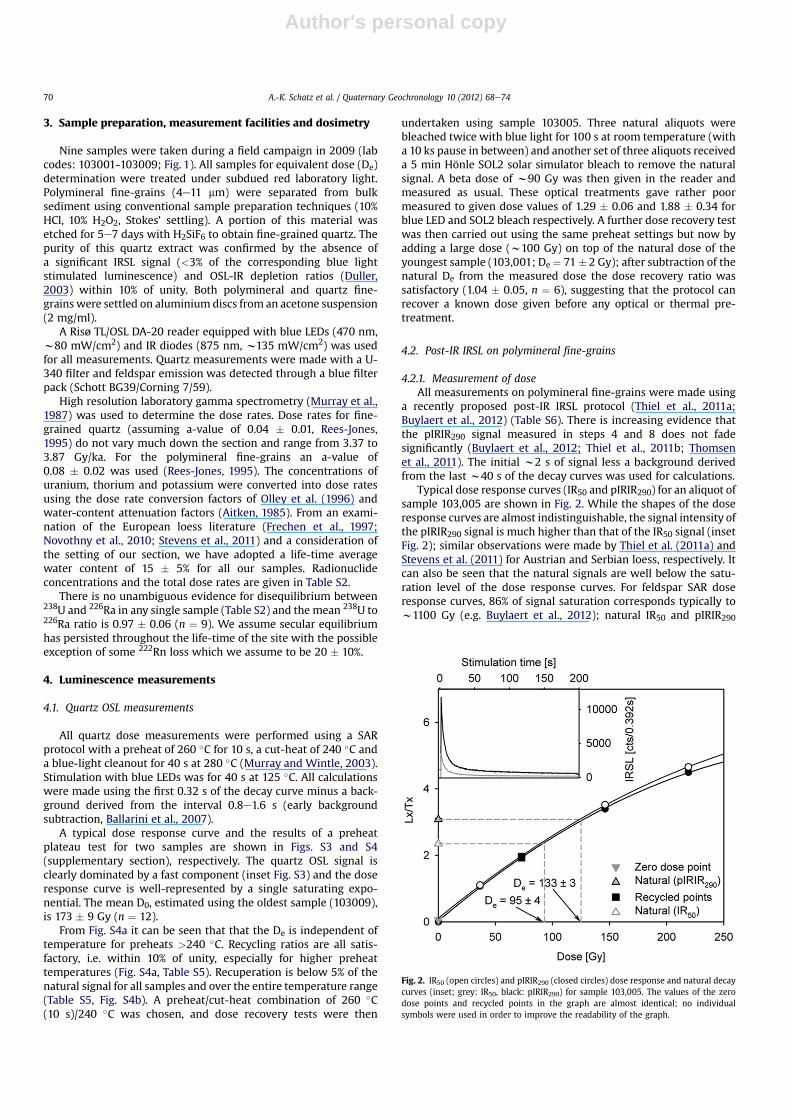
Typical dose response curves (IR50 and pIRIR290) for an aliquot ofsample 103,005 are shown in Fig. 2. While the shapes of the doseresponse curves are almost indistinguishable, the signal intensity ofthe pIRIR290 signal is much higher than that of the IR50 signal (insetFig. 2); similar observations were made by Thiel et al. (2011a) andStevens et al. (2011) for Austrian and Serbian loess, respectively. Itcan also be seen that the natural signals are well below the satu-ration level of the dose response curves. For feldspar SAR doseresponse curves, 86% of signal saturation corresponds typically tow1100 Gy (e.g. Buylaert et al., 2012); natural IR50 and pIRIR290
Fig. 2. IR50 (open circles) and pIRIR290 (closed circles) dose response and natural decaycurves (inset; grey: IR50, black: pIRIR290) for sample 103,005. The values of the zerodose points and recycled points in the graph are almost identical; no individualsymbols were used in order to improve the readability of the graph.
A.-K. Schatz et al. / Quaternary Geochronology 10 (2012) 68e7470
Author's personal copy
doses in this study are well-below this value. Recycling ratios areclose to unity for both IR50 and pIRIR290 measurements and the 10%criterion is met by all samples (Table S5). Values range from0.93 � 0.03 (103,009, IR50) to 1.07 � 0.05 (103,007, IR50). Recu-peration is always well below 5% (Table S5); minimum andmaximum values are 0.90 � 0.04% (103,009, IR50) and 2.7 � 0.3%(103,002, IR50), respectively.
As with quartz, a dose recovery test using laboratory bleachedsamples resulted in rather poor results (ratios >>1.2), and soa second dose recovery test without prior optical treatment wascarried out. A large dose (w280 Gy) was added on top of the naturaldose for three aliquots of the youngest sample 103,001. After sub-tracting the natural De value from the measured dose, the doserecovery ratios are 0.86� 0.01 and 1.08� 0.01 for IR50 and pIRIR290,respectively (Table S5). At least for the pIRIR290 signal this doserecovery test is considered acceptable.
4.2.2. Bleaching experimentBuylaert et al. (2011) have observed significant residual doses in
modern Chinese dust (up to 20 Gy for the pIRIR290 signal). Sohbatiet al. (2011) and Buylaert et al. (2012) have suggested that theremay in fact be an unbleachable component to these residuals.Unfortunately, a modern analogue is not available at or near thissite. The best estimate of any residual is obtained by laboratory andsunlight bleaching experiments of the individual samples. Threealiquots of each sample were bleached for 1 week in a Hönle SOL2solar simulator simulating daylight/night cycles and at w1 m fromthe light source to minimize any heating; the same number ofaliquots were exposed to daylight for the same period of time(Denmark, February).
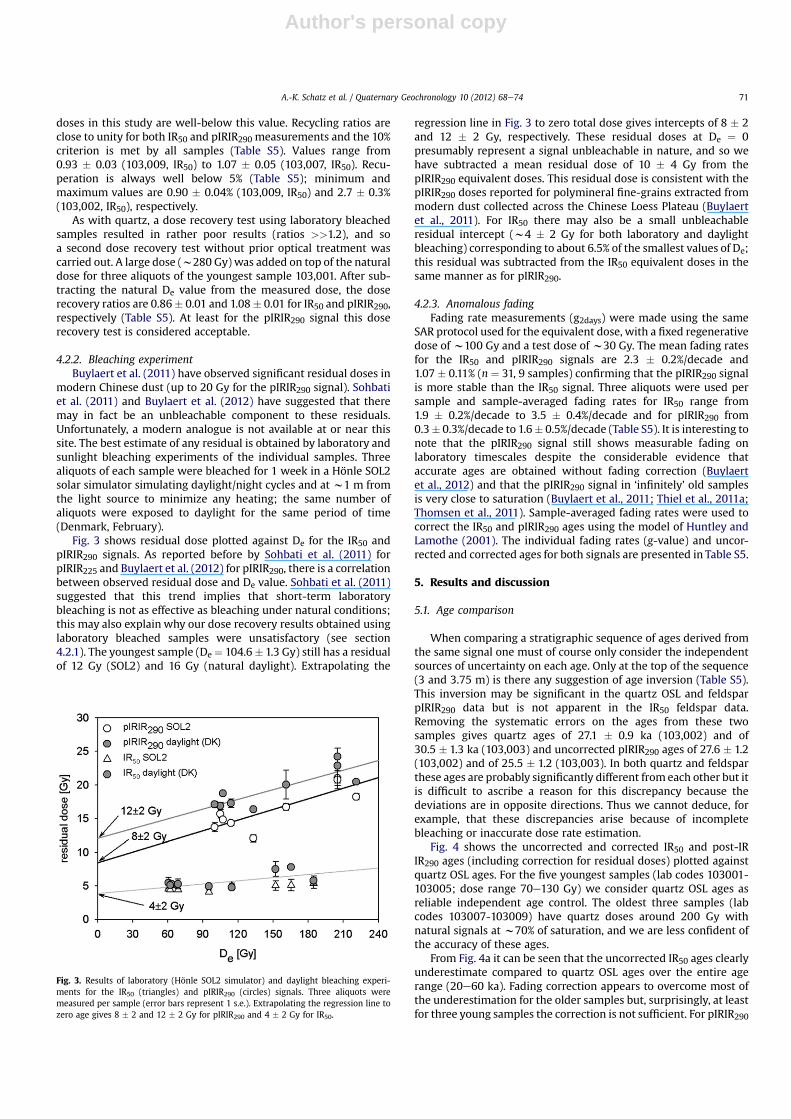
Fig. 3 shows residual dose plotted against De for the IR50 andpIRIR290 signals. As reported before by Sohbati et al. (2011) forpIRIR225 and Buylaert et al. (2012) for pIRIR290, there is a correlationbetween observed residual dose and De value. Sohbati et al. (2011)suggested that this trend implies that short-term laboratorybleaching is not as effective as bleaching under natural conditions;this may also explain why our dose recovery results obtained usinglaboratory bleached samples were unsatisfactory (see section4.2.1). The youngest sample (De ¼ 104.6� 1.3 Gy) still has a residualof 12 Gy (SOL2) and 16 Gy (natural daylight). Extrapolating the
regression line in Fig. 3 to zero total dose gives intercepts of 8 � 2and 12 � 2 Gy, respectively. These residual doses at De ¼ 0presumably represent a signal unbleachable in nature, and so wehave subtracted a mean residual dose of 10 � 4 Gy from thepIRIR290 equivalent doses. This residual dose is consistent with thepIRIR290 doses reported for polymineral fine-grains extracted frommodern dust collected across the Chinese Loess Plateau (Buylaertet al., 2011). For IR50 there may also be a small unbleachableresidual intercept (w4 � 2 Gy for both laboratory and daylightbleaching) corresponding to about 6.5% of the smallest values of De;this residual was subtracted from the IR50 equivalent doses in thesame manner as for pIRIR290.
4.2.3. Anomalous fadingFading rate measurements (g2days) were made using the same
SAR protocol used for the equivalent dose, with a fixed regenerativedose of w100 Gy and a test dose of w30 Gy. The mean fading ratesfor the IR50 and pIRIR290 signals are 2.3 � 0.2%/decade and1.07 � 0.11% (n ¼ 31, 9 samples) confirming that the pIRIR290 signalis more stable than the IR50 signal. Three aliquots were used persample and sample-averaged fading rates for IR50 range from1.9 � 0.2%/decade to 3.5 � 0.4%/decade and for pIRIR290 from0.3� 0.3%/decade to 1.6� 0.5%/decade (Table S5). It is interesting tonote that the pIRIR290 signal still shows measurable fading onlaboratory timescales despite the considerable evidence thataccurate ages are obtained without fading correction (Buylaertet al., 2012) and that the pIRIR290 signal in ‘infinitely’ old samplesis very close to saturation (Buylaert et al., 2011; Thiel et al., 2011a;Thomsen et al., 2011). Sample-averaged fading rates were used tocorrect the IR50 and pIRIR290 ages using the model of Huntley andLamothe (2001). The individual fading rates (g-value) and uncor-rected and corrected ages for both signals are presented in Table S5.
5. Results and discussion
5.1. Age comparison
When comparing a stratigraphic sequence of ages derived fromthe same signal one must of course only consider the independentsources of uncertainty on each age. Only at the top of the sequence(3 and 3.75 m) is there any suggestion of age inversion (Table S5).This inversion may be significant in the quartz OSL and feldsparpIRIR290 data but is not apparent in the IR50 feldspar data.Removing the systematic errors on the ages from these twosamples gives quartz ages of 27.1 � 0.9 ka (103,002) and of30.5 � 1.3 ka (103,003) and uncorrected pIRIR290 ages of 27.6 � 1.2(103,002) and of 25.5 � 1.2 (103,003). In both quartz and feldsparthese ages are probably significantly different from each other but itis difficult to ascribe a reason for this discrepancy because thedeviations are in opposite directions. Thus we cannot deduce, forexample, that these discrepancies arise because of incompletebleaching or inaccurate dose rate estimation.
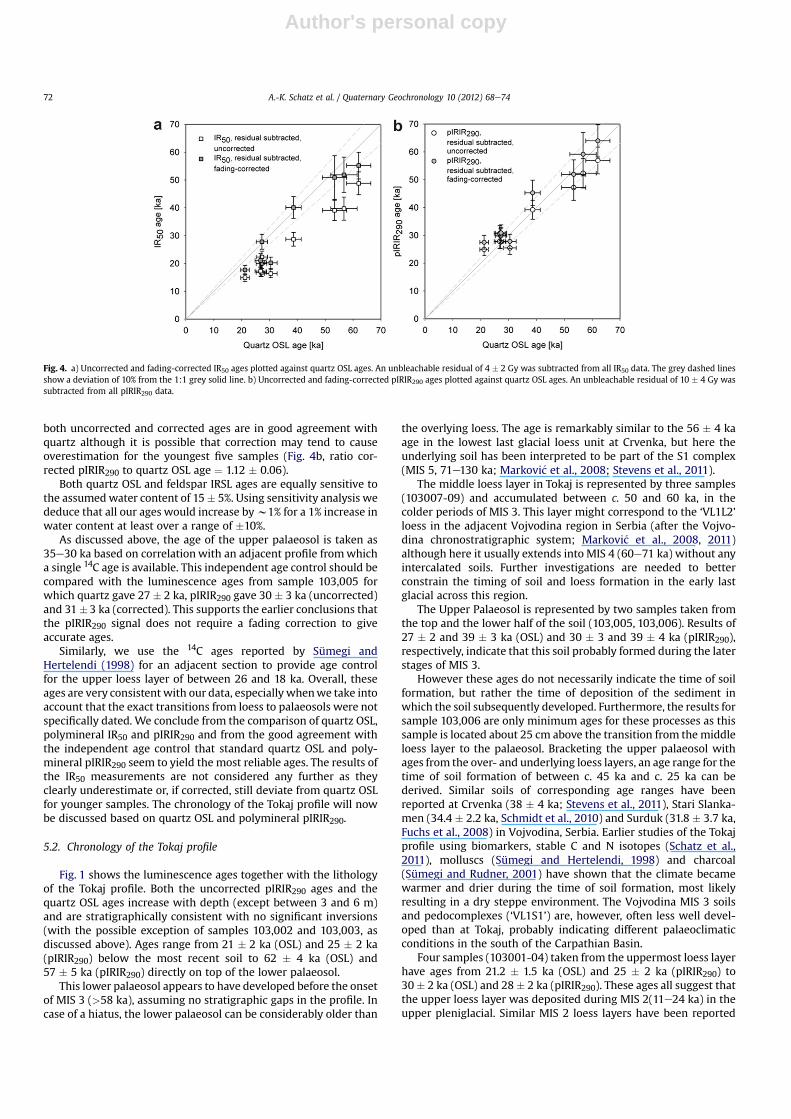
Fig. 4 shows the uncorrected and corrected IR50 and post-IRIR290 ages (including correction for residual doses) plotted againstquartz OSL ages. For the five youngest samples (lab codes 103001-103005; dose range 70e130 Gy) we consider quartz OSL ages asreliable independent age control. The oldest three samples (labcodes 103007-103009) have quartz doses around 200 Gy withnatural signals at w70% of saturation, and we are less confident ofthe accuracy of these ages.
From Fig. 4a it can be seen that the uncorrected IR50 ages clearlyunderestimate compared to quartz OSL ages over the entire agerange (20e60 ka). Fading correction appears to overcome most ofthe underestimation for the older samples but, surprisingly, at leastfor three young samples the correction is not sufficient. For pIRIR290
Fig. 3. Results of laboratory (Hönle SOL2 simulator) and daylight bleaching experi-ments for the IR50 (triangles) and pIRIR290 (circles) signals. Three aliquots weremeasured per sample (error bars represent 1 s.e.). Extrapolating the regression line tozero age gives 8 � 2 and 12 � 2 Gy for pIRIR290 and 4 � 2 Gy for IR50.
A.-K. Schatz et al. / Quaternary Geochronology 10 (2012) 68e74 71
Author's personal copy
both uncorrected and corrected ages are in good agreement withquartz although it is possible that correction may tend to causeoverestimation for the youngest five samples (Fig. 4b, ratio cor-rected pIRIR290 to quartz OSL age ¼ 1.12 � 0.06).
Both quartz OSL and feldspar IRSL ages are equally sensitive tothe assumedwater content of 15� 5%. Using sensitivity analysis wededuce that all our ages would increase byw1% for a 1% increase inwater content at least over a range of �10%.
As discussed above, the age of the upper palaeosol is taken as35e30 ka based on correlation with an adjacent profile fromwhicha single 14C age is available. This independent age control should becompared with the luminescence ages from sample 103,005 forwhich quartz gave 27 � 2 ka, pIRIR290 gave 30 � 3 ka (uncorrected)and 31�3 ka (corrected). This supports the earlier conclusions thatthe pIRIR290 signal does not require a fading correction to giveaccurate ages.
Similarly, we use the 14C ages reported by Sümegi andHertelendi (1998) for an adjacent section to provide age controlfor the upper loess layer of between 26 and 18 ka. Overall, theseages are very consistent with our data, especially whenwe take intoaccount that the exact transitions from loess to palaeosols were notspecifically dated. We conclude from the comparison of quartz OSL,polymineral IR50 and pIRIR290 and from the good agreement withthe independent age control that standard quartz OSL and poly-mineral pIRIR290 seem to yield the most reliable ages. The results ofthe IR50 measurements are not considered any further as theyclearly underestimate or, if corrected, still deviate from quartz OSLfor younger samples. The chronology of the Tokaj profile will nowbe discussed based on quartz OSL and polymineral pIRIR290.
5.2. Chronology of the Tokaj profile
Fig. 1 shows the luminescence ages together with the lithologyof the Tokaj profile. Both the uncorrected pIRIR290 ages and thequartz OSL ages increase with depth (except between 3 and 6 m)and are stratigraphically consistent with no significant inversions(with the possible exception of samples 103,002 and 103,003, asdiscussed above). Ages range from 21 � 2 ka (OSL) and 25 � 2 ka(pIRIR290) below the most recent soil to 62 � 4 ka (OSL) and57 � 5 ka (pIRIR290) directly on top of the lower palaeosol.
This lower palaeosol appears to have developed before the onsetof MIS 3 (>58 ka), assuming no stratigraphic gaps in the profile. Incase of a hiatus, the lower palaeosol can be considerably older than
the overlying loess. The age is remarkably similar to the 56 � 4 kaage in the lowest last glacial loess unit at Crvenka, but here theunderlying soil has been interpreted to be part of the S1 complex(MIS 5, 71e130 ka; Markovi�c et al., 2008; Stevens et al., 2011).
The middle loess layer in Tokaj is represented by three samples(103007-09) and accumulated between c. 50 and 60 ka, in thecolder periods of MIS 3. This layer might correspond to the ‘VL1L2’loess in the adjacent Vojvodina region in Serbia (after the Vojvo-dina chronostratigraphic system; Markovi�c et al., 2008, 2011)although here it usually extends into MIS 4 (60e71 ka) without anyintercalated soils. Further investigations are needed to betterconstrain the timing of soil and loess formation in the early lastglacial across this region.
The Upper Palaeosol is represented by two samples taken fromthe top and the lower half of the soil (103,005, 103,006). Results of27 � 2 and 39 � 3 ka (OSL) and 30 � 3 and 39 � 4 ka (pIRIR290),respectively, indicate that this soil probably formed during the laterstages of MIS 3.
However these ages do not necessarily indicate the time of soilformation, but rather the time of deposition of the sediment inwhich the soil subsequently developed. Furthermore, the results forsample 103,006 are only minimum ages for these processes as thissample is located about 25 cm above the transition from the middleloess layer to the palaeosol. Bracketing the upper palaeosol withages from the over- and underlying loess layers, an age range for thetime of soil formation of between c. 45 ka and c. 25 ka can bederived. Similar soils of corresponding age ranges have beenreported at Crvenka (38 � 4 ka; Stevens et al., 2011), Stari Slanka-men (34.4 � 2.2 ka, Schmidt et al., 2010) and Surduk (31.8 � 3.7 ka,Fuchs et al., 2008) in Vojvodina, Serbia. Earlier studies of the Tokajprofile using biomarkers, stable C and N isotopes (Schatz et al.,2011), molluscs (Sümegi and Hertelendi, 1998) and charcoal(Sümegi and Rudner, 2001) have shown that the climate becamewarmer and drier during the time of soil formation, most likelyresulting in a dry steppe environment. The Vojvodina MIS 3 soilsand pedocomplexes (‘VL1S1’) are, however, often less well devel-oped than at Tokaj, probably indicating different palaeoclimaticconditions in the south of the Carpathian Basin.
Four samples (103001-04) taken from the uppermost loess layerhave ages from 21.2 � 1.5 ka (OSL) and 25 � 2 ka (pIRIR290) to30� 2 ka (OSL) and 28 � 2 ka (pIRIR290). These ages all suggest thatthe upper loess layer was deposited during MIS 2(11e24 ka) in theupper pleniglacial. Similar MIS 2 loess layers have been reported
Fig. 4. a) Uncorrected and fading-corrected IR50 ages plotted against quartz OSL ages. An unbleachable residual of 4 � 2 Gy was subtracted from all IR50 data. The grey dashed linesshow a deviation of 10% from the 1:1 grey solid line. b) Uncorrected and fading-corrected pIRIR290 ages plotted against quartz OSL ages. An unbleachable residual of 10 � 4 Gy wassubtracted from all pIRIR290 data.
A.-K. Schatz et al. / Quaternary Geochronology 10 (2012) 68e7472
Author's personal copy
from the Vojvodina region (‘V L1L1’ loess) (Fuchs et al., 2008;Schmidt et al., 2010; Stevens et al., 2011), as well as from otherlocations in Hungary (Novothny et al., 2011). According to Sümegiand Hertelendi (1998) the upper loess layer was deposited from29 ka BP, which is compatible with our data, but is also hypothe-sized to cover the period until w13,000 yrs ago, although there isno radiocarbon age in their publication that confirms thisassumption. However, our youngest OSL age is 21.2 � 1.5 ka, whichclearly indicates that loess deposition either ended around 20 ka orthat younger loess layers have been eroded or overprinted byHolocene pedogenesis.
5.3. Sedimentation rates and implications for proxy records
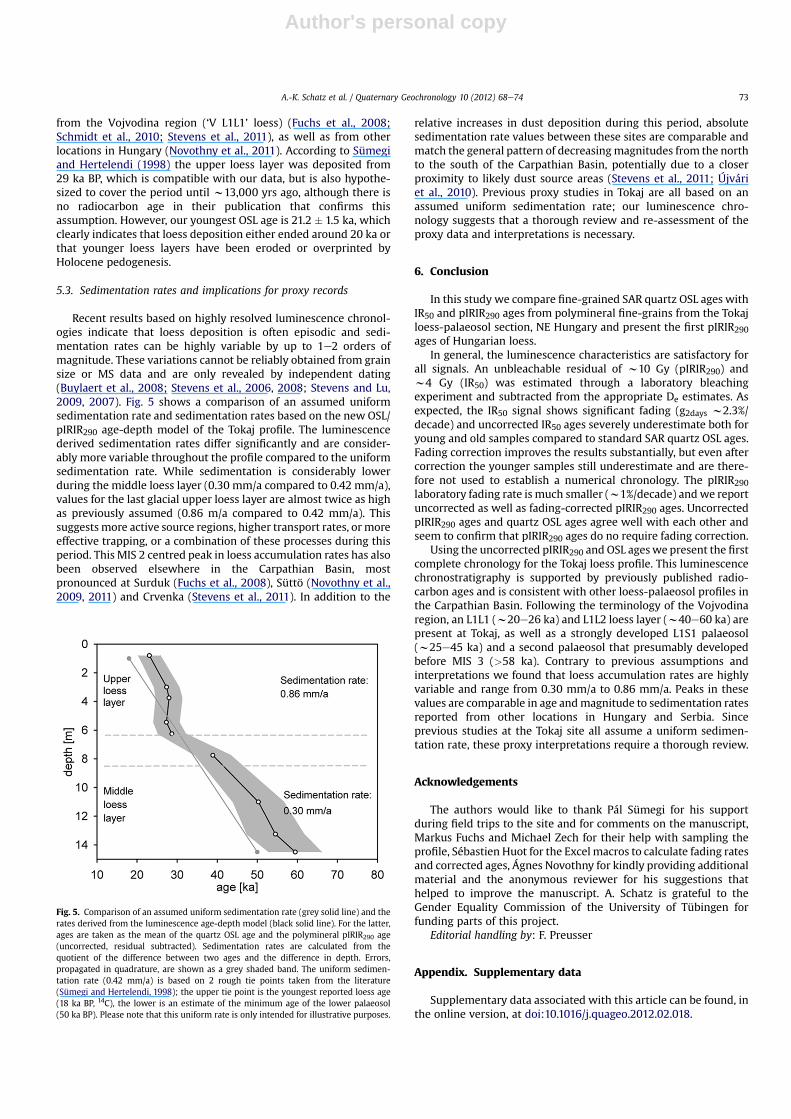
Recent results based on highly resolved luminescence chronol-ogies indicate that loess deposition is often episodic and sedi-mentation rates can be highly variable by up to 1e2 orders ofmagnitude. These variations cannot be reliably obtained from grainsize or MS data and are only revealed by independent dating(Buylaert et al., 2008; Stevens et al., 2006, 2008; Stevens and Lu,2009, 2007). Fig. 5 shows a comparison of an assumed uniformsedimentation rate and sedimentation rates based on the new OSL/pIRIR290 age-depth model of the Tokaj profile. The luminescencederived sedimentation rates differ significantly and are consider-ably more variable throughout the profile compared to the uniformsedimentation rate. While sedimentation is considerably lowerduring the middle loess layer (0.30 mm/a compared to 0.42 mm/a),values for the last glacial upper loess layer are almost twice as highas previously assumed (0.86 m/a compared to 0.42 mm/a). Thissuggests more active source regions, higher transport rates, or moreeffective trapping, or a combination of these processes during thisperiod. This MIS 2 centred peak in loess accumulation rates has alsobeen observed elsewhere in the Carpathian Basin, mostpronounced at Surduk (Fuchs et al., 2008), Süttö (Novothny et al.,2009, 2011) and Crvenka (Stevens et al., 2011). In addition to the
relative increases in dust deposition during this period, absolutesedimentation rate values between these sites are comparable andmatch the general pattern of decreasingmagnitudes from the northto the south of the Carpathian Basin, potentially due to a closerproximity to likely dust source areas (Stevens et al., 2011; Újváriet al., 2010). Previous proxy studies in Tokaj are all based on anassumed uniform sedimentation rate; our luminescence chro-nology suggests that a thorough review and re-assessment of theproxy data and interpretations is necessary.
6. Conclusion
In this study we compare fine-grained SAR quartz OSL ages withIR50 and pIRIR290 ages from polymineral fine-grains from the Tokajloess-palaeosol section, NE Hungary and present the first pIRIR290ages of Hungarian loess.
In general, the luminescence characteristics are satisfactory forall signals. An unbleachable residual of w10 Gy (pIRIR290) andw4 Gy (IR50) was estimated through a laboratory bleachingexperiment and subtracted from the appropriate De estimates. Asexpected, the IR50 signal shows significant fading (g2days w2.3%/decade) and uncorrected IR50 ages severely underestimate both foryoung and old samples compared to standard SAR quartz OSL ages.Fading correction improves the results substantially, but even aftercorrection the younger samples still underestimate and are there-fore not used to establish a numerical chronology. The pIRIR290laboratory fading rate is much smaller (w1%/decade) and we reportuncorrected as well as fading-corrected pIRIR290 ages. UncorrectedpIRIR290 ages and quartz OSL ages agree well with each other andseem to confirm that pIRIR290 ages do no require fading correction.
Using the uncorrected pIRIR290 and OSL ageswe present the firstcomplete chronology for the Tokaj loess profile. This luminescencechronostratigraphy is supported by previously published radio-carbon ages and is consistent with other loess-palaeosol profiles inthe Carpathian Basin. Following the terminology of the Vojvodinaregion, an L1L1 (w20e26 ka) and L1L2 loess layer (w40e60 ka) arepresent at Tokaj, as well as a strongly developed L1S1 palaeosol(w25e45 ka) and a second palaeosol that presumably developedbefore MIS 3 (>58 ka). Contrary to previous assumptions andinterpretations we found that loess accumulation rates are highlyvariable and range from 0.30 mm/a to 0.86 mm/a. Peaks in thesevalues are comparable in age andmagnitude to sedimentation ratesreported from other locations in Hungary and Serbia. Sinceprevious studies at the Tokaj site all assume a uniform sedimen-tation rate, these proxy interpretations require a thorough review.
Acknowledgements
The authors would like to thank Pál Sümegi for his supportduring field trips to the site and for comments on the manuscript,Markus Fuchs and Michael Zech for their help with sampling theprofile, Sébastien Huot for the Excel macros to calculate fading ratesand corrected ages, Ágnes Novothny for kindly providing additionalmaterial and the anonymous reviewer for his suggestions thathelped to improve the manuscript. A. Schatz is grateful to theGender Equality Commission of the University of Tübingen forfunding parts of this project.
Editorial handling by: F. Preusser
Appendix. Supplementary data
Supplementary data associated with this article can be found, inthe online version, at doi:10.1016/j.quageo.2012.02.018.
Fig. 5. Comparison of an assumed uniform sedimentation rate (grey solid line) and therates derived from the luminescence age-depth model (black solid line). For the latter,ages are taken as the mean of the quartz OSL age and the polymineral pIRIR290 age(uncorrected, residual subtracted). Sedimentation rates are calculated from thequotient of the difference between two ages and the difference in depth. Errors,propagated in quadrature, are shown as a grey shaded band. The uniform sedimen-tation rate (0.42 mm/a) is based on 2 rough tie points taken from the literature(Sümegi and Hertelendi, 1998); the upper tie point is the youngest reported loess age(18 ka BP, 14C), the lower is an estimate of the minimum age of the lower palaeosol(50 ka BP). Please note that this uniform rate is only intended for illustrative purposes.
A.-K. Schatz et al. / Quaternary Geochronology 10 (2012) 68e74 73
Author's personal copy
References
Aitken, M.J., 1985. Thermoluminescence Dating. Academic Press, London.Ballarini, M., Wallinga, J., Wintle, A.G., Bos, A.J.J., 2007. A modified SAR protocol for
optical dating of individual grains from young quartz samples. RadiationMeasurements 42, 360e369.
Buylaert, J.-P., Thiel, C., Murray, A., Vandenberghe, D., Yi, S., Lu, H., 2011. IRSL andpost-IR IRSL residual doses recorded in modern dust samples from the ChineseLoess Plateau. Geochronometria 38, 432e440.
Buylaert, J.P., Jain, M., Murray, A.S., Thomsen, K.J., Thiel, C., Sohbati, R., 2012.A robust feldspar luminescence dating method for Middle and Late Pleistocenesediments. Boreas. doi:10.1111/j.1502-3885.2012.00248.x.
Buylaert, J.P., Murray, A.S., Vandenberghe, D., Vriend, M., De Corte, F., Van denhaute, P., 2008. Optical dating of Chinese loess using sand-sized quartz:establishing a time frame for Late Pleistocene climate changes in the westernpart of the Chinese Loess Plateau. Quaternary Geochronology 3, 99e113.
Danzeglocke, U., Jöris, O., Wenninger, B., 2011. CalPal-2007 (online).Duller, G.A.T., 2003. Distinguishing quartz and feldspar in single grain luminescence
measurements. Radiation Measurements 37, 161e165.Frechen, M., Horváth, E., Gábris, Gy, 1997. Geochronology of middle and upper
Pleistocene loess sections in Hungary. Quaternary Research 48, 291e312.Frechen, M., Dodonov, A.E., 1998. Loess chronology of the middle and upper
Pleistocene in Tadjikistan. Geologische Rundschau 87, 2e20.Frechen, M., Kehl, M., Rolf, C., Sarvati, R., Skowronek, A., 2009. Loess chronology of
the Caspian Lowland in Northern Iran. Quaternary International 198, 220e233.Fuchs, M., Rousseau, D.-D., Antoine, P., Hatté, C., Gauthier, C., Markovi�c, S., Zoeller, L.,
2008. Chronology of the last Climatic cycle (Upper Pleistocene) of the Surdukloess sequence, Vojvodina, Serbia. Boreas 37, 66e73.
Huntley, D.J., Lamothe, M., 2001. Ubiquity of anomalous fading in K-feldspars andthe measurement and correction for it in optical dating. Canadian Journal ofEarth Sciences 38, 1093e1106.
Machalett, B., Oches, E.A., Frechen, M., Zöller, L., Hambach, U., Mavlyanova, N.G.,Markovi, B.S., Endlicher, W., 2008. Aeolian dust dynamics in central Asia duringthe Pleistocene: driven by the long-term migration, seasonality, and perma-nency of the Asiatic polar front. Geochemistry, Geophysics, Geosystems 9,Q08eQ09.
Markovi�c, S.B., Bokhorst, M.P., Vandenberghe, J., McCoy, W.D., Oches, E.A.,Hambach, U., Gaudenyi, T., Jovanovi�c, M., Zöller, L., Stevens, T., Machalett, B.,2008. Late Pleistocene loess-palaeosol sequences in the Vojvodina region, northSerbia. Journal of Quaternary Science 23, 73e84.
Markovi�c, S.B., Hambach, U., Stevens, T., Kukla, G.J., Heller, F., McCoy, W.D.,Oches, E.A., Buggle, B., Zöller, L., 2011. The last million years recorded at the StariSlankamen (Northern Serbia) loess-palaeosol sequence: revised chro-nostratigraphy and long-term environmental trends. Quaternary ScienceReviews 30, 1142e1154.
Murray, A., Marten, R., Johnston, A., Martin, P., 1987. Analysis for naturally occurringradionuclides at environmental concentrations by gamma spectrometry. Jour-nal of Radioanalytical and Nuclear Chemistry 115, 263e288.
Murray, A.S., Wintle, A.G., 2003. The single aliquot regenerative dose protocol:potential for improvements in reliability. Radiation Measurements 37, 377e381.
Novothny, Á., Frechen, M., Horváth, E., Bradák, B., Oches, E.A., McCoy, W.D.,Stevens, T., 2009. Luminescence and amino acid racemization chronology of theloessepaleosol sequence at Sütt}o, Hungary. Quaternary International 198,62e76.
Novothny, Á., Frechen, M., Horváth, E., Krbetschek, M., Tsukamoto, S., 2010. Infraredstimulated luminescence and radio fluorescence dating of aeolian sedimentsfrom Hungary. Quaternary Geochronology 5, 114e119.
Novothny, Á., Frechen, M., Horváth, E., Wacha, L., Rolf, C., 2011. Investigating thepenultimate and last glacial cycles of the Sütt}o loess section (Hungary) using
luminescence dating, high-resolution grain size, and magnetic susceptibilitydata. Quaternary International 234, 75e85.
Olley, J.M., Murray, A., Roberts, R.G., 1996. The effects of disequilibria in the uraniumand thorium decay chains on burial dose rates in fluvial sediments. QuaternaryScience Reviews 15, 751e760.
Rees-Jones, J., 1995. Optical dating of young sediments using fine-grain quartz.Ancient TL 13, 9e14.
Rudner, Z.E., Sümegi, P., 2001. Recurring Taiga forest-steppe habitats in the Carpa-thian Basin in the upper Weichselian. Quaternary International 76-77, 177e189.
Schatz, A.-K., Zech, M., Buggle, B., Gulyás, S., Hambach, U., Markovi�c, S.B., Sümegi, P.,Scholten, T., 2011. The late Quaternary loess record of Tokaj, Hungary: recon-structing palaeoenvironment, vegetation and climate using stable C and Nisotopes and biomarkers. Quaternary International 240, 52e61.
Schmidt, E.D., Machalett, B., Markovi�c, S.B., Tsukamoto, S., Frechen, M., 2010.Luminescence chronology of the upper part of the Stari Slankamen loesssequence (Vojvodina, Serbia). Quaternary Geochronology 5, 137e142.
Sohbati, R., Murray, A.S., Buylaert, J.-P., Ortuño, M., Cunha, P.P., Masana, E., 2011.Luminescence dating of Pleistocene alluvial sediments affected by the Alhamade Murcia fault (eastern Betics, Spain) e a comparison between OSL, IRSL andpost-IRIRSL ages. Boreas. doi:10.1111/j.1502e3885.2012.00249.x.
Stevens, T., Armitage, S.J., Lu, H., Thomas, D.S.G., 2006. Sedimentation and diagen-esis of Chinese loess: implications for the preservation of continuous, high-resolution climate records. Geology 34, 849e852.
Stevens, T., Lu, H., 2009. Optically stimulated luminescence dating as a tool forcalculating sedimentation rates in Chinese loess: comparisons with grain-sizerecords. Sedimentology 56, 911e934.
Stevens, T., Lu, H., Thomas, D.S.G., Armitage, S.J., 2008. Optical dating of abrupt shiftsin the late Pleistocene East Asian monsoon. Geology 36, 415e418.
Stevens, T., Markovi�c, S.B., Zech, M., Hambach, U., Sümegi, P., 2011. Dust depositionand climate in the Carpathian Basin over an independently dated last gla-cialeinterglacial cycle. Quaternary Science Reviews 30, 662e681.
Stevens, T., Thomas, D.S.G., Armitage, S.J., Lunn, H.R., Lu, H., 2007. Reinterpretingclimate proxy records from late Quaternary Chinese loess: a detailed OSLinvestigation. Earth Science Reviews 80, 111e136.
Sümegi, P., Hertelendi, E., 1998. Reconstruction of microenvironmental changes inthe Kopasz Hill loess area at Tokaj (Hungary) between 15 and 70 ka BP.Radiocarbon 40, 855e863.
Sümegi, P., Krolopp, E., 2002. Quatermalacological analyses for modeling of theUpper Weichselian palaeoenvironmental changes in the Carpathian Basin.Quaternary International 91, 53e63.
Sümegi, P., Rudner, Z.E., 2001. In situ charcoal fragments as remains of natural wildfires in the upper Würm of the Carpathian Basin. Quaternary International 76-77, 165e176.
Thiel, C., Buylaert, J.-P., Murray, A., Terhorst, B., Hofer, I., Tsukamoto, S., Frechen, M.,2011a. Luminescence dating of the Stratzing loess profile (Austria) e Testing thepotential of an elevated temperature post-IR IRSL protocol. Quaternary Inter-national 234, 23e31.
Thiel, C., Buylaert, J.-P., Murray, A., Tsukamoto, S., 2011b. On the applicability ofpost-IR IRSL dating to Japanese loess. Geochronometria 38, 369e378.
Thomsen, K.J., Murray, A.S., Jain, M., Bøtter-Jensen, L., 2008. Laboratory fading ratesof various luminescence signals from feldspar-rich sediment extracts. RadiationMeasurements 43, 1474e1486.
Thomsen, K.J., Murray, A.S., Jain, M., 2011. Stability of IRSL signals from sedimentaryK-feldspar samples. Geochronometria 38, 1e13.
Újvári, G., Kovács, J., Varga, G., Raucsik, B., Markovi�c, S.B., 2010. Dust flux estimatesfor the Last Glacial Period in East Central Europe based on terrestrial records ofloess deposits: a review. Quaternary Science Reviews 29, 3157e3166.
Willis, K.J., Rudner, E., Sümegi, P., 2000. The full-glacial forests of central andSoutheastern Europe. Quaternary Research 53, 203e213.
A.-K. Schatz et al. / Quaternary Geochronology 10 (2012) 68e7474
Related Documents