Eddie Oldfield – March 20 th , 2012 Presentation at the OGC TC, to the OGC ESSDWG Appointed Member, Resilient Communities Working Group National Platform for Disaster Risk Reduction (Canada) Director www.nbhub.org at www.nb.lung.ca Senior Advisor www.questcanada.org Tel: 506-453-0887, Email [email protected] Interoperable Mapping of Health Information during pandemic and inter-pandemic periods

Welcome message from author
This document is posted to help you gain knowledge. Please leave a comment to let me know what you think about it! Share it to your friends and learn new things together.
Transcript
Eddie Oldfield – March 20th, 2012
Presentation at the OGC TC, to the OGC ESSDWG
Appointed Member, Resilient Communities Working Group
National Platform for Disaster Risk Reduction (Canada)
Director www.nbhub.org at www.nb.lung.ca
Senior Advisor www.questcanada.org
Tel: 506-453-0887, Email [email protected]
Interoperable Mapping of Health Information during pandemic and inter-pandemic periods
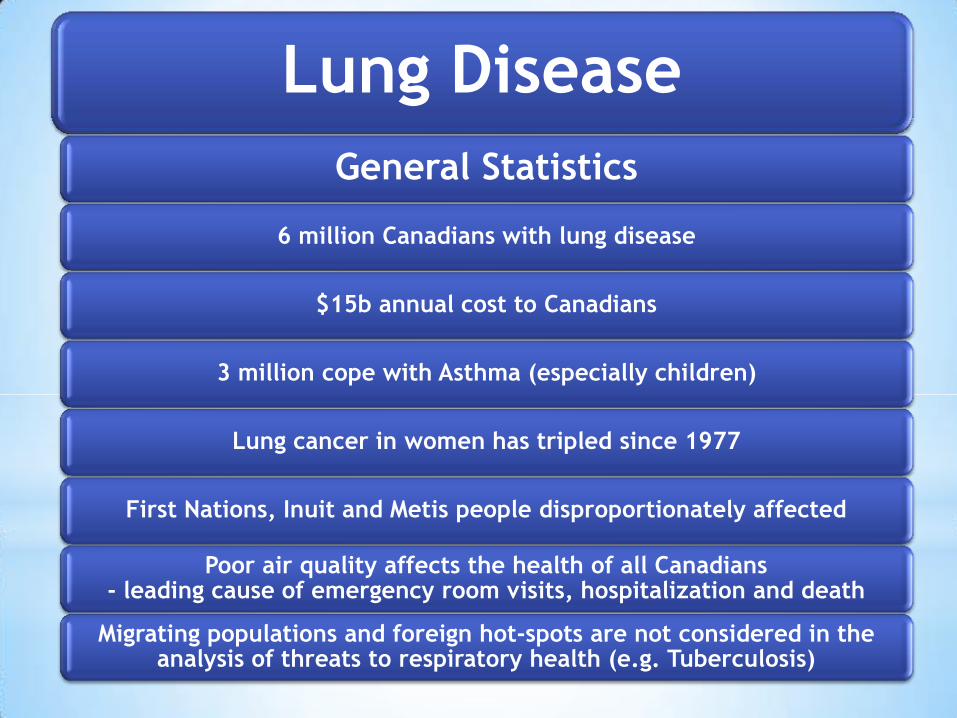
Lung Disease
General Statistics
6 million Canadians with lung disease
$15b annual cost to Canadians
3 million cope with Asthma (especially children)
Lung cancer in women has tripled since 1977
First Nations, Inuit and Metis people disproportionately affected
Poor air quality affects the health of all Canadians - leading cause of emergency room visits, hospitalization and death
Migrating populations and foreign hot-spots are not considered in the analysis of threats to respiratory health (e.g. Tuberculosis)
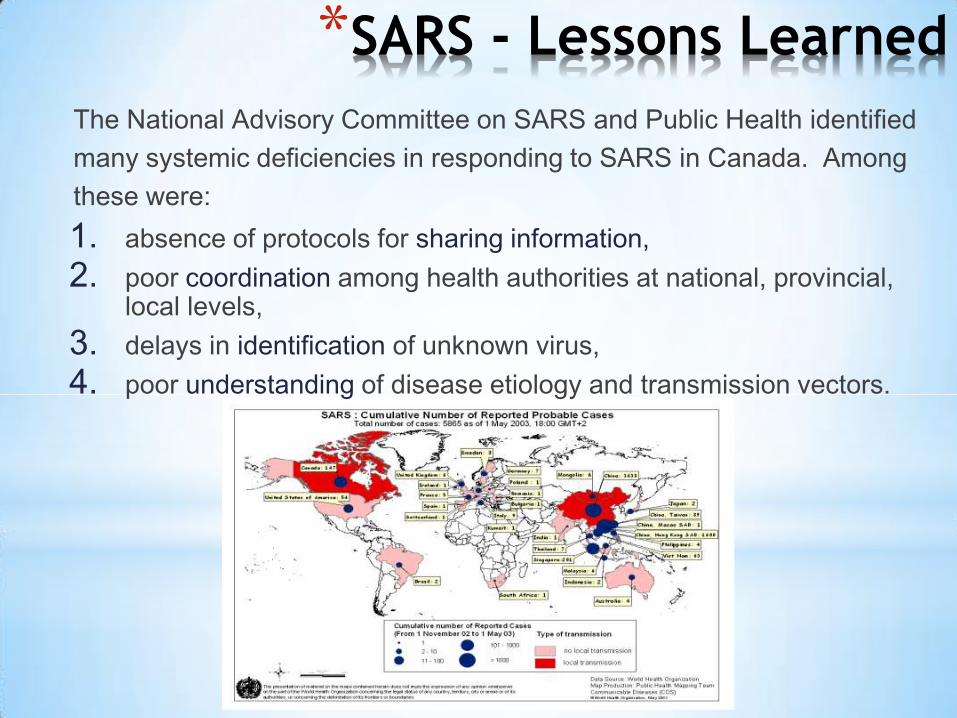
*SARS - Lessons Learned
The National Advisory Committee on SARS and Public Health identified
many systemic deficiencies in responding to SARS in Canada. Among
these were:
1. absence of protocols for sharing information,
2. poor coordination among health authorities at national, provincial, local levels,
3. delays in identification of unknown virus,
4. poor understanding of disease etiology and transmission vectors.

*Spatial Disease Epidemiology
*Baseline Influenza vs Pandemic Indicators (influenza sub-types)
*Transmissibility / Vectors / Spread
*Prevalence / Progression / Morbidity
*Vulnerable Populations
*Access to Health Care
*Vaccine Distribution
*Capacity / Demand Surge
*Affected Health Care Workers
*Social Impacts / Critical Infrastructure
electron microscope image of the Avian Flu Virus
From Micro
To Macro
1918

Policy
Research
Public awareness
Prevention
(Legislation, Behaviour Change,
Exposure Reduction, Risk
Communication)
Health care
(Detection/Diagnosis Primary care,
Community Support, Emergency
Preparedness)
Health outcomes
Surveillance, Monitoring
P
artn
ersh
ips
National &
International
Regional
Provincial
Determinants of Health
* Public Health Policy and Decision Making

Maps Can Help Us Make the Links
Heat Stress
Air Quality
Syndromic Surveillance
Hospitalization Costs
Public Health Resources
Health Indicators

What health data
will be available?
What health
indicators will be
available?
What specific
end-products
will result?
How will this benefit decision-making?

From Data to Maps Data
Licenses
Data Privacy
Data Models
Data Trends
Data Access
Data Integration
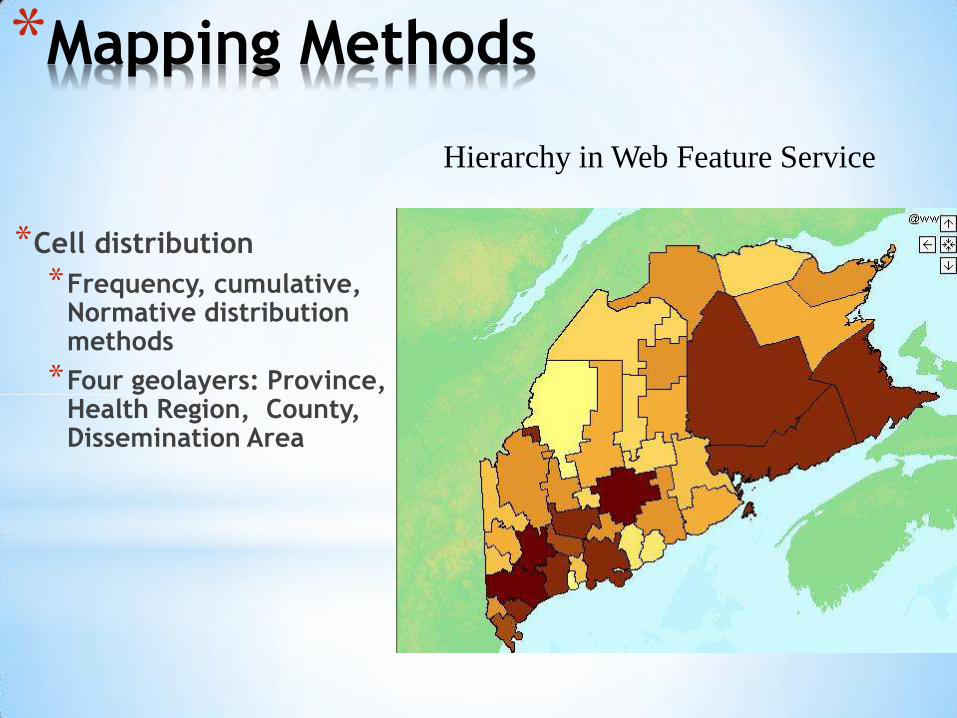
*Mapping Methods
*Cell distribution
*Frequency, cumulative, Normative distribution methods
*Four geolayers: Province, Health Region, County, Dissemination Area
Hierarchy in Web Feature Service

*Mapping Methods
*Contour distribution
*Inverse Distance Weighting method
*One geolayer: Province/State; with 4 boundary overlays (Health Region, County, Metropolitan, and DAUID levels)
*Mapping Methods
Hierarchy in Web Feature Service

Time series automation with time-tag in WMS

Quick Web Map Viewer (to consume WMS, WFS, WPS)
Operations Center / Remote Participants
Time series automation with time-tag in WMS
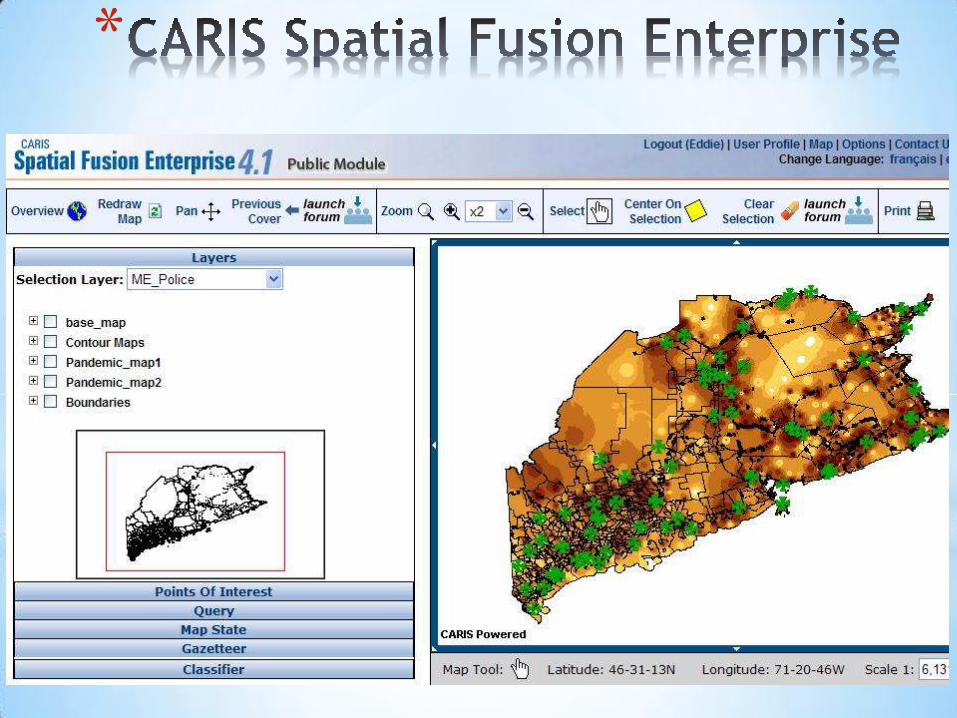
*

NBLA Web Mapping Portal OGC compliant web-mapping application provides access to
credible, closest to source, health, population, and environmental
indicators in support of decision-making
*
*
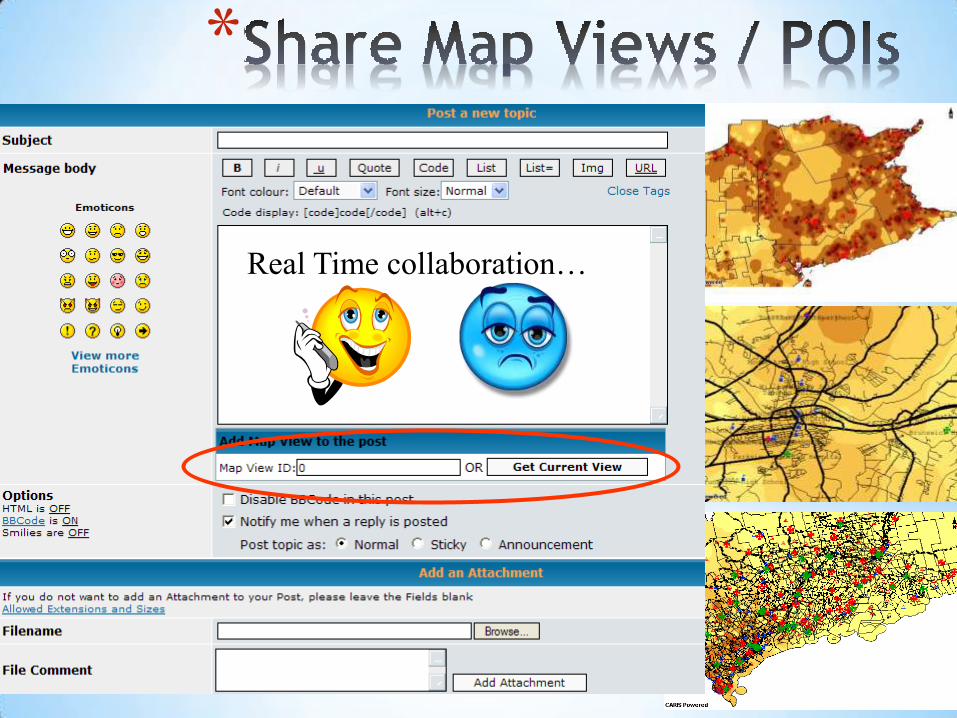
Real Time collaboration…
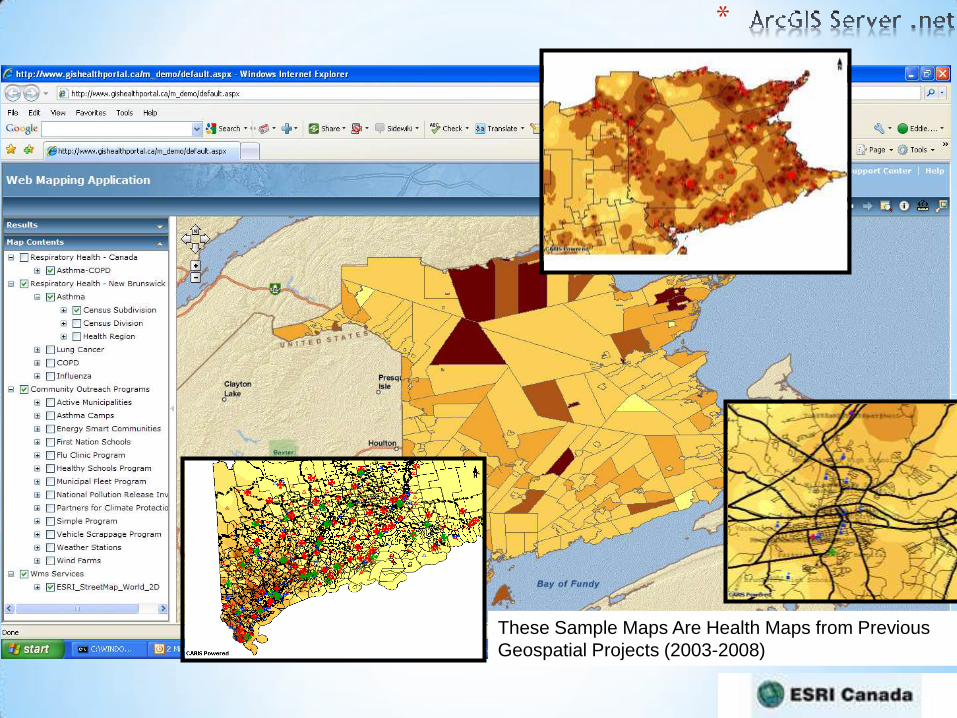
*
These Sample Maps Are Health Maps from Previous
Geospatial Projects (2003-2008)

*NB Lung’s Flu Clinic Locator
enables a public user to
search for the nearest flu
clinic in their Forward
Sortation Area (first three
alphanumeric characters in
the 6-digit postal code).
*

*The map will refresh on
the FSA location
chosen, with points
indicating the location
of nearby clinics.
*
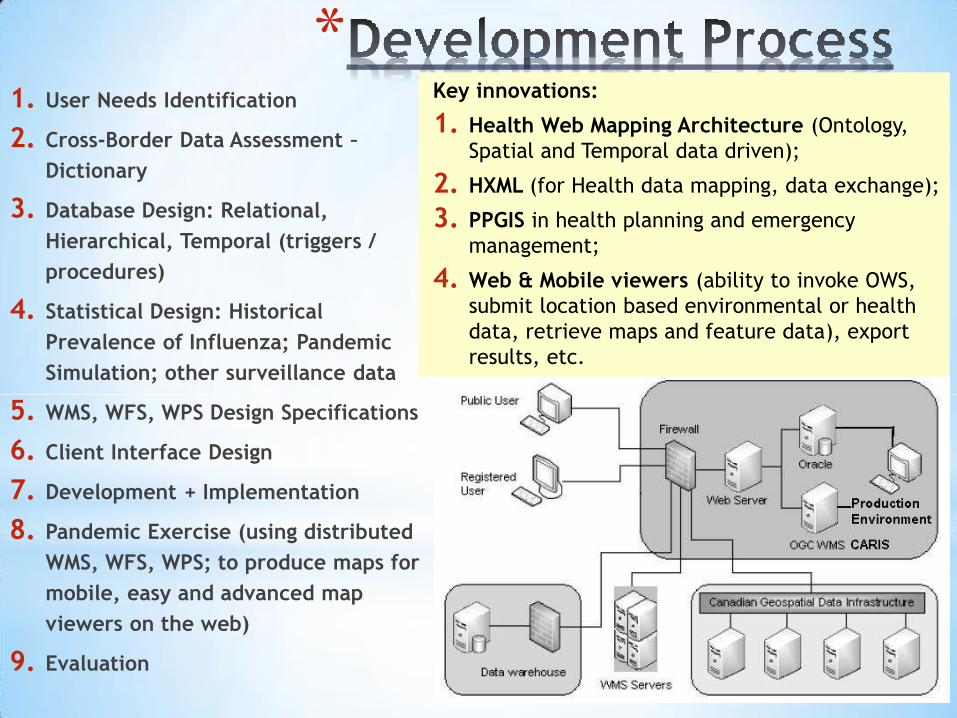
*1. User Needs Identification
2. Cross-Border Data Assessment –
Dictionary
3. Database Design: Relational,
Hierarchical, Temporal (triggers /
procedures)
4. Statistical Design: Historical
Prevalence of Influenza; Pandemic
Simulation; other surveillance data
5. WMS, WFS, WPS Design Specifications
6. Client Interface Design
7. Development + Implementation
8. Pandemic Exercise (using distributed
WMS, WFS, WPS; to produce maps for
mobile, easy and advanced map
viewers on the web)
9. Evaluation
Key innovations:
1. Health Web Mapping Architecture (Ontology,
Spatial and Temporal data driven);
2. HXML (for Health data mapping, data exchange);
3. PPGIS in health planning and emergency
management;
4. Web & Mobile viewers (ability to invoke OWS,
submit location based environmental or health
data, retrieve maps and feature data), export
results, etc.
*
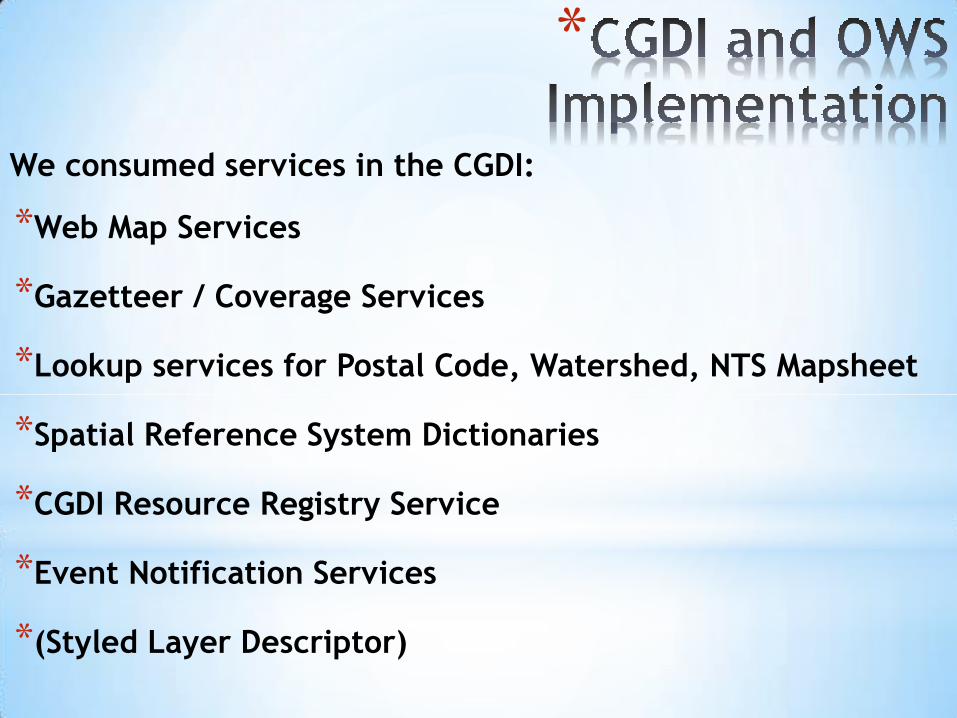
We consumed services in the CGDI:
*Web Map Services
*Gazetteer / Coverage Services
*Lookup services for Postal Code, Watershed, NTS Mapsheet
*Spatial Reference System Dictionaries
*CGDI Resource Registry Service
*Event Notification Services
*(Styled Layer Descriptor)

We Implemented OWS architecture for Health Mapping:
• WMS (with time tag), WFS (hierarchical model), WPS (web process services), SLD…
• Health XML (HXML) data model schema, enabling any health authority to publish into
Web Map Services or National Atlas
• Health Mapping relational data schema, Hierarchical schema (for Maine, New Brunswick,
all of Canada), Statistical DB automation and visualization for health or environmental data
• Application integration and mashup (consumed OWS, tools/features, availability through
browsers, web and mobile)
• Custom map viewer and features which enabled users to submit query parameters for WPS –
interact with the map – find and classify data – add points of interest, and export results.
• Custom map viewer for wrapping processes in dynamic interface that could be deployed on
any website or desktop
• Publication of maps and features in CARIS Spatial Fusion and ESRI ArcGIS Server (FLEX
and .net)
• Custom map viewer (Quick Map) for pandemic exercise
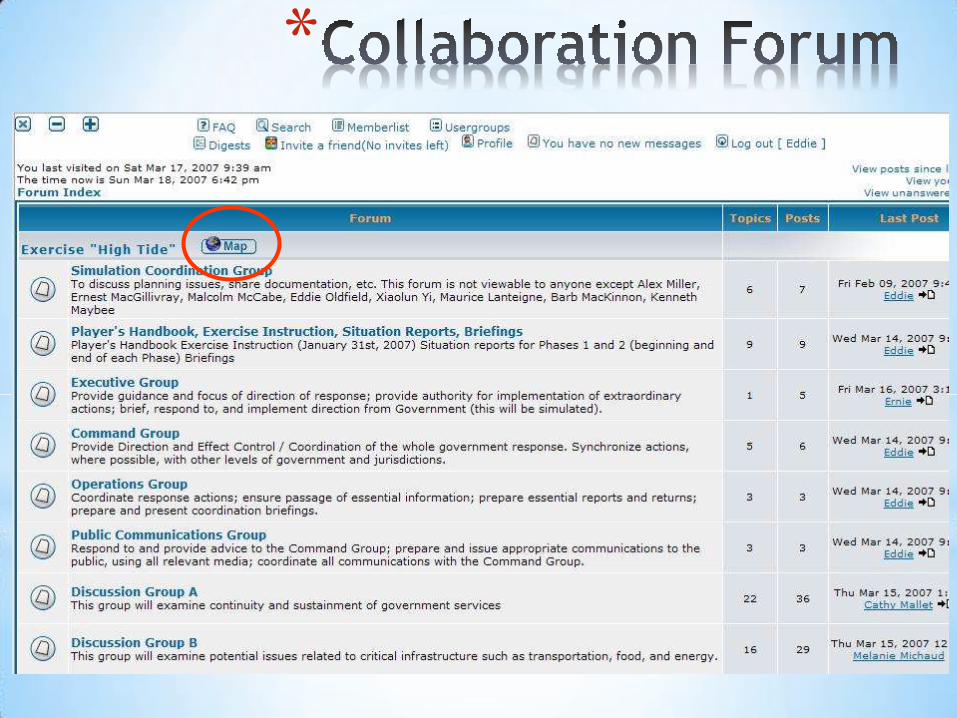
• Collaboration Forum including web map exchange (permissions based)
• Pandemic simulation (moderate style, 550,000 records, 12 weeks)
• 1,600 map layers published in CGDI
• Configuration and Administration modules, to publish or consume WMS/WFS, manage
user/content permissions
• Use authentication handled in the application (though we envisioned DRM at service level),
and services provisioned behind firewall, to high-speed fiber network
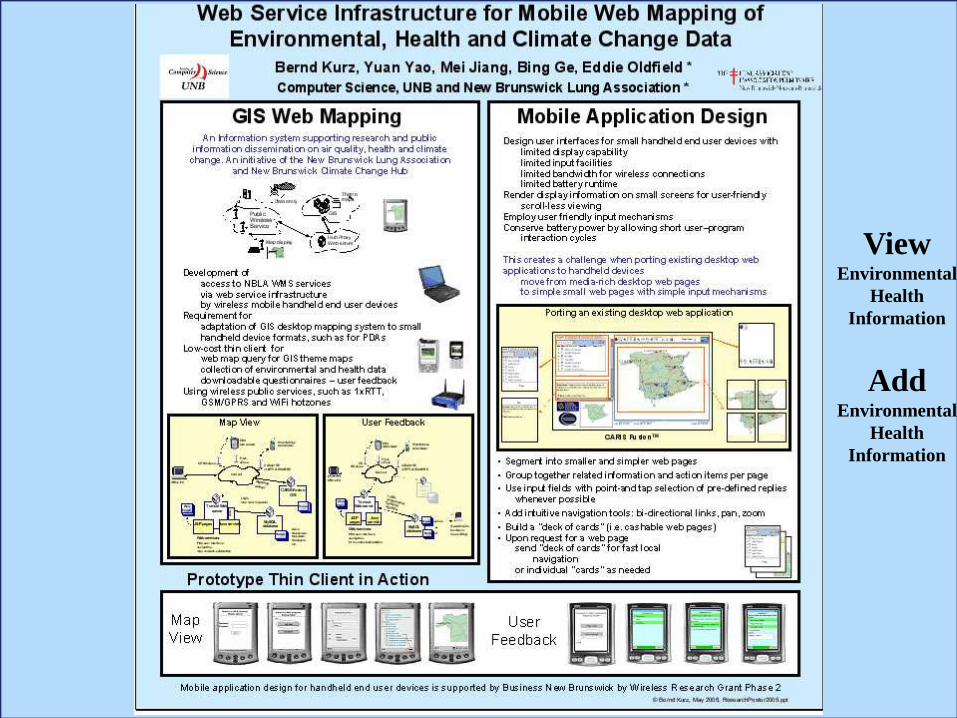
View
Environmental
Health
Information
Add Environmental
Health
Information
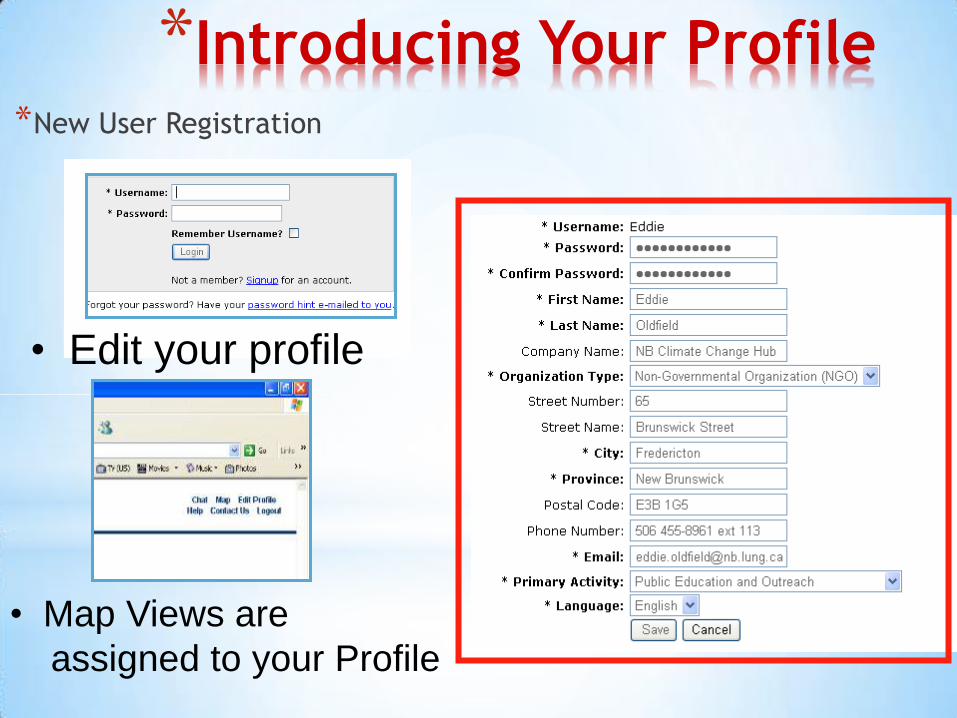
*Introducing Your Profile *New User Registration
• Edit your profile
• Map Views are
assigned to your Profile
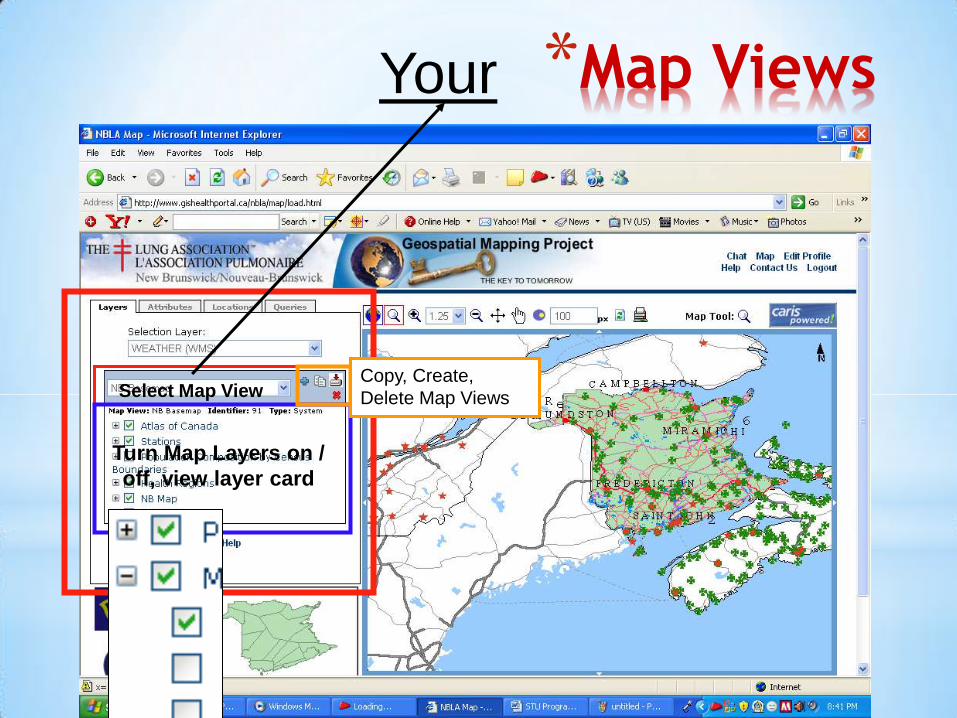
*Map Views Your
Turn Map Layers on /
off, view layer card
Select Map View Copy, Create,
Delete Map Views

*Map Views Your
Choose Selection
Layer


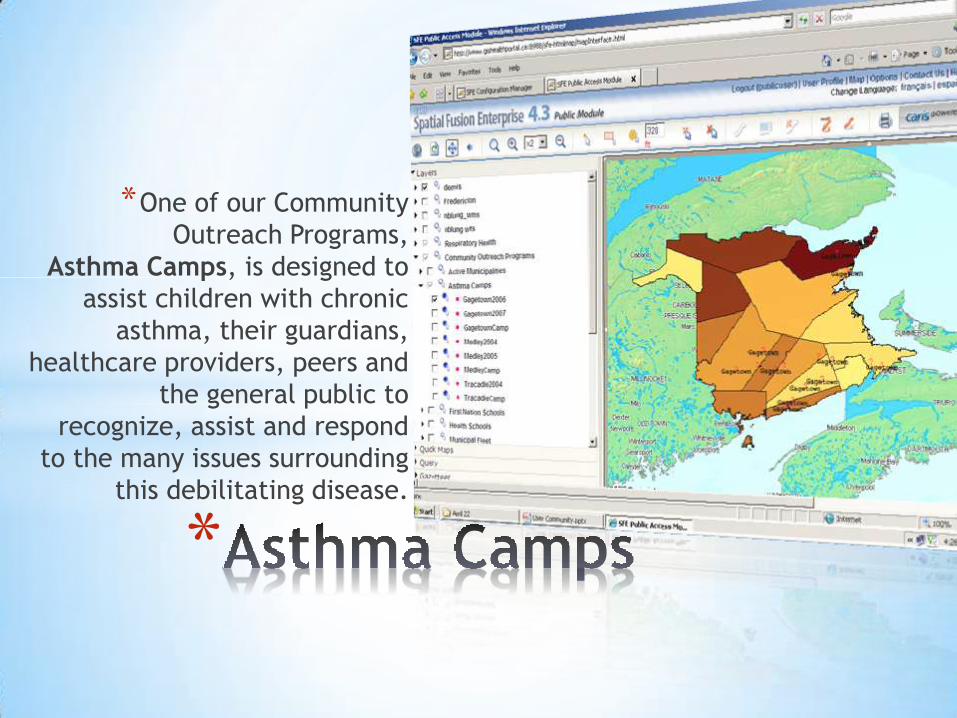
*One of our Community
Outreach Programs,
Asthma Camps, is designed to
assist children with chronic
asthma, their guardians,
healthcare providers, peers and
the general public to
recognize, assist and respond
to the many issues surrounding
this debilitating disease.
*

*When the spatial distribution
of Asthma Camp participants’
origins overlays the spatial
distribution of Asthma
hospitalization outcomes, our
program directors, project
funders, healthcare planners
and providers are readily able
to determine significant
historical gaps and future
opportunities for the Program.
*
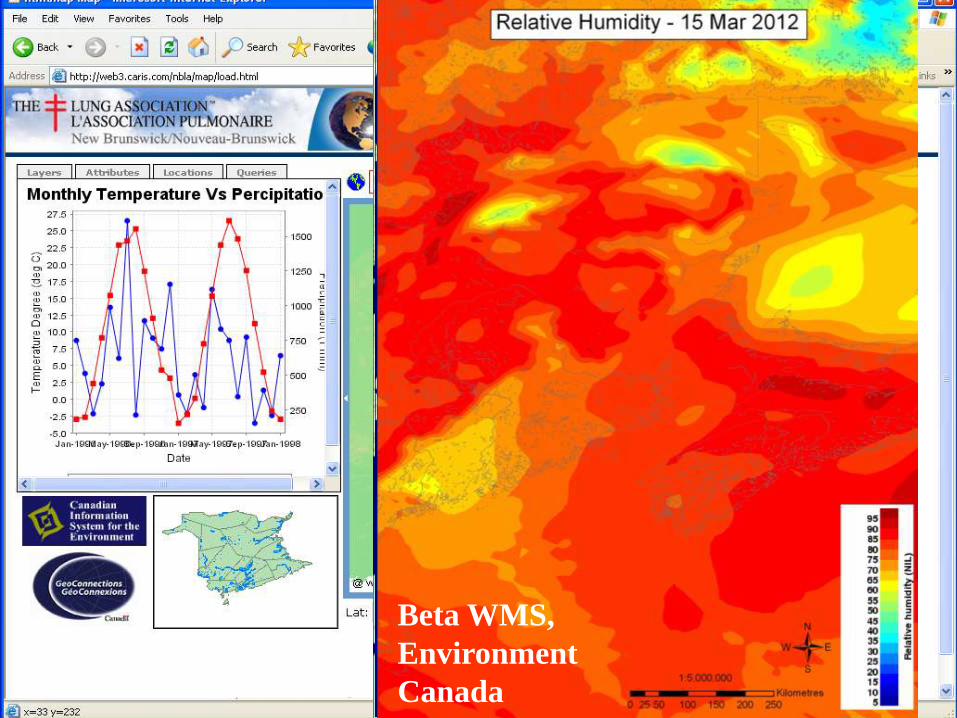
Beta WMS,
Environment
Canada
Theme
PopulationHealth trends
Vulnerablepopulations
links
Database
links
links
HighlightsFeatures
Best practices
1
2
3
4
5
6
7
8
9
10
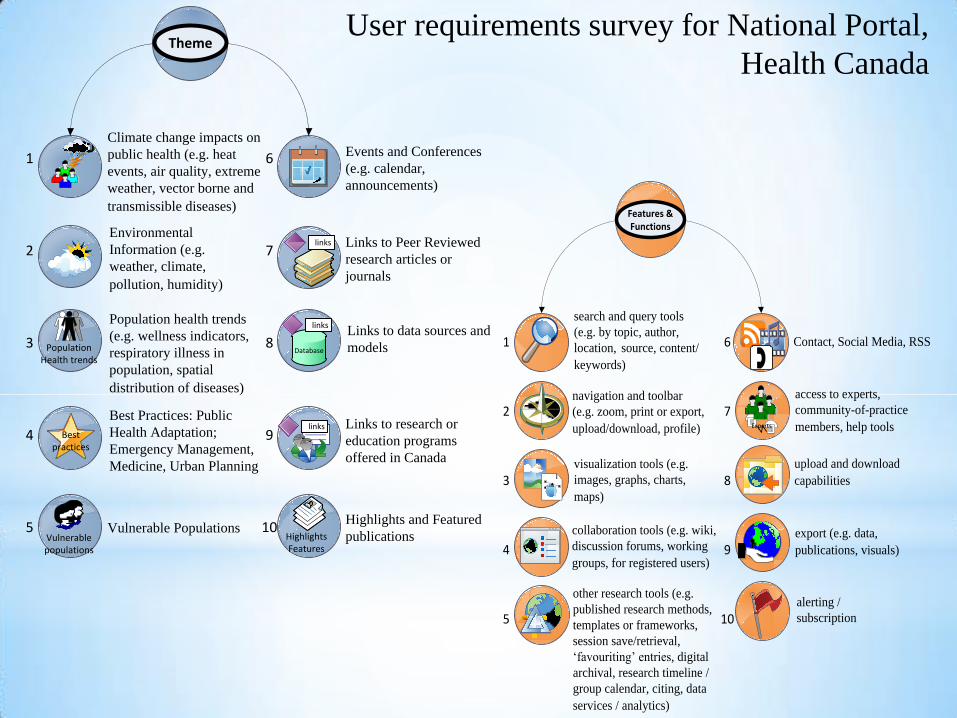
Climate change impacts on
public health (e.g. heat
events, air quality, extreme
weather, vector borne and
transmissible diseases)
Environmental
Information (e.g.
weather, climate,
pollution, humidity)
Population health trends
(e.g. wellness indicators,
respiratory illness in
population, spatial
distribution of diseases)
Best Practices: Public
Health Adaptation;
Emergency Management,
Medicine, Urban Planning
Vulnerable Populations
Events and Conferences
(e.g. calendar,
announcements)
Links to Peer Reviewed
research articles or
journals
Links to data sources and
models
Links to research or
education programs
offered in Canada
Highlights and Featured
publications
User requirements survey for National Portal,
Health Canada
Experts
search and query tools
(e.g. by topic, author,
location, source, content/
keywords)
navigation and toolbar
(e.g. zoom, print or export,
upload/download, profile)
visualization tools (e.g.
images, graphs, charts,
maps)
collaboration tools (e.g. wiki,
discussion forums, working
groups, for registered users)
other research tools (e.g.
published research methods,
templates or frameworks,
session save/retrieval,
‘favouriting’ entries, digital
archival, research timeline /
group calendar, citing, data
services / analytics)
Contact, Social Media, RSS
access to experts,
community-of-practice
members, help tools
upload and download
capabilities
export (e.g. data,
publications, visuals)
alerting /
subscription
1
2
3
4
5
6
7
8
9
10
Features & Functions
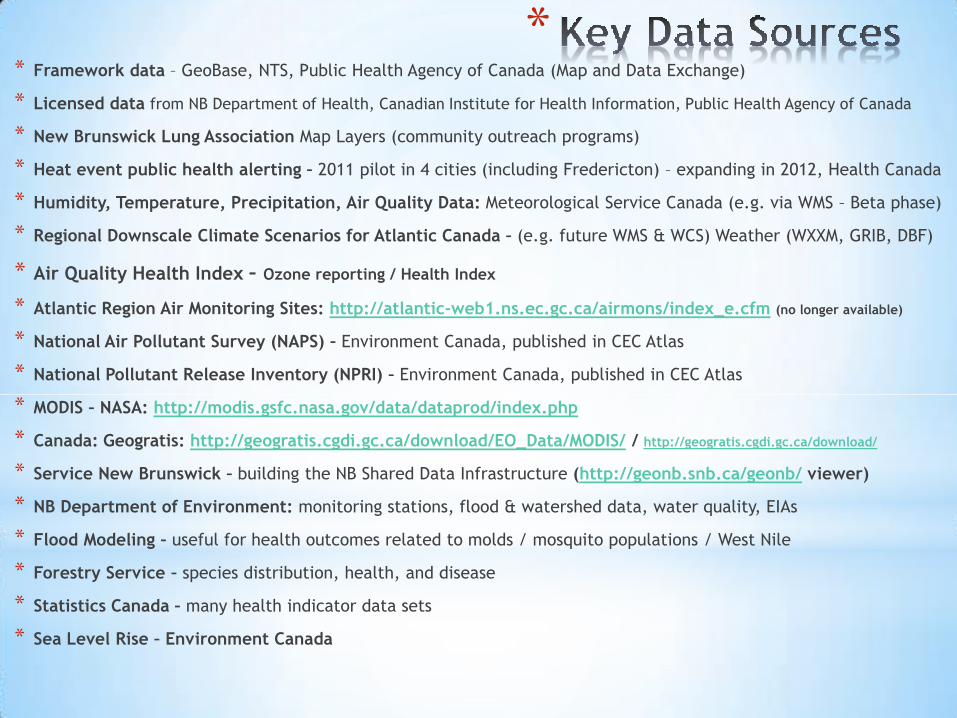
** Framework data – GeoBase, NTS, Public Health Agency of Canada (Map and Data Exchange)
* Licensed data from NB Department of Health, Canadian Institute for Health Information, Public Health Agency of Canada
* New Brunswick Lung Association Map Layers (community outreach programs)
* Heat event public health alerting – 2011 pilot in 4 cities (including Fredericton) – expanding in 2012, Health Canada
* Humidity, Temperature, Precipitation, Air Quality Data: Meteorological Service Canada (e.g. via WMS – Beta phase)
* Regional Downscale Climate Scenarios for Atlantic Canada – (e.g. future WMS & WCS) Weather (WXXM, GRIB, DBF)
* Air Quality Health Index – Ozone reporting / Health Index
* Atlantic Region Air Monitoring Sites: http://atlantic-web1.ns.ec.gc.ca/airmons/index_e.cfm (no longer available)
* National Air Pollutant Survey (NAPS) – Environment Canada, published in CEC Atlas
* National Pollutant Release Inventory (NPRI) – Environment Canada, published in CEC Atlas
* MODIS – NASA: http://modis.gsfc.nasa.gov/data/dataprod/index.php
* Canada: Geogratis: http://geogratis.cgdi.gc.ca/download/EO_Data/MODIS/ / http://geogratis.cgdi.gc.ca/download/
* Service New Brunswick – building the NB Shared Data Infrastructure (http://geonb.snb.ca/geonb/ viewer)
* NB Department of Environment: monitoring stations, flood & watershed data, water quality, EIAs
* Flood Modeling – useful for health outcomes related to molds / mosquito populations / West Nile
* Forestry Service – species distribution, health, and disease
* Statistics Canada – many health indicator data sets
* Sea Level Rise – Environment Canada

**Ambient Particulate Matter .5, 2.5, 10 * New Brunswick Lung Association conducts studies in partnership with health authorities to
determine exposure to ozone, PM, and other air pollutants
* monitoring real time exposures & emissions of Particulate Matter
* Fleet & Traffic-related pollution
* Residential and Commercial radon concentrations
* Airborne Fungal Concentrations in Public Schools
* Sulfur dioxide concentration from petroleum processing plants
* Extreme Weather Data / Forecasts
* Forest Fires / Smog Alerts
*Geographic and temporal distribution of polycyclic aromatic hydrocarbons
* Pest / Insect Infestations
* Rabies
*
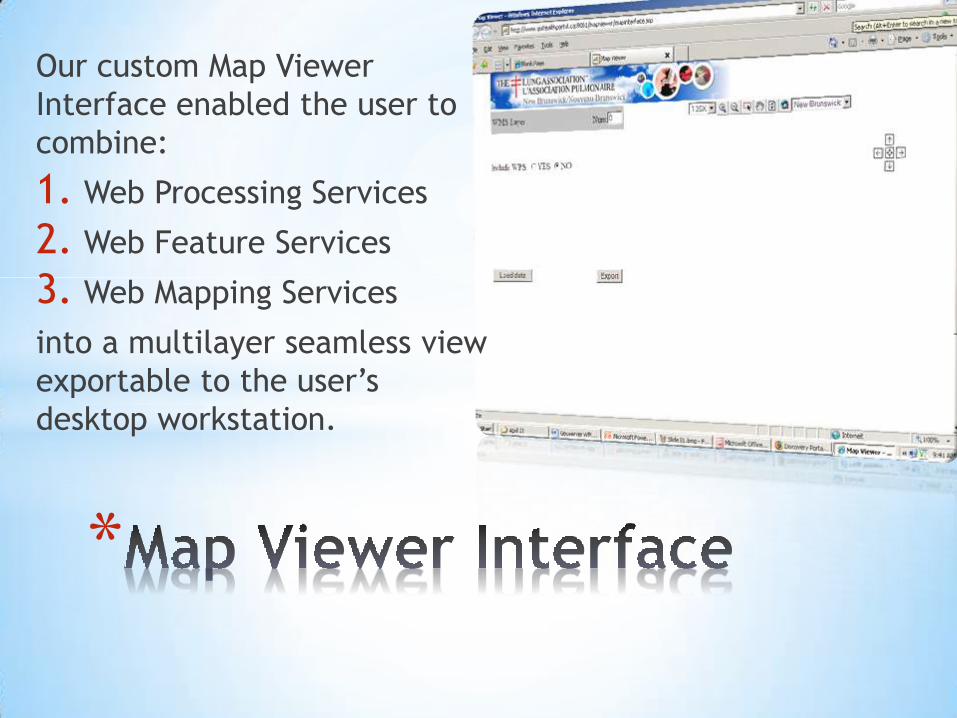
Our custom Map Viewer
Interface enabled the user to
combine:
1. Web Processing Services
2. Web Feature Services
3. Web Mapping Services
into a multilayer seamless view
exportable to the user’s
desktop workstation.
*

The User defines which
combination of values to
obtain for geometry,
respiratory disease,
gender, age, admission
years, statistical methods,
classification methods,
legend range, etc.
*

When satisfied with the
value settings, the User
submits a call to the Web
Processing Service to obtain
these values from the
Oracle server and,
simultaneously, a call to the
Web Feature Service to
obtain the spatial
geometry.
*

Call being made by our
custom MapInterface to
our Geoserver via the
Web Feature Service
(WFS) GetCapabilities
operation.
*
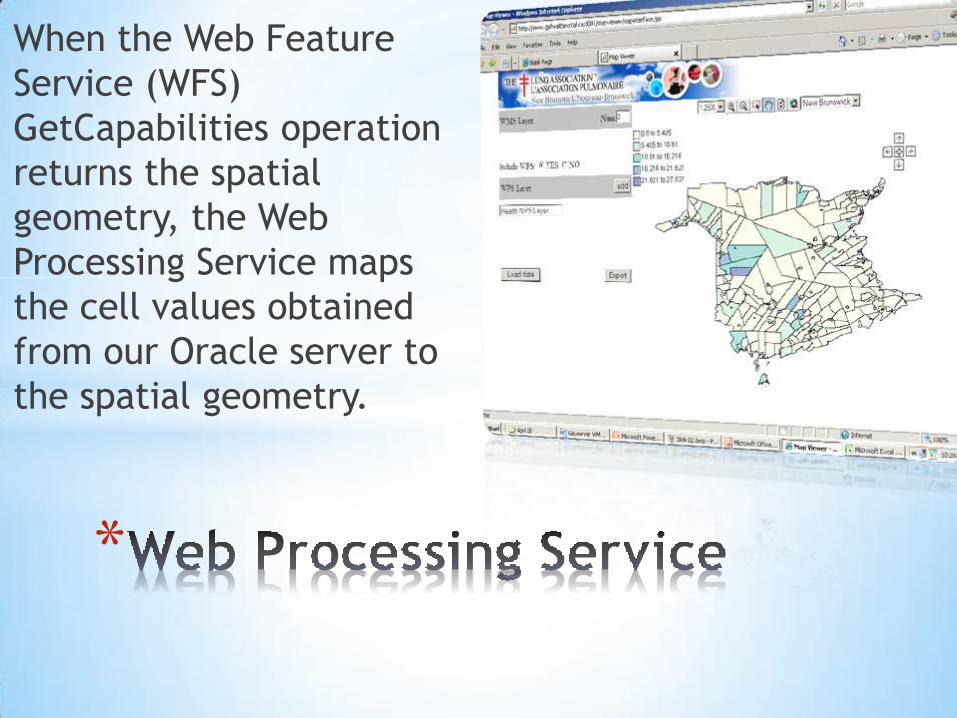
When the Web Feature
Service (WFS)
GetCapabilities operation
returns the spatial
geometry, the Web
Processing Service maps
the cell values obtained
from our Oracle server to
the spatial geometry.
*

User is then able to export
the map view to their
desktop for further analysis,
or import the view into a
web page. The exported map
view has the same GIS
functionalities as the original
Map Viewer Interface (Pan,
Zoom, Layer toggle, etc).
*
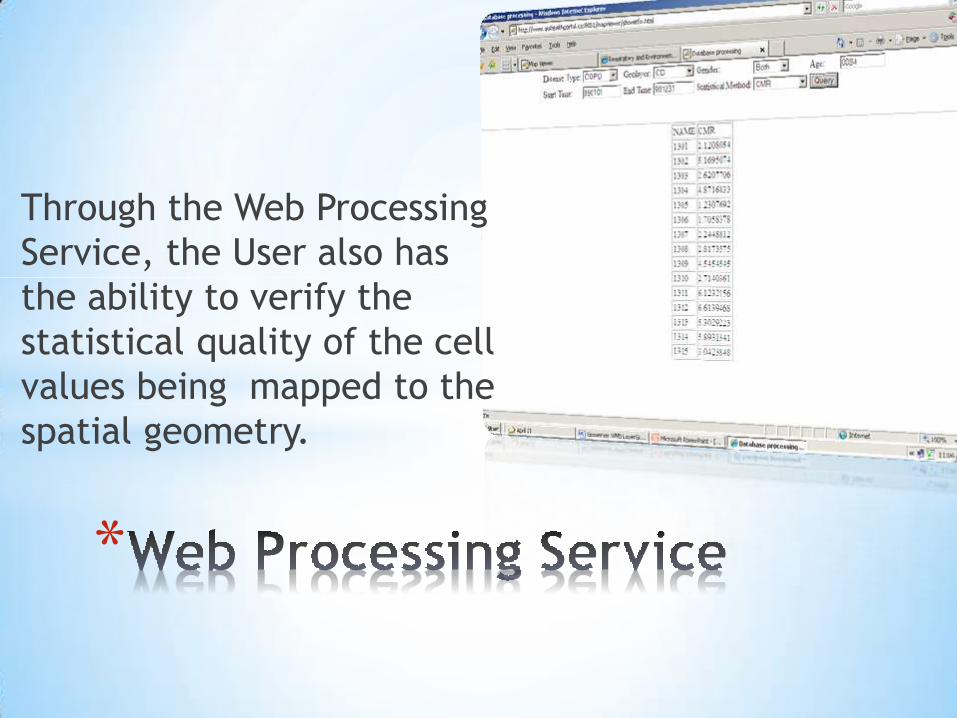
Through the Web Processing
Service, the User also has
the ability to verify the
statistical quality of the cell
values being mapped to the
spatial geometry.
*

Population Distribution
by Health Region Users can select
parameters for
statistical querying
and map visualization
