Essays on Technology Adoption under Uncertainty, Globalisation and Economic Growth Ziv Chinzara B. Comm. (Business Management), University of Fort Hare, South Africa B. Comm. (Economics) Hon., Rhodes University, South Africa M. Comm. (Financial Markets), Rhodes University, South Africa School of Economics and Finance Queensland University of Technology Gardens Point Campus Brisbane, Australia (Email: [email protected] ) This Dissertation is submitted to the Faculty of Business, Queensland University of Technology in fulfilment of the requirements for the degree of Doctor of Philosophy April 2013 Principal Supervisor: Dr. Radhika Lahiri Associate Supervisor: Dr. En Te Chen

Welcome message from author
This document is posted to help you gain knowledge. Please leave a comment to let me know what you think about it! Share it to your friends and learn new things together.
Transcript

Essays on Technology Adoption under Uncertainty, Globalisation and Economic Growth
Ziv Chinzara B. Comm. (Business Management), University of Fort Hare, South Africa
B. Comm. (Economics) Hon., Rhodes University, South Africa M. Comm. (Financial Markets), Rhodes University, South Africa
School of Economics and Finance Queensland University of Technology
Gardens Point Campus Brisbane, Australia
(Email: [email protected])
This Dissertation is submitted to the Faculty of Business, Queensland University of Technology
in fulfilment of the requirements for the degree of
Doctor of Philosophy
April 2013
Principal Supervisor: Dr. Radhika Lahiri Associate Supervisor: Dr. En Te Chen

Statement of Authorship
The work contained in this thesis has not been previously submitted to meet requirements for
an award at this or any other higher education institution. To the best of my knowledge and
belief, the thesis contains no material previously published or written by another person
except where due reference is made.
..................................................................................
Zivanemoyo Chinzara
7th March 2013
QUT Verified Signature
i | P a g e
ABSTRACT
This thesis is concerned about the role of technological progress and reforms in economic growth and development. The first two essays develop stochastic endogenous growth models to examine the impact of uncertainty on the technology adoption decisions of agents, and how this affects the long run growth and development outcomes of an economy. The second essay is concerned with the political economy implications of inequality for technology adoption and economic growth in the presence of uncertainty. The third essay focuses on the topic of globalization and structural reforms, and their impact on economic development within an empirical framework.
The analysis presented in the first essay shows that, in the presence of idiosyncratic
uncertainty, the interaction between the initial productivity of the technologies available in the economy and the costs associated with adopting the superior technologies results in a variety of long run outcomes and ‘sub-outcomes’. We broadly characterise these outcomes and ‘sub-outcomes’ as poverty trap, dual economy, and balanced growth. Moreover, holding the distribution and other parameters of the model constant, changes in uncertainty influences the timing of technology adoption decisions, the steady state technology adoption levels, and the long run growth and inequality outcomes. We provide empirical evidence consistent with this role of uncertainty in short run and long run technology adoption.
Because high adoption costs and large idiosyncratic shocks may delay technology
adoption and induce bad long run outcomes, institutional and policy reforms aimed at addressing these issues are inevitable. These reforms, in turn, alter the fundamental structure of the economy and present new implications for growth and inequality. To that end, the second and the third essay explore the implications of these reforms on economic outcomes. The second essay introduces political economy issues in the model to analyse how economic agents, through a voting mechanism, would react to these reforms, and how this will in turn affect growth and inequality. In this case, we allow for redistribution through taxation, transfers payments, and allocation of funds towards structural and institutional development. Although inequality decreases quicker in this model, distributional conflicts among economic agents create political cycles, which in turn trigger sub-optimal outcomes and delay economic development.
The third essay analyses the role of certain economic reforms within an empirical
framework. It explores the idea that reforms may improve the functioning of markets, thereby improving economic growth by enhancing reallocation of resources from non-productive to productive sectors. Using firm level panel data from South Africa, this essay shows that reforms are associated with improvement in intra-sector and inter-sector efficient reallocation of capital.

ii | P a g e
ACKNOWLEDGEMENTS
First and foremost, my profound gratitude goes to the Almighty Lord. It is by His grace and
mercy that I have been able to undertake this study.
Secondly, I am very much indebted to my Principal Ph.D. Supervisor, Dr Radhika Lahiri for her
motivational and professional supervision. Dr Lahiri actively guided me in all the three essays
presented in this thesis and always made insightful suggestions. She was particularly
instrumental in introducing me to macroeconomic modelling, and MATLAB as a tool for
macroeconomic modelling. Thank you for sacrificing your valuable time and resources to
make me realize this dream, and for your advice regarding my future career.
I am also grateful to my Associate Ph.D. supervisor, Dr En Te Chen for his guidance. Dr Chen
made valuable suggestions on the empirical essay presented in Chapter 5. He was always
ready to help even on short notice. Thank you also for your mentorship, particularly in giving
me teaching advice and career advice.
I also extend my heartfelt gratitude to the Ph.D. panels for the confirmation and the final
seminar. Special thanks to Professor Janice How for constructive suggestions on the
confirmation document. I am also grateful for valuable comments from participants at the
2012 Econometric Society Conference.
I also thank the academic and administration staff from the School of Economics and Finance
for the support throughout my time at Queensland University of Technology (QUT). I am
particularly thankful to Professor Stan Hurn, who encouraged me to consider a Ph.D. at QUT
when I met him in South Africa.
My special thanks to my love Shinga for the encouragement throughout my studies. Thanks
for everything dear. I am also grateful to my family who have been supportive throughout my
studies.
Finally, I acknowledge the funding from QUT, through the following Scholarships: QUT Postgraduate Research Award, Business Scholarship, and Business Top-Up Scholarship. Without this funding, I couldn’t have been able to pursue the Ph.D. programme.

iii | P a g e
TABLE OF CONTENTS
ABSTRACT ....................................................................................................................................................................... i
ACKNOWLEDGEMENTS ............................................................................................................................................. ii
TABLES OF CONTENTS ............................................................................................................................................. iii
LIST OF APPENDICES .................................................................................................................................................. v
LIST OF FIGURES ........................................................................................................................................................ vi
LIST OF TABLES ........................................................................................................................................................ viii
CHAPTER 1: INTRODUCTION ................................................................................................................................................. 1
CHAPTER 2: BACKGROUND AND MOTIVATION .......................................................................................................... 8
2.1 Introduction .................................................................................................................................................................. 8 2.2 Growth and Inequality: Some Stylized Facts .................................................................................................... 9 2.3 Technological Change and Economic Growth .............................................................................................. 15 2.4 Growth and Inequality: The Role of Technology and Politico-Economy Issues ............................ 23 2.5 Globalisation, Allocation of Resources and Economic Growth ............................................................. 28 2.6 Concluding Remarks ............................................................................................................................................... 29
CHAPTER 3: ECONOMIC GROWTH AND INEQUALITY PATTERNS IN THE PRESENCE OF COSTLY TECHNOLOGY ADOPTION AND UNCERTAINTY ........................................................................................................ 32
3.1 Introduction ............................................................................................................................................................... 32 3.2 The Economic Environment ................................................................................................................................ 37 3.3 Numerical Experiments and Discussion ......................................................................................................... 46 3.4 Varying the level of shocks ................................................................................................................................... 53 3.5 Empirical Analysis ................................................................................................................................................... 55
3.5.1 Testing for Long Run and Short Run Relations between the TAI and Risk .................................................... 59
3.6 Concluding Remarks ............................................................................................................................................... 63 CHAPTER 4: RISK INSURANCE AND COSTLY TECHNOLOGY ADOPTION UNDER UNCERTAINTY: A POLITICAL ECONOMY PERSPECTIVE ............................................................................................................................. 70
4.1 Introduction ............................................................................................................................................................... 70 4.2 The Economic Environment ................................................................................................................................ 75
4.3 Numerical Experiments and Discussion ......................................................................................................... 81 4.3.1 The Political Outcome ....................................................................................................................................................... 82
4.3.2 Political Cycles, Economic Fluctuations and Sluggishness: Role of shocks and Initial Inequality ........ 84
4.3.3 The Political Outcome versus Social Welfare Maximization ............................................................................... 88
4. 3.3 Policy Choice: Political Outcome versus Social Welfare Maximization........................................................... 89
4.4 Concluding Remarks ............................................................................................................................................... 91
iv | P a g e
CHAPTER 5: GLOBALISATION AND EFFICIENT SECTORAL REALLOCATION OF CAPITAL: EVIDENCE FROM SOUTH AFRICA ..................................................................................................................................... 96
5.1 Introduction ............................................................................................................................................................... 96 5.2 Theoretical Framework ......................................................................................................................................... 96 5.3 Empirical Methodology .......................................................................................................................................107
5.3.1 Measuring Efficient Allocation of Capital .................................................................................................................107
5.3.2 Measuring Financial Globalisation .............................................................................................................................109
5.3.3 Data and Data Sources .....................................................................................................................................................110
5.4 Empirical Results ...................................................................................................................................................111 5.4.1 Descriptive Evidence .........................................................................................................................................................111
5.4.2 Intra-Sector and Inter-sector Econometric Evidence ..........................................................................................112
5.4.3 Further Robustness Checks .............................................................................................................................................116
5.5 Conclusions and Implications ...........................................................................................................................123 CHAPTER 6: CONCLUSIONS AND POLICY IMPLICATIONS ...................................................................................137
REFERENCES ..............................................................................................................................................................................147
v | P a g e
APPENDICES
Appendix Chapter 3
Appendix 3.1: Proof of Inequality (12) ............................................................................................................................... 63
Appendix 3.2: Proof of Proposition 1 .................................................................................................................................. 64
Appendix 3.3: Correlation Between TAI and the Measures of Risk ........................................................................ 65
Appendix Chapter 4
Appendix 4.1: Proof of Equation (19) ................................................................................................................................. 90
Appendix 4.2: Comparative Statics Analysis .................................................................................................................... 91
Appendix 4.3: Changes in Indirect Utility Functions With Respect to α When Variable Cost, λ is Endogenous ................................................................................................................................................................................... 92
Appendix Chapter 5
Appendix 5.1: Tables of Results and Figures .................................................................................................................121
Appendix 5.2: Constructing our Measure of Financial Globalisation ..................................................................130
vi | P a g e
LIST OF FIGURES
Figures in Chapter 2
Figure 2.1: Development in the Post-World War II Period ........................................................................................ 10
Figure 2.2: Selected Top Contributors to Global Growth by Decade Since 1960 .............................................. 10
Figure 2.3: The Trends in Global Inequality (Gini Coefficient) ................................................................................. 13
Figure 2.4: Global Income Distribution by Population Quintiles, 1990-2007 in PPP Constant 2005 International Dollars .................................................................................................................................................................. 13
Figure 2.5: Summary Results of Income Distribution by Income Levels, 1990-2007 in PPP Constant 2005 International Dollars ...................................................................................................................................................... 14
Figure 2.6: GDP Growth and Decreasing Inequality in Selected Countries, 1990-2005 ................................ 29
Figure 2.7: GDP Growth and Increasing Inequality in Selected Countries, 1990-2005 ................................. 29
Figures in Chapter 3
Figure 3.1: Poverty Trap Sub-outcome 1........................................................................................................................... 42
Figure 3.2: Poverty Trap Sub-outcome 2........................................................................................................................... 43
Figure 3.3: Dual Economy Sub-outcome 1 ........................................................................................................................ 43
Figure 3.4: Dual Economy Sub-outcome 2 ........................................................................................................................ 44
Figure 3.5: Balanced Growth Outcome ............................................................................................................................... 44
Figure 3.6: Technology Adoption, Inequality and Economic Growth: ‘The Poverty Trap’ Sub-outcome 1 ............................................................................................................................................................................................................. 47
Figure 3.7 Technology Adoption, Inequality and Economic Growth: ‘The Poverty Trap’ Sub-outcome 2 ............................................................................................................................................................................................................. 47
Figure 3.8: Technology Adoption, Inequality and Economic growth: ‘The Dual Economy' Sub-outcome 1 .......................................................................................................................................................................................................... 49
Figure 3.9: Technology Adoption, Inequality and Economic Growth: ‘The Dual Economy' Sub-outcome 2 .......................................................................................................................................................................................................... 49
Figure 3.10: Technology Adoption, Inequality and Economic Erowth: ‘The Balanced Growth’ Case ...... 51
Figure 3.11: Impact of Shocks on Technology Adoption ............................................................................................. 52
Figure 3.11: Impact of Shocks on Technology Adoption ............................................................................................. 52
Figure 3.13: Technology Adoption Index: 1961 – 2002 .............................................................................................. 56
Figure 3.14: Correlation Between the Technology Adoption Index and Measures Risk ............................... 66
vii | P a g e
Figures in Chapter 4
Figure 4.1: The Political Outcome ........................................................................................................................................ 82
Figure 4.2: Political Cycles: Role of Initial Inequality and Shocks ........................................................................... 84
Figure 4.3: Economic Fluctuations and Sluggishness: Role of Initial Inequality and Shocks ...................... 85
Figure 4.4: Political Process Versus Welfare Maximization ...................................................................................... 86
Figure 4.5: Political Process Versus Central Planner Under Endogenous Entry Cost .................................... 89
Figures in Chapter 5
Figure 5.1: Percentage Growth in GFCF (1963-2009) ...............................................................................................102
Figure 5.2: Percentage Growth in Value Added (1963-2009) ................................................................................102
Figure 5.3: Growth in Labour Productivity in the Non-Agricultural Sector (1970-2010) ..........................102
Figure 5.4: Growth in Labour Productivity in the Agricultural Sector (1970-2010) ....................................102
Figure 5.5: Mean of the Dispersion of the Tobin Q ......................................................................................................129
Figure 5.6: Trends in FG and the Tobin Q Dispersion ................................................................................................131

viii | P a g e
LIST OF TABLES
Tables in Chapter 2 Table 2.1: Cases of Catch-Up (Economies With A Greater Than 0.10 Increase in Relative GDP Per Capita to the US) ........................................................................................................................................................................................ 11
Table 2.2: Divergence From the Leaders (Economies Suffering a .10 or Higher Decrease in Relative GDP Per Capita to the US) .................................................................................................................................................................. 11
Tables in Chapter 3
Table 3.1: Productivity Parameter Values and Adoption ........................................................................................... 45
Table 3.2 Weights for the Variables .................................................................................................................................. 55
Table 3.3: Correlation Between the TAI and its Explanatory Variables ............................................................... 56
Table 3.4: Unit Root Tests ........................................................................................................................................................ 60
Table 3.5: Multivariate Johansen Cointegration Tests ................................................................................................. 60
Table 3.6: Vector Error Correction Model......................................................................................................................... 61
Tables in Chapter 5
Table 5.1: Descriptive Statistics on EFF ...........................................................................................................................104
Table 5.2: Correlation Between the Log of FD and EFF .............................................................................................104
Table 5.3: Correlation Between the Financial Globalisation Measure and the De Jure and De Facto Measures .......................................................................................................................................................................................108
Table 5.4: Benchmark Results: Intra-Sector ..................................................................................................................123
Table 5.5: Benchmark Results: Inter-Sector ..................................................................................................................123
Table 5.6: Controlling for Other Determinants of Tobin Q Dispersion: Intra-sector: Dependent Variable: GINI .................................................................................................................................................................................................124
Table 5.7: Controlling for Other Determinants of Tobin Q Dispersion: Inter-sector: Dependent Variable: GINI .................................................................................................................................................................................................124
Table 5.8: Controlling for Institutional Quality: Intra-sector: Dependent Variable: GINI ...........................125
Table 5.9: Controlling for Institutional Quality: Inter-sector: Dependent Variable: GINI ...........................125
Table 5.10: Interacting Financial deepening and FG: Intra-sector: Dependent Variable: GINI ................126
Table 5.11: Interacting Financial deepening and FG: Inter-sector: Dependent Variable: GINI ................126
Table 5.12: Do Effects of FG vary across Sectors: Intra-sector: Dependent Variable: GINI ........................127
Table 5.13: Do Effects of FG vary across Sectors: Inter-sector: Dependent Variable: GINI ........................127
Table 5.14: Allerano-Bond Dynamic Panel Model: Intra-sector: Dependent Variable: GINI .....................128
Table 5.15: Allerano-Bond Dynamic Panel Model: Intra-sector: Dependent Variable: GINI .....................128

ix | P a g e
Table 5.16: Alternative FG Measures: Allerano-Bond Dynamic Panel Model: Intra-sector: Dependent Variable: GINI ..............................................................................................................................................................................129
Table 5.17: Alternative FG Measures: Allerano-Bond Dynamic Panel Model: Inter-sector: Dependent Variable: GINI ..............................................................................................................................................................................129
Table A1: Principal Component Analysis for the Financial Liberalisation Indices ........................................133

1 | P a g e
CHAPTER 1 INTRODUCTION
This thesis presents three essays that are concerned with the link between structural
change and economic growth. The first two essays focus on the technological and institutional
aspects that define the fundamental structure of an economy, and examine how these
characteristics determine its long run outcomes. Specifically, these essays focus on how the state
of the technology, and the barriers to technology adoption, which take the form of institutional
and political conditions that impact on the costs of adoption, or the uncertainty that surrounds
the technology adoption decisions, influence long run growth and development. These issues
are addressed in the framework of stochastic endogenous growth models. The third essay
addresses similar issues in the context of an empirical framework. This essay analyses how
some of the reforms that alter the structure of the economy, for example economic, institutional
and policy reforms, as well as reforms aimed at integrating the economy to the global world, can
influence long run growth through their impact on the reallocation of resources within and
across sectors. This essay focuses on firm-level panel evidence from South Africa.
To elaborate on these three essays, the first develops a simple stochastic growth model
(hereafter referred to as the benchmark model) to explain the diverse growth experiences of
developing nations, and the non-convergence of incomes within and across these nations. The
model developed highlights the idea in models such as Greenwood and Yorukoglu (1997), Khan
and Ravikumar (2002) and Lahiri and Ratnasiri (2012) that barriers to technology adoption
may delay technical change, thereby affecting both the short run and long run relationships
between growth and inequality. However, the novelty of our model is in the sense that we
consider a situation where agents make technology adoption decisions in the presence of
uncertainty. The uncertainty emanates from the fact that economic agents do not have enough
information on how unexpected events will affect the productivity of the superior technology.
The benchmark model highlights the idea that the absence of institutions which can help
agents to alleviate the risk associated with superior technologies can slow down the rate of
technology adoption. This is particularly the case in developing countries where formal
insurance schemes are typically unavailable, and the available informal risk-sharing agreements
do not adequately smooth out these shocks (Dercon, 2002, 2004; Morduch, 1995; Townsend,
2 | P a g e
1995). As such, the presence of uncertainty is likely to affect both the short run technology
adoption decisions of agents, as well as the long term economic outcomes of an economy,
thereby helping to explain the diverse economic experiences of nations.
In terms of the predictions of the model, the addition of uncertainty turns out to be an
important contribution for a number of reasons. Firstly, it sharpens the predictions of the model
in a manner that enhances the model’s ability to account for the diverse growth and inequality
patterns observed in the empirical data. Secondly, the model with uncertainty produces a rich
range of new findings that are distinct to those in related existing literature. More specifically, in
the absence of uncertainty, three main outcomes are possible, depending on the initial levels
and differences between the productivities of the inferior and the superior technologies, and the
adoption cost associated with the superior technology. These are characterised as poverty trap,
dual economy, and balanced growth, and each of these outcomes is associated with a single set of
productivity parameters and adoption costs. In the poverty trap outcome, long run growth
stagnates and the wealth of all agents converges. In the dual economy outcome, some agents
adopt the superior technology while others adopt the inferior technology. In this case, the
growth of the economy is determined by the productivity level of the superior technology and
the proportion of agents who adopt it. Moreover, given initial heterogeneity in resource
endowments, inequality is persistent because the wealth of agents adopting the superior
technology grows while that of the agents who adopt the inferior technology stagnates. In the
balanced growth case, both the growth rate and inequality sharply increase in the transitional
process and converge at high levels.
When we account for idiosyncratic uncertainty in the model, further ‘sub-outcomes’
emerge within the poverty trap and the dual economy outcomes. Each of these ‘sub-outcomes’ is
associated with its own set of productivity parameters and adoption costs, and shows its own
unique transitional growth and inequality patterns, suggesting the existence of a diversity within
diversity. For instance, in one of the poverty trap ‘sub-outcomes’, transitional growth is more
volatile than in the other ‘sub-outcomes’. Furthermore, the transitional gap between the poor
and the rich agents differs between these two poverty trap ‘sub-outcomes’. Within the two dual
economy ‘sub-outcomes’, the inequality patterns differ both in transitional stages and in the long
run. In one of the ‘sub-outcomes’, inequality is mean-reverting both in the transitional stages,
and in the long run, while in the other ‘sub-outcomes’, inequality sharply increases in the
3 | P a g e
transitional process and converges at a very high level. As we shall discuss shortly, each of these
‘sub-outcomes’ has a distinct implication for policy.
The outcomes and ‘sub-outcomes’ found in the benchmark model are useful in explaining
the diversity that characterizes the empirical observations regarding growth and inequality.
Thus, our model makes an important contribution in the sense that it captures these features
within a single, unified framework. Models that capture the diversity of growth outcomes evident in
the data are relatively scant in the literature. Lahiri and Ratnasiri (2012) and Iwaisako (2002) are
notable exceptions. However, by incorporating the role that uncertainty plays in technology adoption
decisions, our model makes a significant contribution along two dimensions; it provides insights on how
uncertainty matters, and produces a richer, more diverse range of outcomes relative to those unearthed
in previous theoretical literature. The numerical experiments show that, holding the distribution
and other parameters of the model constant, changes in the magnitude of idiosyncratic
uncertainty affects the timing of technology adoption decisions, the transitional path of growth
and inequality, and the long run economic outcomes of a nation. This is a key contribution of this
thesis, as it highlights the impact of uncertainty on technology adoption and economic
development. Using data on aggregate technology adoption in the Indian agricultural sector, we
provide some empirical evidence consistent with this contribution of our model.
A number of policy implications can be drawn from the findings of the benchmark model.
Although we provide a detailed discussion of these policy implications in Chapter 6, we
summarise some of them here, as they form the basis for the political economy extension to the
benchmark model. The first implication stems from the ‘diversity within diversity’ feature found
in the benchmark model. This feature suggests that, although nations may have similar long run
outcomes (i.e. poverty trap or dual economy), the underlying conditions that define these
outcomes, and the transitional path of growth and inequality may differ across these nations.
Consequently, appropriate policy responses for each bad long run ‘sub-outcome’ are dependent
on a clear-cut and precise understanding of the initial conditions that underlie that particular
‘sub-outcome’. Policies that are tailored to the underlying conditions have a better chance of
success than broad international policy responses that are often predicated on classifying
nations as low-income (poverty trap) and middle-income (dual economy). The latter approach to

4 | P a g e
policy application might explain why some policy prescriptions suggested by the International
Monetary Fund and the World Bank) have been unsuccessful in some developing nations.1
The second implication emanates from the fact that the initial technological and
institutional aspects of an economy determine its long run economic outcomes. In the context of
our model these initial conditions are reflected in the productivity levels of the various
technologies in existence, in addition to the differences between the productivity levels of
superior and inferior technologies. An important question that arises regards the specific policy
responses to ‘create’ the initial conditions that lead to the best possible outcomes. One possible
policy response is allocating more resources towards research and development (R&D) to
improve the initial productivities of the technologies available in an economy.
The third implication stems from the fact that a high adoption cost delays the adoption and
diffusion of new technologies, and thus hampers economic development. In our benchmark
model, this adoption cost relates to the cost associated with both human and physical capital
accumulation, as well as the ‘learning-by-doing’ element that is associated with human capital.
Therefore, possible policy responses include improving human capital development through
investment in education, poverty reduction and health.2 In addition, investing in physical capital
and infrastructure, and improving public dissemination of information relating to how the new
technologies operate may help to expedite the learning.
The last implication relates to the fact the risk affects both the short term and long term
outcomes of an economy. This means that two countries which possess technologies with
similar initial productivities and adoption costs could still end up with different long run
economic outcomes if the quality of their institutions (especially those that help agents to
diversify or alleviate production or consumption shocks) is different. Therefore, in order to
improve technology adoption and economic development, institutions such as shock-relief
funds and risk insurance schemes, can be developed to help agents facing such circumstances.
1 See, for example Dollar and Svensson (2000) for the failure of Structural Adjustment Program (SAPs) in countries such as Kenya and Zambia. These authors argue that failures and successes of SAPs in developing nations are related to country-specific features, particularly political-economy factors. 2 Medsen (2012) provides evidence from 21 OECD that health enhances the quantity and quality of schooling, innovations and growth.

5 | P a g e
While the policy proposals mentioned above can be useful for technology adoption and
economic progress, implementing them often requires major policy and institutional reforms.
However, implementing these reforms is a subject of contention, particularly in democratic
societies. This is mainly because reforms affect the preferences of agents. As a result, conflicts
often arise between those who benefit and those who lose from these reforms. The presence of
these conflicts complicates technology adoption decisions, and thus entails new growth and
inequality outcomes relative to those found in the benchmark model. This is the subject
explored in the essay presented in Chapter 4.
Specifically, the essay presented in Chapter 4 is a political economy extension of the
benchmark model. In this extension, we assume that there are institutions that help agents
alleviate the risk associated with superior technologies in return for a fixed entry cost and a
periodic variable cost. The former cost implicitly includes the fixed cost associated with
adopting the superior technology. The latter cost varies with the return on the superior
technology. In order to introduce political economy issues in the model, we assume that the
fixed entry fee is endogenous, in the sense that it depends on the proportion of government
revenue allocated towards R&D and cost-reducing financial development expenditure, which, in
turn, is determined through a political process. The role of the government in the political
economy extension is that of collecting tax and then redistributing the revenue according to the
alternative preferred by the majority of agents. The alternatives in the ‘menu of choice’ for the
agents are lump-sum transfer payments and expenditures allocated towards R&D and the
development of cost-reducing institutions.
The outcomes of the political economy model are quite distinct to those of the benchmark
model. In the presence of redistribution, which occurs primarily through lump sum transfers,
the wealth of the agents in the economy quickly converges. However, this redistribution results
in poor growth rate during the transitional process. In the transition to the steady state, the
pattern of inequality resembles recurring ‘Kuznets curves’, and the relationship between growth
and inequality is non-linear and bi-directional. These recurring patterns emanate from political
cycles, which are partly caused by distributional conflicts created by the heterogeneity in the
initial resource endowments of agents, but further exacerbated by the presence of uncertainty.
To elaborate on this, these political cycles emanate from the fact that there is a two-way,
dynamic relationship between redistribution and inequality; inequality impacts on the political
outcome, which determines the amount of redistribution that takes place in any given period.
6 | P a g e
This redistribution, in turn, determines the inequality that will prevail in the next period. If
inequality is lower relative to the previous period an entirely different political outcome is
possible, with a lower amount of redistribution taking place in this period. This would then
impact on inequality in the next period, leading to a different outcome in that period, and so on.
In our model, inequality interacts with uncertainty in a manner that substantially exacerbates
this cyclical pattern.3 These political cycles are more pronounced the higher the uncertainty and
the lower the initial inequality. In light of these features of the model, empirical results from
studies that impose linear, one-way and parametric relationships between growth and
inequality need to be interpreted with caution.
Further numerical results show that the political outcomes are sub-optimal in the early and
transitional stages of the economy. This occurs in the sense that they do not coincide with
outcomes that maximize the collective welfare of all agents in the economy. An explanation for
this is that the distributional conflicts among different groups of agents in the economy retard
the speedy implementation of developmental policies. This finding is consistent with an idea in
the related literature that democratic institutions increase redistributive conflicts, particularly
in middle income countries, thereby harming economic growth (Aghion, Alesina and Trebb,
2004;2007; Boix, 2003). In light of this idea, some authors suggest that nations should delay the
democratisation of institutions until they have reached a certain threshold level of income per
capita (see for example Barro, 1996).
Turning to the third essay presented in Chapter 5, we explore the impact of a broad range
of financial reforms, commonly referred as financial globalisation, on intra-sector and inter-
sector reallocation of resources across firms. The role of the reallocation of resources in
economic growth has been emphasised in a number of studies and is a key mechanism
underpinning the ‘structural change’ mentioned above (see for example Fan et al., 2003; Feder,
1986; McMillan and Rodrik, 2011; Robinson, 1971; Swiecki, 2012). To that end, the essay
presented in Chapter 5 is important as it helps us understand the sources of the reallocation of
capital in the context of South Africa.
South Africa is an interest case for a study of this nature for a variety of reasons. Firstly, in
terms of its standing in the world economy, South Africa has become one of the closely watched
emerging economies, along with Brazil, China, Russia and South Africa. These five countries 3 Huffman (1997) and Lahiri and Ratnasiri (2010) develop models which show that, in the absence of central bank independence, inflation and inequality tend to exhibit politically-induced fluctuations.

7 | P a g e
have increasingly become influential by cooperating in economic and political issues through
what is commonly known as the BRICS. Secondly, South Africa is interesting in terms of its
regional location. It is part of poorest and the most underdeveloped region in the world, the Sub
Saharan Africa region. This region has attracted considerable research attention as researchers
seek to understand the sources of poverty and underdevelopment. Although this study could
have benefited from including the sample of all the nations in this region, only South Africa has
the relevant data needed for the current analysis. In spite of the data challenge, the results of
this study will be of policy relevance to the entire Sub Saharan African region given that South
Africa has an important standing in the region. More specifically, South Africa is the largest
economy in the region (see World Economic Outlook, 2011). As we shall elaborate in Chapter 5,
South Africa also has the largest financial markets and financial institutions in the region.
In terms of the contribution to the related literature on South Africa, this is the first study
of this kind, from a methodological point of view. In the context of other countries, closely
related studies have focussed on economy wide firm-level reallocation of capital (see Almeida
and Wolfenzon 2004; Galindo et al., 2007; Abiad et al., 2008). As we shall elaborate in Chapters
2 and 5, the classical literature on development highlights that the take-off of nations is
associated with structural transformation that is often characterised by the reallocation of
resources from the primitive sectors to the modern sectors of the economy. Our focus on intra-
sector and inter-sector as opposed to economy-wide aspects of efficient reallocation of
resources is an important contribution in the sense that it allows us to interpret the results in
the context of the structural transformation described in the classical literature on economic
development. Secondly, by focussing on intra-sector and inter-sector resource reallocation, we
are able to yield some useful findings which are distinct to those in the existing literature.
We find that globalisation, along with factors such as institutional quality and human
capital development enhances efficient intra-sector and inter-sector reallocation of capital. This
reallocation-benefit of globalisation is stronger at the inter-sector than intra-sector level.
Nevertheless there is evidence suggesting that resource reallocation is poor in the primary
sectors of the economy.
With regards to policy implications, the results from this empirical essay suggest that the
reforms undertaken in South Africa since the early 1990s constitute a positive step towards
improving the allocation of resources. The fact that the reallocation benefits of globalisation are

8 | P a g e
stronger at the inter-sector than intra-sector level implies that the implicit/explicit barriers to
free movement of resources across firms in different sectors may limit the benefits of reforms.
Therefore, policy makers need to be mindful of the fact that market-structure based barriers
such as monopolies and institutionalised barriers such as government incentives that promote
the concentration of investment in certain industries or regions can limit the efficient resource-
reallocation benefits of reforms.
Furthermore, evidence of poor resource-reallocation in the primary sectors of the
economy entails that structural and institutional transformation is not yet adequate in South
Africa. Typically, adequate transformation is signalled by the convergence of the productivity
levels of all sectors to a stable level. This usually begins with improving productivity levels in
the primary sectors, and then integrating the primary sector (particularly agriculture) to the
rest of the economy through infrastructural development and market-equilibrium linkages (see
Timmer, 1988). Thus, more effort is needed to integrate the sectors of the South African
economy.
There is also evidence to suggest that the high level of corruption resulting from poor
political and legal institutions in South Africa has negatively affected efficient reallocation of
capital. As such, policy makers need to improve these legal and political institutions in order to
ensure that corruption and other crimes are combated.4
The remainder of the thesis is organised as follows. The next chapter reviews some of the
existing literature with a view towards highlighting the issues that motivate this thesis. Chapter
3 develops the benchmark model and presents some empirical evidence consistent with the
main prediction of this model. Chapter 4 presents the political economy extension to the
benchmark model. Chapter 5 presents the essay on the resource-reallocation benefits of
financial globalisation. Chapter 6 concludes the thesis. The technical aspects of each of the
chapters are chronologically presented in the appendix of each of the chapters.
4 South Africa has the world’s highest crime rate (see Schönteich, 2010). Demombynes and Özler (2002) outline the various channels through which crime has negatively affect economic development in South Africa.

9 | P a g e
CHAPTER 2
BACKGROUND AND MOTIVATION
2.1 Introduction
This chapter discusses some of the theoretical issues and empirical observations that are of
motivational relevance to the thesis. We begin with the empirical observations that motivate the
technology adoption model (henceforth the benchmark model) developed in Chapter 3. These
empirical observations are with regard to the divergence of growth rates across countries, and
non-convergence of incomes within and across nations. To provide a basis for these empirical
observations, we explore the literature on the idea that differences in technological progress are
the main source of cross-country differences in per capita incomes, and compare the
technological progress of different countries and regions. In order to explain the sources of the
differences in technological progress, we then discuss some of the barriers to technological
progress and adoption. We particularly emphasise two barriers that are of relevance to the
benchmark model. These are the cost of adopting new technologies and the uncertainty
associated with the returns on new technologies. We then highlight how differences in these
barriers across nations can explain the differences in technology adoption, and how the latter
affects growth. Furthermore, we explore the relationship between growth and inequality during
the process of technology adoption.
Next we explore the idea that the technological progress/adoption can be endogenously
determined by economic agents in the economy whose preferences influence the strength of the
barriers to technology adoption/progress. These issues form the basis for the political economy
extension to the benchmark model presented in Chapter 4. We further discuss how these
political economy issues might alter the evolution of growth and inequality during the process
of adopting risky technologies. Finally, we present issues motivating the empirical essay
presented in Chapter 5. These issues concern the role of globalisation in promoting economic
growth through the reallocation of resources across firms and sectors. We end this chapter by
summarizing and highlighting the issues to be discussed in the subsequent chapters.
10 | P a g e
2.2 Growth and Inequality: Some Stylized Facts
In the post-Industrial Revolution period, the income per capita of Western Europe and
Western Offshoots (United States, Canada, and Australia) forged ahead on the basis of significant
technological advances, while those of other regions stagnated (Lin and Huang, 2012). The
income per capita of Western Offshoots further accelerated in the post-World War II period.
However, since the 1950s, global economic growth has shown considerable diversity.
Some economies, for example Japan and South Korea in the 1960s, and China since the 1970s,
have converged towards the above mentioned early per-capita income leaders. On the other
hand, other regions such as Sub Saharan Africa and former USSR have either stagnated or
diverged from the growth leaders.
The diversity that characterizes per capita income growth, especially in rural areas
becomes even more evident on a cross-country basis. In Table 2.1 and Table 2.2, we present
data suggesting this diversity. Table 2.1 presents the per capita incomes of some of the
developing countries whose per capita incomes have been converging towards that of the US
since 1950. Table 2.2 presents some of the developing nations whose per capita incomes have
diverged away from that of the US since 1950. Within each group of these countries, there is
additional diversity in the sense that the rate of convergence/divergence towards the US per
capita incomes differs across countries. This suggests the existence of diversity within diversity, a
feature that has not been captured in existing theoretical literature.

11 | P a g e
Figure 2.1: Development in the post-World War II period (Per capita GDP measured in 1990 Geary-Khamis PPP adjusted dollars) Source: Data from Bolt and van Zanden (2013): Maddison data
Figure 2.2: Selected Top Contributors to Global Growth by Decade since 1960 Source: Author’s computation based on World Bank Development and IMF databases
0
5,000
10,000
15,000
20,000
25,000
30,000
35,000
Western Europe
Western Offshoots
East Europe
Former USSR
Japan
Latin America
China
India
S.S. Africa
S. Korea
0.00%
5.00%
10.00%
15.00%
20.00%
25.00%
30.00%
35.00%
40.00%
1960-1970 1970-1980 1980-1990 1990-2000 2000-2010
Cont
ribu
tion
to G
loba
l GD
P G
row
th
Year
United States
Japan
Germany
France
Brazil
Italy
Mexico
United Kingdom
Canada
Spain
China
Korea, Rep.
Australia
India

12 | P a g e
Table 2.1: Cases of Catch-Up (Economies with a greater than .10 increase in relative GDP per capita to the US)
1950 1980 2008 Change 1950 – 2008
Hong Kong SAR, China 0.23 0.57 1.02 0.78 Singapore 0.23 0.49 0.90 0.67 Equatorial Guinea 0.06 0.08 0.71 0.65 Taiwan, China 0.10 0.28 0.67 0.58 S. Korea 0.09 0.22 0.63 0.54 Ireland 0.36 0.46 0.89 0.53 Japan 0.20 0.72 0.73 0.53 Spain 0.23 0.50 0.63 0.40 Austria 0.39 0.74 0.77 0.39 Norway 0.57 0.81 0.91 0.35 Finland 0.44 0.70 0.78 0.34 Greece 0.20 0.48 0.52 0.32 T. & Tobago 0.38 0.67 0.68 0.30 Israel 0.29 0.59 0.58 0.28 Italy 0.37 0.71 0.64 0.27 Germany 0.41 0.76 0.67 0.26 Puerto Rico 0.22 0.44 0.48 0.26 Portugal 0.22 0.43 0.46 0.24 Mauritius 0.26 0.24 0.47 0.21 Oman 0.07 0.22 0.27 0.20 Thailand 0.09 0.14 0.28 0.20 Belgium 0.57 0.78 0.76 0.19 France 0.54 0.79 0.71 0.17 China 0.05 0.06 0.22 0.17 Malaysia 0.16 0.20 0.33 0.17 Netherlands 0.63 0.79 0.79 0.16 Botswana 0.04 0.09 0.15 0.12 Bulgaria 0.17 0.33 0.29 0.11
Source: Author computation based on Bolt and van Zanden (2013): Maddison data
Table 2.2: Divergence leaders (Economies suffering a .10 or higher decrease in relative GDP per capita to
the US)
1950 1980 2008 Change 1950-2008
Bolivia 0.20 0.14 0.09 -0.11 Iraq 0.14 0.34 0.03 -0.11 Lebanon 0.25 0.19 0.14 -0.11 South Africa 0.27 0.24 0.15 -0.11 Nicaragua 0.17 0.12 0.05 -0.12 Djibouti 0.16 0.09 0.04 -0.12 Switzerland 0.95 1.01 0.81 -0.14 Argentina 0.52 0.44 0.35 -0.17 Uruguay 0.49 0.35 0.32 -0.17 Gabon 0.33 0.36 0.12 -0.20 N. Zealand 0.88 0.66 0.60 -0.29 Venezuela 0.78 0.55 0.34 -0.44 UAE 1.65 1.49 0.50 -1.15 Kuwait 3.02 0.71 0.41 -2.61 Qatar 3.18 1.55 0.56 -2.62 Saudi Arabia 0.23 0.71 0.27 0.04 Moldova
0.27 0.11 -0.15
Georgia
0.33 0.19 -0.14 Source: Author computation based on Bolt and van Zanden (2013): Maddison data.
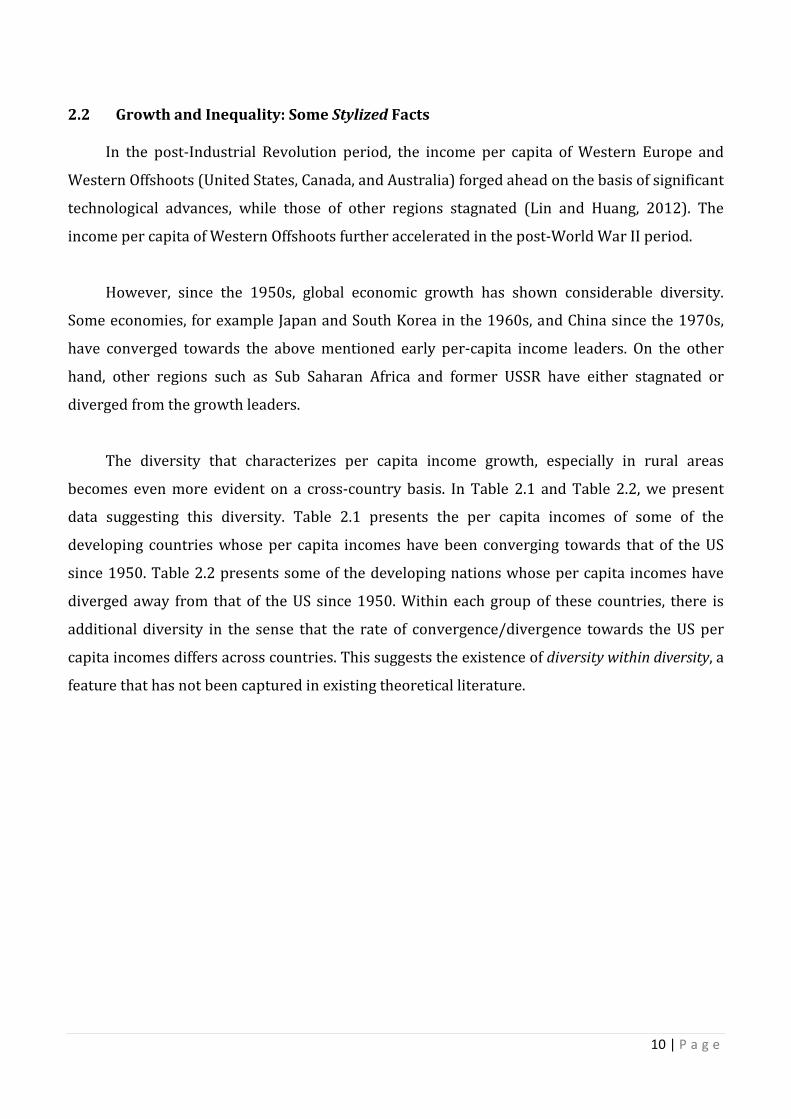
Next we consider the evolution of inequality within and across nations. We begin by
looking at the trends in inter-country global inequality since the 19th century. This measure of
inequality relates to the differences in the mean incomes of countries. In Figure 2.3 we plot the
13 | P a g e
time series of the Gini Index computed by Milanovic (2009). It is evident that global inequality
has steadily risen since 19th century. In fact Bourguignon and Morrisson (2002) show that cross-
country income inequality has increased nearly four times between 1820 and 1950, from its
initial level of 15%. Based on a review of a number of studies on inequality, Cornia (2003)
suggests that global inequality accelerated between 1980 and 2002.
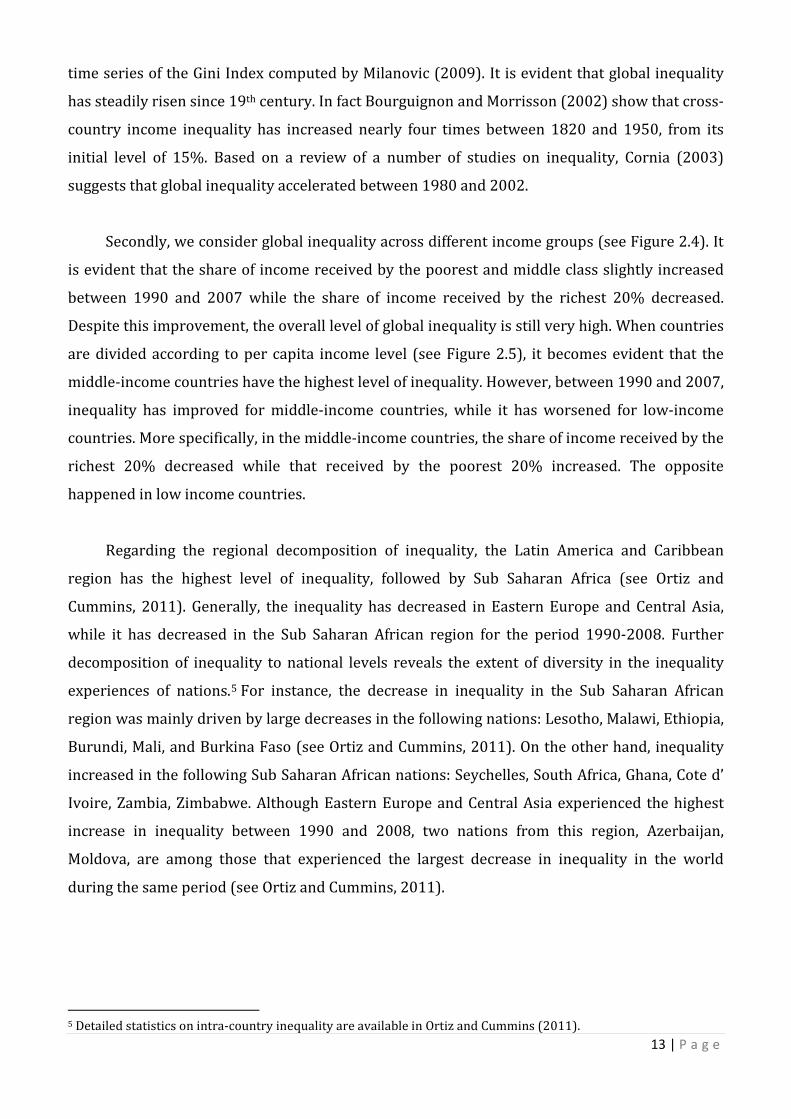
Secondly, we consider global inequality across different income groups (see Figure 2.4). It
is evident that the share of income received by the poorest and middle class slightly increased
between 1990 and 2007 while the share of income received by the richest 20% decreased.
Despite this improvement, the overall level of global inequality is still very high. When countries
are divided according to per capita income level (see Figure 2.5), it becomes evident that the
middle-income countries have the highest level of inequality. However, between 1990 and 2007,
inequality has improved for middle-income countries, while it has worsened for low-income
countries. More specifically, in the middle-income countries, the share of income received by the
richest 20% decreased while that received by the poorest 20% increased. The opposite
happened in low income countries.
Regarding the regional decomposition of inequality, the Latin America and Caribbean
region has the highest level of inequality, followed by Sub Saharan Africa (see Ortiz and
Cummins, 2011). Generally, the inequality has decreased in Eastern Europe and Central Asia,
while it has decreased in the Sub Saharan African region for the period 1990-2008. Further
decomposition of inequality to national levels reveals the extent of diversity in the inequality
experiences of nations.5 For instance, the decrease in inequality in the Sub Saharan African
region was mainly driven by large decreases in the following nations: Lesotho, Malawi, Ethiopia,
Burundi, Mali, and Burkina Faso (see Ortiz and Cummins, 2011). On the other hand, inequality
increased in the following Sub Saharan African nations: Seychelles, South Africa, Ghana, Cote d’
Ivoire, Zambia, Zimbabwe. Although Eastern Europe and Central Asia experienced the highest
increase in inequality between 1990 and 2008, two nations from this region, Azerbaijan,
Moldova, are among those that experienced the largest decrease in inequality in the world
during the same period (see Ortiz and Cummins, 2011).
5 Detailed statistics on intra-country inequality are available in Ortiz and Cummins (2011).
14 | P a g e
Figure 2.3: The Trends in Global Inequality (Gini Coefficient) Source: Data from Milanovic (2009)
Figure 2.4: Global Income Distribution by Population Quintiles, 1990-2007 in PPP constant 2005 international dollars. Source: Data from Ortiz and Cummins (2011), UNICEF Notes: Q1 denotes the poorest 20 % of the population; Q5 denotes the top 20% of the population
0
0.1
0.2
0.3
0.4
0.5
0.6
0.7
0.8
1820 1850 1870 1913 1929 1950 1960 1980 2002
Glob
al I
ncom
e In
equa
lity
Year
0 10 20 30 40 50 60 70 80
Q5
Q4
Q3
Q2
Q1
2007
2000
1990

15 | P a g e
Low Income Nations Middle Income Nations
High Income Nations
Figure 2.5: Summary Results of Income Distribution by Income Levels, 1990-2007 in PPP constant 2005 international dollars Source: Data from Ortiz and Cummins (2011), UNICEF
In order to understand the sources of the diversity in growth and inequality, and the non-
convergence of incomes described above, it is important to understand the factors that influence
growth and development. In the existing literature, technological change, also commonly
referred to as total factor productivity growth (TFPG), along with human and physical capital
accumulation, and structural change have emerged as the major sources of growth. Typically,
human capital and physical capital accumulation are treated as elements of technological
change, as both factors improve the adoption and diffusion of existing technologies, and enhance
the better use of new technologies. In what follows, we discuss the role of technological change
in growth. This discussion forms the basis of the essays presented in Chapters 3 and 4.
2.3 Technological Change and Economic Growth
The role of technological progress in growth and development has been recognised in the
literature of economic growth and development. Early contributions include neoclassical
growth theories of Solow (1956) and Swan (1956). In these models and their related extensions
(e.g. Cass, 1965; Koopmans, 1965), technology is treated as an exogenous component.
0 20 40 60
Q5
Q4
Q3
Q2
Q1
2007
2000
1990
0 50 100
Q5
Q4
Q3
Q2
Q1
2007
2000
1990
0 20 40 60
Q5
Q4
Q3
Q2
Q1
2007
2000
1990
16 | P a g e
Furthermore, holding labour constant, capital accumulation is subject diminishing marginal
returns. As such the economy will eventually converge to a steady state characterised by a
constant capital-labour ratio (Lahiri and Ratnasiri, 2013).
Given the assumptions of the neoclassical models, convergence in the income per capita
across nations is inevitable for two main reasons. Firstly, the poorer nations do not have to
invent technologies, but to simply adopt superior technologies from richer nations at relatively
low cost. Secondly, since the poorer nations have a lower level of capital than richer nations,
they are bound to grow at a faster rate than the richer nations once they adopt the superior
technology. As a result of this, capital will flow from richer nations, where its marginal returns
are lower to poorer nations where its returns are higher, until labour-capital ratios, and the per
capita incomes are equal across the nations. This type of convergence of this known as
conditional convergence, as it is dependent on occurrence of the two events mentioned above.
Despite their important early contribution, the neoclassical models are problematic for a
number of reasons. Firstly, they completely abstract from the role of technology adoption in
economic growth. Consequently, these models fail to account for a key mechanism through
which cross country differences in per capita incomes can be explained. Secondly, by treating
technology as exogenous, the neoclassical models fail to account for the factors which underpin
technological progress.
Attempts to address the problems of the neoclassical growth models have led to the
emergence of another group of models typically labelled as ‘endogenous growth models’. These
models include, among others, Romer (1986, 1987, 1990), Lucas (1988), Robelo (1991),
Grossman and Helpman (1991), Aghion and Howitt (1992). These endogenous growth models
differ in the manner in which they model the process technological change. In models such as
Romer (1986), Lucas (1988) and Robelo (1991), technological change is indirectly
‘endogenized’ by assuming that growth takes place through investment in human capital or
‘learning-by-doing’. In the models of Romer (1987, 1990), Grossman and Helpman (1991),
Aghion and Howitt (1992), technological change is modelled by allowing for endogenous growth
through investment in R&D, which in turn leads to technological innovation. However,
‘endogenizing’ technological progress has a similar implication in that it produces positive
spillover effects on the rest of the economy, and reduces the diminishing returns to capital

17 | P a g e
accumulation (Barro and Sala-i-Martin, 1992). As such, the production technologies used in
these models assume increasing returns to capital accumulation.
The main implication of endogenous growth models is that policies that promote
competition and innovation enhance long term growth in per capita income, while policies that
restrict competition will slow the pace of technological innovation with a negative impact on
long term growth (see Howitt, 2007). In this regard, it is possible to explain the diverse growth
and inequality outcomes of countries as induced by differences in policy. In terms of empirical
validity, the endogenous growth models, particularly those that emphasise the role of R&D and
technology spillovers have been credited for their ability to explain productivity growth in
OECD countries, especially in the post WW II period (see, e.g., Coe and Helpman, 1995; Kneller
and Stevens, 2006; Ha and Howitt, 2007; Madsen, 2007, 2008).
However, endogenous growth theory has also been subject to criticisms. Two common
criticisms pertain to the complexity of these models, and their application to developing nations.
For instance, Parente (2001) argues that the contribution of endogenous growth theory is not
substantial enough to justify its complexity relative to neoclassical growth theory. The second
criticism pertains to these models that they model endogenous growth as occurring through
R&D. Parente (2001) argues that these models are not applicable to developing countries
because these countries hardly engage in R&D. As such, the growth of developing countries is
not through R&D and innovation, but through imitating or adopting readily available
technologies. He cites examples of Japan, South Korea, and China as previously poor countries,
which experienced large gains in income per capita through imitating and adopting existing
technologies. In light of this criticism, the ‘correct’ question to ask in the context of transitional
and developing countries is: why do these countries not adopt productive technologies?
The benchmark model developed in this thesis addresses some of the issues raised in the
preceding paragraph to some degree. Firstly, the endogenous growth model we develop in this
thesis is a model of technological adoption, which characterizes the idea that economic growth
in most developing nations occurs through adopting existing superior technologies, rather than
inventing new ones. Secondly, we address the complexity criticism by assuming a model with a
linear AK – type technological structure.
18 | P a g e
The AK – type model was first introduced by Frankel (1962) as an alternative to the
models that assume diminishing marginal returns to capital deepening (see Aghion and Howitt,
1998: 26). The idea here is that the aggregate production function can exhibit constant or even
increasing marginal returns to capital deepening. This is essentially because, as firms
accumulate more physical and human capital, some of the human capital will be the intellectual
capital embodied in labour. The availability of more intellectual capital would then augment
technological progress, and therefore counter the tendency for the marginal product of capital
to diminish.
The AK – type model was then introduced into the endogenous growth theory by Romer
(1986) and was subsequently used by Lucas (1988). This model structure further gained
popularity in the endogenous growth literature, since it was first applied by Barro (1990) to
explain the divergence of incomes. The major implication of the AK – type model is that
permanent changes in government policies that have a bearing on investment rates will result in
permanent changes in GDP growth.
The AK-type model has been challenged on grounds of empirical validity, albeit the debate
on this front remains inconclusive. The leading critic of this model is Jones (1995), who uses
post-WW II data for 15 OECD countries to show that GDP rates did not match the increases in
investment rates during this period. However, McGrattan (1998) argues that Jones’ (1995)
finding were incidental, in the sense that the sample coincided with a short-lived period when
investment rates simply grew faster than GDP growth. Using data stretching to the 19th century,
McGrattan (1998) shows that the main prediction of the AK-type model is consistent not only
for the sample of OECD and three non-OECD Asian countries, but also for a cross-sectional
sample of nations at different stages of development. Similarly, Li (2002) shows that Jones’
(1995) empirical findings are neither robust to changes in the definition of investment nor
changes in the dataset.
Despite the above and other criticisms, the AK – type model remains a desirable modelling
tool for two main reasons. Firstly, its simplicity entails that it is a tractable framework. This
property is particularly desirable for the technology-adoption model developed in this thesis.
Secondly, the presence of constant returns to capital deepening in the AK – type model ensures
that the framework generates sustained growth. Consequently, it is possible to interpret the

19 | P a g e
non-convergence of cross country per capita incomes as resulting from the process of capital
deepening.
The foregoing discussion highlights that technology is an important factor in economic
growth. Thus, in order to understand the sources of per capita income differences across
nations, it is important to measure the level of technological innovation and technology
adoption, particularly in developing economies. However, measuring technological progress and
technology adoption is a challenging task. This is mainly because these variables are neither
countable, as with goods, nor is it possible to definitively determine their market value, as with
services (see World Bank, 2008). As such, the existing measures are indirect, and they focus on
different aspects of technological progress. Giving an exhaustive list of these measures is beyond
the objectives of this discussion. However, we highlight some of these measures in passing, and
refer readers to World Bank (2008) for a detailed discussion.
One type of measure encompasses input-based measures such as education levels, number
of scientists, expenditure on R&D. Another type includes output-based measures, for example,
the share of high-tech activities in manufacturing value added and exports, indices for
competitive industrial performance (see World Bank, 2008; United Nation Industrial
Development Organisation (UNIDO), 2002), etc. Yet another type of measures focuses on the
mechanisms by which technological progress is achieved (Sagasti 2003) or by which
technological learning occurs (Soubattina 2006). Finally, other measures are based on the
information on technological diffusion and innovation, for example the number of patents
granted.
A report by the World Bank (2008) shows that most developing countries have performed
poorly according to all of the above measures since the 1950s. However, there have been
improvements in some of the Asian countries, for instance South Korea, China, Malaysia,
Singapore, Hong Kong, and India, particularly based on measures such as educational
attainment and the proportion of high-technology exports in total exports. A question that
arises, then, is why developing countries have fared so badly. In what follows, we discuss the
barriers to technological progress and technology adoption as one of the major explanations for
this.

20 | P a g e
The role of various barriers in slowing technological progress, technology adoption, and
economic growth has been emphasised in several endogenous growth models. These barriers
can manifest in different forms, such as physical and human capital constraints that might
hinder the proper use of the new technology (see Basu and Weil, 1998), politico-economy
induced barriers such as resistance by competing political groups, unionism, violence and
vandalism (see Mokyr, 1990), institutional, policy, and legal induced barriers, and barriers that
are created by the existence of monopolies (see Parente and Prescott, 1994). These barriers
have been incorporated in endogenous growth models in a variety of ways.
In Parente and Prescott (1994), barriers to technology adoption are modelled in the form
of a country-specific and time-variant cost of additional investment that is required to adopt the
new technology. Holmes and Schimitz (1995) use a policy parameter that discourages
investment, while Ngai (2004) uses a legal parameter that distorts the market price of goods
produced by the superior technology. Yet another strand of studies model barriers to
technology adoption in the form of a cost associated with using the superior technology. Within
this strand, the adoption cost is modelled as manifesting in different forms. For instance, in
Hornstein and Krusell (1996), Greenwood and Yorukoglu (1997), and Canton et al. (2002), the
adoption cost is modelled in the form of a productivity slowdown during the process of
innovation. However, these three studies differ in the manner in which they interpret the source
of this productivity slowdown. Hornstein and Krusell (1996) interpret the productivity loss as
emanating from all the possible costs that are associated with investment specific technological
change. Greenwood and Yorukoglu (1997) interpret the productivity slowdown as manifesting
through learning and accumulating the new skills needed to operate the new technology. Canton
et al. (2002) interpret the productivity loss manifesting through the leisure time forgone by
workers when they learn the new skills needed to operate the new technology.
Another approach to modelling the barriers to technology adoption is using a fixed cost of
some sort. This fixed cost is in turn interpreted in a variety of ways. For example, Leung and Tse
(2001) interpret this fixed cost as a sunk cost (e.g. the units of capital) that agents must pay to
adopt the more productive technology. Lahiri and Ratnasiri (2012) interpret this fixed cost as a
‘learning-by-doing’ cost associated with the more productive technologies. Furthermore, their
model adopts an overlapping generation structure which characterizes this ‘learning-by-doing’
cost as being incurred by every generation. In the current study, we interpret the cost in a
manner somewhat similar to that of Lahiri and Ratnasiri (2012), although the ‘learning-by-

21 | P a g e
doing’ feature takes on a slightly different meaning due to the presence of uncertainty. We
provide further discussion and motivation for this interpretation in Chapter 3.
Other barriers to technology adoption manifest in the form of shocks that affect either the
productivity of the technology or the consumption of agents. Although these shocks have been
particularly emphasised in the literature on the adoption of agricultural technologies, and
electrical energy and green energy technologies, in the current study, we generalise these
shocks to apply in the context of any type of technology. In the context of the adoption of
agricultural technologies, there are production shocks, which include the variability in weather
conditions, the uncertainty with regards to dynamics of pests, and fluctuations in the prices of
the inputs that are important in the adoption of the new technology. These shocks will then
affect the expected yield. On the other hand, there are shocks such as droughts, domestic or
global macroeconomic shocks, and financial crises which may be classified as consumption
shocks.
The effects of shocks on long run patterns of technology adoption and economic
development will then depend on the agents’ individual risk preferences, and the ability of
agents to diversify these shocks. This then implies that an economy would delay technology
adoption and potentially fall into risk-induced poverty traps if the majority of the economic
agents in the economy are risk-averse (see Dercon, 2002). Similarly, poverty traps would most
likely result if most agents do not have access to institutions that alleviate the shocks. Thus,
shocks are most likely to constrain agents from developing nations than agents from developed
nations, since the former nations do not have well developed institutions to alleviate/diversify
the risk associated with new technologies.
There have been many attempts to analyse the effect of risk on technology adoption,
although much of this literature focuses on micro-level effects of risk and uncertainty. More
specifically, the literature stops short of analysing the impact of risk on macro-level economic
outcomes such as economic growth and inequality. Studies such as Jensen (1982), Just and
Zilberman (1983), Fishelson and Rymon (1989), Dinar and Zilberman (1991), Dinar et al.
(1992), and Dridi and Khanna (2005) have empirically analysed the structural, socio-economic
and demographic factors that impact on the diffusion of technologies. Although the results from
these studies are mixed with regards to the importance of all the other factors used, there is a
consensus that risk is the major factor influencing the rate of adoption. Another strand of
22 | P a g e
empirical studies has analysed role of perceptions about the uncertainty in future yield on the
adoption of new technologies (see Tsur et al., 1990; Saha et al., 1994). The results from these
studies show that information dissemination enhances technology adoption.
On a theoretical level, many micro-level models show that, in the presence of various
forms of production and output uncertainties, risk aversion can influence technology adoption
decisions in the agricultural sector (see for example Hiebert, 1974; Feder, 1984, Just and
Zilberman, 1983; Isik and Khanna, 2003; Koundouri, etal., 2006).6 Dercon and Christiaensen
(2011) focus on the effects of consumption shocks on technology adoption. They develop a
simple model to show that the consumption shocks associated with drought reduce the
adoption of modern agricultural technologies. Using an empirical model that controls for
seasonal working capital constraints, fixed effects (such as risk preferences and permanent
income) and time-varying community fixed effects (such as input output price ratios, current
weather circumstances and extension programs), they find evidence consistent with the idea
that consumption risk reduces the use of fertilizer by Ethiopian farmers.
In light of the literature discussed above, the endogenous growth models developed in this
thesis incorporate the idea that the barriers to the adoption of superior technology are not only
in the form of the adoption costs associated with superior technologies, but also the risks that
are associated with the returns of these technologies. As already mentioned, we do this by
assuming that the adoption of the superior technology takes place in an environment which is
subject to idiosyncratic risk.
In a nutshell, the foregoing discussion suggests that various barriers constrain
technological progress, which in turn affects the long economic outcomes of a nation. This, then,
implies that in nations where barriers to technological progress are higher (lower), the rate of
technological progress is lower (higher), and consequently, economic growth rate will be lower
(higher). Therefore, technological change is potentially the key source of the diversity in growth
experiences of nations as well as the non-convergence of incomes within and across nations. In
light of this, the next section discusses the various issues relating to the relationship between
growth and inequality, particularly during the process of technology adoption. Furthermore,
because inequality often leads to distributional conflicts among groups of agents, we also
6 Feder, Just and Zilberman (1985) provides an extensive survey of some of this literature.

23 | P a g e
explore the political economy issues pertaining to the relationship between growth and
inequality.
2.4 Growth and Inequality: The Role of Technology and Politico-Economy Issues
A large body of empirical literature has explored the link between growth and inequality,
albeit the results still remain mixed. These studies stem from Kuznets (1963) whose classical
contribution, popularly known as the Kuznets hypothesis has shaped subsequent discussions on
this subject. The Kuznets hypothesis suggests that there is a natural tendency for inequality to
follow a market-driven inverted-U shape. According to this view, as the economy ‘takes-off’,
opportunities arise in the modern sectors of the economy, particularly those in urban centres.
Because workers from the traditional sectors of the economy (usually those in rural areas) are
unskilled, they cannot easily switch to the modern sectors unless they are willing to accept low
wages. This widening gap between rural and urban labour drives overall inequality upwards.
However, once the economy has ‘taken-off’ and reaches a certain threshold level of
development, more resources are allocated towards human capital development and
redistribution, thus reducing inequality. In line with the Kuznets (1963) hypothesis, Barro
(2000) uses panel data from Deininger and Squire (1996) to show that the relationship between
initial inequality and growth is negative for poor nations and positive for rich nations.
However, two main issues are raised against the Kuznets (1963) hypothesis. Firstly,
researchers question why East Asian countries experienced a decline in inequality during their
early stages of development (between the 1960s and 1970s), but suffered growing inequality in
the 1990s when they had reached a higher stage of development (see Krongkaew, 1994; Zin,
2005; Ortiz and Cummins, 2011). Similarly, researchers question why India experienced an
increase in inequality between the 1960s and the mid-1990s, even though its growth rate
stagnated (see Chusseau and Lambrecht, 2012). Secondly, questions regarding why a number of
high-income economies experienced an increasing inequality since the 1980s have been raised
(Chusseau and Lambrecht, 2012). Consequently, alternative explanations regarding the
relationship between growth and inequality have emerged.
One such explanation suggests that causality runs from initial inequality to growth. This
explanation is based on the idea that the relationship between growth and inequality is driven
by political economy issues. Although not stated explicitly, this idea is indirectly implied in the
Kuznets hypothesis since the redistribution that takes place once the economy has reached some

24 | P a g e
threshold level of development is likely to be driven by the political conflicts arising from high
inequality. Typically, political economy models examine how the existence of agents with
conflicting interests affects the optimal choice of policies and the long run economic outcomes.
In line with this explanation, Alesina and Rodrick (1994) develop a politico-economy
endogenous growth model where agents vote on the tax rate on capital. The political outcome of
the model is determined by the median agent. When the economy is characterised by high initial
inequality, the median agent is poor. As such, the political outcome is characterised by a high tax
rate on capital resulting in poor long-run growth. The authors use inequality in land holdings as
a proxy for initial inequality to provide empirical evidence consistent with this result. Persson
and Tabellini (1994) also develop a model with a relatively similar structure and predictions.
Furthermore, they provide empirical evidence suggesting the income equality enhances
economic growth in democratic economies, although their measure of inequality is based on
income share of the third quintile. Similarly, Bénabou (1996) develops a political economy
model to show that high inequality creates distributional conflicts, thereby slowing down
growth. The author provides supporting empirical evidence showing that South Korea, which
had lower inequality in the 1960s and 1970s, grew faster than the Philippines, a country that
had quite similar macroeconomic features but higher inequality.
Nevertheless, other politico-economy studies such as Saint-Paul and Verdier (1993), Li and
Zou (1998), and Forbes (2000) show that growth and initial inequality are positively related.
Saint-Paul and Verdier (1993) develop a model where agents vote on the preferred proportion
of government revenue from a tax on labour income that should be allocated towards education.
Their results show that high initial inequality results in more expenditure on education. Since
education improves future human capital development, this then leads to long run growth. Li
and Zou (1998) modify Alesina and Rodrik (1994) model to accommodate for the idea that the
government expenditure consists of both production and consumption goods. They then show
that if consumption goods are combined with the agents’ private consumption, the predictions
of this modified model could either be positive or ambiguous, depending on the trade-off
between private and public consumption. Using a measure of inequality based on the Gini
coefficients for a sample of 114 developed and developing nations, Li and Zou (1998) show that
the relationship between growth and inequality is positive and significant, even after controlling
for other determinants of growth. Forbes (2000) uses a model controlled for omitted-variable

25 | P a g e
bias to document robust evidence of positive short-term and medium-term relationships
between growth and inequality for a panel of 45 developed and developing nations.
A number of studies have also analysed the impact of new technologies on the relationship
between growth and inequality. In most of these studies, superior technologies affect inequality
through human capital (see Krusell et al., 2002, Acemoglu, 2002, He and Liu, 2008). The
intuition here is that technological change seems to be biased towards certain skills (see Krusell,
et al. 2002; Caselli, 1999; Acemoglu, 2002; He and Liu, 2008). Thus, agents with the relevant
skills will earn a skills-premium over unskilled agents. The empirical support for this argument
is based on the observation that the productivity of skilled workers rises faster than that of
unskilled workers. Since workers are paid according to their marginal productivity, it must be
the case that the earnings of skilled labour have accelerated faster than those of unskilled
workers.
However, Weiss (2008) shows that the technology-induced inequality between skilled and
unskilled labour is not as large in the long run. The explanation for this finding is based on the
idea that factors of production are paid according to their marginal value, which is the product
of marginal productivity and output price. During the process of technological progress, factors
of production move from low-technology to high-technology sectors, thus reducing the supply of
low technology goods. As a result, the relative prices of ‘low-technology’ goods rise above those
of ‘high-technology’ goods. Since workers are paid according to the marginal value, the increase
in the relative price of low-technology goods will then counter the initial decrease in the relative
wages of unskilled workers.
Recent evidence also suggests physical capital accumulation has increasingly become an
important channel through which technology affects inequality (Atkinson et al., 2011). This is
because new technology does not only enhance the skill-capital complementarities, but also
enhances capital intensity (Lansing and Markiewicz, 2011). Atkinson et al. (2011) and Lansing
and Markiewicz (2011) argue that these features have been observed during the Information
and Communication Technologies (ICT) led innovations.
There are also political economy studies that attempt to analyse the relationship between
inequality and growth during the process of technology adoption. Results that commonly
emerge from these studies are consistent with the ‘economic loser hypothesis’. This hypothesis
26 | P a g e
was coined by Kuznets (1968) and later developed by Mokyr (1990), and was then formalised in
the technology adoption literature by Krusell and Rios-Rull (1996) and Parente and Prescott
(1997). According to this idea, ‘interest groups’, comprising of agents at the top end of the
distribution block the introduction of new technologies if they threaten their ‘economic rent’.
This creates a twin-negative effect of poor rates of technological adoption and economic growth,
and persistence of inequality.
However, Acemoglu and Robinson’s (2000; 2006) political economy models show that
new technologies are not merely blocked on the basis that they threaten ‘economic rent’, but on
the basis that they threaten ‘political power’. Based on this prediction, the authors suggest that,
in order to understand why technology adoption is poor in some countries, researchers should
look at the factors that determine the distribution of political power such as political and legal
institutions.
The foregoing discussion shows that the relationship between inequality and growth is not
easy to analyse empirically. Depending on the theoretical framework being used, the
relationship can be either positive or negative, unidirectional or bidirectional. Furthermore,
given that politico-economy conflicts affect the evolution of inequality, the relationship between
growth and inequality is likely to be non-linear since preferences of different interest groups
vary, depending on the level of inequality and wealth. Furthermore, the evolution of political
preferences and the expressions of these preferences are likely to differ across countries
because of differences in social factors, political and legal institutions, and type of political
regime. In light of these issues, caution should be exercised when interpreting empirical studies
that impose a one way, linear and parametric relationship between growth and inequality.
Likewise, empirical studies based on cross-country data should also be interpreted with caution
in light of differences in the institutions that shape different nations (see Banerjee and Newman,
1991; Aghion and Bolton, 1992; 1997).
To illustrate the complexity of the relationship between growth and inequality, we
consider the evolution in inequality and growth for six countries at different levels of
development. These include the USA, Brazil, China, India, Malaysia, and Malawi. All the six
countries experienced a positive average growth between 1990 and 2005. However, three of the
countries experienced a decrease in inequality (Brazil, Malaysia, and Malawi), while the
remaining three experienced an increase in inequality (USA, China, and India). Inequality is
27 | P a g e
measured by the share of wealth received by the upper most quartile versus that received by the
bottom-end quartile of the income distribution.
Figure 2.6 presents the countries that experienced a decrease in inequality, while Figure
2.7 presents the countries that experienced an increase in inequality. In each of these figures,
the inequality data for each country is presented separately in the first, second, and third
quadrant, while the growth rates are presented together in the fourth quadrant. It is evident
that the growth and inequality data presented in the figure below cannot be easily interpreted
by a single theoretical model.
For example, in two countries at their early stages of development (Malawi and Brazil),
growth was associated with a decrease in inequality between 1990 and 2005, while in the USA,
a developed nation, growth was associated with an increase in inequality. This is inconsistent
with Kuznets’ (1963) idea that inequality increases at the early stages of development and
decreases at the higher stage of development. However, in the case of China and India, the
relationship between inequality and growth is negative and consistent with the Kuznets
hypothesis.
Another question that arises regards why the relationship between growth and intra-
country inequality differs for Brazil and India even though they are arguably at a comparable
level of development. It could then be argued that country-specific and time-specific issues, such
as political, social and demographic factors, might have played a role in explaining the difference
in inequality changes in these two countries.
This discussion serves to highlight that there is substantial complexity in the relationship
between growth and inequality, suggesting a scope for further research. Furthermore, cross-
country differences in the relationship between growth and inequality entail that country-
specific empirical studies are likely to be more useful in identifying the relationship between
these variables than studies based on cross-country data. Unfortunately, relevant data,
particularly for developing nations, is not yet rich enough to perform country-specific empirical
studies.
Finally, in the majority of the literature on technological progress, the state of technologies
available in the economy, and the barriers that constrain the adoption of superior technologies
28 | P a g e
are determined by certain initial structural features of the economy. Overtime, these structural
features change due to changes in institutional and policy reforms thereby altering these initial
conditions. Apart from altering the state of technologies and the barriers that constrain
technology adoption, these can also affect long run growth by facilitating the reallocation of
resources. This is the subject discussed in the next section, and this discussion forms basis for
the empirical essay presented in Chapter 5.
2.5 Globalisation, Allocation of Resources and Economic Growth
Many studies have emphasized the importance of resource allocation in promoting
economic growth. Robinson (1971) develops a model to examine the contribution of the
reallocation of resources between agricultural and non-agricultural sectors to growth. He then
uses the model to provide empirical evidence suggesting that the role of played by the
reallocation of resources in economic growth is much larger for less developed nations than
developed nations. Using Robinson’s (1971) model, Feder (1986) provides cross-sectional
evidence that reallocating resources from low productivity non-export sectors to high
productivity export sectors results in large gains in growth. Similarly, Swiecki (2012) provides
evidence suggesting that misallocation of resources reduces the welfare gains from trade.
McMillan and Rodrik (2011) present evidence suggesting that the growth success of Asian
nations such as China, Singapore, South Korea, and India over Sub Saharan and Latin American
nations was mainly because the former nations successfully implemented policies that are
aimed at improving reallocation of resources. This sentiment is also shared by a number of
studies on China and India. For instance, Cortuk and Singh (2011) document evidence that
reallocation of resources was among the main drivers of economic growth in India for the
period 1988 - 2007, using measures of structural change based on the norm of absolute values
and the standard deviations of sectoral growth rates in employment. Likewise Fan et al. (2003)
show that inter-sectoral reallocation of resources was among the main drivers of China’s
impressive growth between 1978 and 1995. Furthermore, reallocation of resources is credited
as one of the major factors behind the so-called ‘age of productivity’ between 1950 and 1975 in
Latin Africa. More specifically, during this period, Latin America experienced a 4% productivity
growth, approximately half of which is attributed to the reallocation of resources from non-
productive to productive sectors (see Pagés, 2010).

29 | P a g e
Given the role that reallocation of resources plays in enhancing economic growth,
understanding its sources becomes of policy relevance. In the classical economic development
literature, the reallocation of resources from the primary sector to the modern sectors of the
economy is driven by increases in agricultural productivity which then pushes labour from the
primary sector towards other sectors. In contrast, studies such as Lewis (2008) and Hansen and
Prescott (2002) provide an alternative view, in which an increase in productivity in the modern
sectors of the economy will set in motion resource reallocation by pulling resources out of the
primary sectors of the economy.
Globalisation has also been emphasized as a major driver of the reallocation of resources
in recent years (see Almeida and Wolfenzon, 2004; Galindo et al., 2007; Abiad et al., 2008). In
these studies, reforms aimed at liberalising the financial system and integrating the economy in
the global world enhance economy wide firm-level reallocation of capital.7 In the essay
presented in Chapter 5, we examine how globalisation, along with factors such as institutional
quality and human capital development, enhances intra-sector and inter-sector reallocation of
capital from low-productivity to high-productivity firms/sectors in South Africa.
2.6 Concluding Remarks
This chapter explored the related literature and the underlying motivation for this thesis.
These include the diversity in growth experiences of nations and the non-convergence of
incomes within and across nations. We then explored the role of technological progress and
technology adoption in explaining these differences. The state of the technology available in the
economy and barriers that constrain the adoption of technologies often determine the long run
outcomes of the economy.
Existing literature has gone a long way in addressing some of the issues that motivate this
thesis. Specifically, the role of technology adoption in explaining the diverse economic outcomes
of nations has been explored in a variety of ways. Related studies have emphasized the role of
technology adoption costs in constraining the adoption of superior technologies, thereby
inducing bad long run economic outcomes. However, the role of risk in constraining technology
adoption and long run economic outcomes has not been emphasized. To that end, the
7 We discuss this literature in detail in the essay presented in Chapter 5.

30 | P a g e
benchmark model presented in Chapter 3 extends the existing literature by addressing the role
of uncertainty in technology adoption and long run economic outcomes.
The structural features of an economy change overtime due to factors such as institutional,
and policy reforms. Chapters 4 and 5 present essays, which explore two channels through which
changes in structural features of the economy affect long run economic outcomes. The essay in
Chapter 4 is a political economy extension of the benchmark model to accommodate for the idea
that these changes may generate political-economy responses, which in turn influence the
technology adoption decisions, economic growth, and inequality. Chapter 5 presents an
empirical essay, which explores the idea that the changes in the structural features of the
economy can result in better functioning of markets, thereby promoting efficient reallocation of
resources.
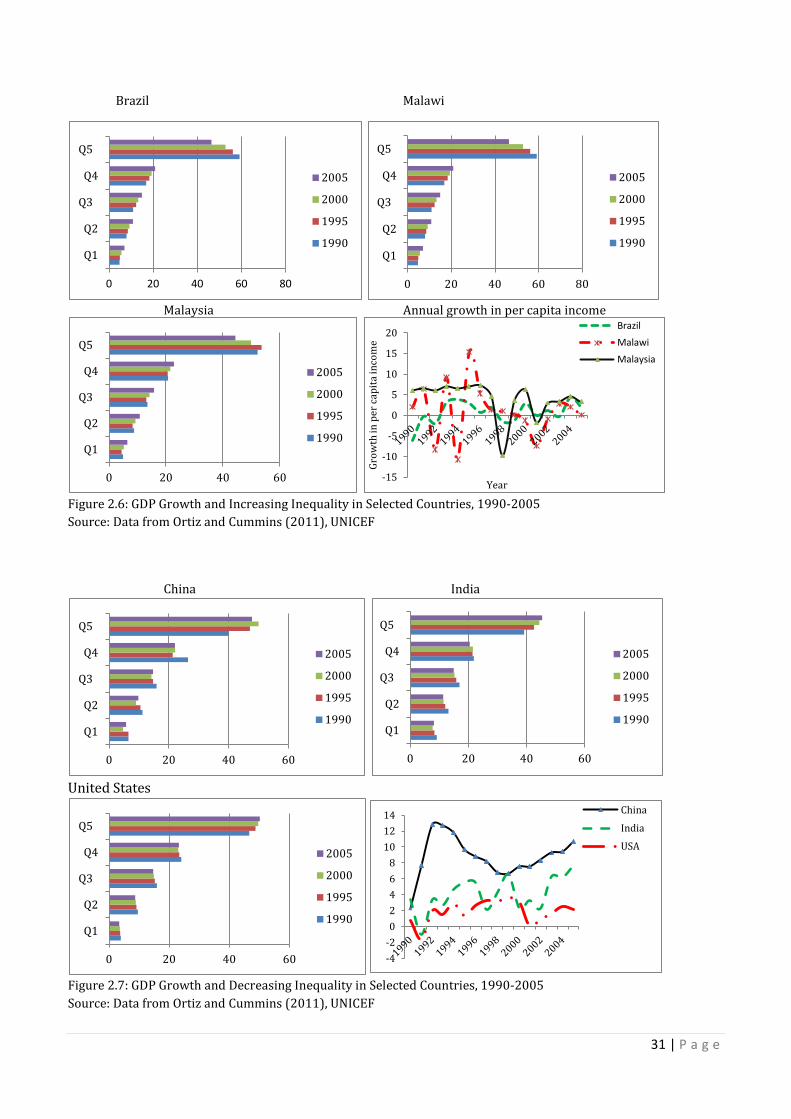
31 | P a g e
Brazil Malawi
Malaysia Annual growth in per capita income
Figure 2.6: GDP Growth and Increasing Inequality in Selected Countries, 1990-2005 Source: Data from Ortiz and Cummins (2011), UNICEF
China India
United States
Figure 2.7: GDP Growth and Decreasing Inequality in Selected Countries, 1990-2005 Source: Data from Ortiz and Cummins (2011), UNICEF
0 20 40 60 80
Q1
Q2
Q3
Q4
Q5
2005
2000
1995
1990
0 20 40 60 80
Q1
Q2
Q3
Q4
Q5
2005
2000
1995
1990
0 20 40 60
Q1
Q2
Q3
Q4
Q5
2005
2000
1995
1990
-15
-10
-5
0
5
10
15
20
Grow
th in
per
capi
ta in
com
e
Year
Brazil Malawi Malaysia
0 20 40 60
Q1
Q2
Q3
Q4
Q5
2005
2000
1995
1990
0 20 40 60
Q1
Q2
Q3
Q4
Q5
2005
2000
1995
1990
0 20 40 60
Q1
Q2
Q3
Q4
Q5
2005
2000
1995
1990
-4 -2 0 2 4 6 8
10 12 14 China
India
USA
32 | P a g e
CHAPTER 3
ECONOMIC GROWTH AND INEQUALITY PATTERNS IN THE PRESENCE OF COSTLY TECHNOLOGY ADOPTION AND UNCERTAINTY
3.1 Introduction
While new technologies usually bring gains in Total Factor Productivity (TFP) (see Wirz,
2008), the decision to adopt these technologies is complicated by a number of issues. The first
issue regards the size of productivity gains from the modern technology, particularly relative to
existing technologies. The second issue regards the costs associated with adopting this modern
technology. The size of this adoption cost is particularly relevant when compared to the relative
productivity gains from the technology (see Lahiri and Ratnasiri, 2012). The third issue
concerns the risk/uncertainty that faces agents when they make decisions on whether to adopt
the modern technology.
Uncertainty in technology adoption decisions can emanate from a number of sources.
Firstly, it could emanate from the fact that the productivity gains associated with the modern
technology are subject to particular future events whose occurrence is unknown at the time of
the decision (Ulu and Smith, 2009). Secondly, uncertainty could result from the fact that the
price of inputs used with the new technology may change unexpectedly. For instance, the
adoption of high yield varieties (HYVs) in many developing nations is associated with risk in the
form of weather and climate (e.g. Sharma et al., 2006; Gine, 2007; Dercon and Christiaensen,
2011). Typically, weather and climate impact on the proportion of fertilizer use that is optimal
with HYVs, but not with traditional varieties, because farmers already have good experience
with optimal fertilizer use associated with the latter varieties. Thus farmers would need time to
learn the optimal fertilizer application required with HYVs in different weather and climatic
conditions. Furthermore, HYVs involve greater fertilizer use and the prices of such inputs are
subject to fluctuations, which create an additional uncertainty.
Thirdly, uncertainty can emanate from unexpected consumption shocks that affect the
welfare of consumers thereby directly affecting preferences for modern technologies. For
33 | P a g e
instance, Dercon and Christiaensen (2011) find survey based evidence from Ethiopia suggesting
that consumption shocks resulting from drought lead to a reduction in fertilizer use among poor
farmers. However, the effects of consumption shocks on technology adoption can also be
indirect, through their impact on the inputs of technology adoption. For example, Dasgupta and
Ajwad (2011) document evidence based on survey data suggesting that income shocks resulting
from the 2007/2008 global financial crisis resulted in a reduction in households’ investment in
education in Armenia, Bulgaria, Montenegro, Romania, and Turkey. Since learning is an
important element in the adoption of new technologies, any kind of shock that adversely affects
education would delay adoption. These shocks would more likely affect developing countries
than developed countries, which have historically invested in education and sufficient amount of
human capital deepening has already taken place. Furthermore, the reduction in investment in
education is also likely to amplify the delay in the adoption of technology associated with
production risk. This is because educated agents are better able to manage risk than uneducated
agents (see Lin, 1991). Finally, all the above forms of risk can be exacerbated by policy
uncertainties. Typically, policy uncertainties affect the risk of new technologies through
influencing the markets for the input used with the technology, or outputs from the technology.
Apart from the education channel mentioned above, uncertainty is more likely to constrain
technology adoption decisions of agents from developing nations than those from developed
nations for two main reasons. Firstly, reducing uncertainty depends on the availability of
institutions that disseminate information about the factors that may affect future yields, input,
and output prices associated with the new technology. These institutions are either
underdeveloped or absent in developing countries. Secondly, it depends on the availability of
institutions that help agents to alleviate the risk associated with the modern technology.
Typically, these can either be private insurance companies or other informal risk sharing
schemes (see Dercon and Christiaensen, 2011). In developing countries, insurance companies
are often unwilling to insure poor agents, particularly those who rely on subsistence agriculture
(see Gine and Yang, 2007). Although informal risk sharing schemes exist in some developing
nations, they only offer partial protection against risk (see Morduch, 1995; Townsend, 1995;
Dercon 2002). As a result, poor agents fail to switch to modern agricultural technologies.
A number of studies document that uncertainty influences economic outcomes, albeit most
of this literature focusses on developed nations. For example, Bloom (2009) develops a model
with time varying variance to show that macro-level uncertainty has a negative influence on

34 | P a g e
employment, productivity and aggregate output. Martin and Roger (2000) develop a model to
show that business cycle fluctuations are negatively related to expected long term growth if
labour supply is increasing and concave. Furthermore, they provide evidence to suggest that
developed nations with higher fluctuations in growth and unemployment have low growth
rates. Asteriou and Price (2005) provide panel data evidence from 59 developed and developing
nations to show that uncertainty reduces investment and growth. Of course there are also
studies that provide evidence to the contrary. For example Oikawa (2010) develops a model
where uncertainty induces more research aimed at reducing it, resulting in the accumulation of
social knowledge. Kose et al. (2006) document evidence of a positive relationship between
growth and fluctuations for a sample of developed nations, but a negative relationship for
developing nations. This result is in line with our discussion earlier that agents from developing
nations, particularly those who lack access to financial institutions are more likely to be
adversely affected by uncertainty. The model developed in this essay is motivated by this
evidence.
It is interesting to examine whether the three factors mentioned above can explain the
short run technology adoption decisions of agents and the long run technology adoption levels
of economies. If that were the case, it would be possible to explain why different countries use
different production technologies, and why some countries delay the adoption of superior
technologies. Furthermore, given that technological progress is an important determinant of
growth and inequality, understanding the determinants of short run and long run technology
adoption would enable us to explain differences in global growth patterns and non-convergence
in incomes observed across and within nations. To that end, the current essay seeks to address
these issues. Relative to existing literature, the main contribution of the essay is in explaining
the role of idiosyncratic uncertainty in technology adoption decisions, and how this affects the
transitional path of growth and inequality, as well as the relationship between these two
variables in the long run.
To address the issues raised above, we develop a simple two-period lived overlapping-
generations model where endogenous growth takes place through physical and human capital
deepening. In the model, agents can invest in either one of the two technologies available in the
economy. The first technology is safe but less productive, and the second is more productive but
its returns are subject to risk which is agent-idiosyncratic. Furthermore, the adoption of the
latter technology is subject to a fixed adoption cost. The risk component emanates from the fact

35 | P a g e
that technology adoption occurs in an environment that is uncertain, partly due to unexpected
shocks and partly due to the fact that developing nations do not have developed institutions that
facilitate risk diversification. Put differently, in the absence of well-developed institutions,
entrepreneurs face a ‘learning-by-doing’ cost of adopting technologies that have a high return
on average, but are associated with risk. In this case this cost also has an opportunity cost
element in the form of returns foregone due to a lack of developed institutions that would have
otherwise helped alleviate this risk. Furthermore, we emphasize that this cost is not necessarily
limited to ‘monetary value’ paid, but may also involve a ‘time component’ representing the time
spent learning and acquiring knowledge that can only be gained experientially.
Based on some of the analytical outcomes of the model as well as the results of numerical
experiments, we are able to explain a variety of outcomes. Firstly, we show that the diversity in
growth and inequality outcomes of transitional economies can be traced to differences in certain
initial conditions that characterize the economy. These conditions relate to the levels and the
differences in initial productivities of technologies, the adoption costs associated with more
productive technologies, and the ability to alleviate the shocks associated with the more
productive technologies.
To elaborate on the aforementioned outcomes, our model shows that varying the standard
deviations of the uncertainty parameters affects both the short term timing of technology
adoption decisions, and the long run technology adoption levels. As such, shocks affect the
transitional path of growth and inequality, and the long run economic outcomes of a nation.
More specifically, holding other parameters constant, large shocks tend to drive the economy
into the poverty trap, while moderately sized shocks result in a dual economy, and low shocks
lead to a balanced growth.
Keeping the shock parameters constant, varying the adoption cost and the non-stochastic
productivity parameters yields various outcomes.8 In this case, the ‘poverty trap’ and ‘dual
economy’ outcomes have other ‘sub-outcomes’. Each of these ‘sub-outcomes’ is associated with
its own set of productivity and adoption cost parameters. Furthermore each of these ‘sub-
outcomes’ shows its own unique growth and inequality patterns, thus suggesting the existence
of a diversity within diversity. Consequently, the presence of uncertainty in the model results in a
richer range of growth and inequality patterns relative to models that do not account for this 8 These outcomes are somewhat similar to those in Lahiri and Ratnasiri (2012) although due to the presence of uncertainty there are sub-outcomes which are only possible in a stochastic model.

36 | P a g e
aspect of technology adoption. In this regard, another contribution of the benchmark model is in
its ability to capture these diverse outcomes and ‘sub-outcomes’ within a unified framework.
Finally, our model also shows that the persistence in cross-dynasty inequality can be
traced to the delays in physical and human capital deepening by poor dynasties due to their
limited initial resource endowment. A feature of the model is that both growth and inequality
are subject to fluctuations over time. These fluctuations are, in part, due to the presence of
uncertainty, but intrinsic to the model is the possibility of reversals in the growth process, even
if uncertainty were absent.
The benchmark model is related to a number of models in the literature. Firstly, it is
related to models such as Hiebert (1974), Feder (1980), Just and Zilberman (1983), Isik and
Khanna (2003), Koundouri etal. (2006), and Dercon and Christiaensen (2011) that emphasize
the role of risk and uncertainty in explaining technology adoption decisions. However, most of
these models focus on specific technologies, particularly those within the agricultural sector. As
such they stop short of analysing the macro-level effects of these technology adoption decisions
on variables such as growth and inequality.
Secondly our model is related to a strand of models that emphasize the role the of
adoption cost as a constraint to technology adoption. These models include, among others,
Parente and Prescott (1994), Hornstein and Krusell (1996), Greenwood and Yorukoglu (1997),
Leung and Tse (2001), Canton et al. (2002), Lahiri and Ratnasiri (2012), and they characterise
the adoption cost parameter in a different forms. Our characterisation of the adoption cost is in
the form of ‘learning-by-doing’ cost associated with technical change, as in models such as
Romer (1986), Lucas (1988), and Rebelo (1991), as well as some type of learning of the ‘new
skill’ required to operate the modern high return technology (see for example Lahiri and
Ratnasiri, 2012). It is then possible to interpret the persistence in inequality within and across
developing nations as occurring through delays in the adoption of the superior technology.
These delays result from a lack of resources for acquiring the high level skills needed to operate
the superior technology. Furthermore, in the context of our benchmark model, the presence of
uncertainty complicates the learning process, thereby causing further delays in technology
adoption.
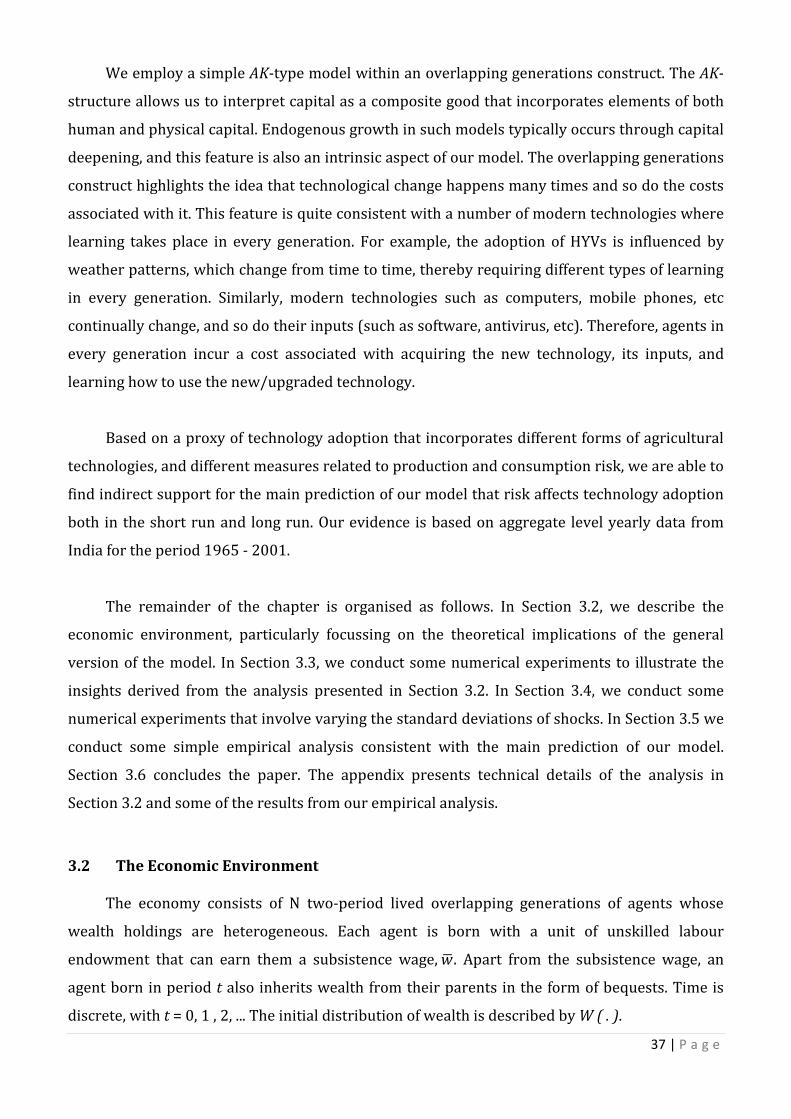
37 | P a g e
We employ a simple AK-type model within an overlapping generations construct. The AK-
structure allows us to interpret capital as a composite good that incorporates elements of both
human and physical capital. Endogenous growth in such models typically occurs through capital
deepening, and this feature is also an intrinsic aspect of our model. The overlapping generations
construct highlights the idea that technological change happens many times and so do the costs
associated with it. This feature is quite consistent with a number of modern technologies where
learning takes place in every generation. For example, the adoption of HYVs is influenced by
weather patterns, which change from time to time, thereby requiring different types of learning
in every generation. Similarly, modern technologies such as computers, mobile phones, etc
continually change, and so do their inputs (such as software, antivirus, etc). Therefore, agents in
every generation incur a cost associated with acquiring the new technology, its inputs, and
learning how to use the new/upgraded technology.
Based on a proxy of technology adoption that incorporates different forms of agricultural
technologies, and different measures related to production and consumption risk, we are able to
find indirect support for the main prediction of our model that risk affects technology adoption
both in the short run and long run. Our evidence is based on aggregate level yearly data from
India for the period 1965 - 2001.
The remainder of the chapter is organised as follows. In Section 3.2, we describe the
economic environment, particularly focussing on the theoretical implications of the general
version of the model. In Section 3.3, we conduct some numerical experiments to illustrate the
insights derived from the analysis presented in Section 3.2. In Section 3.4, we conduct some
numerical experiments that involve varying the standard deviations of shocks. In Section 3.5 we
conduct some simple empirical analysis consistent with the main prediction of our model.
Section 3.6 concludes the paper. The appendix presents technical details of the analysis in
Section 3.2 and some of the results from our empirical analysis.
3.2 The Economic Environment
The economy consists of N two-period lived overlapping generations of agents whose
wealth holdings are heterogeneous. Each agent is born with a unit of unskilled labour
endowment that can earn them a subsistence wage, 𝑤� . Apart from the subsistence wage, an
agent born in period t also inherits wealth from their parents in the form of bequests. Time is
discrete, with t = 0, 1 , 2, ... The initial distribution of wealth is described by W ( . ).

38 | P a g e
In each period t, agents must decide which among two technologies they should adopt. We
refer to these technologies as Technology A and Technology B. Technology A is both cost-free and
risk-free. However, this technology is less productive, giving a time-invariant return of 𝜙.
Technology B has a stochastic return, and is, on average, more productive than Technology A.
However, the adoption of Technology B is subject to an exogenous adoption cost, δ. Furthermore,
the return on Technology B is divided into two parts. The first part of the return 𝜂 > 𝜙 is certain.
The second part of the return tε is subject to uncertainty and depends on the type of shock that
Technology B is subjected to. These shocks are idiosyncratic to agents. If the shock is bad, and
this occurs with the probability p, then 0,, <= liti εε , while if the shock is good 0,, >= hiti εε .
Furthermore, we assume that ηε <li, and φεη <+ li, .
The economy’s produces output (Y) using capital (K). The production functions F(K)
assume a simple “AK” specification. Specifically the production functions for Technology A and
Technology B are F(Kt) = AKt and F(Kt) = BKt respectively, where A and B are the respective total
factor productivities associated with the technologies, where A < B. In the context of this model,
K represents a composite good embodying both human and physical capital. However, we
emphasize the dominance of the ‘human’ component, which can be interpreted as investment in
higher level skill needed to adopt the more productive technology. In this case, it is possible to
interpret δ as an implicit fixed cost of experientially learning new technologies in the absence of
developed institutions.9
Every period each generation faces a problem on whether they should adopt Technology A
or Technology B. The choice of which Technology to adopt is not necessarily dependent on the
Technology that their parents adopted. That is, offspring of parents who adopted B need not
adopt B; it depends on the magnitude of resources they inherit from their parents.
The agent does not consume in the first period of his life.10 The utility of the ith agent, in
the event he/she adopts Technology A is described by:
9 An elaborate discussion of δ is given in Section 1. 10 This type of preference structure is consistent with the idea that ‘consumption’ consists of household consumption which includes the consumption of the children. The agent therefore ‘consumes’ part of the consumption of his parents in the first period of his life and undertakes the consumption decision in the second period with his offspring in mind.

39 | P a g e
)1()ln()ln(),( 1111A
itAit
Ait
Ait bcbcU ++++ += θ
The preferences for agents who adopt Technology B are described as follows:
)2()ln()1()ln()ln()1()ln(),,,( ,1
,1
,1
,1
,1
,1
,1
,1
hBit
lBit
hBit
lBit
hBit
lBit
hBit
lBit bpbpcpcpbbccU ++++++++ −++−+= θθ
In equation (1), Aitc 1+ and A
itb 1+ denote period 2 consumption and bequests for agent i if he
adopts Technology A. In equation (2), Bitc 1+ and B
itb 1+ denote period 2 consumption and bequests for
agent i if he adopts Technology B, with superscripts l and h representing the nature of shock that
the economy is subjected to. Subscript l represents a bad shock while subscript h denotes a good
shock, where the probability of the bad shock is represented by p. In both equation (1) and
equation (2), the parameter 𝜃 describes the extent of imperfect intergenerational altruism in the
model.
Agents face different budget constraints depending on the technology that they adopt. The
budget constraint for agents that adopt Technology A is as follows:
)3()( 11A
ititAit bWwc ++ −+=φ
where itW denotes resource endowment of the ith agent in period t and all the other unknowns
are as defined earlier. Resource endowments for agents depend on the technology that their
parents adopted. For agents whose parents adopted Technology A, the endowment is given by A
itA
itit bWW == . The endowment of agents whose parents adopted Technology B is given by:
Bit
Bitit bWW ==
Likewise, agents adopting Technology B have the following state-contingent budget
constraint:
)4(,1))(,(,
1 δεη −+−++=+xB
itbitWwxti
xBitc
where the superscript x represents the nature of the shock (i.e. l or h) that Technology B is
subjected to.

40 | P a g e
Agent i’s problem is optimise his utility subject to his/her budget constraint. Agents adopting
Technology A maximise equation (1) subject to constraint (3). This yields the following
consumption and bequest plans:
[ ] )5(11 itWwA
itc ++
=+ θφ
[ ] )6(11 it
Ait Wwb +
+=+ θθφ
Alternatively, the optimal state-contingent plans for agents who adopt Technology B
depend on the sign of the shock that their parent faces. These are described by
[ ] )7()(),(1
1,1 δεη
θ−++
+=+ itWwli
lBitc
[ ] )8()(),(1
1,1 δεη
θ−++
+=+ itWwhi
hBitc
[ ] )9()(),(1
,1 δεη
θθ
−+++
=+ itWwlilB
itb
[ ] )10()(),(1
,1 δεη
θθ
−+++
=+ itWwhihB
itb
The ith agent will adopt Technology B iff.
)11()*1,*
1()*1,*
1( ++≥++ itbitcAUitbitcBU
where 𝑈𝐴 and 𝑈𝐵 denote the indirect utility functions for the agents adopting Technology A and
Technology B respectively and the subscript * denotes the optimal choice of the variable in
question. It can then be shown that this is equivalent to the following (See Appendix 3.1):
[ ] [ ] [ ] )12(1
ititi,hiti,l Wwφδ)Ww()εη(δ)Ww()ε(ηp)(p
+≥−++⋅−++−
In equation (12), the LHS represents the geometric average of the wealth that is
accumulated when an agent adopts Technology B. The RHS gives the wealth that is accumulated
by an agent who adopts Technology A. It is easy to see that both the LHS and the RHS are
continuous and monotonically increasing in Wit.

41 | P a g e
By setting certain parameter restrictions on (12), it is possible to derive some threshold
level of Wit (hereafter to be referred as *W ) that would equate the LHS to the RHS.11 As such, it is
possible to make the following proposition:
Proposition 1: There is a threshold level of initial endowment, *W that is required for an agent
to adopt Technology B. This level of endowment is implicitly defined as the *W that solves equation
(13):
)13(*)*(),()*(),()1(
+=
−++⋅
−++
−
WwWwhiWwli
ppφδεηδεη
An agent will adopt Technology B iff. *WWit ≥
To gain more intuition about *W we carry out some comparative static analysis to
examine how this threshold level of endowment changes with the parameters of the model.
This is done by implicitly differentiating *W with respect to each of the parameters in equation
(13). Our results are intuitively plausible; we find that *W is decreasing in parameters
hw εη,, and increasing in parameters lp εδφ ,,, . 12
As in Lahiri and Ratnasiri (2012) and Khan and Ravikumar (2002), we assume that the
agents cannot borrow to adopt the superior technology. We believe that this assumption is
reasonable in the context of the current model. This is because access to borrowing may not
directly help the agents since the investment needed to undertake Technology B is a human-
capital intensive activity, whose main component is ‘learning-by-doing’. Secondly, even if the
agents can access consumption loans, borrowing to adopt technology may not be economically 11 We provide a sketch of the proof in Appendix 3.2.
12 More specifically the following are the total derivatives are: ,01*
<−=wd
dW
,0))(1()(
)1(
,,
22*<
−+−++−+
−=YZXYpXZp
ZXpYpXd
dW
hili εηεηη ,0))(1()( ,,
2
,
*<
−+−++−=
YZXYpXZpYpX
ddW
hilihi εηεηε
,0))(1()(
)1(
,,
2
,
*>
−+−++−
=YZXYpXZp
ZXpddW
hilili εηεηε [ ] ,0))(1()( ,,
*>
−+−++=
YZXYpXZpXYZ
ddW
hili εηεηφφ
,0))(1()(
)(
,,
*>
−+−+++
=YZXYpXZp
YZXd
dW
hili εηεηδ ,0
))(1()()/(ln
,,
*>
−+−++=
YZXYpXZpYZXYZ
dpdW
hili εηεη
where δεδε −++=−++=+= ))((,))((, *
,*
,*
ithiitliit WwnZWwnYWwX . Since δ−+>+ **itit WwWw , it is easy to see
that 0),)(1()( , >−+−++ YZXYipXZp hli εηεη .

42 | P a g e
tenable. This is because our model is such that agents who want to borrow access the loans from
those who are willing to lend, who in this case are those who have adopted Technology B. For
the lenders to be willing to lend, they should at least earn an interest equal to the expected net
return on Technology B, i.e. 1)()( )1(,, −++ − phi
pli εηεη . However, this is not possible given that
agents who adopt B must also incur the adoption cost δ . As such it is not possible for the lender
and the borrower to reach an agreement.
The dynamics of the model are described by the evolution of bequests overtime. This is given
by the following truncated system of first order difference equations:
[ ] )14(*1 WWforWwW itit
AAit <+=+ γ
and
[ ][ ] )1(),1/(
)15(),1/(
,,1
*
,,1
pyprobabilitwithWwWWWfor
pyprobabilitwithWwW
ithBhB
it
it
itlBlB
it
−+−+=>
+−+=
+
+
θθδγ
θθδγ
where 11 ++ = itit bW in equilibrium, θ
θφγ+
=1
A , θεηθ
γ+
+=
1)( ,,B lil , θ
εηθγ
+
+=
1)( ,,B hih , and *W is
defined in Proposition 1. Equations (12) and (13) highlight the importance of the slopes Aγ , lB,γ
, hB,γ of the bequests function in determining the dynamics of the model. These slopes are
proportionally related to the productivities of the respective technologies. Of particular
importance are the sizes of these slopes relative to the 450 line, which has a slope equal to 1.
In the presence of idiosyncratic shocks, it is difficult to analytically develop some intuition
regarding how the economy evolves over time. As such we begin by analysing a ‘deterministic’
version of the model where agents adopting Technology B do not face idiosyncratic shocks. In
this case Technology B is associated with a deterministic return equal to a weighted average of
the ‘low’ and ‘high’ shock cases. Stated differently, in the case of Technology B, we do not analyse
the slopes of the two bequest functions individually, but we focus on the weighted slope i.e. hBlBwB pp ,,, ).1(. γγγ −+= assuming that εi,t = 0. Consequently, for Technology B, equation (13)
can be written as a single weighted wealth function as follows: )1/(][,,1 θθδγ +−+=+ it
wBwBit WwW .
Combined with equation (12), this function describes what happens ‘on average’ in the
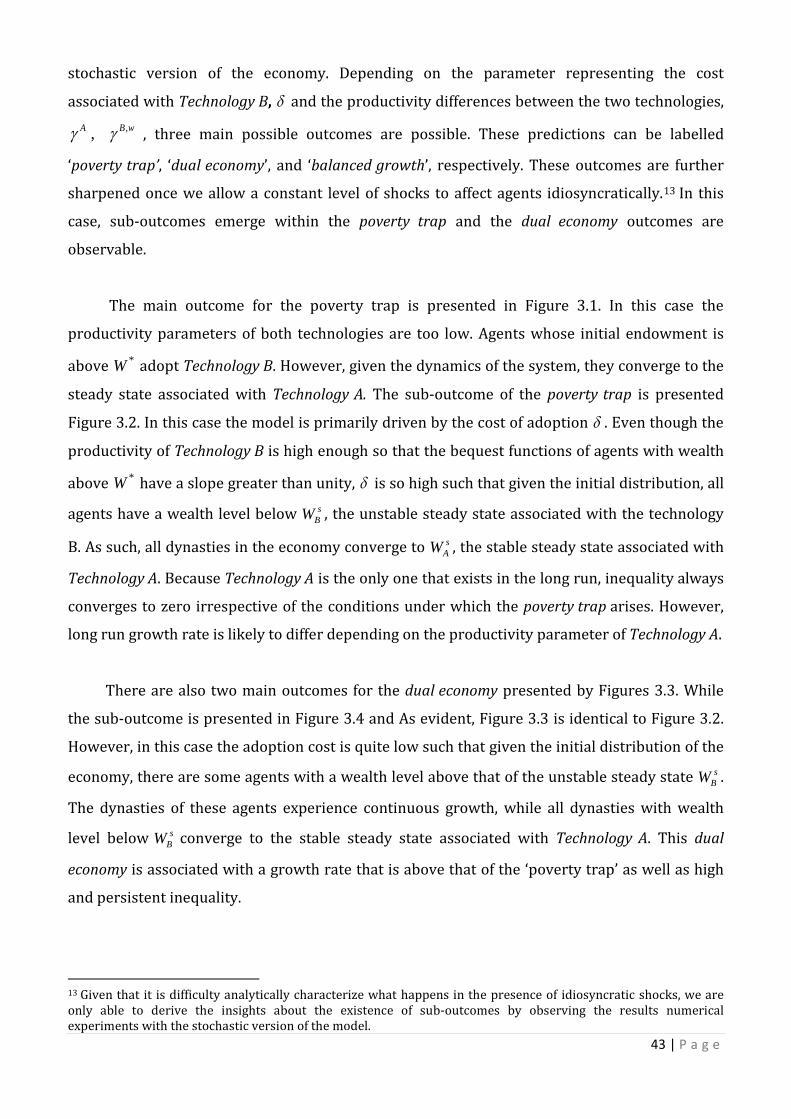
43 | P a g e
stochastic version of the economy. Depending on the parameter representing the cost
associated with Technology B, δ and the productivity differences between the two technologies, wBA ,, γγ , three main possible outcomes are possible. These predictions can be labelled
‘poverty trap’, ‘dual economy’, and ‘balanced growth’, respectively. These outcomes are further
sharpened once we allow a constant level of shocks to affect agents idiosyncratically.13 In this
case, sub-outcomes emerge within the poverty trap and the dual economy outcomes are
observable.
The main outcome for the poverty trap is presented in Figure 3.1. In this case the
productivity parameters of both technologies are too low. Agents whose initial endowment is
above *W adopt Technology B. However, given the dynamics of the system, they converge to the
steady state associated with Technology A. The sub-outcome of the poverty trap is presented
Figure 3.2. In this case the model is primarily driven by the cost of adoption δ . Even though the
productivity of Technology B is high enough so that the bequest functions of agents with wealth
above *W have a slope greater than unity, δ is so high such that given the initial distribution, all
agents have a wealth level below sBW , the unstable steady state associated with the technology
B. As such, all dynasties in the economy converge to sAW , the stable steady state associated with
Technology A. Because Technology A is the only one that exists in the long run, inequality always
converges to zero irrespective of the conditions under which the poverty trap arises. However,
long run growth rate is likely to differ depending on the productivity parameter of Technology A.
There are also two main outcomes for the dual economy presented by Figures 3.3. While
the sub-outcome is presented in Figure 3.4 and As evident, Figure 3.3 is identical to Figure 3.2.
However, in this case the adoption cost is quite low such that given the initial distribution of the
economy, there are some agents with a wealth level above that of the unstable steady state sBW .
The dynasties of these agents experience continuous growth, while all dynasties with wealth
level below sBW converge to the stable steady state associated with Technology A. This dual
economy is associated with a growth rate that is above that of the ‘poverty trap’ as well as high
and persistent inequality.
13 Given that it is difficulty analytically characterize what happens in the presence of idiosyncratic shocks, we are only able to derive the insights about the existence of sub-outcomes by observing the results numerical experiments with the stochastic version of the model.
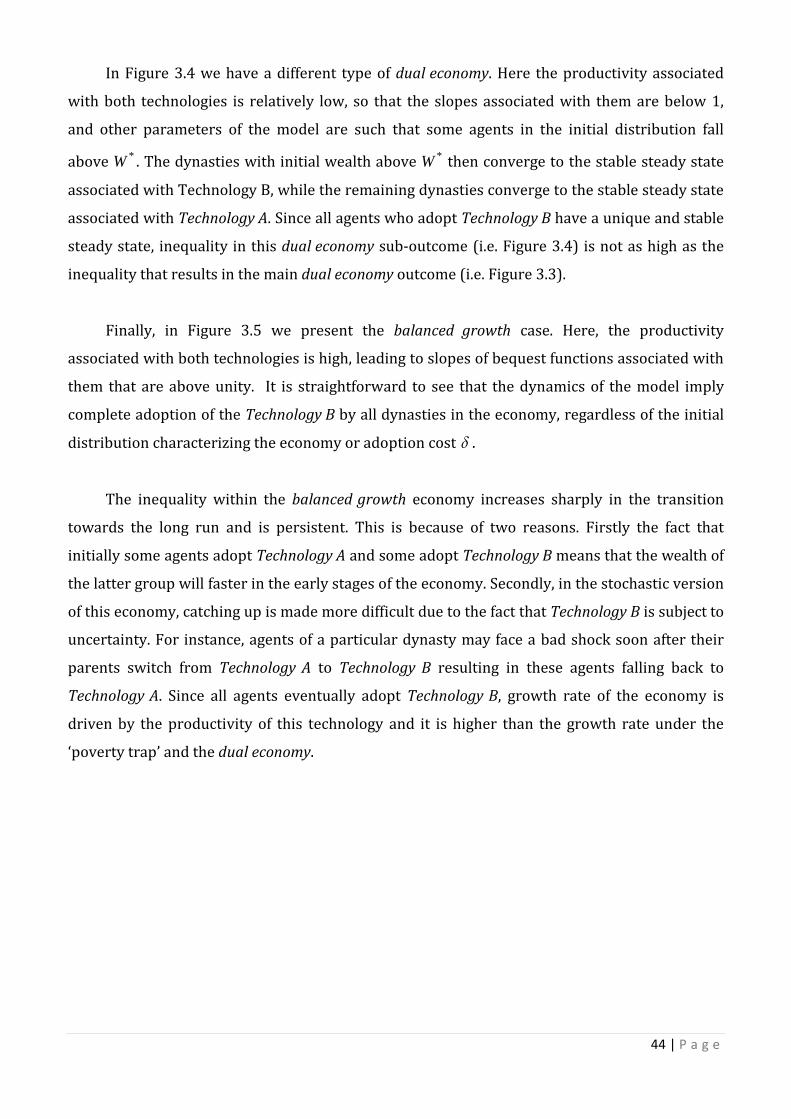
44 | P a g e
In Figure 3.4 we have a different type of dual economy. Here the productivity associated
with both technologies is relatively low, so that the slopes associated with them are below 1,
and other parameters of the model are such that some agents in the initial distribution fall
above *W . The dynasties with initial wealth above *W then converge to the stable steady state
associated with Technology B, while the remaining dynasties converge to the stable steady state
associated with Technology A. Since all agents who adopt Technology B have a unique and stable
steady state, inequality in this dual economy sub-outcome (i.e. Figure 3.4) is not as high as the
inequality that results in the main dual economy outcome (i.e. Figure 3.3).
Finally, in Figure 3.5 we present the balanced growth case. Here, the productivity
associated with both technologies is high, leading to slopes of bequest functions associated with
them that are above unity. It is straightforward to see that the dynamics of the model imply
complete adoption of the Technology B by all dynasties in the economy, regardless of the initial
distribution characterizing the economy or adoption cost δ .
The inequality within the balanced growth economy increases sharply in the transition
towards the long run and is persistent. This is because of two reasons. Firstly the fact that
initially some agents adopt Technology A and some adopt Technology B means that the wealth of
the latter group will faster in the early stages of the economy. Secondly, in the stochastic version
of this economy, catching up is made more difficult due to the fact that Technology B is subject to
uncertainty. For instance, agents of a particular dynasty may face a bad shock soon after their
parents switch from Technology A to Technology B resulting in these agents falling back to
Technology A. Since all agents eventually adopt Technology B, growth rate of the economy is
driven by the productivity of this technology and it is higher than the growth rate under the
‘poverty trap’ and the dual economy.

45 | P a g e
Figure 3.1: Poverty trap sub-outcome 1.
Figure 3.2: Poverty trap sub-outcome 2.
Figure 3.3: Dual economy sub-outcome 1
Wit+1
Wit *W s
AW
A
A’
B’
B
450
sBW
Wit+1
Wit *W
sAW
A
A’
B’
B
450
sBW
Wit+
1
Wit *W sAW
A
A’
B’
B
450
46 | P a g e
Figure 3.4: Dual economy sub-outcome 2
Figure 3.5: Balanced growth outcome
Secondly, by allowing idiosyncratic shocks to vary while keeping the other parameters
constant, we are able to observe that shocks affect technology adoption decisions in the short
run and the level of long run technology adoption. As we shall elaborate below, in the short run,
the size of shocks affects the transitional path of technology adoption thereby impacting on
transitional growth and inequality. In the long run, the size of shocks determines whether an
economy falls into the poverty trap, dual economy, or balanced growth. Because it is difficult to
analytically illustrate these findings, we only demonstrate them numerically. In what follows, we
carry out some numerical experiments.
3.3 Numerical Experiments and Discussion
In this section we use numerical experiments to illustrate the intuition underlying the
theoretical predictions that were reported in the preceding section. Our focus is on predictions
Wit+1
Wit *
itW
A
A’
B’
B
450
Wit+1
Wit *W sAW
A A’
B’
B
450
sBW

47 | P a g e
based on a constant level of idiosyncratic shocks. The results for varying the shocks will be
analysed separately in Section 3.4. The initial distribution of wealth for the reported results is
assumed to be lognormal with a mean of 2.5 and standard error of 0.4 and there are 501 agents.
Based on the extensive numerical experiments that we have carried out there are essentially
three types of results which are characterized by the parameter sets reported in Table 1.14
Furthermore in our numerical experiments, we are able to identify some threshold levels of
adoptions costs δ which would characterise whether equilibrium is a poverty trap or a dual
economy, given initial distribution and productivity parameters.15 For illustrative convenience,
we label them Hδ and Lδ , where LH δδ > .
Table 3.1: Productivity Parameter Values and Adoption
δ wB ,γ
Poverty Trap: Case 1 Lδδ > 1, << wBA γγ
Poverty Trap: Case 2 Hδδ >
wBA ,1 γγ <<
Dual Economy: Case 1 Hδδ < wBA ,1 γγ <<
Dual Economy: Case 2 Lδδ < 1, << wBA γγ
Balanced growth Any δ wBA ,1 γγ <<
Generally the results from the numerical experiment with the stochastic version of the model
confirm the predictions made above. Figure 3.6 illustrates the implications for technology
choice, inequality and economic growth for the main poverty trap outcome. In this case the
productivity parameters of both technologies are low (i.e. less than 1) and δ is above the lower
threshold Lδ . Panel (a) of Figure 3.6 shows the number of agents that adopt Technology A or
Technology B in different time periods. As evident in panel (a), although both Technology A and
Technology B co-exist in the initial stages, all agents in the economy eventually adopt the former
technology.
Panel (b) illustrates the evolution of inequality within this ‘poverty trap’ economy over
time. The inequality within this economy initially fluctuates at high levels and then decreases
sharply in the transition to the steady state and eventually converges to zero. The initial,
14 Note that the parameters choice was also guided by all the other parameter restrictions state in Section 2. An
additional restriction is that: δεη ≥++ )()( itl Ww 15 We are not able to analytically solve these threshold levels of δ . Note that the balanced growth outcome is independent of the level of adoption cost since Technology A is productivity enough to enable agents to accumulate adequate wealth needed to adopt Technology B.
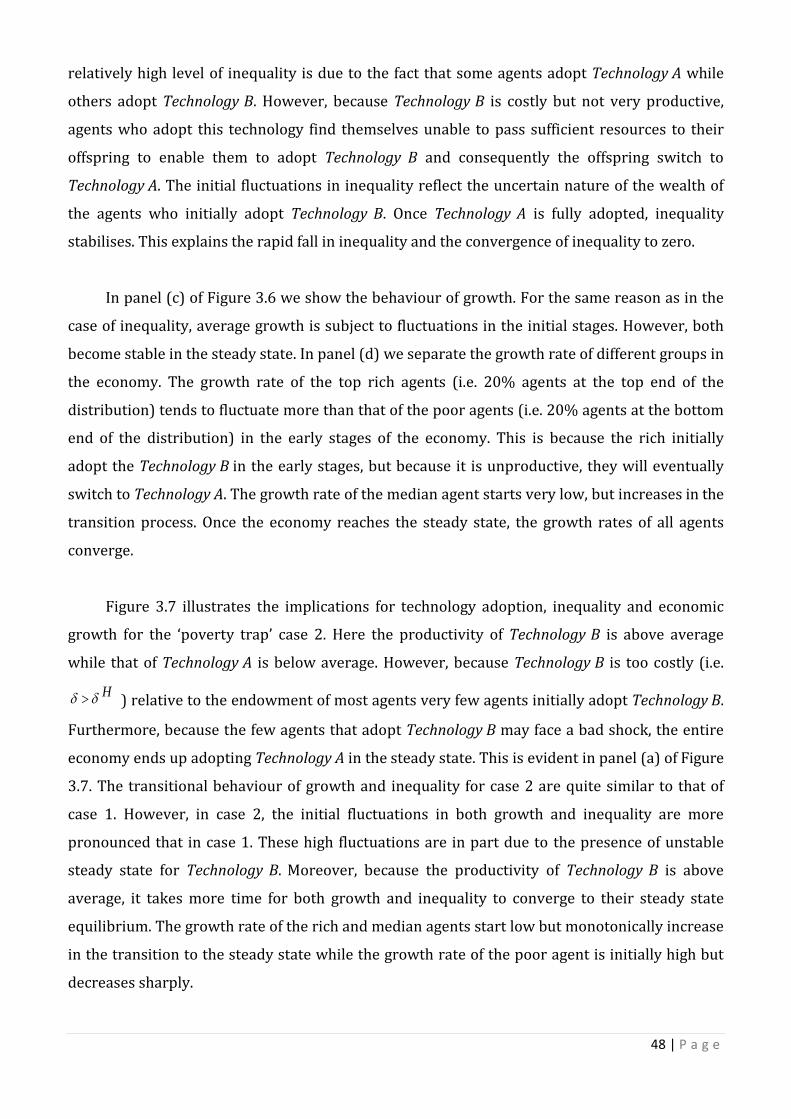
48 | P a g e
relatively high level of inequality is due to the fact that some agents adopt Technology A while
others adopt Technology B. However, because Technology B is costly but not very productive,
agents who adopt this technology find themselves unable to pass sufficient resources to their
offspring to enable them to adopt Technology B and consequently the offspring switch to
Technology A. The initial fluctuations in inequality reflect the uncertain nature of the wealth of
the agents who initially adopt Technology B. Once Technology A is fully adopted, inequality
stabilises. This explains the rapid fall in inequality and the convergence of inequality to zero.
In panel (c) of Figure 3.6 we show the behaviour of growth. For the same reason as in the
case of inequality, average growth is subject to fluctuations in the initial stages. However, both
become stable in the steady state. In panel (d) we separate the growth rate of different groups in
the economy. The growth rate of the top rich agents (i.e. 20% agents at the top end of the
distribution) tends to fluctuate more than that of the poor agents (i.e. 20% agents at the bottom
end of the distribution) in the early stages of the economy. This is because the rich initially
adopt the Technology B in the early stages, but because it is unproductive, they will eventually
switch to Technology A. The growth rate of the median agent starts very low, but increases in the
transition process. Once the economy reaches the steady state, the growth rates of all agents
converge.
Figure 3.7 illustrates the implications for technology adoption, inequality and economic
growth for the ‘poverty trap’ case 2. Here the productivity of Technology B is above average
while that of Technology A is below average. However, because Technology B is too costly (i.e.
Hδδ > ) relative to the endowment of most agents very few agents initially adopt Technology B.
Furthermore, because the few agents that adopt Technology B may face a bad shock, the entire
economy ends up adopting Technology A in the steady state. This is evident in panel (a) of Figure
3.7. The transitional behaviour of growth and inequality for case 2 are quite similar to that of
case 1. However, in case 2, the initial fluctuations in both growth and inequality are more
pronounced that in case 1. These high fluctuations are in part due to the presence of unstable
steady state for Technology B. Moreover, because the productivity of Technology B is above
average, it takes more time for both growth and inequality to converge to their steady state
equilibrium. The growth rate of the rich and median agents start low but monotonically increase
in the transition to the steady state while the growth rate of the poor agent is initially high but
decreases sharply.
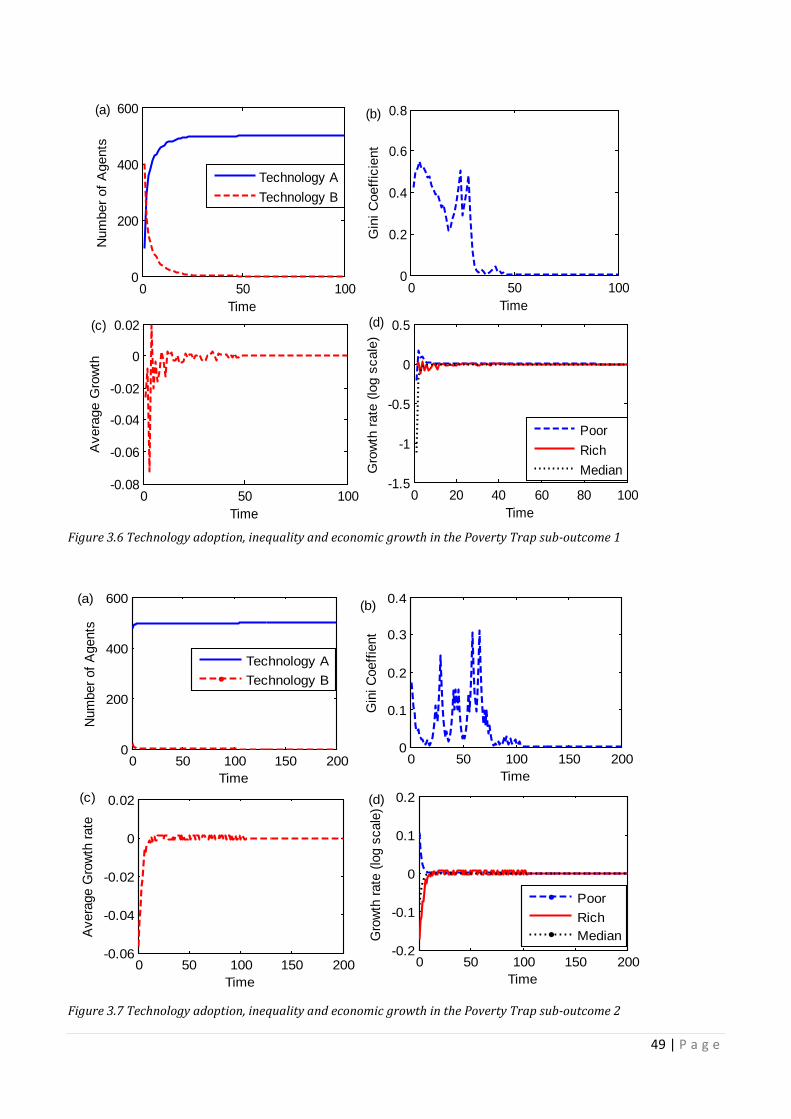
49 | P a g e
Figure 3.6 Technology adoption, inequality and economic growth in the Poverty Trap sub-outcome 1
Figure 3.7 Technology adoption, inequality and economic growth in the Poverty Trap sub-outcome 2
0 50 1000
200
400
600
Time
Num
ber o
f Age
nts
0 50 1000
0.2
0.4
0.6
0.8
Time
Gin
i Coe
ffici
ent
0 50 100-0.08
-0.06
-0.04
-0.02
0
0.02
Time
Ave
rage
Gro
wth
0 20 40 60 80 100-1.5
-1
-0.5
0
0.5
Time
Gro
wth
rate
(log
sca
le)
Technology ATechnology B
PoorRichMedian
(a)
(c) (d)
(b)
0 50 100 150 2000
200
400
600
Time
Num
ber o
f Age
nts
0 50 100 150 2000
0.1
0.2
0.3
0.4
Time
Gin
i Coe
ffien
t
0 50 100 150 200-0.06
-0.04
-0.02
0
0.02
Time
Aver
age
Gro
wth
rate
0 50 100 150 200-0.2
-0.1
0
0.1
0.2
Time
Gro
wth
rate
(log
sca
le)
PoorRichMedian
Technology ATechnology B
(b)
(d)
(a)
(c)

50 | P a g e
Figure 3.8 presents the numerical results for the main dual economy outcome. In this case
the productivity parameters of Technology A are low while the productivity parameters of
Technology B are high. Given the initial distribution some agents are above the unstable steady
state illustrated in Figure 3.3. Technology A and Technology B co-exist in the steady state. Agents
who adopt Technology A will be poorer while those that adopt Technology B will be richer. Thus,
as shown in panel (b) of Figure 3.8, this economy is characterised by very high levels of
inequality. The average growth rate for this economy is slightly above that of the ‘poverty trap’.
This is due to the component of growth that is emanates from agents who adopt the more
productive Technology B. The growth rate of the poor agents starts quite high while that median
agent starts low. The two growth rates then monotonically move towards one another and
converge. However, the two growth rates never converge to that of the rich agents.
Figure 3.9 presents the numerical results for the other dual economy sub-outcome. In this
case the productivity parameters of both technologies are low. However, the adoption cost is
very low i.e. Lδδ < . The set of other parameters is such that Technology B has a stable steady
state as presented in Figure 3.4. The distinguishing feature of this equilibrium is that inequality
remains fluctuating and never converges. This is part is due to the fact that both technologies
have stable steady states. In this of equilibrium, the growth rates of all the groups of agents
remain close and they are all subject to fluctuations.
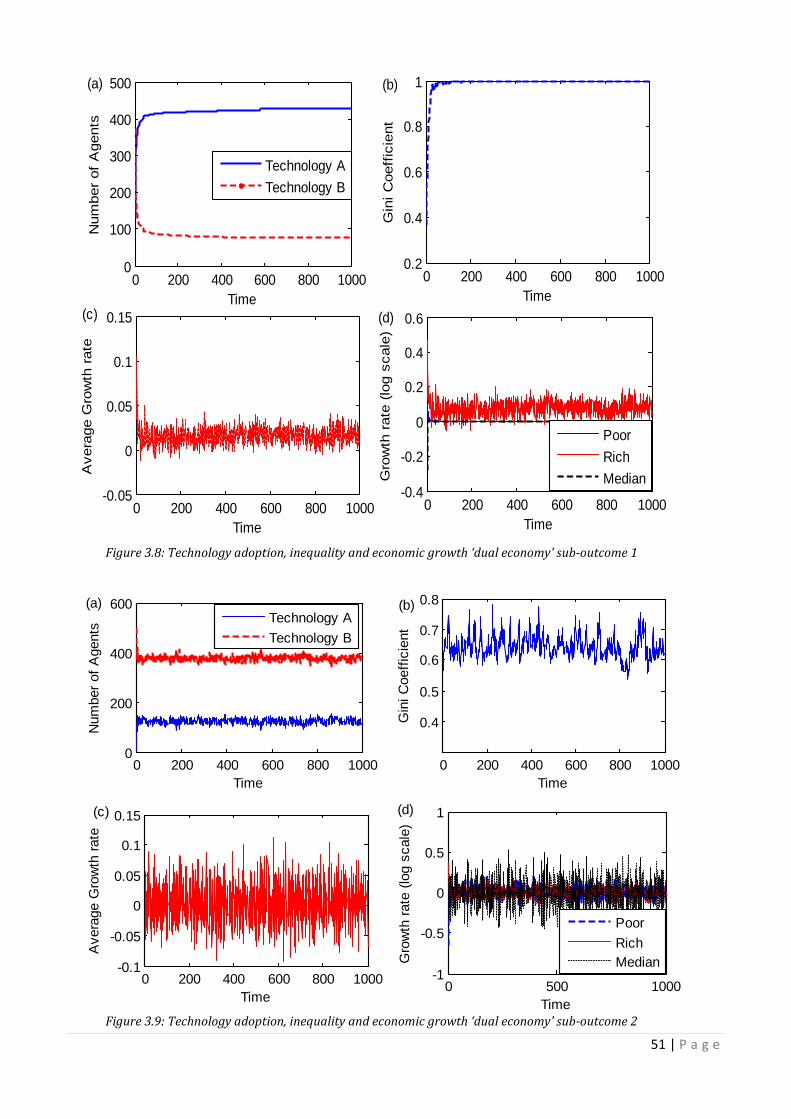
51 | P a g e
Figure 3.8: Technology adoption, inequality and economic growth ‘dual economy' sub-outcome 1
Figure 3.9: Technology adoption, inequality and economic growth ‘dual economy' sub-outcome 2
0 200 400 600 800 10000
100
200
300
400
500
Time
Num
ber
of A
gent
s
0 200 400 600 800 10000.2
0.4
0.6
0.8
1
Time
Gin
i Coe
ffic
ient
0 200 400 600 800 1000-0.05
0
0.05
0.1
0.15
Time
Ave
rage
Gro
wth
rat
e
0 200 400 600 800 1000-0.4
-0.2
0
0.2
0.4
0.6
Time
Gro
wth
rat
e (lo
g sc
ale)
Technology ATechnology B
PoorRichMedian
(c)
(b)(a)
(d)
0 200 400 600 800 10000
200
400
600
Time
Num
ber o
f Age
nts
0 200 400 600 800 1000
0.4
0.5
0.6
0.7
0.8
Time
Gin
i Coe
ffici
ent
0 200 400 600 800 1000-0.1
-0.05
0
0.05
0.1
0.15
Time
Ave
rage
Gro
wth
rate
0 500 1000-1
-0.5
0
0.5
1
Time
Gro
wth
rate
(log
sca
le)
Technology ATechnology B
PoorRichMedian
(a) (b)
(c) (d)

52 | P a g e
Figure 3.10 presents the numerical results for the balanced growth case. In this case, the
productivities of both technologies are high enough to allow agents’ wealth to grow at a
relatively high rate. Consequently, irrespective of which technology they start with, all agents in
the economy eventually adopt Technology B. Inequality in this economy increases in the
transition process and remains persistently high. The high level and persistence of inequality is
due to the fact that agents switch from Technology A to Technology B at different times.
Furthermore, some of those that have switched to Technology B may be subjected to a negative
shock thereby reverting back to Technology A. Agents who switch to Technology B earlier, and
also receive a good shock will accumulate more wealth than those that remain in Technology A
and those that adopt Technology B and face a bad shock.
The steady state average growth rate for the balanced growth economy is much higher
than that of the dual economy since both technologies are very productive. Furthermore, the
adoption cost has no impact on the long economic outcomes. However, the cost tends to affect
transitional behaviour of the ‘balanced growth’ economy. More specifically, the time taken for
the economy to fully adopt Technology B and for growth and inequality to converge to their
steady state paths is increasing in the adoption cost.16
16 Since in our comparative analysis show that W* is increasing in δ, it is clearly intuitive that agents who initially adopt Technology A will take more time to switch to Technology B if δ were higher.
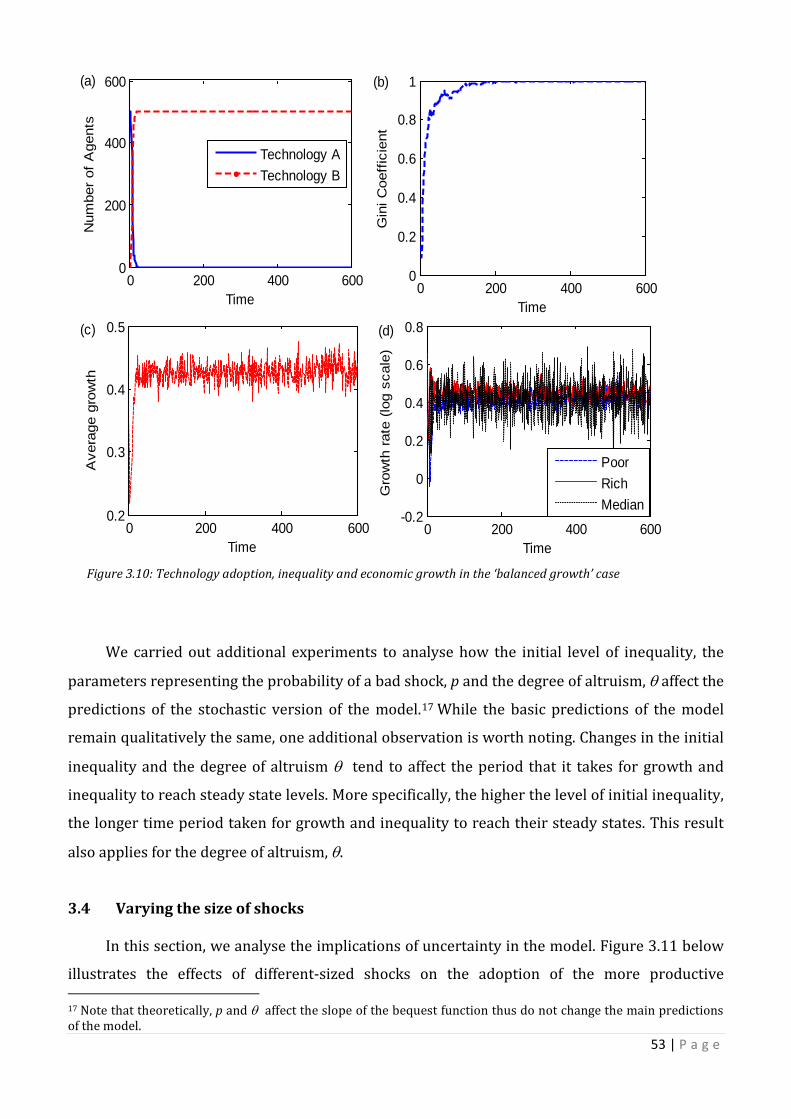
53 | P a g e
Figure 3.10: Technology adoption, inequality and economic growth in the ‘balanced growth’ case
We carried out additional experiments to analyse how the initial level of inequality, the
parameters representing the probability of a bad shock, p and the degree of altruism, θ affect the
predictions of the stochastic version of the model.17 While the basic predictions of the model
remain qualitatively the same, one additional observation is worth noting. Changes in the initial
inequality and the degree of altruism θ tend to affect the period that it takes for growth and
inequality to reach steady state levels. More specifically, the higher the level of initial inequality,
the longer time period taken for growth and inequality to reach their steady states. This result
also applies for the degree of altruism, θ.
3.4 Varying the size of shocks
In this section, we analyse the implications of uncertainty in the model. Figure 3.11 below
illustrates the effects of different-sized shocks on the adoption of the more productive 17 Note that theoretically, p and θ affect the slope of the bequest function thus do not change the main predictions of the model.
0 200 400 6000
200
400
600
Time
Num
ber
of A
gent
s
0 200 400 6000
0.2
0.4
0.6
0.8
1
Time
Gin
i Coe
ffic
ient
0 200 400 6000.2
0.3
0.4
0.5
Time
Ave
rage
gro
wth
0 200 400 600-0.2
0
0.2
0.4
0.6
0.8
Time
Gro
wth
rat
e (lo
g sc
ale)
Technology ATechnology B
PoorRichMedian
(a) (b)
(d)(c)

54 | P a g e
technology. It is evident that given other parameter values, shocks with a high standard
deviation (henceforth ‘high’ or ‘large’ shocks) results in the economy converging to the poverty
trap where no agent adopts the productive technology. Moderately sized shocks will result in a
dual economy where both technologies co-exist. Small shocks result in a balanced growth,
where all the agents will end up adopting the productive technology. Also evident is that,
although all agents end up adopting the productive technology when shocks are low, the timing
of technology differs depending on the size of shocks. The lower the standard deviation of the
shocks, the quicker is the complete adoption of the better technology. In what follows, we now
discuss the growth and inequality outcomes of these different sized shocks.
Figure 3.11: Number of Agents adopting Technology B under different sized shocks
Figure 3.12 presents the inequality and growth rate from the different sized shocks. Panel
(a) reports the Gini coefficient, panel (b) reports the average growth of the economy, panel (c)
reports the growth rate of the 20% agents at the top end of the distribution, and panel (d)
reports the growth rate of the 20% agents at the bottom end of the distribution. As evident from
Figure 3.12, when the shocks are too high, the incomes of all agents converge since every agent
ends up adopting the less productive technology. The growth rate stagnates, so does the growth
0 50 100 150 200 250 300 350 400 450 5000
100
200
300
400
500
600
Time
Num
ber o
f Age
nts
adop
ting
of T
echn
ology
B
ε,l = -1.5 ; ε,h = 1.5
ε,l = -1 ; ε,h = 1
ε,l = -0.75 ; ε,h = 0.75
ε,l = -0.5 ; ε,h = 0.5
ε,l = -0.8 ; ε,h = 0.8
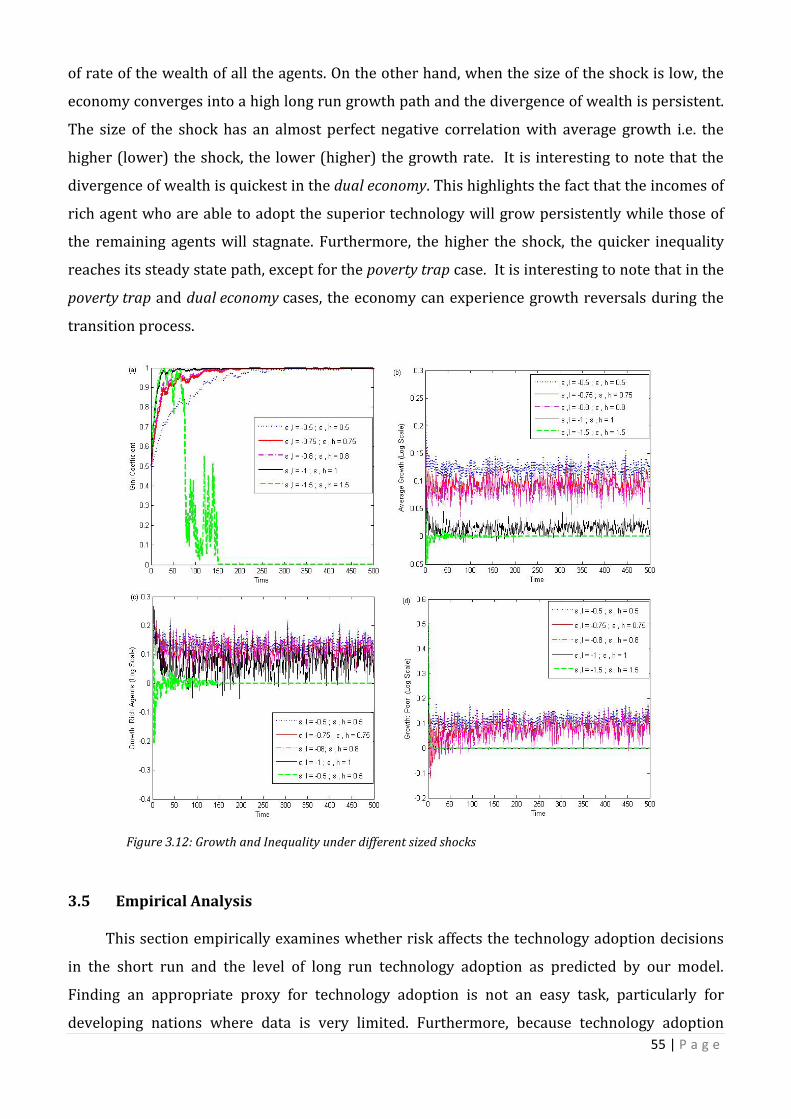
55 | P a g e
of rate of the wealth of all the agents. On the other hand, when the size of the shock is low, the
economy converges into a high long run growth path and the divergence of wealth is persistent.
The size of the shock has an almost perfect negative correlation with average growth i.e. the
higher (lower) the shock, the lower (higher) the growth rate. It is interesting to note that the
divergence of wealth is quickest in the dual economy. This highlights the fact that the incomes of
rich agent who are able to adopt the superior technology will grow persistently while those of
the remaining agents will stagnate. Furthermore, the higher the shock, the quicker inequality
reaches its steady state path, except for the poverty trap case. It is interesting to note that in the
poverty trap and dual economy cases, the economy can experience growth reversals during the
transition process.
Figure 3.12: Growth and Inequality under different sized shocks
3.5 Empirical Analysis
This section empirically examines whether risk affects the technology adoption decisions
in the short run and the level of long run technology adoption as predicted by our model.
Finding an appropriate proxy for technology adoption is not an easy task, particularly for
developing nations where data is very limited. Furthermore, because technology adoption
56 | P a g e
decisions in different countries are affected by country-specific factors such as culture, country
history, and policy, it is often difficult to compare measures across countries. As such our case
study here focuses on a single country, India, and we focus on the adoption of agricultural
technologies.
The choice of India is motivated by the fact that it is among the developing countries that
implemented intensive technological and other agricultural reforms, commonly known as the
Green Revolution since the 1960s. To date, India ranks second in production of cereals such as
wheat and rice, courtesy of these technological and other reforms. In terms of its standing in the
world economy, India has become one of the fastest growing and closely watched emerging
economies, along with Brazil, China, Russia and South Africa. These five countries have
increasingly become influential by cooperating in economic and political issues through what is
commonly known as the BRICS. This augments India’s suitability to the current study.
Our empirical analysis is constrained by a number of data-related issues. Firstly, the
available state-level technology adoption data has so many gaps rendering it unsuitable for any
meaningful empirical analysis. As such we rely on aggregate level data. Secondly, there is no
aggregate data for two indicators of technology adoption; crop intensity and area cropped with
HYVs. Therefore we rely only on four indicators which are: total fertilizer consumption, total
land under irrigation, number of tractors used per thousand hectare, and harvest thrasher use
per hectare. The data on these indicators and the output measures such as Gross Production
Index (GPI), the Gross Production Value (GPV) and Export Unit Value Index (EX_V) for the
agricultural sector were sourced from the database of the Food and Agriculture Organisation of
the United Nations (2012). All the remaining data was obtained from the Word Bank Databank
(2012). The analysis here covers the period 1965 to 2001, and the choice of period is based on
data availability. The summary statistics for all the variables used in this study is provided in
Appendix 3.4.
To construct out technology adoption index, we follow an approach in Jain et al. (2009).
This is related to the approach used by the United Nation Development Program (2006) to
compute the Human Development Index. We begin with standardising each of the indicators of
technology adoption as follows:

57 | P a g e
)16(minmax
minXX
XiXiX
−−
=
where Xi is the ith value of the technology adoption indicator in question, Xmin , Xmax denotes
the minimum value and the maximum value of this indicator, respectively. Once all the
indicators are standardised, we now use normalised weights (denoted by αi for technological
indicator i) obtained from a Principal Component Analysis (PCA) to compute the aggregate
technology adoption index (henceforth TAI) which is given by: 18
)17(6
1iX
iiTAI ∑
=
= α
This index takes values strictly between 0 and 1, with a higher value indicating a larger
extent of technology adoption. In Table 3.2, we report the αi’s and in Figure 3.13 we report the
TAI.
We use four measures of risk. These are based on volatilities of GPI, GPV and EX_V, and the
volatility in Gross Domestic Production (GDP) at 2000 constant prices. The volatilities of these
variables were computed use using an appropriate GARCH-type volatility model for each of the
variables.19 An advantage with the GARCH-type models is that they account for time-varying
volatility.20
In Figure 2.14 (see Appendix 3.3), we present the correlation plots of TAI and each of the
measures of risk. A negative correlation is evident between TAI and all the measures of risk
suggesting that risk potentially slows technology adoption. We also report the correlation
coefficients between TAI and a host of its possible determinants in Table 3.3. The TAI is
evidently negatively correlated with all the measures of risk and positively correlated to such as
Consumer Price Index (CPI), logarithm of aggregate real Gross Fixed Capital Formation (LGFCF), 18 Given that the PCA is a widely used in the economics literature, we will not describe the method here. However, we provide a precise discussion of the method in Appendix 5.2. Readers who need more details on the method are referred to textbooks such as Dunteman and Lewis-Beck (1989) and Stock and Watson (2002). 19 By ‘appropriate’, we mean that the ARCH-type model used to generate the volatility of each of the variables passed a number of stringent tests. For instance, we ensured that the mean equation had no evidence of serial correlation, and the model used does not violate the non-negativity condition/constraint and its coefficients are non-explosive. The residuals were further tested to ensure that no ARCH effects remained in the data. Furthermore, we experimented with various specifications to ensure that the final formal used had the Minimum Information Criteria. For detailed discussion of the GARCH-type volatility models, see Brooks (2008). 20 Note that we also experimented with risk measures based on the standard deviation and the squared standard deviation of these variables. The results were qualitatively similar to those obtained using the GARCH-type volatility measures.

58 | P a g e
ratio of total expenditure on education to GDP (EDUEXP), life expectancy (LIF_E), and GDP.
Nevertheless correlation between two variables does not necessarily imply causality because it
might be the case that the variables are driven by a common exogenous factor. As such it is
important to carry out formal econometric analysis, which is the subject of the next section.
Table 3.2 Weights for the Variables
Variable Normalised Weights
Total Fertilizer consumption 0.25192
Total land Under Irrigation 0.24838
Number of tractors used per thousand hectare 0.25066
Harvest Thrasher Use per hectare 0.24904
Figure 3.13: Technology Adoption Index: 1961 – 2002
Table 3.3: Correlation between the TAI and its explanatory variables
TAI VOLGDP(1) VOLEX_V(1) CPI LGFCF EDEXP LIF_E VOLGPI VOLGPV
TAI VOLGDP -0.269
VOLEX_V -0.094 -0.046 CPI 0.963 -0.223 -0.085
GFCF 0.991 -0.260 -0.042 0.565 EDEXP 0.871 -0.207 0.064 0.256 0.287
LIF_E 0.478 -0.254 0.026 0.385 0.440 0.428 VOLGPI -0.402 0.615 0.009 -0.406 -0.414 -0.340 -0.409
VOLGPV -0.402 0.694 0.009 -0.406 -0.414 -0.339 -0.409 0.999 GDP 0.993 -0.161 -0.082 0.611 0.702 0.662 0.474 -0.403 -0.403
Notes: VOLGDP = volatility in GDP, VOLGPV = volatility in GDV, VOLGPI = volatility in GPI, VOLEX_V =volatility in EX_V
0
0.2
0.4
0.6
0.8
1
1.2
1961 1964 1967 1970 1973 1976 1979 1982 1985 1988 1991 1994 1997 2000

59 | P a g e
3.5.1 Testing for Long Run and Short Run Relations between the TAI and Risk
In this section we examine the short run and long run relationship between TAI and the
four measures of risk. Moreover, we control for the other determinants of TAI. To that end, we
test for a long run relationship using the multivariate Johansen and Juselius (1990) maximum
likelihood-based cointegration approach. Once long run relations are identified, we then
estimate the Vector Error Correlation Models (VECMs) to examine how any short run
disequilibrium in the relationship between TAI and its determinants adjusts back to the long run
path. The VECM model will also allow us to examine the signs and significance of the long run
and short run parameters.21
We begin our analysis by testing each of our variables for unit roots. To that end the
augmented Dickey Fuller (ADF) and the Phillip Peron (PP) are employed. To determine the
appropriate lag length for the ADF test we use the Schwarz’s Bayesian information criterion
(SBIC). In the PP test, we use the Bartlett Kernel estimation method and the bandwidth is
selected using the Newey West method. The results are presented in Table 3.4. It is evident that,
based on both tests, all the variables only become stationary when differenced, except for the
volatility series which are stationary in levels.
Next we tested for cointegration between the variables. This is done by specifying three
Vector Autoregression (VAR) models, each featuring the TAI index and other variables. The
specification of VAR model was guided by the need to minimise multicollinearity. To that end,
the correlation coefficients reported in Table 3.3 are utilised. In Model 1, we include TAI,
volatility in GDV, volatility in EX_V, CPI, GDP, LIF_E, GFCF, Edu. Exp. In Model 2, we include TAI,
volatility in GDI, volatility in EX_V, CPI, GDP, LIF_E, GFCF, Edu. Exp. In Model 3, we include TAI,
volatility in GDP, volatility in EX_V, CPI, LIF_E, GFCF, Edu. Exp. Variables such as GDP, GDFC,
LIF_E were logarithmically transformed to address issues associated with skewness and
outliers. Furthermore, lagged rather than contemporaneous values of GDP were used because
in the context of our model, increases in wealth/income is likely to improve technological
adoption in the next period as decisions for the current period have already taken place. More
specifically, an increase in GDP is likely to increase the amount of bequest left for the future
generation and thus affect this generation’s technological adoption decision. All the risk
measures were included at ‘lead’ since current technology adoption decisions are likely to 21 Since our analysis is based on the standard Johansen cointegration technique and we do not do any extension or modifications to the model, discussion of all the technical aspects of the model is beyond objectives of this essay. As such we will highlight steps and the procedures we think are necessarily for the purpose of making the current empirical analysis clear to the readership. More technical issues on the multivariate Johansen cointegration and VECM are available in time series textbook such as Kirchgässner and Wolters (2007).
60 | P a g e
depend on agent expectation about the future risk. Moreover, recall that in our model, agents
take technology adoption decisions before the shock has been observed. In all the specifications,
we include a dummy variable to account for India’s economic reforms that began in July 1991.
In selecting the appropriate lag length for test for cointegration, the Akaike information
criteria (AIC) and the SBIC were considered. However, in cases where they gave conflicting lags,
we relied on the AIC since the SBIC is inefficient in small samples (see Brooks, 2008). The
residuals from the selected lag order were further tested for serial correlation to ensure that a
lag with good diagnostic properties was used. The Johansen cointegration tests were then
performed using this lag. The results thereof are reported in Table 3.5. Also reported are the lag
length and the estimation assumption used in performing the cointegration test. It is evident
that there are four cointegrating relations in each of the model. This implies that TAI has a long
run relation with the variables in each of the models.
To analyse the nature of these long run relationships and to examine the short run
dynamics, we proceeded to estimate the VECMs. The VECMs is estimated on truly endogenous
variables. As such we performed the weak exogeneity tests to identify the endogenous variables.
Because our concern here is on whether TAI is influenced by the other variables, we only report
the weak exogeneity results for this variable. Similarly, we only report the VECMs normalised on
TAI. Both results are reported in Table 3.6. We also reported the VECM coefficients, the
coefficients of the dummy variable, adjusted R-squared for each model, and the results from
serial correlation tests.
As evident in this table, TAI is endogenous in all the three models. Regarding the VECMs, it
is evident that the long run parameters for all the four measure of risk are negative and
statistically significant at 1% in almost all the specifications. This implies that risk has a negative
influence on long run technology adoption levels, even after controlling for the other
determinants of technology adoption. Furthermore, the short run parameters of all the four risk
measures are negative and three of them are statistically significant implying that risk
influences short run technology adoption decisions of agents. All the VECM coefficients are
correctly signed and statistically significant at 1% suggesting that in the event of short run
disequilibrium in the relationship between TAI and the other variables, adjustment back to
equilibrium takes place. Furthermore, the VECM coefficients are reasonably large implying that
the adjustment in quick. For instance, in Model 1, the VECM coefficient is 0.19 implying that 19%
61 | P a g e
of the short run disequilibrium from the long run path of the variables in this model is corrected
every year. Consequently, it takes just over five years and three month for this short run
disequilibrium to adjust back to the long run path.
The coefficients of all the other determinants of TAI have the expected signs, except those
of life expectancy, which is surprisingly negative. In the early classical theoretical literature such
as Kuznets (1973) and Rum and Shultz (1979) increased life expectancy is expected to increase
technology adoption and economic performance by increasing the time spent on education and
human capital development. Ang and Madsen (2012) provide two pieces of evidence consistent
to this idea. Firstly, they show that educated workers are more likely to retire later. Secondly,
they show that the propensity to innovate increases with age.
However, models such as de la Croix and Licandro (1999), and Boucekkine et al. (2002),
suggest that an increase in life expectancy could be counterproductive, especially if human
capital is considered a vintage asset. Other explanations based on models of endogenous life
expectancy in human capital suggest that multiple equilibria are possible depending on the
initial level of life expectancy (see Blackburn and Ciprian, 2002; Cavalletti and Sunde, 2005).
Finally in political economy explanations, conflicts between vested-interest groups, one
comprised of the aged agents and the other the young agents could result in a negative
relationship, especially if the former group is large or has a stronger influence on the political
system (see Lancia and Prarolo, 2009). The idea here is the aged groups is not in favour of new
technologies as they are ‘too old’ to begin learning. Whether this negative result is because India
has reached this threshold level of life expectancy as emphasised in the endogenous life
expectancy models, political conflicts arising from its democracy, or is due to other reasons
remains an interesting question for future research.
It is also surprising that while GFCF has a positive influence on long run TAI, it has
negative effects in the short term although the coefficients are all insignificant. Similarly, CPI
negatively influences TAI in the long run but positively in the short run. This result implies that
moderate price increases that reward risk takers may encourage technology adoption in the
short run, but unsustainable price increases may backfire in the long run through reducing in
real wealth and consequently limiting the potential to adopt new technologies. The coefficients
of expenditure on education have the correct sign in all of the specifications and are significant
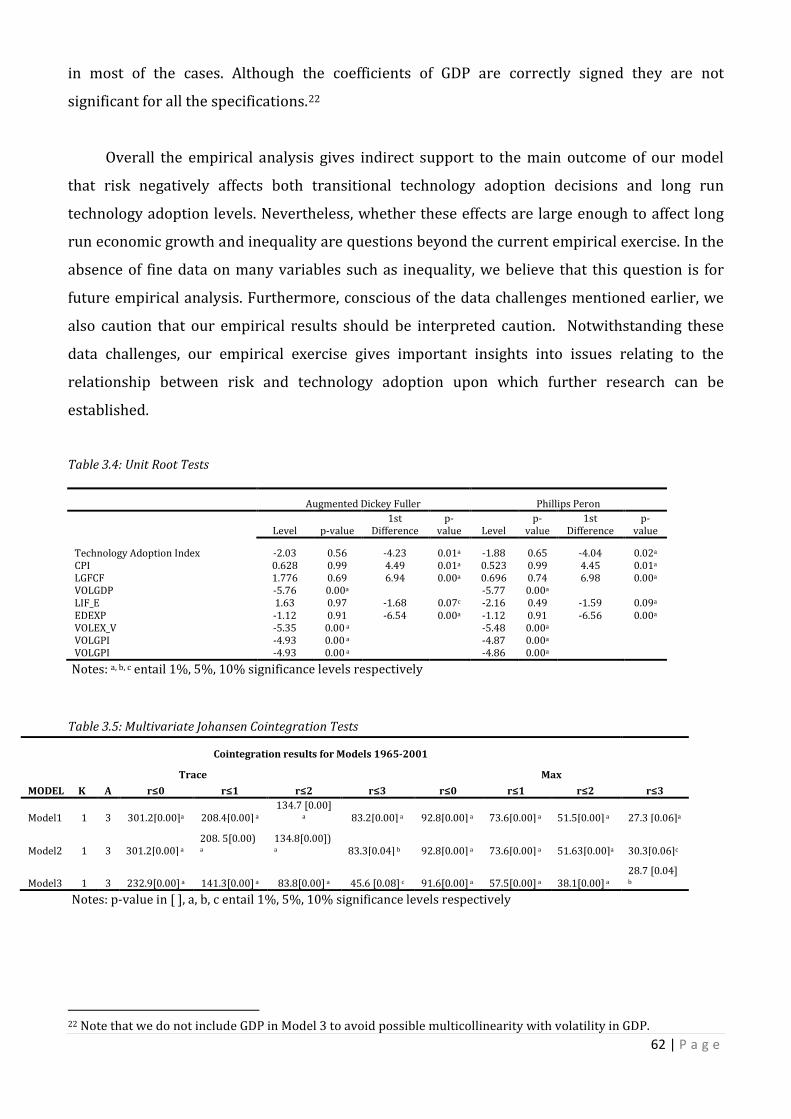
62 | P a g e
in most of the cases. Although the coefficients of GDP are correctly signed they are not
significant for all the specifications.22
Overall the empirical analysis gives indirect support to the main outcome of our model
that risk negatively affects both transitional technology adoption decisions and long run
technology adoption levels. Nevertheless, whether these effects are large enough to affect long
run economic growth and inequality are questions beyond the current empirical exercise. In the
absence of fine data on many variables such as inequality, we believe that this question is for
future empirical analysis. Furthermore, conscious of the data challenges mentioned earlier, we
also caution that our empirical results should be interpreted caution. Notwithstanding these
data challenges, our empirical exercise gives important insights into issues relating to the
relationship between risk and technology adoption upon which further research can be
established.
Table 3.4: Unit Root Tests
Augmented Dickey Fuller Phillips Peron
Level p-value
1st Difference
p-value Level
p-value
1st Difference
p-value
Technology Adoption Index -2.03 0.56 -4.23 0.01a -1.88 0.65 -4.04 0.02a CPI 0.628 0.99 4.49 0.01a 0.523 0.99 4.45 0.01a
LGFCF 1.776 0.69 6.94 0.00a 0.696 0.74 6.98 0.00a
VOLGDP -5.76 0.00a
-5.77 0.00a LIF_E 1.63 0.97 -1.68 0.07c -2.16 0.49 -1.59 0.09a
EDEXP -1.12 0.91 -6.54 0.00a -1.12 0.91 -6.56 0.00a VOLEX_V -5.35 0.00 a
-5.48 0.00a
VOLGPI -4.93 0.00 a
-4.87 0.00a VOLGPI -4.93 0.00 a
-4.86 0.00a
Notes: a, b, c entail 1%, 5%, 10% significance levels respectively Table 3.5: Multivariate Johansen Cointegration Tests
Cointegration results for Models 1965-2001
MODEL K A Trace
Max
r≤0 r≤1 r≤2 r≤3 r≤0 r≤1 r≤2 r≤3
Model1 1 3 301.2[0.00]a 208.4[0.00] a 134.7 [0.00]
a 83.2[0.00] a 92.8[0.00] a 73.6[0.00] a 51.5[0.00] a 27.3 [0.06]a
Model2 1 3 301.2[0.00] a 208. 5[0.00)
a 134.8[0.00])
a 83.3[0.04] b 92.8[0.00] a 73.6[0.00] a 51.63[0.00]a 30.3[0.06]c
Model3 1 3 232.9[0.00] a 141.3[0.00] a 83.8[0.00] a 45.6 [0.08] c 91.6[0.00] a 57.5[0.00] a 38.1[0.00] a 28.7 [0.04]
b Notes: p-value in [ ], a, b, c entail 1%, 5%, 10% significance levels respectively
22 Note that we do not include GDP in Model 3 to avoid possible multicollinearity with volatility in GDP.
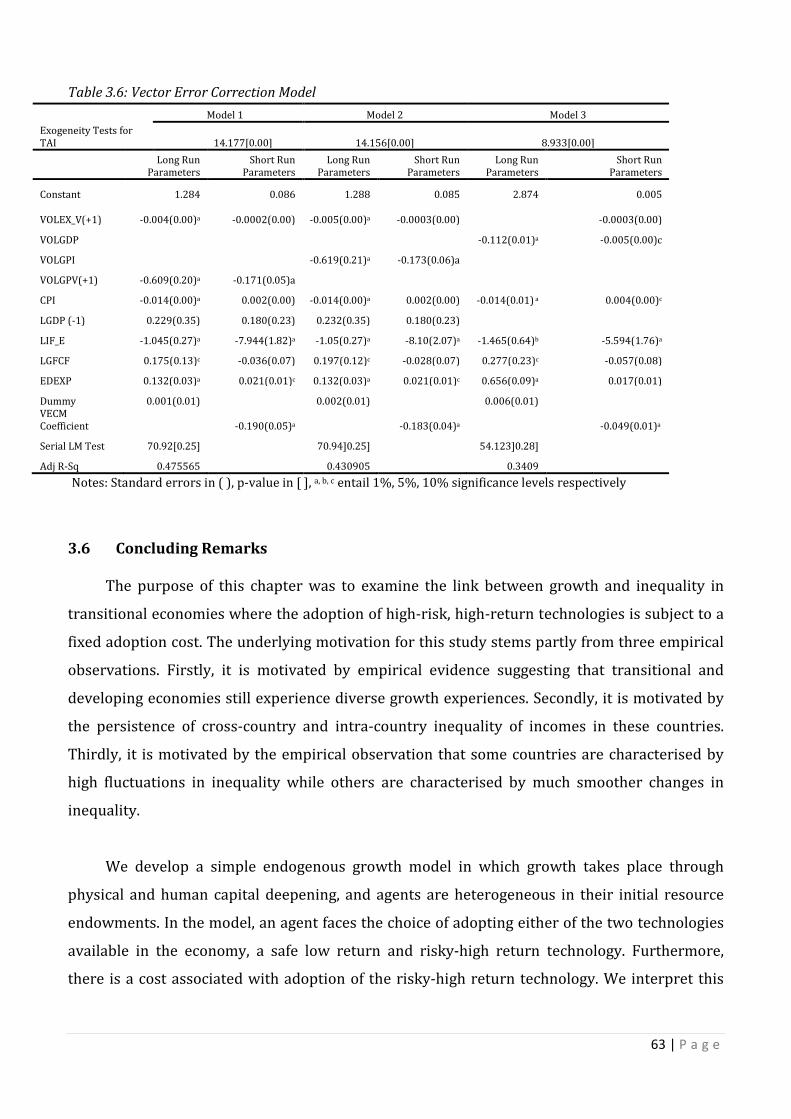
63 | P a g e
Table 3.6: Vector Error Correction Model
Model 1 Model 2 Model 3
Exogeneity Tests for TAI 14.177[0.00] 14.156[0.00] 8.933[0.00]
Long Run Parameters
Short Run Parameters
Long Run Parameters
Short Run Parameters
Long Run Parameters
Short Run Parameters
Constant 1.284 0.086 1.288 0.085 2.874 0.005
VOLEX_V(+1) -0.004(0.00)a -0.0002(0.00) -0.005(0.00)a -0.0003(0.00)
-0.0003(0.00)
VOLGDP
-0.112(0.01)a -0.005(0.00)c
VOLGPI
-0.619(0.21)a -0.173(0.06)a
VOLGPV(+1) -0.609(0.20)a -0.171(0.05)a
CPI -0.014(0.00)a 0.002(0.00) -0.014(0.00)a 0.002(0.00) -0.014(0.01) a 0.004(0.00)c
LGDP (-1) 0.229(0.35) 0.180(0.23) 0.232(0.35) 0.180(0.23)
LIF_E -1.045(0.27)a -7.944(1.82)a -1.05(0.27)a -8.10(2.07)a -1.465(0.64)b -5.594(1.76)a
LGFCF 0.175(0.13)c -0.036(0.07) 0.197(0.12)c -0.028(0.07) 0.277(0.23)c -0.057(0.08)
EDEXP 0.132(0.03)a 0.021(0.01)c 0.132(0.03)a 0.021(0.01)c 0.656(0.09)a
0.017(0.01)
Dummy 0.001(0.01)
0.002(0.01)
0.006(0.01) VECM
Coefficient
-0.190(0.05)a
-0.183(0.04)a
-0.049(0.01)a
Serial LM Test 70.92[0.25]
70.94]0.25]
54.123]0.28]
Adj R-Sq 0.475565
0.430905
0.3409 Notes: Standard errors in ( ), p-value in [ ], a, b, c entail 1%, 5%, 10% significance levels respectively
3.6 Concluding Remarks
The purpose of this chapter was to examine the link between growth and inequality in
transitional economies where the adoption of high-risk, high-return technologies is subject to a
fixed adoption cost. The underlying motivation for this study stems partly from three empirical
observations. Firstly, it is motivated by empirical evidence suggesting that transitional and
developing economies still experience diverse growth experiences. Secondly, it is motivated by
the persistence of cross-country and intra-country inequality of incomes in these countries.
Thirdly, it is motivated by the empirical observation that some countries are characterised by
high fluctuations in inequality while others are characterised by much smoother changes in
inequality.
We develop a simple endogenous growth model in which growth takes place through
physical and human capital deepening, and agents are heterogeneous in their initial resource
endowments. In the model, an agent faces the choice of adopting either of the two technologies
available in the economy, a safe low return and risky-high return technology. Furthermore,
there is a cost associated with adoption of the risky-high return technology. We interpret this

64 | P a g e
cost as an implicit ‘learning-by-doing’ fixed cost associated with uncertainty in an environment
which has less developed economic and financial institutions.
Depending on the initial productivity differences between the two technologies and the
implicit fixed cost of adopting Technology B, three outcomes are possible. We characterize these
as poverty trap, dual economy and balanced growth. Further analysis of these three outcomes
reveals that, once agent-idiosyncratic uncertainty is introduced into the model new sub-
outcomes emerge within the poverty trap and dual economy outcomes. Each of these sub-
outcomes is associated with different sets of productivity parameters and adoption costs and
shows its own unique growth and inequality patterns. This suggests the existence of diversity
within diversity. Consequently, our model has the potential to explain the diverse growth and
inequality patterns observed in the empirical data better than other models in related literature.
Furthermore, by experimenting with different levels of shocks, we are able to disentangle
that uncertainty influences for both the transitional technology adoption decisions and the long
run technology adoption levels. In so doing we find that uncertainty affects the transitional path
of growth and inequality as well as the long run economic outcomes of nations. More specifically
nations that face large production or consumption shocks and will potentially fall into poverty
trap if they do not have developed institutions to diversify or to alleviate the effects of these the
shocks. Studies such as Dercon (2011) have provided evidence consistent with this idea.
In this essay, we also provided empirical evidence which offers indirect support to the idea
that risk negatively affects technology adoption decision in the short run and the long run levels
of technology adoption even after controlling for other determinants of technology adoption.
This empirical analysis is based on aggregate levels of technology adoption in the Indian
agricultural sector. Moreover, the impact of the other standard determinants of technology
adoption is found to be in accordance to a priori expectation, except for life expectancy. Finally,
in light of data constraints, we believe that the findings of our empirical analysis set a good
foundation for future empirical work once better data becomes available.
Given the importance of risk and cost impede technology adoption, technological progress,
and long run economic outcomes, reforms that are aimed at tackling these two barriers are
necessary if a nation is to escape underdevelopment. However, reforms often create new issues
for technology adoption, growth and inequality. These issues pertain to the fact that these

65 | P a g e
reforms have different effects on the preferences of heterogeneous economic agents. As such
agents are likely to respond to these reforms in a variety of ways depending on the various
mechanisms available to express their preferences and consequently creating new complexities
for technology adoption, growth and inequality. These are the issues addressed in the political
economy extension to the benchmark model presented in the next chapter.

66 | P a g e
Appendix 3.1: Proof of inequality (12)
Agents adopt Technology B iff. indirect utility of Technology B is greater that indirect utility of
Technology A. This implies that agents adopt Technology B
),(),,,( 11,1
,1
,1
,1
Ait
Ait
AhBit
lBit
hBit
lBit
B bcUbbccUiff ++++++ ≥ Substituting for the functional forms of the utility function we get,
)ln()ln()ln()1()ln()ln()1()ln( 11,1
,1
,1
,1
Ait
Ait
hBit
lBit
hBit
lBit bcbpbpcpcp ++++++ +≥−++−+ θθ
Recognising that 11 ++ = itit cb θ we can substitute for 1+itb and simplify the resulting inequality to obtain the following:
)ln()ln()ln()1()ln()ln()1()ln( 11,1
,1
,1
,1
Ait
Ait
hBit
lBit
hBit
lBit cccpcpcpcp ++++++ +≥−++−+ θθθθθ
Using laws of logarithms and then simplifying the above inequality we can obtain:
)ln()ln()1()ln( 1,1
,1
Ait
hBit
lBit ccpcp +++ ≥−+
Rewriting hBit
lBit
Ait ccc ,
1,11 ,, +++ in terms of their definitions in steady state equations (5), (7), (8) we
obtain the following:
++
≥
+
−++−+
+
−++)1(
)(ln)1(
)()(ln)1()1(
))((lnθ
φθ
δεηθ
δεη ititlitl WwWwpWwp
Using laws of logarithms, we can simplify the above inequality to get the following:
[ ] [ ] [ ])(ln))((ln)1())((ln ititlitl WwWwpWwp +≥−++−+−++ φδεηδεη
Since log is a monotonic transformation, it must be that:
[ ] [ ] [ ]itithitl WwWwWwpp
+≥−++⋅−++−
φδεηδεη)1(
)()()()(
Since there is a level of endowment *W that equates the RHS to the LHS, we can write:
[ ] [ ] [ ]***)1(
)()()()( WwWwWwpp
hl +=−++⋅−++−
φδεηδεη

67 | P a g e
Appendix 3.2: Proof of Proposition 1
Firstly, it is to see the LHS and RHS in (12) are both continuous functions in Wit.
Secondly, the following applies as Wit approaches the origin
)1()1(])[(])[(
0lim Apwh
pwlLHSWt
−−+⋅−+→→
δεηδεη
)2(
0lim AwRHS
Wtφ→
→
Thus, as 𝑊 → 0, LHS < RHS iff: )3()1(])[(])[( Awpwhpwl φδεηδεη <−−+⋅−+
Thirdly, expressing equation (12) in logarithmic form and taking the derivatives of the LHS and
the RHS with respect to W* we obtain the following:23
)4(0))((
)()1(
))((
)()( AitWwh
hp
itWwl
lp
itWLHS
>
−++
+−+
−++
+=
∂∂
δεη
εη
δεη
εη
Using equations (7) and (8), we can recognise that lBitCitWwl
,)1())(( θδεη +=−++ . Thus by rewriting and simplifying equation A4, we can obtain the following:
)5(0,,)1(
,)()1(,)()( AhB
itClBitC
lBitChphB
itClp
itWLHS
>
+
+−++=
∂∂
θ
εηεη
)6(01)( AitWwitW
RHS>
+=
∂∂
As 𝑊 → ∞, LHS increases faster than RHS as long as A5 > A6. By simplifying the expressions, we can obtain the following:
)7(,,)1(,)()1(,)()( AhBitClB
itChBitChplB
itClpitWw θεηεη +>
+−+++
In A7 it is easy to see that LHS > RHS. Thus assuming that (A3) applies, the W* exists.
23 Taking logs amounts to a monotonic transformation, so comparing slopes of the transformed LHS and RHS are equivalent to the corresponding comparing of the untransformed levels.
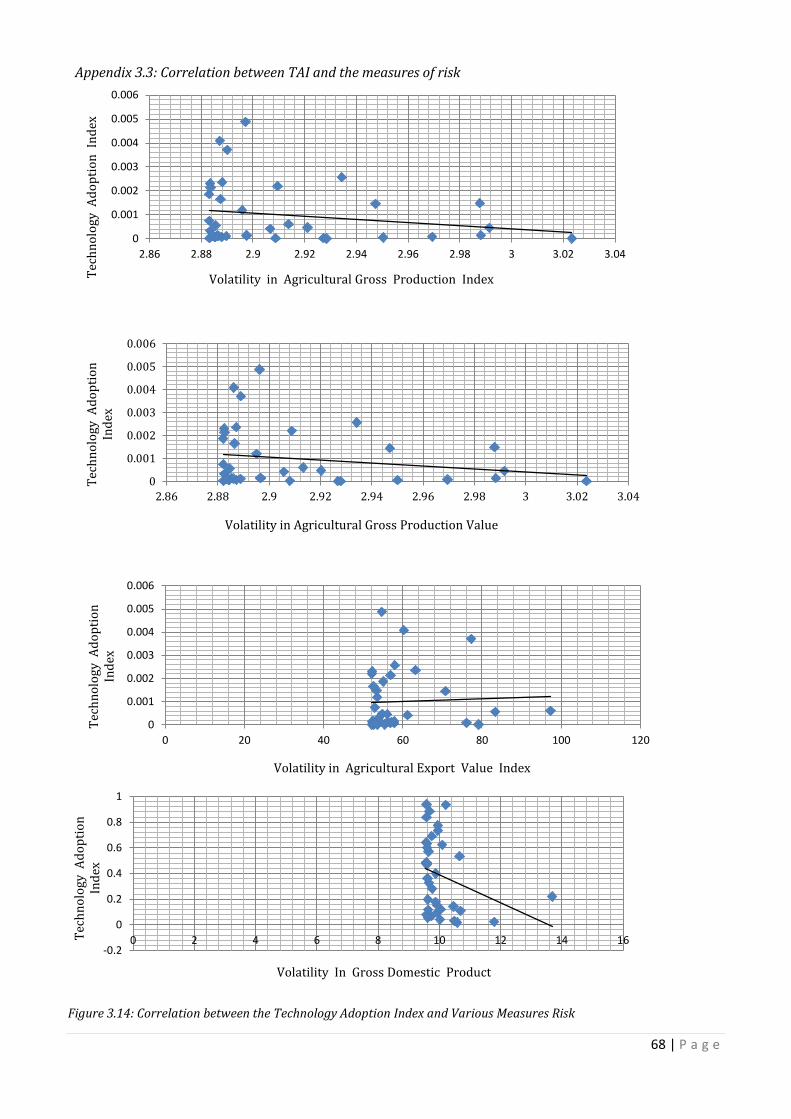
68 | P a g e
Appendix 3.3: Correlation between TAI and the measures of risk
Figure 3.14: Correlation between the Technology Adoption Index and Various Measures Risk
0
0.001
0.002
0.003
0.004
0.005
0.006
2.86 2.88 2.9 2.92 2.94 2.96 2.98 3 3.02 3.04
Tech
nolo
gy A
dopt
ion
Inde
x
Volatility in Agricultural Gross Production Index
0
0.001
0.002
0.003
0.004
0.005
0.006
2.86 2.88 2.9 2.92 2.94 2.96 2.98 3 3.02 3.04
Tech
nolo
gy A
dopt
ion
In
dex
Volatility in Agricultural Gross Production Value
0
0.001
0.002
0.003
0.004
0.005
0.006
0 20 40 60 80 100 120
Tech
nolo
gy A
dopt
ion
In
dex
Volatility in Agricultural Export Value Index
-0.2
0
0.2
0.4
0.6
0.8
1
0 2 4 6 8 10 12 14 16 Tech
nolo
gy A
dopt
ion
In
dex
Volatility In Gross Domestic Product

69 | P a g e
Appendix 3.4: Summary Statistics for Variables Used for Empirical Analysis
INFL i_rate LGDP LGFCF LIF_E M3 MORT VOLEX_V VOLGDP VOLGPI VOLGPV TEL
Ter. Enrol TAI
Mean 7.26 15.53 11.36 11.59 56.83 38.41 129.04 60.42 9.94 2.90 2.90 0.85 5.81 0.46 Median 8.11 16.28 11.34 11.54 57.46 41.20 124.05 55.73 9.70 2.89 2.89 0.45 5.65 0.48 Maximum 13.87 18.92 11.70 12.63 61.97 56.93 192.30 97.27 13.68 2.99 2.99 3.60 9.62 0.94 Minimum -7.63 12.08 11.03 10.51 47.82 19.42 85.00 52.14 9.57 2.88 2.88 0.16 4.78 0.04 Std. Dev. 4.33 1.62 0.19 0.65 3.66 9.36 30.92 11.28 0.76 0.03 0.03 0.91 1.12 0.27 Skewness -1.16 -0.53 0.12 0.03 -0.81 -0.30 0.49 1.78 4.20 1.77 1.77 1.74 2.33 0.10 Kurtosis 5.72 2.88 1.88 1.79 3.08 2.62 2.27 5.36 21.13 5.53 5.53 5.05 8.49 1.89 Jarque - Bera 16.01 1.42 1.65 1.84 3.30 0.65 1.87 22.77 499.29 23.71 23.71 20.40 64.97 1.61 Probability 0.00 0.49 0.44 0.40 0.19 0.72 0.39 0.00 0.00 0.00 0.00 0.00 0.00 0.45 Observations 36 36 36 36 36 36 36 36 36 36 36 36 36 36
70 | P a g e
CHAPTER 4
RISK INSURANCE AND COSTLY TECHNOLOGY ADOPTION UNDER UNCERTAINTY: A POLITICAL ECONOMY PERSPECTIVE
4.1 Introduction
An important finding from the benchmark model presented in Chapter 3 is that adoption
cost and uncertainty constrain technology adoption in developing nations. These two barriers
can determine the long run growth and inequality outcomes of nations through their effects on
agents’ transitional technology adoption decisions and the long run level of technology
adoption. The variation in the strength of these barriers across nations usually depends on
differences in institutions. More specifically, the extent to which shocks affect agents depends on
the availability and accessibility of institutions (such as insurance or financial institutions) that
help alleviate these shocks, or appropriate government policies that ensure that agents are
insulated from the shocks. Consequently, institutional and policy reforms that help to create or
develop such institutions are likely to improve technology adoption and the long run economic
outcomes of a nation.
The benchmark model also shows that, given initial heterogeneity in the income
distribution, the above mentioned constraints to technology adoption may worsen inequality.
This is because the rich agents who can pay the adoption cost and diversify the uncertainty
associated with the superior technologies can adopt more productive technologies, while the
poor agents will be stuck with the risk-free, cost-free and low-productivity technology. As a
result the wealth of the former group of agents increases faster than that of the latter group of
agents. This then creates conflicts among these two groups, which in turn necessitates the need
for policy and institutional reforms.
However, the aforementioned reforms are often endogenous, in that they depend on the
preferences of agents in the economy. Firstly, as stated in the preceding paragraph, these
reforms are initiated by distributional conflicts among agents in the economy. Secondly, the
success of the reforms and their influence on growth and inequality hinge on the preferences of
different groups of agents in the economy and the mechanisms available to express these

71 | P a g e
preferences. As such, the outcomes depend on the groups of agents that either constitutes the
majority or those who have greater influence in the political process underlying the
determination of such reforms. It is therefore more appropriate to model institutional and
policy reforms and their impact on the economic outcomes using a political economy construct.
In this regard, the essay extends the benchmark models developed in Chapter 3 by
incorporating political economy issues.
A number of studies attempt to explain the role of political economy issues in growth and
inequality, albeit with mixed conclusions. One strand of these studies includes endogenous
growth models by Persson and Tabellini (1994) and Alesina and Rodrik (1994), where agents
are allowed to vote for the tax rate on capital. The political outcome in these models depends on
the preferences of the median agent. In an economy with high initial inequality the median agent
is poor. Consequently, the majority of the agents prefer a high capital tax rate resulting in a
negative relationship between growth and initial inequality.
Another strand of political economy studies predicts that relationship between growth and
initial inequality is either positive or ambiguous. One such study is by Li and Zou (1998). This
study modifies the model of Alesina and Rodrik (1994) by allowing the government to be
engaged in both production and consumption.24 They then show that, if the government
consumption is incorporated into the preferences of the agents, the relationship between
growth and inequality would either be positive or ambiguous, depending on the trade-off
between private and public consumption.
Other models analyse how the adoption of new technologies affect the political economy
relationship between growth and inequality. For instance, a study by Krusell and Rios-Rull
(1996) develops a three-period lived model where agents vote on whether to adopt new
technologies or maintain the old technology. In the presence of heterogeneity in initial
endowments, vested-interest groups comprising of the users of the old technology use their
political influence to block the new technologies. This then results in low rates of technological
change and long cycles of economic stagnation. An alternative model is a two-period lived
overlapping generations model by Lahiri and Ratnasiri (2013). This model uses more general
preferences, and an AK technological structure to show political outcomes which are somewhat
similar to Krusell and Rios-Rull in the sense that they may slow down the pace of technological
24 In Alesina and Rodrik (1994) the role of the government is only limited to providing the productive technology.
72 | P a g e
progress. However, the political outcomes of this model are based on the majority rule. The poor
agents, who are unable to afford the adoption costs associated with new technology, are the
majority at the early stages of the economy block the allocation of resources towards R&D.
However, because this model has redistribution in the form of taxation and lump-sum transfer
payments, the poor agents are able to accumulate the threshold wealth required to adopt the
productive technology. As such, all agents will eventually support allocation of resources
towards R&D.
Mixed findings are also noticeable in the empirical literature. The differences in empirical
results often reflect the underlying differences in the theoretical basis for the empirical models,
the causality restrictions imposed in the empirical models, and the choice of inequality
measures. Persson and Tabellini (1994) use a measure of inequality based on the top 20% share
of income to provide evidence of an inverse relationship between growth and inequality holds
for democracies, but not for non-democracies. Similarly, Alesina and Rodrik (1994) also provide
evidence of a negative relationship between growth and initial inequality using measures of
inequality based on the Gini coefficient and distribution of land. However, they do not find
significant evidence that this relationship differs between democracies and non-democracies.
On the contrary, Clarke (1995) shows that the negative relationship between inequality
and growth is neither robust across different income inequality measures, nor across
specifications of the growth-inequality regressions. Other studies such Forbes (2000) provides
panel regression evidence based on mostly OECD nations suggesting that growth and inequality
are positively related. Li and Zou (1998) also provide evidence supportive of the positive
relationship between the two variables, although they cannot rule out the fact that the
relationship can also be ambiguous.
Yet another strand of empirical studies provides evidence that questions whether the
relationship between growth and inequality is monotonic, as assumed in many empirical
studies. For instance, Barro (2000) provides panel regression evidence consistent with the
Kuznets (1955) idea that the relationship between growth and inequality is negative for the
nations at early stages of development, and positive for developed nations. Similarly, using a
sample comprising of developed and developing nations, Banerjee and Duflo (2003) document
evidence, based on non-parametric analysis that the relationship between growth and
inequality follows the Kuznets curves. However, unlike the Kuznets hypothesis where the
73 | P a g e
inverted U-shape results from a natural process of development, their explanation is based on
the idea that, in a political economy changes in inequality from any direction will negatively
affect growth. Furthermore, these authors argue that, for the relationship between growth and
inequality to be captured properly, empirical analysis should not rely on models that impose
linear, unidirectional, parametric structures on these two variables.
From the foregoing discussion, it is evident that the relationship between growth and
inequality is inconclusive both at theoretical and empirical levels. This suggests that there is
scope for further research. To this end, we contribute to this debate by developing a political
economy model where agents make technology adoption decisions in the presence of
idiosyncratic uncertainty. In this model, we extend the benchmark model by allowing for the
existence of financial intermediaries that help agents to alleviate the risk associated with the
superior technologies. We assume that these financial intermediaries are able to reduce this
through pooling the idiosyncratic risks of agents. In order to access the financial system, agents
pay a fixed entry fee and a periodic cost that varies with the return on the superior technology.
To introduce political economy issues in the model, we assume that there is a government
which facilitates R&D and financial development, and redistributes wealth. The government
raises its revenue by levying a constant and exogenous tax rate on agents’ wealth. Agents are
then allowed to vote on the proportion of the revenue that should be spent on two competing
alternatives. One alternative is a lump-sum transfer to every agent. The other is cost-reducing
R&D and financial development expenditure. The voting process takes place before agents know
whether they will face a good shock or a bad shock. Once voting has taken place, the proportions
of revenue for the two respective alternatives above are allocated accordingly.
The presence of idiosyncratic shocks in our model entails that the changes in the
preferences of the agents is non-monotonic. As a result, the effects of these changes on the
political outcomes of our model are quite distinct relative to those in related literature. Our
model shows that, agents at both ends of the distribution collude to block the allocation of
resources towards cost-reducing R&D and financial development expenditure.25 This result is
similar to the “ends against the middle” feature observed in some political economy models, for
example, the model of Epple and Romano’s (1996)
25 As shall become clear later, the top-end (‘rich’) and the bottom-end ‘poor’ agents are defined in a relative to a certain threshold level of wealth that is required to access financial intermediaries.

74 | P a g e
A key reason for the aforementioned collusion is that agents with different wealth levels
face different trade-offs, and that these trade-offs change in non-monotonic ways as wealth
increases. This results in a situation where the preferences of agents from both ends of the
distribution increase in lump-sum transfer faster than in the proportion allocated towards cost-
reducing R&D and financial development expenditure. However, as redistribution continues, the
middle of the distribution becomes successively thicker, and the majority of the agents start
preferring the allocation of more funds towards cost-reducing R&D and financial development
expenditure.
During the transitional process, the growth rate and inequality show patterns of recurring
inverted Kuznets curves. These patterns are due to political cycles, which emanate, in part, from
the group conflicting choices initiated by the presence of disparities in the initial resource
endowments of agents. The political cycles are then exacerbated by the fact that the presence of
uncertainty causes precautionary voting. To elaborate on this point, starting from certain initial
level of inequality, unexpected shocks induce bias towards more redistribution in the next
period, thus resulting in sudden reduction of inequality. However, the sudden decrease in
inequality reduces the preference for redistribution in the subsequent period, thus resulting in
an increase in inequality. These political cycles continue until the economy reaches the steady
state which is characterised by a balanced growth rate and equitable distribution of wealth.
Further numerical experiments show that the political cycles, and the resulting
sluggishness and fluctuations in transitional growth and inequality are more pronounced when
initial inequality is low and shocks are large. The explanation for this is that low inequality
decreases the number of agents in favour of redistribution in the form of the lump-sum transfer.
This can cause an increase in inequality, which alters the majority preference in the next period,
and so on. This then leads to fluctuations, and sluggish reductions in inequality. The excessive
precautionary voting caused by the presence of uncertainty then exacerbates these fluctuations.
The abovementioned features of our model are quite useful in explaining why developed
nations sometimes experience reversals in their path of inequality.26 According to our model,
these reversals are due to the two-way link between inequality and redistribution. More
specifically, a decrease in inequality resulting from high redistribution in the current period will
reduce the preference for redistribution in the next period, thus resulting in an increase in 26 Zillono document that a number of many European and European Offshoots s nations have experienced increases inequality between the early 1980s and the early 1990s. This followed a falling trend since the 1950s.
75 | P a g e
inequality. This explanation is in line with an observation by Zollino (2004) that the decrease in
inequality in Europe resulted in reduced preference towards social welfare policies. This two-
way link suggests that non-linear and non-parametric empirical models, such as those suggested
by Banerjee and Duflo (2003) are more plausible in analysing the short run relationship
between growth and inequality, compared to empirical models that impose linear, parametric or
one-way link between the two variables.
Finally, our numerical experiments show that the political economy choices are sub-
optimal in the early and transitional stages of economy. This is because they do not coincide
with choices which maximize the aggregate welfare of all agents. However, once the economy
reaches the steady state path, the political economy choices become optimal.
The remainder of the paper is organised as follows. In Section 4.2, we describe the
economic environment and carry out some comparative static analysis with the political
economy model. To shed light on the dynamics, in Section 4.3, we conduct some numerical
experiments with the political economy model. We then compare the political outcomes to the
welfare maximizing outcomes. In Section 4.4, we conclude the paper. The appendix presents
some technical details of the analysis in Section 4.2.
4.2 The Economic Environment
We consider a two-period overlapping-generations economy with N-agents whose wealth
holdings are heterogeneous. A new generation is born every period. Each ith agent is born with a
unit of unskilled labour endowment that can earn them a subsistence wage w . Agents born in
period t also inherit wealth from their parents in the form of bequests. Time is discrete, with t =
0, 1, 2,...., and initial distribution of wealth is described by W ( . ).
The economy has two technologies, one subject to high risk (hereafter referred to as
Technology B) and another, that is only accessed through financial intermediaries, who are able
to minimize the risk by pooling risks of all agents (hereafter referred to as Technology F). The
total return on Technology B has two components and is given by tt εηϑ += , where 0>η is a
time-invariant and non-stochastic component and tε is a time-variant shock that is agent-
idiosyncratic. If the agent faces a bad shock, and this occurs with the probability p, then

76 | P a g e
0<= lt εε , while if the agent faces a good shock 0>= ht εε . We assume that 0][ =tE ε and
ηε <l . The return on Technology F is similar to that of Technology B when the agent faces a
good shock i.e. ht εηϑ += . However, when the agent faces a bad shock, the return on Technology
F is φ where ηφεη <<+ l . This modelling approach follows an idea by Townsend and Ueda
(2006, 2010).
As in Townsend and Ueda (2006, 2010), agents who decide to use financial intermediaries
will deposit all their wealth in financial intermediaries. However, we assume that agents cannot
borrow to adopt a certain technology. Rather, financial intermediaries invest on behalf of all the
agents who deposit funds with them and offer the returns as described above depending on the
type of shock that an agent faces. Financial intermediaries charge two intrinsic and non-
refundable costs. Firstly they charge a once-off fixed entry fee 0>ψ . This fee implicitly
represents the registration and other fees that financial intermediaries incur including any
mark-up they charge on customers. Secondly they charge a periodic service fee ]1,0[∈λ , which
is a constant proportion of the returns on Technology F.27 Thus if agent i uses financial
intermediaries, his/her return at any time t is given by ),(max)1()( φϑλϑ ttR −= .
There is also a government in the economy. The government supervises the financial
intermediaries.28 The government raises its revenue by levying a constant tax rate of τ is levied
on the heterogeneous agents’ total endowment. The distribution of the agents’ total endowment
is described by a density function )(.)(Wf with support ),0( κ . The total revenue that the
government raises in any period is described by:
[ ] )1(
0
(.))(.)((.) tWdWWfWtGR τκ
τ =
= ∫
where ( ).W is as defined earlier and GRt is the revenue raised in period t. The government then
uses a proportion tt Wg τα= of the funds to reduce the cost associated with registering a
financial intermediary and to fund its regulatory activities. The latter cost may, for example,
include things such as the cost of training a financial regulator, engaging in research and other
27 As we shall discuss later, ψ is endogenous in this model. They are determined by the proportion α of government revenue allocated towards financial intermediation. Every period agents vote for on the desired level of α and the winning α becomes the proportion that the government allocates towards financial intermediation. 28 We assume that there are extortionist elements in the financial system that would charge exorbitant fees without appropriate supervision. Note that we do not explicitly model financial regulation.

77 | P a g e
activities aimed at improving the financial system. Thus ψ is decreasing in gt which in turn
depends on α .The remainder of the revenue tt Wtr τα )1( −= is given to all the young agents in
the form of a lump-sum transfer.
In this model, we consider the following properties for the functional forms of ψ 29
(i) .0)('';0)(' ≥< gg ψψ
(ii) 0)( =∞→ggψ
The fixed cost is specified as follows:
+=
)1()(
tgtg ψψ , where ψψ =)0( .
We assume that the tax rate τ is exogenously determined by the government. However,
the agents vote on the proportion α that should be allocated towards cost-reducing financial
development expenditure. Voting takes place at the ‘first stage’ of each period t and the political
outcome is determined by majority rule. In the “second stage” of period t, after considering the
political outcome, agents now decide whether they should use financial intermediaries or not.
The timing of events is as characterised by the figure below:
The economy produces output (Y) using capital (K). The production functions G(K) assume
a simple “AK” specification. Specifically, the production functions for Technology F is G(Kt) = BKt
and for Technology B is G(Kt) = FKt, where B and F denote the respective total factor productivity
parameters associated with the two technologies, and B < F.
29 We also explored the case where 𝜆 is endogenous. However, the results for this case were too obvious. As would be expected, both analytical and numerical result showed that the agents who adopt Technology F would favour the highest possible gt to be allocated towards the reducing 𝜆 while the agents who adopt Technology B prefer the highest possible trt. We provide a formal explanation in Appendix 3.
Old agents carry out state-contingent plans. Voting
outcome is revealed
Agents decide whether to seek financial intermediation, and make state-contingent plans
t+1 t
The shock that economy faces is revealed.
Stage 2: Agents receive lump sum transfers
Stage 1: Young agents vote on their desired level of α
Next generation of young agents vote on desired level of α
78 | P a g e
The agent does not consume in the first period of his life. The utilities of the agents use and
those who do not use financial intermediaries are as described in equations (2) and (3),
respectively:
)2()ln()1()ln()ln()1()ln(),,,( ,1
,1
,1
,1
,1
,1
,1
,1
hBit
lBit
hBit
lBit
hBit
lBit
hBit
lBit bpbpcpcpbbccU ++++++++ −++−+= θθ
)3()ln()1()ln()ln()1()ln(),,,( ,1
,1
,1
,1
,1
,1
,1
,1
hFit
lFit
hFit
lFit
hFit
lFit
hFit
lFit bpbpcpcpbbccU ++++++++ −++−+= θθ
In equations (2) and (3), 1+itc and 1+itb denote period 2 household consumption and
bequests for the ith agent. Superscripts B and F simply imply that the agent adopts Technology B
and Technology F, respectively, while superscripts l and h denote that the agent faces a bad
shock and a good shock, respectively. The parameter 𝜃 describes the extent of imperfect
intergenerational altruism in the model.
Every period each generation faces a problem regarding whether to use financial
intermediaries or not. This decision depends on an agent’s resource endowment and this
depends upon the resources they inherited from their parents through bequests.
Agents face different budget constraints depending on whether they use the financial
intermediaries or not. The budget constraints for agents that do not use the financial
intermediaries are as follows:
)4()1(,1))(()1(,
1 tWlBitbitWwl
lBitc ταεητ −++−++−=+
)5()1(,1))(()1(,
1 tWhBitbitWwh
hBitc ταεητ −++−++−=+
The resource endowments for agents depend on whether their parents used financial
intermediaries or not, in addition to the idiosyncratic shocks faced by their parents. The
resource endowment for agents whose parents did not use financial intermediaries is given by
xBitbxB
itWitW ,, == while the endowment of agents whose parents used financial intermediaries
is given by xFitbxF
itWitW ,, == , where x = h, l.
For agents who use financial intermediaries, the budget constraints are described as
follows:
)6()()1(,1))(1()1(,
1 tgtWlFitbitWwlF
itc ψταλφτ −−++−+−−=+
)7()()1(,1))(()1()1(,
1 tgtWhFitbitWwh
hFitc ψταεηλτ −−++−++−−=+

79 | P a g e
Agent i’s problem is make choices of 1,1 ++ itbitc that maximise his/her utility. More
specifically, agents that do not seek financial intermediation maximise equation (2) subject to
constraints (4) and (5). This yields the following optimal state-contingent consumptions and
bequest plans:
[ ] )8()1()()()1(1
1,1 tWitWwllB
itc ταεητθ
−+++−+
=+
[ ] )9()1()()()1(1
1,1 tWitWwhhB
itc ταεητθ
−+++−+
=+
[ ] )10()1()()()1(1
,1 tWitWwllB
itb ταεητθ
θ−+++−
+=+
[ ] )11()1()()()1(1
,1 tWitWwhhB
itb ταεητθ
θ−+++−
+=+
Alternatively, agents who use financial intermediaries maximise equation (3) subject to
constraints (6) and (7). This yields the following optimal state-contingent consumption and
bequest plans.
[ ] )12()()1())(1()1(1
1,1 tgtWitWwlF
itc ψταλφτθ
−−++−−+
=+
[ ] )13()()1())(()1()1(1
1,1 tgtWitWwhhF
itc ψταεηλτθ
−−+++−−+
=+
[ ] )14()()1())(1()1(1
,1 tgtWitWwlF
itb ψταλφτθ
θ−−++−−
+=+
[ ] )15()()1()))()(1()1(1
,1 tgtWitWwhhF
itb ψταεηλτθ
θ−−+++−−
+=+
The ith agent will seek the financial intermediation iff.
)16()*1,*
1()*1,*
1( ++≥++ itbitcBUitbitcFU
where FU and XU represent the indirect utility functions for the agents who use financial
intermediaries and agents who do not use financial intermediaries respectively and the
subscript * denotes the optimal choice of the variable in question. It can then be shown that (16)
implies the following (See proof in Appendix 4.1):
[ ]p
tWitWwl
ptgtWitWw
−+++−
−−++−−
))1(()*()()1(
)())1(())(1()1(
αεητ
ψαλφτ≥
[ ][ ] )17(
1)())1(()))()(1()1(
1))1(()()()1(
ptgtWitWwh
ptWWwh it
−−−+++−−
−−+++−
ψαεηλτ
αεητ

80 | P a g e
In equation (18), the LHS gives the ratio of the expected wealth of an agent who uses
financial intermediaries to the expected wealth of an agent who does not use financial
intermediaries in the event that they face a bad shock. Alternatively, the RHS gives the ratio of
the expected wealth of an agent who does not use financial intermediaries to the expected
wealth of an agent who uses financial intermediaries in the event that they face a bad shock.
Since in equation (17), the RHS > 1, it is clear that an agent will use financial intermediaries, iff
the risk-alleviating benefits of financial intermediaries are such that in the event of a bad shock,
the expected wealth of an agent who uses financial intermediaries will outweigh the expected
wealth of an agent who does not.
We define W * as the Wit that solves equation (17).30 This W * would represent the
threshold level of initial endowment that is required for an agent to enter the financial
intermediary system. It is possible to gain some insight on how people vote by analysing the
total change of W * with respect to changes in α . The results of the comparative static analysis
presented in Appendix 4.2 show that W * is decreasing in α .31 This then suggests that agents
are likely to prefer a high α in order to enter the financial intermediary system quickly.
However, this decision is not clear cut because agents also receive a lump-sum transfer payment
tWτα )1( − , which is decreasing in α . Thus agents will have to weigh the trade-off between the
benefits from a reduction of W * (in the form of high expected returns from financial
intermediaries) and the lump-sum transfer. This trade-off is likely to vary from agent to agent
depending how close they are W *.
Thus, it is important to analyse how the indirect utilities of individual agents change as α
changes. More specifically, we compute the partial derivatives of the indirect utility functions of
each agent i with respect to the parameter α i.e. ),(', ταtiV . Although it would be intuitive to
argue that the rich agents would favour α > 0 (and poor people α = 0) to benefit from a reduction
in entry costs, the political solution from this exercise is not conclusive because the sign of
),(', ταtiV is neither clear nor constant across the range of values of α. Furthermore, the presence
of uncertainty in the model introduces more complexity.32 This is because W * also shifts
depending on the sign of εt. More specifically, if 0<lε , W * increases while if 0>hε , W *
30 Intuition and numerical analysis suggest that this must be the case but it is difficult to provide formal proof. 31 See the derivatives in Appendix 3.2. 32 Recall that the shock is only revealed after agents have voted.
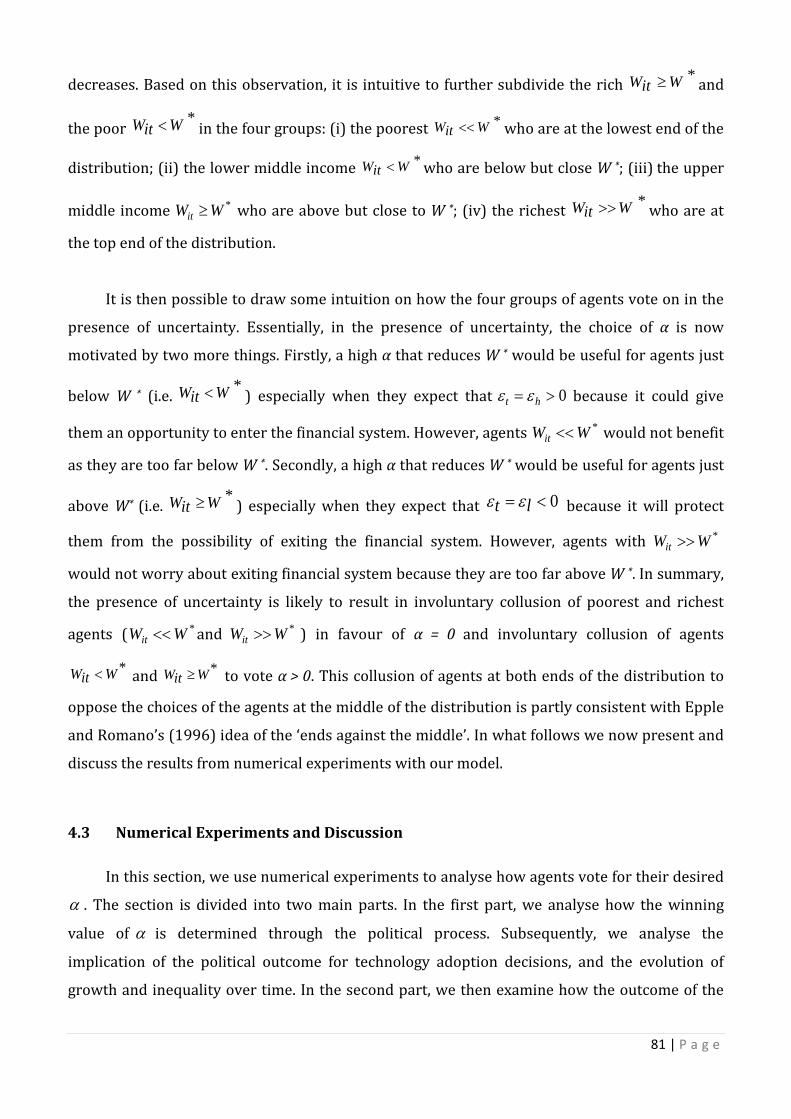
81 | P a g e
decreases. Based on this observation, it is intuitive to further subdivide the rich *WitW ≥ and
the poor *WitW < in the four groups: (i) the poorest *WitW << who are at the lowest end of the
distribution; (ii) the lower middle income *WitW < who are below but close W *; (iii) the upper
middle income *WWit ≥ who are above but close to W *; (iv) the richest *WitW >> who are at
the top end of the distribution.
It is then possible to draw some intuition on how the four groups of agents vote on in the
presence of uncertainty. Essentially, in the presence of uncertainty, the choice of α is now
motivated by two more things. Firstly, a high α that reduces W * would be useful for agents just
below W * (i.e. *WitW < ) especially when they expect that 0>= ht εε because it could give
them an opportunity to enter the financial system. However, agents *WWit << would not benefit
as they are too far below W *. Secondly, a high α that reduces W * would be useful for agents just
above W* (i.e. *WitW ≥ ) especially when they expect that 0<= lt εε
because it will protect
them from the possibility of exiting the financial system. However, agents with *WWit >>
would not worry about exiting financial system because they are too far above W *. In summary,
the presence of uncertainty is likely to result in involuntary collusion of poorest and richest
agents ( *WWit << and *WWit >> ) in favour of α = 0 and involuntary collusion of agents
*WitW < and *WitW ≥ to vote α > 0. This collusion of agents at both ends of the distribution to
oppose the choices of the agents at the middle of the distribution is partly consistent with Epple
and Romano’s (1996) idea of the ‘ends against the middle’. In what follows we now present and
discuss the results from numerical experiments with our model.
4.3 Numerical Experiments and Discussion
In this section, we use numerical experiments to analyse how agents vote for their desired
α . The section is divided into two main parts. In the first part, we analyse how the winning
value of α is determined through the political process. Subsequently, we analyse the
implication of the political outcome for technology adoption decisions, and the evolution of
growth and inequality over time. In the second part, we then examine how the outcome of the

82 | P a g e
political process compares to an outcome that would result if the choice of α was based on
social welfare consideration.
The initial distribution of wealth for the reported results is assumed to be lognormal with
a mean of 2. 5 and standard error of 0.4 and there are 501 agents. The parameters used are
reported in Table 4.1. The parameter choices are guided by the conditions set in the Section 2.
The numerical results presented are robust to sensitivity tests with different distributions and
parameter values.
4.3.1 The Political Outcome
The results from the numerical experiments with the models are shown in Figure 4.1. In
Figure 4.1, panel (a) shows the number of agents who use financial intermediaries versus those
who do not. The winning values of α, and the proportion of agents voting for the winning value
are shown in panels (b) and (c), respectively. Panels (d) and (e) show the implication of the
political process on the transitional dynamics of inequality and growth, respectively.
These numerical results are quite consistent with the intuition set out in Section 2. As
discussed in Section 2, the political outcomes of this model are determined by the battle
between agents from both ends of the distribution (i.e. *WitW << and *WitW >> ), who prefer
lump sum transfer payment and agents from middle of the distribution (i.e.
** WitWandWitW ≥< ), who prefer redistribution in the form of cost-reducing financial
development expenditure. Because most agents are poor in the early stages of development, the
political outcome is characterized by α = 0.33
To elaborate on the reasons of the different choices made by different groups of agents
above, agents at the bottom end of the distribution prefer a lump-sum transfer because a
reduction in the cost of entering the financial intermediaries ( ψ ) will not help them enter the
financial system since their initial endowment is too far below from the threshold level of
wealth required, W*. Agents at the top end of the distribution also prefer a lump sum transfer
because cause a reduction in ψ will not benefit them much given their endowment large
enough; they can still afford to use financial intermediaries even in the event of a bad shock. On
33 Note that at some points in the early stages of the economy, the political outcome is unclear because the proportion of agents voting for the winning is below 50%.
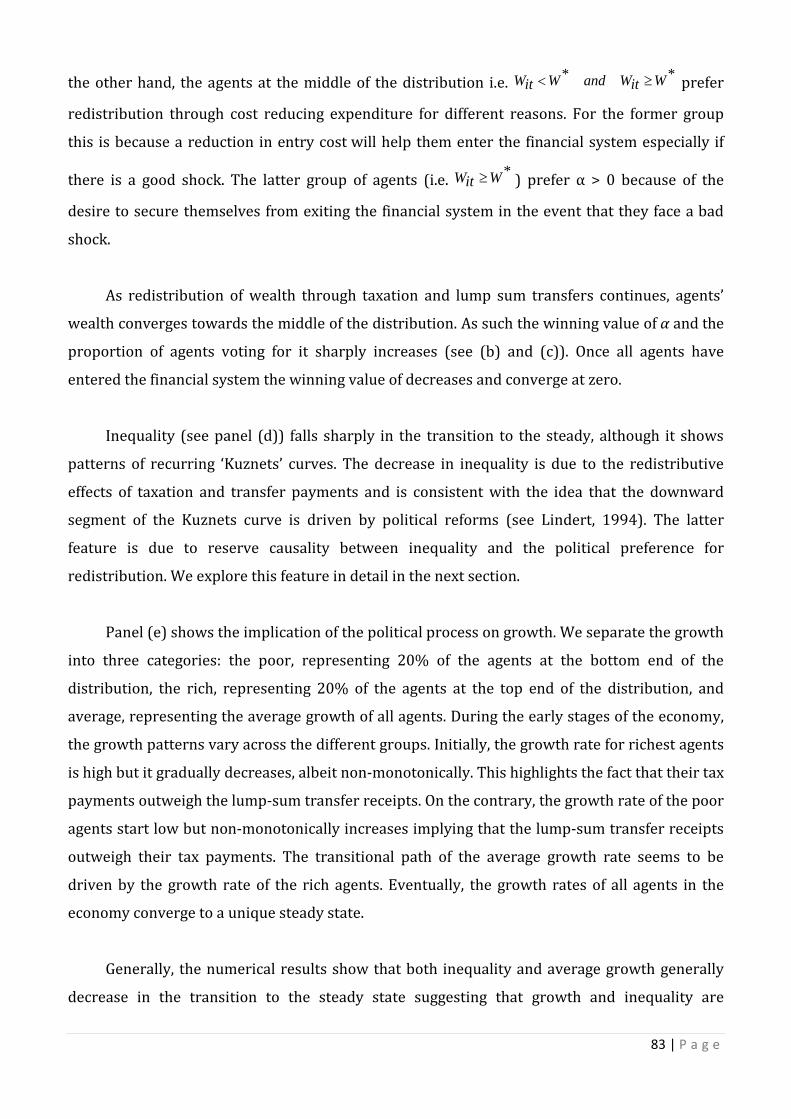
83 | P a g e
the other hand, the agents at the middle of the distribution i.e. ** WitWandWitW ≥< prefer
redistribution through cost reducing expenditure for different reasons. For the former group
this is because a reduction in entry cost will help them enter the financial system especially if
there is a good shock. The latter group of agents (i.e. *WitW ≥ ) prefer α > 0 because of the
desire to secure themselves from exiting the financial system in the event that they face a bad
shock.
As redistribution of wealth through taxation and lump sum transfers continues, agents’
wealth converges towards the middle of the distribution. As such the winning value of α and the
proportion of agents voting for it sharply increases (see (b) and (c)). Once all agents have
entered the financial system the winning value of decreases and converge at zero.
Inequality (see panel (d)) falls sharply in the transition to the steady, although it shows
patterns of recurring ‘Kuznets’ curves. The decrease in inequality is due to the redistributive
effects of taxation and transfer payments and is consistent with the idea that the downward
segment of the Kuznets curve is driven by political reforms (see Lindert, 1994). The latter
feature is due to reserve causality between inequality and the political preference for
redistribution. We explore this feature in detail in the next section.
Panel (e) shows the implication of the political process on growth. We separate the growth
into three categories: the poor, representing 20% of the agents at the bottom end of the
distribution, the rich, representing 20% of the agents at the top end of the distribution, and
average, representing the average growth of all agents. During the early stages of the economy,
the growth patterns vary across the different groups. Initially, the growth rate for richest agents
is high but it gradually decreases, albeit non-monotonically. This highlights the fact that their tax
payments outweigh the lump-sum transfer receipts. On the contrary, the growth rate of the poor
agents start low but non-monotonically increases implying that the lump-sum transfer receipts
outweigh their tax payments. The transitional path of the average growth rate seems to be
driven by the growth rate of the rich agents. Eventually, the growth rates of all agents in the
economy converge to a unique steady state.
Generally, the numerical results show that both inequality and average growth generally
decrease in the transition to the steady state suggesting that growth and inequality are
84 | P a g e
positively related in the short run. However, the relationship is bidirectional and non-linear. As
argued earlier, this feature of the model entail that empirical studies that impose linear and
parametric relationship between growth and inequality are unlikely to appropriately capture
the transitional relationship between these two variables within a political economy.
Figure 4.1: The political outcome
4.3.2 Political Cycles, Economic Fluctuations and Sluggishness: Role of shocks and Initial Inequality
A unique feature of our political economy model is that the uncertainty inherent in the
productivity parameters interacts with initial inequality in a manner that produces political
0 20 40 60 80 1000
200
400
600
Time
Num
ber
of A
gent
s
0 20 40 60 80 1000
0.05
0.1
0.15
0.2
Time
Win
ning
α
0 20 40 60 80 10020
40
60
80
100
Time
Pro
port
ion
in f
avou
rof
win
ning
α
0 20 40 60 80 1000
0.1
0.2
0.3
0.4
Time
Gin
i coe
ffic
ient
0 20 40 60 80 1000
2
4
6
8
Time
Ave
rage
gro
wth
AveragePoorRich
Do not use FIUse FI
(a)
(c) (d)
(e)
(b)

85 | P a g e
cycles during the transitional stages of the economy. These political cycles result in a non-linear
and bidirectional relationship between inequality and growth. These political cycles also slow
the pace at which the economy converges towards a balanced growth path.
There are two sources of these political cycles. Firstly, they emanate from the fact that
there is a two-way link between inequality and the political preference for redistribution. Given
initial heterogeneity in wealth, the majority of the agents will prefer redistribution in the next
period resulting in a reduction in inequality. The resulting low inequality then entails that the
agents’ preference for redistribution is reduced. Consequently, inequality increases in the next
period, which changes the political preference in the next period, and so on.
The second source of political cycles is the fact that uncertainty causes precautionary
voting by agents with wealth close to the threshold level. To elaborate on this point, in the
presence of uncertainty, agents with *WitW ≥ face two competing choices. Firstly, they face the
opportunity to further increase their wealth by voting for redistribution through lump-sum
transfer receipts. Their wealth would especially increase if voting for a large transfer payment is
then followed by a good shock in the next period. However, there is also a risk that voting for a
transfer payment instead of cost-reducing financial development expenditure would leave them
vulnerable to the possibility of exiting the financial system, especially if they were to face a bad
shock in the next period. Thus, until their wealth becomes secure, these agents have a tendency
to exercise ‘precautionary’ voting. This entails fluctuations in their preferred α depending on
their previous experience and their expectations about future shocks.
To explore the conditions under which these political cycles are more pronounced, we
experiment with different levels of shocks and initial inequality. The results for the political
outcomes and the economic implication of these political choices are presented in Figure 4.2
and Figure 4.3, respectively. In Figure 4.2, we report the winning values of α and the proportion
of agents voting for the winning α under of high inequality (i.e. Gini coefficient = 0.73) and low
inequality (i.e. Gini coefficient = 0.11), with given levels of shocks.
The results show that when shocks have a low variance (i.e. with 5.0;5.0 =−= hl εε ), the
level of inequality does not seem to influence the winning value of α. However, agents reach a
consensus quicker, the higher the levels of initial inequality. This is evident from the fact that the
proportion of agents in favour of the winning α converges quicker when the level of initial

86 | P a g e
inequality is higher. Consequently, growth and inequality converge to their steady state slower
relative to the case in which initial inequality is low. Furthermore, inequality shows some signs
of fluctuations.
When shocks are ‘high’ ( 1;1 =−= hl εε ), the political choices significantly vary with initial
levels of inequality. Low initial inequality is associated with significant political cycles. These
shocks are evident from the fluctuations of both the winning α and the proportion of agents
voting for the winning α. As evident from Figure 4.3, these political cycles then cause significant
fluctuations in transitional growth and inequality, and delay the pace at which the economy
converges to an equitable and balanced growth path.
As argued earlier, the political cycles and resulting fluctuations in growth and inequality are due
to precautionary voting that results from the presence of uncertainty, and the two-way causality
between inequality and political preference for redistribution. The results suggest that, if initial
inequality is low, poor agents are few. As such redistributive policies are likely to be difficult to
pass. This feature of the model explains the inequality patterns of a number of developed
nations. While inequality has historically decreased in developed nations, countries such as UK,
Sweden and USA, Japan, Denmark, Australia and New Zealand, and Netherlands have
experienced an increase in inequality between 1981 and 1992 (Smeeding, 2000; Brandolini,
1999; Zollino, 2004). A common explanation for this inversion in the trend of inequality is often
based on the ‘imperfect democracy’ argument (see Benabou, 2000; Saint Paul, 2001). However,
our explanation is related to an idea by Zollino (2004:8) that that endogenously determined
political economy fluctuations could trap developed nations ‘in a region where inequality
shrinks and enlarges periodically and counter-cyclically’.

87 | P a g e
Figure 4.2: Political Cycles: Role of initial inequality and shocks
Figure 4.3: Economic Fluctuations and Sluggishness: Role of initial inequality and shocks
0 20 40 60 80-1
-0.5
0
0.5
1
1.5
Time
Winn
ing α
ε,l = -0.5 ; ε,h = 0.5
0 20 40 60 8040
50
60
70
80
90
100
Time
Prop
ortio
n in
fav
our
of w
inning
α
ε,l = -0.5 ; ε,h = 0.5
0 20 40 60 800
0.05
0.1
0.15
0.2
0.25
Time
Winn
ing α
ε,l = -1 ; ε,h = 1
0 20 40 60 8030
40
50
60
70
80
90
100
Time
Prop
ortio
n in
fav
our
of w
inning
α
ε,l = -1 ; ε,h = 1
Initial Gini = 0.11Initial Gini = 0.73
Initial Gini 0.11Initial Gini = 0.73
Initial Gini = 0.11Initial Gini = 0.73 Initial Gini = 0.11
Initial Gini = 0.73
0 20 40 60 800
0.05
0.1
0.15
0.2
0.25
0.3
0.35
0.4
0.45
0.5
Time
Gini
Coe
fficien
t
ε,l = -1; ε,h = 1
0 20 40 60 80-0.5
0
0.5
1
1.5
2
2.5
Time
Avera
ge G
rowth
(Log
Sca
le)
ε,l = -1; ε,h = 1
0 20 40 60 800
0.05
0.1
0.15
0.2
0.25
0.3
0.35
0.4
0.45
0.5
Time
Gini
Coeff
icien
t
ε,l = -0.5; ε,h = 0.5
0 20 40 60 800
0.5
1
1.5
2
2.5
Time
Avera
ge G
rowth
(Log
Sca
le)
ε,l = -0.5; ε,h = 0.5
Initial Gini = 0.11Initial Gini = 0.73
Initial Gini = 0.11Initial Gini = 0.73
Initial Gini = 0.11Initial Gini = 0.73
Initial Gini = 0.11Initial Gini = 0.73

88 | P a g e
4.3.3 The Political Outcome versus Social Welfare Maximization In this section we compare the political economy α with the α that would result if its choice
was motivated by social welfare considerations. We define social welfare maximization in the
utilitarian sense, i.e. the value of α that maximizes the sum of the utilities of all agents in the
economy is the welfare maximizing outcome. The numerical results from this exercise are
reported in Figure 4.4. The solid line shows the winning α from the political economy, while the
broken lines shows the α that would result when choice was based on the maximum of the sum
of welfare of all agents.
It is interesting to note that policy choices differ between the political economy and the
welfare maximization case both in the early stages of the economy, and in the transition to the
steady state. At the early stages of development, the political process tends to produce a winning
α that is significantly below the one that maximizes social welfare. The explanation for this is
that at the early stages of the economy, most agents are poor and they prefer lump-sum transfer
payments. As redistribution occurs through each successive generation, the middle of the
distribution becomes thicker. This then explains why the winning α from the political economy
moves above the α that maximizes total welfare. However, because of the precautionary
behaviour of agents in the face of uncertainty as described earlier, there is a tendency for the
political economy α to keep fluctuating. Once all agents enter the financial system and their
wealth levels have stabilized, the winning α from the political process converges to that of the
welfare maximizing case. At this stage both α’s start decreasing monotonically and eventually
converge to zero.
Figure 4.4: Political process versus welfare maximization
0 10 20 30 40 50 60 70 80 90 1000
0.02
0.04
0.06
0.08
0.1
0.12
0.14
0.16
0.18
Time
Winn
ing α
Political processWelfare maximization
89 | P a g e
4. 3.3 Policy Choice: Political Outcome versus Social Welfare Maximization Thus far, an important revelation from the numerical experiments is that certain groups
block development-oriented policies especially at the early stages of the economy. This implies
that policies that maximize the overall welfare of the society may continue to face resistance.
The question that arises, then, is whether an economy that is run with the objectives of
maximizing overall welfare results in better growth and inequality outcomes compared to a
political economy.
This debate has indirect empirical relevance for some economies. An example that
commonly features in the comparative economics literature is that of China and India (see
Wong, 1989; Nin-Pratt et al., 2008; 2010), two economies that that are well known for the large
geographical size and large population, the majority of which has remained poor during most of
the twentieth century (Nin-Pratt et al., 2010). Since the late 1970s both countries embarked on
rapid reforms that included accelerated industrialisation, international trade reforms,
agricultural reforms, etc (Anderson, 2003). However, while China, a ‘command economy’
experienced a sevenfold increase in GDP and sustained growth in agricultural sector
productivity, India, an ‘open, participatory and multiparty democracy’ only experienced a
twofold increase in GDP and quite disappointing increases in agricultural sector productivity
(see Nin-Pratt et al., 2010). China has also outperformed India with reference to other
development indicators such as per capita GDP, life expectancy, child mortality, and human
capital development as measured by adult literacy and tertiary enrolment rates.34 Some of the
key explanations that have been suggested for the impressive performance of China over India
include the additional institutional reforms in China that resulted in migration of labour from
agriculture to other sectors of the economy (Hari, 2002).
An argument that has been made by some political analysts and academics, then, is that
given its ‘command economic system’, China might have managed to implement growth-
oriented policies relatively easily while India, a ‘multiparty democracy’ might have found it
difficult to implement growth-oriented reforms due to opposition from lobbies and interest
groups (see Huang, 2011). To some extent this argument has indirect support from the analysis
that follows. Specifically, we compare the outcomes of the political economy case with that
which would prevail if a social planner maximized the collective welfare of all agents in the
economy. While we do not claim that the latter case proxies a ‘command economy’ in the style of
34 The conclusion here is based on comparing the two nations using data from the World Bank (2012), World Development Indicators.

90 | P a g e
China, the analysis below does serve to highlight that the endogeneity of policies that is typical
in democracies may result in ‘sub-optimal’ outcomes.
Figure 4.5 compares the growth and inequality outcomes of a political economy to those of
an economy that is run on social welfare considerations. Panel (a) compares technology
adoption decisions, panel (b) compares the transitional dynamics of inequality, and panels (c)
and (d) compare the transitional behaviour of average growth, under the two policy choices. In
all the panels, the solid line represents the political economy outcomes and the broken line
represents the social welfare outcomes.
It is evident that the timing of technology adoption does not seem to differ much between
these two cases. However, the transitional behaviour of both growth and inequality differ.
Inequality tends to converge to the steady state quicker under the welfare-maximizing economy
than the political economy. Moreover, because the welfare-maximizing choices are more likely
to result in the pooling of the risks faced by individual agents, the convergence of inequality to
the steady state is much smoother, while under the political economy, the convergence is non-
monotonic. The same can be said with regards to the average growth rate. However, the
transitional fluctuations in the political economy are not significantly larger relative to the
welfare maximizing case. Furthermore, the two outcomes eventually converge once the
economy reaches its steady state.
Figure 4.5: Political Process versus Central Planner under endogenous entry cost
0 20 40 60 80 1000
200
400
600
Time
Num
ber o
f Age
nts
usin
g FI
0 20 40 60 80 1000
0.1
0.2
0.3
0.4
Time
Gin
i coe
ffici
ent
0 20 40 60 80 1000.5
1
1.5
2
2.5
3
3.5
Time
Ave
rage
gro
wth
0 20 40 60 80 1000
2
4
6
8
Time
Ave
rage
gro
wth
Political EconomyWelfare Maximization
Political EconomyWelfare Maximization
Political Economy: PoorPolitical Economy RichWelfare Maximization: PoorWelfare Maximization: Rich
Political Economy: AverageWelfare Maximization: Average
(d)(c)
(a) (b)
91 | P a g e
4.4 Concluding Remarks
This essay contributes to the growing body of literature that analyses the role of political
economy issues in the trade-off between growth and inequality. We develop an endogenous
growth model where agents vote on their preferred mode of redistributing wealth. In the model,
agents adopt a high-risk, high-return technology either directly or indirectly through the
financial system. Financial intermediaries are able to alleviate risk through risk pooling. On
average, agents who use the financial system earn higher returns. However, the use of the
financial system is subject to entry and periodic costs, with the former cost depending on the
proportion of government revenue spent on supervising and developing the financial system.
This proportion in turn depends on the preference of the agents in the economy who express
their preferences by voting between distributing government revenue through cost-reducing
financial development expenditure and lump sum transfers. The political outcome is mostly
based on the majority rule.
The analytical and numerical results show that agents at the bottom end and the top end of
the distribution form a majority that blocks expenditures towards cost-reducing financial
development during the early stages of the economy. This collusion emanates from the fact that
agents with different wealth levels face different trade-offs, and these trade-offs change in non-
monotonic ways as wealth increases. This then results in a situation where agents at both ends
of the distribution benefit more from a lump sum transfer than from cost-reducing financial
development expenditure. However, as redistribution continues through generations, the
middle of the distribution becomes successively thicker and the majority of the agents start
supporting policies aimed at cost-reducing financial development expenditure.
Our model shows a unique feature of political cycles. These cycles then cause ‘Kuznets’
curves patterns in transitional growth and inequality, resulting in a bidirectional and non-linear
relationship between these variables. Furthermore, these cycles delay the pace at which the
economy converges to its balanced growth path. These cycles partly emanate from the two-way
link between changes in inequality and the political preference for redistribution, but are
further exacerbated by the fact that the presence of shocks results in precautionary voting. The
political cycles, the resulting fluctuations in growth and inequality, and the delay in convergence
towards the steady state are more pronounced the lower the initial inequality. This highlights
the idea that when inequality is low, poor agents are few and thus there is little support for
redistribution through a lump-sum transfer payment.

92 | P a g e
Finally, the results show that the political outcomes do not coincide with the welfare
maximising outcomes during the early and the transitional stages of the economy. This is in line
with the idea that interest groups in the economy slow the pace of technological advancement
(see Krusell and Rios-Rull, 1996). However, once there are more agents are in the middle of the
distribution, the political process tends to produce outcomes that are supportive of
development, although this is subject to periodic reversals. The political economy outcomes
only converge to the welfare maximising outcomes once the economy has reached its steady
state path.

93 | P a g e
Appendix 4.1: Proof of Equation (19)
Agents invest in project B iff indirect utility of project B is greater that indirect utility of project A. This implies that agents invest in project B
),,,(),,,( ,1
,1
,1
,1
,1
,1
,1
,1
hXit
lXit
hXit
lXit
XhFit
lFit
hFit
lFit
F bbccUbbccUiff ++++++++ ≥
Substituting for the functional forms of the utility function we get,
)ln()1()ln()ln()1()ln()ln()1()ln()ln()1()ln( ,1
,1
,1
,1
,1
,1
,1
,1
hXit
lXit
hXit
lXit
hFit
lFit
hFit
lFit bpbpcpcpbpbpcpcp ++++++++ −++−+≥−++−+ θθθθ
Recognising that 11 ++ = itit cb θ , we can substitute for 1+itb and using the laws of logarithms and
then simplifying, we can obtain the following:
)ln()1()ln()ln()1()ln( ,1
,1
,1
,1
hXit
lXit
hBit
lBit cpcpcpcp ++++ −+≥−+
Since log is a monotonic transformation, it must be that:
[ ] [ ] [ ] [ ] )1()1(,1
,1
,1
,1
pppphX
itlX
ithF
itlF
it CCCC−−
++++ ⋅≥⋅
Which we can alternatively express as follows:
[ ][ ]
[ ][ ] )1(
)1(
,1
,1
,1
,1
p
p
p
p
hFit
hXit
lXit
lFit
C
C
C
C−
−
+
+
+
+ ≥
Now rewriting hXit
lXit
hFit
lFit cccc ,
1,1
,1
,1 ,,, ++++ in terms of their definitions in steady state equations (10),
(11), (14), (15) and given that there exist a level of endowment W* that equates the LHS to the
RHS, we can obtain equation (19).

94 | P a g e
Appendix 4.2: Comparative Statics Analysis
Assuming that W* exist, we can rewrite equation (19) in logarithmic form as follows:
LHS:
−+++−−
−−++−− ))1(()*)(()1(ln)())1(()*)(1()1(ln tWWwlptgttWWwp αεητψαλφτ
RHS:
−−+++−−−−
−+++−− )())1(()*))()(1()1(ln)1())1(()*))(()1(ln)1( tgttWWwhptWWwhp ψαεηλταεητ
Then taking the total derivative of W* with respect to α, simplifying and collecting like terms will yield the following will then yield the following for the LHS: 35
0,1
,1
,1))(1)(1(,
1))(1(,1
,1
,1))(1)(1)(1(,
1)1)(1(*>
++
++−−+++−−
++
++−−−++−−=
lXitChX
itC
lBitChphB
itClplF
itChFitC
lFitChphF
itCp
ddW εητεητεηλτφλτ
α
It is convenient to interpret the first fraction in the brackets as some weighted average
consumption for an agent i who seek financial intermediation and the second term as some
weighted average consumption for an agent i who do not seek financial intermediation after
multiplying the consumption under each state with the net return on investment under that
state. Since the model is such that the agents who use financial intermediaries are on average
better off than agents who do not use financial intermediaries, it is easy to see that the above
expression is greater than zero.
For the RHS we obtain the following:
0])1()[(')1()1(,1
,1
,1
,1
,1
,1
,1
,1
,1
,1
,1
,1 <
−++
−+−
−+
++
++
++
++
++
++lF
ithF
it
lFit
hFitt
lXit
hXit
lXitt
hXitt
lFit
hFit
lFitt
hFitt
CCCppCg
CCCWpCWp
CCCWpCWp ψττττ
Here we can interpret first fraction in the brackets as some weighted average consumption for
an agent i who seek financial intermediation and the second term as some weighted average
consumption for an agent i who do not seek financial intermediation each multiplied by
government revenue. Since, the first term is greater than the second term, the sign of the above
expression is inferred from the third term. Since 0)(' <tgψ , the third expression is less than
zero. Thus, 0*<
αddW
35 Notice that by using the steady state consumption functions in equations (10) to (19), it is possible to write each of the
terms in brackets in equation (14) and (15) as: sFitCsB
itC ,1)1(,,
1)1( ++++ θθ where superscript s = h, l.

95 | P a g e
Appendix 4.3: Changes in Indirect Utility Functions (IUF) with respect to α when λ is endogenous
All agents *WitW < will adopt Technology X. Thus their preferences are characterised by equation (2).
)ln()1()ln()ln()1()ln( ,
1,1
,1
,1
hXit
lXit
hXit
lXit bpbpcpcp ++++ −++−+ θθ
Recognising that 11 ++ = itit cb θ , we can substitute for 1+itb and using the laws of logarithms and then simplifying, we can obtain the following indirect utility function:
θθθθ ln)ln()1()1()ln()1( ,1
,1 ++−++ ++
hXit
lXit cpcp
Now we can substitute for lX
itc ,1+ and hX
itc ,1+ using their optimal consumptions equations (10) and
(11) to obtain the following:
[ ] [ ] θθαεητθαεητθα ln))1(()()()1(ln)1)(1())1(()()()1(ln)1()( +−+++−+−+−+++−+= tWitWwhptWitWwlpxIUF
Now differentiating with respect to α and simplifying we can get the FOC for IUFx
0,1
,1
),1)1(,
1()(<
+⋅+
+−++−=∂
∂lX
itChXitC
lXitCphX
itpCWxIUF τ
αα
All agents *WitW > will adopt Technology F. Thus their preferences are characterised by equation (3). By following the same steps as above, it is possible to derive the following FOC for IUFF with respect to α:
0,1
,1
),1)1(,
1(,1
,1
],1)()1(,
1)[(')()1()(>
+⋅+
+−++−
+⋅+
++−+++−−=
∂∂
lFitChF
itC
lFitCphF
itpCWlF
itChFitC
lFitChphF
itCptgitWwFIUF τεηφλτ
αα
where tWtg ατ= . Since λ is decreasing in α, it is easy to see that the first term positive. Thus,
0)(>
∂∂
ααFIUF
Therefore, if λ is endogenous and ψ is exogenous, the political economy is characterised by
agents *WitW < voting α = 0 and agents *WitW > voting α > 0.

96 | P a g e
CHAPTER 5:
GLOBALISATION AND EFFICIENT SECTORAL REALLOCATION OF CAPITAL: EVIDENCE FROM SOUTH AFRICA
5.1 Introduction
The role of reallocation of resources in enhancing productivity growth and long run
economic growth has been emphasized in various strands of literature. This literature stems
from an idea in the classical literature on economic growth and development that structural
change is intrinsic to the process of growth and development (Clark, 1940; Kuznets, 1966;
Chenery and Syrquin, 1975; Timmer, 1998). According to this idea, the take-off of nations from
underdevelopment to a balanced growth path is associated with a reallocation of resources from
non-productive to productive sectors of the economy. Typically, this take-off begins with
productivity increases in the agricultural sector, which is usually made possible by the adoption
of modern agricultural technologies. Sufficient increases in agricultural productivity then
facilitates the releasing of resources towards the manufacturing sector, after which the services
sector follows.
Maddison (1997) and Temple (2001) provide evidence that the majority of developed
nations in Europe and European Offshoots experienced inter-sectoral reallocation of labour in
the fashion prescribed in the classical development-economics literature, particularly in the
post-World War II period. Robinson (1971) provides empirical evidence suggesting that the
gains from reallocation of resources are much larger for nations at the early stages of
development than for developed nations. In support of this idea, Cortuk and Singh (2011) show
evidence that reallocation of labour was among the key drivers of growth in India for the period
1988 - 2007.
Nevertheless, because some nations do not necessarily follow the pattern of development
suggested in the classical development literature, it has been accepted that the growth-
enhancing reallocation of resources does not only result from the reallocation in the classical
pattern, but any form of reallocation that exploits productivity differences among

97 | P a g e
firms/sectors.36 In line with this idea, Feder (1986) uses Robinson’s (1971) model to provide
cross-sectional evidence suggesting that reallocation of resources from low productivity non-
export sectors to high productivity export sectors results in large gains in growth.
Other studies attempt to quantify the contribution of allocation of resources to economic
growth. One such study is Fan et al. (2003), which develops a model and uses it to show that
approximately 17% of China’s growth between 1978 and 1995 was attributed to reallocation of
resources from low-productivity to high-productivity sectors of the economy. In similar spirit,
Pagés (2010) shows that approximately half of the 4% productivity growth in Latin America
between the period 1950 – 1975 was attributed to the reallocation of resources from non-
productive to productive sectors.
Given the role that the reallocation of resources plays in enhancing productivity and
economic growth, understanding the factors that drive efficient reallocation of resources
becomes of relevance to policy. In the economic development literature, this reallocation of
resources is initiated by productivity increases in the primary sector, which then pushes labour
from the primary sector towards other sectors. Formal models supportive of this idea include
Matsuyama (1992), Laitner (2000), Caselli and Coleman (2001), and Gollin et al. (2002). An
alternative explanation is offered in models such as Lewis (2008) and Hansen and Prescott
(2002). In these models, structural transformation is set in motion by an increase in
productivity in the modern sectors, which then pulls resources away from the primary sectors
of the economy.
However, implicit in the aforementioned resource reallocation is the availability of
appropriate signals which guide resources towards the sectors where resources are valued the
most. Ensuring the availability of appropriate signals is important because the misallocation of
resources, in the form of either output or welfare losses, is costly. For instance, Swiecki (2012)
provides quantitative model-based evidence suggesting that domestic inter-sectoral
misallocation of resources can result in approximately 6.6 percentage points loss in the welfare
gains from trade. Furthermore, because reallocation of resources is subject to an adjustment
36 See, for instance Lahiri and Ratnasiri (2013) the case of India, where productivity gains in agriculture due to 1960s and 70s green revolution was followed by a services-sector led ‘revolution’, before the and not the manufacturing sector, as prescribed by the classical literature.
98 | P a g e
cost, misallocation would double this adjustment cost as these resources would need to be
reallocated.37
The aforementioned signals for resource allocation often emanate from the availability of
well integrated factor, product and financial markets. Consequently, reforms aimed at
improving the functioning of these markets could improve the allocation of resources. To that
end, a strand of literature has analysed the impact of a broad range of economic, institutional,
and policy reforms. For instance, Brown and Earle (2008) document evidence that the post-
reform contribution of resource reallocation to productivity growth in six former socialist
nations exceeded that of market economies.
The reforms that we are particularly concerned with in the current essay are those aimed
at the financial sector because these were the main reforms in South Africa, and they were
preceded by very restrictive financial policies.38 We collectively term these reforms ‘financial
globalisation’.39 Typically, these reforms improve the functioning of the financial system,
thereby enhancing efficient allocation of capital through various channels. These channels
include minimising asymmetric information, facilitating better choice of investment projects,
enhancing the insurance and diversification of risk thereby encouraging agents to invest in high-
risk, high-return projects (Obstfeld, 1994), and reducing the adjustment cost associated with the
reallocation of resources. There is evidence suggesting that a well-functioning financial system
enhances two key drivers of long term growth, innovation and technological progress (see Ang
and Madsen, 2012).
There is also consensus that reforms result in increased inflow of Foreign Direct
Investment (FDI) (see Kose et al., 2006 and references therein). FDI then improves the
allocation of capital through two main channels. Firstly, it brings with it managerial and
technological expertise, investment in research and development, education and on-the-job
training, all of which will potentially result in efficiency, productivity and other external
spillovers to the whole economy (Bailliu, 2000, Agénor, 2003, Kose et al., 2006). Secondly, FDI
often involves setting up operations in emerging and developing countries, which help foster
37 The adjustment cost associated with the reallocation of labour is emphasized in the dynamic models of Steger (2003), Mussa (1978), and Kemp and Wan (1974), while the adjustment cost associated with the reallocation of capital is emphasized in dynamic models of Hayashi (1982), and Abel and Blanchard (1983). 38 Although the financial reforms are the main focus, our empirical analysis also accounts for other reforms such as trade reforms, political reforms, and other macroeconomic reforms. 39 In this study, the terms financial globalisation, financial liberalisation and financial reforms are interchangeably used to refer to liberal financial reforms.
99 | P a g e
competition among domestic firms forcing them to develop new and efficient methods of
production, and to train their employees to stay in touch with new technologies (Agénor, 2003).
A number of empirical studies are of relevance to the current essay. For instance, Cho
(1980) provides evidence that allocation efficiency, as measured by the variability of borrowing
costs across sectors, improves after liberalisation. However, this measure is unreliable if capital
allocation does not solely depend on economic factors (see Abiad et al., 2008). Studies by
Harrison et al. (2004) and Forbes (2007) use a measure as of efficient allocation of capital based
on the sensitivity of investment to cash flows. They find evidence that capital account
restrictions and/or taxes on capital flows are associated with the worsening of the allocation of
capital. Using the same measure, Forbes (2007) and Leaven (2003) provide evidence that the
efficiency-allocation benefits of financial reforms are stronger for small firms than for big firms.
Nevertheless, this measure is problematic when the sensitivity of investment to cash flows
changes non-monotonically with financial frictions, which is often the case (see Kaplan and
Zingales, 1997, 2000; Stein, 2003).
Studies such as Wurgler (2000) and Almeida and Wolfenzon (2004) use a measure of
efficiency that is based on assessing whether new investment flows from sectors with low
changes in value added to sectors with high changes in value added. Wurgler (2000) provides
evidence that this measure is positively associated with financial deepening. Similarly, Almeida
and Wolfenzon (2004) document evidence that this measure is negatively associated with state
ownership, but positively associated with a developed and well-functioning stock market, and
minority investor protection. Galindo et al. (2007) use two measures of efficiency based on
comparing firms’ marginal products of capital to a benchmark that would result if capital were
allocated according to firm size, to show that financial globalisation is associated with
improvements in the reallocation of capital across firms in 12 developing countries. Similarly,
Abiad et al. (2008) provide cross-country panel evidence that financial globalisation has
efficiency-reallocation effects, using a measure based on the dispersion of firms’ Tobin’s Q’s
from their optimal level.
As evident, the majority of the studies on the reallocation effects of reforms have not
explicitly explored inter-sector reallocation, but rather focussed on economy wide firm-level
reallocation. Consequently, it is difficult to interpret these studies in the context of the resource
reallocation narrative that is implied in the classical development-economics literature.

100 | P a g e
Furthermore, majority of these studies focus on cross-country panel evidence. A potential issue
with such analysis is that reforms are often endogenous, in the sense that they originate from
the preferences of different stakeholders (e.g. consumers, firms, government, etc), which in turn
depend on country-specific factors. Moreover, the nature of the reaction of different
stakeholders and the mechanisms through which such reactions are expressed are key elements
that determine the effects of these reforms on the allocation of capital. Because these issues
differ across nations, cross-country analysis may distort country specific issues.
To this end, the current essay contributes to the growing literature on the reallocation
effects of financial reforms by focussing on the intra-sector and inter-sector reallocation of
capital.40 We use a measure of efficiency based on the dispersion of marginal returns to capital.
We specifically examine the case of an emerging economy, viz. South Africa, which has not
received similar empirical attention. The choice of South Africa is motivated by the fact that it is
an emerging economy which has experienced a series of rapid financial, legal, policy and
institutional reforms since the early 1990s. The fact that these reforms were preceded by very
restrictive financial policies during the pre-1994 political democratisation makes South Africa
an interesting case study.41
South Africa is also an interesting case for two other reasons. Firstly, it is the largest
economy on the African continent as measured by Gross Domestic Product (GDP). Secondly, its
financial system is, by far the largest on the African continent. More specifically, South Africa’s
four banks are ranked the top 4 largest in Africa by both total assets and capital (see Bankers
Almanac, 2012) and its stock market is also by far the largest stock market in Africa as
measured by market capitalisation and market turnover. South Africa is the only country from
the Sub-Saharan countries with data that is adequate enough to allows us to perform a
meaningful analysis. Furthermore, there is preliminary graphical, descriptive and prima facie
evidence from South Africa that suggests that the pre-1990s financial restriction and the post-
40 The term intra-sector reallocation relates to reallocation within a specific sector. We consider four sectors which include: primary, manufacturing, wholesale and retail trade, services. Further elaboration on the type of firms that each sector is composed of is provided in Section 5.3.3. Inter-sector reallocation relates to reallocation between firms in any two sectors, for example, reallocation between primary and manufacturing, between primary and retail and wholesale, between primary and services. Based on this, there are 6 combinations that form inter-sector. 41 In Appendix 5.3, we provide a summary of the financial policies (restrictions and reforms) from the late 1960s to 2007. This summary is based on sources as the South African Reserve Bank (SARB), the Johannesburg Securities Exchange (JSE), South African National Treasury, and other authors such as Farrell and Todani (2006), Casteleign (2001), Loots (2002) and Stals (1997), etc.

101 | P a g e
1990s financial reforms might have affected the sectoral/industrial allocation of resources.42
We provide this preliminary evidence in the next Section 5.2.
Our focus on intra-sector and inter-sector aspects of efficient reallocation of capital yields
dividends in the form of some striking differences and additional findings relative to previous
studies. Firstly, our intra-sector coefficients are smaller than the inter-sector coefficients, which
in turn are smaller than the economy-wide firm level coefficients of Abiad et al. (2008). The
implication of this finding is that factors that promote market concentration and barriers to
entry or exit from a sector may limit the resource reallocation benefits of financial globalisation.
Thus, any forms of natural, geographical, or institutionalised monopolies, and/or any other
forms of collusions that distort the free flow of resources across sectors should be dismantled.
Secondly, there is evidence to suggest that the impact of financial globalisation on efficient
reallocation of capital is marginally stronger among firms within the modern sectors of the
economy (services and manufacturing) than in the primary sector. The results for the inter-
sector reallocation show that reallocation from the primary sector to the other sectors of the
economy is subject to inefficiency, raising concerns regarding whether SA might have failed to
satisfy some of the pre-conditions for takeoff as suggested in the development economics
literature. Firstly, SA might have failed to properly channel the early productivity gains from the
primary sector towards the development of other sectors of the economy due to inappropriate
policies. Secondly, SA might have failed to achieve the structural transformation that is
considered necessary for economic development – namely maintaining the productivity of the
primary sector at sufficiently higher levels and progressively integrating the sector into the
macro-economy ensure that resources continue to move towards the modern sectors of the
economy. In Section 5.2, we provide preliminary evidence suggesting that South Africa failed to
maintain productivity in the primary sector high enough to ensure that resources keep flowing
towards other sectors of the economy.
Thirdly, the inclusion of institutional quality, in the form of controlling of corruption,
ensuring political stability, rule of law, voice and accountability, regulatory quality, and
government effectiveness as control variables adds an interesting dimension to the existing
42 Because most of the reforms took place after the 1994 political democratisation of South Africa, we use 1994 as the cut off year. Thus the context in which the terms pre-reform and post-reform are used is with reference to the period before and after 1994 respectively.

102 | P a g e
literature on the reallocative effects of financial globalisation.43 The results suggest that the
benefits of financial globalisation seem to diminish once institutional quality is controlled for.
Moreover, there is no evidence to suggest that financial globalisation enhances institutional
quality as some authors have argued (e.g. Kose et al., 2006). This implies that for a country to
sufficiently reap the benefits of financial globalisation, commitment to institutional quality
should precede financial reforms. Finally, there is also evidence to suggest that reallocation
benefits of financial globalisation may also manifest indirectly through augmentation of the
domestic financial institutions.
The remainder of the essay is organised as follows. In Section 5.2, we present some
preliminary evidence suggesting that the aforementioned reforms might have improved
reallocation of capital in South Africa. In Section 5.3, we outline the theoretical basis for our
empirics. In Section 5.4, we outline the empirical methodology and data. In Section 5.5, we
present and discuss our empirical findings. Section 5.6 concludes the paper.
5.2 Background and Preliminary Analysis
This section presents some preliminary evidence that is consistent with reallocation of
capital in South Africa. We analyse data on value added, productivity growth, and Gross Fixed
Capital Formation (GFCF). The data was sourced from the South African Reserve Bank (SARB)
and the United Nations General Industrial Statistical panel (INDSTAT-3) Databases.
Figure 5.1 presents the percentage changes in GFCF for the mining, agriculture,
manufacturing, wholesale and retail trade, and transport and communication sectors of the SA
economy.44 The plot shows that growth in GFCF was very volatile for the pre-reform period, but
became quite stable in the post-reform period. We believe that volatility in growth of GFCF from
period to period implies agents may have overinvested/underinvested in a sector in a certain
period. When they realise this, they then move capital from overinvested to under invested
sectors in the next period. In order to make these decisions, investors need properly functioning
market signals. In instances where market signals are not working properly, investors may
potentially move more/less capital than necessary between underinvested and overinvested
43 La Porta et al. (1997, 1998) postulate that good legal systems which enforce private property rights, support private contractual arrangements, and protect the legal right of investors, enhance investment. Galindo et al. (2007) attempt to test this hypothesis, but due to data constraints they resort to comparing the countries that use English Common Law against those that do not. However, they found that the countries with an English Common Law background have better investor protection than those with other forms of law. 44 Note that we only analyse the sectors for which data is available.
103 | P a g e
sectors resulting in high changes in GFCF. Consequently the reduction of volatility in growth of
GFCF might be reflective of the fact that market signals started working better and quicker in
the post-reform than the pre-reform period. It is also evident that the growth in GFCF for the
primary sector (mining and agriculture sectors) is below that of other sectors in the post-reform
period.
In Figure 5.2 we plot the percentage growth in value added for the period 1961 – 2009 for
the primary, secondary and tertiary sectors. Very little distinguishes the growth in value added
to the growth in GFCF. Firstly, the growth in value added for the primary sector seems to
dominate those of the secondary and the tertiary sectors for the pre-reform period, but the
opposite happens for the post-reform period. The sudden decrease in growth in value added of
the primary sector in the early 1990s might have been due to the abandonment of directed
credit and other financial subsidies that the primary sector was getting during the pre-reform
period. This might have then resulted in the exodus of resource from the primary sector to the
other sectors of the economy. Secondly, the growth in value added especially for the primary
sector seems to be less volatile in the post-reform period. We believe that the same explanation
as suggested earlier for the reduction in volatility of the growth of GFCF is also applicable here.
Figure 5.3 and 5.4 plots growth in labour productivity in the non-agricultural and
agricultural sectors respectively.45 As evident from Figure 5.3 and 5.4, growth in labour
productivity was much higher in the agricultural than the non-agricultural sectors between
1970 and 1990. Of interest is the sharp increase in productivity in the former sector for the
period 1965-1990 followed by the sharp decline in 1990-1994. This sharp decline and the
subsequent low growth in agricultural productivity in the post 1990 period raises a question
about the role played by preferential credit treatment and subsidies that this sector received in
the pre-reform period. Furthermore, the subsequent and sustained increase in the productivity
of non-agricultural sectors suggests that the earlier (1965-1990) increase in agricultural
productivity might have prompted the release of resources from the latter sector to the former
sectors.
It is also interesting that agricultural productivity recovered after 1994 when full-fledged
reforms started. Since then productivity in both sectors of the economy has remained positive,
albeit higher for the non-agricultural sectors. However caution should be taken in inferring 45 Due to data constraint,s Figure 1d is directly adopted from a study by Ramaila et al. (2011, p. 7) published by the South African Department of Agriculture (SADA).

104 | P a g e
efficiency in the allocation of capital from the post-reform growth in labour productivity.
Theoretically, improvements in labour productivity may result from better combinations of
labour and capital used in the production function.
Next we attempt to examine whether the changes in value added are contemporaneously
related to the changes in GFCF. To this end we use a measure of capital allocation efficiency
suggested by Wugler (2000). The measure (hereafter referred as EFF) is based on dividing the
percentage change in value added by the percentage change in GFCF.46 The summary
descriptive statistics (mean and standard deviation) based on this measure are presented in
Table 5.1. We first present the statistics for the overall period and then statistics for the two
sub-periods (i.e. pre-reform and post-reform). The statistics for the overall period show that this
measure is on average positive for all the sectors except for the mining sector. Generally, the
average EFF is highest in the tertiary sectors of the economy (i.e. wholesale & retail trade and
transport & communication sectors). The standard deviations of the measure for the tertiary
sector are lower than those of the other sectors. Generally these results show that changes in
value added are positively associated with changes in GFCF, which suggests efficient allocation
of capital. Comparing the pre-reform and post-reform statistics, it is evident that EFF increased
in all the sectors for the post-reform period, except for the mining sector. Furthermore, the
variability of returns for the tertiary and the secondly sectors decreased in the post-reform
period suggesting an improvement in efficiency.
Next, we attempt to link the changes in EFF to changes in bank credit to the private sector
as percentage of GDP (an indirect proxy of the financial reforms) by analysing the correlation
between the two for the pre-reform period, post-reform period and the entire period. The
correlation coefficients are reported in Table 5.2. The results show a mixed picture. For the
entire 1963 – 2009 period, the correlation between EFF and a proxy of financial reforms for the
primary sector is negative, while it is positive for the other sectors. When the period is divided
between pre-reform and post-reform, the results change. For the pre-reform period, the
correlation is negative for all the sectors, except for the manufacturing sector. For the post-
reform period, correlation is positive for all sectors except for the mining and agricultural
sectors. However, the correlation coefficients for all sectors suggest an improvement in
allocation of capital in the post-reform period.
46More specifically, the formula is as follows: )1ln(/)1ln( −−−−= tItItVtVEFF , where Vt and Vt-1 represent current period and previous period value added and It and It-1 represent period and previous GFCF, respectively.
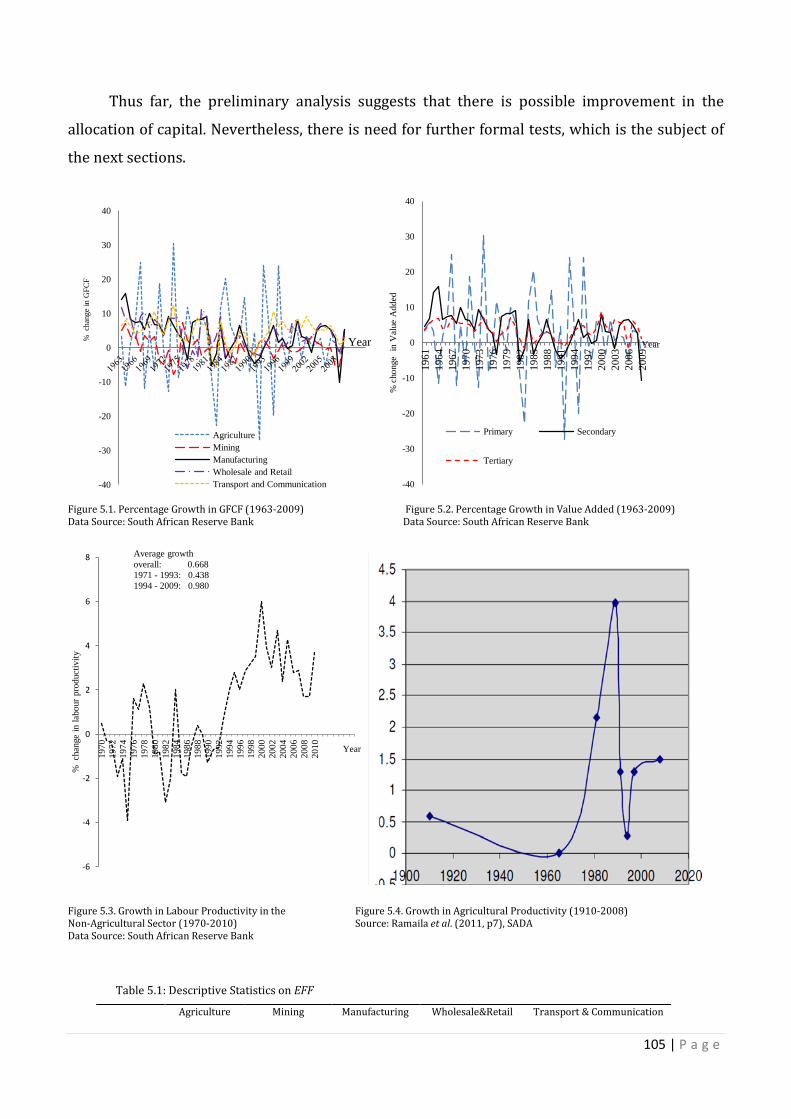
105 | P a g e
Thus far, the preliminary analysis suggests that there is possible improvement in the
allocation of capital. Nevertheless, there is need for further formal tests, which is the subject of
the next sections.
Figure 5.1. Percentage Growth in GFCF (1963-2009) Figure 5.2. Percentage Growth in Value Added (1963-2009) Data Source: South African Reserve Bank Data Source: South African Reserve Bank
Figure 5.3. Growth in Labour Productivity in the Figure 5.4. Growth in Agricultural Productivity (1910-2008) Non-Agricultural Sector (1970-2010) Source: Ramaila et al. (2011, p7), SADA Data Source: South African Reserve Bank
Table 5.1: Descriptive Statistics on EFF
Agriculture Mining Manufacturing Wholesale&Retail Transport & Communication
-40
-30
-20
-10
0
10
20
30
40
% c
hang
e in
GFC
F
Year
Agriculture Mining Manufacturing Wholesale and Retail Transport and Communication -40
-30
-20
-10
0
10
20
30
40
1961
19
64
1967
19
70
1973
19
76
1979
19
82
1985
19
88
1991
19
94
1997
20
00
2003
20
06
2009
% c
hong
e in
Val
ue A
dded
Year
Primary Secondary
Tertiary
-6
-4
-2
0
2
4
6
8
1970
19
72
1974
19
76
1978
19
80
1982
19
84
1986
19
88
1990
19
92
1994
19
96
1998
20
00
2002
20
04
2006
20
08
2010
% c
hang
e in
labo
ur p
rodu
ctiv
ity
Year
Average growth overall: 0.668 1971 - 1993: 0.438 1994 - 2009: 0.980
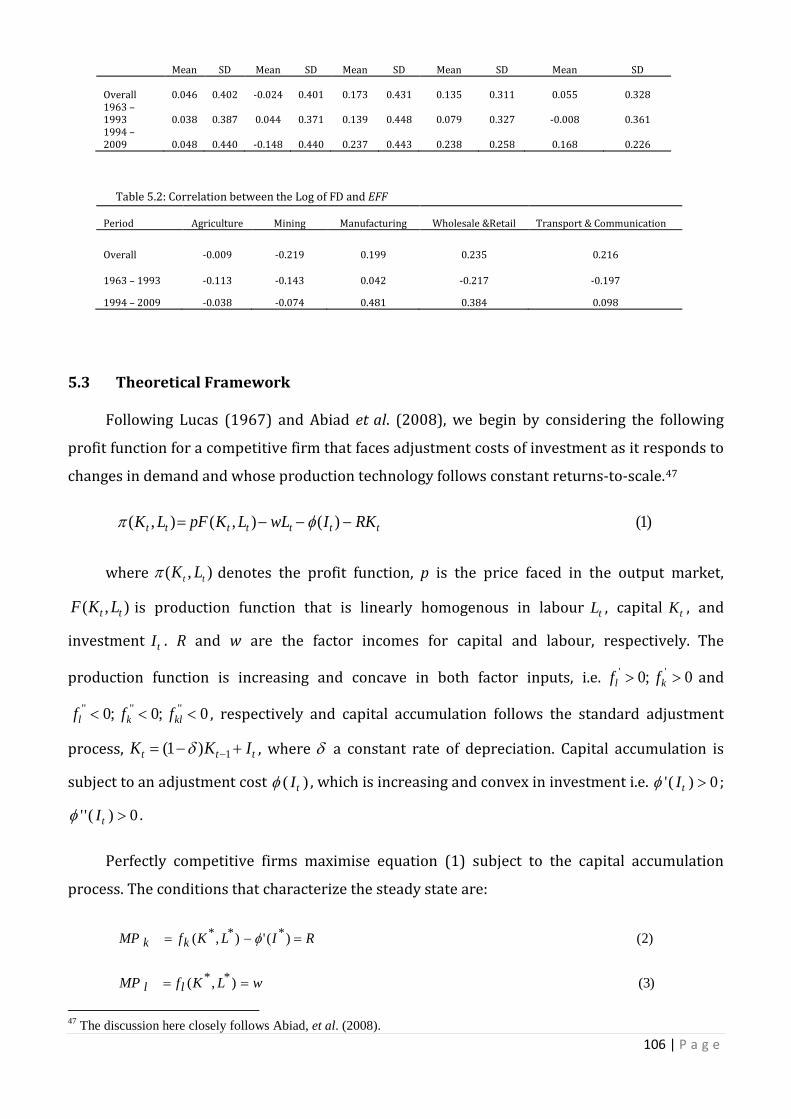
106 | P a g e
Mean SD Mean SD Mean SD Mean SD Mean SD
Overall 0.046 0.402 -0.024 0.401 0.173 0.431 0.135 0.311 0.055 0.328 1963 – 1993 0.038 0.387 0.044 0.371 0.139 0.448 0.079 0.327 -0.008 0.361 1994 – 2009 0.048 0.440 -0.148 0.440 0.237 0.443 0.238 0.258 0.168 0.226
Table 5.2: Correlation between the Log of FD and EFF
Period Agriculture Mining Manufacturing Wholesale &Retail Transport & Communication
Overall -0.009 -0.219 0.199 0.235 0.216
1963 – 1993 -0.113 -0.143 0.042 -0.217 -0.197
1994 – 2009 -0.038 -0.074 0.481 0.384 0.098
5.3 Theoretical Framework
Following Lucas (1967) and Abiad et al. (2008), we begin by considering the following
profit function for a competitive firm that faces adjustment costs of investment as it responds to
changes in demand and whose production technology follows constant returns-to-scale.47
)1()(),(),( ttttttt RKIwLLKpFLK −−−= φπ
where ),( tt LKπ denotes the profit function, p is the price faced in the output market,
),( tt LKF is production function that is linearly homogenous in labour tL , capital tK , and
investment tI . R and w are the factor incomes for capital and labour, respectively. The
production function is increasing and concave in both factor inputs, i.e. 0;0 '' >> kl ff and
0;0;0 '''''' <<< klkl fff , respectively and capital accumulation follows the standard adjustment
process, ttt IKK +−= −1)1( δ , where δ a constant rate of depreciation. Capital accumulation is
subject to an adjustment cost )( tIφ , which is increasing and convex in investment i.e. 0)(' >tIφ ;
0)('' >tIφ .
Perfectly competitive firms maximise equation (1) subject to the capital accumulation
process. The conditions that characterize the steady state are:
)2()('),( *** RILKfMP kk =−= φ
)3(),( ** wLKfMP ll == 47 The discussion here closely follows Abiad, et al. (2008).
107 | P a g e
)4(** IK =δ
The investment decisions of firms are uniquely characterised by the above steady state
conditions. Particular emphasis in the current study is on how R determines the allocation of
capital. Assuming that )(' *Iφ ’s were equal across firms, then all firms’ investment decisions
would be closely tied to the rental rate of capital R, which under competitive conditions, is equal
across all firms.48 However, if the government intervenes in the financial sector, for instance by
controlling credit allocation, interest rates or restrictions/taxes on of foreign capital, distortions
are likely to arise.49 Firms are then likely to face different levels of R depending on how each is
affected by these interventions and how financially connected they are. Firms that benefit from
these interventions or that are financially connected face Rlow < R while firms that are
disadvantaged will face Rhigh > R. This result in misallocation of capital as firms facing Rlow will
overinvest and get low kMP while firms facing Rhigh will under-invest and get a high kMP .
The extent of the misallocation caused by these government interventions are reflected by
the variability of individuals firms’ sMP k ' around the optimal kMP . 50 The higher the
variability the worse are these distortions. A reduction in this variability would signal an
improvement in allocation of capital. Thus, the current study aims to examine whether financial
globalisation is associated with an improvement in allocation of capital as shown by a reduction
in variability of individual firms’ kMP after controlling for other determinants of this
variability.
5.4 Empirical Methodology
5.3.1 Measuring Efficient Allocation of Capital
Building on the theoretical framework discussed above, we seek to capture the idea of
reallocation of capital as the variation of the marginal returns to capital across firms within a
particular sector. An appropriate way of empirically capturing this is by examining the
dispersion of the ex-ante expected marginal returns to capital. A commonly used measure of the
expected returns to capital the Tobin’s Q (hereafter refer as Q) and it is computed as follows: 48 We assume that there are no financial frictions. 49 A large body of literature has shown that financial liberalisation reduces these distortions (see McKinnon, 1973; Shaw, 1973; Gertler and Rose, 1994; Obstfeld, 1994; Phelan, 1995). 50 Note that variability may also emanate from productivity shocks and other factors. As shall be seen later, the other factors that may influence variability in returns are controlled for in the empirical exercise.
108 | P a g e
)5(Capital theofCost t Replacemen
Capital sFirm' of ueMarket val' =QsTobin
The market value of the firm’s capital comprises of the market value of its equity (stock
market capitalisation) and the market value of its debt securities. The replacement cost of
capital is given by the sum of the value of all its tangible and intangible assets. Assuming that
there are no measurement errors and that markets are functioning perfectly, the equilibrium
value of the Q should be unity and any short term deviation are quickly arbitraged away by rent-
seeking investors or mergers (Jovanovic and Rousseau, 2002).
Q may vary from unity due to such issues as measurement errors, financial constraints,
and market imperfections (Blanchard et al., 1993). Moreover, due data constraints, the marginal
Q can only be indirectly approximated using the average Q.51 Because not all variations of the Q
are attributed to variations in the marginal returns across firms, it is essential to control for
excess variation. Following Abiad et al. (2008), these adjustments are made through the
estimating the following regression:
)6(1
,
2
321 i
K
kkik
i
i
i
ii
si eIndustry
AL
ALAgeq +⋅+
⋅+⋅+⋅= ∑
=
ϕααα
where siq is the logarithm of the average Q for firm i=1...I, in sector s, Agei is the difference
between the current year and the year of establishment of firm i, Li/Ai and (Li/Ai)2 denote the
value and the squared value of the liabilities-to-asset ratio for firm i, a proxy for debt-overhang,
to accommodate for the possibility that the probability of default non-linearly increases with
debt-asset ratio (Abiad et al., 2008). Industryi,k is a binary variable that takes the value 1 if firm i
belongs to industry k and 0 otherwise, ei is the component of qi that is not explained age, debt
overhang, and industry.
The adjusted Q of each firm i in sector s, ∧siq is then computed as follows:
)7(1
1)( ieI
iiq
Iiesiqmeans
iq +
∑=
=+=∧
The measure of efficiency is now based on the dispersion of the adjusted Q across firms.
We use measures of dispersion based on the Gini coefficient, the mean logarithm of deviations,
51 There are many adjustment which we did in line with Abiad et al. (2008) e.g. adjustment for depreciation of assets, for cumulative inflation, etc. Also see Blanchard et al. (1993); Chari and Henry (2004b) for other adjustments.
109 | P a g e
Theil index, and the coefficient of variation. A decrease in the dispersion of the adjusted Q across
firms entails the worsening of efficiency in reallocation of capital, vice versa.
5.3.2 Measuring Financial Globalisation
Measuring financial globalisation appropriately is important as some views in the
literature allege that differences in results on the growth-enhancing effects of financial
globalisation can be partly traced to differences in its measurement (see Prasad et al., 2004;
Kose et al., 2006; Henry, 2007). The convention in most studies is to either use measures based
on whether the pre-requisites for financial globalisation are met (de jure measures) or measures
based on whether the outcomes of financial globalisation are evident in the financial system (de
facto measures).52 However, because financial globalisation is a gradual process that involves
both de jure and de facto elements, there is an increasing consensus among researchers that an
appropriate measure of financial globalisation should capture both the de jure and the de facto
elements, and the gradual process that financial globalisation manifests. For this reason, and
following a trend in recent literature (see Demetriades and Luintel, 2001; Laeven, 2003, and Ang
and McKibbin, 2007), we construct a measure that takes into account the interaction between
the de jure and de facto elements and also the gradual process in which SA’s financial system has
been integrated into the world.
We track financial restrictions/reforms in the SA financial system and financial markets
since 1969. These restrictions/reforms are with regards to interest rates (INT), entry into the
banking sector (EBB), prudential regulation of banks (PDR), credit controls (CC), the stock
market (SM), and controls on foreign exchange and capital (FEC).We then allocate values from 0
(representing extreme restriction) to 1 (representing no restriction and full institutional
reforms). Intermediate values of 0.33 and 0.50 and 0.66 are allocated to years depending on the
extent of restrictions/reform and whether the removal of restrictions was completed with
institutional improvements. For instance, in 1986 credit controls were partly removed, but
because the majority of the SA population was financially excluded, we allocate a value of 0.33.
Similarly, foreign capital inflows and exchange rate controls were loosened in 1983, but because
SA was under international sanctions, we allocate a value of 0.5. We then use the Principal
52 Readers who require a detailed understanding of the different measures of FG and their strength and weaknesses are referred to studies such as Chinn and Ito (2008), Kose et al. (2006), Montiel and Reinhart (1999).
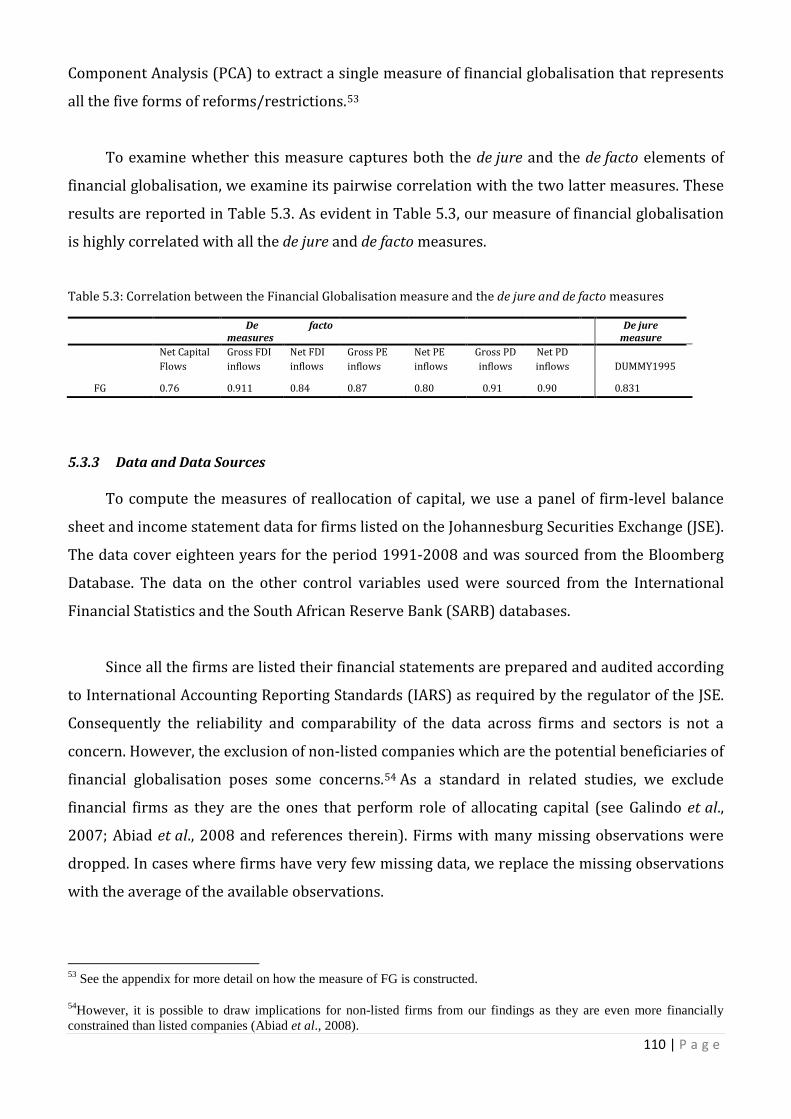
110 | P a g e
Component Analysis (PCA) to extract a single measure of financial globalisation that represents
all the five forms of reforms/restrictions.53
To examine whether this measure captures both the de jure and the de facto elements of
financial globalisation, we examine its pairwise correlation with the two latter measures. These
results are reported in Table 5.3. As evident in Table 5.3, our measure of financial globalisation
is highly correlated with all the de jure and de facto measures.
Table 5.3: Correlation between the Financial Globalisation measure and the de jure and de facto measures
De facto measures
De jure measure
Net Capital Flows
Gross FDI inflows
Net FDI inflows
Gross PE inflows
Net PE inflows
Gross PD inflows
Net PD inflows
DUMMY1995
FG 0.76 0.911 0.84 0.87 0.80 0.91 0.90
0.831
5.3.3 Data and Data Sources
To compute the measures of reallocation of capital, we use a panel of firm-level balance
sheet and income statement data for firms listed on the Johannesburg Securities Exchange (JSE).
The data cover eighteen years for the period 1991-2008 and was sourced from the Bloomberg
Database. The data on the other control variables used were sourced from the International
Financial Statistics and the South African Reserve Bank (SARB) databases.
Since all the firms are listed their financial statements are prepared and audited according
to International Accounting Reporting Standards (IARS) as required by the regulator of the JSE.
Consequently the reliability and comparability of the data across firms and sectors is not a
concern. However, the exclusion of non-listed companies which are the potential beneficiaries of
financial globalisation poses some concerns.54 As a standard in related studies, we exclude
financial firms as they are the ones that perform role of allocating capital (see Galindo et al.,
2007; Abiad et al., 2008 and references therein). Firms with many missing observations were
dropped. In cases where firms have very few missing data, we replace the missing observations
with the average of the available observations.
53 See the appendix for more detail on how the measure of FG is constructed. 54However, it is possible to draw implications for non-listed firms from our findings as they are even more financially constrained than listed companies (Abiad et al., 2008).

111 | P a g e
After making these adjustments, the remaining data is as follows; primary (mining) sector:
20 firms, manufacturing sector: 20 firms, retail and wholesale trade sector: 20 firms, services
sector: 26 firms. The composition of the four sectors is as follows: The primary sector comprises
firms in the agricultural and mining sector. The manufacturing sector includes all firms in this
sector. As seen the services sector was divided into two, retail and wholesale trade sector and
‘other services’ sector. The retail and wholesale trade sector includes firms in engaged in
merchandising, warehousing and distribution. The services sector then includes any other
remaining firms in the services sector such as IT, communication, hospitality, etc. Although the
main motivation of breaking the services sector into two was to balance the number of firms in
each of the four sectors above, the wholesale and retail sector is usually a standalone,
particularly for stock market listing purposes. Of course the IT and mining are also usually
standalones, but attempt to consider them as such was constrained by data challenges.
5.4 Empirical Results
5.4.1 Descriptive Evidence
To lay a foundation for formal econometric analysis, we analyse the descriptive properties
of the measures of reallocation of capital before and after the financial reforms of 1995 as well
as their association with the measure of financial globalisation both for the intra-sector and
inter-sector level.55 Figure 5.5 reports the mean of each of the four measures of dispersion for
periods 1991-1994 and 1995-2008 and 1991-1999 and 2000-2008. Dispersion of Q as shown by
all the four measures has decreased in the post-reform period for all the sectors except for the
mining (primary) sector where all the measures show an increase. The decrease in dispersion of
the Q is more pronounced in the wholesale & retail sector, followed by the services sector. This
suggests that the allocation of capital has improved in these sectors more than in other sectors
while it has worsened in the mining (primary) sector. Comparing the relative changes in the
four measures, it is evident that the Gini coefficient, which is more sensitive to changes around
the centre of the distribution (Abiad et al., 2008) seems to show lower decrease than the three
generalised entropy-based measures of dispersion. This suggests that the firms that were worst
disadvantaged by and those that most benefited from financial repression were the ones most
affected by the financial reforms.
55 For succinctness we do not report the descriptive statistics for the Q dispersion measures of the inter-sector. However, the measures were lower and showed larger decreases in the post-reform period than the intra-sector measures.

112 | P a g e
To examine whether these changes in allocation of capital are linked to the financial
reforms in SA, we plot the trends in the four measures and the measure of financial globalisation
in Figure 5.6 in the appendix.56 It is evident that there is a negative association between the
movements of the measure of financial globalisation and the Q-dispersions especially for the
wholesale & retail sector and the services sectors. The negative association between the Q-
dispersion and financial globalisation is not as clear cut for the mining and the manufacturing
sectors although there are some points where a decrease/increase in financial globalisation was
followed by an increase/decrease in at least one of the measures of the Q-dispersion. Generally,
Figures 4.5 and 4.6 reveal that there is a possible association between the post-1994 reforms in
SA and reallocation of capital that is worth pursuing. In what follows, we thus formally test
whether these financial reforms had any effects on reallocation of capital in SA. We begin by
analysing intra-sector reallocation and then inter-sector reallocation.
5.4.2 Intra-Sector and Inter-sector Econometric Evidence
To analyse the intra-sector reallocative effects of financial globalisation, we estimate the
following panel regression:
)8(,,,, tititiiti XFGD εγβα +++=
where subscripts i and t denote sector and time, Di,t denotes the measure of Q-dispersion, FGi,t is
a contemporaneous measure of financial globalisation, Xi,t is a vector of control variables and εi,t
is an error term. The null hypothesis being tested is that β = 0. The control variables used
include four measures of financial deepening , which are the ratio of banks’ lending to the
private sector to GDP, the ratio stock market capitalisation to GDP, the ratio of stock market
turnover to GDP and the ratio of stock market turnover to stock market capitalisation. The ratio
of government expenditure on tertiary education to GDP is used as a proxy of human capital
development. The ratio of government debt to GDP is used as a measure of government
expenditure. We control for inflation as a measure of macroeconomic instability. 57 We also
control for business cycle fluctuations using GDP growth. Furthermore, we control for
differences in mark-up pricing between trading and non-trading firms using changes in real
effective exchange rate. Finally, we control for trade openness using the ratio of net exports to
56 Notice that the measure of FG is plotted on the right axis while the measures of Q dispersion are on the left axis. 57 We also use the ratio of broad money supply (M3) to GDP as a proxy of inflation. However, following the finance literature, this variable can also be interpreted as proxy of financial development.

113 | P a g e
GDP and ratio of exports to GDP. Conscious of the problem of multicollinearity, control variables
whose pairwise correlations were high were not included in the same regression.58
We begin by estimating equation (8) for each of the four measures of Tobin Q dispersion
using both the fixed effects model (FEM) and the random effects model (REM).59 We control for
financial deepening (proxied by ratio of stock market turnover to GDP) and trade openness.
Stock market turnover is a measure of the size, depth and liquidity of the stock market. Since the
depth and liquidity of the stock market determines the extent to which firm-related and other
macroeconomic information is reflected in the market value of securities, illiquidity has the
potential to cause transitory deviations between its current Q and its steady state Q, thereby
potentially inflating the variation of the Q. Although financial globalisation may be seen as a
conduit through which financial market and banking sector development can be promoted, it is
possible to achieve the latter without necessarily having the former. Thus the issue of which of
the two should be promoted or whether they should be equally promoted is of important policy
relevance. Consequently, it is important to separate the dispersion of Q that emanates from the
micro-structure of the stock market and the dispersion of Q that results from financial
globalisation.
In a country like SA where financial reforms contemporaneously occurred with other
reforms such as trade reforms, it is important to also control for trade openness. Trade
openness may cause potential differences in Q-dispersion between trading and non-trading
firms. The fact that trade reforms and financial reforms might have happened
contemporaneously may result in correlation between the error term and the regressors,
making the estimators inconsistent under the null hypothesis. However, this is addressed by the
FEM. The measure of trade openness that is first explored is the sum of imports and exports as a
percentage of GDP.
Tables 5.4 and 5.5 report the results for the intra-sector and inter-sector levels,
respectively. The results are similar for both the FEM and the REM. The coefficients of financial
globalisation are all negative for both the intra-sector and inter-sector levels suggesting that FG
58 Pairwise correlation tests among the control variables were computed, but we do not report them for brevity. 59 While we experimented with both REM and FEM, the REM model was not always appropriate as the Hausman test statistics were sometimes significant. Furthermore, we believe that the there is a possibility that there are some firm-specific characteristics e.g. locational differences, number of employees, etc that we could not control for when we adjusted the Tobin Q in equations (6). The FEM can account for these firm specific characteristics. For these reasons, and for succinctness, we only report the results for the FEM.
114 | P a g e
is associated with improvement in allocation of capital. However, the economic and statistical
significance of the coefficients of financial globalisation is higher for the inter-sector level than
the intra-sector level implying that the impact of financial globalisation on efficient reallocation
of capital is stronger when capital can move across firms in different sectors than when capital
can only be moved among firms within the same sector. The coefficients of financial deepening
and trade openness are positive in both cases, although all insignificant in the intra-sector case.
However, the coefficients for financial deepening are significant for the inter-sector case
suggesting that stock market depth is associated with misallocation of capital. While this finding
is surprising, it may be due to the following reasons. Firstly, the early stages of financial reforms
may be associated with transitory lending booms and busts which may result in misallocation of
capital (see Loayza and Rancière, 2004). Secondly, in a country like SA where most small firms
are financially excluded, an improvement in stock market liquidity might only help the big and
financially connected firms. It might be that the excluded firms are in fact the more efficient
ones.
Next we control for inflation, human capital development, government expenditure,
interest rates, savings, GDP growth and bank credit to the private sector.60 Since the Wald test
suggested significant evidence of GroupWise heteroscedasticity in the panel, we estimate these
models using the robust standard error estimator.61 The results for the intra-sector and inter-
sector are reported in Tables 5.6 to 5.7, respectively. Inflation is expected to inversely affect
allocation of capital. Firstly, unstable prices have the potential to disrupt effective strategic
planning for firms. Secondly, since inflation redistributes wealth from lenders to borrowers, as it
makes borrowers repay less than what they borrowed in real terms, it may disrupt smooth
lending. Inflation can also be interpreted as a measure of macroeconomic instability, as it makes
it difficult to identify good investment opportunities if prices are unstable (Galindo et al, 2007).
In both the intra-sector and inter-sector cases, inflation has the expected sign (i.e. positive) and
is significant especially for the inter-sector results.
60 Our estimations were based on both the REM and the FEM. In most cases, our results were very close, but in some cases, the Hausman Test suggested the REM was inappropriate. For succinctness, we only report the results for the FEM. Results were also very close across all the measures of the Q-Dispersion, but for succinctness, we only report results for the GINI based measure. Results are available on request. 61 Notice that robust standard error estimators were only used in cases where we found evidence of heteroscedasticity and/serial correlation. In notes provided under our Tables of results, we highlight to the reader whether or standard errors are robust or not. Tables whose notes just read standard errors should therefore be interpreted as those where no evidence of heteroscedasticity and/or serial correlation was found.

115 | P a g e
Human capital development is expected to enhance efficient allocation of capital
independent of financial globalisation. Reallocation of capital entails movement of capital from
one firm/sector/industry to another and this may entail the adoption of a new technology in the
firm/industry/sector where capital is migrating. In this regard flexible and developed human
capital may be necessary to facilitate a smooth transition to the new technology. The results
indeed show that human capital development as measured by government investment in
tertiary education has a negative and very significant coefficient. In fact, it is the only control
variable that is always correctly signed and statistically significant across all the Q dispersion
measures, estimated models, and both in the intra-sector and inter-sector cases.
There is some theoretical ambiguity with regards to the undesirable effect of government
expenditure on efficient allocation of capital. According to some economic models government
expenditure ‘crowds out’ private sector investment (Spencer and Yohe, 1970), although this
idea has been contentious in recent literature (see Romer, 2012, p. 72-73). Our results confirm
the inconclusive nature of this debate; while the sign of most of the coefficients is in line with
the crowding out hypothesis, these coefficients are usually statistically insignificant.
We also control for the interest rate. The effect of this factor is ambiguous as the level of
interest rate may reflect other variables in the economy or the structure of the financial sector.
Our results show that the interest rate is significantly associated with a worsening allocation of
capital. This finding is sensible in an economy like SA where the banking sector is concentrated.
It is possible that the interest rates they charge on loans are above the optimal levels. Indeed,
policy makers and practitioners have raised concerns with regards to interest rate margins of
SA banks.
One channel through which financial globalisation improves allocation of capital is
through reducing financial constraints among small firms (Laeven, 2003). However, since
domestic savings can also be channelled to investment, they can also reduce financial
constraints. Thus, we also controlled for the effects of savings. While the coefficient of savings is
correctly signed in most of the estimated models, it is only significant in the inter-sector based
models.
The business cycle may also cause fluctuations in the Tobin Q (see Christiano and Fischer,
1995). Therefore we control for a variable that has been used as a proxy for business cycle

116 | P a g e
fluctuations in the literature i.e. GDP growth.62 The results suggest that business cycle
fluctuations are associated with worsening allocation of capital although the coefficients are not
significant.
Finally to control for financial deepening we used an alternative proxy of financial
deepening, viz. bank credit to the private sector as a percentage of GDP. This proxy is important
especially for emerging nations where financial markets are not as deep as in developed
countries. Like in the previous financial deepening measure, most of the coefficients are positive
and insignificant except for one case in the inter-sector results where the coefficient is negative
and significant. Our interpretation of this result is similar to the interpretation we made earlier
about stock market liquidity. We also controlled for trade openness using an alternative proxy,
exports as a ratio of GDP, and unlike the previous proxy the coefficients in the regressions are
always correctly signed and statistically significant.
Despite controlling for the other determinants of the efficient allocation of capital, all the
coefficients of financial globalisation remained negative. However, a few of the coefficients of
financial globalisation in the intra-sector regressions become insignificant, while most of the
coefficient for the inter-sector regressions remain significant. Moreover, like in the previous
case, the coefficients for the inter-sector regressions are larger than those of the intra-sector
regressions suggesting again that financial globalisation is more beneficial if capital is allowed to
move across sectors than when its movement is restricted within sectors.
5.4.3 Further Robustness Checks
Thus far, the results seem to suggest that gradual financial reforms are significantly
associated with an improvement in sectoral allocation of capital and that this effect is more
pronounced if reallocation is across-sectors than within-sector. This result is largely confirmed
by all the Q-dispersion measures and it seems robust even after controlling for some of the usual
determinants of the allocation of capital. As further assessment of the robustness of this finding,
we carry out additional tests. Firstly, we control for institutional quality. Secondly, we control
possible non-linearity in the effects of financial globalisation on the allocation of capital. More
specifically, we explore whether financial globalisation affects efficient allocation of capital
through its effects on financial deepening and on institutional quality. Third, we examine
62 See the discussion by Boileau and Normandin (1999) and references therein on the suitability of real GDP growth as a proxy of the business cycle.
117 | P a g e
whether or not our results are being driven by specific sectors. Fourth, we test whether the
finding remain significant for another stringent estimation techniques, a dynamic panel model.
Lastly, using the dynamic panel model, we examine whether our findings are not just driven by
the measure of financial globalisation that we constructed. We use alternative measures of
financial globalisation that reflects both the de jure and the de facto elements of financial
globalisation. In what follows we explore each other these five robustness checks.
Controlling for Institutional Quality
We begin by controlling for institutional quality. The role of quality institutions in the form
of an efficient legal framework that protects property rights, the rights of minority shareholders,
expropriation of foreign capital has been strongly emphasized in various strands of literature.
Theoretical contribution by authors has La Porta et al. (1998) and empirical contribution by
Acemoglu et al. (2005) highlights the importance of quality institutions as facilitators of growth
and development. Empirical studies by Almeida and Wolfenzon (2005) and Galindo et al. (2007)
then contextualise quality institutions in terms of their effect on the efficient allocation of
capital. Both studies give empirical support to this allocative role of finance. However, the study
Almeida and Wolfenzon (2005) does not explicitly explore financial globalisation, and there are
concerns with the measure of efficient allocation of capital they use, as we highlight in Section 1.
On the other hand, the study by Galindo et al. (2007) was constrained by the availability of data
on institutional quality. Thus their finding was largely drawn from a proxy based on whether the
origins of a country’s legal framework is English common law or not. In the current study we use
six continuous measures of institutional quality that were obtained from the World Bank
Database and are often referred to as Worldwide Governance Indicators (WGI). They include
variables such as commitment by governments to ensure Voice and Accountability, Government
Effectiveness, Political Stability, Regulatory Quality, Rule of Law and Control of Corruption.
We control for the 6 WGI in each of our benchmark regressions. The results for the intra-
sector and inter-sector, based the Gini measure are reported in Tables 5.8 and 5.9, respectively.
It is interesting to note that once we control for institutional quality, most of the coefficients of
financial globalisation become insignificant, although they are still negative. As before, we also
notice that the coefficients of financial globalisation for the inter-sector allocation measures are
on average higher and more statistically significant than those for the intra-sector reallocation
measures. The coefficient of the proxy for financial deepening is still incorrectly signed.
118 | P a g e
Moreover while they are statistically insignificant for the intra-sector measures, they are
significant for inter-sector reallocation measures. The coefficients of the measures of WGI
indicator are quite appealing across all the measure of Q dispersion. Coefficients for corruption,
voice and accountability, and rule of law are positive, implying the deterioration of these factors
is associated with a misallocation of capital. On the contrary, the coefficients for government
effectiveness, political stability and regulatory quality are negative implying that improvements
in these factors are associated with an improvement in the allocation of capital.
Do Reforms Enhance Resource Reallocation Indirectly?
Proponents of financial globalisation often argue that the effects of financial globalisation
on macro-level growth might be difficult to detect as they manifest through indirect channels.
Some of the indirect channels that have been suggested include promoting of financial sector
development and financial deepening, enhancing domestic institutional quality (promoting
public and corporate governance), imposing macroeconomic discipline and signalling (see Kose
et al, 2006 and references therein).
We therefore ‘interact’ a measure of financial globalisation with the measures of financial
deepening and institutional quality. This allows us to examine how financial globalisation affects
efficient allocation of capital non-linearly through its effects on financial deepening and
institutional quality. 63 The results from interacting financial globalisation with financial
deepening are reported in Tables 5.10 and 5.11. Most of the coefficients of for financial
globalisation still remain negative and significant. Interestingly, once we interact financial
globalisation and financial deepening, the coefficients are negative and statistically significant.
This suggests that financial globalisation does not only directly enhance reallocation of capital,
but also enhances its role of improving the functioning of the financial sector. The coefficients
from interacting financial globalisation and institutional quality did not make economic sense.
As such, we do not report them in this essay.
63 Notice that the measure of FG used in this interaction takes a value of zero in the pre-reform period (1991-1994) and one for the post-reform period (1995-2000). We could not use the measure of FG that we constructed to minimise possibility of multicollinearity.

119 | P a g e
Do The Efficiency Enhancing Effects Of Reforms Vary Across Sectors?
Given that our descriptive statistics and graphical correlation analysis suggest thaton
average the decrease in Q-dispersion was more pronounced in the services and wholesale and
retail sectors, a legitimate question to ask is whether our main result on the re-allocative role of
financial globalisation varies across sectors. If this were the case then it will be of policy interest
to analyse why reallocative effects of financial globalisation are stronger in some sectors than
others. Positive lessons from the sectors that are responding strongly can then be applied to
sectors that are responding weakly. For instance, if the weak response of capital allocation to
globalisation is a consequence of tacit collusion behaviour by a few firms in some sectors, then
regulators could find some way to deal with this problem. To address the above issue, we
include in the regressions a variable that captures sector-specific effects of financial
globalisation. This entails the creation of a new variable which is the product of the financial
globalisation index with a dummy variable which takes a value of 1 corresponding to the sector
in question and zero otherwise. We then estimate separate panel regressions for each of the
sectors.
The results based on Gini measure of Q-Dispersion are reported in Table 5.12 and 5.13. In
terms of intra-sector allocation, the coefficient for the mining is the only one that is positive
suggesting that financial globalisation is associated with a worsening of the allocation of capital
in this sector. However, all the coefficients are not significant. In terms of the inter-sector results,
the coefficients representing allocation between firms in mining (primary) sector with retail &
wholesale trade and manufacturing sectors are positive and statistically significant. Although
this result may be attributable to the imperfect substitutability of resources used in the two
sectors, it may also reflect the lack of structural transformation that is often identified as a pre-
condition for economic development (see Rostow, 1960). That is, the economy must experience
an increase in primary sector productivity, which enables the release of resources to other
sectors of the economy. The inefficiency in the allocation of capital in the mining sector,
however, is suggestive of a lack of such structural change.
This lack of primary sector transformation also reinforces our discussion in Section 1 of
the paper. As evident from Figure 4.4 presented earlier, productivity in another primary sector,
namely agriculture, did increase between 1965 and 1990. However, this increase seems to have
been temporary, suggesting that SA might have failed to undertake policy initiatives to keep this
sector productive and to integrate it with the rest of the economy, thereby facilitating the
120 | P a g e
structural transformation mentioned above. To this extent, the experience of SA seems to have
followed similarly the path as that of many transitional economies such as India where the lack
of sufficient structural reforms has resulted in sluggish growth in agricultural productivity
especially in the rural areas as well as weak spillover effects of agricultural growth to other
sectors of the economy (see Ravallion and Datt, 1999).
However, it is important to emphasize that the current empirical analysis does not include
the agricultural sector. This is because of issues with regard to measuring the agriculture sector
efficiency in a manner that is consistent with other sectors of the economy. More specifically, in
the current study where the measure of efficient allocation is the dispersion of the Tobin’s Q,
there are challenges with regard to computing the Q for the agricultural sector since most firms
in this sector rarely sell their stocks to the public. This is especially true for transitional
economies like SA where the agricultural derivative market is not that deep. As such our
empirical inference for the primary sector is based on the mining sector.
Controlling for Possible Endogeneity, and Persistence in Ds,t, and Using Alternative Measures of Financial Globalisation
An estimation assumption upon which our analysis so far is based on are that our
regressors are exogenous and there is no simultaneity in the relationship between the measures
of efficient reallocation and the explanatory variables. If either of the two assumptions above
were violated, then the problems endogeneity and incidental relationship will result. To address
this issue, the following regression was estimated:
)10(,1,,,, tstststssts DXFGD εϕγβα ++++= −
where Ds,t-1 denotes the lagged value Q dispersion measures and the other variables are as
defined earlier. A potential problem with (9) is that including the lagged dependent variable will
given rise to autocorrelation. To address this problem and the problems associated with
endogeneity, the Arellano-Bond (1991) dynamic panel General Methods of Moments (GMM)
estimator was utilised. The dynamic panel GMM was first proposed by Holtz-Eakin, Newey and
Rosen (1988) and it helps us to address the problems of autocorrelation and endogeneity.
Firstly, to address the problem of endogeneity arising from possible simultaneity between the
measures of efficient reallocation and financial globalisation, as well as the problem of weak
121 | P a g e
instruments, we used the lagged values of the endogenous regressors as instruments.64 Second,
to eliminate the possibility of bias resulting from invariant sector-specific characteristics (e.g.
location of firms) and the possibility of spurious correlations due to non-stationary variables, all
the variables in equation (8) and their instruments were differenced before estimation. Third, to
address the possibility of autocorrelation resulting from using the differenced lagged values of
the dependent variable Ds,t-1, we instrumented it with its differenced lagged values.
The results are reported in Tables 5.14 and 5.15. Evidently, if anything our main result on
the allocative effects of financial globalisation become even more statistically significant and in
some cases economically stronger. Moreover, the coefficients of most of the control variables
are still significant. Our results do not show any evidence of serial correlation or over-
identification.
Finally, to examine whether our main findings are not just picking the measure of financial
globalisation that we constructed, we re-estimate equation (10) using alternative measures of
financial globalisation. These measures capture the de facto elements of financial globalisation
and they include aggregate net capital inflows, gross FDI inflows, gross portfolio equity inflows,
and gross portfolio debt inflows. All these measures were expressed as percentage of GDP.
The results for intra-sector and inter-sector are reported in Tables 5.16 and 5.17,
respectively. The coefficients of all the alternative measures of financial globalisation were
negative and mostly statistically significant except for portfolio debt which was positive but
insignificant. This is expected since portfolio debt inflows are likely to lead to moral hazards and
currency mismatch (Kose et al. 2006). On the other hand portfolio equity inflows improve
allocation of capital through different channel. Often portfolio equity only flows to firms that
have signalled willingness to adhere to strict corporate governance standards. This can be
through cross-listing on stock markets that has strict accounting and disclosure requirement.
Furthermore, such firms are closely followed by concerned stakeholder including analysts. As
such, this type of flow usually brings qualitative benefits in the form of improving allocation of
capital. FDI brings benefits through bringing managerial expertise, horizontal and vertical
technological transfers, on the job trainings, and research and development all of which have
positive spillovers to the economy.
64 One of the criticisms of the instrumental variable econometric technique is that ‘strong’ instruments may be difficult to get. Thus, the Arellano-Bond (1991) dynamic panel (GMM) estimator uses the lagged values of the regressors as instruments in addition to any other additional exogenous instruments provided.
122 | P a g e
How do our findings compare to existing literature?
The findings of this study add an interesting dimension to existing studies. Our results are
not directly comparable to those in existing literature for two main reasons. Firstly, our focus is
intra-sector and inter-sector reallocation of capita while the majority of the existing studies have
focussed on economy wide firm-level reallocation. Secondly, we focus on a single country,
whereas the majority of the studies focus on cross-country data. Notwithstanding these issues, a
few lessons that can be drawn by comparing our study to that of Abiad et al. (2008) upon which
methodology is based.
Firstly, our findings are generally in line with those of Abiad et al. (2008) that financial
globalisation enhances efficient reallocation of capital. However, the economic significance of
the coefficients of our intra-sector firm-level reallocation are lower than the coefficients of inter-
sector firm-level reallocation, which in turn are lower than the coefficients of economy wide
firm-level reallocation considered by Abiad et al. (2008). Consequently, the results suggest that
the reallocation benefits of financial globalisation are likely to be greater if there are no implicit
or explicit barriers that inhibit free movements of capital across firms in different sectors. In this
regard, market structure based barriers, such as monopolies or institutionalised barriers, such
as government incentives to promote investment in certain industries or regions might limit the
size of the reallocative benefits of financial globalisation. Nevertheless, this does not necessarily
imply the effects of financial globalisation in movement of resources across firms in different
sectors in always smooth. As we showed earlier, some inter-sectoral reallocations are subject to
efficiency losses. The efficiency losses result from the adjustment cost of capital and the
imperfect substitutability of capital.
Secondly, in contrast to Abiad et al. (2008), our findings suggest that institutions play an
important role in intra-sector and inter-sector reallocation of capital. The absence of good
institutions may actually limit the capital reallocation benefits of financial globalisation.
Furthermore, there is very little evidence that financial globalisation indirectly enhances
efficient allocation of resources through its effects on institutions. This suggests that good
institutions should be considered as a pre-requisite rather than an outcome of financial
globalisation.
Thirdly, unlike in Abiad et al. (2008), human capital development is an important
determinant of intra-sector and inter-sector reallocation capital, while trade openness does not

123 | P a g e
seem that important. The former finding suggests that the availability of skills that is not only
specialised but also flexible is important if capital reallocation is to be smooth. Otherwise, the
efficiency reallocation effects of financial globalisation are likely to be derailed if the labour
skills/input cannot complement the new capital moving into a firm/sector. The latter finding
might be because the once the economy-wide firm level data is broken into sectors, the number
of trading firms in each sector may not be as large. Thus the benefit of trade openness may not
be observable at sectoral level.
5.5 Conclusions This essay analysed the effect of financial globalisation in efficient intra-sector and inter-
sector reallocation of capital in SA. The speed with which SA has instituted and implemented
various liberal reforms since the 1994 political dispensation makes it an interesting case in the
context of globalisation and its impact on efficiency. Currently, existing firm level studies have
focussed on economy wide firm-level reallocation of capital. Consequently, our analysis at the
intra-sector and inter-sector firm level provides new insights and policy implications that are
relevant for other sub-Saharan African and other emerging economies.
In testing whether financial globalisation enhances efficient reallocation we use firm level
data for the period 1991-2008. We construct our own measures of financial globalisation by
tracing the various financial reforms/restrictions that happened in SA since 1969. This measure
allows us to capture the gradual nature in which financial globalisation manifests rather than
treating it as a once-off event. We use Abiad et al. (2008) measure of reallocative efficiency-
reallocation which is based on the concept of variability of firms’ marginal returns (as proxied
by Tobin Q) around the sectors’ steady state level of marginal returns.
Generally our main finding is that financial globalisation enhances efficient sectoral
reallocation of capital in SA. However, there is a new insight from our results; we find that
efficient reallocation effects of financial globalisation are larger at inter-sector than intra-sector
level. Moreover, compared to the coefficients of Abiad et al. (2008) based on economy wide
firm-level reallocation, our inter-sector firm-level reallocation coefficients are smaller in
magnitude. This suggests that implicit or explicit barriers that inhibit free movement of capital
across firms in different sectors of the economy potentially limit the reallocation benefits of
financial globalisation.

124 | P a g e
There is evidence to suggest that intra-sector reallocation of capital in the primary
(mining) sector of the economy is the weakest. Moreover, the empirical results show that the
effects of financial globalisation on both the intra-sector allocation of capital in the mining sector
and for inter-sector reallocation from the mining sector to other sectors of the economy seem to
be the weakest. Thus, although SA is benefiting from financial globalisation, there is a need to
undertake structural and institutional transformation that ensures the efficiency gains are
experienced in all sectors of the economy. Typically, this requires that the productivity growth
of all sectors converges to a stable level and that the primary sector (particularly agriculture) is
integrated to the rest of the economy through infrastructural development and market-
equilibrium linkages (see Timmer, 1988). As such positive lessons can be learnt from an
emerging nation like China, whose structural, institutional and technological transformation of
the agricultural sector paid-off through not only massive increase in productivity growth in this
sector, but also spillover effects to the non-agricultural sectors and the entire economy.65
However, since the conditions in China were different from those of SA when the former
implemented its reforms, the reforms that SA needs might be more extensive than those
implemented in China. For instance, the structural changes that SA should implement need to
take into account the historical land ownership imposed by colonialism as well as the economic
exclusion of the majority of the population.
There is also evidence to suggest that poor institutions limit the reallocative effects of
financial globalisation and as can be expected, human capital development has an independent
and significant effect on reallocative efficiency. Furthermore, while there is no evidence to
suggest that financial deepening has independent effects on the efficient reallocation of capital,
there is evidence to suggest that it is one of the indirect channels through which financial
globalisation can potentially affect the reallocation of capital. Our findings are robust to several
stringent tests.
While our study provides new and interesting insights into the intra-sector and inter-sector
effects of financial reforms, a number of questions still have to be answered. These are in
relation to whether the effects of financial globalisation on sectoral reallocation vary according
to the size of firms and whether there are differences between exporting and non-exporting
firms. Pending the availability of a richer data set, we leave these questions as a future direction
of research.
65 The total factor productivity (TFP) in China’s agricultural increased by 55 percent from 1979 to 1984 and this is attributed to several structural and technological improvements were made prior to 1979 (see Stone, 1993).
125 | P a g e
Appendix 5.1: Tables of Results and Figures
Table 5.4Benchmark Results: Intra-Sector
Fixed Effect Model Random Effect Model
Gini Theil M.L.D C.V. Sq Gini Theil M.L.D C.V. Sq
FG -0.044* -0.024* -0.023 -0.097** -0.044* -0.024 -0.023* -0.097**
(0.024) (0.015) (0.012) (0.039) (0.024) (0.015) (0.012) (0.040)
Stock Market Turnover 0.007 0.003 0.003 0.015 0.007 0.003 0.003 0.015
(0.007) (0.004) (0.004) (0.012) (0.007) (0.005) (0.004) (0.012)
Change in Trade Openness 0.025 0.009 0.011 -0.008 0.025 0.009 0.011 -0.008
(0.033) (0.020) (0.017) (0.055) (0.033) (0.020) (0.016) (0.055)
Constant 0.105** 0.035** 0.033** 0.102** 0.105** 0.035** 0.033** 0.102** Observations 72 72 72 72 72 72 72 72 Number of Sectors 4 4 4 4 4 4 4 4 R-squared 0.09 0.07 0.09 0.123 0.07 0.06 0.07 0.11
Hausman Test Statistic 0.000 0.000 0.000 0.000
Hausman Test p-value 1.000 1.000 1.000 1.000
Notes: Standard errors in parenthesis, *,**,*** denote 10%, 5%, 1% significance level respectively. Table 5.5: Benchmark Results: Inter-Sector
Fixed Effect Model
Random Effect Model
Gini Theil M.L.D C.V. Sq Gini Theil M.L.D C.V. Sq
FG -0.062*** -0.031*** -0.029*** -0.093*** -0.062*** -0.031*** -0.029*** -0.093***
(0.014) (0.009) (0.008) (0.031) (0.014) (0.009) (0.007) (0.031)
Stock Market Turnover
0.013*** 0.006** 0.006** 0.017* 0.013*** 0.006** 0.007** 0.017* (0.004) (0.003) (0.002) (0.009) (0.004) (0.003) (0.002) (0.009)
Change in Trade Openness
0.020 0.009 0.011 0.022 0.019 0.009 0.011 0.022 (0.019) (0.013) (0.010) (0.043) (0.019) (0.013) (0.010) (0.043)
Constant 0.119*** 0.0401*** 0.0382*** 0.111*** 0.119*** 0.0401*** 0.0382*** 0.111*** Observations 108 108 108 108 108 108 108 108 NO. of Sectors 6 6 6 6 6 6 6 6 R-squared 0.209 0.134 0.173 0.107 0.17 0.12 0.15 0.1
Hausman Test Statistic NA* NA* 0.000 NA*
Hausman Test p-value
1.000
Notes: Standard errors in parenthesis, *,**,*** denote 10%, 5%, 1% significance level respectively.

126 | P a g e
Table 5.6 Controlling for other Determinants of Tobin Q dispersion: Intra-sector: Dependent Variable: GINI
I II III IV V VI VII VIII
FG -0.029 -0.040 -0.023 -0.068*** -0.031 -0.077 -0.077*** -0.063**
(0.034) (0.064) (0.036) (0.011) (0.030) (0.036) (0.012) (0.012)
Stock Market Turnover
0.005 -0.032* 0.012 0.015 0.008 0.009 0.011* (0.005) (0.017) (0.005) (0.007) (0.004) (0.005) (0.004) Inflation 0.001**
(0.0002) Tertiary
Education Exp. -0.039***
(0.011) Exports/GDP
-0.097
(0.052) Government
Expenditure -0.103
(0.145) Interest Rates
0.002*
(0.0004) Savings
-0.210
(0.153) GDP growth
0.002 0.001
(0.001) (0.002)
Bank Credit to the Private Sector
0.007
(0.004)
Constant 0.090** 0.256*** 0.227** 0.261 0.076** 0.379 0.120*** 0.111*** No. Of Sectors 4 4 4 4 4 4 4 4 Observations 72 48 72 72 72 72 72 72 R-squared 0.10 0.35 0.11 0.09 0.12 0.13 0.11 0.12
Notes: Robust Standard errors in parenthesis, *,**,*** denote 10%, 5%, 1% significance level respectively. Table 5.7 Controlling for other Determinants of Tobin Q dispersion: Inter-sector: Dependent Variable: GINI
I II III IV V VI VII VIII
FG -0.045*** -0.070 -0.027* -0.057*** -0.054*** -0.090*** -0.086*** -0.084***
(0.011) (0.062) (0.011) (0.007) (0.006) (0.010) (0.002) (0.001)
Stock Market Turnover
0.011*** -0.032* 0.019*** 0.012** 0.014*** 0.016*** 0.016*** (0.002) (0.013) (0.002) (0.004) (0.002) (0.002) (0.001) Inflation 0.001***
(0.0001) Tertiary Educ. Exp
-0.039***
(0.007) Exports/GDP
-0.147***
(0.009) Government
Expenditure 0.046
(0.084) Interest Rates
0.001**
(0.0003) Savings
-0.181**
(0.068) GDP Growth
0.002 0.002*
(0.001) (0.001)
Bank Credit to the Private Sector
-0.015*
(0.006)
Constant 0.103*** 0.237*** 0.301*** 0.0540 0.101*** 0.355*** 0.131*** 0.158*** No of Cross Sections 6 6 6 6 6 6 6 6 Observations 108 72 108 108 108 108 108 108 R-squared 0.24 0.49 0.31 0.20 0.23 0.26 0.23 0.24
Notes: Robust Standard errors in parenthesis, *,**,*** denote 10%, 5%, 1% significance level respectively.
127 | P a g e
Table 5.8 Controlling for Institutional Quality: Intra-sector: Dependent Variable: GINI
I II III IV V VI
FG -0.096** -0.121 -0.057 -0.020 -0.154* -0.077
(0.047) (0.086) (0.049) (0.092) (0.068) (0.068)
Stock Market Turnover
0.025* 0.022 0.021 0.011 0.022* 0.018 (0.009) (0.010) (0.009) (0.011) (0.009) (0.008)
Corruption 0.043**
(0.009)
Government Effectiveness
-0.006
(0.012)
Political Stability
-0.010**
(0.003)
Regulatory Quality
-0.042**
(0.007)
Rule of Law
0.049
(0.032)
Voice and Accountability
0.064
(0.033)
Constant 0.135* 0.162* 0.121 0.103 0.180** 0.077 No. Of Sectors 4 4 4 4 4 4 Observations 52 52 52 52 52 52 R-squared 0.23 0.16 0.17 0.22 0.20 0.22
Notes: Robust Standard errors in parenthesis, *,**,*** denote 10%, 5%, 1% significance level respectively. Table 5.9 Controlling for Institutional Quality: Inter-sector: Dependent Variable: GINI
I II III IV V VI
FG -0.156*** -0.102** -0.0615* -0.0391 -0.165*** -0.0325
(0.0390) (0.0437) (0.0326) (0.0501) (0.0386) (0.0349)
Stock Market Turnover 0.0250*** 0.0212*** 0.0194*** 0.00725 0.0206*** 0.0157**
(0.00447) (0.00496) (0.00460) (0.00572) (0.00455) (0.00421)
Corruption 0.0642***
(0.00300)
Government Effectiveness
-0.000328
(0.00490)
Political Stability
-0.0141***
(0.00307)
Regulatory Quality
-0.0502***
(0.00530)
Rule of Law
0.0642***
(0.00829)
Voice and Accountability
0.0855***
(0.00651)
Constant 0.105** 0.146*** 0.0875** 0.0745* 0.169*** 0.0323 No. Of Sectors 6 6 6 6 6 6 Observations 78 78 78 78 78 78 R-squared 0.435 0.175 0.215 0.304 0.278 0.341
Notes: Robust Standard errors in parenthesis, *,**,*** denote 10%, 5%, 1% significance level respectively.
128 | P a g e
Table 5.10 Interacting Financial deepening and FG: Intra-sector: Dependent Variable: GINI
I II III IV
FG -0.0397** 0.0399 -0.117*** -0.0535*
(0.0124) (0.0636) (0.0367) (0.0279)
Tertiary Educ. Exp -0.0222*** -0.0390*** -0.0165*** -0.0254***
(0.00510) (0.0109) (0.00594) (0.00671)
FG*Turnover/Market Capitalisation
-0.0232** (0.0112) FG*Turnover
-0.0314*
(0.0170) FG*Market
Capitalisation 0.00740
(0.00457)
FG*Bank Credit to Private Sector -0.0733
(0.0727)
Constant 0.243*** 0.256*** 0.238*** 0.397** No. Of Sectors 4 4 4 4 Observations 72 72 72 72 R-squared 0.366 0.353 0.342 0.317
Notes: Robust Standard errors in parenthesis, *, **, *** denote 10%, 5%, 1% significance level respectively. Table 5.11 Interacting Financial deepening and FG: Inter-sector: Dependent Variable: GINI
I II III IV
FG -0.0305** -0.0701* -0.173*** -0.0367**
(0.0119) (0.0365) (0.0205) (0.0152)
Tertiary Educ. Exp -0.0218*** -0.0389*** -0.0145*** -0.0273***
(0.00271) (0.00626) (0.00333) (0.00381)
FG*Turnover/Market Capitalisation
-0.0296*** (0.00596) FG*Turnover
-0.0324***
(0.00976) FG*Market Capitalisation
0.00934***
(0.00256) FG*Bank Credit to Public
-0.119***
(0.0414)
Constant 0.225*** 0.237*** 0.219*** 0.479*** No. Of Inter-Sectors 6 6 6 6 Observations 72 72 72 72 R-squared 0.566 0.487 0.502 0.467
Notes: Robust Standard errors in parenthesis, *, **, *** denote 10%, 5%, 1% significance level respectively.

129 | P a g e
Table 5.12 Do effects of FG vary across Sectors: Intra-sector: Dependent Variable: GINI
I II III IV
FG -0.022* -0.013* -0.015 -0.023*
(0.0128) (0.07) (0.013) (0.013)
Financial Crisis Dummy -0.002 -0.002 -0.002 -0.002
(0.004) (0.004) (0.004) (0.004)
FG*Manufacturing -0.002
(0.025)
FG*Mining
0.018
(0.025)
FG*Services
-0.041
(0.025)
FG*Retail& Wholesale Trade
-0.004
(0.025)
Constant 0.0948*** 0.0936*** 0.0968*** 0.0944*** No. Of Sectors 4 4 4 4 Observations 72 72 72 72 R-squared 0.10 0.07 0.08 0.10
Notes: Standard errors in parenthesis, *, **, *** denote 10%, 5%, 1% significance level respectively. Table 5.13 Do effects of FG vary across Sectors: Inter-sector: Dependent Variable: GINI
I II III IV V VI
FG -0.021*** -0.023*** -0.027*** -0.018** -0.017** -0.020***
(0.007) (0.00734) (0.007) (0.007) (0.007) (0.007)
Financial Crisis Dummy -0.005** -0.005** -0.005** -0.004** -0.005** -0.005**
(0.002) (0.002) (0.002) (0.002) (0.002) (0.002)
FG*Manufacturing-Mining 0.013
(0.018)
FG*Manufacturing-Retail
0.031*
(0.018)
FG*Mining-Retail
0.030*
(0.018)
FG*Manufacturing-Service
-0.025
(0.018)
FG*Services-Mining
-0.008
(0.018)
FG*Services-Retail
0.001
(0.018)
Constant 0.0983*** 0.0976*** 0.0977*** 0.0997*** 0.0990*** 0.0987*** No. Of Inter-Sectors 6 6 6 6 6 6 Observations 108 108 108 108 108 108 R-squared 0.126 0.147 0.146 0.139 0.123 0.122
Notes: Standard errors in parenthesis, *, **, *** denote 10%, 5%, 1% significance level respectively.

130 | P a g e
Table 5.14 Allerano-Bond Dynamic Panel Model: Intra-sector: Dependent Variable: GINI
I II III IV V
FG -0.058** -0.064** -0.003 -0.120*** -0.021
(0.024) (0.021) (0.045) (0.022) (0.027)
Turnover/Market Capitalisation
-0.0210* (0.0122)
Bank Credit to Private Sector -0.081
(0.071) Market Turnover
-0.018
(0.019) Market Capitalisation
0.007
(0.005) Trade Openness
-0.097
(0.074)
Tertiary Education Exp. -0.017*** -0.021*** -0.028** -0.012* -0.021***
(0.007) (0.007) (0.012) (0.007) (0.006)
Growth 0.004 0.005** 0.004* 0.004* 0.004
(0.003) (0.002) (0.00247) (0.003) (0.004)
Lagged Dependent Variable 0.269* 0.248 0.207 0.266* 0.217
(0.153) (0.155) (0.151) (0.160) (0.150)
2nd Order Serial Correlation 0 .215(0.82) 0.184(0.85) -0.006(0.99 ) 0.171(0.86) 0.101( 0.92) Sargan Test 42.241(0.37) 43.081(0.34) 44.942(0.27) 39.383(0.49) 43.739(0.32) No. Of Sectors 4 4 4 4 4 N 44 44 44 44 44
Notes: Standard errors in parenthesis, *, **, *** denote 10%, 5%, 1% significance level respectively. Table 5.15 Allerano-Bond Dynamic Panel Model: Intra-sector: Dependent Variable: GINI
I II III IV V
FG -0.088*** -0.096*** -0.041 -0.141*** -0.064
(0.021) (0.032) (0.083) (0.039) (0.051)
Turnover/Market Capitalisation -0.025***
(0.007)
Bank Credit to Private Sector
-0.113***
(0.039)
Market Turnover
-0.022**
(0.010)
Market Capitalisation
0.007**
(0.003)
Trade Openness
-0.194***
(0.057)
Tertiary Education Exp. -0.019*** -0.025*** -0.033*** -0.013*** -0.025***
(0.004) (0.005) (0.007) (0.005) (0.004)
Growth 0.003* 0.004** 0.003** 0.003** 0.003**
(0.013) (0.002) (0.001) (0.001) (0.001)
Lagged Dependent Variable
0.126 0.0825 0.00392 0.128 0.0157 (0.126) (0.131) (0.126) (0.139) (0.122)
2nd Order Serial Correlation 0 .589 (0.56) 0 .873(0.38) 0.488(0.63) 0 .921(0.35) 0 .005(0.99) Sargan Test 58.491(0.19) 58.827(0.18) 47.081(0.32) 55.505(0.27) 44.469(0.36) Number of Inter-Sectors 6 6 6 6 6 Observations 66 66 66 66 66
131 | P a g e
Table 5.16 Alternative FG measures: Allerano-Bond Dynamic Panel Model: Intra-sector: Dependent Variable: GINI
I II III IV V
FGt-1 -0.059***
(0.016)
Net Capital Inflow/GDP
-0.114**
(0.055)
Gross FDI Inflow/GDP
-0.055**
(0.022)
Gross Portfolio Equity Inflow/GDP
-0.054*
(0.0281)
Gross Debt Inflow/GDP
0.006
(0.008)
Bank Credit to Private Sector -0.110*** -0.182*** -0.140*** -0.150*** -0.167***
(0.036) (0.036) (0.037) (0.037) (0.037)
Tertiary Education Exp. -0.026*** -0.0329*** -0.027*** -0.032*** -0.024***
(0.004) (0.006) (0.005) (0.006) (0.005)
GDP Growth 0.003*** 0.003*** 0.004*** 0.004*** 0.002*
(0.001) (0.001) (0.001) (0.001) (0.001)
Lagged Dependent Variable 0.039 0.089 0.141 0.084 0.102
(0.12) (0.134) (0.134) (0.135) (0.142)
2nd Order Serial Correlation 0.175(0.86) 0.456(0.64) 0.754(0.45) 0.521(0.60) 0 .679(0.49) Sargan Test 56.782(0.61) 61.046(0.14) 57.999(0.21) 59.624(0.170 59.124(0.18) Number of Inter-Sectors 4 4 4 4 4 Observations 44 44 44 44 44
Notes: Standard errors in parenthesis, *, **, *** denote 10%, 5%, 1% significance level respectively. Table 5.17 Alternative FG measures: Allerano-Bond Dynamic Panel Model: Inter-sector: Dependent Variable: GINI
I II III IV V
FGt-1 -0.086***
(0.029)
Net Capital Inflow/GDP
-0.221**
(0.098)
Gross FDI Inflow/GDP
-0.067**
(0.032)
Gross Portfolio Equity Inflow/GDP
-0.075***
(0.022)
Gross Debt Inflow/GDP
0.003
(0.014)
Bank Credit to Private Sector -0.077*** -0.191*** -0.133** -0.138** -0.165**
(0.017) (0.065) (0.067) (0.067) (0.068)
Tertiary Education Exp. -0.022*** -0.036*** -0.025*** -0.031*** -0.021**
(0.007) (0.009) (0.007) (0.009) (0.009)
GDP Growth 0.004** 0.004* 0.004* 0.004* 0.002
(0.002) (0.002) (0.002) (0.002) (0.002)
Lagged Dependent Variable 0.208 0.264* 0.292* 0.245 0.273
(0.148) (0.157) (0.160) (0.160) (0.167)
2nd Order Serial Correlation 0.088(0.92) 0.506(0.61) 0.359(0.71) 0.247(0.80) 0.423(0.67) Sargan Test 41.077(0.38) 37.98(0.52) 38.39(0.50) 38.55(0.49) 38.38(0.50) Number of Inter-Sectors 6 6 6 6 6 N 66 66 66 66 66
Notes: Standard errors in parenthesis, *, **, *** denote 10%, 5%, 1% significance level respectively.
132 | P a g e
GINI THEIL
MEAN LOG DEVIATION (MLD) COEFFICIENT OF VARIATION (CoV)
Figure 5.5: Mean of the Dispersion of the Tobin Q
0
0.02
0.04
0.06
0.08
0.1
0.12
Manufacturing Mining Services Wholesale and Retail
1991-1994
1995-2008
1991-1999
2000-2008
0
0.005
0.01
0.015
0.02
0.025
0.03
0.035
Manufacturing Mining Services Wholesale and Retail
1991-1994
1995-2008
1991-1999
2000-2008
0
0.005
0.01
0.015
0.02
0.025
0.03
Manufacturing Mining Services Wholesale and Retail
1991-1994
1995-2008
1991-1999
2000-2008
0
0.01
0.02
0.03
0.04
0.05
0.06
0.07
0.08
0.09
0.1
Manufacturing Mining Services Wholesale and Retail
1991-1994
1995-2008
1991-1999
2000-2008

133 | P a g e
Manufacturing Mining
Services Retail and Wholesale
Figure 5.6: Trends in FG and the Tobin Q Dispersion
0 0.1 0.2 0.3 0.4 0.5 0.6 0.7 0.8 0.9 1
0 0.01 0.02 0.03 0.04 0.05 0.06 0.07 0.08 0.09
0.1 19
91
1992
19
93
1994
19
95
1996
19
97
1998
19
99
2000
20
01
2002
20
03
2004
20
05
2006
20
07
2008
Year
GINI THEIL MLD CoV FG
0 0.1 0.2 0.3 0.4 0.5 0.6 0.7 0.8 0.9 1
0
0.02
0.04
0.06
0.08
0.1
0.12
0.14
1991
19
92
1993
19
94
1995
19
96
1997
19
98
1999
20
00
2001
20
02
2003
20
04
2005
20
06
2007
20
08
Year GINI THEIL MLD CoV FG
0 0.1 0.2 0.3 0.4 0.5 0.6 0.7 0.8 0.9 1
0
0.05
0.1
0.15
0.2
0.25
1991
19
92
1993
19
94
1995
19
96
1997
19
98
1999
20
00
2001
20
02
2003
20
04
2005
20
06
2007
20
08
Year GINI THEIL MLD CoV FG
0 0.1 0.2 0.3 0.4 0.5 0.6 0.7 0.8 0.9 1
0
0.02
0.04
0.06
0.08
0.1
0.12
0.14
0.16
1991
19
92
1993
19
94
1995
19
96
1997
19
98
1999
20
00
2001
20
02
2003
20
04
2005
20
06
2007
20
08
Year GINI THEIL MLD CoV FG
134 | P a g e
Appendix 5.2: Constructing our measure of Financial Globalisation
Using the Principal Component Analysis (PCA), we analyse the data on the six forms of financial reforms to create a measures of financial globalisation.66 The composition of the financial globalisation variables is as follows:
)11(654321 FECwSMwCCwPDRwINTwEBBwFG +++++=
where FG is the measure of financial globalisation, the other variables are as defined in Section 3.2, and w1 ,..., w6 are the weight of each of the component as given by the respective eigenvector of the selected principal component. The estimated results for equation (8) are reported in Table A1. As evident in Table A1, the first principal component (PC) captures approximately 88.3% of the information from the original data. The remaining PCs each capture less than 4% of the information. Furthermore, following the Keiser-Guttman rule (Guttman; 1954; Keiser, 1960), it is evident that the eigenvalues of all the PCs, except for PC1 are less than one. Thus, we calculate our measure of financial globalisation as a linear combination of our six measures of financial globalisation (i.e. INT, EBB, PDR, CCR, SM, and FCE) with weights given by the first eigenvector. We rescale the eigenvectors so that the individual contribution of INTR, EBB, PDR, CCR, SMR, and FCE to the first the standardised variance of the first principal component are 16.6%, 16.5%, 17.0%, 16.6%, 16.3%, 17.0% i.e. their sum is 100%. 67
Table A1: Principal component analysis for the financial liberalisation indices
PC 1 PC 2 PC 3 PC 4 PC 5 PC 6
Eigenvalues 5.299 0.234 0.196 0.141 0.099 0.030 % of variance 0.883 0.039 0.033 0.024 0.017 0.005 Cumulative 0.883 0.922 0.955 0.978 0.995 1.000
Variable Vector 1 Vector 2 Vector 3 Vector 4 Vector 5 Vector 6 EBB 0.406 -0.445 0.329 -0.441 0.576 0.048 INTR 0.416 -0.106 -0.349 -0.375 -0.508 0.543 PDR 0.406 -0.320 0.332 0.745 -0.167 0.198 CCR 0.418 -0.233 -0.463 0.048 -0.112 -0.736 SMR 0.400 0.569 0.554 -0.215 -0.301 -0.270 FCEC 0.403 0.557 -0.373 0.245 0.528 0.223
Notes: EBB= Entry Barriers into the banking industry, FCEC= Foreign capital and exchange rate controls, INTR = Interest rate controls, PDR= Prudential regulation, SMR= Stock market regulation and reforms, CCR= Credit Controls, PC1,....,PC6 are the Principal Components, Vector 1,...,Vector 6 are the eigenvectors.
66 Traditionally, the PCA has been used to reduce a large set of correlated variables into a small set of uncorrelated variables, called principal components (Stock and Watson, 2002; Ang and McKibbin, 2007). Each of the principal components can be described as a linear combination of optimally weighed values from the original dataset. Readers who are keen to know the theoretical basis and applications of the PCA are referred to textbooks like Dunteman and Lewis-Beck (1989). 67 Note that for experimental purposes, we also constructed another FG measure based on the first four PCs, thereby capturing 98% of the information. The results empirical results regarding the effects of FG (based on this latter measure of FG) on reallocation of capital were very close to those based on the former measure, both qualitatively and quantitatively.
135 | P a g e
Appendix 5.3: Trends in Financial Globalisation and Financial Reforms in South Africa Summary of trends in Capital and Foreign exchange Control Policies in South Africa 1961-1975: The Blocked Rand: In terms of the Exchange Control Regulation 1991 issued in terms of Currency and Exchanges Act 9 of 1933, proceeds from the sale of South Africa securities by non-residents were blocked within the country and deposited in blocked rand account with commercial banks. The balance could only be used to buy domestic shares which could be exported and sold outside Sub Saharan Africa or buy 5/more-year government securities sale, in which case repatriation at official rate would be allowed after at least five year. 1975: Abolition of the Blocked Rand. 1976-1979: Inception of the Securities Rand: Direct transfers between non-residents and residents were allowed so as trading of foreign currency through brokers on the JSE. 1979-1983: The financial rand: Recommendations from a Commission of Enquiry chaired by Gerhard De Kock resulted in the implementation of the financial rand. February 1983: Abolition of the Financial Rand and the reunification of the rand. August 1985: The Financial Rand system was reintroduced as a policy response to South Africa’s Debt crisis of 1985. March 1995: The Financial Rand system abolished. July 1995: Domestic institutional investors (unit trusts, insurance companies, and pension funds) allowed diversifying in foreign markets. June 1996: Limit on investment on foreign assets by way of swaps raised from 5% to 10%. Outright foreign investment was introduced with the limit set at 3% of net inflows. July 1997: Domestic private individuals permitted to make limited investments abroad. Limit per individual was set at R200 000. November 1998: Limit on foreign assets by way of swaps raised from 10% to 15% for institutional investors. Limit on outright foreign investment were raised to 5% while that for regional investors (i.e. from SADC) was raised to 10%. February 2000: Limit on foreign assets by way of swaps raised to 20% only for unit trusts but maintained at 15% for insurance companies, and pension funds. February 2000: The limit on private individuals’ investments abroad increased from R200 000 to R750 000. November 2001: The foreign investment allowance given to institutional investors were extended to fund managers. 2003: Tax amnesty was introduced on inward foreign exchange transaction. This was done mainly done to encourage the repatriation of flight capital. October 2004: Abolition of exchange control limits on foreign direct investment (FDI) of less than R500million by South Africa corporate October 2009: Pre-approval process for new FDI of less than R500million by South Africa corporate has been removed. Summary of trends in interest rate reforms and monetary policy framework 1960 - 1980: Monetary policy was based on the on the liquid asset ratio system with quantitative controls on interest rates and credit. 1981 – 1985: The De Kock commission recommendations to remove direct interest rate and bank credit ceilings were implemented in 1980. Mixed monetary policy system following were pursued between 1981 and 1985. 1986 – 1998: Monetary targeting monetary policy based on the cost of cash reserves was introduced in 1986. The broad money, M3 was the monetary target. Short-term interest rate became the main instrument of monetary policy. 1998 – 1999: Post-democratic financial liberalisation rendered monetary targeting absoluteness In March 1998 a new repo system of monetary accommodation was introduced. 2000: Inflation targeting policy was formally introduced. Summary of trends in credit controls policies and reforms 1960 - 1980: Monetary policy was based on the on the liquid asset ratio system with quantitative controls on interest rates and credit. 1981- 1991: Direct credit control removed in 1980 but credit still poor because South Africa was under international sanctions and majority of the population was unbanked. 1992 – 1994: Gradual improvement in lending conditions as the emergence of a democratic South Africa becomes inevitable.
136 | P a g e
1995-2005: After 1994 democratisation, the new government introduced various policies through the Financial Services Charter to ensure that the unbanked were given access to the banking sector. Banking services were rapidly extended to the public. But the main benefit of this was retail banking. Although wholesale and business lending to the previously unbanked increased, it remained relatively low. 2006: Introduction of the National Credit Act to ensure that all South African have access to affordable credit. Subsequently the National Credit Regulator and the National Credit Tribunal were created. Summary of Banking Sector Prudential Regulations Prior to 1980: Due to policies aimed at limiting the entry and exit of foreign capital, the South African banking legislation was diverging from the trend towards growing internationalisation of banking regulation. 1980s: Although South Africa was not a signatory to the Basel “Concordat”, it endorsed the principles and the 1985 amendment to the South African banks act; some of the principles of Basel were implemented 1991: In line with the EU, risk- based capital requirements were introduced. 1998: Banks were obliged to conform to Generally Accepted Accounting Practice (GAAP). 2002: Amendment of the Banks Act 1990 to compel banks to establish sound risk management and corporate governance. 2007-2008: South African Banker’s Association agree on a code of conduct aimed at adhering to proper lending standard. In 2008 the South African Reserve Bank (SARB) implemented Phase 1 of the Integrated Cash Management Systems and all Banks began to officially begin to operate under Basel II. Summary of Trends in barriers and restrictions on foreign bank entry Prior to 1970: Although Banks were never nationalised, the South African Government used several policies that resulted in concentration of the banking industry and that created barriers to entry. 1967: The South African government appointed a commission of enquiry into the banking sector, headed by Vice-President of SARB, Dr D. G. Franszen, which made recommendations to limit foreign ownership and increasing credit. 1973: The Minister of Finance demanded that foreign shareholding in South African banks be reduced to 10 percent of banks’ shares and later that year lifted this ceiling to 50%. 1976: The Financial Institution Act was amended in 1976 to make the 50% ceiling only binding only to banks with R20 million shares. 1990: The Banks Act, No 94 of 1990 was instituted. Foreign banking was permitted to conduct banking operations by means of a branch in South Africa with prior authorisation of the Registrar of Banks. The 1990 Bank Act also authorised the entry of foreign banks into the South Africa banking industry by means of FDI. Local South Africa banks were also granted permission to open foreign branches. By 1993 foreign banks had opened 33 approved local representative offices. In the 2000s, they have been mergers of South African banks with foreign banks (ABSA with Barclay Bank International). However, the South African Banking sector remains relatively oligopolistic. Summary of Trends Stock Market Reform and Liberalisation 1963: JSE becomes a member of the World Federation of Exchanges. 1995: Substantial amendments made to the legislation applicable to stock exchanges which result in the deregulation of the JSE through the introduction of limited liability corporate and foreign membership. 1996: The open outcry trading floor is closed on 7 June and replaced by an order driven, centralised, automated trading system known as the Johannesburg Equities Trading (JET) system. Dual trading capacity and negotiated brokerage is introduced. The value of shares traded annually reaches a new record of R117.4 billion and the new capital raised during the year reaches R28.4 billion. 1997: SENS (Securities Exchange News Service – known then as Stock Exchange News Service), a real time news service for the dissemination of company announcements and price sensitive information, is introduced. SENS ensures early and wide dissemination of all information that may have an effect on the prices of securities that trade on the JSE. 1999: The JSE establishes, in collaboration with South Africa’s four largest commercial banks, the electronic settlement system, STRATE, and the process to dematerialise and electronically settle securities listed on the JSE on a rolling, contractual and guaranteed basis is initiated. 2002: All listed securities are successfully dematerialised and migrated to the STRATE electronic settlement environment, with rolling, contractual and guaranteed settlement for equities taking place five days after trade (T+5). Since the completion of this process, the JSE has had a zero failed trade record, thereby improving market integrity immeasurably and representing a major milestone in winning both local and international investor confidence. The JET system is replaced by the LSE’s SETS system, hosted by the LSE in London.
137 | P a g e
CHAPTER 6
CONCLUSIONS AND POLICY IMPLICATIONS
This chapter summarises the aims of the thesis and the main outcomes
documented in each of the previous chapters. Furthermore, we outline some of the
policy implications of our findings and the direction for future research.
The thesis presents three essays that explore various issues related to the role of
certain initial conditions that define the fundamental structure of the economy, and the
changes in these conditions over time, in explaining the long run economic outcomes.
The first essay, presented in Chapter 3, examines how variations in the initial conditions
across nations can help explain the diverse economic experiences across developing
nations. An understanding of these initial conditions is critical from a policy perspective.
This is because policy makers can then use appropriate policies that engender the
necessary structural changes in the economy to ‘create’ the ‘initial conditions’ that lead
to better outcomes. To that end, the second and the third essay examine how policy or
institutional reforms that alter the initial structural features of an economy can alter the
economic outcomes we find in the first essay. More specifically, the second essay
analyses the outcomes that would result from these structural changes, taking into
account political economy responses that these changes would ignite. The third essay
empirically analyses how the reforms can enhance structural change that is associated
with the reallocation of resources from non-productive to productive firms/sectors of
the economy. This study is based on South Africa, and is, from a methodological point of
view, the only study of this kind for that country.
The first underlying motivation of the thesis pertains to the diverse growth
outcomes of nations around the world, particularly across those commonly classified as
developing economies. This diversity is evident in Maddison’s (2009) global per capita
income data. This diversity has also been documented in studies such as Pritchett
(1997) who shows that in a sample of 108 developing countries, eleven grew faster than
developed countries, while the majority stagnated and sixteen experienced growth
reversals. In fact, this diversity has been accepted as an important feature of modern
138 | P a g e
economic growth. The second motivating empirical observation is the non-convergence
of incomes both within and across nations (see Lipton, 1977; Bourguignon and
Morrison, 1998; Dercon, 2002; Jalan and Ravallion, 1997).
To that end we develop a benchmark model of technology adoption model in
Chapter 3 from which further motivations arose for a political-economy extension,
which is presented in Chapter 4. This benchmark model is a simple stochastic
endogenous growth model, where endogenous growth takes place through human and
physical capital deepening, and agents have heterogeneous initial wealth holdings.
Agents produce output by choosing between two available technologies, one which
superior and the other inferior, with the former technology is subject to an adoption
cost and uncertainty in pay-offs. The model adopts an overlapping generations
structure where technology adoption decisions confront every generation, irrespective
of whether they are cohorts in the line of a dynasty that has already adopted the
superior technology of its time. As discussed earlier, this structure is plausible in so far
as it captures the manner in which a number of modern technologies are adopted. For
example, the adoption of the modern agricultural technologies, commonly known as
high yield varieties (HYVs) requires ‘learning-by-doing’ which is unavoidable
irrespective of whether the previous generation in the dynasty has adopted the
technology. This is mainly because new technologies are invented in each period, and
such technologies are responsive to weather conditions which keep changing from
generation to generation, thereby requiring learning the appropriate amount of inputs
to apply in each weather condition, and each new variety of HYV that is developed.
Similarly, recent technologies such as computers, mobile phones, etc keep on changing
both in terms of social fashion and in software, thereby requiring agents at every
generation to learn how to use the new/upgraded technology. Furthermore, these
forms of technologies have been integrated into other exogenous innovative services
that entail an adoption cost at every generation. For example, internet and mobile
banking incur a ‘learning-by-doing’ cost at every generation, as well as the cost of
upgrading security features.
In relation to the existing literature, the main contribution of the benchmark model
is that technology adoption decisions are taken in an environment which is subject to

139 | P a g e
idiosyncratic shocks. This characterisation of the technology adoption environment is
applicable to many developing countries where there are no developed institutions to
alleviate the risks associated with new technologies.
In terms of the outcomes of the benchmark model, the inclusion of risk sharpens
the predictions of the model in a number of useful ways. Firstly, in the absence of
idiosyncratic uncertainty, the models shows that three major outcomes are possible
depending on the initial levels and differences of the productivities associated with the
superior and inferior technologies, and the cost of adopting the superior technologies.
These are labelled as poverty trap, dual economy, and balanced growth. In the presence
of idiosyncratic uncertainty, the poverty trap and the dual economy outcomes each has
‘sub-outcomes’. Each of these outcomes and ‘sub-outcomes’ are associated with its
unique set of productivity and adoption parameters and shows its own unique growth
and inequality patterns. Thus our model suggests the existence of a diversity within
diversity, which has not been captured previously with a single, unified framework
The diversity within diversity feature entails that nations may be ‘caught’ at
comparable levels of development, but the underlying initial conditions and the
transitional path of growth and inequality might differ between these countries. For
instance, countries such as Mozambique and Malawi are both considered to be in
poverty traps (see Pritchett, 1997). However, the general economic performance for the
period 1990 – 2005 has been much better in Malawi (see Ortiz and Cummins, 2011),
suggesting that the two poverty traps are potentially driven by different initial
conditions. Similarly, countries such as South Africa and Brazil are comparable as they
are both considered to be dual economies. However, Brazil has performed better in
terms of growth and inequality since 1980.68 Furthermore, inequality has declined in
Brazil since the late 1980s. This provides indirect support to the finding in one of our
‘sub-outcomes’ that the dual economy is not always associated with an increase in
inequality.
68 Comparison based data on growth and inequality from World Development Indicators, World Databank (2012) and (see Ortiz and Cummins, 2011)

140 | P a g e
Secondly, and most importantly, changing the uncertainty parameter while
holding all the other parameters of the model constant affects the timing of technology
adoption decisions and the long run levels of technological progress. Consequently,
uncertainty influences both the transitional path of growth and inequality, and the long
run economic outcomes of a nation. This suggests that some developing nations could
fall into poverty traps because agents are unwilling to adopt high-risk high-return
technologies in the absence of institutions that help alleviate the risk associated with
these technologies. Evidence of risk-induced poverty traps has been documented for
Ethiopia and Malawi (see Gine and Yang, 2007; Dercon, 2012).
In this essay, we also provide empirical evidence suggesting that risk affects short
run technology adoption decisions and the long-run technology adoption outcomes. Our
evidence is based on a technology adoption index (TAI) that captures various aspect of
technology adoption in agriculture. It is constructed using yearly Indian data for the
period 1965-2001.
In terms of policy implications, the outcomes of this model suggest that in order to
promote growth, and to reduce both intra-country and cross-country inequality, nations
should ensure that they create appropriate initial conditions. This entails improving the
state of technologies available in the nation, and addressing the barrier (e.g. adoption
cost and risk) that constrains the adoption of superior technologies. To that end, there
are a number of practical steps that a nation can undertake to improve the state of the
technologies available in the economy and the adoption of superior technologies. These
include, among others, investing in R&D, human capital development, and physical
capital deepening. Furthermore, effort should be made to protect the poor agents from
technology-specific and other macroeconomic shocks. This can be through establishing
shock-relief funds and technology-related insurance schemes. Likewise, strengthening
the broader institutions that shield the agents (particularly those at the bottom end of
the distribution) from both domestic and external shocks could improve the adoption of
superior technologies by the poor agents.
Another implication is that, in light of the diversity within diversity feature of the
model with idiosyncratic uncertainty, general application of policies, especially at
141 | P a g e
international level, should be subject to caution. Usually, the broad policies that are
applied by the Bretton Woods institutions (the International Monetary Fund and the
World Bank) are based on classifying developing nations as low-income or middle-
income. However, policies of this nature have failed in some developing nations. A
common example of policies that have failed in some developing nations is the
structural adjustment programmes (SAPs) (see Dollar and Svensson, 2000 and
references therein). Our model suggests that, appropriate policy responses for bad long
run outcomes and ‘sub-outcomes’ should be based on a clear-cut and precise
understanding of the initial conditions that underlie each of those specific outcomes or
‘sub-outcomes’.
Another important policy implication stems from the fact that irrespective of the
availability of the institutions that reduce the barrier (i.e. adoption cost and risk) to
technology adoption, the inequality outcomes of our benchmark model are persistent,
except under the poverty trap outcome and ‘sub-outcomes’. This feature arises because
the initial wealth holdings of agents are heterogeneous and, as such, they switch to the
more productive technologies at different times. As argued earlier, high inequality
creates the potential for class conflicts. An obvious solution is redistribution in the form
of taxation. However, in the presence of inequality, the form in which the revenues
generated from taxation are redistributed are a subject of contention, particularly in
democratic societies.
Specifically, in order to implement the policy proposals suggested in the previous
two paragraphs, a nation has to undertake some form of reform. Often these reforms
affect the preferences of agents differently thereby creating new conflicts in the
economy and new implications for technology adoption decisions, economic growth,
and inequality. This, essentially, is the motivation underlying the political economy
extension of the benchmark model presented in Chapter 4.
In particular, the extension considers a situation where there are financial
intermediaries that accept the risk associated with the high-risk high-return technology
in return for a fixed entry fee and a periodic variable fee. The fixed entry fee implicitly
includes the cost of adopting the high-risk high-return technology. To introduce
142 | P a g e
political economy aspects in the model, we ‘endogenize’ the fixed entry cost by
assuming that it depends on the proportion of government tax revenue that is spent on
R&D and cost-reducing financial development expenditure which, in turn, is determined
through a political process. The political outcomes are mostly determined by majority
vote. The remaining proportion of the revue is the redistributed to the agents in the
form of a lump sum transfer.
The outcomes of the model show that, in the presence of shocks, changes in the
preferences of the agents are such that agents at the top and bottom ends of the
distribution benefit from a lump-sum transfer more than they would benefit from cost-
reducing expenditure on R&D and financial development. Together these ‘ends’
constitute a majority which blocks cost-reducing expenditure policies preferred by the
‘middle’ at the early and transitional stages of the economy. Because of this, technology
adoption and institutional development are slowed down relative to the ‘optimal
scenario’ in which a social planner chooses the policy that maximizes the collective
welfare of the agents.
The implication of this outcome is that the political/social conflicts that are
endogenous in democracies may delay the implementation of growth-oriented policies.
This finding is in line with the idea that democracy may create redistribution pressures
that are harmful to growth (see Aghion, Alesina and Trebb, 2004; Boix, 2003).
Furthermore, this finding lends indirect support to an ‘untested’ argument that China’s
success over India might be due to the difficulties experienced in passing growth-
oriented policies in the latter economy (see Huang, 2011).
The political economy model also shows some interesting features relative to
related literature. Chief among these features is the existence of political cycles. These
cycles emanate from two main sources. Firstly, they emanate from the fact that, in a
dynamic model with political economy aspects, there is a two-way link between
inequality and redistribution. Inequality induces redistribution through the political
process, resulting in a reduction in inequality. The resulting reduction in inequality then
reduces the preference for redistribution in the next period which may result in an
143 | P a g e
increase in inequality. Secondly, the presence of uncertainty induces precautionary
voting thereby initiating or augmenting political cycles.
The presence of these political cycles results in recurring inverted-Kuznets-curve
patterns in growth and inequality. Therefore, the relationship between growth and
inequality in the transitional process is non-linear and bidirectional. In light of this
finding, empirical models that impose a linear and unidirectional relationship between
growth and inequality should be interpreted with caution.
However, once the economy has reached the steady state, growth starts increasing
steadily while inequality converges to zero. This suggests that once distribution has
taken place and inequality is low, the political/social conflicts among different groups of
agents become minimal. This result highlights the fact that redistribution is not
necessarily harmful for long run growth, as in models like Li and Zou (1998).
The third essay examines the role of reforms commonly known as ‘financial
globalisation’, in promoting efficient intra-sector and inter-sector reallocation of capital.
This essay focuses on South Africa, for which no related studies using a similar
methodology exist. Our focus on intra-sector and inter-sector aspects of the reallocation
of capital is quite appealing because it allows us to interpret our results in the context of
the reallocation of resources suggested in the classical economic development literature
(see Rostow, 1960; Kuznets, 1966; Chenery and Syrquin, 1975). Related existing studies
cannot be directly interpreted in this manner because they have focussed of economy-
wide firm level reallocation of capital. The main finding of this essay is that reforms,
along with other factors such as institutional quality and human capital development
enhance efficient reallocation of capital within and across sectors. As argued earlier, the
two latter factors are also important for successful technology adoption. Therefore,
these factors should be used in addition with others if long term growth is to be
promoted.
Furthermore, we find that the reallocation-benefits of globalisation are stronger at
the inter-sector than intra-sector level. The implication of this finding is that, barriers to
free movement of resources across firms in different sectors may limit the benefits of
reforms. Consequently, in order to improve the gains from financial globalisation, policy

144 | P a g e
makers should tackle market-structure-based as well as institution-based barriers to
resource reallocation.
The three essays presented in this thesis provide a number of useful directions for
future research. In what follows, we outline some of these directions. We begin with the
research issues that stem from the essay which presents our benchmark model of
technology adoption.
The benchmark model considers an environment where agents face shocks. A key
assumption that we have made is that all agents are risk-averse. However, it possible
that risk preferences could vary across agents as in the investment and finance
literature (see Ghosh, 1994). In this regard, it is interesting to explore whether the long
run outcomes of our model would differ if we allow risk preferences to vary across
agents. Furthermore, our model assumes that the shocks that affect the returns on the
productive technology are known with some objective probabilities. Nevertheless,
shocks such as droughts and global crises happen in an unexpected fashion, in which
case the probabilities of the shocks become subjective. This idea is commonly referred
to as ‘ambiguity’ in behavioural economics (see Heath and Tversky, 1991; Fox and Tversky,
1995; Chow and Sarin, 2002) and has been empirically documented in Ethiopia in the
context of agricultural technology adoption (see Akay et al., 2009).
Secondly, in the benchmark model, we have assumed that the adoption cost does
not vary overtime. However, this cost could vary overtime, not only due to politico-
economy issues as it the extension presented in Chapter 4, but due to other institutional
and structural changes. For instance, the relaxation of trade restrictions that allows free
inflow foreign technologies could affect the adoption cost. It is therefore of interest to
explore a situation in which the adoption cost is stochastic.
The essay in Chapter 3 also raises a number of issues that are worthy of exploring
empirically. Although the empirical analysis conducted in this essay provides important
insights with regards to the role of risk on short run and long run technology adoption,
the analysis is constrained by data limitations. Once data becomes available, it would be
interesting to examine the implication of the empirical findings on the relationship
145 | P a g e
between growth and inequality both in the short run and long run. It would also be
interesting to conduct similar empirical analyses for countries at different levels of
development to see whether the results would differ.
The political economy model presented in Chapter 4 also provides interesting
issues that will be worth exploring in the future. Firstly, we have assumed that the tax
on agents is a constant proportion of their incomes. It will be interesting to explore
other cases where, for instance, the tax structure is more progressive. Secondly, we
assume that redistribution only occurs through cost-reducing financial development
expenditure and transfer payments. However it is also possible to redistribute through
investment in human capital development through expenditure on education, health,
and other social services. Thirdly, the political economy model produces political cycles,
unique inequality patterns, as well as some interesting insights into the relationship
between growth and inequality. Empirically examining these issues will be an
interesting direction for further research.
Pending the availability of adequate data, two issues from the empirical essay in
Chapter 5 are worthy of exploration in the future. These include analysing whether the
effect of financial globalisation on the efficient reallocation of capital varies between
exporting and non-exporting firms, and between large and small firms. Furthermore, it
could be useful to extend the analysis to non-listed firms and the informal sector.
However, given that it is difficult to obtain secondary data for non-listed firms and firms
in the informal sector, this would entail conducting a survey based analysis.
Finally, future research could try to explicitly explore the link between the
financial globalisation explored in the Chapter 5, and the technology adoption issues
explored in the Chapters 3 and 4. Theoretically, there are a number of possible channels
through which financial globalisation can influence technology adoption. Firstly,
financial globalisation often improves the functioning of financial markets. This in turn
improves the ability of financial markets to signal the sectors of the economy in which
new technologies are valued most. As a result, this creates incentives for technological
innovation. Secondly, globalisation promotes competition in the capital markets thereby
reducing the cost of borrowing. In this regard, financial globalisation could improve

146 | P a g e
technology adoption as agents can ‘cheaply’ borrow to invest in human capital
deepening. Thirdly, competition within the financial system may promote financial
innovation resulting in the creation of financial products that help to alleviate the risk
associated with new technologies. Finally, since the reforms also reduce restriction on
capital flows, it could promote FDI, a flow that often embodies the transfer of
technologies from developed to developing/transitional economies. We leave these
issues for future research.
147 | P a g e
REFERENCES Abel, A. B. and Blanchard, O. J. (1983). An intertemporal model of savings and investment.
Econometrica, 51, 3, 675-692.
Abiad, A., Oomes, N., and Ueda, K., 2008. The quality effect: Does financial liberalisation improve the allocation of capital. Journal of Development Economics, 87, 270 – 282.
Acemoglu, D. 2002. Technical Change, Inequality and the Labor Market. Journal of Economic Literature, 40, 7 – 72.
Acemoglu, D. and Robinson, J.A. (2000). Political Losers as a Barrier to Economic Development. American Economic Review Papers and Proceedings, 90, 126 – 130.
Acemoglu, D. and Robinson, J.A. (2006). Economic Backwardness in Political Perspective. American Political Science Review, 100, 115 – 131.
Acemoglu, D.S. Johnson, S. and Robinson, J.A. (2005). Institutions as the Fundamental Cause of Long-Run Growth. In P. Aghion and S. Durlauf (eds.) Handbook of Economic Growth. North Holland.
Agénor, P. R. (2002). Macroeconomic adjustment and the poor: Analytical issues and cross-country evidence. World Bank, Working Paper No: WPS2788.
Agénor, P. R. (2003). Benefits and Costs of International Financial Integration: Theory and Facts. The World Economy, 26 (8): 1089 – 1118.
Aghion, P., Alesina, A., and Trebbi, F. (2004). Endogenous Political Institutions. Quarterly Journal of Economics, 119(2), 565-611.
Aghion, P., Alesina, A., and Trebbi, F. (2007). Democracy, Technology, and Growth. NBER Working Paper No. 13180.
Aghion, P. and Bolton, P. (1992). Distribution and Growth in Models of Imperfect Capital Markets. European Economic Review, 36, 603 – 611.
Aghion, P. and Bolton, P. (1997). A Theory of Trickle Down Effect and Development. Review of Economic Studies, 64(2). 151 – 172.
Aghion, P. and Howitt, P. (1992). A model of growth through creative destruction. Econometrica. 60 (2), 323-352.
Aghion, P., Howitt, P. (1998). Endogenous growth theory. Cambridge and London: MIT Press.
Akay, A., Martinsson, P., Medhin, H. and Trautmann, S. (2009). Attitudes Toward Uncertainty Among the Poor: Evidence from Rural Ethiopia. IZA Discussion Paper No. 4225.
Akita, T. (2003). Decomposing regional income inequality in China and Indonesia using two-stage nested Theil decomposition method. The Annals of Regional Science, 37(1), 55-77.
Alesina, A. and Rodrik, D. (1994). Distributive Politics and Economic Growth. Quarterly Journal of Economics, 109(2), 465 – 490.
148 | P a g e
Almeida, H. and Wolfenzon, D. (2005). The Effect of External Finance on the Equilibrium Allocation of Capital. Journal of Financial Economics, 75, 133 – 64.
Anderson, K. (2003). Agriculture and Agricultural Policies in China and India post-Uruguay Round. Discussion Paper No. 0319. Centre for International Economic Studies, University of Adelaide, Adelaide, Australia.
Ang, J. B. and Madsen, J. B. (2012). Risk Capital, Private Credit and Innovative Production. Canadian Journal of Economics, 45(4), 1608-1639.
Ang, J. B. and Madsen, J. B. (2012). Imitation versus Innovation in an Aging Society: International Evidence since 1870. Monash Economics Working Papers 45-12, Monash University, Department of Economics.
Ang, J. B. and McKibbin, W. J. (2007). Financial Liberalization, Financial Sector Development and Growth: Evidence from Malaysia. Journal of Development Economics, 84, 215 – 33.
Archibugi, D. and Coco, A. (2005). Measuring Technological Capabilities at the Country Level: A Survey and a Menu for Choice. Research Policy, 34, 175 – 194.
Arellano, M. and Bond, S. (1991). Some tests of specification for panel data: Monte Carlo Evidence and an application to employment equations. Review of Economic Studies, 58(2), 277 – 297.
Asteriou, D. and Price, S. (2005). Uncertainty, investment and economic growth: Evidence from a dynamic panel. Review of Development Economics, 9(2), 277 – 288.
Atkinson, A. B. and Stiglitz, J. (1980). Lectures on Public Economics. McGraw-Hill, MA.
Atkinson, A. B., Piketty, T. and Saez, E. (2011). Top Incomes in the Long Run of History. Journal of Economic Literature, 49, 3 – 71.
Aziz J. and Wescott, R. (1997). Policy Complementarities and the Washington Consensus. IMF Working Paper No. 118.
Bailliu, J. (2000). Private Capital Flows, Financial Development, and Economic Growth in Developing Countries. Bank of Canada Working Paper No. 2000. Ontario Canada: Bank of Canada.
Banerjee, A. and Newman, A. (1991). Risk Bearing and the Theory of Income Distribution. Review of Economic Studies, 58, 211 – 235.
Banerjee, A. V. and Duflo, E. (2003). Inequality and growth: What can the data say? Journal of Economic Growth, 8, 267–299.
Banerjee, A.V. and Newman, A. (1993). Occupational Choice and the Process of Development. Journal of Political Economy, 101, 274 – 298.
BankersAlmanac, 2012. Top banks in the world. Online. Available: http://www.bankersaccuity.com.
149 | P a g e
Bardhan, P., Bowles, S. and Gintis, H. (2000), Wealth Inequality, Wealth Constraints and Economic Performance. In Handbook of Income Distribution, Vol. 1, ed. Anthony Barnes Atkinson and Francois Bourguignon, 541 – 603. Elsevier, Amsterdam.
Barro, R.J. (1990). Government Spending In a Simple Model of Endogenous Growth. The Journal of Political Economy, 98 (5), 103 – 125.
Barro, R.J. (1991). Economic Growth in a Cross Section of Countries. Quarterly Journal of Economics, 106, 407 – 444.
Barro, R.J. (1996). Democracy and Growth. Journal of Economic Growth, 1, 1-27.
Barro, R. J. (2000). Inequality and Growth in a Panel of Countries. Journal of Economic Growth, 5(1), 5 – 32.
Barro, R.J. and Sala-i-Martin, X. (1990). Economic Growth and Convergence across the United States. NBER Working Paper No. 3419.
Barro, R. J. and Sala-i-Martin, X. (1992). Convergence. Journal of Political Economy, 100(2), 223 – 251.
Basu, S. and Wei, D.N. (1998). Appropriate Technology and Growth. The Quarterly Journal of Economics, 113(4), 1025-1054
Batuo, M.E., Guidi, F., and Mlambo, K. (2010). Financial Development and Income Inequality: Evidence from African countries. African Development Bank.
Baumol, W. (1986). Productivity Growth, Convergence, and Welfare: What the Long-Run Data Show?’, American Economic Review, 76 (5), 1072-1085.
Beck, T. R. Levine, R. and Loayza, N. (2000). Financial development and the sources of growth. Journal of Financial Economics, 58, 261-300.
Bénabou, R. (1996). Inequality and Growth. In Bernanke, B. and J. Rotemberg (eds.), NBER Macro Annual 1996, MIT Press: Cambridge, MA: 11-76.
Benabou, R. (2000). Unequal Societies: Income Distribution and the Social Contract. American Economic Review 90, 96-129.
Benhabib, J. and Spiegel M. M. (1998). Cross-country Growth Regressions. Mimeo.
Bittencourt, M. F. (2009). Financial Development and Inequality: Brazil 1985-99. The Developing Economies, 47 (1), 30 – 52.
Blackburn, K. and Ciprian, G.P. (2002). A Model of Longevity, Fertility, and Growth. Journal of Economic Dynamics and Control, 26, 187 – 204.
Blanchard, O., Rhee, C., and Summers, L. (1993). The Stock Market, Profit, and Investment. Quarterly Journal of Economics, 108(1), 115 – 36.
Bloom, N. (2009). The Impact of Uncertainty Shocks. Econometrica, 77(3), 623 – 685.
150 | P a g e
Boileau, M. and Normandin, M. (1999). Capacity Utilization and the Dynamics of Business Cycle Fluctuations. Working Paper No. 99-12. Centre for Economic Analysis. University of Colorado Boulder.
Boix, C. (2003). Democracy and Redistribution. Cambridge University Press.
Bolt, J. and van Zanden, J. L. (2013). The First Update of the Maddison Project; Re-Estimating Growth Before 1820. Maddison Project Working Paper 4.
Bosworth, B. and Collin, S.M. (2008). Accounting for Growth: Comparing China and India. Journal of Economic Perspective, 22(1), 45–66.
Boucekkine R., de la Croix D. and Licandro, O. (2002). Vintage human capital, demographic trends and growth. Journal of Economic Theory, 104, 340- 375.
Bourguignon, F. and Morrison, C. (2002). Inequality among world citizens 1820-1993. American Economic Review, 92(4) 727-745.
Brandolini, A. (1999). The Distribution of Personal Income in Post-War Italy: Source Description, Data Quality, and the Time Pattern of Income Inequality. Temi di Discussione n. 350, Banca d’Italia, Rome.
Brooks, C. (2008). Introductory Econometrics for Finance. Cambridge: Cambridge University Press.
Burki, S. J. and Edwards, S. (1995). Latin America after Mexico: Quickening the Pace. Current Issues Paper. Washington, D.C. The World Bank, Latin America and the Caribbean Region Technical Department.
Calderón C. and Serven, L. (2003), Macroeconomic Dimensions of Infrastructure in Latin America. mimeo. The World Bank.
Canton, E.J.F., Groot, H.L.F., Nahuis, R. (2002). Vested Interests, Population Ageing and Technology Adoption. European Journal of Political Economics, 18, 631 - 652.
Caplan, B. (2002). Systematically biased beliefs about economics: robust evidence of judgmental anomalies from the survey of Americans and economists on the economy. Economic Journal, 112, 433-458.
Caplan, B. (2002). Systematically biased beliefs about economics: robust evidence of judgmental anomalies from the survey of Americans and economists on the economy. Economic Journal, 112, 433-458.
Caselli, F. (1999). Technological Revolutions. American Economic Review, 89, 78–102.
Caselli, F., Coleman, W.J. (2001). The US Structural Transformation and Regional Convergence. Journal of Political Economy, 109, 3, 584-616.
Cass, D. (1965). Optimum growth in an aggregative model of capital accumulation. Review of Economic Studies, 32, 233-240.
151 | P a g e
Casteleign, A. (2001). South African Monetary Policy Framework. Conference Papers on the Monetary Policy Frameworks in Africa, Pretoria South Africa. South African Reserve Bank.
Cavalletti, M. and Sunde, U. (2005). Human Capital Formation, Life Expectancy and Process of Economic Development. American Economic Review, 95, 1653 – 1672.
Chakraborty, S. and Das M. (2005). Mortality, human capital and persistent inequality. Journal of Economic Growth, 10(2), 159 – 192.
Chand, R., Raju, S. S., Garg, S. and Pandey, L. M. (2011). Instability and Regional Variation in Indian Agriculture, National Centre for Agricultural Economics and Policy Research, Policy Paper No. 26.
Chari, A. and Henry P. B., (2004a). Risk Sharing and Asset Prices: Evidence from a Natural Experiment. Journal of Finance, 59(3), 1295–324.
Chari, A. and Henry, P. B. (2004b). Is the Invisible Hand Discerning or Indiscriminate? Investment and Stock Prices in the Aftermath of Capital Account Liberalizations. NBER Working Paper No. 10318.
Chenery, H. B., and Syrquin, M. (1975). Patterns of Development, 1957–1970. London: Oxford University Press.
Chinn, M. D. and Ito, H. (2008). A New Measure of Financial Openness. Journal of Comparative Policy Analysis, 10(3), 307 – 320.
Cho, Y. J. (1988). The Effect of Financial Liberalization on the Efficiency of Credit Allocation. Journal of Development Economics, 29, 101 – 110.
Chow, C. and Sarin, R. (2002). Known, unknown, and unknowable uncertainties. Theory and Decision, 52, 127 – 138.
Christiano, J.C. and Fischer, J. (1995). Tobin's q and Asset Returns: Implications for Business Cycle Analysis. NBER Working Paper No. 5292.
Chusseau, N. and Lambrecht, J. (2012). Inequality in Emerging Countries, ECINE Working Paper No. 258.
Ciccone, A., and Matsuyama, K. (1996). Start-up Costs and Pecuniary Externalities as Barriers to Economic Development. Journal of Development Economics, 49(1), 33 – 59.
Clark, C. (1940). The conditions of economic progress. (3eds). London. Macmillan and Co.
Clarke, G.R.G. (1995). More Evidence on Income Distribution and Growth. Journal of Development Economics, 47, 403 – 28.
Coe, D., and Helpman, E. (1995). International R&D Spillovers. European Economic Review, 39, 859 – 887.
Collier, P. and Dollar, D. (1999). Aid allocation and Poverty Reduction. Policy Research Working Paper, No. 2041, World Bank.
Corneo, G. and Grüner, H.P. (2002). Individual Preferences for Political Redistribution, Journal of Public Economics, 83, 83-107.

152 | P a g e
Cornia, G. A. (2003). The Impact of Liberalization and Globalization on Income Inequality in Developing and Transitional Economies. Working Paper No.14. Geneva: International Labour Office.
Cortuk, O. and Singh, N. (2011). Structural change and growth in India. Economics Letters, 110(3), 178 – 181.
Dasgupta, B. and Ajwad, M. I. (2011). Income Shocks Reduce Human Capital Investments: Evidence from Five East European Countries. Policy Research Working Paper No. 5926. World Bank.
De Gregorio, J. (1998). Financial integration, financial development and economic growth. Estudios de Economia, 26(2), 137 – 161.
De Gregorio, J. and Guidotti, P. E. (1995). Financial Development and Economic Growth. World Development, 23(3), 433 – 448.
de la Croix, D. and Licandro, O. (2001). Growth Dynamics and Education Spending: The Role of Inherited Tastes And Abilities. European Economic Review, 45(8), 1415–1438.
De Long, B. (1988). Productivity Growth, Convergence, and Welfare: Comment. American Economic Review, 78, 1138 – 1154.
Deininger, K. and Squire, L. (1996). A New Data Set Measuring Income Inequality. World Bank Economic Review, 10(3), 565-91.
Demetriades, P.O. and Luintel, K.B. (2001). Financial Restraint in the South Korea Miracle. Journal of Development Economics, 64, 459 – 479.
Demombynes, G. and Özler, B. (2002). Crime and Local Inequality in South Africa. Journal of Development Economics, 76(2), 265 – 292.
Dercon, S. (2002). Income Risk, Coping Strategies and Safety Nets. World Bank Research Observer, 17 (2), 141 – 166.
Dercon, S. and Christiaensen, L. (2011). Consumption Risk, Technology Adoption and Poverty Traps: Evidence from Ethiopia. Journal of Development Economics, 96(2), 159 – 173.
Dinar, A., Campbell, M. and Zilberman, D. (1992). Adoption of Improved Irrigation and Drainage Reduction Technologies under Limiting Environmental Conditions. Environmental & Resource Economics, 2(4), 373 – 398.
Dollar, D. and Svensson, J. (2000). What Explains the Successes and Failures of Structural Adjustment Programmes? The Economic Journal, 110, 894 – 917.
Dorwick, S. and Nguyen, D. (1989). OECD Comparative Economic Growth 1950 – 1985: Catch Up and Convergence. American Economic Review, 79, 1010 – 1030.
Dridi, C. and Khanna, M. (2005). Irrigation Technology Adoption and Gains from Water Trading under Assymetric Information. American Journal of Agricultural Economics, 87, 289 – 301.

153 | P a g e
Dunteman, G. H. and Lewis-Beck, M. S. (1989). Principal Components Analysis: Quantitative Applications in the Social Sciences Series. eds (1), Sage Publications Inc.
Edwards, S. (1995). Crisis and reform in Latin America: From despair to hope. The World Bank. Oxford University Press.
Epple, D., Romano, R.E. (1996). Ends against the middle: Determining public service provision when there are private alternatives. Journal of Public Economics, 62 (3), 297–326.
Fagerberg, J. And Verspagen, B. (1996). Heading for Divergence? Regional Growth in Europe Reconsidered. Journal of Common Market Studies, 34(3), 431-448.
Fan, S., Zhang, X. and Robinson, S. (2003). Structural Change and Economic Growth in China. Review of Development Economics, 7(3), 360–377.
Farrell, G.N. and Todani. K.R. (2004). Capital Flows, Exchange Control Regulations and Exchange Rate Policy: The South African Experience. South African Journal of Economic History, 21(12), 84-123.
Feder, G. (1980). Farm Size, Risk Aversion and the Adoption of New Technology under Uncertainty. Oxford Economic Papers, 32, 263 – 283.
Feder G. (1986). Growth in Semi-Industrial Countries, A Statistical Analysis. In H.B. Chenery, S. Robinson and M. Syrquin, Industrialization and Growth, New York, Oxford University Press.
Feder, G. and Just, R. E. and Zilberman, D. (1985). Adoption of Agricultural Innovations in Developing Countries: A Survey. Economic Development and Cultural Change, 33(2), 255 – 298.
Feder, G., and Slade, R. (1984). The Acquisition of Information and Technology Adoption. American Journal of Agricultural Economics, 66(3), 312-320.
Fischer, S., Sahay R., and Vegh C.A. (1996). Stabilization and Growth in Transition Economies: The Early Experience. Journal of Economic Perspective, 10, 45–66.
Fishelson, G. and Rymon, D. (1989). Adoption of Agricultural Innovation: The Case of Drip Irrigation of Cotton in Israel. Technological Forecasting and Social Change, 35, 375-382.
Fisher, A.G.B. (1939). Primary, Secondary and Tertiary Production. Economic Record, 15, 24 – 38.
Forbes, K. (2007). One Cost of the Chilean Capital Controls: Increased Financial Constraints for Smaller Traded Firms. Journal of International Economics, 71, 294 – 323.
Forbes, K.J. (2000). A Reassessment of the Relationship between Inequality and Growth. The American Economic Review, 90(4), 869 – 87.
Fox, C. and Tversky, A. (1995). Ambiguity Aversion and Comparative Ignorance. The Quarterly Journal of Economics, 110, 585 – 603.

154 | P a g e
Frankel, M. (1962). The Production Function in Allocation of Growth: A Synthesis. American Economic Review, 52, 995 – 1022.
Galindo, A., Schiantarelli, F. and Weiss, A. (2007). Does Financial Liberalization Improve the Allocation of Investment? Micro Evidence from Developing Countries. Journal of Development Economics, 83, 562 – 587.
Galor O. and Mayer-Foulkes, D. (2004). Food for Thought: Basic Needs and Persistent Educational Inequality, mimeo, Brown University.
Galor, O. and Zeira, J. (1993). Income Distribution and Macroeconomics. Review of Economic Studies, 60, 35 – 52.
Gertler, M. and Rose, A. (1994). Finance, Public Policy, and Growth. In Caprio, G. Atiyas, I., and Hanson, J., Financial Reform: Theory and Experience, New York, NY, Cambridge University Press.
Ghosh, S., McGuckin, T. and Kumbhakar, S.C. (1994). Technical Efficiency, Risk Attitude, and Adoption Of New Technology - The Case Of The United-States Dairy-Industry. Technological Forecasting and Social Change, 46 (3), 269 – 278.
Gine, X. and Yang, Y. (2007). Insurance, credit, and technology adoption: field experiment evidence from Malawi. The World Bank, Working Paper No. WPS4425.
Glomm, G. and Palumbo M. (1993). Optimal intertemporal consumption decisions under the threat of starvation. Journal of Development Economics, 42(2), 271 – 291.
Glomm, G. and Ravikumar, B. (1992), ‘Public versus private investment in human capital: Endogenous growth and income inequality’, Journal of Political Economy, 100(4). 818 – 834.
Glomm, G. and Ravikumar, B. (1992), ‘Public versus private investment in human capital: Endogenous growth and income inequality’, Journal of Political Economy, 100(4), 818 – 834.
Goldsmith, R. (1969). Financial Structure and Development New Haven: Yale University Press.
Goldsmith, R.W. (1969). Financial Structure and Development, New Haven, CT: Yale University Press.
Gollin, D., Parente, S. and Rogerson, R. (2002). The Role of Agriculture in Development. American Economic Review, 92(2), 160 – 164.
Greenwood, J. and Yorukoglu, M. (1997). ‘1974’. Carnegie-Rochester Conference Series on Public Policy, 46. 49 – 95.
Greenwood, J., and Jovanovic, B. (1990). Financial Development, Growth and the Distribution of Income. Journal of Political Economy, 98, 1076 – 1107.
Grossman, G. and E. Helpman (1991). Innovation and growth in the global economy. Cambridge, MA. MIT Press.
155 | P a g e
Guttman, L. 1954. Some necessary conditions for common factor analysis. Psychometrika, 19, 149 – 162.
Ha, J. and Howitt, P. (2007). Accounting for Trends in Productivity and R&D: A Schumpeterian Critique of Semi-Endogenous Growth Theory. Journal of Money Credit and Banking, 39, 733 – 774.
Haber, S. (2008). The Finance Growth Nexus: Theory, Evidence, and Implications for Africa. Paper Presented at the Conference on African Finance for the 21st Century, Tunis, 4-5th March, 1 – 35.
Hall, R. E., and Jones, C. I. (1999). Why do some countries produce so much more output per worker than others? Quarterly Journal of Economics, 114(1), 83 – 116.
Hansen, G.D. and Prescott, C.E. (2002). Malthus to Solow. American Economic Review, 92(4), 1205 – 1217.
Hari, K.S. (2002). Structural Transformation in an Agrarian Economy: A Study of India, 1970–2000. Centre for Development Studies, Trivandrum, Kerala, India.
Harrison, A., Love, I. and McMillan, M. (2004). Global Capital Flows and Financing Constraints. Journal of Development Economics, 75(1), 269 – 301.
Hayashi, F. (1982). Tobin’s Marginal q and Average q: A Neoclassical Reinterpretation, Econometrica, 50, 213-224.
He, H. and Liu, Z. (2008). Investment-Specific Technological Change, Skill Accumulation, and Wage Inequality, Review of Economic Dynamics, 11, 314 – 334.
Heath, C. and Tversky, A., 1991. Preference and belief: Ambiguity and competence in choice under uncertainty. Journal of Risk and Uncertainty 4, 5-28.
Henry, P. B. (2007). Capital Account Liberalisation: Theory, Evidence, and Speculation. Journal of Economic Literature, 45, 887 – 935.
Hiebert, L. D. (1974). Risk, Learning, and the Adoption of Fertilizer Responsive Seed Varieties. American Journal of Agricultural Economics, 56, 764 – 768.
Hochman, H.M. and Rodgers, J.D. (1969). Pareto Optimal Redistribution, American Economic Review, 59, 542-557.
Huffman, G., 1997. An equilibrium analysis of central bank independence and inflation. Canadian Journal of Economics 30, 943–958.
Holmes, T.J. and Schmitz, J. A. (1995). Resistance to new technology and trade between areas. Federal Reserve Bank of Minneapolis, Quarterly Review, 19(1), 2 – 17.
Holtz-Eakin, D., Newey, W. and Rosen, H. (1988). Estimating Vector Autoregressions with Panel Data. Econometrica, 56(6), 1371 – 1395.
Hornstein, A. and P. Krusell (1996). Can Technology Improvements Cause Productivity Slowdowns? NBER Macroeconomics Annual 11 (MIT Press: Cambridge MA), 209 – 259.
156 | P a g e
Howitt, P. (2007). Innovation, Competition and Growth: A Schumpeterian Perspective on Canada’s Economy. Commentary No. 246, C.D. Howe Institute.
Huang, Y. (2011). Does Democracy Stifle Economic Growth? Public Lecture, Massachusetts Institute of Technology.
Isik, M., and Khanna, M. (2003). Stochastic technology, risk preferences, and adoption of site-specific technologies. American Journal of Agricultural Economics, 85,305 – 17.
Jain, R., Arora, A. and Raju, S.S. (2009). Novel Adoption Index of Selected Agricultural Technologies: Linkages with Infrastructure and Productivity. Agricultural Economics Research Review, 22, 109 – 120.
Jensen, R. (1982). Adoption and Diffusion of an Innovation of Uncertain Profitability. Journal of Economic Theory, 27(1), 182 – 193.
Johansen, S. and Juselius, K. (1990). The Full Information Maximum Likelihood Procedure For Inference On Cointegration: With applications to the demand for money. Oxford Bulletin of Economics and Statistics, 52, 169 – 210.
Jones, C. I. (1995). Time Series Tests of Endogenous Growth Models. Quarterly Journal of Economics, 110, 495 – 525.
Jovanovic, B. and Rousseau, P. (2002). The Q-theory of mergers. American Economic Review, 92 (2), 198 – 204.
Just, R. E. and Zilberman, D. (1983). Stochastic Structure, Farm Size and Technology Adoption in Developing Agriculture. Oxford Economic Papers, 35(2), 307 – 328.
Kaplan, S. and Zingales, L. (1997.) Do Investment-Cash Flow Sensitivities Provide Useful Measures of Financing Constraints? Quarterly Journal of Economics, 112, 159 – 216.
Kaplan, S. and Zingales, L. (2000). Investment-Cash Flow Sensitivities are Not Valid Measures of Financing Constraints. Quarterly Journal of Economics, 115, 707 – 712.
Katchanovski, I. (2000). Divergence in Growth in Post-Communist Countries. Journal of Public Policy, 10(1), 55 – 81.
Keefer, P. and Knack, P. (1997). Why don’t poor countries catch up? A Cross-National Test Of An Institutional Explanation. Economic Inquiry, 35(3), 590-602.
Kemp, M. C. and Wan, H. Y. (1974). Hysteresis of Long-Run Equilibrium from Realistic Adjustment Costs. In G. Horwich and P.A. Samuelson (eds.). Trade, Stability and Macroeconomics, New York, New York Academic Press, 221-242.
Khan, A. and Ravikumar, B. (2002). Costly Technology Adoption and Capital Accumulation. Review of Economic Dynamics, 5, 489 – 502.
King, R. G. and Levine, R. (1993). Finance and Growth: Schumpeter Might Be Right. Quarterly Journal of Economics, 108, 717 – 738.

157 | P a g e
Kirchgässner, G and Wolters, J. (2007). Introduction to Modern Time Series Analysis. New York: Springer Berlin Heidelburg.
Klein, M. W., and Olivei, G. (1999). Capital Account Liberalization, Financial Depth and Economic Growth. Working Paper Series No. 7384, NBER.
Kneller, R. and Stevens, P. A. (2006). Frontier Technology and Absorptive Capacity: Evidence from OECD Manufacturing Industries. Oxford Bulletin of Economics and Statistics, 68(1): 1-21.
Koopmans, T. (1965). On the concept of optimal economic growth. In The Econometric Approach to Development Planning. Amersterdam, North Holland.
Kose, M. A., Prasad, E. S., Rogoff, K., and Wei, S. (2006). Financial Globalization. A Reappraisal. NBER Working Paper No. 12484. Cambridge, MA: NBER.
Kose, M.A., Prasad, E.S., Terrones, M.E. (2006). How do trade and financial integration affect the relationship between growth and volatility? Journal of International Economics, 69, 176–202.
Koundouri, P., Nauges, C. and Tzouvelekas, V. (2006). Technology adoption under production uncertainty: theory and application to irrigation technology. American Journal of Agricultural Economics, 88(3), 657 – 670.
Krongkaew, M., (1994). Income Distribution in East Asian Developing Countries: An update. Asian-Pacific Economic Literature, 8(2), 58-73.
Krugman, P. (1995). Dutch Trips and Emerging markets. Foreign Affairs, 74(4), 28 – 44.
Krusell, P. and Rios-Rull, J. V. (1996). Vested Interests in a Positive Theory of Stagnation and Growth. Review of Economic Studies, 63, 301 – 329.
Krusell, P. and Rios-Rull, J.V. (2002). Politico-Economic Transition. Review of Economic Design, 7, 309 - 329.
Krusell, P., L. Ohanian, R´ios-Rull, J.V. and Violante, G.L. (2000). Capital Skill Complementarily and Inequality: A Macroeconomic Analysis. Econometrica, 68, 1029 – 1054.
Krusell, P., Quadrini, V. and Rios-Rull, J.V. (1997). Politico-Economic Equilibrium and Economic Growth. Journal of Economic Dynamics and Control, 21, 243 – 272.
Kuznets S. (1955). Economic Growth and Income Inequality. American Economic Review, 45(1), 1-28.
Kuznets, S. (1963). Quantitative Aspects of the Economic Growth of Nations. Economic Development and Cultural Change, 112, 1–80.
Kuznets, S. (1968). Towards a Theory of Economic Growth. New Haven: Yale University Press.
Kuznets, S. (1973). Population, Capital, Growth. W.W. Norton, New York, NY.
Kuznets, S. (1966). Modern Economic Growth, Yale University Press, New Haven, CT.

158 | P a g e
La Porta, R., Lopez-de-Silanes, F., Shleifer, A., and Vishny, R. (1998). Law and Finance. Journal of Political Economy, 106, 1113 – 1155.
La Porta, R., Lopez-de-Silanes, F., Shleifer, A., and Vishny, R. (1997). Legal Determinants of External Finance. Journal of Finance, 52, 1131 – 1150.
Laeven, L. (2003). Does Financial Liberalization Reduce Financing Constraints? Financial Management, 32(1), 5 – 34.
Laeven, L. (2003). Does Financial Liberalization Reduce Financing Constraints? Financial Management, 32(1), 5 – 34.
Lahiri, R. and Ratnasiri, S. (2010). A political economy perspective on persistent inequality, Inflation and redistribution. Economic Modeling, 27,1199-1210.
Lahiri, R. and Ratnasiri, S. (2012). Growth Patterns and Inequality in the Presence of Costly Technology Adoption. Southern Economic Journal, 79(1), 203 – 223.
Lahiri, R. and Ratnasiri, S. (2013) Productivity Differences, Technology Adoption and Economic Growth: The Case of India. In Lo, V.I. and Hiscock, M. The Rise of the BRICS in the Global Political Economy: Changing Paradigms. Edwards Elgar Publishing Ltd.
Lahiri, R. and Ratnasiri, S. (2013). Growth Patterns and Inequality in the Presence of Costly Technology Adoption: A political economy perspective, Economic Modelling, Forthcoming.
Laitner, J. (2000). Structural Change and Economic Growth. Review of Economic Studies, 63(3), 545 – 561.
Lancia, F. and Prarolo, G. (2009). Life Expectancy, Human Capital Accumulation, Technological Adoption and the Process of Economic Growth. In Kuhn, M and Ochsen, C., 2009. Labour Markets and Demographic Change. VS Verlag für Sozialwissenschaftenpp, 169 – 189.
Lansing, K. J. and Markiewicz, A. (2011). Technology diffusion and increasing income inequality. Federal Reserve Bank of San Francisco.
Lemennicier, B., (2007). Aaron Director’s Law of Public Income Redistribution: A Reappraisal through the Median Voter Model, Paper presented at the 2007 Public Choice World Congress.
Leung, C.K.Y. and Tse, C.Y. (2001). Technology Choice and Saving in the Presence of a Fixed Adoption Cost. Review of Development Economics, 5(1), 40 – 48.
Levchenko, A. A., Rancière, R. and Thoenig, M. (2009). Growth and Risk at the Industry Level: The Real Effects of Financial Liberalization. Journal of Development Economics, 89, 210 – 222.
Levine, R. (1997). Financial Development and Growth: Views and Agenda. Journal of Economic Literature, 35(2), 688 – 726.
Levine, R. and Zervos S. (1996). Stock Market Development and Long-Run Growth. World Bank Economic Review, 10(2): 323–39.

159 | P a g e
Levine, R. (2005). Finance and Growth: Theory and Evidence. In Aghion, P., and Durlauf, S., (eds). Handbook of Economic Growth. The Netherlands: Elsevier Science.
Lewis, W.A., (2008). Economic Development with Unlimited Supplies of Labor. Manchester School, 22(2), 139 – 191.
Li, D. (2002). Is the AK Model Still Alive? The Long-Run Relation between Growth and Investment Re-Examined. The Canadian Journal of Economics, 35(1), 92 – 114.
Li, H., and Zou, H. (1998). Income inequality is not harmful for growth: Theory and evidence. Review of Development Economics, 2(3), 318-334.
Lin, J.Y. (1991). Education and Innovation Adoption in Agriculture: Evidence from Hybrid Rice in China. American Journal of Agricultural Economics, 73, 713-23.
Lin, P. C. and Huang, H. C. (2012). Convergence in Income Distribution? Evidence from Panel Unit Root Tests with Structural Breaks. Empirical Economics, 43, 153 – 174.
Lindert, P.H. (1994). The Rise in Social Spending 1880 – 1930. Exploration of Economic History, 31(1), 1 – 37.
Loayza, N. and Rancière, R. (2004). Financial development, financial fragility, and growth. World Bank Policy Research Working Paper Series, No. WPS 3431.
Loots, E. (2002). Globalisation and Economic Growth in South Africa: Do We Benefit From Trade and Financial Liberalisation? Trade and industry policy Strategies (TIPS), 2002 Annual Forum.
Lopez, H. (2004), ‘Pro-poor-Pro-growth: Is there a Trade Off?’, Policy Research Working Paper No. 3378, World Bank.
Lucas, R. (1988). On the mechanics of economic development. Journal of Monetary Economics, 22(1), 3 – 42.
Lucas, R.E. (1967). Adjustment Costs and the Theory of Supply. Journal of Political Economy 75, 321–334.
Maddison, A. (1987). Growth and Slowdown in Advanced Capitalist Economies: Techniques of Quantitative Assessment, Journal of Economic Literature, 25(2), 649-698.
Madlener, R., Kumbaroğlu, G. and Ediger, V.S. (2004). Modelling technology adoption as an irreversible investment under uncertainty: the case of the Turkish electricity supply industry. Centre for Energy Policy and Economics (CEPE) Working Paper No. 30.
Madsen J.B. (2007). Technology Spillover through Trade and TFP Convergence: 135 Years of Evidence for the OECD Countries. Journal of International Economics, 72, 464 – 480.
Madsen, J.B. (2008). Economic Growth, TFP Convergence and the World Export of Ideas: A Century of Evidence. Scandinavian Journal of Economics, 110(1), 145 – 167.
Madsen, J. B. (2012). Health, Human Capital Formation and Knowledge Production: Two Centuries of International Evidence. NBER Working Paper No. 18461.
Mankiw, N. G., Romer, D and Weil, N. D. (1992). A Contribution to the Empirics of Economic Growth. Quarterly Journal of Economics, 107, 407 – 437.

160 | P a g e
Martin, P. and Rogers, C.A. (2000). Long Term Growth and Short-Term Economic Instability. European Economic Review, 44, 359 – 381.
Matsuyama, K. (1992). A Simple Model of Sectoral Adjustments. Review of Economic Studies, 59(2), 375-88.
McGrattan, Ellen R. A. (1998). Defense of AK Growth Models. Federal Reserve Bank of Minneapolis Quarterly Review. 22( 4), 13-27.
McKinnon, R. I. (1973). Money and Capital in Economic Development. Washington, DC: The Brooking Institution.
McMillan, M. S. and Rodrik, D. (2011). Globalization, Structural Change and Productivity Growth, NBER Working Paper No. 17143.
Mehra, S. (1981). Instability in Indian Agriculture in the Context of the New Technology, Research Report No. 25, International Food Policy Research Institute, Washington, D.C., U.S.A.
Milanovic, B. (2009). Global Inequality and the Global Inequality Extraction Ratio: The Story of the Past Two Centuries. Policy Research Working Paper No.5044. Washington D.C.: World Bank.
Mokyr, J. (1990). The Lever of Riches: Technological Creativity and Economic Progress. Oxford University Press, New York.
Mokyr, J. (1993), The New Economic History and the Industrial Revolution. In The British Industrial Revolution: An Economic Perspective. Eds. Mokyr, J. Westview Press, Boulder.
Mokyr, J. (1993). The New Economic History and the Industrial Revolution. In The British Industrial Revolution: An Economic Perspective. Eds. Mokyr, J. Westview Press, Boulder.
Montiel, P. and Reinhart, C. (1999). Do Capital Controls and Macroeconomic Policies Influence the Volume and Composition of Capital Flows? Evidence from the 1990s. Journal of International Money and Finance, 18(4): 619 – 35.
Morduch, J. (1995). Income Smoothing and Consumption Smoothing. Journal of Economic Perspective, 9 (3), 103–114.
Mussa, M. (1978). Dynamic Adjustment in the Heckscher-Ohlin-Samuelson Model. Journal of Political Economy, 86(5), 775-791.
Ngai, L.R. (2004). Barriers and the transition to modern growth. Journal of Monetary Economics, 51(7), 1353-1383.
Nin-Pratt, A., Yu, B. and Fan, S. (2008). The Total Factor Productivity in China and India: New Measures and Approaches. China Agricultural Economic Review, 1(1), 9 – 22.
Nin-Pratt, A., Yu, B. and Fan, S. (2010). Comparisons of Agricultural Productivity Growth in China and India. Journal of Productivity Analysis, 33, 209 – 223.
Obstfeld, M. and Rogoff, K. (1996). Foundations of International Macroeconomics, MIT Press, Cambridge, MA and London.

161 | P a g e
Obstfeld, M. (1994). Risk-Taking, Global Diversification, and Growth. American Economic Review, 84, 1310 – 1329.
Oikawa, K. (2010). Uncertainty Driven Growth. Journal of Economic Dynamics and Control, 34(5), 897 – 912.Ortiz, I. and Cummins, M. (2011). Global Inequality: Beyond the Bottom Billion. A Rapid Review of Income Distribution in 141 Countries. UNICEF Social and economic Policy Working Paper No. 1105.
Pagano, M. (1993). Financial markets and growth: An overview. European Economic Review, 37(2-3), 613-622.
Pagés, C. (2010). The Age of Productivity. Washington DC, Inter-American Development Bank.
Parente, S. (2001). The failure of endogenous growth. Knowledge, Technology and Policy,13, 49-58.
Parente, S. and Prescott, E. (1994). Barriers to Technology Adoption and Development. Journal of Political Economy. 102 (2). 298-301.
Parente, S. and Prescott, E. (2004), A Unified Theory of the Evolution of International Income Levels. Federal Reserve Bank of Minneapolis, Research Department Staff Report-333.
Parente, S. and Prescott, E. (1994). Barriers to Technology Adoption and Development. Journal of Political Economy, 102 (2), 298-301.
Parente, S. and Prescott, E. (2004). A Unified Theory of the Evolution of International Income Levels. Federal Reserve Bank of Minneapolis, Research Department Staff Report-333.
Pekkala, S. (1999). Regional convergence across the Finnish provinces and subregions, 1960-94. Finnish Economic Papers, 12(1), 28-40.
Persson, T. and Tabellini, G. (1994). Is Inequality Harmful for Growth? American Economic Review, 84, 600-21.
Phelan, C. (1995). Repeated Moral Hazard and One-Sided Commitment. Journal of Economic Theory, 66(2), 488–506.
Piketty, T. (1997). The Dynamics of Wealth Distribution and Interest Rates with Credit Rationing. Review of Economic Studies 64, 173 – 190.
Prasad, A., Rogoff, K., Wei, S., and Kose, M. A. (2004). Financial Globalization, Growth and Volatility in Developing Countries. NBER Working Paper No. 10942.
Prasad, E. S., Rogoff, K., Wei, S., and Kose, M.S. (2003). Effects of Financial Globalization on Developing Countries: Some Empirical Evidence, IMF Occasional Paper No. 220.
Prescott, S.L. and Parente, E. C. (1997). Monopoly Rights: A Barrier to Riches. American Economic Review, 89(5), 1216 – 1233.
Pritchett, L. (1997). Divergence, Big Time, Journal of Economic Perspectives, 11(3), 3-17.
Quah, D.T. (1997). Empirics for Growth and Distribution: Stratification, Polarization, and Convergence Clubs. Journal of Economic Growth, 2(1), 27 – 59.

162 | P a g e
Quah, D.T. (1996). Twin Peaks: Growth and Convergence in Models of Distribution Dynamics. Economic Journal, 106(437), 1045 – 1055.
Ramaila, M., Mahlangu, S. and du Toit, D. (2011). Agricultural Productivity in South Africa: Literature Review. Directorate: Economic Services, South African Department of Agriculture.
Ravallion, M. and G. Datt (1999). When is growth pro-poor? Evidence from the diverse experiences of India’s states. World Bank, manuscript.
Ray, D. and Peter A. Streufert, P. A. (1993). Dynamic Equilibria with Unemployment due to undernourishment. Economic Theory, 3, 61-85.
Ray, S.K. (1983). An empirical investigation of the nature and causes for growth and instability in Indian agriculture: 1950-80. Indian Journal of Agricultural Economics, 38 (4): 459-474.
Rebelo, S. (1991). Long run policy analysis and long run growth. Journal of Political Economy, 99, 500 – 521.
Robinson, S. (1971). Sources of Growth in Less-Developed Countries: a Cross-Section Study. Quarterly Journal of Economics, 85, 391 – 408.
Rodrik, D. (1998). Who Needs Capital-Account Convertibility? In Stanley Fisher et al. (eds). Should the IMF Pursue Capital-Account Convertibility? Princeton Essays in International Finance 207. Princeton: Princeton University.
Romer, D. (2012). Advanced Macroeconomics, McGraw Hill Irwin, New York.
Romer P. (1990). Endogenous technological change. The Journal of Political Economy, 98(5), 71 – 102.
Romer, P. (1986). Increasing returns and long run growth. Journal of Political Economy, 94, 1002 – 1037.
Romer, P. (1987). Growth based on Increasing returns due to specialization. American economic Review papers and Proceedings, 77, 56 – 62.
Rostow, W. W. (1960). The Stages of Economic Growth: A Non-Communist Manifesto. Cambridge University Press.
Rum, R. and Shultz, T.W. (1979). Life Span, Health, Savings, and Productivity. Economic Development and Cultural Change, 27(3), 399-421.
Sachs, J. and Warner, A. (1995a). Economic convergence and economic policies. NBER Working Paper No. 5039, Cambridge, MA.
Sachs, J. and Warner, A. (1995b). Economic reform and the process of global integration. Brookings Papers on Economic Activity, 1, 1 – 95.
Sagasti, F. (2003). Knowledge and Innovation for Development: The Sisyphus Challenge for the 21st Century. Edward Elgar, Cheltenham, U.K.
Saha, L., Alan, L. H. and Robert, S. (1994). Adoption of Emerging Technologies under Output Uncertainty. American Journal of Agricultural Economics, 76, 836-846.

163 | P a g e
Saint Paul, G. (2001). The Dynamics of Exclusion and Fiscal Conservatism. Review of Economic Dynamics, 4(2), 275 – 302.
Saint-Paul, G. and Verdier, T. (1993). Education, democracy and growth, Journal of Development Economics, 42(2), 399 – 402.
Saint-Paul, G. 1(992). Technology Choice, Financial Markets and Economic Development. European Economic Review, 36(4), 763-781.
Schönteich, M. (2010). South Africa's position in Africa's crime rankings. African Security Review, 9(4), 51 – 65.
Shahbaz, M. and Islam, F. (2011). Financial Development and Income Inequality in Pakistan: An Application of ARDL Approach. Journal of Economic Development, 46(1), 35-58.
Sharma, H.R., Kamlesh, S. and Shanta K. (2006). Extent and source of instability in food grains production in India. Indian Journal of Agricultural Economics, 61 (4): 648 – 666.
Shaw, E.S. (1973). Financial Deepening in Economic Development. Oxford University Press. New York.
Smeeding, T.M. (2000). Changing Income Inequality in OECD Countries: Updated Results from Luxemburg Income Study (LIS). LIS Working Paper n. 252.
Solow, R. M. (1956). A Contribution to the Theory of Economic Growth. Quarterly Journal of Economics, 70 (1): 65–94.
Soubattina, T. (2006). Generic Models of Technological Learning by Developing Countries. Draft. World Bank, Washington, DC
Spencer, R. W. and Yohe, W. P., 1970. The 'Crowding Out' of Private Expenditures by Fiscal Policy Actions. Federal Reserve Bank of St. Louis Review.
Staehr, K. (2005). Reform and economic growth in transitional economies: Complementality, Sequencing and speed. European Journal of Comparative Economics, 2(2), 177 – 202.
Steger, T.M. (2003). Economic Growth and Sectoral Change under Resource Reallocation Costs, CER-ETH - Institute of Economic Research, Working Paper No. 03/30.
Stein, J. (2003). Agency, information and corporate investment. In Constantinides, G., M. Harris, and R. Stulz (Eds.), Handbook of the Economics of Finance. Elsevier Science, Amsterdam, 109 – 163.
Stiglitz, J. (2002). Globalization and Its Discontents, New York: W.W. Norton and Company.
Stiglitz, J. (2000). Capital Market Liberalization, Economic Growth, and Instability. World Development, 28(6), 1075–86.
Stock, J.H. and Watson, M.W. (2002). Forecasting using Principal Components from a large number of predictors. Journal of the American Statistical Association, 97, 1167–1179.
Stone, B. (1993). Basic Agricultural Technology under Reform. In Kueh, Y.Y. and. Ash, R.F., eds., Economic Trends in Chinese Agriculture: The Impact of Post-Mao Reforms. New York: Oxford University Press.

164 | P a g e
Swan, T. W. (1956). Economic Growth and Capital Accumulation. Economic Record, 32 (2), 334–361.
Swiecki, T. (2012). Intersectoral Distortions, Structural Change and the Welfare Gains from Trade. Department of Economics, Princeton University.
Temple, J. (2001). Structural change and Europe’s Golden Age. Centre for Economic Policy Research, Discussion Paper No. 2861.
Terrasi, M. (1999). Convergence and divergence across Italian regions. The Annals of Regional Science, 4, 491-510.
Timmer C.P. (1988). The Agricultural Transformation. In: Chenery, H. and T.N. Srinivasan, 1988, Handbook of Development Economics, Handbook of Development Economics, Elsevier, Ed1, 1(1).
Tiongson, E. R. (2005). Education Policy Reforms. In S. Paternostro and A. Coudouel, eds., Analysing the distributional impact of reforms. Washington: World Bank.
Tobin, J. (1969). A general equilibrium approach to monetary theory. Journal of Money Credit and Banking, 1 (1): 15–29.
Townsend, R. M. (1982). Optimal multi-period contracts and the gain from enduring relationships under private information. Journal of Political Economy, 90, 1166 -86.
Townsend, R. M. and Ueda, K. (2006). Financial Deepening, Inequality, and Growth: A Model-Based Quantitative Evaluation. Review of Economic Studies, 73(1), 251–293.
Townsend, R. M. and Ueda, K., (2010). Welfare Gains from Financial Liberalization. International Economic Review, 51(3), 553-597.
Townsend, R.M. (1995). Consumption Insurance: An Evaluation of Risk-Bearing Systems in Low-Income Economies. Journal of Economic Perspective, 9(3): 83-102.
Tsur, Y., Sternberg, M. and Hochman, E. (1990). Dynamic Modeling of Innovation Process Adoption with Risk Aversion and Learning. Oxford Economic Papers, 42, 336-355.
Ulu, C. and Smith, J. E. (2009). Uncertainty, Information Acquisition, and Technology Adoption. Operations Research, 57(3), 740 – 752.
UNIDO (2002). Industrial Development Report 2002/2003: Competing through Innovation and Learning. Vienna: United Nations Industrial Development Organization (UNIDO).
United Nations (2012). Food and Agriculture Organisation Database. New York.
United Nations Development Program (2006). Human Developmental Report (2006). United Nations Development Programme, New York, USA.
Weiss, M. (2008). Skill-biased technological change: Is there hope for the unskilled? Economic Letters, 100, 439 – 441.
Wirz, N. (2008). Assessing the Role of Technology Adoption in China's Growth Performance. Economic Policy Research Unit (EPRU), Working Paper No.6, University of Copenhagen. Department of Economics.
165 | P a g e
Wong, L.F. (1989). Agricultural Productivity in China and India: A Comparative Analysis. Canadian Journal Agricultural Economics, 37(1), 77 – 93.
Word Bank Databank (2012). World Development Indicators. The World Bank, Washingaton.
World Bank (2008). Technology and Technological Diffusion in Developing Countries, Global Economic Prospects. The World Bank, Washington DC.
Wurgler, J. (2000). Financial Markets and the Allocation of Capital, Journal of Financial Economics, 58,187–214.
YUSUF, S. (2001). Globalisation and the Challenge for Developing Countries. Policy Research Working Paper No. 2618, Washington DC: World Bank.
Zin, R.H.M. (2005). Income Distribution in East Asian Developing Countries: recent trends. Asian-Pacific Economic Literature, 19(2), 36-54.
Zollino, F. (2004). Social mobility and endogenous cycles in redistribution. Bank of Italy Research Department, Working Paper No. 505.
Related Documents