Essays on Financial Intermediation, Innovation, and Growth Dissertation zur Erlangung des Doktorgrades der Wirtschafts- und Sozialwissenschaftlichen Fakultät der Eberhard Karls Universität Tübingen vorgelegt von Markus Merz, M.Sc. aus Stuttgart Tübingen 2020

Welcome message from author
This document is posted to help you gain knowledge. Please leave a comment to let me know what you think about it! Share it to your friends and learn new things together.
Transcript

Essays onFinancial Intermediation, Innovation, and Growth
Dissertationzur Erlangung des Doktorgrades
der Wirtschafts- und Sozialwissenschaftlichen Fakultätder Eberhard Karls Universität Tübingen
vorgelegt vonMarkus Merz, M.Sc.
aus Stuttgart
Tübingen2020

Tag der mündlichen Prüfung:Dekan:1. Gutachter:2. Gutachter:
30. September 2020Professor Dr. Josef SchmidProfessor Dr. Werner NeusProfessor Dr. Manfred Stadler

For Anna


Vorwort
Die vorliegende Schrift wurde von der Wirtschafts- und Sozialwissenschaftlichen Fakultät derEberhardKarls Universität Tübingen als Dissertation angenommen. Sie umfasst Veröffentlichun-gen und Beiträge, die sich mit dem Einfluss von Finanzmärkten im Allgemeinen und Bankenim Besonderen auf das einzel- und gesamtwirtschaftliche Wachstum befassen. Diese sind imRahmenmeiner Tätigkeit als wissenschaftlicherMitarbeiter in der Abteilung Bankwirtschaft derEberhard Karls Universität Tübingen und meines Gastaufenthalts an der Cass Business SchoolLondon entstanden.
An dieser Stelle möchte ich mich bei allen Personen ganz herzlich bedanken, die mich aufvielfältige Art und Weise während meiner Promotionszeit unterstützt und mir Rückhalt gegebenhaben. In erster Linie gilt mein Dank meinem Doktorvater, Herrn Prof. Dr. Werner Neus. Er hatmich stets wohlwollend unterstützt und mir die wissenschaftliche Freiheit eingeräumt, mich mitden recht unterschiedlichenThemen,wie derBedeutung klassischer Bankdienstleistungen für dieRealwirtschaft, digitalen Innovationen, derRelevanz finanziellerMittel für den Innovationserfolgsowie Corporate Venture Capital zu befassen. Seine konstruktiven Anmerkungen und Hinweisesowie nicht zuletzt seine jederzeitige Diskussionsbereitschaft haben entscheidend zum Gelingenmeiner Arbeit und den Veröffentlichungen beigetragen. Es war für mich eine große Freudeund Ehre zugleich, an seinem Lehrstuhl tätig zu sein. Ebenfalls herzlich bedanken möchte ichmich bei meinem Zweitgutachter, Herrn Prof. Dr. Manfred Stadler. Seine Lehrveranstaltungenund Passion für die Wirtschaftstheorie haben entscheidend zu meinem Promotionsbestrebenbeigetragen.
Überdies danke ich Sebastian Weitz und Markus Nisch für die zahlreichen fachlichen undpersönlichen Gespräche, die wesentlich zum Gelingen dieser Arbeit beigetragen haben. KristinaUhl, Britta Schmid, Eva Schäberle, Dorothee Amann, Anna-Lena Kotzur und Justine Reh-bronn danke ich für die familiäre Arbeitsatmosphäre, stete Hilfsbereitschaft sowie viele schöneErinnerungen an die gemeinsame Zeit am Lehrstuhl. Meinen Kollegen in der Nauklerstr. 47,insbesondere Patrick Kompolsek, Philipp Roßmann, Jakob Schwerter und Martin Kipp, sowiemeinen Mitdoktoranden Filippo Umberto Andrini und Riccardo Brignone an der Cass BusinessSchool danke ich für die erheiternden Momente im Arbeitsalltag. Für die mental entspannendenStunden auf dem Tennisplatz außerhalb der Arbeitszeit danke ich Ferdinand Springer und AttilaKiss.
Zwei Kapitel dieser Dissertation wurden in Co-Autorenschaft verfasst. Ich danke den betei-ligten Co-Autoren ganz herzlich für ihr Engagement und die erfolgreiche Zusammenarbeit. DieDiskussionen mit Jan Riepe waren gerade in der Anfangszeit meiner Promotion sehr hilfreichund haben auch die anderen Teile der Dissertation beeinflusst. Patrick Röhm und Andreas Ku-ckertz danke ich für die interuniversitäre Kooperationsbereitschaft und die rundum gelungene
vii

viii Vorwort
Zusammenarbeit. In diesem Zusammenhang gebührt ein weiteres herzliches Dankeschön HerrnProf. Dr. Thorsten Beck von der Cass Business School London, bei dem ich drei Monate alsGastwissenschaftler verbringen durfte. Für die tatkräftige Unterstützung bei der Datenerhebungim Rahmen des Marihuana-Projekts in Colorado (USA) danke ich meinem Schwiegervater UweStaerz. Für wertvolle Anmerkungen zu den einzelnen Beiträgen sowie sorgfältigen Korrekturar-beiten in der Endphase meiner Dissertation danke ich Lukas Stickel und Amelie Wulff.
Besonderer Dank gebührt meiner Ehefrau und meiner Familie, ohne die ich die wohl üblichenHöhen und Tiefen einer Promotion nicht gemeistert hätte. Meinen Eltern, Karin und Ulrich,sowie meinem Bruder Martin danke ich für die uneingeschränkte, liebevolle und vielseitigeUnterstützung, die ich in all meinen Lebensabschnitten erfahren habe. Einen unschätzbarenAnteil am Gelingen dieser Arbeit hat meine Ehefrau Anna Staerz, die mich in jeder Phase dieserArbeit in vielfältiger Weise unterstützt und mich immer wieder angespornt hat. Ihr widme ichdiese Arbeit.
Tübingen, September 2020 Markus Merz

Contents
1 Introduction . . . . . . . . . . . . . . . . . . . . . . . . . . . . . . . . . . . . . . . . . . . . . . . . . . . . . . . . . . . . . 1
Part I Banks, The Allocation of Resources and Growth
2 Access to Banking and its Value for SMEs - Evidence from the U.S. MarijuanaIndustry . . . . . . . . . . . . . . . . . . . . . . . . . . . . . . . . . . . . . . . . . . . . . . . . . . . . . . . . . . . . . . . . . 72.1 Introduction . . . . . . . . . . . . . . . . . . . . . . . . . . . . . . . . . . . . . . . . . . . . . . . . . . . . . . . . . . . 72.2 The marijuana firms and the banking system . . . . . . . . . . . . . . . . . . . . . . . . . . . . . . . 92.3 Data and method . . . . . . . . . . . . . . . . . . . . . . . . . . . . . . . . . . . . . . . . . . . . . . . . . . . . . . . 11
2.3.1 Empirical strategy . . . . . . . . . . . . . . . . . . . . . . . . . . . . . . . . . . . . . . . . . . . . . . . . 112.3.2 Event study . . . . . . . . . . . . . . . . . . . . . . . . . . . . . . . . . . . . . . . . . . . . . . . . . . . . . . 122.3.3 Survey design and sample . . . . . . . . . . . . . . . . . . . . . . . . . . . . . . . . . . . . . . . . . . 14
2.4 Results . . . . . . . . . . . . . . . . . . . . . . . . . . . . . . . . . . . . . . . . . . . . . . . . . . . . . . . . . . . . . . . 162.4.1 Event studies’ results . . . . . . . . . . . . . . . . . . . . . . . . . . . . . . . . . . . . . . . . . . . . . . 162.4.2 Survey results . . . . . . . . . . . . . . . . . . . . . . . . . . . . . . . . . . . . . . . . . . . . . . . . . . . . 22
2.5 Critical assessment and further research . . . . . . . . . . . . . . . . . . . . . . . . . . . . . . . . . . . 302.6 Conclusion . . . . . . . . . . . . . . . . . . . . . . . . . . . . . . . . . . . . . . . . . . . . . . . . . . . . . . . . . . . 31A Appendices . . . . . . . . . . . . . . . . . . . . . . . . . . . . . . . . . . . . . . . . . . . . . . . . . . . . . . . . . . . 33
A.1 Sample firms . . . . . . . . . . . . . . . . . . . . . . . . . . . . . . . . . . . . . . . . . . . . . . . . . . . . 33A.2 Survey . . . . . . . . . . . . . . . . . . . . . . . . . . . . . . . . . . . . . . . . . . . . . . . . . . . . . . . . . . 35A.3 Robustness tests - event studies . . . . . . . . . . . . . . . . . . . . . . . . . . . . . . . . . . . . . 42A.4 Dividend discount model and a firm’s maximum attainable growth rate . . . . 54
3 Contemporaneous Financial Intermediation - How DLT Changes theCross-Border Payment Landscape . . . . . . . . . . . . . . . . . . . . . . . . . . . . . . . . . . . . . . . . . . 573.1 Introduction . . . . . . . . . . . . . . . . . . . . . . . . . . . . . . . . . . . . . . . . . . . . . . . . . . . . . . . . . . . 573.2 The foundation of interbank intermediaries . . . . . . . . . . . . . . . . . . . . . . . . . . . . . . . . . 59
3.2.1 The concept of correspondent banking . . . . . . . . . . . . . . . . . . . . . . . . . . . . . . . 593.2.2 The theory of interbank intermediation . . . . . . . . . . . . . . . . . . . . . . . . . . . . . . . 61
3.3 The downfall of interbank intermediaries . . . . . . . . . . . . . . . . . . . . . . . . . . . . . . . . . . 653.3.1 The digital transformation of correspondent banking . . . . . . . . . . . . . . . . . . . 653.3.2 Implications for the correspondent banking system . . . . . . . . . . . . . . . . . . . . . 70
3.4 Conclusion . . . . . . . . . . . . . . . . . . . . . . . . . . . . . . . . . . . . . . . . . . . . . . . . . . . . . . . . . . . 72
ix

x Contents
Part II Access to Finance, Innovation and Growth
4 Innovative Efficiency as a Lever to Overcome Financial Constraints in R&DContests . . . . . . . . . . . . . . . . . . . . . . . . . . . . . . . . . . . . . . . . . . . . . . . . . . . . . . . . . . . . . . . . . 774.1 Introduction . . . . . . . . . . . . . . . . . . . . . . . . . . . . . . . . . . . . . . . . . . . . . . . . . . . . . . . . . . . 774.2 The basic model . . . . . . . . . . . . . . . . . . . . . . . . . . . . . . . . . . . . . . . . . . . . . . . . . . . . . . . 794.3 The role of firm characteristics . . . . . . . . . . . . . . . . . . . . . . . . . . . . . . . . . . . . . . . . . . . 81
4.3.1 Unconstrained firms . . . . . . . . . . . . . . . . . . . . . . . . . . . . . . . . . . . . . . . . . . . . . . 814.3.2 Financial constraints . . . . . . . . . . . . . . . . . . . . . . . . . . . . . . . . . . . . . . . . . . . . . . 85
4.4 Conclusion from the model, real world significances and future research . . . . . . . . 90
5 Identifying Corporate Venture Capital Investors: A Data-Cleaning Procedure . . . 935.1 Introduction . . . . . . . . . . . . . . . . . . . . . . . . . . . . . . . . . . . . . . . . . . . . . . . . . . . . . . . . . . . 935.2 Relevant databases for CVC research . . . . . . . . . . . . . . . . . . . . . . . . . . . . . . . . . . . . . . 945.3 Data sample . . . . . . . . . . . . . . . . . . . . . . . . . . . . . . . . . . . . . . . . . . . . . . . . . . . . . . . . . . 955.4 Data-cleaning process . . . . . . . . . . . . . . . . . . . . . . . . . . . . . . . . . . . . . . . . . . . . . . . . . . 96
5.4.1 Undisclosed investors . . . . . . . . . . . . . . . . . . . . . . . . . . . . . . . . . . . . . . . . . . . . . 975.4.2 Unknown investors . . . . . . . . . . . . . . . . . . . . . . . . . . . . . . . . . . . . . . . . . . . . . . . 985.4.3 Geographical overlap . . . . . . . . . . . . . . . . . . . . . . . . . . . . . . . . . . . . . . . . . . . . . 985.4.4 Alternative investors . . . . . . . . . . . . . . . . . . . . . . . . . . . . . . . . . . . . . . . . . . . . . . 995.4.5 CVC governance . . . . . . . . . . . . . . . . . . . . . . . . . . . . . . . . . . . . . . . . . . . . . . . . . 995.4.6 Outside LPs . . . . . . . . . . . . . . . . . . . . . . . . . . . . . . . . . . . . . . . . . . . . . . . . . . . . . 995.4.7 CVC definition . . . . . . . . . . . . . . . . . . . . . . . . . . . . . . . . . . . . . . . . . . . . . . . . . . . 100
5.5 Conclusion . . . . . . . . . . . . . . . . . . . . . . . . . . . . . . . . . . . . . . . . . . . . . . . . . . . . . . . . . . . 101
6 Conclusion and Outlook . . . . . . . . . . . . . . . . . . . . . . . . . . . . . . . . . . . . . . . . . . . . . . . . . . . 103
References . . . . . . . . . . . . . . . . . . . . . . . . . . . . . . . . . . . . . . . . . . . . . . . . . . . . . . . . . . . . . . . . . . . 107
List of Figures
1.1 The functions of the financial system . . . . . . . . . . . . . . . . . . . . . . . . . . . . . . . . . . . . . 1
2.1 Marijuana laws by state, as of December 2019 . . . . . . . . . . . . . . . . . . . . . . . . . . . . . 92.2 Financing sources of marijuana SMEs . . . . . . . . . . . . . . . . . . . . . . . . . . . . . . . . . . . . 252.3 Major challenges for marijuana SMEs and microbreweries . . . . . . . . . . . . . . . . . . . 292.4 Event 1 with the subgroup of eight firms that is examined in all events. . . . . . . . . . 512.5 Event 2 with the subgroup of eight firms that is examined in all events. . . . . . . . . . 522.6 Event 3 with the subgroup of eight firms that is examined in all events. . . . . . . . . . 53
3.1 Correspondent banking system today . . . . . . . . . . . . . . . . . . . . . . . . . . . . . . . . . . . . . 603.2 Bilateral transactions . . . . . . . . . . . . . . . . . . . . . . . . . . . . . . . . . . . . . . . . . . . . . . . . . . . 623.3 Interbank intermediation . . . . . . . . . . . . . . . . . . . . . . . . . . . . . . . . . . . . . . . . . . . . . . . 623.4 Distributed ledger taxonomy . . . . . . . . . . . . . . . . . . . . . . . . . . . . . . . . . . . . . . . . . . . . 663.5 Cross-border payments via Ripple . . . . . . . . . . . . . . . . . . . . . . . . . . . . . . . . . . . . . . . . 683.6 Intermediation via DLT . . . . . . . . . . . . . . . . . . . . . . . . . . . . . . . . . . . . . . . . . . . . . . . . 70
4.1 Reaction functions when the small firm values the patent less but is significantlymore efficient, i.e., Uf < 1 holds true . . . . . . . . . . . . . . . . . . . . . . . . . . . . . . . . . . . . . 82
4.2 Shift of the large firm’s reaction function when the valuation parameter Uincreases, i.e., the large firm values the innovation higher . . . . . . . . . . . . . . . . . . . . 83
4.3 Shifts of reaction functions when the innovative efficiency parameter f increases 844.4 The small firm has an overall disadvantage (Uf > 1) and is financially constrained 854.5 The small firm has an overall advantage (Uf < 1) but is extremely financially
constrained . . . . . . . . . . . . . . . . . . . . . . . . . . . . . . . . . . . . . . . . . . . . . . . . . . . . . . . . . . . 864.6 The small firm has an overall advantage (Uf < 1) but is weakly financially
constrained . . . . . . . . . . . . . . . . . . . . . . . . . . . . . . . . . . . . . . . . . . . . . . . . . . . . . . . . . . . 874.7 Financial resources and expected profits of the small firm when it has an overall
advantage (Uf < 1) . . . . . . . . . . . . . . . . . . . . . . . . . . . . . . . . . . . . . . . . . . . . . . . . . . . . 884.8 Financial resources and expected profits of the small firm when it has an overall
disadvantage (Uf > 1) . . . . . . . . . . . . . . . . . . . . . . . . . . . . . . . . . . . . . . . . . . . . . . . . . 894.9 Reaction functions when both firms are financially constrained, and the small
firm has an overall advantage (Uf < 1) . . . . . . . . . . . . . . . . . . . . . . . . . . . . . . . . . . . 90
5.1 Underlying methodology of the proposed data-cleaning procedure . . . . . . . . . . . . . 96
xi


List of Tables
2.1 Descriptive statistics event study . . . . . . . . . . . . . . . . . . . . . . . . . . . . . . . . . . . . . . . . . 132.2 Summary statistics on respondents . . . . . . . . . . . . . . . . . . . . . . . . . . . . . . . . . . . . . . . 152.3 Event 1: Guidance Fin-2014-G001 . . . . . . . . . . . . . . . . . . . . . . . . . . . . . . . . . . . . . . . 172.4 Event 2: The Fourth Corner Credit Union Case . . . . . . . . . . . . . . . . . . . . . . . . . . . . . 192.5 Event 3: The SAFE Banking Act . . . . . . . . . . . . . . . . . . . . . . . . . . . . . . . . . . . . . . . . . 212.6 Financial transaction management . . . . . . . . . . . . . . . . . . . . . . . . . . . . . . . . . . . . . . . 232.7 Benefits of access to electronic payment services via banks . . . . . . . . . . . . . . . . . . 242.8 Bank loans and credit lines . . . . . . . . . . . . . . . . . . . . . . . . . . . . . . . . . . . . . . . . . . . . . . 262.9 Transaction services, bank lending, and other challenges . . . . . . . . . . . . . . . . . . . . . 282.10 Comparisons for challenges of marijuana SMEs and microbreweries . . . . . . . . . . . 292.11 Sample firms . . . . . . . . . . . . . . . . . . . . . . . . . . . . . . . . . . . . . . . . . . . . . . . . . . . . . . . . . 332.12 Sample characteristics event study . . . . . . . . . . . . . . . . . . . . . . . . . . . . . . . . . . . . . . . 342.16 Event 1 with the standardized cross-sectional test by Kolari and Pynnönen (2010) 422.17 Event 1 with the parametric test by Boehmer et al. (1991) . . . . . . . . . . . . . . . . . . . . 432.18 Event 1 with the non-parametric rank test by Corrado (1989) and Corrado and
Zivney (1992) . . . . . . . . . . . . . . . . . . . . . . . . . . . . . . . . . . . . . . . . . . . . . . . . . . . . . . . . 442.19 Event 2 with the standardized cross-sectional test by Kolari and Pynnönen (2010) 452.20 Event 2 with the parametric test by Boehmer et al. (1991) . . . . . . . . . . . . . . . . . . . 462.21 Event 2 with the non-parametric rank test by Corrado (1989) and Corrado and
Zivney (1992) . . . . . . . . . . . . . . . . . . . . . . . . . . . . . . . . . . . . . . . . . . . . . . . . . . . . . . . . 472.22 Event 3 with the standardized cross-sectional test by Kolari and Pynnönen (2010) 482.23 Event 3 with the parametric test by Boehmer et al. (1991) . . . . . . . . . . . . . . . . . . . 492.24 Event 3 with the non-parametric rank test by Corrado (1989) and Corrado and
Zivney (1992) . . . . . . . . . . . . . . . . . . . . . . . . . . . . . . . . . . . . . . . . . . . . . . . . . . . . . . . . 50
3.1 Different types of transaction costs . . . . . . . . . . . . . . . . . . . . . . . . . . . . . . . . . . . . . . . 63
4.1 Summary of results . . . . . . . . . . . . . . . . . . . . . . . . . . . . . . . . . . . . . . . . . . . . . . . . . . . . 91
5.1 Results from the database queries for U.S. and European-based CVCs . . . . . . . . . . 975.2 Comparison of unique CVCs and investment rounds (follow-on rounds
excluded) covering the period 2000 to 2015 . . . . . . . . . . . . . . . . . . . . . . . . . . . . . . . . 100
xiii


Acronyms
AAR Average Abnormal ReturnCAAR Cumulative Average Abnormal ReturnCHIPS Clearing House Interbank Payment SystemCVC Corporate Venture CapitalDDM Dividend Discount ModelDLT Distributed Ledger TechnologyDNS Deferred Net SettlementFCCU Fourth Corner Credit UnionGP General PartnerIOU I Owe YouIVC Independent Venture CapitalistLP Limited PartnerNCIA National Cannabis Industry AssociationOTC Over-The-CounterPE Private EquityR&D Research and DevelopmentRTGS Real-Time Gross SettlementSAFE Secure and Fair EnforcementSMEs Small- and Medium-Sized EnterprisesSIC Standard Industrial ClassificationSWIFT Society for Worldwide Interbank Financial CommunicationTARGET Trans-European Automated Real-Time Gross Settlement Express Transfer SystemUTXO Unspent Transaction OutputVC Venture Capital
xv


Symbols
U Valuation parameter\8 Firm i’s innovative efficiencyc Patent valueΠ8 Expected profits of firm if Innovative efficiency parameterg1 Fixed indirect costs for a technology solution providerg2 Fixed direct costs for a technology solution providerg3 Variable direct costs for a technology solution providerg4 Variable indirect costs for a technology solution providerl8 Financial resources of firm i2 Economy-wide transaction costs without correspondent banks2̂ Economy-wide transaction costs with correspondent banks2̄ Economy-wide transaction costs with DLT21 Fixed indirect costs for banks22 Fixed direct costs for banks23 Variable direct costs for banks24 Variable indirect costs for banks2̄� Costs for administrator (A)2̂� Costs for correspondent bank (B)2� Costs for domestic bank (D)2� Costs for foreign bank (F)3C Dividend yield in t�C+1 Expected cumulative dividends'$�C Return on equity in t6 Implied growth rate8 Indicator for large (L) or small (S) firm9 Number of correspondent banks:4 Cost of equity< Number of foreign banks= Number of domestic banks?8 Probability of winning the R&D contest%C Value of marijuana portfolio in t(� C Sustainable growth rate in t+ Volume for all cross-border paymentsG8 R&D investment of firm i
xvii


Chapter 1Introduction
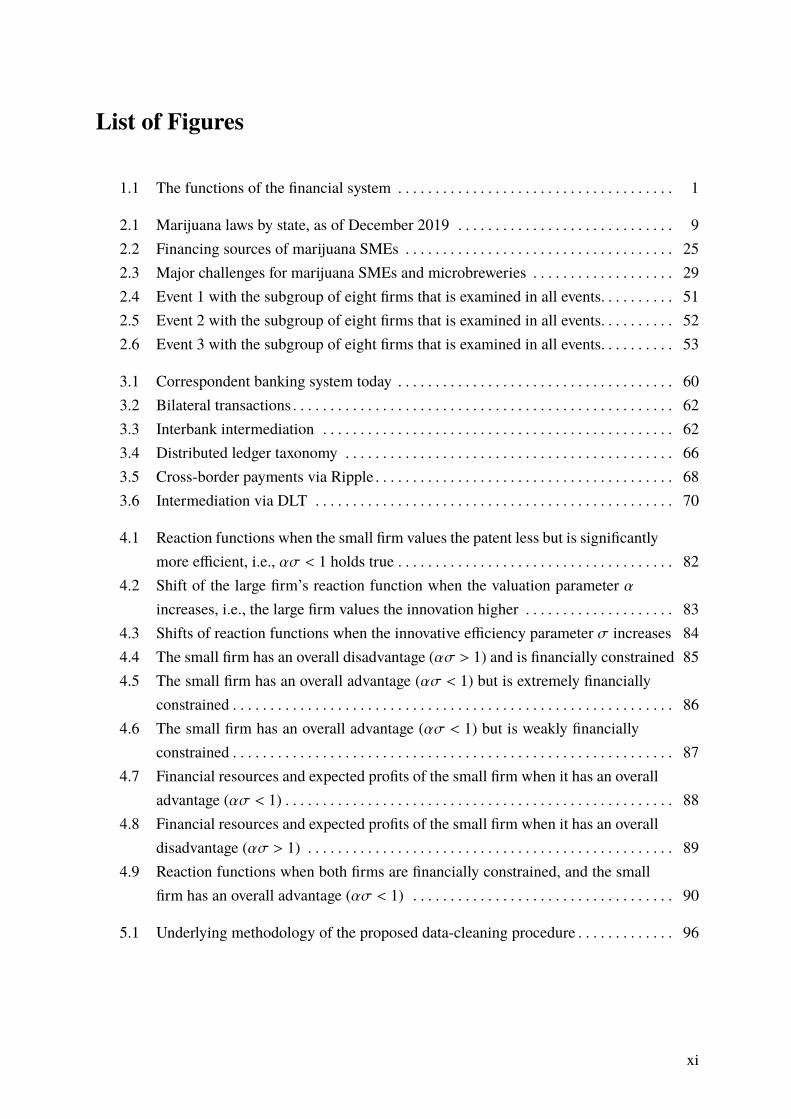
Over the last few decades, research has largely found that a more developed financial systemresults in higher economic growth (see, e.g., Levine 2005; Popov 2018 and Berger et al. 2019for comprehensive surveys of the literature on finance and growth). The financial system fosterseconomic growth by providing payment and transaction services, enabling a more productiveallocation of society’s capital, and offering risk management tools (Allen et al. 2019). Thefinancial system thus stimulates the formation of capital (Pagano 1993) and spurs technologicalinnovation (King and Levine 1993; Comin and Nanda 2019). Both capital accumulation andinnovation have long been recognized as key drivers for economic growth (e.g., Lucas 1988;Rebelo 1991; Grossman and Helpman 1991; Aghion and Howitt 1992). Figure 1.1 offers aschematic overview of the financial system’s role in an economy.
Lenders,e.g., households
Savings
Financial marketsand intermediaries
� offer liquidityand payment services� allocate resources� manage risks
Borrowers,e.g., firms
Investments
Capitalaccumulation
Technologicalinnovation
Growth
Fig. 1.1: The functions of the financial system
Lenders of capital are primarily households that have saved surplus funds. Financial marketsand intermediaries transform these savings into funds, which for example can be used for invest-ments by firms. When markets are perfect and complete, financial systems which use resourcesto research projects, scrutinize managers, or design arrangements to ease risk management andfacilitate transactions are superfluous. In such a frictionless world, borrowers and lenders trans-act directly. The allocation of resources is Pareto efficient and intermediaries do not improvewelfare. However, as soon as one takes into account the presence of frictions, such as the costsof acquiring information, enforcing contracts and making transactions, financial markets andintermediaries more efficiently allocate economic resources both across borders and across time(Merton and Bodie 1995).
1
2 1 Introduction
Overall, empirical evidence indicates that the impact of the financial system on growththrough increased productivity and optimized resource allocation is more significant than capitalaccumulation (Beck et al. 2000). Specifically, access to financial services, e.g., credit, savings,and insurance, increases entrepreneurship and firm innovation (Klapper et al. 2006; Aghionet al. 2007; Ayyagari et al. 2011). Financial development is not only important for individualfirm growth or household welfare but also for the aggregate (economy-wide) growth. A well-developed financial system directs funds to their most productive use, fosters innovation andcompetition and improves governance across the economy (Kerr and Nanda 2009; Brown et al.2013). Clearly, a well-developed financial system is beneficial for firm and economic growth.
This dissertation provides insight on the function and infrastructure of the modern financialsystem. In general, it examines the aggregate economic welfare and specifically looks at thedifferent channels and mechanisms through which financial markets and institutions affect thereal economy at the firm level. The dissertation is made up of two parts. The first part (Chapter2, “Access to Banking and its Value for SMEs - Evidence from the U.S. Marijuana Industry” andChapter 3, “Contemporaneous Financial Intermediation - How DLT Changes the Cross-BorderPayment Landscape”) specifically deals with the two functions, financing as well as payment andtransaction services and how they affect firm growth. For centuries, these financial services wereessentially performed by banks alone (Quinn and Roberds 2008; Greenwood and Scharfstein2013). In developed countries, however, financial systems have recently undergone a dramatictransformation. In particular, the application of digital technology - with online banking, bigdata and cheap data processing - has not only transformed banks but also has created newcompetitors (FinTechs) in their core business. FinTechs frequently offer clients faster and moreflexible solutions at good rates, such as instantaneous payment services, reliable informationtracking, and new borrowing technologies (Ventura et al. 2015; Schwienbacher 2016). In thiscontext the role of traditional banks in developed countries must be reevaluated. Here, thenecessity of banks for financing and payment and transaction services for small- and medium-sized enterprises (SMEs) is examined in Chapter 2 (forthcoming as Merz and Riepe 2020). Theunique example of the U.S. marijuana industry, a young industry without access to banking butsituated in a highly financially developed environment, was utilized. Furthermore, the potentialof Distributed Ledger Technology (DLT) is examined in Chapter 3 (Merz 2020, currently underreview at the journal Information and Management). DLT is a novel and fast-evolving approachto record and share data among members of a decentralized network. This technology couldrevolutionize the cross-border payment system, a system traditionally relying on intermediarybanks.
The second part (Chapter 4, “Innovative Efficiency as a Lever to Overcome Financial Con-straints in R&D Contests” and 5, “Identifying Corporate Venture Capital Investors: A Data-Cleaning Procedure”) focuses on the connection between finance and innovation-led growth.Innovations typically result from investment in research and development (R&D). Like any
1 Introduction 3
investment, R&D projects require financial resources. Raising external financing, however, isassociated with several difficulties inherent to R&D projects (Hall and Lerner 2010). Not everyplanned innovation can be realized making R&D projects highly uncertain. This uncertaintymakes it hard for financiers to quantify the risk of an investment (Knight 1921). Additionally,often neither the innovator nor the financier knows the true potential of the project which ex-acerbates adverse selection (Stiglitz and Weiss 1981) and moral hazard problems (Holmström1989). This background makes it especially challenging for innovative start-ups to access financ-ing as they do not have creditworthiness and lack prior examples of technological capabilities(Hottenrott et al. 2016). Not surprisingly, it has been repeatedly found that large firms havehigher R&D budgets (Acs and Audretsch 1988; Foster et al. 2019). In reality, however, despitetheir higher R&D expenditures large firms often do not win innovation contests. This raises thequestion of innovative advantage, i.e., when are entrepreneurial firms more capable at generatinginnovations. In order to clarify the origin of this apparent contradiction, a theoretical model ispresented in Chapter 4 (published as Merz 2019) which explores the innovative advantages ofsmall firms over large firms. In order to compensate the success of small firms in innovationcontests, large firms have begun to develop their own venture capital (VC) programs, commonlyreferred to corporate venture capital (CVC). Recently, there has been a high research interest inCVC, but due to non-standardized definitions and data-cleaning procedures comparability andreplicability is difficult. Here, in Chapter 5 (published as Röhm et al. 2020) a common definitionof CVC and a data-cleaning procedure is proposed.
Taken as a whole, this dissertation provides a more thorough understanding of the modernfinancial system’s function and its utilized infrastructure in developed countries.


Part IBanks, The Allocation of Resources and Growth


Chapter 2Access to Banking and its Value for SMEs - Evidence fromthe U.S. Marijuana Industry
Abstract This paper examines how legally restricted access to banking services affects smalland medium-sized enterprises in a highly developed country. Using a mixed-method approach,we examine the unique situation of the U.S. marijuana industry. The industry benefits from thesuperior institutional environment in terms of legal protection and the labor market of the UnitedStates. However, due to conflicting state and federal laws it has no legal access to banking.Wefindsignificant value effects around three major events that affected future access to banking. Theseresults indicate that banking access remains desirable for the marijuana industry. A survey takenby marijuana SMEs provides insights into what banking services are considered most valuable.We find that marijuana SMEs have problems to obtain financing and handle their transactionslargely in cash, resulting in transaction inefficiency and high security concerns. Thereby, weshed light on the value of banks for SMEs in developed countries. We complement the literatureon financial transaction services by highlighting the value for SMEs in developed markets.
2.1 Introduction
Banks are a vital lifeline for the economy (Bernanke 2008). They supply capital to firms andfacilitate the exchange of goods and services (Levine 1997; Levine et al. 2000; Levine 2005;Song and Thakor 2010). In addition, they offer safekeeping depository services (Donaldson et al.2018).While in developed countries capital markets and other non-bank financial intermediariesalso fulfill these functions, a large number of studies have shown that access to bank financingis crucial for firms. This holds particularly true for SMEs. For example, Jayaratne and Strahan(1996), Bertrand et al. (2007), and Krishnan et al. (2014) examine the effects of gradual im-provements in the availability of loans due to bank branching deregulation in the United States.They find evidence that this bank deregulation results in increased productivity of small firmsand fosters economic growth. Gan (2007), Jiménez et al. (2012), Chodorow-Reich (2014), andHuber (2018) come to a similar conclusion based on the effect of bank distress or a change inmonetary policy on the local economy. Fracassi et al. (2016) and Berg (2018) show that theability to obtain loans increases firms’ survival probability, sales, and job creation. Beck et al.(2008) and Robb and Robinson (2014) also provide evidence that access to bank financing iscrucial for SMEs. Similar results are also found for developing countries (compare, e.g., Levine2005 or Ayyagari et al. 2013 for an in-depth overview). While all of these studies find thatbanks are crucial for financing, the other banking services remained unconsidered. Specifically,
7
8 2 Access to Banking and its Value for SMEs
payment and financial transaction services are known to be an essential banking function (Kohn1999; Donaldson et al. 2018). In their theory of banking, Donaldson et al. (2018) even cite safe-keeping depository services as a fundamental aspect of banks. However, there is only a limitednumber of empirical findings from developing countries, most of which focus on the Kenyanmobile money market. In this famous example, financial transaction services from M-Pesa areconsidered. This service enables customers who have limited or no access to a bank account tosend, receive and store money. Overall these studies show the importance of access to paymentand financial transaction services. Vaughan (2007), for example, reports that individuals use themobile payment service to store money safely when traveling across Kenya. Jack and Suri (2014)provide evidence that access to financial transaction services affects the risk-sharing behaviorof households. In particular, when faced with a financial shortage, households with access totransaction services are more likely to receive support from their network of family and friends.Plyler et al. (2010) and Beck et al. (2018) find that access to financial transaction services isnot only welfare-enhancing on the household level, but also growth-enhancing for SMEs. Ad-ditionally, Beck et al. (2018) show empirically that access to financial transaction and paymentservices also influences access to external lending. Today, considerably less is still known aboutthe value of bank-based transaction services in highly developed countries. Examples of firmsin developed countries without any banking access are hard to find.
Our study aims at filling this knowledge gap by using the unique situation of theU.S. marijuanaindustry. While this industry has access to all other well-developed institutions, such as thelegal system and the labor market, federal law inhibits the marijuana industry from using thetraditional banking system (see Hill 2015). In addition, in the United States, new alternativefinancial intermediaries from the digital world (FinTechs) now exist (Ventura et al. 2015; Millsand McCarthy 2016). These intermediaries frequently offer clients faster and more flexiblesolutions at good rates, such as instantaneous payment services, reliable information tracking,and new borrowing technologies. This calls into question whether in this setting traditional banksstill play a significant role. To understand the perceived importance of banking access for the U.S.marijuana industry in general, we apply an event study. We conduct event studies on three majoroccasions that affect the marijuana firms’ probability of gaining legal access to banking services.Using a mixed-method approach, the event study results are complemented by a detailed surveyamong marijuana SMEs (microbreweries serve as a control group). With our survey, we reassessthe legally restricted access to banking for unlisted firms and uncover specifically the SMEs’perspectives on the business challenges that arise from the legally denied access to banking in adeveloped country. Based on the literature, we expect that traditional banks are still perceived asimportant by the marijuana industry with particular desirability of the SMEs for bank financing.Although in developing countries it has been shown that transaction services are beneficial, inthe United States, alternative transaction methods to traditional banks exist. Therefore, using

2.2 The marijuana firms and the banking system 9
the results of the survey, it will be identified if transaction services by traditional banks are stillconsidered relevant.
2.2 The marijuana firms and the banking system
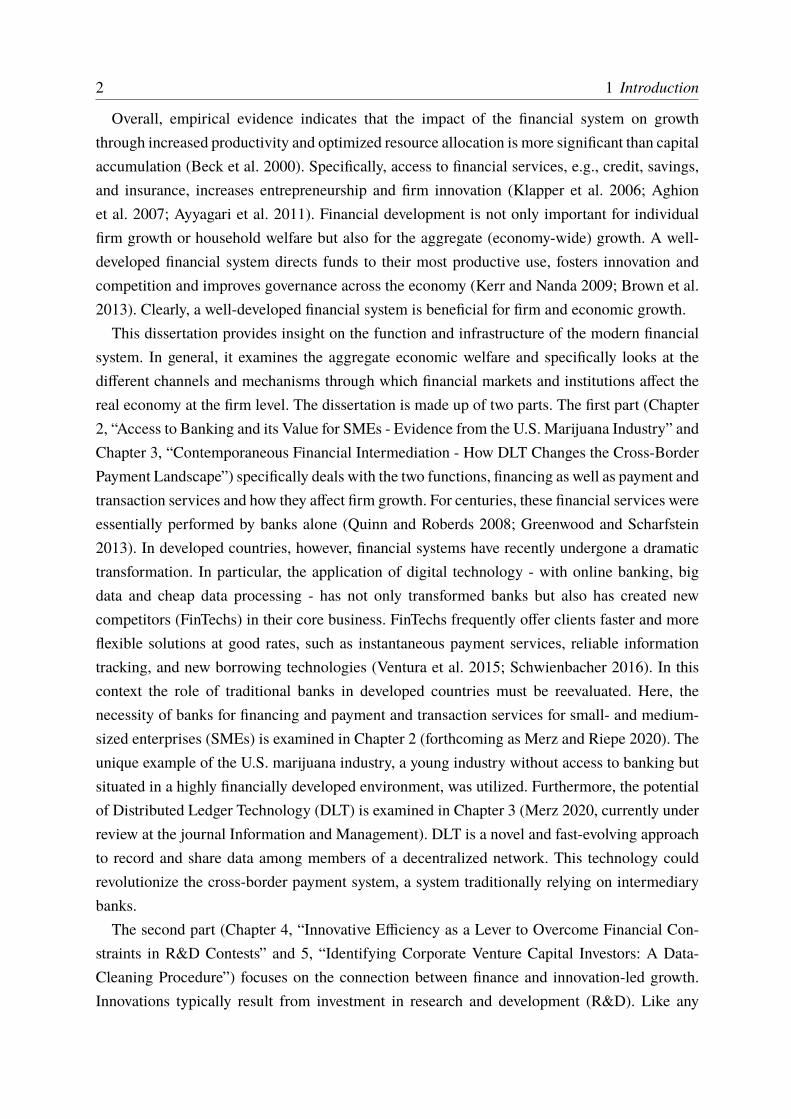
In the United States, marijuana is considered a Schedule I drug. This means that according to theControlled Substance Act, under federal law, it is illegal to possess, use, buy, sell, or cultivatemarijuana. This prohibition also includes providing banking services to marijuana firms. Despiteits federal controlled substance status, several states have legalized medical and recreationalpossession, use, sale, and cultivation of marijuana on a state level. In January 2014, Coloradobecame the first state where licensed and regulated retail stores could sell recreational marijuanato consumers. This jump-started a new industry. Washington State, Alaska, and Oregon soonfollowed suit. As of December 2019, eleven states have legalized recreational marijuana. About70% of the U.S. population now lives in states where retail and/or medical marijuana is allowed.According to Marijuana Business Daily™ (2019), industry sales in the United States increasedfrom about $2.7 billion in 2014 to up to $14 billion in 2019. Figure 2.1 shows the legal status ofmarijuana sales in each state.
WA
MT
OR
CA
NV
UT
AZ NM
TX
OK
KS
NE
WY
ID
ND
SD
IA
MN
WIMI
CO
IL
MO
AR
LA
MS AL GA
FL
SC
NCTN
KY
INOH
PA
WVVA
NY
VT
ME
NH
MD
DE
NJ
CTRI
MA
AK
HI
No Laws Legalizing Marijuana
Limited Medical
Medical Marijuana Legalized
Recreational Marijuana Legalized
Fig. 2.1: Marijuana laws by state, as of December 2019
Although marijuana is legalized to some extent in several states, the Department of Justicehas made clear that “[p]ersons who are in the business of cultivating, selling or distributingmarijuana, and those who knowingly facilitate such activities, are in violation of the ControlledSubstance Act, regardless of state law” (Cole 2011, p. 2). In other words, even in the faceof contrary state law, individuals, firms, and financial institutions that violate the Controlled
10 2 Access to Banking and its Value for SMEs
Substances Act can be prosecuted under federal law. While a marijuana firm operates accordingto the legal requirements of a single state, federal law directly affects banks. Although the UnitedStates’ dual banking system allows for both federal- and state-chartered institutions, the vastmajority of financial institutions are federally insured.1 With the benefit of federal insurancecomes the burden of federal regulation.
There are additional legal requirements that intensify the legal threat to financial institutions.As outlined in the Bank Secrecy Act (1970) and the Money Laundering Control Act (1986),federal law requires all financial institutions to report any illegal activity to federal officials andto prevent wrongdoers from accessing the banking system. In the words of Hill (2015, p. 617),these requirements lead to the problem that “a financial institution that knowingly processestransactions for marijuana-related businesses commits the crime of money laundering.” Anywrong-doing directly causes civil and criminal penalties for financial institutions that rangefrom costly fines to the closing of the institution. Anecdotal evidence in the Marijuana BusinessDaily™ (2015, p. 7) indicates that “most banks [...] will not move forward until the governmentissues actual new rules or changes the law.”
On February 14, 2014, the Department of Justice and the Department of the Treasury’sFinancial Crime Enforcement Network took a step towards easing the ban on marijuana firmsfrom the banking system. They jointly issued Guidance Fin-2014-G001 on how banks shouldhandle marijuana-related clients (Cole, 2014; Department of the Treasury Financial CrimesEnforcement Network, 2014) and announced their general intent to not prioritize the punishmentof banks engaging in business relationships with legal marijuana firms. The clarification wasperceived by market participants as a first step towards enabling banking access for marijuanafirms (Hill, 2015) and gave hope that the legal restrictions would soon be abandoned altogether.
After the issuance of the Guidance Fin-2014-G001, the Fourth Corner Credit Union (FCCU)was founded with the mission to provide banking services to marijuana firms. Despite initiallyappearing promising, the U.S. District Court’s ruling in Denver on January 5, 2016, ended theFCCU’s attempt to receive a Master Account for electronic money transactions and paymentservices with the Federal Reserve, hindering a fast change in the legal situation. In their ruling,the court prioritized the federal law over the Guidance Fin-2014-G001 and reiterated that banksare not legally allowed to have clients from the marijuana industry. The Court’s decision not onlyimmediately affected the FCCU, but also had declaratory power for all other financial serviceproviders in the United States.
On September 25, 2019, in a new attempt to harmonize federal and state law, the Secureand Fair Enforcement (SAFE) Banking Act was passed with a resounding 321-103 vote in thefederal House of Representatives. While the passing of the SAFE Banking Act in the House wasa first step enabling banking access, concerns that marijuana businesses violate federal laws werenot fully addressed. “Ultimately, the only federal action that could provide equitable financial
1 Even banks that operate under state charter rather than national charter use the Federal Reserve system for transferring funds and aregenerally supervised by the Federal Reserve, the National Credit Union Administration, or the Federal Deposit Insurance Corporation.

2.3 Data and method 11
services to the industry is a change in federal treatment of [...] marijuana” (Lawrence, 2019,p. 31). In addition, the initial euphoria of the marijuana industry about the landmark House votewas dampened shortly afterwards because it remains unclear how the measure might fare in theSenate and if President Trump would sign it into law.
2.3 Data and method
2.3.1 Empirical strategy
To explore the importance of banking services for marijuana firms, e.g., financing and financialtransaction services, we apply a mixed-method approach. To measure the necessity of bankingservices for the marijuana industry as a whole, we use the event study method. As events,the issuing of the Guidance Fin-2014-G001 regarding marijuana enforcement, the U.S. DistrictCourt’s unexpected ruling in 2016 as well as the U.S. House of Representatives vote on the SAFEBanking Act in 2019 were selected. All events mark milestones in the marijuana industry’s fightto gain legal access to the banking system. We expect to find positive (negative) abnormalreturns for events that increase (decrease) the likelihood of banking access if market participantsperceive banking services as important for the marijuana industry. To specifically understand theperspective of SME members of the marijuana industry on the importance of legal bank access,a detailed survey was conducted. As a control, similarly sized microbreweries were used. Similarto marijuana firms, microbreweries face multiple regulations at the federal and state level withrespect to producing, distributing, and selling their products (Anhalt 2016). However, in contrastto marijuana firms, microbreweries have legal access to banks. Additionally, they started growingin popularity in areas where and around the same time asmarijuana firmswere legalized (Elzingaet al., 2015; Brewers Association, 2017). Both microbreweries and marijuana firms belong tosin industries and thus share a number of other characteristics. Hong and Kacperczyk (2009)and Durand et al. (2013) show that in general sin firms have similar investors, receive lesscoverage from analysts and face greater litigation risk. We expect that if banking services areperceived as valuable for sin firms, respondents from the marijuana industry should more oftenthan microbreweries identify the lack of bank-related services as challenging. With the survey,we specifically examine the desirability of a) transaction and payment services and/or b) banklending for these industries. Based on the literature that has established the crucial role of accessto bank financing, we expect that our respondents have a particular desire for bank financing.

12 2 Access to Banking and its Value for SMEs
2.3.2 Event study
For the event study, we identified all listed U.S. firms that engage in marijuana-related businessactivities based on the Bloomberg Weed Index, firms mentioned in the 2014 and 2015 ViridianCannabis Industry Report, and firms mentioned by Weisskopf (2019). It was manually verifiedthat all firms conduct business in the marijuana industry. Overall, 87 firms from the marijuanaindustry that are listed on a stock exchange were identified. Thomson Reuters Datastreamprovides the corresponding stock prices for the marijuana firms. All time series are adjusted fornon-trading days. We deleted penny stocks below 10 cents and illiquid stocks that are tradedon less than 20% of all trading days within the respective estimation window. We also deletedstocks with less than 30 non-zero daily returns per year or missing return observations in the 20days before the respective event (Brown and Warner, 1985). Additionally, we do not considerreturns above 100% or equal to -100% on a single trading day and the subsequent reversals.Applying all of these criteria yields a sample of 28 firms for the first event, a sample of 28 firmsfor the second event and a sample of 30 firms for the third event. Overall, 52 unique marijuanafirms are considered. Some firms are considered in more than one event. A detailed list of allfirms included in the samples by marijuana industry activities and by stock exchange listings isprovided in Tables 2.11 and 2.12 in Appendix A.1.
All samples consist of firms within several marijuana industry activities, such as growers,providers and manufacturers of equipment or growing facilities, and more indirectly, firmsthat provide supplementary goods or services. While some of the firms were newly founded,other firms in the sample previously operated in other industries before becoming marijuanafirms, such as suppliers. With the exception of the producers, each sample’s distribution closelyresembles that of the marijuana industry. In all samples, a high number of firms is engaged inpharmaceutical research that includesmarijuana firmswhich distribute their products formedicalpurposes. While medical marijuana is legal in many states, only a limited number of states allowrecreational use (compare Figure 2.1). The marijuana producers are underrepresented in oursamples and in the stock market in general, most probably due to their limited bank access.
Table 2.1 reports the statistics for all events. The differences of the firms considered for theevent studies are reflective of the strong growth of the marijuana industry between February 2014and September 2019 (Marijuana Business Daily™ 2019). As a result, the findings offer insightinto the marijuana industry at different stages. A typical (median) marijuana firm in our sampleof the first (second/third) event has 7 (10, 27) employees, total assets of $1.52 ($3.70, $13.25)million and annual revenues of $120,000 ($530,000, $5,020,000). The market capitalizationof the underlying stocks one day prior to the first (second/third) event window ranges from$21.53 ($7.01, $25.11) million at the 25th percentile to $176.99 ($22.85, $187.68) million at the75th percentile with a median of $55.38 ($10.03, $37.72) million. The portfolio returns of each

2.3 Data and method 13
Table 2.1: Descriptive statistics event study
N Mean St. dev P25 Median P75Event 1Number of Employees 023 38 72 4 7 38Revenues [in million $] 028 $9.27 $23.79 $0.00 $0.12 $5.38Total Assets [in million $] 028 $19.89 $65.40 $0.05 $1.52 $7.10Market cap [in million $] 028 $184.61 $346.48 $21.53 $55.38 $176.99Portfolio returns 239 0.86 % 2.78 % −1.03 % 0.39 % 2.57 %Event 2Number of Employees 028 46 109 4 10 21Revenues [in million $] 028 $18.55 $62.86 $0.08 $0.53 $10.17Total Assets [in million $] 028 $33.99 $78.25 $1.47 $3.70 $25.89Market cap [in million $] 028 $123.51 $407.37 $7.01 $10.03 $22.85Portfolio returns 239 −0.11 % 1.92 % −1.39 % −0.22 % 1.14 %Event 3Number of Employees 030 63 78 6 27 78Revenues [in million $] 030 $45.37 $148.50 $0.33 $5.02 $31.31Total Assets [in million $] 030 $100.37 $241.10 $3.78 $13.25 $99.57Market cap [in million $] 030 $224.13 $510.21 $25.11 $37.72 $187.68Portfolio returns 239 0.01 % 1.96 % −1.23 % 0.01 % 1.00 %
This table displays the statistics of the equally weighted portfolio of all marijuana shares that are used forthe event studies. Number of Employees refers to the reported number of employees of the underlying firmsat the time of the event. Note that for Event 1, a few firms did not report the exact number of employees.Revenues refer to the firms revenues in millions of USD that were disclosed in the financial report taken mostclosely to the event day. Total Assets refer to the firms total assets in millions of USD that were disclosed inthe financial report taken most closely to the event day. Market cap refers to the market capitalization of theunderlying stocks in millions of USD one day prior to the event window, respectively. Portfolio returns referto the daily returns over the samples’ estimation periods.
sample are small but mostly positive and the distribution of returns becomes less dispersed forlater events.
The event study method closely follows Brown and Warner (1985). For the event study, weform an equally weighted portfolio of the identified marijuana firms. We use the market modelto calculate the abnormal portfolio returns as well as the abnormal returns for all single stocks.We use different market benchmarks to mitigate any confounding effects of parallel marketmovements on the event day. We start with a beta factor of zero and a risk-free rate of zeropercent. Furthermore, we estimate firm-specific model parameters with the S&P 500 Indexas well as the S&P 600 Food, Beverage, & Tobacco Index as alternative market benchmarks.We discuss in detail only the results attained using the market benchmark of the S&P 600Food, Beverage, & Tobacco Index since it measures the performance of similar sin industries.As previously mentioned, sin firms differ from other firms with respect to investors, analystcoverage and litigation risk (Hong and Kacperczyk 2009; Durand et al. 2013). We rely ondifferent time frames preceding the three events. Due to the possibility that the issuing of theGuidance Fin-2014-G001 might have leaked into the market early, we start one trading daybefore the event in the earliest specification. For the court ruling, we base our main reasoning

14 2 Access to Banking and its Value for SMEs
on the event day and the days afterwards because the judgment surprised the market. Due to thefact that the vote on the SAFE Banking Act was announced one trading day before the actualevent, we start at minus one. All the event windows go up to two days after because most firmsare traded infrequently so it might take more than a day before the information is reflected in theprices. Overall, the results appear robust for the different event windows with smaller variations.All results remain qualitatively unchanged with respect to the different market benchmarks. Thisindicates that our findings can be traced back to abnormal movements in the marijuana firms’stock prices.
2.3.3 Survey design and sample
To understand the perspective of marijuana SMEs and to identify how these firms cope withthe lack of legal access to banking in their day-to-day business, we developed a survey. Thesurvey was designed based on the well-established “Survey on the access to finance of SMEs”by the European Commission and the European Central Bank. The questions are adjusted andcomplemented to address challenges specific to the marijuana industry. The survey containsobjective questions (e.g., “Does your company currently have a business account with an U.S.American bank?”), that are complemented by subjective questions (e.g., “What in your opinionwould be the biggest benefit of access to banking in regards to money transactions for yourcompany?”). In addition, in order to limit bias stemming from socially desirable answers, weincluded questions that are constructed as “ideal experiments” (Hall 2008, p. 418). For example,to assess whether limited access to bank financing hinders firm growth we ask respondents forthe first reaction in case of unexpected costs. The survey questions are provided in AppendixA.2.
The paper-based survey was conducted directly by visiting dispensaries in the Denver areaas well as at the 2017 National Cannabis Industry Association’s (NCIA’s) Seed-to-Sale Show.One of the authors personally distributed 70 surveys to qualified personnel, for example, storemanagers or owners, to be sent back viamail. Herewe received ten responses. At the 2017NCIA’sSeed-to-Sale Show, one of the authors personally surveyed managers and owners of marijuanaSMEs. In order to limit a potential sample bias stemming from a fear to disclose illegal activityby marijuana SMEs, complete anonymity was promised to any potential respondent. Four outof five respondents were willing to participate in the survey.2 In total, 58 marijuana SMEsparticipated in the survey. The survey sample includes very small firms (dispensaries) withdirect customer contact as well as medium-sized firms that mainly supply other marijuana firms.
In the survey, most participants responded to all questions. Table 2.2 provides the summarystatistics of the respondents and their firms. About 43% of the respondents were business owners
2 Two additional responses were received by distributing the survey through an industry contact. Another two responses were receivedthrough follow-up calls via telephone.

2.3 Data and method 15
Table 2.2: Summary statistics on respondents
Marijuana firms MicrobreweriesN=58 N=24
Position of respondent N in % N in %Owner 25 43 % 16 67 %Executive director 10 17 % 06 25 %Non-executive director & other 23 40 % 02 8 %Working experience in the firmLess than 1 year 14 24 % 01 4 %1 year and more 44 76 % 23 96 %U.S. stateColorado 42 72 % 10 42 %California 07 12 % 07 29 %Other 09 16 % 07 29 %Industry sectorDispensary with integrated grow 26 45 %Infused product maker 12 21 %Wholesale grower 09 16 %Ancillary technology 06 10 %Ancillary services 05 08%Owners of firmsOne owner 30 52 % 05 21 %Multiple people 25 43 % 19 79 %Venture capital enterprises 02 03% 00 00%Public shareholders 01 02% 00 00%Age of firmsLess than 2 years 15 26 % 07 29 %2-4 years 17 29 % 07 29 %5-10 years 24 43 % 09 38 %More than 10 years 02 02% 01 4 %Firm size by employeeMicro firms 26 45 % 16 67 %Small firms 23 40 % 07 29 %Medium-sized firms 09 15 % 01 04%Annual turnoverUp to $100000 16 30 % 03 13 %Over $100000 and up to $1 million 16 30 % 15 65 %Over $1 million and up to $5 million 12 22 % 05 22 %Over $5 million 10 18 % 00 00%Average growth rate in the last 2 yearsOver 50 % 26 51 % 05 21 %Between 20 and 50 % 14 27 % 07 29 %Less than 20 % 08 16 % 05 21 %Stayed about the same size 03 06% 07 29 %Did you (at least) break-even?Yes 37 64 % 17 71 %Not yet 21 36 % 7 29 %
This table displays the summary statistics of the respondents and the marijuanafirms/microbreweries the respondents work for. We report the respondents’ position and theirworking experience in the firm. Additionally, we report the firm’s characteristics such as loca-tion, industry sector, ownership structure, age, and size in terms of the number of employees,and annual turnover. Micro firms are firms with 1-9 employees, while small firms are thosewith 10-49 employees and medium-sized firms have 50-249 employees. We report the averagegrowth rate over the last two years measured by turnover and whether the firms broke-even in thelast year. We obtained 58 responses to our marijuana survey, but not all respondents providedinformation on the annual turnover and the average growth rate. We obtained 24 responses toour microbrewery survey, but not all respondents provided information on the annual turnover.

16 2 Access to Banking and its Value for SMEs
of marijuana SMEs, followed by non-executive directors such as store managers (∼40%) andexecutive directors (∼17%). Most respondents had worked in the firm for over a year. Giventheir position as well as their working experience in the industry, our respondents should bevery knowledgeable about the business activities and their firms’ access to banking services.Regarding the geographic scope, our sample is heavily focused on Colorado (72%) that is theoldest, most developed, and largest market for legal marijuana in the United States. Informationfrom the remaining surveys indicates a similar, albeit less advanced, situation in other states.With around 45%, nearly half of our sample consists of dispensaries with integrated growingfacilities. The other 55% of surveys come from SMEs that mainly do business with othermarijuana firms.
About two-thirds of the marijuana sample firms have already broken even and consequentlycan rely on internal cash flow as a source of financing. Although 43% of our sample firmsgrew more than 50% in terms of turnover, their overall size remains small. Only 18% of thesurveyed SMEs self-report revenues of more than $5 million.3 Furthermore, the marijuana firmsare on average young, because state licenses were only granted following legislation in 2010 formedical and after 2014 for recreational uses. Regarding the ownership structure, most marijuanaSMEs are owned by a family or a single entrepreneur.
To better attribute our results to the marijuana firms’ lack of access to banking and not to theoverall characteristics of young SMEs, we conducted an online survey among U.S. Americanmicrobreweries as a control. Using the results of the subjective questions it is possible toexplain differences in behavior between the control group and the marijuana firms (Bertrandand Mullainathan 2001). In total 24 microbreweries participated. Apart from access to bankingservices, the microbreweries in our control sample closely resemble the surveyed marijuanaSMEswith respect to age, size, and geographical location (see Table 2.2).Most of the respondentswere business owners or executive managers from Colorado (∼42%). About two-thirds of thesurveyed microbreweries have less than ten employees, and none of them self-reports revenuesof more than $5 million. Thus, the microbreweries in our sample are on average smaller than themarijuana SMEs. As a result of their smaller size and also of their slightly shorter history, themicrobreweries should be on average more financially constrained. Similar to most marijuanaSMEs, microbreweries are owned by a family or a single entrepreneur.
2.4 Results
2.4.1 Event studies’ results
Table 2.3 reports the event study results for the Guidance Fin-2014-G001. Column 1 depictsthe average abnormal returns (AARs) per trading day, i.e., the portfolio returns. The according
3 Bhue (2018) reports similar revenues for marijuana firms in Washington State.

2.4 Results 17
Table 2.3: Event 1: Guidance Fin-2014-G001
Panel A: Market benchmark of S&P 600 Food, Beverage, & Tobacco IndexAverageabnormal Positive/ Cumulative average abnormal returnsreturns t-stats Negative (-1,2) (-1,1) (0,1) (0,2) (1,2)
t-2 +0.92% 0.40 13/15t-1 +3.46% 1.52 16/12 5.67 % 8.02 % 4.56 % 2.21 % −1.23%Event day +3.44% 1.51 14/14 1.25 2.04** 1.42 0.56 −0.38t+1 +1.12% 0.49 14/14t+2 −2.35% −1.03 08/20
Panel B: Market benchmark of S&P 500 IndexAverageabnormal Positive/ Cumulative average abnormal returnsreturns t-stats Negative (-1,2) (-1,1) (0,1) (0,2) (1,2)
t-2 +0.91% 0.40 13/15t-1 +3.20% 1.41 16/12 5.47 % 7.71 % 4.51 % 2.27 % −1.14%Event day +3.41% 1.50 14/14 1.20 1.96* 1.40 0.58 −0.35t+1 +1.10% 0.48 14/14t+2 −2.24% −0.98 07/21
Panel C: Zero-return benchmarkAverage Positive/abnormal No change/ Cumulative average abnormal returnsreturns t-stats Negative (-1,2) (-1,1) (0,1) (0,2) (1,2)
t-2 +1.86% 0.81 15/2/11t-1 +4.17% 1.82* 18/2/08 9.32 % 10.61 % 6.44 % 5.15 % 0.77 %Event day +4.38% 1.91* 16/5/07 2.03** 2.67*** 1.99** 1.30 0.24t+1 +2.06% 0.90 14/2/12t+2 −1.29% −0.56 09/1/18
This table displays the event study results for the Guidance Fin-2014-G001. The average abnormal returns (AARs)correspond to the excess returns with respect to three different benchmarks. In Panel A, the AARs are calculatedagainst the S&P 600 Food, Beverage, & Tobacco Index as the market benchmark; Panel B uses the S&P 500 Indexas a broad market benchmark; Panel C relies on the zero-return benchmark. Significance is calculated based on atwo-sided t-test. Column 3 displays the number of individual marijuana firms that have abnormal positive (negative)returns on the specific trading day. The cumulative average abnormal returns are calculated based on five differentevent windows. The ∗∗∗, ∗∗, and ∗ represent significance at the 1%, 5%, and the 10% levels.
two-sided t-statistics are displayed in Column 2. Column 1 shows that the portfolio returnsare positive on the event day and the day before. As the guidance was largely expected andinvolved many parties (see, e.g., Altman 2014), some investors had already traded based onthis information. Apart from the portfolio returns, we also explore the individual securities toidentify whether all firms are affected in a similar fashion or whether the aggregated resultsare dominated by a small number of marijuana firms. For the event day and the trading daybefore, we see that the vast majority of individual stocks show positive abnormal returns. Whenexamining differences within the marijuana industry, positive abnormal returns on the eventday were detected for all sectors, except for consulting firms. This result is logical because the

18 2 Access to Banking and its Value for SMEs
dominant role of consulting firms in the marijuana industry is brokering private financing. Inthis case access to banking could be perceived as negative.
In a second step, we accumulate the AARs over different event windows. The positive effect isespecially strong for the event window of -1 to +1, where we find a significant cumulative averageabnormal return (CAAR) of around 8% for the marijuana stocks. In Panel B and C of Table2.3, the results are reported for the market benchmark of the S&P 500 Index and the zero-returnbenchmark. For both benchmarks, we still find significant CAARs for the event window of -1 to+1.
The event day is the same for all sample firms. To avoid bias in our results stemming from con-temporaneous correlations among abnormal returns, we apply the standardized cross-sectionaltest by Kolari and Pynnönen (2010). The results remain qualitatively unchanged (compare Table2.16 in Appendix A.3.1). This also holds true when applying parametric and non-parametrictests (compare Tables 2.17 and 2.18 in Appendix A.3.1). During the considered time period,there were no other confounding events that affected the stock market in general, the marijuanaindustry or any individual member of the marijuana industry sample. This thus indicates thatthe abnormal returns stem from the perceived substantial economic benefits that banking accesswould provide. In addition, the results are significant in economic terms. For the event window of-1 to +1, the average (median) marijuana stock increased its equity value by $14.8 million ($4.4million). Even after accounting for general market trends, these gains remain economically sub-stantial for the firms and their shareholders. Applying the dividend discount model (DDM) forthe event day yields an implied growth rate of about 9.9%. To put this into context, we estimatethe maximum sustainable growth rate according to Demirgüç-Kunt and Maksimovic (1998) as9% for the marijuana industry portfolio. Thus, predicted legal access to banking services affectsthe marijuana industry’s growth by about 0.9%.4
In Table 2.4, the event study results for the court ruling against the FCCU on January 5, 2016are displayed. The portfolio returns around the event are positive on the days before the courtruling and the returns drop on the event day and turn negative. The significant positive AARsprior to the court ruling indicate the high hope for a positive court ruling and a fundamentalchange in the industry’s access to banking. This hope was made clear in statements from industryrepresentatives in the days before the court ruling. In contrast to the expectation of the industry,the FCCU’s suit was rejected. Most marijuana stocks are traded on over-the-counter (OTC)markets at a low trading volume and frequency resulting in an often delayed trading. In addition,the local (Coloradan) court ruling slowly reached the industry and investors. For example, eventhe directly related Credit Union National Association only reported the judgment three daysafterwards (Credit Union National Association 2016). These are possible explanations for thenegative average abnormal return detected two days after the court ruling. When examiningdifferences within the marijuana industry, negative abnormal returns on the days following the
4 For more details on the estimations of the growth rates, see Appendix A.4.

2.4 Results 19
Table 2.4: Event 2: The Fourth Corner Credit Union Case
Panel A: Market benchmark of S&P 600 Food, Beverage, & Tobacco IndexAverageabnormal Positive/ Cumulative average abnormal returnsreturns t-stats Negative (-1,2) (-1,1) (0,1) (0,2) (1,2)
t-2 +3.60% 2.08** 16/12t-1 +3.50% 2.02** 11/17 −3.78% −0.17% −3.67% −7.28% −4.80%Event day −2.48% −1.43 12/16 −1.09 −0.06 −1.50 −2.43** −1.96**t+1 −1.19% −0.69 12/16t+2 −3.61% −2.08** 08/20
Panel B: Market benchmark of S&P 500 IndexAverageabnormal Positive/ Cumulative average abnormal returnsreturns t-stats Negative (-1,2) (-1,1) (0,1) (0,2) (1,2)
t-2 +3.71% 2.14** 14/14t-1 +3.45% 1.99** 11/17 −3.50% −0.14% −3.59% −6.95% −4.35%Event day −2.60% −1.50 14/14 −1.00 −0.05 −1.47 −2.31** −1.77*t+1 −0.99% −0.57 11/17t+2 −3.36% −1.93* 12/16
Panel C: Zero-return benchmarkAverage Positive/abnormal No change/ Cumulative average abnormal returnsreturns t-stats Negative (-1,2) (-1,1) (0,1) (0,2) (1,2)
t-2 +3.44% 1.98** 13/6/09t-1 +3.09% 1.78* 09/6/13 −4.76% −0.92% −4.01% −7.85% −5.15%Event day −2.70% −1.56 11/4/13 −1.37 −0.31 −1.63 −2.61*** −2.10**t+1 −1.31% −0.76 06/6/16t+2 −3.84% −2.21** 07/5/16
This table displays the event study results around the court ruling against The Fourth Corner Credit Union. The averageabnormal returns (AARs) correspond to the excess returns with respect to three different benchmarks. In Panel A,the AARs are calculated against the S&P 600 Food, Beverage, & Tobacco Index as the market benchmark; Panel Buses the S&P 500 Index as a broad market benchmark; Panel C relies on the zero-return benchmark. Significance iscalculated based on a two-sided t-test. Column 3 displays the number of individual marijuana firms that have abnormalpositive (negative) returns on the specific trading day. The cumulative average abnormal returns are calculated basedon five different event windows. The ∗∗∗, ∗∗, and ∗ represent significance at the 1%, 5%, and the 10% levels.
court ruling are detected for all sectors except for consulting firms. In the case of the accumulatedtime frame 0 to +2, we find a statistically significant negative CAAR of about -7.3% resultingfrom the rejection of the FCCU’s suit. In other words, the court ruling led to a value declineof about $9 million ($0.7 million) for the average (median) member of the marijuana industry.Although the second event has a less significant effect than the first event, the overall economicimpact to the industry remains strong. Applying the DDM for the event day yields an impliedgrowth rate of about 10.2%. In comparison, the estimated maximum growth rate is 11.3%. Thus,the perceived setback to gaining legal banking access reduced growth by about 1.1%. Panel Bof Table 2.4 displays the results for the market model where the S&P 500 Index serves as the

20 2 Access to Banking and its Value for SMEs
benchmark. Panel C of Table 2.4 gives the results for the zero-return benchmark. Similar to ourbaseline case, we find significant cumulative average abnormal returns for the event window of 0to +2 resulting from the legally denied access to banking. Again, our results remain qualitativelyunchanged when applying parametric and non-parametric tests (compare Tables 2.19, 2.20 and2.21 in Appendix A.3.2). Upon examination for confounding events, it was identified that theU.S. stock market in general was affected by turbulence in the Chinese stock market. In addition,there were concerns about the Chinese economy that led to a strong decline of mainly export-oriented firms in the S&P 500 Index during the event window.5 Since the U.S. marijuana industrydoes not export to China, this event should not significantly affect the marijuana stocks. In otherwords, without the court ruling against the FCCU, marijuana stocks should have outperformedthemarket. Thus, the identified negative CAARs are significant. In order to confirm that spillovereffects on marijuana stocks from our sample listed in the NYSE and NASDAQ were not thesole drivers of the negative returns, we reaffirm our results with a portfolio solely consistingOTCmarket stocks. In conclusion, our results can largely be traced back to the continued deniedaccess to banking.
Table 2.5 illustrates the event study results for the U.S. House of Representatives votingon the SAFE Banking act in 2019. Column 1 shows positive portfolio returns on the day ofthe voting and negative returns on the days before and afterwards. The unclear pattern of thereturns imminently around the vote appears rather surprising. It can, however, be understoodby considering the news coverage of the vote. One day prior to the scheduled vote, there wererumors that the vote for the bill could be delayed. In addition, the vote was scheduled “undersuspension of the rules”, i.e., as a take it or leave it proposition that must be approved by atwo-thirds majority in the House, making a success seem less likely. In the end, however thevote on the SAFE Banking Act took place and was passed with an overwhelming majority. Inaddition to the Democrats, surprisingly nearly half of the Republican caucus voted for the bill.The initial euphoria of the marijuana industry was subdued by the likely failure of the bill in theSenate (a positive vote in the House of Representatives and the Senate is necessary to pass a billinto a law). Moreover, while the SAFE Banking Act improves the status quo, it does not ensurefinancial services to the marijuana industry. This led to a significant negative portfolio return of-5.66% in the cumulative event window of +1 to +2. In Panel B and C of Table 2.5, the resultsare reported for the market benchmarks of the S&P 500 Index and the zero-return benchmark.For both benchmarks, we still find significant negative CAARs for the event window of +1 to +2.Again, our results remain qualitatively unchanged if we apply parametric and non-parametrictests (compare Tables 2.22, 2.23 and 2.24 in Appendix A.3.3). The results are also significantin economic terms. For the event window of +1 to +2 the average (median) value of marijuanafirms declined by about $12.7 million ($2.1 million). Applying the DDM for the event day yieldsan implied growth rate of about 10.6%. In comparison, the estimated maximum growth rate
5 For more information, see Koptis (2016) and NBC NEWS (2016).

2.4 Results 21
Table 2.5: Event 3: The SAFE Banking Act
Panel A: Market benchmark of S&P 600 Food, Beverage, & Tobacco IndexAverageabnormal Positive/ Cumulative average abnormal returnsreturns t-stats Negative (-1,2) (-1,1) (0,1) (0,2) (1,2)
t-2 +0.20% 0.13 09/21t-1 −2.48% −1.70* 06/24 −6.16% −3.45% −0.97% −3.68% −5.66%Event day +1.98% 1.36 14/16 −2.11** −1.37 −0.47 −1.46 −2.75***t+1 −2.95% −2.02** 07/23t+2 −2.71% −1.86* 08/22
Panel B: Market benchmark of S&P 500 IndexAverageabnormal Positive/ Cumulative average abnormal returnsreturns t-stats Negative (-1,2) (-1,1) (0,1) (0,2) (1,2)
t-2 +0.30% 0.21 09/21t-1 −2.05% −1.41 08/22 −5.56% −3.00% −0.95% −3.51% −5.39%Event day +1.88% 1.30 13/17 −1.91* −1.19 −0.46 −1.39 −2.62***t+1 −2.83% −1.95* 07/23t+2 −2.56% −1.76* 09/21
Panel C: Zero-return benchmarkAverage Positive/abnormal No change/ Cumulative average abnormal returnsreturns t-stats Negative (-1,2) (-1,1) (0,1) (0,2) (1,2)
t-2 +0.28% 0.19 09/3/18t-1 −2.64% −1.80* 04/4/22 −6.26% −3.34% −0.70% −3.62% −5.92%Event day +2.30% 1.57 12/6/12 −2.14** −1.32 −0.34 −1.43 −2.87***t+1 −3.00% −2.05** 05/6/19t+2 −2.92% −2.00** 06/6/18
This table displays the event study results around the voting by the U.S. House of Representatives on the SAFEBanking Act. The average abnormal returns (AARs) correspond to the excess returns with respect to three differentbenchmarks. In Panel A, the AARs are calculated against the S&P 600 Food, Beverage, & Tobacco Index as themarket benchmark; Panel B uses the S&P 500 Index as a broad market benchmark; Panel C relies on the zero-return benchmark. Significance is calculated based on a two-sided t-test. Column 3 displays the number of individualmarijuana firms that have abnormal positive (negative) returns on the specific trading day. The cumulative averageabnormal returns are calculated based on five different event windows. The ∗∗∗, ∗∗, and ∗ represent significance at the1%, 5%, and the 10% levels.
is 14.5%. Thus, the reiterated legally denied access to banking services lowers the marijuanaindustry’s growth by about 3.9%. To ensure that our results can be traced back to the deniedaccess to banking services, we again searched for confounding events. While the marijuanaindustry in general was only affected by this vote, three firms of our sample were also affected byfirm-specific announcements. In particular, Kushco Holdings announced a secondary offeringone day after the voting that negatively affected its stock. In contrast, CBDMD and UnitedCannabis both announced new partnerships on the event day and the day afterward, respectively.Still, the main results remain qualitatively unchanged if we exclude these three firms.

22 2 Access to Banking and its Value for SMEs
In summary, the event studies’ results show that the marijuana industry perceives legal accessto banking as crucial. More information about how typical marijuana firms, i.e., SMEs, copewith the restricted access to banking will be attained from the survey presented in the followingsection.
2.4.2 Survey results
2.4.2.1 Financial transaction management
Financial transaction and payment services are one of the most prominent economic functionsof banks. Levine (1997) refers to them as “easing the exchange of goods and services.” Financialtransaction and payment services refer to the exchange of goods and services with the firms’customers, suppliers, investors, and with the tax authorities. Panel A of Table 2.6 providesevidence on how the surveyed marijuana SMEs and microbreweries handle their transactionswith customers, suppliers, and other parties.
It is shown that marijuana SMEs handle most of their transactions with either cash or checks.6More than two-thirds report cash as their main source of revenue from customers and clientsfollowed by checks (approximately one-third). Bank-based transactions do not play a major rolein the revenues of most marijuana SMEs. Considering how they pay their suppliers, investors,and similar parties, all three forms of transactions are important. Checks, however, are usedmost often. Surprisingly, no firm listed alternative payment services like Bitcoins as their majortransaction platform. In comparison, firms that do have access to banking, i.e., microbrew-eries, heavily rely on bank-based transactions. 79% of the microbreweries report bank-basedtransactions as their major source of revenues and none pay their bills in cash.
Although most marijuana firms rely predominantly on cash for transactions, over half of thesurveyed firms have a bank account. This result is surprising as banks usually reject a clientor terminate the business relations as soon as they become aware of the marijuana businessactivity. Although 12 SMEs indicate that they circumvented the rules by operating at least sometransactions via their private or a third-party bank account, thirty SMEs report that they managedto open a corporate bank account. To the subjective question about whether they believe to havea long-term relationship 64% answered “yes”. Based on additional comments by the respondents(e.g., “I hope that this time it is a long-term relationship”), this result is more an indication forthe desire to have a stable banking relationship and less indicative of the current situation.
Still, and as indicated by the previous responses, these bank accounts are not used by mostmarijuana SMEs to handle their main payment transactions. One reason might be the permanent
6 Note that there are several forms of checks, e.g., cashier’s check, that do not require a bank account (compare, e.g., Stavins 2018 for anoverview of the different payment instruments in the United States). The check can be cashed in at regular cash or retail stores. Althoughthese non-bank money services are also subject to federal law and thus will not knowingly accept money from marijuana-related firms.However, if cash amounts are small, few questions are asked.

2.4 Results 23
Table 2.6: Financial transaction management
Panel A: Handling of financial transactionsMarijuana firms Microbreweries
How do you receive most of your revenue? N=44 ★ in % N=24 in %Cash 31 70 % 1 04%Check 13 29 % 4 17 %Via a bank 3 07% 19 79 %Via a non-bank (e.g., Bitcoin) 0 00% 0 00%How do you pay most of your bills? N=45 ★Check 18 40 % 9 38 %Cash 16 36 % 0 00%Via a bank 15 33 % 15 63 %Via a non-bank (e.g., Bitcoin) 0 00% 0 00%
Panel B: Access to banking of marijuana firmsDoes your firm currently have a bank account? N=56 in %Yes, directly 30 54 %Yes, indirectly (e.g., private account) 12 21 %No 14 25 %Perceived stability of bank relationship N=39Long-term 25 64 %Short-term 10 26 %Terminable 4 10 %Did the bank reject or close your account? N=56Yes 31 55 %No 25 45 %★ Multiple answers possible
Panel A of this table displays the responses on the handling of money transactions by marijuana firms andmicrobreweries. We report how firms receive revenues and pay their bills. In panel B, we report how manymarijuana firms currently have bank accounts and how often bank accounts were closed as well as their perceivedstability of the banking relationship. Note that for some questions we received multiple answers.
threat that the bank discovers their status as marijuana firms and freezes or terminates theirbank accounts. This threat also prevents marijuana SMEs from establishing a closer bank-clientrelationship that could overcome information asymmetries (Kysucky and Norden 2015). Whendirectly asked, more than 50% of the respondents indicate that, due to their status as a marijuanafirm, they had been rejected by a bank or their existing bank account had been terminated.
When asked for the most important and strongest benefit of having a regular bank account tohandle transactions, most respondents name a reduction in risk (see Table 2.7). With an averagescore of 4.43 out of five, more than 80% expect that having a bank account would significantlyreduce the risk of day-to-day business operations. With a regular transaction account, these firmswould face lower risk of being robbed, of misappropriation by employees, as well as of crimesrelated to money laundering. This is in line with anecdotal evidence. To pay his taxes JerredKiloh from United Cannabis Business Alliance, for example “ha[s] to use a six-story parking

24 2 Access to Banking and its Value for SMEs
Table 2.7: Benefits of access to electronic payment services via banks
Significant% with differences in
Mean 4 or 5 mean score H0: MeanRow Benefits score score N vs. rows score = 3(1) Reduced risks 4.43 83 % 46 2–5 ***(2) Reduced time 3.83 63 % 46 1,5 ***(3) More satisfied customers 3.83 35 % 46 1,5 ***(4) Reduced costs 3.74 63 % 46 1,5 ***(5) More satisfied suppliers 3.22 48 % 46 1–4
This table reports the survey responses on the benefits of access to electronic payment services offered bybanks. Respondents were asked to indicate the level of importance on a scale of 1 (not at all beneficial) to5 (very beneficial). Column 3 reports the mean score where higher values correspond to larger benefits.Column 4 presents the percent of respondents who indicated the beneficial levels of 4 or 5 (somewhatbeneficial and very beneficial). Column 5 displays the number of respondents. Column 6 reports the resultof a t-test of the null hypothesis that the mean score for a given benefit is equal to the mean score for eachof the other benefits, where only significant differences at the 5% level are reported. Column 7 reports thet-test of the null hypothesis that each mean score is equal to three (neither beneficial nor not beneficial).The ∗∗∗, ∗∗, and ∗ indicate statistical significance at the 1%, 5%, and 10% levels, respectively.
structure 500 yards from the [local] office of finance and walk through a homeless encampmentwith a duffel bag full of cash” (as cited in Chiang 2017, p. 13).
In addition to the reduction in risk, respondents state that a bank account would increase theiroperating efficiency by reducing time and costs, as well as improving customer satisfaction.The extra resources spent on counting money and handling transactions could be used to getadditional funding. Currently, it is very labor and time intensive to ensure that each transactionis made correctly and on time. With an average of around 3.8 out of 5, the three effects areperceived as equally important, although the average is significantly lower than that of riskreduction. The lack of access to the bank transaction services appears to not be a relevant factorfor the suppliers’ satisfaction.
Overall, Tables 2.6 and 2.7 indicate the challenges of marijuana SMEs in handling financialtransactions. The lack of legal access to banks makes these firms operate with cash and checks.These options cause a threat to the firms’ security and reduce their operating efficiency, therebyhampering growth. Without widespread access to payment services, credit repayments to non-banks are also subject to theft, which decreases the creditworthiness of the firms.
2.4.2.2 Bank loans and credit lines
A second banking service that is typically crucial for SMEs is lending (see, e.g., Berger andUdell 1998; Robb and Robinson 2014). Bank lending includes standard loans and short-termliquidity facilities, such as overdrafts or credit lines. Unlike larger established firms, young SMEslack access to public institutional debt and capital markets. The fluctuations in SMEs’ profits

2.4 Results 25
make free cash flow a less stable source of financing, making them more dependent on bankloans (Beck et al. 2008). However, irrespective of the size, firms rely heavily on credit lines oroverdraft facilities to handle temporary fluctuations in the firms’ cash flows. Figure 2.2 showshow marijuana SMEs cope with the lack of access to bank lending for their current and futurebusiness activities.
!
"
#
$
%
&
'
(
)
!
!"#$%&
'()$*+
,$*-'
()$*+
.!$/&'0!&/"%'
)!'1$2%)!"*3
,$*-'4#&!/!$5%
'')!'0!&/"%'("*&
()$*+'5!)6'
''''''4%7&!'
'0)68$*"&+
!"#$%&'
9:;"%<
!"#$%&%'
!"##$%&'( )% "*$ !+%*),$#$, )& -$*)#./'$ /"& )%.00$**)/'$
=*%&!*$>'
Fig. 2.2: Financing sources of marijuana SMEs
Figure 2.2 and Panel A of Table 2.8 show that most marijuana SMEs rely on internal fundingas their major source of financing. Whenever available in a sufficient quantity, internal fundingis usually an easy way of financing new and profitable operations. Most surveyed SMEs statethat internal funds were available at least to some degree. However, firms that heavily rely oninternal cash flow to finance investments tend to systematically underinvest and are classified asfinancially constrained (Almeida et al. 2004; Almeida and Campello 2007). This in turn holdsback firm and ultimately economic growth (Beck et al. 2005; Ayyagari et al. 2008).
Figure 2.2 also shows that most marijuana SMEs finance their operations with private loansfrom friends, family members, wealthy private individuals, and private equity. Although privateloans and private equity can have desirable features, they are usually more costly than traditionalbank loans. According to Marijuana Business Daily™ (2016), these private loans are availablefor an average interest rate of 11%. In comparison, the U.S. Small Business Administrationoffers financing to SMEs not served by traditional banks and (only) charges between 5.75% and8.25%. The more sophisticated financing instruments, such as factoring or trade credit, appearto be irrelevant for most marijuana SMEs.
Bank lending is not a major financing source for marijuana SMEs. Less than 20% have accessto bank overdrafts or credit lines and less than 10% rely on bank loans, most likely via theirprivate accounts. About 68% (43%) state that bank loans (overdraft facilities) are desirable butinaccessible (see Panel A of Table 2.8). The lack of bank funding is most probably the result

26 2 Access to Banking and its Value for SMEs
Table 2.8: Bank loans and credit lines
Panel A: Financing sources of marijuana firmsCurrently or Considered it Desirable,previously for the but Notin use future inaccessible relevant
Financing sources N in % N in % N in % N in %Internal funds (N=56) 45 80 % 09 16 % 00 00% 02 04%Private loans (N=56) 32 57 % 06 11 % 00 00% 18 32 %Private equity (N=56) 21 38 % 19 34 % 00 00% 16 29 %Loans from other firms (N=55) 11 20 % 16 29 % 01 02% 27 49 %Bank overdraft or credit line (N=54) 10 19 % 07 13 % 23 43 % 14 26 %Trade credit or factoring (N=55) 08 15 % 15 27 % 06 11 % 26 47 %Bank loans (N=56) 04 07% 08 14 % 38 68 % 06 11 %Issuing debt (N=55) 02 04% 06 11 % 06 11 % 41 74 %Public equity (N=56) 01 02% 17 30 % 05 09% 33 59 %Most preferred external financing source (N=56) N in %Bank loans 26 47 %Equity capital (private or public) 16 29 %Loans from other sources 08 15 %None 06 11 %
Panel B: Financing sources of microbreweriesCurrently or Considered it Desirable,previously for the but Notin use future inaccessible relevant
Financing sources N in % N in % N in % N in %Private loans (N=24) 16 67 % 01 04% 01 04% 06 25 %Internal funds (N=24) 13 54 % 04 17 % 01 04% 06 25 %Bank loans (N=24) 10 42 % 08 33 % 02 08% 04 17 %Bank overdraft or credit line (N=24) 09 38 % 06 25 % 00 00% 09 38 %Trade credit or factoring (N=24) 04 17 % 04 17 % 01 04% 15 63 %Private equity (N=24) 03 13 % 08 33 % 00 00% 13 54 %Loans from other firms (N=24) 02 08% 04 17 % 00 00% 18 75 %Public equity (N=24) 01 04% 02 08% 03 13 % 18 75 %Issuing debt (N=24) 00 00% 02 08% 02 08% 20 83 %
Panel C: Financial constraints of marijuana firms and microbreweriesMarijuana firms Microbreweries
Reaction in case of unexpected costs N=56 in % N=24 in %Raising capital 32 57 % 18 75 %Cut back investments 12 21 % 03 13 %Delay payments of suppliers 06 11 % 02 08%Lay off employees 03 05% 00 00%Increase the price of products 02 04% 00 00%Delay wage payments 01 02% 01 04%Restricting growth opportunities N=58Yes 40 69 % 06 25 %No 18 31 % 18 75 %
This table reports the survey responses related to the financing of marijuana firms and microbreweries. Panel A and Bdisplay several financing sources that are used, considered, or desired by the firms. Panel C shows the first reaction incase of unexpected costs for marijuana firms and microbreweries. It further shows whether these firms see themselves asfinancially constrained.
2.4 Results 27
of the legal situation. When directly asked, about 47% admit that bank loans are their mostpreferred source of new funding.
The surveyed microbreweries also heavily rely on internal funds and private loans. In com-parison, however, bank loans are their third major financing source. 42% of the surveyed micro-breweries state that they currently use bank loans and another 33% considers to apply for one(compare Panel B of table 2.8). Furthermore, about 38% currently use bank overdrafts or creditlines to finance their business.
Overall, the results in Table 2.8 show that marijuana SMEs lack access to bank lending butwould prefer bank loans, credit lines and overdraft facilities to finance their future operations. Themarijuana firms’ inability to access bank lending causes the firm to be financially constrained.About 69% state that these financing obstacles hold back their firms’ growth. In contrast, onlya quarter of the microbreweries appear to be financially constrained and stated that they arerestricted in their growth due to lack of funding. Consequently, marijuana SMEs suffer fromtheir lack of access to bank financing.
2.4.2.3 Transaction services, bank lending, and other challenges
Our survey results indicate that the lack of legal access to banking services restricts marijuanaSMEs in both financing and transactions. We now assess the relative importance of the twofunctions and explore their effects compared to other common challenges of SMEs. Panel A ofTable 2.9 shows the perceived benefits of banking services. When asked about the most usefulbanking service, over 50% of the respondents state deposit and savings accounts. Thereby, thebanks’ service for storing and safeguarding money is perceived as highly important. The accessto banks’ lending (∼26%) and money transfer services (∼24%) appear to be equally importantto marijuana SMEs.
Panel B of Table 2.9 displays the major challenges marijuana SMEs face, including the lackof access to banking services. Tax rules are the dominant concern of marijuana SMEs with64% mentioning this as one of their main problems.7 Access to finance is the second majorconcern (∼50%). This is in line with the previously stated results. Financial transactions withcustomers and/or suppliers are only a minor concern. It appears that marijuana SMEs haveadapted to the legal restriction by using cash payments. However, the frequent handling of largecash transactions increases security concerns dramatically. Security is the fourth most importantconcern of marijuana SMEs and is even ranked higher than concerns regarding the attractionof customers or finding sufficiently skilled employees and suppliers. These security concerns inturn negatively affect the creditworthiness of the firm because the credit repayment is subject totheft, intensifying the financing problems.
7 Since marijuana is a Schedule I controlled substance, the IRS has used section 280E to disallow marijuana firms from deducting theirordinary and necessary business expenses. The result is that marijuana firms face much higher taxes than similar companies in otherindustries.

28 2 Access to Banking and its Value for SMEs
Table 2.9: Transaction services, bank lending, and other challenges
Panel A: Most useful banking serviceBanking service (N=46∗) N in %Deposit/Savings account 24 52 %Credit 12 26 %Money transfer 11 24 %Insurance/Foreign exchange 00 00%* Multiple answers possible
Panel B: Major challenges for marijuana firmsSignificant
% with differences inMean 4 or 5 mean score H0: Mean
Row Challenges score score N vs. rows score = 3(1) Tax rules 3.71 64 % 56 3–11 ***(2) Access to finance 3.34 50 % 56 4–11 *(3) Bureaucracy 3.07 45 % 56 1,7–11(4) Security concerns 2.81 36 % 58 1–2,8,10–11(5) Competition 2.82 25 % 56 1–2,8,10–11(6) Costs of production and labor 2.84 24 % 58 1–2,8,10–11(7) Availability of skilled staff 2.60 23 % 57 1–3,10–11 **(8) Financial business transactions 2.23 20 % 56 1–6,10 ***(9) Customer payments 2.25 16 % 44 1–3,10 ***(10) Finding suppliers 1.75 09% 56 1–9 ***(11) Finding customers 1.88 07% 56 1–7 ***
This table reports the overall importance of different banking services. Panel A displays which banking service is perceived as the mostuseful for marijuana firms. Panel B reports the survey responses on the major challenges that marijuana firms faced in the last six months.Respondents were asked to indicate the level of difficulty of different challenges on a scale of 1 (not an issue) to 5 (very difficult).Column 3 reports the mean score, where higher values correspond to greater difficulty. Column 4 presents the percent of respondentswho indicate difficulty levels of 4 or 5 (somewhat difficult and very difficult). Column 5 displays the number of respondents. Column 6reports the results of a t-test of the null hypothesis that the mean score for a given challenge is equal to the mean score for each of theother challenges, where only significant differences at the 5% level are reported. Column 7 reports the t-test of the null-hypothesis thateach mean score is equal to three (neither easy nor difficult). The ∗∗∗, ∗∗, and ∗ indicate statistical significance at the 1%, 5%, and 10%levels, respectively.
As a control, the major challenges of typical, young SMEs are illustrated by the exampleof U.S. American microbreweries in Figure 2.3. Bureaucracy is the dominant concern of mi-crobreweries with 46% mentioning this as one of their main problems, followed by tax rules.This is consistent with the findings from marijuana SMEs. Although 38% of the surveyed mi-crobreweries mentioned access to finance as the third major concern, they rated it on averagesignificantly lower. With a mean value of 2.67 (compared to 3.34 for marijuana SMEs) accessto finance appears to be rather a minor issue. This is also confirmed by the fact that finding cus-tomers is almost as challenging as getting financing for microbreweries. Looking at the handlingof financial transactions and security concerns, the value of banking services becomes evenmore obvious. In contrast to the marijuana SMEs, none of the microbreweries rated customerpayments or security as major concerns.

2.4 Results 29
Fig. 2.3: Major challenges for marijuana SMEs and microbreweries
Table 2.10 reinforces the impressions from Figure 2.3. Compared to similar SMEs with legalaccess to banking services, marijuana SMEs have significantly more difficulties in handlingtransactions (with customers and other firms) and getting additional funding. In line with thepreviously stated results, the lack of legal access to bank-based transaction services increasessecurity significantly.8
Table 2.10: Comparisons for challenges of marijuana SMEs and microbreweries
Marijuana firms Microbreweries H0: EqualityChallenges Mean St. dev Mean St. dev of meansTax rules 3.71 1.45 2.92 1.18 **Access to finance 3.34 1.43 2.67 1.63 *Bureaucracy 3.07 1.43 3.25 1.26Security concerns 2.81 1.33 1.71 0.81 ***Competition 2.82 1.13 2.71 1.30Costs of production and labor 2.84 1.15 2.83 1.24Availability of skilled staff 2.60 1.21 2.25 1.03Financial business transactions 2.23 1.36 1.71 1.23 *Customer payments 2.25 1.28 1.33 0.57 ***Finding suppliers 1.75 1.07 1.29 0.62 **Finding customers 1.88 0.99 2.38 1.13 *
This table reports the mean score and standard deviation of survey responses on the major challenges thatmarijuana firms and microbreweries faced in the last six months. Respondents were asked to indicate thelevel of difficulty of different challenges on a scale of 1 (not an issue) to 5 (very difficult). The last columnreports the result of a Welch t-test of equal means between the two different firm groups. The ∗∗∗, ∗∗, and ∗
indicate a statistical significance difference in means at the 1%, 5%, and 10% levels, respectively.
As shown by Ayyagari et al. (2008), only obstacles related to finance, crime, and policyinstability directly affect firms’ growth. It appears thatmicrobreweries do not face these obstacles.
8 As previously mentioned, the significant difference in tax rules results from the huge tax burdens marijuana firms face.

30 2 Access to Banking and its Value for SMEs
As a result, most microbreweries (∼75%) stated that the current business environment is notrestricting their growth. In comparison, 69% of the surveyed marijuana SMEs are hindered intheir growth because they lack access to banking services.
In summary, our findings substantiate the importance of legal access to banking for youngSMEs in developed countries. In particular, widespread access to banking services would allevi-ate the growth constraints for marijuana SMEs. Access to bank loans is needed to finance futureoperations whereas access to bank-based transaction services reduces the firms’ risk, improvestheir operating performance, and increases the firms’ creditworthiness.
2.5 Critical assessment and further research
In total, our empirical analysis gives significant insights into the value of banking services fordeveloping industries in the United States, based on findings from the marijuana industry. Inorder to ensure that the results of the three event studies are not driven by any effects stemmingfrom differences in the sample, we graphically analyzed the eight firms that are examined inall events and show that our results are also valid for this subgroup (compare Figures 2.4, 2.5and 2.6 in Appendix A.3.4). In the event studies, we examine the value of legal banking accessfor the marijuana industry. Although we carefully selected events which affect the legality ofthe marijuana industry’s access to banking, the changes in stock prices and the correspondingabnormal returns only reflect investors’ changing expectations. Thus, it is only an indirectindicator for the valuation of legal banking access by the industry, which could be biased. Forexample, investors could incorrectly estimate firms’ ability to cope with adverse regulatorydevelopments, i.e., that the actual impact of the event is less positive/negative than investorsexpect. It is possible that our results are partly driven by other channels. For example, thebanking announcement may proxy for the demand channel rather than the value of bankingservices. In the future a more accurate value of banking access could be attained by analyzinga binding law change. Alternatively, in future studies, abnormal returns from the events couldbe compared to abnormal returns surrounding other industry (non-banking) announcementsrelated to the marijuana industry. However, the only important other industry (non-banking)announcements that took place during the examined time frames were votes on legalization inseveral states. For Colorado, these took place back in November 2012, a time when investorinterest in marijuana was low. For several other states, the vote on legalization coincided withthe presidential election in 2016, making it impossible to estimate meaningful abnormal returns.
With the survey, we specifically examine the perspectives of SMEs that are directly involvedin the production and distribution of marijuana, on the business challenges that arise from thelegally denied access to banking. As with all surveys, it is possible that our sample suffers froma bias. For example, respondents that maintain bank accounts illegally might be less likely to
2.6 Conclusion 31
participate in the survey out of fear that their activity will be disclosed. Although the bias shouldbe limited because complete anonymity was ensured; four out of five asked respondents filledout the survey and of those a large number illegally uses a bank account. In addition, basedon a later and larger survey with different questions, Berger and Seegert (2020) report verysimilar results to our work here. As a result, although the survey sample size here was small, thefindings appear to be representative. Officially reported marijuana firm data from WashingtonState also substantiates the relevance of our results (compare, Bhue 2018). It is also possiblethat some respondents systematically overstate the value of legal access to banking due to socialdesirability or their short firm history. Several types of questions, i.e., subjective, objective,direct and indirect questions, have been used to limit this bias. In addition, all results are robustfor the subgroup of respondents that have worked at least one year for the firms. In the survey,the high perceived value for bank-based financial transaction services is identified. Specifically,the heightened security risk as a results of large cash amounts is frequently cited. Now thatmarijuana has been legalized in over ten states, a larger multi-state study could be used to verifythe general validity of the findings.
Based on the combined methods presented here, it can be discerned that the industry as awhole perceives legal banking access as highly desirable. Due to the inhomogeneity of theexamined samples, it is not possible to directly link the worth of legal banking access identifiedin the event studies with the high valuation of bank financing transaction services by marijuanaSMEs.
2.6 Conclusion
This study uses a mixed-method approach to analyze the real economic value of legal bankingservices for the U.S. marijuana industry. While this industry has access to the superior institu-tional environment of the United States, the conflict between federal and state laws prevents anylegal banking access.
In an event study, we find statistically strong and economically significant value consequencesaround three events that are significant for determining the marijuana industry’s future bankingaccess. These results indicate that despite the superior institutional environment offered by ahighly developed country, the marijuana industry still perceives widespread access to banking ascrucial. In order to understand if financing and/or transaction services are perceived as desirableby the industry, we conducted a comprehensive survey.Microbreweries (a similar industry in sizeand revenues) were used as a control. As expected, in our survey more young marijuana SMEsthan microbreweries identify financing as challenging. Many marijuana SMEs struggle to findfinancing comparable to that offered by banks: cheap and reliable. As a result, they more oftencited being financially constrained. This indicates that widespread access to bank lending would

32 2 Access to Banking and its Value for SMEs
help marijuana firms grow. Surprisingly, after access to finance, security concerns were citedas one of the largest challenges facing marijuana SMEs. Contrarily, despite being in a similarindustry segment, microbreweries do not consider security a concern. Without legal access tobanking services marijuana firms are forced to use cash to complete financial transactions. Thesetransactions are perceived as inefficient and significantly increase security concerns due to largelevels of cash present in the firms. Our results indicate that in addition to access to financing,SMEs consider access to efficient payment and transaction services as substantially important foralleviating their financial constraints and stimulating their growth. The insights initially providedhere are further supported by an ongoing larger study from Berger and Seegert (2020).
In summary, based on our results, even in highly developed countries, the services of traditionalbanks remain desirable. In line with the large body of existing studies, SMEs still rely onfinancing from banks. Additionally, the marijuana industry identifies transaction services as oneof the most desirable bank functions. From studies largely done in Kenya, the importance oftransaction services was previously identified. In these studies, however, the widespread andsuccessful use of solely a transaction service was examined. In line with the results here, onecritical aspect of transaction services is an increase of security due to a reduction of large cashamounts. In the United States similar transaction service providers exist. This fact in context withthe research from Kenya, makes the marijuana industry’s high valuation of bank’s transactionservices surprising. Based on the study here, this result cannot be conclusively explained. It is,however, possible that due to their long-standing presence, banks today play a too integral partin transaction processing within the United States, preventing widespread use of alternates.
Acknowledgements This chapter is adapted from my publication “SMEs with Legally Restricted Banking Access - Evidence fromthe U.S. Marijuana Industry” in the Journal of Business Economics in 2020. It was joint work with Jan Riepe from the EberhardKarls University of Tübingen and was partly written during my stay at Cass Business School, London. We thank Thorsten Beck,Tobias Berg, Christoph Börner, Martin Brown, Ulf Brüggemann, Hans-Peter Burghof, Marc Deloof, Patrick Kampkötter, Werner Neus,Markus Nisch, Anh D. Pham, Andreas Pfingsten, Marc S. Rapp, David T. Robinson, Zacharias Sautner, Anna Staerz, Matthias Sutter,Tereza Tykvova, Theresa Veer, Laurent Weill, audiences at the Entrepreneurial Financial Management Conference 2017, Academy ofEntrepreneurial Finance (Europe) Conference 2017, World Finance Conference 2017, Research Seminar of Rotterdam University 2017,Münsteraner Bankenworkshop 2017, the Finance Research Workshop of Cass Business School 2018, the HERMES Franco-GermanDoctoral Seminar 2019, three anonymous reviewers and the managing editor (Wolfgang Breuer) for very helpful and constructivecomments.

A Appendices 33
A Appendices
A.1 Sample firms
Table 2.11: Sample firms
Event 1 Event 2 Event 3Industry sector Company name Company name Company nameProducer GROWBLOX SCIENCES UNITED CANNABIS
UNITED CANNABIS
Industrial AERO GROW INT. AERO GROW INT. AERO GROW INT.GREENGRO TECH. TERRA TECH GROWGENERATIONGROWLIFE TWO RIV. WATER FRMG. KUSHCO HLDG.TERRA TECH TERRA TECHTWO RIV. WATER FRMG. TWO RIV. WATER FRMG.
Pharma/Research 22ND CENTURY GROUP 22ND CENTURY GROUP 22ND CENTURY GROUPARENA PHARMA. ARENA PHARMA. ARENA PHARMA.CV SCIENCES CARA THERAPEUTICS AXIM BIOTECH.INSYS THERAPEUTICS CV SCIENCES CANNABICS PHARMA.NEUTRA EMERALD BIOSCIENCE CANNAPHARMARXPAZOO INSYS THERAPEUTICS CARA THERAPEUTICSPHARMACYTE BIOTECH. NEUTRA CV SCIENCESVERDE SCIENCE PAZOO EMERALD BIOSCIENCE
ZYNERBA PHARMA. INSYS THERAPEUTICSZYNERBA PHARMA.
Consulting CHUMA HLDG. AMERICANN AMERICANNDIRECTVIEW HLDG. GROW CAPITAL MARIMEDGREEN TECH. SLTN. MARIMED MJ HLDG.ML CAPITAL GROUP STWC HLDG.
Technology AVT DIGIPATH DIGIPATHENDEXX LIFELOC TECH. ENDEXXMCIG MASSROOTS LIFELOC TECH.NHALE MYDX TECHCARETECHCARE TECHCARE
Real Estate GENERAL CANNABIS GENERAL CANNABIS GENERAL CANNABISZONED PROPERTIES INNOV. INDL. PROPS.
Consumer FOREVERGREEN WWD. CANNABIS SATIVA CANNABIS SATIVAHEALTHIER CHOICES MAN. EARTH SCIENCE TECH. CBDMD (ASE)HEMP FOREVERGREEN WWD. EARTH SCIENCE TECH.VAPE HLDG. HEALTHIER CHOICES MAN. FOREVERGREEN WWD.
ROCKY MOUNT. HIGH
This table displays the firm samples for the event studies.

34 2 Access to Banking and its Value for SMEs
Table 2.12: Sample characteristics event study
Panel A: By industry sectorEvent 1 Event 2 Event 3
Industry sector [Number of firms] [Number of firms] [Number of firms]Producer 0 2 1Industrial 5 3 5Pharma/Research 8 8 10Consulting 4 3 4Technology 5 5 4Real Estate 2 1 2Consumer 4 6 4Total 28 28 30
Panel B: By listing typeEvent 1 Event 2 Event 3
Stock market [Number of firms] [Number of firms] [Number of firms]OTC PINK 16 7 5OTCQB 7 13 13OTCQX 2 3 4NASDAQ 2 4 5NYSE 1 1 3Total 28 28 30
This table displays the distribution of marijuana stocks by industry sector and by listing type. The industry sectors areadopted from Bloomberg. Producers are medical marijuana growers and recreational cultivators. Industrial firms aremanufacturers of equipment or growing facilities used by the marijuana industry. Pharmaceutical research firms de-velop and/or research cannabis-based therapeutics and medicines. Consulting firms provide consulting, management,marketing, and/or financial services to the marijuana industry. Technology firms develop marijuana breathalyzersand/or provide software and technology solutions to the marijuana industry. Real estate firms acquire, lease, and/ordevelop real estate properties and growing facilities for the marijuana industry. Consumer firms are producers andmanufacturers of hemp- or cannabis-based products, such as nutraceuticals, fibers, fabrics, and/or vaporization prod-ucts.

A Appendices 35
A.2 Survey
Part A: Company Background Information
1. In which U.S. state are your headquarters located?
2. In which year did your company start operating in the marijuana industry?
3. How long have you been with the company?
4. What is your position in the company?
5. How many people does your company currently employ in full-time equivalents?
6. Who owns the largest stake in the company?
� One owner (yourself or another single person)� Multiple people (e.g., a family or several entrepreneurs)� Another company� Public shareholders (it is listed on the stock market)� Venture capital enterprises or business angels� Other, please specify:
7. Which sector of the marijuana industry is your company currently in? (If you havebusinesses in more than one, please choose the one in which you spend most of yourtime/ have the most active role.)
� Wholesale grower� Infused product maker (edibles, topicals, concentrates, etc.)� Dispensary or recreational store with integrated grow or processing� Dispensary or recreational store without integrated grow or processing� Testing lab� Ancillary services (i.e., law firms, consultants, accountants, education, etc.)� Ancillary technology or products (i.e., consumption devices, software, lighting, etc.)

36 2 Access to Banking and its Value for SMEs
8. What was the annual turnover of your company within the last year?
� Up to $100,000� Over $100,000 and up to $500,000� Over $500,000 and up to $1 million� Over $1 million and up to $5 million� Over $5 million and up to $10 million� Over $10 million and up to $50 million� Over $50 million
9. Over the past two years, how much did your company grow on average per year interms of turnover?
� Over 50%� Between 20% and 50%� Less than 20%� Stayed about the same size� Became smaller
10. Did you (at least) break even last year?
� Yes� No

A Appendices 37
11. How difficult have the following been for your company in the last six months?
Not an Veryissue difficult1 2 3 4 5
Finding customers � � � � �
Customer payments � � � � �
Finding suppliers � � � � �
Financial business transactions(e.g., paying employees, vendors, etc.) � � � � �
Competition � � � � �
Costs of production and labor � � � � �
Access to finance(financing your business) � � � � �
Availability of skilled staffor experienced managers � � � � �
Bureaucracy(e.g., business license application) � � � � �
Tax rules � � � � �
Security concerns � � � � �
Other, please specify: � � � � �

38 2 Access to Banking and its Value for SMEs
Part B: Access to Banking and Financing of Your Company
1. Which banking service would be most useful for your company?
� Deposit/Savings account� Money transfer� Foreign exchange� Credit� Insurance
2. Does your cannabis company currently have a business account with an U.S. Americanbank or credit union?
� Yes, direct relationship with the bank/credit union� Yes, via a third party (i.e., holding companies, financial intermediaries, etc.)� No (please continue with question 4)
3. How stable do you consider your company’s banking relationship?
� Terminable� Short-term� Long-term
4. Have you ever been rejected by a bank, i.e., were unable to open a bank account, or thebank closed your account?
� Yes, please specify:
� No
5. How do you receive most of your revenue?
� Cash� Electronic funds transfer via a bank (e.g., direct deposit/debit)� Check� Electronic transfer via a non-bank third party (e.g., Bitcoin)� Other, please specify:

A Appendices 39
6. How do you pay most of your bills?
� cash� electronic funds transfer via a bank (e.g., direct deposit/debit)� check� electronic transfer via a non-bank third party (e.g., Bitcoin)� other, please specify:
7. What in your opinion would be the biggest benefit of access to banking in regards tomoney transactions for your company?
Not Verybeneficial beneficial
1 2 3 4 5
Reduced cost offinancial transactions � � � � �
Reduced time offinancial transactions � � � � �
Reduced risk offinancial transactions � � � � �
More satisfied suppliers � � � � �
More satisfied customers � � � � �
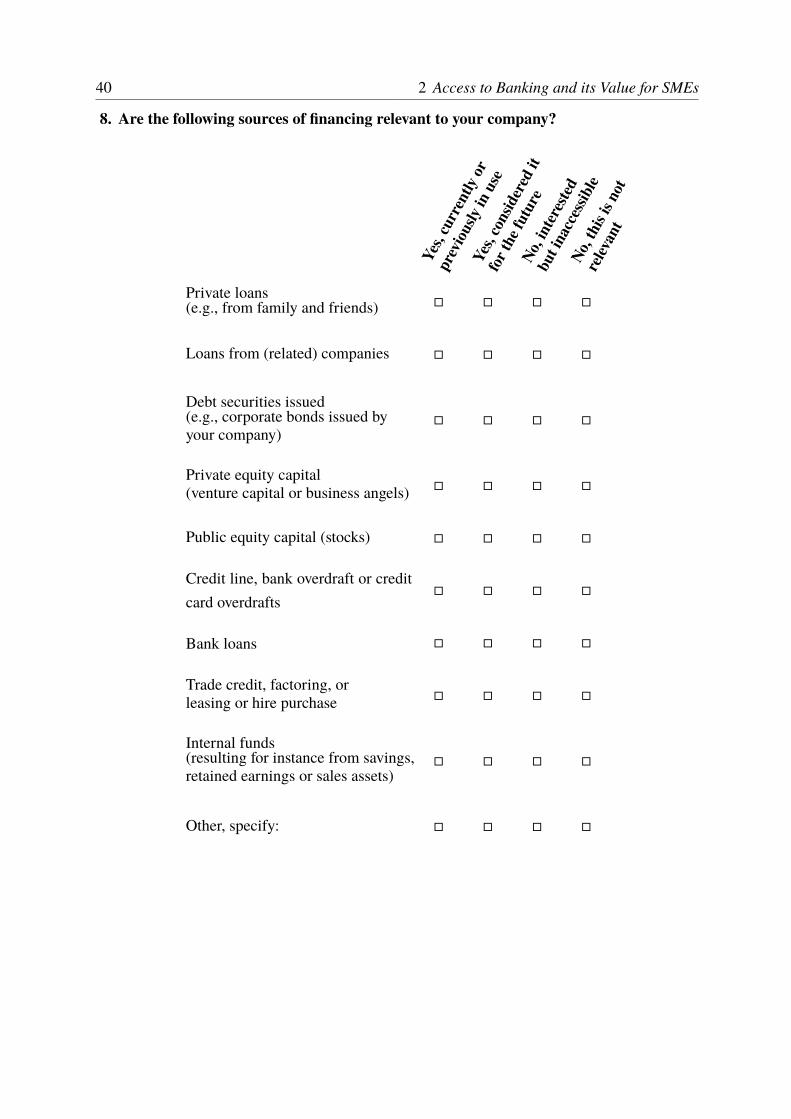
40 2 Access to Banking and its Value for SMEs
8. Are the following sources of financing relevant to your company?
Yes,currently
or
previou
slyinuse
Yes,conside
red it
forthe future
No, in
terest
edbut inaccess
ible
No, th
isisnot
relev
ant
Private loans(e.g., from family and friends) � � � �
Loans from (related) companies � � � �
Debt securities issued(e.g., corporate bonds issued byyour company)
� � � �
Private equity capital(venture capital or business angels) � � � �
Public equity capital (stocks) � � � �
Credit line, bank overdraft or creditcard overdrafts
� � � �
Bank loans � � � �
Trade credit, factoring, orleasing or hire purchase � � � �
Internal funds(resulting for instance from savings,retained earnings or sales assets)
� � � �
Other, specify: � � � �

A Appendices 41
9. What type of external financing would you prefer most to help your company grow?
� Equity capital (e.g., venture capital, business angels or stocks)� Bank loans� Loans from other sources (e.g., trade credit, related company, or family)� Not applicable because of sufficient internal funds (e.g., savings, or sales assets)� Other, please specify:
10. What would be your first reaction in the case of unexpected costs (e.g., replacement ofstorage furniture, new transport vehicles, etc.)?
� Raising capital (e.g., from owners)� Cut back investments� Close the business� Delay wage payments� Delay payments of suppliers� Increase the price of products� Layoff employees� Other, please specify:
11. Is the current business financing environment (i.e., the limited access to banking)restricting growth opportunities for your company?
� Yes, please specify:
� No

42 2 Access to Banking and its Value for SMEs
A.3 Robustness tests - event studies
A.3.1 Event 1: Guidance Fin-2014-G001
Table 2.16: Event 1 with the standardized cross-sectional test by Kolari and Pynnönen (2010)
Panel A: Market benchmark of S&P 600 Food, Beverage, & Tobacco IndexAverageabnormal Positive/ Cumulative average abnormal returnsreturns C % Negative (-1,2) (-1,1) (0,1) (0,2) (1,2)
t-2 +0.92% 0.52 13/15t-1 +3.46% 1.83* 16/12 5.67 % 8.02 % 4.56 % 2.21 % −1.23%Event day +3.44% 1.84* 14/14 1.56 2.11** 1.83* 0.79 −0.48t+1 +1.12% 0.53 14/14t+2 −2.35% −1.54 08/20
Panel B: Market benchmark of S&P 500 IndexAverageabnormal Positive/ Cumulative average abnormal returnsreturns C % Negative (-1,2) (-1,1) (0,1) (0,2) (1,2)
t-2 +0.91% 0.52 13/15t-1 +3.20% 1.85* 16/12 5.47 % 7.71 % 4.51 % 2.27 % −1.14%Event day +3.41% 1.82* 14/14 1.49 2.06** 1.77* 0.80 −0.45t+1 +1.10% 0.52 14/14t+2 −2.24% −1.50 07/21
Panel C: Zero-return benchmarkAverage Positive/abnormal No change/ Cumulative average abnormal returnsreturns C % Negative (-1,2) (-1,1) (0,1) (0,2) (1,2)
t-2 +1.86% 1.06 15/2/11t-1 +4.17% 2.58*** 18/2/08 9.32 % 10.61 % 6.44 % 5.15 % 0.77 %Event day +4.38% 2.28** 16/5/07 2.58** 2.91*** 2.51** 1.78* 0.30t+1 +2.06% 0.98 14/2/12t+2 −1.29% −0.88 09/1/18
This table displays the event study results for the Guidance Fin-2014-G001. The average abnormal returns (AARs)correspond to the excess returns with respect to three different benchmarks. In Panel A, the AARs are calculatedagainst the S&P 600 Food, Beverage, & Tobacco Index as the market benchmark; Panel B uses the S&P 500 Indexas a broad market benchmark; Panel C relies on the zero-return benchmark. Significance is calculated based onthe two-sided standardized cross-sectional test by Kolari and Pynnönen (2010). Column 3 displays the number ofindividual marijuana firms that have abnormal positive (negative) returns on the specific trading day. The cumulativeaverage abnormal returns are calculated based on five different event windows. The ∗∗∗, ∗∗, and ∗ represent significanceat the 1%, 5%, and the 10% levels.

A Appendices 43
Table 2.17: Event 1 with the parametric test by Boehmer et al. (1991)
Panel A: Market benchmark of S&P 600 Food, Beverage, & Tobacco IndexAverageabnormal Positive/ Cumulative average abnormal returnsreturns C�"% Negative (-1,2) (-1,1) (0,1) (0,2) (1,2)
t-2 +0.92% 0.56 13/15t-1 +3.46% 1.29 16/12 5.67 % 8.02 % 4.56 % 2.21 % −1.23%Event day +3.44% 1.69* 14/14 1.04 1.81* 1.59 0.46 −0.77t+1 +1.12% 0.14 14/14t+2 −2.35% −1.34 08/20
Panel B: Market benchmark of S&P 500 IndexAverageabnormal Positive/ Cumulative average abnormal returnsreturns C�"% Negative (-1,2) (-1,1) (0,1) (0,2) (1,2)
t-2 +0.91% 0.57 13/15t-1 +3.20% 1.35 16/12 5.47 % 7.71 % 4.51 % 2.27 % −1.14%Event day +3.41% 1.56 14/14 0.96 1.77* 1.47 0.38 −0.77t+1 +1.10% 0.14 14/14t+2 −2.24% −1.35 07/21
Panel C: Zero-return benchmarkAverage Positive/abnormal No change/ Cumulative average abnormal returnsreturns C�"% Negative (-1,2) (-1,1) (0,1) (0,2) (1,2)
t-2 +1.86% 1.18 15/2/11t-1 +4.17% 2.38** 18/2/08 9.32 % 10.61 % 6.44 % 5.15 % 0.77 %Event day +4.38% 2.18** 16/5/07 2.49** 3.14*** 2.48** 1.48 0.00t+1 +2.06% 0.76 14/2/12t+2 −1.29% −0.75 09/1/18
This table displays the event study results for the Guidance Fin-2014-G001. The average abnormal returns (AARs)correspond to the excess returns with respect to three different benchmarks. In Panel A, the AARs are calculatedagainst the S&P 600 Food, Beverage, & Tobacco Index as the market benchmark; Panel B uses the S&P 500 Indexas a broad market benchmark; Panel C relies on the zero-return benchmark. Significance is calculated based on thetwo-sided parametric test by Boehmer et al. (1991). Column 3 displays the number of individual marijuana firms thathave abnormal positive (negative) returns on the specific trading day. The cumulative average abnormal returns arecalculated based on five different event windows. The ∗∗∗, ∗∗, and ∗ represent significance at the 1%, 5%, and the 10%levels.
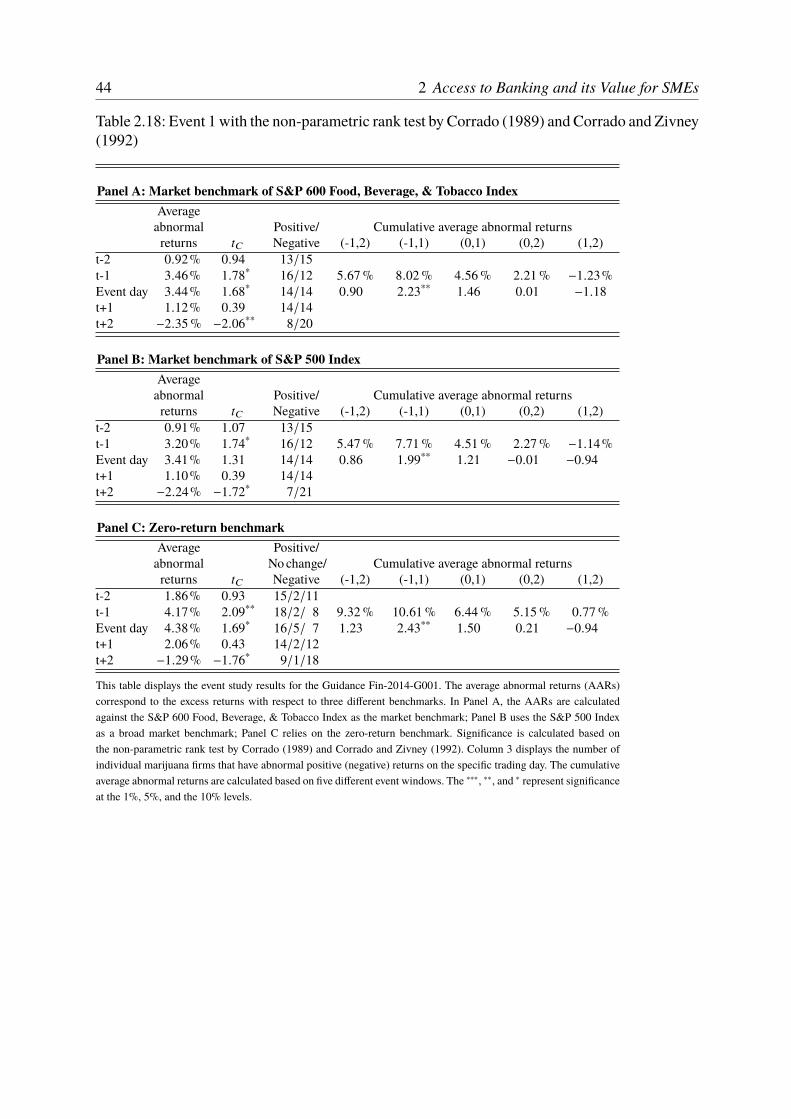
44 2 Access to Banking and its Value for SMEs
Table 2.18: Event 1 with the non-parametric rank test by Corrado (1989) and Corrado and Zivney(1992)
Panel A: Market benchmark of S&P 600 Food, Beverage, & Tobacco IndexAverageabnormal Positive/ Cumulative average abnormal returnsreturns C� Negative (-1,2) (-1,1) (0,1) (0,2) (1,2)
t-2 +0.92% 0.94 13/15t-1 +3.46% 1.78* 16/12 5.67 % 8.02 % 4.56 % 2.21 % −1.23%Event day +3.44% 1.68* 14/14 0.90 2.23** 1.46 0.01 −1.18t+1 +1.12% 0.39 14/14t+2 −2.35 % −2.06** 08/20
Panel B: Market benchmark of S&P 500 IndexAverageabnormal Positive/ Cumulative average abnormal returnsreturns C� Negative (-1,2) (-1,1) (0,1) (0,2) (1,2)
t-2 +0.91% 1.07 13/15t-1 +3.20% 1.74* 16/12 5.47 % 7.71 % 4.51 % 2.27 % −1.14%Event day +3.41% 1.31 14/14 0.86 1.99** 1.21 −0.01 −0.94t+1 +1.10% 0.39 14/14t+2 −2.24% −1.72* 07/21
Panel C: Zero-return benchmarkAverage Positive/abnormal No change/ Cumulative average abnormal returnsreturns C� Negative (-1,2) (-1,1) (0,1) (0,2) (1,2)
t-2 +1.86% 0.93 15/2/11t-1 +4.17% 2.09** 18/2/08 9.32 % 10.61 % 6.44 % 5.15 % 0.77 %Event day +4.38% 1.69* 16/5/07 1.23 2.43** 1.50 0.21 −0.94t+1 +2.06% 0.43 14/2/12t+2 −1.29% −1.76* 09/1/18
This table displays the event study results for the Guidance Fin-2014-G001. The average abnormal returns (AARs)correspond to the excess returns with respect to three different benchmarks. In Panel A, the AARs are calculatedagainst the S&P 600 Food, Beverage, & Tobacco Index as the market benchmark; Panel B uses the S&P 500 Indexas a broad market benchmark; Panel C relies on the zero-return benchmark. Significance is calculated based onthe non-parametric rank test by Corrado (1989) and Corrado and Zivney (1992). Column 3 displays the number ofindividual marijuana firms that have abnormal positive (negative) returns on the specific trading day. The cumulativeaverage abnormal returns are calculated based on five different event windows. The ∗∗∗, ∗∗, and ∗ represent significanceat the 1%, 5%, and the 10% levels.

A Appendices 45
A.3.2 Event 2: The Fourth Corner Credit Union Case
Table 2.19: Event 2 with the standardized cross-sectional test by Kolari and Pynnönen (2010)
Panel A: Market benchmark of S&P 600 Food, Beverage, & Tobacco IndexAverageabnormal Positive/ Cumulative average abnormal returnsreturns C % Negative (-1,2) (-1,1) (0,1) (0,2) (1,2)
t-2 +3.60% 1.40 16/12t-1 +3.50% 1.34 11/17 −3.78% −0.17% −3.67% −7.28% −4.80%Event day −2.48 % −0.95 12/16 −1.01 −0.05 −1.22 −2.03** −2.34**t+1 −1.19 % −0.91 12/16t+2 −3.61 % −1.93* 08/20
Panel B: Market benchmark of S&P 500 IndexAverageabnormal Positive/ Cumulative average abnormal returnsreturns C % Negative (-1,2) (-1,1) (0,1) (0,2) (1,2)
t-2 +3.71% 1.46 14/14t-1 +3.45% 1.34 11/17 −3.50% −0.14% −3.59% −6.95% −4.35%Event day −2.60 % −0.99 14/14 −0.94 −0.04 −1.21 −1.93* −1.94*t+1 −0.99 % −0.75 11/17t+2 −3.36 % −1.69* 12/16
Panel C: Zero-return benchmarkAverage Positive/abnormal No change/ Cumulative average abnormal returnsreturns C % Negative (-1,2) (-1,1) (0,1) (0,2) (1,2)
t-2 +3.44% 1.32 13/6/09t-1 +3.09% 1.20 09/6/13 −4.76% −0.92% −4.01% −7.85% −5.15%Event day −2.70 % −1.03 11/4/13 −1.27 −0.26 −1.33 −2.18** −2.53**t+1 −1.31 % −1.00 06/6/16t+2 −3.84 % −2.07** 07/5/16
This table displays the event study results around the court ruling against The Fourth Corner Credit Union. The averageabnormal returns (AARs) correspond to the excess returns with respect to three different benchmarks. In Panel A,the AARs are calculated against the S&P 600 Food, Beverage, & Tobacco Index as the market benchmark; Panel Buses the S&P 500 Index as a broad market benchmark; Panel C relies on the zero-return benchmark. Significance iscalculated based on the two-sided standardized cross-sectional test by Kolari and Pynnönen (2010). Column 3 displaysthe number of individual marijuana firms that have abnormal positive (negative) returns on the specific trading day.The cumulative average abnormal returns are calculated based on five different event windows. The ∗∗∗, ∗∗, and ∗
represent significance at the 1%, 5%, and the 10% levels.

46 2 Access to Banking and its Value for SMEs
Table 2.20: Event 2 with the parametric test by Boehmer et al. (1991)
Panel A: Market benchmark of S&P 600 Food, Beverage, & Tobacco IndexAverageabnormal Positive/ Cumulative average abnormal returnsreturns C�"% Negative (-1,2) (-1,1) (0,1) (0,2) (1,2)
t-2 +3.60% 1.24 16/12t-1 +3.50% 0.87 11/17 −3.78% −0.17% −3.67% −7.28% −4.80%Event day −2.48% −0.55 12/16 −1.34 −0.22 −1.07 −2.24** −2.78***t+1 −1.19% −1.09 12/16t+2 −3.61% −2.19** 08/20
Panel B: Market benchmark of S&P 500 IndexAverageabnormal Positive/ Cumulative average abnormal returnsreturns C�"% Negative (-1,2) (-1,1) (0,1) (0,2) (1,2)
t-2 +3.71% 1.35 14/14t-1 +3.45% 0.90 11/17 −3.50% −0.14% −3.59% −6.95% −4.35%Event day −2.60% −0.62 14/14 −1.15 −0.15 −1.00 −2.03** −2.38**t+1 −0.99% −0.84 11/17t+2 −3.36% −1.89* 12/16
Panel C: Zero-return benchmarkAverage Positive/abnormal No change/ Cumulative average abnormal returnsreturns C�"% Negative (-1,2) (-1,1) (0,1) (0,2) (1,2)
t-2 +3.44% 1.14 13/6/09t-1 +3.09% 0.65 09/6/13 −4.76% −0.92% −4.01% −7.85% −5.15%Event day −2.70 % −0.66 11/4/13 −1.62 −0.48 −1.22 −2.43** −2.95***t+1 −1.31 % −1.17 06/6/16t+2 −3.84 % −2.30** 07/5/16
This table displays the event study results around the court ruling against The Fourth Corner Credit Union. The averageabnormal returns (AARs) correspond to the excess returns with respect to three different benchmarks. In Panel A,the AARs are calculated against the S&P 600 Food, Beverage, & Tobacco Index as the market benchmark; Panel Buses the S&P 500 Index as a broad market benchmark; Panel C relies on the zero-return benchmark. Significanceis calculated based on the two-sided parametric test by Boehmer et al. (1991). Column 3 displays the number ofindividual marijuana firms that have abnormal positive (negative) returns on the specific trading day. The cumulativeaverage abnormal returns are calculated based on five different event windows. The ∗∗∗, ∗∗, and ∗ represent significanceat the 1%, 5%, and the 10% levels.
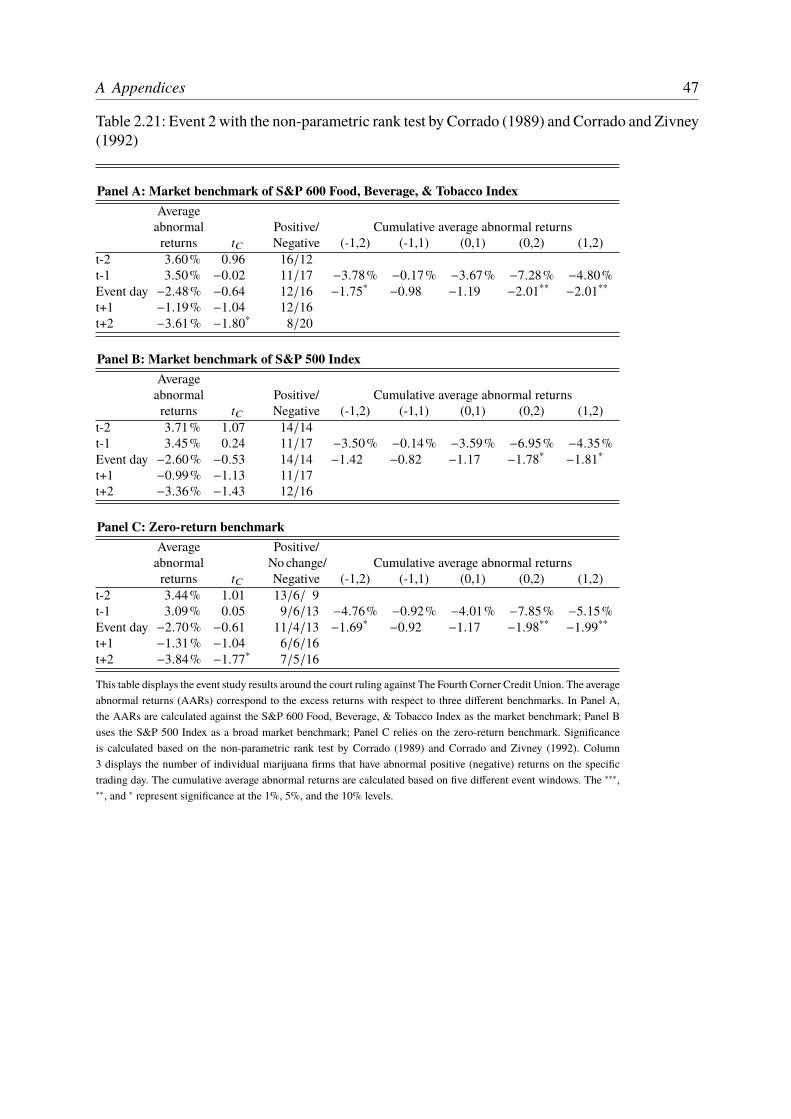
A Appendices 47
Table 2.21: Event 2 with the non-parametric rank test by Corrado (1989) and Corrado and Zivney(1992)
Panel A: Market benchmark of S&P 600 Food, Beverage, & Tobacco IndexAverageabnormal Positive/ Cumulative average abnormal returnsreturns C� Negative (-1,2) (-1,1) (0,1) (0,2) (1,2)
t-2 +3.60% 0.96 16/12t-1 +3.50% −0.02 11/17 −3.78% −0.17% −3.67% −7.28% −4.80%Event day −2.48% −0.64 12/16 −1.75* −0.98 −1.19 −2.01** −2.01**t+1 −1.19% −1.04 12/16t+2 −3.61% −1.80* 08/20
Panel B: Market benchmark of S&P 500 IndexAverageabnormal Positive/ Cumulative average abnormal returnsreturns C� Negative (-1,2) (-1,1) (0,1) (0,2) (1,2)
t-2 +3.71% 1.07 14/14t-1 +3.45% 0.24 11/17 −3.50% −0.14% −3.59% −6.95% −4.35%Event day −2.60% −0.53 14/14 −1.42 −0.82 −1.17 −1.78* −1.81*t+1 −0.99% −1.13 11/17t+2 −3.36% −1.43 12/16
Panel C: Zero-return benchmarkAverage Positive/abnormal No change/ Cumulative average abnormal returnsreturns C� Negative (-1,2) (-1,1) (0,1) (0,2) (1,2)
t-2 +3.44% 1.01 13/6/09t-1 +3.09% 0.05 09/6/13 −4.76% −0.92% −4.01% −7.85% −5.15%Event day −2.70% −0.61 11/4/13 −1.69* −0.92 −1.17 −1.98** −1.99**t+1 −1.31% −1.04 06/6/16t+2 −3.84% −1.77* 07/5/16
This table displays the event study results around the court ruling against The Fourth Corner Credit Union. The averageabnormal returns (AARs) correspond to the excess returns with respect to three different benchmarks. In Panel A,the AARs are calculated against the S&P 600 Food, Beverage, & Tobacco Index as the market benchmark; Panel Buses the S&P 500 Index as a broad market benchmark; Panel C relies on the zero-return benchmark. Significanceis calculated based on the non-parametric rank test by Corrado (1989) and Corrado and Zivney (1992). Column3 displays the number of individual marijuana firms that have abnormal positive (negative) returns on the specifictrading day. The cumulative average abnormal returns are calculated based on five different event windows. The ∗∗∗,∗∗, and ∗ represent significance at the 1%, 5%, and the 10% levels.

48 2 Access to Banking and its Value for SMEs
A.3.3 Event 3: The SAFE Banking Act
Table 2.22: Event 3 with the standardized cross-sectional test by Kolari and Pynnönen (2010)
Panel A: Market benchmark of S&P 600 Food, Beverage, & Tobacco IndexAverageabnormal Positive/ Cumulative average abnormal returnsreturns C % Negative (-1,2) (-1,1) (0,1) (0,2) (1,2)
t-2 +0.20% 0.09 09/21t-1 −2.48% −1.64 06/24 −6.16% −3.45% −0.97% −3.68% −5.66%Event day +1.98% 0.77 14/16 −1.73* −0.99 −0.43 −1.54 −2.93***t+1 −2.95% −2.06** 07/23t+2 −2.71% −2.87*** 08/22
Panel B: Market benchmark of S&P 500 IndexAverageabnormal Positive/ Cumulative average abnormal returnsreturns C % Negative (-1,2) (-1,1) (0,1) (0,2) (1,2)
t-2 +0.30% 0.14 09/21t-1 −2.05% −1.33 08/22 −5.56% −3.00% −0.95% −3.51% −5.39%Event day +1.88% 0.74 13/17 −1.54 −0.85 −0.42 −1.46 −2.81***t+1 −2.83% −1.98** 07/23t+2 −2.56% −2.74*** 09/21
Panel C: Zero-return benchmarkAverage Positive/abnormal No change/ Cumulative average abnormal returnsreturns C % Negative (-1,2) (-1,1) (0,1) (0,2) (1,2)
t-2 +0.28% 0.14 09/3/18t-1 −2.64% −1.78* 04/4/22 −6.26% −3.34% −0.70% −3.62% −5.92%Event day +2.30% 0.92 12/6/12 −1.82* −0.99 −0.32 −1.56 −2.98***t+1 −3.00% −2.06** 05/6/19t+2 −2.92% −3.02*** 06/6/18
This table displays the event study results around the voting by the U.S. House of Representatives on the SAFEBanking Act. The average abnormal returns (AARs) correspond to the excess returns with respect to three differentbenchmarks. In Panel A, the AARs are calculated against the S&P 600 Food, Beverage, & Tobacco Index as themarket benchmark; Panel B uses the S&P 500 Index as a broad market benchmark; Panel C relies on the zero-returnbenchmark. Significance is calculated based on the two-sided standardized cross-sectional test byKolari and Pynnönen(2010). Column 3 displays the number of individual marijuana firms that have abnormal positive (negative) returnson the specific trading day. The cumulative average abnormal returns are calculated based on five different eventwindows. The ∗∗∗, ∗∗, and ∗ represent significance at the 1%, 5%, and the 10% levels.

A Appendices 49
Table 2.23: Event 3 with the parametric test by Boehmer et al. (1991)
Panel A: Market benchmark of S&P 600 Food, Beverage, & Tobacco IndexAverageabnormal Positive/ Cumulative average abnormal returnsreturns C�"% Negative (-1,2) (-1,1) (0,1) (0,2) (1,2)
t-2 +0.20% - 1.08 09/21t-1 −2.48% −2.82*** 06/24 −6.16% −3.45% −0.97% −3.68% −5.66%Event day +1.98% 0.68 14/16 −2.69*** −2.06** −1.10 −2.08** −2.34**t+1 −2.95% −1.61 07/23t+2 −2.71% −2.79*** 08/22
Panel B: Market benchmark of S&P 500 IndexAverageabnormal Positive/ Cumulative average abnormal returnsreturns C�"% Negative (-1,2) (-1,1) (0,1) (0,2) (1,2)
t-2 +0.30% −1.01 09/21t-1 −2.05% −2.49** 08/22 −5.56% −3.00% −0.95% −3.51% −5.39%Event day +1.88% 0.66 13/17 −2.49** −1.90* −1.10 −1.99** −2.21**t+1 −2.83% −1.56 07/23t+2 −2.56% −2.62*** 09/21
Panel C: Zero-return benchmark.Average Positive/abnormal No change/ Cumulative average abnormal returnsreturns C�"% Negative (-1,2) (-1,1) (0,1) (0,2) (1,2)
t-2 +0.28% −1.02 09/3/18t-1 −2.64% −2.98*** 04/4/22 −6.26% −3.34% −0.70% −3.62% −5.92%Event day +2.30% 0.91 12/6/12 −2.78*** −2.08** −0.97 −2.08** −2.46**t+1 −3.00% −1.65* 05/6/19t+2 −2.92% −3.04*** 06/6/18
This table displays the event study results around the voting by the U.S. House of Representatives on the SAFEBanking Act. The average abnormal returns (AARs) correspond to the excess returns with respect to three differentbenchmarks. In Panel A, the AARs are calculated against the S&P 600 Food, Beverage, & Tobacco Index as themarket benchmark; Panel B uses the S&P 500 Index as a broad market benchmark; Panel C relies on the zero-returnbenchmark. Significance is calculated based on the two-sided parametric test by Boehmer et al. (1991). Column3 displays the number of individual marijuana firms that have abnormal positive (negative) returns on the specifictrading day. The cumulative average abnormal returns are calculated based on five different event windows. The ∗∗∗,∗∗, and ∗ represent significance at the 1%, 5%, and the 10% levels.

50 2 Access to Banking and its Value for SMEs
Table 2.24: Event 3 with the non-parametric rank test by Corrado (1989) and Corrado and Zivney(1992)
Panel A: Market benchmark of S&P 600 Food, Beverage, & Tobacco IndexAverageabnormal Positive/ Cumulative average abnormal returnsreturns C� Negative (-1,2) (-1,1) (0,1) (0,2) (1,2)
t-2 +0.20% - 0.92 09/21t-1 −2.48% −2.42** 06/24 −6.16% −3.45% −0.97% −3.68% −5.66%Event day +1.98% 0.20 14/16 −2.44** −1.94* −0.67 −1.42 −1.88*t+1 −2.95% −1.15 07/23t+2 −2.71% −1.51 08/22
Panel B: Market benchmark of S&P 500 IndexAverageabnormal Positive/ Cumulative average abnormal returnsreturns C� Negative (-1,2) (-1,1) (0,1) (0,2) (1,2)
t-2 +0.30% - 1.07 09/21t-1 −2.05% −2.49** 08/22 −5.56% −3.00% −0.95% −3.51% −5.39%Event day +1.88% 0.06 13/17 −2.58** −2.11** −0.82 −1.54 −1.92*t+1 −2.83% −1.22 07/23t+2 −2.56% −1.50 09/21
Panel C: Zero-return benchmarkAverage Positive/abnormal No change/ Cumulative average abnormal returnsreturns C� Negative (-1,2) (-1,1) (0,1) (0,2) (1,2)
t-2 +0.28% −0.87 09/3/18t-1 −2.64% −2.28** 04/4/22 −6.26% −3.34% −0.70% −3.62% −5.92%Event day +2.30% 0.28 12/6/12 −2.28** −1.77* −0.56 −1.32 −1.82*t+1 −3.00% −1.07 05/6/19t+2 −2.92% −1.50 06/6/18
This table displays the event study results around the voting by the U.S. House of Representatives on the SAFEBanking Act. The average abnormal returns (AARs) correspond to the excess returns with respect to three differentbenchmarks. In Panel A, the AARs are calculated against the S&P 600 Food, Beverage, & Tobacco Index as themarket benchmark; Panel B uses the S&P 500 Index as a broad market benchmark; Panel C relies on the zero-returnbenchmark. Significance is calculated based on the non-parametric rank test by Corrado (1989) and Corrado andZivney (1992). Column 3 displays the number of individual marijuana firms that have abnormal positive (negative)returns on the specific trading day. The cumulative average abnormal returns are calculated based on five differentevent windows. The ∗∗∗, ∗∗, and ∗ represent significance at the 1%, 5%, and the 10% levels.

A Appendices 51
A.3.4 Event studies’ results for the subgroup of eight firms that is examined in all events.
Fig. 2.4: Event 1 with the subgroup of eight firms that is examined in all events.
-2 -1 0 1 2012345678
AA
R /
%
(a) Market benchmark of S&P 600 Food, Beverage, & TobaccoIndex
-2 -1 0 1 2012345678
AA
R /
%
(b) Market benchmark of S&P 500 Index0
-2 -1 0 1 2012345678
AA
R /
%
(c) Zero-return benchmark0

52 2 Access to Banking and its Value for SMEs
Fig. 2.5: Event 2 with the subgroup of eight firms that is examined in all events.
-2 -1 0 1 2
-7-6-5-4-3-2-101
AA
R /
% Time / Days
(a) Market benchmark of S&P 600 Food, Beverage, & TobaccoIndex
-2 -1 0 1 2
-7-6-5-4-3-2-101
AA
R /
% Time / Days
(b) Market benchmark of S&P 500 Index0
-2 -1 0 1 2
-7-6-5-4-3-2-101
AA
R /
% Time / Days
(c) Zero-return benchmark0

A Appendices 53
Fig. 2.6: Event 3 with the subgroup of eight firms that is examined in all events.
-2 -1 0 1 2
-4
-3
-2
-1
0
1
2
AA
R /
%
(a) Market benchmark of S&P 600 Food, Beverage, & TobaccoIndex
-2 -1 0 1 2
-4
-3
-2
-1
0
1
2
AA
R /
%
(b) Market benchmark of S&P 500 Index0
-2 -1 0 1 2
-4
-3
-2
-1
0
1
2
AA
R /
%
(c) Zero-return benchmark0

54 2 Access to Banking and its Value for SMEs
A.4 Dividend discount model and a firm’s maximum attainable growthrate
To estimate the implied growth rate of marijuana firms, the dividend discount model with apermanently constant expected growth rate is used, i.e., the Gordon growth model (Gordon1959). The model relates the value of the marijuana portfolio %C to its expected cumulativedividends �C+1, the cost of equity :4 and the expected growth rate 6.
%C =�C+1:4 −6
. (2.1)
The implied growth rate can be estimated by rearranging equation (2.1):
6 =%C:4 −�C+1
%C. (2.2)
Since many marijuana firms in our sample have not paid out dividends, the cumulative dividends�C+1 are hard to estimate. Empirical evidence, however, has shown that in the United States theso-called Fed model holds true (Bekaert and Engstrom 2010). The Fed model postulates thaton average the dividend yield 3C on stocks equals the yield on nominal Treasury bonds. For thecalculation, we assume the dividend yield to be the same as the yield on the nominal 10 yearU.S. treasury bond at the event day. Thus, for the first (second/third) event, we get a dividendyield of 2.75% (2.25%, 1.73%). Equation (2.2) can be restated in terms of the dividend yield as:
6 =%C:4 − 3C%C (1+6)
%C(2.3)
6 =:4 − 3C1+ 3C
. (2.4)
Our marijuana portfolio consists of firms listed on amajor stock exchange and OTC-traded firms.Since firms listed on a major stock exchange have on average lower costs of equity than OTC-traded firms (Dhaliwal 1983), we use a weighted average for :4. For the firms listed on majorstock exchanges, we assume that the costs of equity equal those of the U.S. American Tobaccoindustry. Analogously, for the OTC-traded stocks, we use data from the Canadian marijuanaindustry. For the first (second/third) event, we computed a cost of equity of 12.94% (12.73%,12.55%). Inserting :4 and 3C into equation (2.4) results in the presented implied growth rates.According to Demirgüç-Kunt and Maksimovic (1998), a firm’s maximum attainable and
sustainable growth rate can be calculated as follows:
(� C ='$�C
1−'$�C, (2.5)
where '$�C is the return on equity, i.e., the ratio of net income to equity. To calculate themarijuana industry’s sustainable growth rate according to equation (2.5), we use the reported

A Appendices 55
ROEs of the S&P 600 Food, Beverage, & Tobacco Index (8.28%, 10.16%, and 12.66%) for theyears 2014, 2016 and 2019.

Chapter 3Contemporaneous Financial Intermediation - How DLTChanges the Cross-Border Payment Landscape
Abstract Digital innovations in banking and payments recently have garnered a great deal ofattention. Specifically, distributed ledger technology has the potential to fundamentally changethe roles and responsibilities of stakeholders in the financial sector. DLT is a novel and fast-evolving approach to record and share data, e.g., payment transactions, among members of adecentralized network. Using transaction cost theory, the paper examines how DLT will changethe cross-border payment infrastructure. DLT can reduce the overall transaction costs potentiallyresulting in the disappearance of correspondent banks.
3.1 Introduction
Banks have long been rationalized by their seemingly essential role as financial intermediariesin an economy. Traditionally, banks are thought to intermediate between non-banks, such ashouseholds and firms (e.g., Diamond and Dybvig 1983; Diamond 1984). However less regarded,but equally important banks also provide payment services.9Cash is ill-suited for large payments, especially over a long distance. In this context, banks
allow customers to transfer money in a safe and secure manner. Due to the globalization of bothbusiness and private transactions, and growing financial integration, transferring money acrossborders has become a pervasive issue.
For centuries, banks have dominantly carried out cross-border payments via correspondents,i.e., interbank intermediaries that complete transactions on behalf of banks in areas wherethey are not physically present (Society for Worldwide Interbank Financial Telecommunication2016; Calomiris and Carlson 2017; Committee on Payments and Market Infrastructures 2018).Today, however, this model faces significant challenges. For example, banks must competewith faster, cheaper and more transparent (online) payment service providers (e.g., PayPal,TransferWise, WeChat Pay, Alipay, Amazon Pay, etc.). Many of these new intermediaries carryout transactions within their own ecosystem, instantly shifting money from one account toanother. Surprisingly, according to Denecker et al. (2016), more than 95 percent of business-to-business and approximately 60 percent of consumer-to-consumer cross-border transactions are
9 Strictly speaking, banks started as providers of payment services and then extended into financial intermediation services (Kohn1999).
57

58 3 Contemporaneous Financial Intermediation
still processed by banks.10 The authors cite proven security of banks for both money and data asthe dominant reason.
Despite the longstanding dominance of banks, the competition remains fierce as cross-borderpayments are extremely profitable. About $136 trillion flow across borders annually (Bruno et al.2019). Although this is only one-sixth of all global payments, it generates about 30 percent of therevenues that processors collect, totaling more than $230 billion per annum (Bruno et al. 2019).In order to insure their control, banks are continually working on improvements. For example theSociety for Worldwide Interbank Financial Telecommunication’s global payments innovation(SWIFT gpi) improves the speed, transparency and traceability of cross-border payments, butstill relies on the correspondent banking system. More recently, however, banks have started toexplore an innovation that could profoundly transform the cross-border payment infrastructure:Distributed Ledger Technology. DLT is decentralized and the network participants hold identicalcopies of a shared database that is updated algorithmically. The usage of DLT eliminates theneed for third parties, i.e., correspondent banks, to manage and reconcile individual bankaccounts. Although there are still significant legal, regulatory and operational barriers to theglobal implementation of such a system, DLT already has the potential to replace correspondentbanks and dominate cross-border payments. In the presented research, transaction cost theory isapplied to predict how DLT will increase the efficiency and resiliency of cross-border payments.
Empirical evidence is reported in literature that banks themselves rely on another layer ofintermediation for a variety of functions (Craig and von Peter 2014; Calomiris and Carlson2017). In a first step, this work rationalizes interbank intermediation theoretically. Specifically,the transaction cost model of Breuer (1993) is introduced and adapted to cross-border paymentsin order to show the current functions of correspondent banks. Subsequently, the impact of DLTon the presented market structure is analyzed. While in the field of cross-border payments DLTis highly discussed (He et al. 2017; Bank of Canada, Bank of England, and Monetary Authorityof Singapore 2018; Newman et al. 2018) and has been implemented (Rapoport et al. 2014),academic reports are limited. Mills et al. (2016) and Casu and Wandhöfer (2018) are one of thefew exceptions.11 Mills et al. (2016), however, only touch on the topic in their broader work onpayment, clearing, and settlement. Casu and Wandhöfer (2018) provide a more comprehensiveanalysis of the implementation of DLT in cross-border payments. Based on survey results ofindustry experts, they qualitatively evaluate the potential of DLT and several other networkmodels. This work extends their analysis by explicitly examining potential effects on the designof payment infrastructure. It is shown that the economy-wide transaction costs can be reduced
10 More recently, Rice et al. (2020) reinforce this finding stating that the overwhelmingmajority of cross-border transactions is processedby banks.11 The direct use of central bank digital currencies for cross-border transactions is also examined in literature (e.g., Koning 2016, Raskinand Yermack 2018 and Auer and Boehme 2020). Although this idea seems promising, economists have several reservations, e.g.,privacy issues, or the limited operational capacity of central banks to deal with individuals (see, e.g., Kahn et al. 2019 for an insightfuldiscussion on this topic). Additionally, Boar et al. (2020) found that the overwhelming majority of central banks see themselves asunlikely to issue any type of such a currency in the foreseeable future. Other studies examine the specific example of Bitcoin (Böhmeet al. 2015; Narayanan et al. 2016) and its use as virtual currency (Rysman and Schuh 2017). Scalability and transaction speed, however,is limited in the Bitcoin system (Natarajan et al. 2017).

3.2 The foundation of interbank intermediaries 59
through DLT which will ultimately result in the disappearance of interbank intermediaries incross-border payments. The work sheds light on how large-scale global payment transactionsbased on DLT affect established hierarchies and their utility (Swan 2015). The paper also relatesand contributes to the broader literature on DLT and its economic implications (e.g., Abadi andBrunnermeier 2019; Catalini and Gans 2019).
3.2 The foundation of interbank intermediaries
3.2.1 The concept of correspondent banking
The ability to safely and securely transfer money both within and across borders is indispensablefor a functioning economy. Until the middle ages, banks were municipally chartered institutionsand could offer payments services only within their home city (Quinn and Roberds 2008). Asa result, funds had to be physically transferred. A process that was often plagued by theft,confiscation, and loss at sea. As long distance trade increased, better suited transaction meanswere needed. The bill of exchange became available as a new payment instrument during the 13thcentury. Bills of exchange are written instructions from a drawer to a drawee, a correspondent ina different city, to give funds to a payee. Initially correspondents were often merchants, with timebanks were used more frequently due to their ubiquitous network and ample liquidity. Startingin the 17th century, ongoing improvements in interbank relationships and the emergence of newpayment instruments simplified inter-regional and cross-border payments (Quinn 1997; Quinnand Roberds 2008). By the end of the 19th century, certain banks began to specialize inmediationof long-distance transactions, i.e., correspondent banks (see, e.g., Calomiris and Carlson 2017for an overview of the U.S. corresponding banking network at that time). Today most otherbanks rely on these correspondent banks to complete transactions on their behalf in areas wherethey are not physically present (Society for Worldwide Interbank Financial Telecommunication2016; Rice et al. 2020).
The intermediary banking services are controlled by a few large correspondents, i.e., themarket is typical for an oligopoly. According to the European Central Bank, in 2016, therewere 401 correspondent banks involved in the Euro business that served 9,754 customer banks(European Central Bank 2016). Based on data from the Committee on Payments and MarketInfrastructures (2019), it is estimated that the number of correspondent banks had decreased toabout 361 by the end of 2018. Although the exact number of correspondent banks globally ispublicly unknown (Committee on Payments and Market Infrastructures 2016, 2019), the totalnumber is declining, i.e., the market is increasingly concentrated.
In the succeeding sections, for simplification correspondent banks will only be referred to ascorrespondents. The modern correspondent banking model consists of an international networkof financial institutions, where the sender and the beneficiary bank employ an intermediary
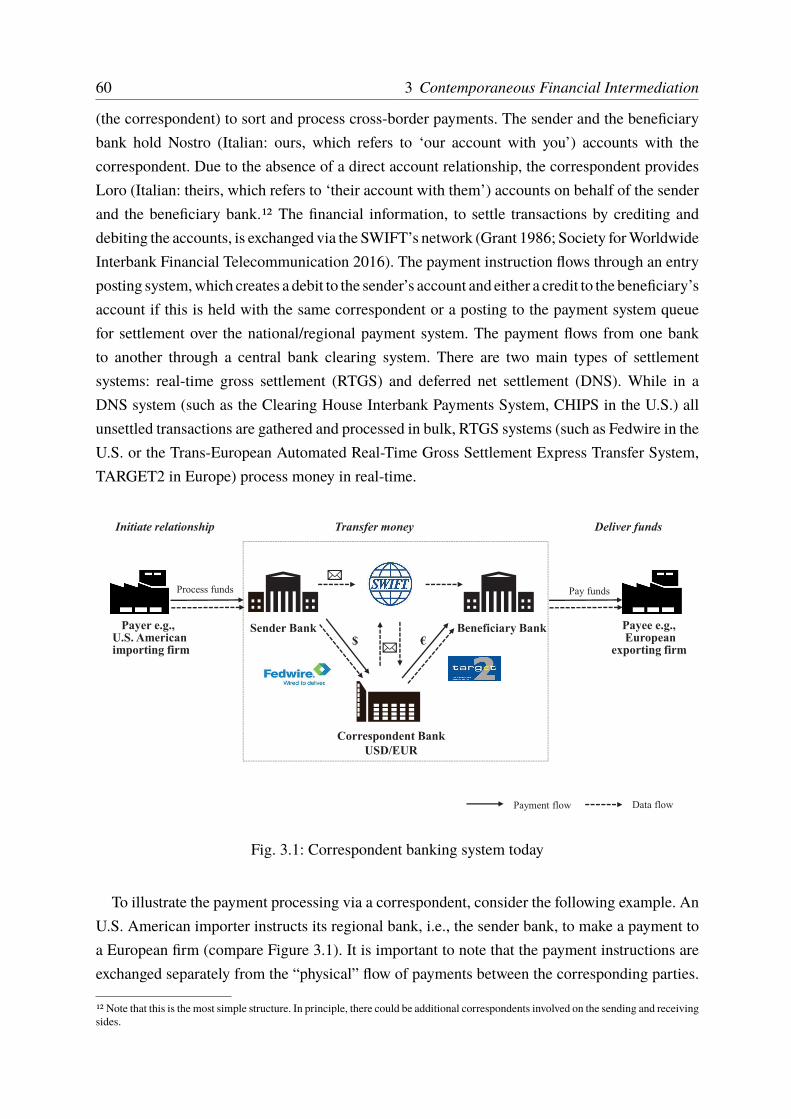
60 3 Contemporaneous Financial Intermediation
(the correspondent) to sort and process cross-border payments. The sender and the beneficiarybank hold Nostro (Italian: ours, which refers to ‘our account with you’) accounts with thecorrespondent. Due to the absence of a direct account relationship, the correspondent providesLoro (Italian: theirs, which refers to ‘their account with them’) accounts on behalf of the senderand the beneficiary bank.12 The financial information, to settle transactions by crediting anddebiting the accounts, is exchanged via the SWIFT’s network (Grant 1986; Society forWorldwideInterbank Financial Telecommunication 2016). The payment instruction flows through an entryposting system,which creates a debit to the sender’s account and either a credit to the beneficiary’saccount if this is held with the same correspondent or a posting to the payment system queuefor settlement over the national/regional payment system. The payment flows from one bankto another through a central bank clearing system. There are two main types of settlementsystems: real-time gross settlement (RTGS) and deferred net settlement (DNS). While in aDNS system (such as the Clearing House Interbank Payments System, CHIPS in the U.S.) allunsettled transactions are gathered and processed in bulk, RTGS systems (such as Fedwire in theU.S. or the Trans-European Automated Real-Time Gross Settlement Express Transfer System,TARGET2 in Europe) process money in real-time.
Pay fundsProcess funds
Sender Bank Beneficiary Bank
Correspondent Bank
USD/EUR
Initiate relationship Transfer money Deliver funds
Payer e.g., U.S. Americanimporting firm
Payee e.g.,European
exporting firm$ €
Payment flow Data flow
Fig. 3.1: Correspondent banking system today
To illustrate the payment processing via a correspondent, consider the following example. AnU.S. American importer instructs its regional bank, i.e., the sender bank, to make a payment toa European firm (compare Figure 3.1). It is important to note that the payment instructions areexchanged separately from the “physical” flow of payments between the corresponding parties.
12 Note that this is the most simple structure. In principle, there could be additional correspondents involved on the sending and receivingsides.

3.2 The foundation of interbank intermediaries 61
The European firm has an account at Deutsche Bank with which the regional bank, e.g., the Bankof Colorado, has no banking relationship. However, both the Bank of Colorado and DeutscheBank have a correspondent banking relationship with the Bank of America, i.e., they both holdNostro accounts at the Bank of America. Like the Bank of Colorado, the Bank of America hasan account at the Fed and thus receives the funds through the national payment system, e.g.,Fedwire. The Bank of America provides Loro accounts for their bank clients that they can makeand receive USD and foreign currency payments. Upon receiving the USD in its Federal Reserveaccount, Bank of America does a book-entry transfer to credit Deutsche Bank’s USD Nostroaccount for the amount of the payment. Bank of America then converts the USD to Euro so itcan send the payment to the German supplier’s account at Deutsche Bank. Correspondents areused because accounts at the central bank governing the particular currency are required for atransfer. In this example, Deutsche Bank does not have an account at the Fed. As a result, Bankof America cannot “physically” move the USD to Deutsche Bank. Assuming the supplier wouldlike to either withdraw the funds or use them to make a Euro payment, Bank of America mustfirst do a separate foreign exchange transaction to convert the funds to Euro. To do this, the Bankof America will debit Deutsche Bank’s USD Nostro account and then credit Deutsche Bank’sEuro Nostro account for the Euro equivalent. Bank of America then sends the Euro amount viathe European Central Bank settlement system, TARGET2, to Deutsche Bank, since DeutscheBank has a TARGET2 account. Once Deutsche Bank has the funds, it can credit the supplier’saccount, and the supplier can make a Euro payment or withdrawal.
In terms of costs of cross-border payments, each bank in the payment process charges paymentprocessing fees (Casu andWandhöfer 2018).13 Each bank also individually conducts know-your-customer, anti-money laundering and counter-terrorist-financing checks. In addition, networkand liquidity costs are involved in maintaining correspondent relationships. Costs arise for eachbank that is involved in the process of funding interbank accounts and managing exposures.
3.2.2 The theory of interbank intermediation
To better understand the formation of interbank intermediaries in cross-border payments, themodel of Breuer (1993) is introduced and adapted. For this model cross-border transactionsare defined as the transfer of a fixed amount of money from one currency-zone into another.Two banking systems with = domestic banks (�) and < foreign banks (�) are considered,the bilateral network and the corresponding banking system. In the bilateral network (compareFigure 3.2), on behalf of their clients, each domestic bankmust handle the sorting and processingof payments directlywith its foreign counterpart. In this system, there are<∗= possible interbanktransactions.
13 Note that in the end, these costs are passed on to the payer and/or payee depending on the charge code. The code OUR is used todenote that the payer covers all transaction fees, BEN indicates that the beneficiary bears all the costs and SHA indicates that payer andpayee share the costs.

62 3 Contemporaneous Financial Intermediation
1 2 ... <
1 2 ... =
Fig. 3.2: Bilateral transactions
1 ... <9
...<−</ 9+1
... <
1 2 ... =
1 ... 9
Fig. 3.3: Interbank intermediation
In contrast, the presence of 9 intermediary correspondents (�) results in =∗ 9 +< transactions(compare Figure 3.3). In this case, all institutions forward payment instructions to correspondentsthat operate solely in a specific region (e.g., in one country, state or jurisdiction, etc.), to sortand process. In this system, the number of interbank transactions is reduced if the number ofcorrespondents is sufficiently low, i.e., 9 ≤ <(=−1)
=holds true. In other words, as long as every
correspondent 9 serves more than two foreign banks <, the correspondent system results ina lower number of interbank transactions. Note that the modeled structure implies that eachdomestic bank has access to all service-providing correspondents. As only “a few key players[account] for the majority of loro account turnover” (Committee on Payments and MarketInfrastructures 2016, p. 15), this seems to be a reasonable assumption for the cross-borderpayment market. In contrast, each correspondent limits its service to a few foreign banks ina specific region, jurisdiction, or category of clients due to regulatory requirements and riskmanagement considerations (Committee on Payments and Market Infrastructures 2016).14
To evaluate if the employment of correspondents and the resulting decrease in interbanktransactions also reduces costs, further analysis is necessary. Therefore, it is important to considerthe different types of transaction costs that arise for the banks when payments are processed.
In principle, transaction costs are classified according to their traceability (direct or indirectcosts) and/or to their relationship with the transaction volume (variable or fixed costs) – compareTable 3.1. Each market participant faces market entry costs, 21. These costs are volume inde-pendent (i.e., fixed) and cannot be attributed to a specific transaction. In case of cross-borderpayments, this could be, e.g., costs for a payment processor license. In addition, there are fixedcosts that are directly attributable to the transaction, 22. In the considered use case, these couldbe costs for establishing and managing counter-party bank relationships, directly with the cor-respondent or the foreign bank, respectively. There are also direct costs, 23, that depend on thetransferred money volume. Examples are foreign exchange costs or payment processing fees.With increasing payment orders, more processing fees accumulate. Finally, there are general
14 Theoretically it is also possible to assume that each correspondent 9 has a relationship with all foreign banks. This would result in< ∗ 9 + = ∗ 9 transactions. Depending on the number of correspondents, i.e., if 9 ≤ <∗=
<+= , this system could have a lower number oftransactions in comparison to the bilateral system. However, such a system is not only inferior to the one depicted in Figure 3.3, butalso at odds with reality.

3.2 The foundation of interbank intermediaries 63
Table 3.1: Different types of transaction costs
Transaction volumeindependent costs
Transaction volumedependent costs
Costs not directly attributableto specific transactions 21 24
Costs directly attributableto specific transactions 22 23
This table is adapted from Breuer (1993) and displays the different transaction costs. Transaction costs caneither be fixed (volume independent) or variable. Moreover costs can be distinguished into direct and general,i.e., not clearly attributable costs.
costs that depend on the total volume but are not attributable to a specific transaction, 24. Anexample are the opportunity costs for trapped liquidity that banks are required to hold on theirNostro accounts to settle payments.
Every market participant is considered to have the same cost parameters and functions, i.e.,is able to process the same amount of payments. This is done to rule out any biases stemmingfrom specialized banks in the systems (i.e., more cost efficient banks). All market participantsare banks and face similar regulatory costs (e.g., licensing fees or costs for know-your-customerchecks etc.). In addition, all banks involved have volume dependent costs for funding interbankaccounts as well as processing and managing exposures (Casu and Wandhöfer 2018).
As a result, the costs for a domestic bank in a bilateral system amount to:
2� = 21 +<22 +<23
(+
<=
)+ 24
(+
=
), (3.1)
where + denotes the volume of all cross-border payments, +<=
the volume for each transaction,and +
=the volume per domestic bank. Respectively, the transaction costs for each foreign bank
are given by:
2� = 21 +=22 +=23
(+
<=
)+ 24
(+
<
), (3.2)
where +<denotes the payment volume per foreign bank. Consequently, in a bilateral system with
= domestic and < foreign banks (compare Figure 3.2), the transaction costs sum up to:
2 = =2� +<2�
2 = [< +=]21 +2<=22 +2<=23
(+
<=
)+=24
(+
=
)+<24
(+
<
). (3.3)
In comparison, if 9 correspondents are involved (compare Figure 3.3), each domestic bankhas transaction costs of:
2̂� = 21 + 922 + 923
(+
9=
)+ 24
(+
=
). (3.4)
64 3 Contemporaneous Financial Intermediation
Instead of directly processing payments to foreign banks, the domestic banks forward paymentinstructions to the specific correspondents. In turn the correspondent forwards the payment tothe foreign bank. The costs for the foreign bank can be described by:
2̂� = 21 + 22 + 23
(+
<
)+ 24
(+
<
). (3.5)
In addition to the bilateral model, each correspondent bank also faces costs for their transmittingservices:
2̂� = 21 +[=+ <
9
]22 +=23
(+
9=
)+ <923
(+
<
)+ 24
(+
9
). (3.6)
As a result, in a system with 9 correspondents, = domestic, and < foreign banks, the overalltransaction costs are given by:
2̂ = =2̂� +<2̂� + 9 2̂�
2̂ = [< +=+ 9]21 +2[ 9=+<]22
+2[9=23
(+
9=
)+<23
(+
<
)]+=24
(+
=
)+<24
(+
<
)+ 924
(+
9
). (3.7)
To assess potential benefits of a correspondent banking system, the economy-wide costs with andwithout interbank intermediaries must be compared. Subtracting equation (3.7) from equation(3.3) reveals the cost differences between the two systems.
2− 2̂ = − 921− 924
(+
9
)+2[<=− ( 9=+<)]22 +2
[<=23
(+
<=
)−
[9=23
(+
9=
)+<23
(+
<
)] ]. (3.8)
If the cost reduction in 22 and 23 through interbank intermediaries exceeds the additional costs21 and 24, correspondents are beneficial. 21 increases with the number of correspondents in themarket. The general costs 24 for processing payments increase with both volume and the numberof involved correspondents because more liquidity is trapped on the respective Nostro accounts.For a sufficiently small number of correspondents, i.e., 9 ≤ <(=−1)
=, interbank intermediaries
result in lower network costs, 22. Instead of maintaining business relationships with all counter-parties, the domestic and foreign banks only interact with their correspondents. The networkcosts decrease as the number of domestic and foreign banks per correspondent increases. Ifthe cost function 23 is increasing at a decreasing rate, then correspondents can result in lowerforeign exchange and payment processing fees. In other words, in this case correspondentshave economies of scale. An example for such a cost function is 23(+) = 0+ 2, where 0 > 0and 0 < 2 < 1. For this cost function, a lower 23 is attained if there is a sufficient amount offoreign and domestic banks relative to the number of correspondents in the market. The sufficient

3.3 The downfall of interbank intermediaries 65
amount is defined as min {<,=} ≥[1+ 91−2
] 11−2 .15 If the number of correspondents ( 9) and the
economies of scale parameter (2) are constant, then the cost saving increases with a highernumber of foreign and domestic banks. Newman et al. (2018) cite processing payments (23) asthe most significant cost in cross-border transactions. Although cited as important, opportunitycosts for trapped liquidity (24) were found to be less significant than processing payment costs.The effect of the network management costs (22) was found to be low and that of market entrycosts (21) is cited as negligible. In the case of a relatively high number of foreign and domesticbanks compared to correspondents in the market, the positive effect of 22 and 23 outweighs theadditional costs of 21 and 24. Since the correspondent banking market is best described by anoligopoly, i.e., the cross-border payment services are controlled by a few large correspondents,this holds true. Consequently, correspondents reduce the overall costs.
3.3 The downfall of interbank intermediaries
3.3.1 The digital transformation of correspondent banking
3.3.1.1 Distributed ledger technology
The previously described correspondent banking system was developed when communicationwas still costly, slow, and unreliable. Banks faced regulatory, as well as technical differencesin national payment systems. As a result, there is limited transparency regarding the status ofpayments in this system. Depending on the parties involved, different requirements need to bemet, e.g., some national payment systems (e.g., Fedwire and CHIPS in the U.S., or the Australian,Swiss and Japanese RTGS systems) do not use SWIFT messages (Casu and Wandhöfer 2018).The correspondent banking system is susceptible to payment delays as not all involved bankshold enough liquidity in the correct currency. As a result of the internet and the accompanieddigitization, expectations by consumers for transparency, speed and reduced transaction costshave risen. In a world where online shopping enables real-time tracking and free delivery ofphysical goods within a few hours, customers struggle to accept opaque cross-border paymentsthat take several days. Despite significant investments by SWIFT and other banks, the cross-border payment infrastructure remains suboptimal. From a financial stability perspective, thecorrespondent banking system is also a source of risk (Freixas and Parigi 1998; Allen et al.2012; Del Prete and Federico 2019). Although, for simplification, banks use interbank credit
15 Note that the derived relation would be most beneficial for a monopolistic correspondent that could evolve from the suggestedcost function. As the cross-border market is clearly not controlled by a unique correspondent, the proposed cost function should beinterpreted as a piecewise-defined function of an overall cubic cost function. Costs first increase at a decreasing rate (as advocated) andthen increase at increasing rates after an optimal number and volume of processed payments is reached by a correspondent. If a cubiccost function is assumed, the existing oligopoly market structure can be rationalized.
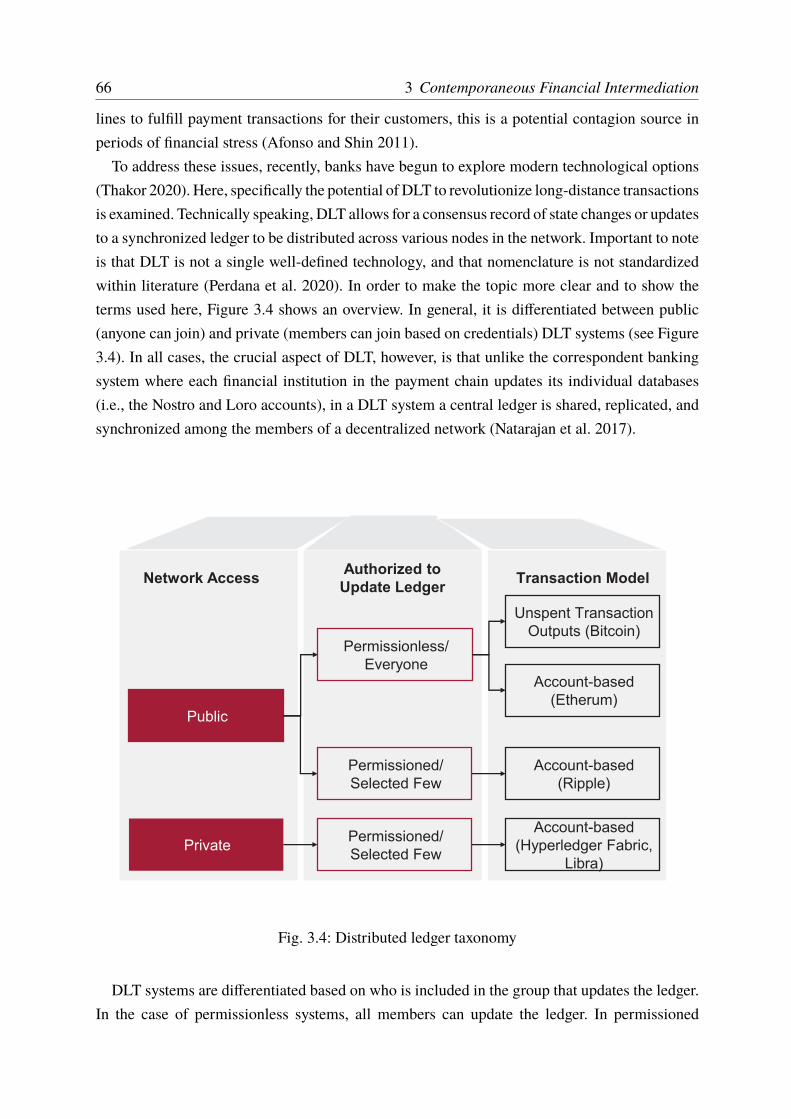
66 3 Contemporaneous Financial Intermediation
lines to fulfill payment transactions for their customers, this is a potential contagion source inperiods of financial stress (Afonso and Shin 2011).
To address these issues, recently, banks have begun to explore modern technological options(Thakor 2020). Here, specifically the potential of DLT to revolutionize long-distance transactionsis examined. Technically speaking, DLT allows for a consensus record of state changes or updatesto a synchronized ledger to be distributed across various nodes in the network. Important to noteis that DLT is not a single well-defined technology, and that nomenclature is not standardizedwithin literature (Perdana et al. 2020). In order to make the topic more clear and to show theterms used here, Figure 3.4 shows an overview. In general, it is differentiated between public(anyone can join) and private (members can join based on credentials) DLT systems (see Figure3.4). In all cases, the crucial aspect of DLT, however, is that unlike the correspondent bankingsystem where each financial institution in the payment chain updates its individual databases(i.e., the Nostro and Loro accounts), in a DLT system a central ledger is shared, replicated, andsynchronized among the members of a decentralized network (Natarajan et al. 2017).
Permissionless/
Everyone
Permissioned/
Selected Few
Public
Unspent Transaction
Outputs (Bitcoin)
Account-based
(Etherum)
Account-based
(Ripple)
PrivatePermissioned/
Selected Few
Account-based
(Hyperledger Fabric,
Libra)
Network AccessAuthorized to
Update LedgerTransaction Model
Fig. 3.4: Distributed ledger taxonomy
DLT systems are differentiated based on who is included in the group that updates the ledger.In the case of permissionless systems, all members can update the ledger. In permissioned

3.3 The downfall of interbank intermediaries 67
setups only certain members can update the ledger. The group governs and agrees by consensuson database updates, i.e., new transaction records. Thereby, the consensus is reached via apredefined cryptographic validation method, i.e., a set of rules. Such a consensus mechanismis necessary to establish whether a particular transaction is legitimate or not, and to ensure acorrect sequencing of transactions done with the same assets. Every record has a timestampand a unique cryptographic signature, making the ledger a verifiable, immutable history of alltransactions in the network.16
Two different record-keeping models are commonly used in DLT systems, UTXO (unspenttransaction output, sometimes referred to as store of value) and account-based (Kahn andRoberds2009; Kahn et al. 2019). For a transaction to be deemed satisfactory in an account-based system,the payer has to be identified as the holder of the account from which the payment is made. Theaccount balance of the payer is checked to ensure that the transaction amount is covered. Theaccount value of the payer is then reduced and the money is added to the account of the payee.In the case of a UTXO-based system, information about the amount available from the payer forthe transaction is stored in the unspent transaction output. This total value is used as the input forthe transaction. In a second step, a new UTXO (total amount minus transaction amount) is sentback to a newly created address of the payer and the transaction amount is stored in a new outputof the payee. The UTXO-model is often compared to a cash system. During a transaction, tocover the cost, several bills can be used (existing outputs) and in some cases change is returned(new output). In total each bill can only be used once (the original output no longer exists afterthe transaction).17
3.3.1.2 RippleNet - a new global payment system
Recently several banks, e.g., Royal Bank of Canada, Santander, UBS, etc., have begun to usea public permissioned account-based DLT system to transfer payments across borders. Thebanks use the closed-source banking software RippleNet that is sold by Ripple Labs, Inc. and isdifferent fromRipple’s own currencyXRP (colloquially also referred to as Ripple). Access to thissystem is naturally permissioned, i.e., participating banks are pre-selected by an administrator,i.e., Ripple Labs, who controls network access and sets the rules of the database. RippleNetis a distributed database that contains information about user accounts, balances, and trades(Ripple 2017). A trade or payment is executed by making a valid change to the central ledger.Here an interledger protocol connects the different payment record systems of all participatingbanks from which it creates the central ledger. The central ledger is shared and maintained byall network members and represents every user’s balance. Currencies enter and exit the Ripplenetwork via gateways, i.e., banks (Rapoport et al. 2014). Analogously to traditional banks, these
16 Note that many of the technical constructs are simplified here. For a more detailed and technical description, the reader is referred toNatarajan et al. (2017).17 For more details on the UTXO-model see, e.g., Sun (2018).

68 3 Contemporaneous Financial Intermediation
gateways accept currency deposits from customers and issue balances on the Ripple network.When a userwants towithdrawmoney from theRipple network, the existing balance is redeemed.For security purposes, every user of RippleNet must hold a small amount of XRP. Within thenetwork, payments can either be processed directly via XRP debit payments or indirectly viapath-based currency-agnostic “I owe you” (IOU) settlement transactions (Moreno-Sanchez et al.2016). In the case of IOU settlement transactions, banks can use fiat currencies (USD, Euro,etc.) to settle cross-border payments without any conversion to cryptocurrency. In this case,XRP is only used to pay the minute transaction fee imposed to prevent senseless transactions(Rapoport et al. 2014). To settle credit between sender and receiver, the most suitable route ofcredit between the sender’s and receiver’s banks is used (Moreno-Sanchez et al. 2018).Whenevera payment is made that involves two banks that are not connected by a direct trust line (i.e.,Nostro accounts), the payment “ripples” through other trust relationships in the network. Thesetrust relationships are banks that hold the specific currency pairs and function as market makers.By routing a payment through one (or several) market maker(s), banks can pay each other incurrencies that they do not hold (or do not want to hold). The system automatically uses themost competitive exchange rates, i.e. the cheapest path. The money is simultaneously debitedfrom the payer’s account and credited to the beneficiary. For example, an American company A
USD
Gateway -
Sender Bank
EUR
Gateway -
Beneficiary
Bank
USD/EUR
Market
Maker
Firm A: sender
with USD balance
Firm B: beneficiary
with EUR balance
a) Direct trust line
b) Pathfinding
Fig. 3.5: Cross-border payments via RippleNet
would like to transfer money to a European firm B. After checking for liquidity and verifying theclient’s identification (legally required), the bank of the sender can simply send an IOU in USDto the beneficiary’s European bank (compare Figure 3.5). At the same time, the beneficiary’sbank must also put the transaction amount on hold. This step is necessary to accommodate thedesire of the beneficiary to receive the money in Euros despite the transfer of USD. Once bothbanks have validated that the funds are on hold, the funds are released. A market maker becomesnecessary if the beneficiary bank in Europe does not want to hold USD (compare Figure 3.5).
3.3 The downfall of interbank intermediaries 69
The market maker holds trust lines with the sender and the beneficiary bank and is paid a smallfee (bid-ask spread) for the foreign exchange.18RippleNet simplifies cross-border transactions enabling on-demand liquidity across multiple
currencies for banks. It is capable of processing 1500 transactions per seconds and a typical pay-ment only takes about 4-5 seconds between initiation and completion (Travis 2017). RippleNetintegrates well into an already existing and highly regulated payment system. “In other words,while Ripple[Net] improves the underlying settlement infrastructure of global-payment systems,it does not affect the existing legal relationships between the participants of such systems” (Ros-ner and Kang 2016, p. 664). Banks must still continue to comply with financial regulations,anti-money laundering and know-your-customer rules. RippleNet also lowers some of the risksthat current regulations seek to mitigate. For instance, the adoption of atomic (all or nothing)real-time settlement drastically reduces the risk of lost payments.
While from a technological perspective, RippleNet and other DLT systems are generallyconsidered to offer secure, immutable, and transparent transactions, legal liability will simplynot disappear (Zetzsche et al. 2018). Risks that are particularly pronounced due to the early levelof RippleNet implementation are the lack of liquidity and the poor inter-connectivity of certainbanks. Moreno-Sanchez et al. (2018) show that if banks are poorly interconnected, then it ispossible that users can no longer access their funds even if the involved sender and beneficiarybank are not insolvent. In this case the issue of liability is unclear. The same holds true for thecase of unintended third-party access (cyberattack) or the “garbage in, garbage out” dilemma,i.e., the spread of inaccurate stored data via DLT. In case of RippleNet, Ripple Labs controls therules (Armknecht et al. 2015) and access to the database (Ripple 2017).19 This allows the entitiesinvolved to be known. In turn, the particular entity could be directly liable for economic lossesin the case of its breach. Nonetheless, the fundamental joint control of DLT will likely result ina joint liability of the network participants, including Ripple Labs (Zetzsche et al. 2018).
Due to the inherently international nature of RippleNet’s activities, both domestic and inter-national laws must be considered. For example, regulators have concerns about the monopolyposition of RippleNet in cross-border payments (European Securities and Markets Authority2017). In addition, regulators must decide under which jurisdictions conflicts fall, e.g., whichinsolvency law to follow in the case of a bank’s default (Rosner and Kang 2016). Therefore,regulators must coordinate and communicate to harmonize global standards and rules. Althoughthe use of XRP could simplify issues due to international regulations, most banks do not yetuse it as a vehicle currency. The digital currency is only worth what someone else is willing topay for it. Ripple Labs owns about 60 percent of all XRP and controls the money supply in thenetwork (Pick 2020). Users are forced to trust Ripple Labs with the fate of their money.
18 For very exotic currencies XRP can be used as a vehicle currency. Most banks, however, opt not to use XRP (Pick 2020). Therefore,a detailed discussion of this feature is omitted here. For more information on XRP settlement see, e.g., Ripple (2017).19 As fairly mentioned by Rosner and Kang (2016), in principle, no single entity can change the RippleNet database. However, most ofthe validating servers are run by Ripple Labs, allowing it to change the database.

70 3 Contemporaneous Financial Intermediation
Overall, for a successful wide-spread implementation, it is vital that all network elementsreceive sufficient supervision. For securing trust in the newpayment infrastructure,more researchon the resiliency and weakness of the system is needed.
3.3.2 Implications for the correspondent banking system
In the following the transaction cost model of Breuer (1993) is used to illustrate how DLTsystems, like RippleNet, affect the correspondent banking system. Instead of relying on severalspecialized correspondents, domestic and foreign banks use a shared network that is based on apermissioned DLT and transfer funds directly (compare Figure 3.6).
1 2 <
1 2 =
�!)
Fig. 3.6: Intermediation via DLT
In case of cross-border payments via DLT, the costs for a domestic and a foreign bank reduceto:
2̄� = 21 + 22 + 23
(+
=
)+ 24
(+
=
)(3.9)
2̄� = 21 + 22 + 23
(+
<
)+ 24
(+
<
). (3.10)
Instead of maintaining 9 counter-party relationships, each bank only maintains access to theRipple network. This reduces the network costs for each bank to 22. Similarly due to the factthat less parties are involved, the processing fees 23 can be reduced, too. Instead of processingmessages to 9 correspondents and keeping internal records to capture proprietary aspects of eachcurrency transfer, both banks only face one-time costs, consisting out of the direct transfer costsand costs for validating transactions on the ledger. Like in the correspondent banking system,banks still have to provide sufficient funds in their account to process the payments.
Even though a lot of interbank intermediaries can be excluded in this system, at least oneadministrator (�) for the marketplace is needed. The administrator faces market entry costsg1 to set up the system. Additionally, the administrator has to verify all domestic and foreignbanks (resulting in costs g2), ensuring that they have the ability to process payments. Once theinformation is digital, it can be easily verified and shared among all network members. Making
3.3 The downfall of interbank intermediaries 71
use of the distributed exchange capability, cross-border payments are automatically processedamong network members, resulting in g3. The instant real-time settlement of transactions basi-cally eliminates the time and cost of capital (g4) that is locked during a cross-border transfer.Still, the administrator faces g4 costs for the infrastructure, i.e., capacity costs that incur to beable to process all payments. Thus, the costs for the administrator can be described by:
2̄� = g1 + (< +=)g2 +=g3
(+
=
)+<g3
(+
<
)+ g4 (+) . (3.11)
As a result, in a DLT system the following transaction costs incur:
2̄ = =2̄� +<2̄� + 2̄�
2̄ = (< +=)21 + g1 + (< +=) (22 + g2) +=[23
(+
=
)+ g3
(+
=
)]+<
[23
(+
<
)+ g3
(+
<
)]+=24
(+
=
)+<24
(+
<
)+ g4 (+) . (3.12)
To assess potential benefits of the DLT system, the economy-wide costs of the DLT system mustbe compared to those of the correspondent banking system. Subtracting equation (3.12) fromequation (3.7) reveals the economy-wide differences between the two systems.
2̂− 2̄ = 921− g1 + 924
(+
9
)− g4(+) + [2 9=+<−=]22− (=+<)g2
+2 9=23
(+
9=
)−=
[23
(+
=
)+ g3
(+
=
)]+<
[23
(+
<
)− g3
(+
<
)]. (3.13)
Although the initial infrastructure required for a DLT platform is far more costly (g1) thana simple banking license (21), in relative terms considering the sheer number of existing cor-respondents 9 the technology is remunerative. While there is little data on the costs of publicpermissioned DLT systems, Brody et al. (2019) estimate an initial investment equivalent to ap-proximately twenty-six German banking licenses, i.e., correspondent banks.20 Currently, thereare about 361 correspondent banks in the Euro business alone. For a sufficiently large numberof correspondents (∼26), the DLT system results in lower market entry costs. A DLT systemreduces networking costs if onboarding (g2) is less expensive than it is for banks to establishcounter-party relationships (22). There is limited information on both the onboarding costs ina DLT system and the banks’ network costs. It seems plausible, however, that both the ad-ministrator and correspondents have economies of scale in establishing additional relationships(Maringer et al. 2019). While an administrator must accumulate knowledge about the regulatoryenvironment and how to establish trustworthy relationships, correspondents potentially alreadypossess unique proprietary knowledge. The exact relation between g2 and 22 is hard to determine.Although 22 may possibly be lower than g2, with an increasing number of correspondents the
20 According to Haag and Steffen (2020), the German Federal Financial Supervisory Authority BaFin charges a fee of up to $25,000for granting a banking license.

72 3 Contemporaneous Financial Intermediation
DLT system can result in lower network costs. Anecdotal evidence indicates that it is simply toocostly for correspondents to establish and maintain banking relationship for certain geographicregions (Bräuning and Fecht 2017; Kobayashi and Takaguchi 2018). The number of correspon-dents has been steadily decreasing over the last years and the remaining correspondents haveeven pared back their relationships. This resulted in even higher cross-border payments costsin abandoned regions (Rice et al. 2020). In contrast, technologies such as RippleNet enablebanks to exchange funds without dedicated pre-established networks for the target location ofthe transaction as long as both institutions are connected via the system.
Payment processing costs can be significantly reduced in the DLT system because failuresof payments are minimized through the automatic real-time settlement (Ripple 2017). In thecurrent correspondent system, complex interbank pricing rules create the need for manualinvoicing, claims-handling and dispute management. This requires substantial manpower andvaluable time for transaction execution. In addition, due to the presence of market makers,an universal intermediate currency (e.g., XRP) and cost beneficial path-settlements, foreignexchange costs can be reduced. Currently, managing cash reserves in multiple currencies makesoptimizing payment flows challenging. The DLT system will reduce operational costs linked tothe processing of payments, i.e., g3(·) < 23(·) holds true. Themain challenge for the administrator,e.g., Ripple Labs, is to ensure that the processing power to support an increasing number oftransactions per second is available, i.e., the system is scalable. The required computing isenergy intensive (Leopold and Englesson 2017; Truby 2018). Brody et al. (2019) cite ongoingmaintenance (g4) as the most significant running cost for a public permissioned DLT system. Inthe case of correspondents, typically, opportunity costs for trapped liquidity (24) are a major costfactor. Nonetheless, given the required processing power and energy, maintaining a DLT systemmight still be more expensive. However, in case of a relatively high number of correspondents,the positive effect of g1, g2 and g3 outweighs the additional costs of g4. Consequently, in principlea DLT system results in an overall cost saving. The magnitude of improvement greatly dependson network effects that can only be created by on-board large banks around the world (Iansitiand Lakhani 2017). To achieve this, building and maintaining trust in the new payment systemis vital.
3.4 Conclusion
Traditional correspondent banking networks are still prevalent for cross-border payments. Here,transaction cost theory was used to show the amenities of such interbank intermediaries. Sub-sequently, the effect of a DLT-based system on the cross-border payment market was analyzed.DLT has the potential to replace correspondents and dominate cross-border payments by reduc-ing the overall transaction costs. DLT is a nascent technology that could form the basis of a

3.4 Conclusion 73
new cross-border commercial payments network. The speed of acceptance by banks around theworld and the rate at which legal concerns are addressed will determine when DLT can be usedto support trillions of dollars in payments.
Acknowledgements This chapter is adapted frommyworking paper “Contemporaneous Financial Intermediation - HowDLT Changesthe Cross-Border Payment Landscape”, which is currently under review at the journal Information and Management. The paperis accepted for presentation at the German Operations Research Society AG workshop on Financial Management and FinancialInstitutions 2020, the World Finance Conference 2020 and at the Edinburgh conference on Economics of Financial Technology 2020. Ithank Max Bruche, Werner Neus, Anna Staerz, and Sebastian Weitz for their helpful suggestions and comments.


Part IIAccess to Finance, Innovation and Growth


Chapter 4Innovative Efficiency as a Lever to Overcome FinancialConstraints in R&D Contests
Abstract Often the winner of an R&D contest seems unexpected or surprising, e.g., small firmswin a disproportionate number of R&D contests despite having limited funds and on averagelower market power. Here, different contest situations are modeled by considering variations inthe innovative efficiency, patent valuation and financial resources of firms. It is found that smallfirms can be the Nash winner through highly efficient innovation despite financial constraintsand low patent valuation. The results are helpful in understanding and predicting the probabilityof a firm’s successful innovation.
4.1 Introduction
Give me a lever long enough and a fulcrum on which to place it, and I shall move the world.– Archimedes
Since Schumpeter’s discussion of the qualitative differences between the innovative activitiesof small entrepreneurial firms and large corporations, the relationship between firm size andinnovation has attracted a great deal of theoretical and empirical research (see, e.g., Cohen 2010for an in-depth overview). Until the 1980s, academics and policymakers attributed technologicalprogress and innovation predominantly to large firms. Today, however, there are many examplesof highly successful innovations stemming from small entrepreneurial firms.
One good example is the success of PayPal. In the 1990s internet use became very popularand companies such as eBay began to offer an online marketplace that enabled virtual strangersto conduct transactions with a mouse click. While purchases on such websites seemed instan-taneous, the payment process still lagged behind. Slowly online transaction services started toappear that enabled people to exchange money instantly. However, these services were plaguedby fraud issues. Although this was problematic for all service providers, Citibank, the largestU.S. bank at that time, and PayPal, a small start-up from California were the most significantplayers in the research and development contest to address digital fraud. In 2001, despite beingmuch smaller, more financially constrained and having much less experience with financialtransactions, PayPal was the first to patent a financial surveillance software called IGOR.21 ThusPayPal succeeded, Citibank ended its online transaction service in 2003 and left the marketcompletely. Like PayPal, many entrepreneurial firms beat a seemingly stronger opponent in
21 Compare Levchin and Frezza (2002). Note that according to the U.S. patent law, software per se cannot be patented. However, thepatent was granted for a business method invention.
77

78 4 Innovative Efficiency as a Lever
R&D contests. This raises the question of innovative advantage, i.e., when are entrepreneurialfirms more capable at generating innovations.
Creating innovation requires investment in R&D. Large and well-established firms haveadvantages in financial resources (Beck et al. 2005; Hottenrott et al. 2016). They have thefinancial reputation and records of past performances necessary to attract additional financing.Moreover, it has been repeatedly found that within many industries, R&D expenditures varyproportionallywith firm size, i.e., larger firms have higher R&Dexpenditures (Acs andAudretsch1988; Foster et al. 2019). Based on these findings, all else equal, large firms are more probable towin R&D contests (Kamien and Schwartz 1982; Schroth and Szalay 2009). In addition to beingmore endowed, there are several reasons why large firmsmay have greater incentives to innovate,and consequently value the patent more than small firms.22 They can apply the innovation in agreater product output and reap rewards more quickly (Teece 1986; Gans and Stern 2003). If afunctioning patent system is in place, established firms have greater incentives to preserve theircurrent market position by patenting new technologies before potential competitors (Gilbert andNewbery 1982).
Regardless, many modern global corporations often find it difficult to compete with the R&Defforts of smaller firms. Holmström (1989) attributes the success of smaller firms to comparativeadvantages in conducting innovative research, i.e., a higher innovative efficiency. Large firmshave more bureaucratic drag, organizational rules and routines, and are distracted by ongoingbusiness activities (Haveman 1993). Additionally, due to the fact that R&D investments areuncertain, intangible, and can take a long time, project managers can more easily seek privatebenefits and disguise their suboptimal investment decisions.23 This particularly holds true forlarge firms, because they pursue several research projects at the same time and face less significantfinancial constraints. In contrast, financially constrained firms, which are often small, only investin their most promising projects (Zenger 1994; Almeida et al. 2013). There is also evidencethat small firms more often benefit from unidirectional knowledge spillovers from universities(Kirchhoff et al. 2007). Thus, there are several reasons why small firms might have a higherinnovative efficiency, i.e., a higher ability to transform investment into technological progress.
To understand whether innovative efficiency can be a lever with which small firms canpotentially overcome their lower incentive to innovate (measured by the patent value) andlimited funds, a contest model where two asymmetric firms compete for a patent is used.24
22 Note that there are also claims for why small and entrepreneurial firms have greater incentives to innovate. Reinganum (1983), forexample, argues that established firms have lower incentives to innovate when there is uncertainty about whether an innovation willcannibalize a portion of their profits.23 Private benefits from wasteful R&D investment come in many ways. For example, managers may gain insider profits by disclosingplanned changes in R&D budgets (Aboody and Lev 2000). Moreover, having a large R&D budget represents power, which can helpenhance managers’ self esteem.24 Within the industrial organization literature, at least two other model types (races and tournaments) are often used. Here, however,the contest framework was selected because it offers a simple structure and empirical results can be easily included. As shown by Bayeand Hoppe (2003), contest games are strategically equivalent to continuous-time patent-race games with negligible interest rates (see,e.g., Loury 1979), and (if restricted to a discrete strategy space) to research-tournament games (see, e.g., Taylor 1995; Fullerton andMcAfee 1999).
4.2 The basic model 79
Thereby, the three previously described, variable characteristics of firms are considered: patentvaluation, innovative efficiency and financial constraints.
Prior work on strategic consequences of firm characteristics in contests focused on the effectof different patent valuations (e.g., Nti 1999) or innovative efficiency (e.g., Singh and Wittman2001) or both (e.g., Harris and Vickers 1985; Baik 1994). Baik (1994) shows that a firm canovercome its relative innovative inefficiency through a higher relative valuation of the patent iffinancially unconstrained. In reality, however, a firm’s willingness to invest is not a sufficientcondition for actual investment in R&D, because they have limited funds. This holds particularlytrue for small entrepreneurial firms (Brown et al. 2012). Che and Gale (1997) and Grossmannand Dietl (2012) address this concern and incorporate financial constraints in their contestmodels. The model of Che and Gale (1997) is limited because they assume otherwise symmetricfirms. In the case of Grossmann and Dietl (2012) asymmetric patent valuation is considered,but innovative efficiency is not addressed. Innovative efficiency, however, has been found to playa key role in R&D success. Shackelford (2013), for example, reports that small firms (5-499employees) spend on average only $1.17 million per patent application, whereas large firms(>500 employees) spend on average $2.63 million per patent application. Akcigit and Kerr(2018) also document a significant decline in innovation intensity (patents as a share of sales ortotal employment) with firm size.
By considering the effect of all three firm characteristics, the work here provides a morecomplete analysis of the correlation between a firms’ R&D expenditures and its resulting successin innovation. The next section presents the basic assumptions and the structure of the model.Then the case without financial constraints is analyzed. Subsequently the analysis is extendedto the case of asymmetric firms with varying financial constraints. The article concludes witha summary of the main results and highlights policy implications and testable implications forfuture empirical research.
4.2 The basic model
A contest between two asymmetric firms i (i=L,S), i.e., a large and a small firm, that arecompeting in R&D activities in order to attain a patentable product is considered. Because thepatent system provides a legal monopoly over the technology to the winner, the innovation allowsthe first firm to extract profits c by selling it in a market where competitors are unable to replicateit. Only the winner of the contest profits and the loser suffers a loss given by the invested R&Dexpenditures which, however, is sunk as soon as the contest is over. Evaluation of the patent isdifferent between the two firms due to differences in commercializing the new products. Whilethe small firm values the patent at c, the large firm values the patent at Uc, where U > 0. Ifthe valuation parameter U is greater than one, the large firm values the patent more, while a

80 4 Innovative Efficiency as a Lever
value of the parameter less than one implies the opposite. While some firms can fully realize thepotential of an innovation or even have additional utility for other applications, other firms arelimited in their financial and human resources to commercially exploit the innovation (Gans andStern 2003). In addition, patents have different strategic values for firms, e.g., due to securinga firm’s future market or due to restricting competitors’ opportunities (Blind et al. 2009). Withtime the valuation parameter of a firm can vary, i.e., past successful R&D contests result inchanges of strategic motives. For a single R&D contest, however, it is assumed, that the presentcommercialization capability and a firm’s strategic motives largely predetermine the valuationparameter.
In order to win the contest, both firms invest G8 of their financial resources l8 > 0 in R&Dactivities. Thus, the maximum investment each firm can make is equal to its financial resources.Furthermore, the individual financial resources of the firms are common knowledge. It is publiclyknown that the large firm has more financial resources than the small firm (l! > l() because ithas access to capital market financing. The small firm must rely on internal and private funds.
The success probability of each firm is given by the logit-form contest success function (Dixit1987). Firm i’s probability of winning the contest, ?8 = ?8 (G! , G(), equals the ratio between itsown (effective) investment and the sum of all (effective) investments:
?8 (G! , G() =
\8G8\!G!+\(G( if max{G! , G(} > 0
0 otherwise,(4.1)
where \8 > 0 indicates the firm’s innovative efficiency, i.e., the ability to transform the investmentinto technological progress. Put differently, the innovative efficiency parameter is a measure fora firm’s present ability to generate patents per dollar of R&D investment. A firm’s innovativeefficiency existent in each R&D contest is predetermined by several characteristics, such as theorganizational form (Holmström 1989; Seru 2014), managerial skills (Custódio et al. 2019), pastinnovation success (Cohen et al. 2013), and financial distress (Almeida et al. 2013).
For notational ease, equation (4.1) is considered in relative terms. The probability of successfor the large firm is described by the following function:
?! (G! , G() =
fG!fG!+G( if max{G! , G(} > 0
0 otherwise,(4.2)
where f = \!\(
represents the innovative efficiency of the large firm relative to the small one. Avalue of f greater unity implies that the large firm has a higher innovative efficiency than thesmall firm, and vice versa. Note that the described set-up is a special case of the more generalmodel of Baik (1994).
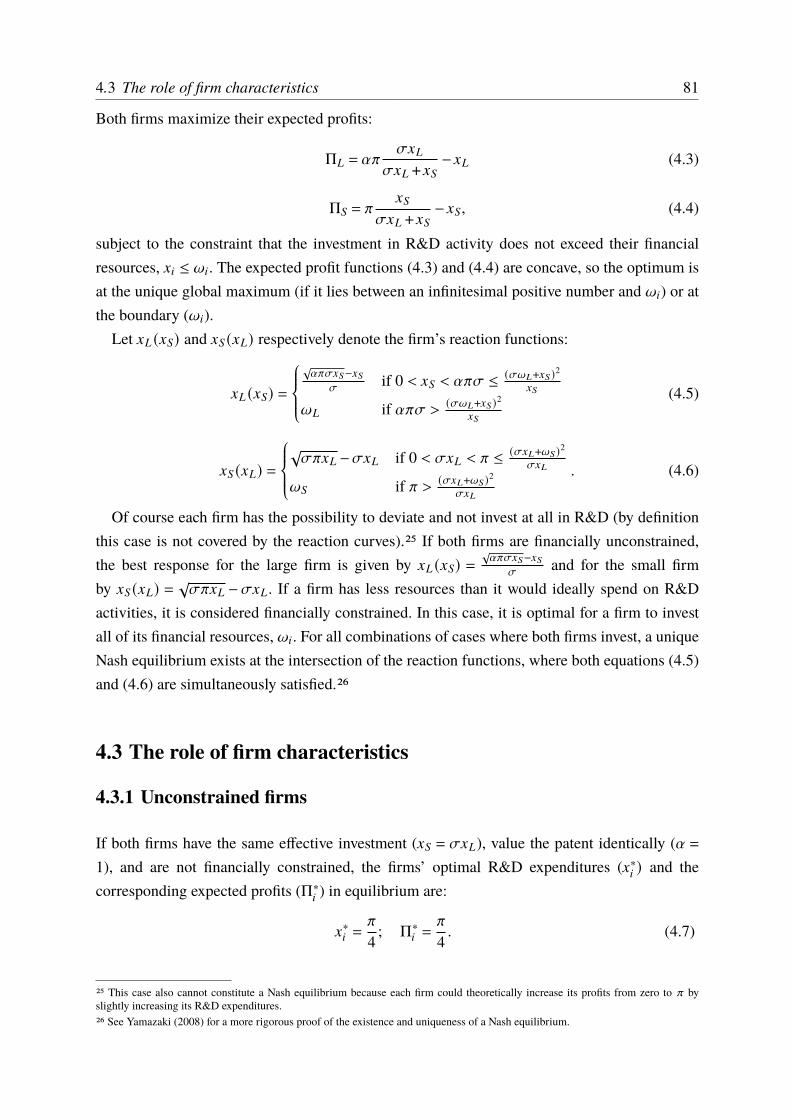
4.3 The role of firm characteristics 81
Both firms maximize their expected profits:
Π! = UcfG!
fG! + G(− G! (4.3)
Π( = cG(
fG! + G(− G(, (4.4)
subject to the constraint that the investment in R&D activity does not exceed their financialresources, G8 ≤ l8. The expected profit functions (4.3) and (4.4) are concave, so the optimum isat the unique global maximum (if it lies between an infinitesimal positive number and l8) or atthe boundary (l8).
Let G! (G() and G( (G!) respectively denote the firm’s reaction functions:
G! (G() =√UcfG(−G(
fif 0 < G( < Ucf ≤ (fl!+G()
2
G(
l! if Ucf > (fl!+G()2
G(
(4.5)
G( (G!) =√fcG! −fG! if 0 < fG! < c ≤ (fG!+l()
2
fG!
l( if c > (fG!+l()2
fG!
. (4.6)
Of course each firm has the possibility to deviate and not invest at all in R&D (by definitionthis case is not covered by the reaction curves).25 If both firms are financially unconstrained,the best response for the large firm is given by G! (G() =
√UcfG(−G(
fand for the small firm
by G( (G!) =√fcG! −fG! . If a firm has less resources than it would ideally spend on R&D
activities, it is considered financially constrained. In this case, it is optimal for a firm to investall of its financial resources, l8. For all combinations of cases where both firms invest, a uniqueNash equilibrium exists at the intersection of the reaction functions, where both equations (4.5)and (4.6) are simultaneously satisfied.26
4.3 The role of firm characteristics
4.3.1 Unconstrained firms
If both firms have the same effective investment (G( = fG!), value the patent identically (U =1), and are not financially constrained, the firms’ optimal R&D expenditures (G∗
8) and the
corresponding expected profits (Π∗8) in equilibrium are:
G∗8 =c
4; Π∗8 =
c
4. (4.7)
25 This case also cannot constitute a Nash equilibrium because each firm could theoretically increase its profits from zero to c byslightly increasing its R&D expenditures.26 See Yamazaki (2008) for a more rigorous proof of the existence and uniqueness of a Nash equilibrium.

82 4 Innovative Efficiency as a Lever
In this case, both firms are equally likely to win the R&D contest (?∗8= 1/2).
However, firms usually differ in their innovative efficiency and their valuation of the patent,i.e., U and f are not equal to one. Thus, the optimal R&D expenditures (and consequently alsothe success probabilities) and the corresponding expected profits depend on a combination ofthese factors:
G∗! =U2cf
(Uf +1)2; Π∗! =
U3cf2
(Uf +1)2(4.8)
G∗( =Ucf
(Uf +1)2; Π∗( =
c
(Uf +1)2. (4.9)
In the following, the Nash winner is defined as the firm who has a probability of winninggreater than 1/2. Thus, the large firm is the Nash winner if Uf > 1, while the small firm is theNash winner if Uf < 1. As a result, if one firm has a significantly higher innovative efficiency,it is now possible that this firm is the Nash winner even if it values the patent less. Similarly, if afirm values the patent significantly higher, it can still be the Nash winner even if it is less efficientin innovating. Figure 4.1 illustrates the case for the situation where the small firm overcomesits relative lower valuation through a higher relative efficiency. The dotted line in Figure 4.1illustrates the points that satisfy fG! = G(, resulting in an equal winning probability. Therefore,if the Nash equilibrium is located above (below) the dotted line, the small (large) firm is theNash winner.
xS
xL
σ xL
= xS
xL
(xS)
xS(x
L)
Fig. 4.1: Reaction functions when the small firm values the patent less but is significantly moreefficient, i.e., Uf < 1 holds true

4.3 The role of firm characteristics 83
Since the outcome of the contest crucially depends on the values of U and f, comparativestatics with respect to these parameters are analyzed. An increase of the valuation parameter Uresults in a shift to the right of the large firm’s reaction function (cf. Figure 4.2). The valuationparameter is relative. Therefore, the small firm’s reaction function remains unchanged.
xS
xL
σ xL
= xS
xS(x
L)
xL
(xS)'
Fig. 4.2: Shift of the large firm’s reaction function when the valuation parameter U increases,i.e., the large firm values the innovation higher
Intuitively, the large firm is willing to spend more in R&D activities, the more it values thepatent. A higher valuation parameter U in turn can result in higher or lower R&D expendituresfor the small firm:
mG∗!
mU=
2Ucf(Uf +1)3
> 0 (4.10)
mG∗(
mU=−Ucf2 +fc(Uf +1)3
> 0= 0< 0
8 5
<
Uf = 1>
. (4.11)
In the case Uf < 1, the small firm has an advantage and increases its R&D expenditures withincreasing U. Once an equal success probability is reached, the small firm is no longer at anadvantage and will no longer increase R&D expenditures. In the case Uf > 1, the large firmis stronger and the small firm decreases its R&D expenditures with increasing U. Thus, firmsincrease their R&D expenditures (and their success probability) as long as they maintain anoverall advantage. The opposite holds true for a lower valuation parameter.
An increase of the relative innovative efficiency parameter from f to f′ results in a shift tothe right (upward) of the large firm’s reaction function above curve f′G! = G(. However, below

84 4 Innovative Efficiency as a Lever
curve fG! = G( the large firm’s reaction function shifts to the left (downward). A graphicalillustration is given in Figure 4.3.
xS
xL
σ xL
= xS
xL
(xS)'
σ' xL
= xS
xS(x
L)'
Fig. 4.3: Shifts of reaction functions when the innovative efficiency parameter f increases
In the case of Uf′ < 1 (i.e., above curve f′G! = G(), where the small firm is strong, the largefirm responds to an increase in the relative innovative efficiency by increasing its own R&Dexpenditures. Although the large firm’s innovative efficiency increases relative to the small firm,it remains an overall disadvantage. The small firm will also increase its R&D expenditures. Inthe case of Uf > 1 (i.e., below curve fG! = G(), where the small firm is weak, the large firmresponds to an increase in its innovative efficiency by decreasing its own R&D expenditures.Since the increase in the efficiency parameter worsens the small firm’s situation, it will respondaccordingly by decreasing its R&D spending. Overall, each firm’s R&D expenditure increaseswith increasing f until f reaches 1/U, and then decreases with increasing f.
mG∗!
mf=−U3cf +U2c
(Uf +1)3
> 0= 0< 0
8 5
<
Uf = 1>
(4.12)
mG∗(
mf=−U2cf +Uc(Uf +1)3
> 0= 0< 0
8 5
<
Uf = 1>
. (4.13)
In addition, a higher (lower) relative innovative efficiency parameter always increases thesuccess probability of the large (small) firm.

4.3 The role of firm characteristics 85
4.3.2 Financial constraints
In addition to the valuation parameter and the innovative efficiency, a firm’s financial constraintsare considered. In the following the small firm is considered financially constrained, i.e., it canonly invest its financial resources l(, that is assumed to be under the theoretically optimalR&D expenditures without financial constraints,l( < G∗(.27 In this case, the firms’ optimal R&Dexpenditures are:28
G∗∗! =
√l(
f
(√Ucf−√l(
)(4.14)
G∗∗( = l(, (4.15)
and the corresponding expected profits are:
Π∗∗! =
(√Ucf−√l(√
f
)2
(4.16)
Π∗∗( =
√cl(√Uf−l( . (4.17)
Whether the large or the small firm is the Nash winner or loser now depends on a combinationof the relative patent value, the relative innovative efficiency and the financial resources of thesmall firm, l(. For Uf ≥ 1, the large firm is always the Nash winner, given that the small firm
xS
xL
σ xL
= xS
xL
(xS)
xS(x
L)FC
xS
** = ω
S
Fig. 4.4: The small firm has an overall disadvantage (Uf > 1) and is financially constrained
27 Note that the case where the large firm is financially constrained could also be examined, but would provide no further insight as thelarge firm is always relative to the small firm.28 In order to guarantee a positive investment for the large firm, Ucf > l( and the non-binding constraint G∗∗
!≤ l! must be fulfilled.

86 4 Innovative Efficiency as a Lever
is financially constrained. In this case, the small firm has a comparative disadvantage that isamplified further by its financial constraints (cf. Figure 4.4).
For Uf < 1, the small firm has a comparative advantage that results in a higher successprobability without financial constraints. Thus, the Nash winner is determined by how financiallyconstrained the small firm is. The equal winning probability is described by the points that satisfyfG! = G(. For an equal winning probability the financial resources of the small firm must equal:
l̂( =Ufc
4. (4.18)
If the small firm has less financial resources than l̂(, i.e., it is extremely financially constrained,the large firm becomes the Nash winner (cf. Figure 4.5).
xS
xL
σ xL
= xS
xL
(xS)
xS(x
L)FC
xS
** = ω
S
Fig. 4.5: The small firmhas an overall advantage (Uf < 1) but is extremely financially constrained
Although the large firm has a comparative disadvantage, the limited financial resources setthis disadvantage off and decrease the small firm’s success probability significantly. However,if the small firm’s financial resources exceed l̂(, it becomes the Nash winner. Thus, if it canovercome the lower valuation of the patent with a higher innovative efficiency, the small firm isthe Nash winner despite facing financial constraints (cf. Figure 4.6).
4.3 The role of firm characteristics 87
xS
xL
σ xL
= xS
xS(x
L)FC
xL
(xS)
xS
**= ω
S
Fig. 4.6: The small firm has an overall advantage (Uf < 1) but is weakly financially constrained
Overall, all else equal, more financial resources lead to an increase in the small firm’s R&Dexpenditures and its probability of winning until the theoretical optimal expenditures G∗
(are
reached.mG∗∗
(
ml(= 1 > 0. (4.19)
The effect of an increase in l( on the large firm’s R&D expenditures requires further analysis.
mG∗∗!
ml(=
√Ucf√l(−2
2f
> 0= 0< 0
8 5
<
l( = l̂(
>
. (4.20)
If the small firm has financial resources that are below l̂(, the large firm raises its R&Dexpenditures with increasing financial resources of the small firm. Intuitively, the large firm iswilling to spend more in R&D activities as long as it remains the Nash winner. Whereas theopposite is true for l( > l̂(.In all cases, more financial resources of the small firm result in a decrease of the large firm’s
expected profits. In this case, the large firm becomes less likely to win the contest.
mΠ∗∗!
ml(=
1f−√Ucf
f√l(
< 0. (4.21)
The profits of the large firm decrease with increasing financial resources l( since if the largefirm invests in R&D activity Ucf > l( holds true (compare equation 4.14). Consequently, thesecond term of equation (4.21) is always larger than the first term (
√Ucf√l(
> 1).

88 4 Innovative Efficiency as a Lever
The expected profits for the small firm will change with increasing financial resources ac-cordingly:
mΠ∗∗(
ml(=
√l̂(
Uf√l(−1
> 0= 0< 0
8 5
<
Uf√l( =
√l̂(
>
. (4.22)
The expected profits of the small firm increase for Uf√l( <√l̂(. Intuitively, this holds true in
the case of Uf < 1, where the small firm is strong. An increase in its financial resources raisesits success probability in all cases because it has an overall advantage. The small firm’s expectedprofits will increase until it reaches its optimal R&D expenditures G∗
(, i.e., it is financially
unconstrained. A graphical illustration is given in Figure 4.7.
ΠS
**
ω̂S ωS
x∗S ω̂S
(ασ)2
Fig. 4.7: Financial resources and expected profits of the small firm when it has an overalladvantage (Uf < 1)
If the small firm is weak (Uf > 1), an increase of its financial resources can result in higherexpected profits (compare area A in Figure 4.8). This is only the case for l( < l̂(
(Uf)2 =c
4Uf ,where the marginal revenues exceed the constant marginal costs. This means that an increasedwinning probability offsets the additional R&D expenditures.
If the small firm’s financial resources l( are larger than l̂((Uf)2 , its expected profits decrease.
Due to the fact that the small firm is financially constrained √l( <√G∗(=√Ufc
Uf+1 holds true.Rearranging this relation yields:
(Uf +1)√l( <√Ufc (4.23)
Uf +12√l( <
√l̂( . (4.24)

4.3 The role of firm characteristics 89
ωS
x∗Sω̂S
(ασ)2ω̂S
ΠS
**
BA
Fig. 4.8: Financial resources and expected profits of the small firm when it has an overalldisadvantage (Uf > 1)
The expected profits of the small firm decrease for 1+Uf2√l( <
√l̂( < Uf
√l(. In Figure 4.8,
this holds true for all financial resources in area B. In the case of Uf > 1, where the smallfirm is weak, the additional R&D expenditures are larger than the potential gains. The marginalrevenues are below the constant marginal costs. In this case, a more constrained small firmwouldbe preferential as a larger firm will increase R&D expenditures as a result of higher spending bya smaller firm.
Although generally large firms have more financial resources, on an individual R&D projectlevel it is possible that both firm types are comparably financially constrained. In this case, it isoptimal for both to invest their financial resources.
G∗∗∗! = l! (4.25)
G∗∗∗( = l( . (4.26)
As an example, the situationwhere the small firm has an overall advantage (Uf < 1) is depicted inFigure 4.9. Equilibria, i.e. any intersection between two financially constrained investments, onlyexist within the shaded lens. The Nash winner is determined by a firm’s financial resources andits innovative efficiency. If both are financially constrained, the expected profits in equilibriumare given by:
Π∗∗∗! = Ucfl!
fl! +l(−l! (4.27)
Π∗∗∗( = cl(
fl! +l(−l( . (4.28)

90 4 Innovative Efficiency as a Lever
xS
xL
σ xL
= xS
xS
***=w
S
xL
***=w
L
Fig. 4.9: Reaction functions when both firms are financially constrained, and the small firm hasan overall advantage (Uf < 1)
For Uf > 1 the large firm has larger expected profits if both firms have at least the samefinancial resources (compare equation 4.29). Alternatively, if Uf < 1, the small firm has largerexpected profits. In case the large (small) firm has less financial resources than its competitor butis overall advantaged, i.e., Uf > 1 (Uf < 1), its expected profits are higher or lower dependenton its financial resources and its overall advantage:
Π∗∗∗!
> Π∗∗∗
(
= Π∗∗∗(
< Π∗∗∗(
8 5
>
l! (Ucf−fl!) = l( (c−fl!)<
. (4.29)
4.4 Conclusion from the model, real world significances and futureresearch
There is awide debate onwhether small or large firms aremore capable innovators. The presentedmodel reveals explanations for different outcomes of R&D contests. Table 4.1 summarizes thepresented results. In several cases small firms have a higher success probability. Either theyvalue the patent more than large firms and have at least the same innovative efficiency, orthey can overcome their relatively lower patent valuation with a higher innovative efficiency(Uf < 1). Interestingly, this prediction even holds true for small firms that are weakly financiallyconstrained. In this case, if the financial resources of the small firm are sufficiently large, i.e.,l( > l̂(, innovative efficiency is a lever with which the small firm can overcome its lower

4.4 Conclusion from the model, real world significances and future research 91
Table 4.1: Summary of results
Relative advantage x∗Y 8̂Y < 8Y < x∗Y 8Y < 8̂Y < x∗Y 8Y < 8R
Uf < 1 ?( > ?! ?( > ?! ?( < ?! ?( Q ?!Uf = 1 ?( = ?! ?( < ?! ?( < ?! ?( < ?!Uf > 1 ?( < ?! ?( < ?! ?( < ?! ?( < ?!
This table displays the model’s predicted contest outcomes, measured by the winning probabilities ?( and ?! . Column 1indicates the firms’ relative advantage, dependent on the valuation parameter U and the innovative efficiency parameter f.While for Uf < 1 the small firm is favored, Uf > 1 indicates an advantageous situation for the large firm. Column 2 showsthe financially unconstrained cases where both firms invest G∗
(. Column 3 depicts the outcomes when the small firm is weakly
financially constrained (l̂( < l() . Column 4 shows the result when the small firm is extremely financially constrained(l( < l̂() . In the last column both firms face financial constraints but the small firm has less financial resources.
incentive to innovate despite limited funds. If the small firm, however, is extremely financiallyconstrained, i.e., l( < l̂(, the large firm is more likely to win, even if the small firm is moreefficient and values the patent higher. Analogously, on an individual project level innovativeefficiency is a lever with which the small firm can overcome its limited funds.
The presented findings are relevant for policy makers. They identify the significant contribu-tion of small firms to innovation. As a result of this finding, the founding of small firms shouldbe encouraged by the government. If small firms have sufficient funding, they can outplay theirlarger competitors. Public policies designed to promote innovation should therefore facilitate ac-cess to finance for small firms. In this context, governments can use regulation to make financialmarkets more attractive and accessible for small firms. Additionally, small firms should be mademore visible for investors. In order to financially help small firms, governments could offer R&Dsubsidies. Identifying the firms likely to innovate might, however, be challenging (Archibugiet al. 2013). Alternatively, according to Howell (2017), R&D grants given on a one-time basisat an early stage are an effective option.
Although prior empirical literature examined the characteristics of the most innovative firms,they focused on the average success of small versus large firms due to difficulties in observingcontestants. These results, however, might be biased since only successful small firm innovatorsare included in the sample. Making use of U.S. patent data, Thompson and Kuhn (2020) providea novel strategy to identify direct contestants, i.e., firms that compete for the same patent. Usingthis approach, the accuracy of the model could be examined using the outcome of real innovationcontests. For example, it could be directly exploredwhether financially unconstrained small firms(e.g., measured by employee size) outperform their larger contestants. Based on the model, thisshould be the case if they have a higher innovative efficiency and/or value the patent more. In thestudy by Thompson and Kuhn (2020) which examines R&D contests between publicly tradedfirm pairs, small firmsmore often win the patent. Although they claim that the contestants in theirsample are similar, the small firms have a slightly higher innovative efficiency (R&D intensity,measured by R&D expenditures per patent). A more thorough analysis of the model parametersis needed to assess their relative importance. Empirically, the role of innovative efficiency could

92 4 Innovative Efficiency as a Lever
be potentially disentangled from the valuation parameter by following specific employees as theymove to different firms. Similar to Akcigit and Kerr (2018), it could be examined how innovationqualities and types (process vs. product innovation) relate to firm characteristics. Conclusionson the expected profits resulting from the innovations could then be drawn. Alternatively, patentvaluations could be measured by using takeover offers for small firms, as suggested by Phillipsand Zhdanov (2013).
In the future, the impact of financial resources in direct R&Dcontestsmust be examined. Basedon the model, weakly financially constrained firms are expected to win if they can overcometheir limited resources with a higher patent valuation and/or a higher innovative efficiency. Thishypothesis is in line with empirical findings from Almeida et al. (2013). They show that onaverage weakly financially constrained firms have a higher innovative efficiency, resulting ina higher innovative success rate. On an individual project level, severe financial constraintsalso delay firm innovation (Kukuk and Stadler 2001). Given that both firms are comparablyfinancially constrained, the firm with the higher innovative efficiency should win.
In summary, the model could be applied to empirically explore many different aspects of theinnovative process.
Acknowledgements This chapter is adapted from my publication “Innovative Efficiency as a Lever to Overcome Financial Constraintsin R&D Contests” in the journal Economics of Innovation and New Technology in 2019. It was partly written during my stay atCass Business School, London. I thank Werner Neus, Manfred Stadler, Anna Staerz, Alexandra Zaby, the audience at the SIBR 2019Seoul Conference on Interdisciplinary Business & Economic Research and two anonymous referees for their helpful suggestions andcomments.

Chapter 5Identifying Corporate Venture Capital Investors: AData-Cleaning Procedure
Abstract The majority of research on corporate venture capital relies on data retrieved fromsecondary databases. However, various databases define CVC differently. Generally, researchersrely on the definition of the used database. As a result, empirical CVC research is not readilycomparable, and replicability across databases is often impossible. This article examines thescope and consistency of the most popular databases in CVC research: Eikon from ThomsonReuters and Dow Jones’ VentureSource. The outcome is a replicable data-cleaning procedurebased on an appropriate CVC definition. The article provides a necessary basis for the futurediscourse on CVC.
5.1 Introduction
Corporate venture capital is increasingly becoming ameans throughwhich established firms gainan edge in today’s business. Investment funds, or in this case CVC units, are established within aparent company (Dushnitsky 2006). The funds target nascent firms with promising technologiesthat are usually strategically aligned with the mother firm (Ernst et al. 2005). CVC investmentsprovide start-ups with capital and industry knowledge, and in turn, the parent companies acquireaccess to potentially disruptive technologies and emerging markets (e.g., Dushnitsky and Lenox2005). The increased CVC activity has stimulated academic interest in the topic, resulting in arapidly growing body of research (see Röhm 2018 for an overview). However, empirical researchinto its workings and impact has been hindered by data limitations and the absence of a commondefinition of CVC. This makes it particularly difficult to gauge the progression of CVC research.
There have been some attempts to propose a common theoretically-grounded CVC definitionfor future empirical work. Chemmanur et al. (2014), for example, define several dimensions thata firm should comply with in order to be considered a CVC. In their view, CVCs are stand-alonesubsidiaries of nonfinancial corporations that strategically invest in new ventures on behalf oftheir corporate parents to enhance competitive advantage. CVCs typically pursue both strategicand financial goals and are characterized by a managerial compensation practice that is tied tothe parent company’s performance.
In contrast, the majority of empirical studies base their definition of CVC on presets fromthe corresponding data providers, each of which has its own slightly different CVC definition.VentureSource classifies investors as a CVC if they invest in ventures through a dedicated fund tosimultaneously achieve financial and strategic objectives (personal communication, September
93

94 5 Identifying Corporate Venture Capital Investors: A Data-Cleaning Procedure
2017; VentureSource 2018a). Eikon treats corporate subsidiaries as CVCs if they are activelyinvolved in PE related investments (personal communication, September to October 2017).According to Crunchbase, a CVC is an arm of a corporation that invests in innovative start-upcompanies, whereas Pitchbook considers all forms of equity investment to be CVCs. CB Insightsdefines CVCs as specialized divisions of larger companies that directly invest in external privatecompanies.29 Even for the same database, it is hard to replicate empirical results because theunderstanding of CVC activities varies among researchers (see, e.g., Dushnitsky 2006 for anoverview) and most studies give no detailed information on the applied search settings within thecommercial databases. Additionally, researchers have reported inconsistencies among databases(e.g., Lerner 1994, 1995; Kaplan et al. 2002; Maats et al. 2011). In fact, we are unaware of anydetailed comparison of CVC databases.
Based on the theoretical literature, we define CVC units as wholly-owned subsidiaries of non-financial corporations that invest in start-ups on behalf of their corporate parent (e.g., Souitariset al. 2012; Chemmanur et al. 2014). Using this definition, we propose a replicable data-cleaningprocedure for the two most popular CVC research databases: Eikon from Thomson Reuters andDow Jones’ VentureSource.30 We thereby help to put future CVC research on a common foot-ing, which would facilitate academic discussion and promote coherence across future research.Additionally, we contribute to the literature on the consistency and reliability of venture capitalrelated databases by shedding light on the scope of CVC data in the two most extensively useddatabases.
5.2 Relevant databases for CVC research
To identify the most prominent databases for CVC research, we conducted an extensive literaturereview based on Elsevier’s Scopus database. We searched Scopus for occurrences of the searchstrings venture capital or corporate venture capital in either the title, abstract, or keywords.Additionally, we limited the results to academic papers published in journals before March2018 and written in English; applying the initial criteria meant we downloaded 2,128 articles.To extract information about the underlying databases used by the articles, we drew on thetext analysis program Linguistic Inquiry and Word Count from Pennebaker et al. (2015), andcontrolled for inconsistencies in spelling.With 551 appearances, Eikon (also known as ThomsonOne, VentureXpert, or Venture Economics and with a history of data collection going back to1961) is used most extensively, followed by VentureSource (also known as VentureOne thathas been collecting data since 1994) with 95 appearances. Other databases such as Crunchbase(26 appearances), Preqin (31 appearances), Pitchbook (9 appearances) and CB Insights (9
29 Prequin does not provide any specific definition of CVC but considers it a subgroup of VC.30 Note that the VentureSource data is now offered by CB Insights who acquired the database from Dow Jones (CB Insights 2020).

5.3 Data sample 95
appearances) play only a minor role.31 The results are similar to those of Da Rin et al. (2013),who reported that the two primary commercial databases used in VC research are ThomsonReuters’ Eikon and VentureSource fromDow Jones. Hence, we will focus on these two databasesin the remainder of this paper.
VentureSource provides information for 36,000 CVC investors and offers data points for about101,000 private equity (PE-) and VC-backed companies (VentureSource 2018b). In comparison,the “private equity screener” of Eikon comprises information on about 22,000 investors with51,000 funds and a total number of 133,000 PE- and VC-backed companies (Thomson Reuters2018). To gather information both databases rely on extensive quarterly surveys of investorsin the VC industry; surveys that grant access to sensitive information that is not presented inofficial deal statements. Additionally, VentureSource uses its Factiva database and a web-crawlerto identify information from press releases and investors’ homepages (personal communication,September 2017). Likewise, Eikon draws on government filings, public news releases, and onPE newsmakers including the European Venture Capital and Private Equity Journal (personalcommunication, September to October 2017; Thomson Reuters 2008, 2010).
5.3 Data sample
To develop a common data-cleaning process for the given CVC definition, we rely on the twoprimary databases: Eikon and VentureSource. For each database we construct two samples, onefor U.S.-based CVCs and one for CVC vehicles headquartered in Europe.32 As described byGompers and Lerner (2000) CVC activities are recurrent and strongly related to the generaleconomic condition. In order to cover a full boom-bust cycle, we draw on an extensive datasetranging from January 2000 to December 2015.33 In addition, we do not restrict the country oforigin of the investees, thus allowing for cross-country investments. We are well aware of the factthat particularly the VCmarket in Europe is highly diverse in terms of institutional attractiveness(Groh et al. 2010). However, using Europe as a subsample makes it possible to demonstratethe data-cleaning procedure in two geographical areas that are commonly used to describe VC-,PE-, and CVC-related phenomena.
In both databases, the search criteria were set to an appropriate minimum, reducing the risk ofomitting a CVC unit owing to incorrect classification in the databases. Accordingly, in additionto using geographical settings, we predefine “Corporate Venture Capital” as an investor type inVentureSource and “Corporate PE/Venture” as a firm type in Eikon. For the predefined period of
31 Because some articles discuss several databases simultaneously, the counts cannot be interpreted as mutually exclusive. Someempirical studies also rely on unique, mostly hand-collected data alongside the use of databases.32 Note that Europe also includes the non-EU countries Iceland, Norway, Russia, Switzerland, and Turkey.33 According to CB Insights (2017) corporate venture capital amounted to $16.8 bn. in 2000 before it substantially fell off after thedot-com bubble burst. It then began to increase again (before dipping during the financial crisis) and reached its current maximum of$28.4 bn. in 2015.

96 5 Identifying Corporate Venture Capital Investors: A Data-Cleaning Procedure
sixteen years we found 629 investors, 9,602 investees and a total of 19,077 investment rounds forthe U.S.-based Eikon sample (Europe: 282 investors, 2,737 investees, 4,540 investment rounds).For VentureSource our initial data set for the U.S. comprised 235 investors, 4,532 investeesand a total number of 7,719 investment rounds (Europe: 171 investors, 2,026 investees, 3,283investment rounds). The previously specified samples serve as a starting point for the subsequentdata-cleaning process.
5.4 Data-cleaning process
The proposed data-cleaning procedure comprises seven steps and results in a generic definitionfor a CVC unit. The underlying methodology of the data-cleaning procedure is shown in Figure5.1.
Fig. 5.1: Underlying methodology of the proposed data-cleaning procedure
In the following section, we introduce each step of the procedure and discuss how the un-derlying samples from both databases are affected. Table 5.1 offers an overview in numbers ofthe excluded investors, investees, and investment rounds for both data providers and for eachcontinent separately based on the applied criteria.

5.4 Data-cleaning process 97
Table 5.1: Results from the database queries for U.S. and European-based CVCs
Thomson Reuters DowJonesEikon VentureSource
U.S. Europe U.S. EuropeN in % in % in % N in % N in %
Step 1: Full sample Initial investors 00629 0282 0235 0171Initial investees 09602 2737 4532 2026Initial rounds 19077 4540 7719 3283
Step 2: Undisclosed investors Excluded investors 00001 00% 0002 01% 0000 00% 0000 00%Excluded investees 03101 32 % 0005 00% 0000 00% 0000 00%Excluded rounds 06332 33 % 0008 00% 0000 00% 0000 00%
Step 3: Unknown investors Excluded investors 00044 07% 0025 09% 0011 05% 0007 04%Excluded investees 00092 01% 0157 06% 0024 01% 0014 01%Excluded rounds 00199 02% 0213 05% 0043 01% 0016 00%
Step 4: Geographical overlap Excluded investors 0080 14 % 0007 03% 0050 22 % 0004 02%Excluded investees 00731 11 % 0055 02% 0571 13 % 0012 01%Excluded rounds 01885 15 % 0069 02% 1161 15 % 0019 01%
Step 5: Alternative investors Excluded investors 00063 13 % 0061 25 % 0015 09% 0013 08%Excluded investees 00507 09% 0636 25 % 0086 02% 0250 13 %Excluded rounds 00901 08% 1089 26 % 0207 03% 0510 16 %
Step 6: CVC governance Excluded investors 00240 54 % 0031 17 % 0033 21 % 0021 14 %Excluded investees 00843 16 % 0123 07% 0276 07% 0069 04%Excluded rounds 01828 19 % 0155 05% 0419 07% 0091 03%
Step 7: Outside LPs Excluded investors 00022 11 % 0017 11 % 0010 08% 0011 09%Excluded investees 01313 30 % 0434 25 % 01231 34 % 0362 22 %Excluded rounds 02604 33 % 0732 24 % 2168 37 % 0660 25 %
CVC definition Remaining investors 00179 0139 0116 0115Remaining investees 03015 1327 2344 1319Remaining rounds 05328 2274 3721 1987
This table reports the initial investors, investees and rounds for Thomson Reuters Eikon and DowJones VentureSource that were availablefor the United States and Europe. In addition, the number of excluded investors, investees and rounds is displayed for each proposeddata-cleaning step.
5.4.1 Undisclosed investors
Building on the initial step of retrieving the raw data from the databases, we drop all CVC unitswhere only information on the investee but not on the investors was available. This only affectedthe Eikon samples, in which unknown investors are categorized as “Undisclosed Investors” inthe U.S. data and as “Undisclosed Firm” or “Other UK Investor(s)” in the European data. Theomission of such investors led to the exclusion of 3,101 (5) investees in the U.S. (Europe) sample.This step eliminates one third of the hits from the U.S. sample. Eikon indicates the investors areinactive or unknown. Eikon either does not have the full information for these cases or promisedthe CVC investors to keep the information confidential for the next six months or until the nextfinancing round has passed. The fact that this is largely observed in the United States and notin Europe potentially can be traced back to differences in the CVC markets. U.S. Americanstart-ups have a broader set of funding options than their European counterparts. As a result,they can operate with more secrecy and timing defense strategies (Colombo and Shafi 2016).

98 5 Identifying Corporate Venture Capital Investors: A Data-Cleaning Procedure
Using a manual double-check with other sources for each investment might be appropriate forsome research questions. This, however, exceeds the scope of this paper.
5.4.2 Unknown investors
Third, we merge all investor specific information with data from the Capital IQ platform ofStandard & Poor’s. This made it possible to triangulate our data by drawing on an extensive poolof more than 4 million companies (S&P Global 2018). Compared to other databases, Capital IQoffers a broad coverage of both private and public companies. The database provides informationon the investors’ business descriptions and information related to the company affiliation. Weexclude all investors where we could not find a fitting investor profile in the Capital IQ database.Doing so ensured data consistency and simultaneously provided a solid and reliable foundationfor the subsequent steps. This step led to the exclusion of 44 U.S.-based investors appearing inthe Eikon sample (25 in Europe) and 11 appearing in the VentureSource sample (7 in Europe).
5.4.3 Geographical overlap
The fourth step includes the analysis of the investors’ position within an existing corporatenetwork. This is important because knowledge typically flows from the investor to the corre-sponding corporate mother (e.g., Gupta and Govindarajan 2000). Hence, the corporate motherdetermines the geographical affiliation. However, previous articles in the field of CVC limittheir empirical analysis to one geographical area (Röhm 2018), thus making them vulnerableto excluding external factors such as cultural aspects or institutional settings. Therefore, authorsneed to clarify if their selected CVC units are still suitable to their research question. In orderto elucidate the ownership status and thus determine the geographic affiliation, we draw on theCapital IQ database to identify potential corporatemothers for each investor. Accordingly, we usethe business descriptions in conjunction with the corporate tree function of Capital IQ to clearlymatch the investor to a corporate mother. Although we excluded non-U.S. and non-Europeaninvestors from our sample construction, we could still identify a large number of investors with acorporate mother from an excluded geographical region. For instance, German-based companiessuch as BMW and Bertelsmann operate investment vehicles in the USA. Both databases classifythese CVC units as U.S.-based, although the corporate mother is from Europe. Accordingly, weomit all CVC units with a corporate mother from a different region. This procedure resultedin the exclusion of 80 investors from the U.S. sample of Eikon (7 in Europe) and 50 fromVentureSource (4 in Europe).

5.4 Data-cleaning process 99
5.4.4 Alternative investors
Based on the business description, we omit business associations, NGOs, universities, regionaldevelopment vehicles, advisory firms, independent VCs, and several other non-CVC investmentvehicles such as hedge funds, PE investors, and business angels. These investor types wereinitially recorded as CVC units in the databases but do not meet the definition due to missingcorporate parents or because of their own descriptions of the unit in the Capital IQ database.Including them would therefore risk skewing the empirical analysis. Accordingly, between eightand twenty-five percent of the remaining investors were removed.
5.4.5 CVC governance
The sixth step includes the deep analysis of the remaining corporate investment vehicles. Fol-lowing Dushnitsky (2006), corporations can structure their venturing activities in three ways:first, they can act as a limited partner (LP) in already existing funds of independent venturecapitalists (IVCs). Second, the investments can be organized through an operating business unitresponsible for the venturing strategy (also called direct investments). In practice, it is mainlyR&D or business development units that are responsible for such transactions (Bertoni et al.2013). Third, CVC units can also be organized as wholly-owned subsidiaries within corporateboundaries. The problem, however, is that investments made through IVCs cannot be assignedto a specific corporate LP and are therefore not observable in the databases. There are alsochallenges involved in clearly matching direct CVC investments, because commercial databasesonly provide information about the existing corporate entities but not on the business unit level.Consequently, only wholly-owned subsidiaries were considered in the further analysis usingthe corporate trees in Capital IQ. In line with Dushnitsky and Lenox (2005), we also excludecorporate pension trusts and comparable investment schemes. This step led to the exclusion of54 percent of the remaining investment vehicles in the U.S.-based sample of Eikon (17 percentin Europe) and 21 percent of the remaining VentureSource investors (14 percent in Europe).
5.4.6 Outside LPs
In contrast to the proper sense of CVC, some corporate venture units act as a general partner (GP)for external investors. In this case, LPs such as insurance firms, can invest in a fund organizedand run by a CVC and benefit from the knowledge and experience of the GP. However, thisinvestment practice is accompanied by a risk of sharing knowledge with actual or potentialcompetitors through a knowledge outflow. Therefore, we excluded CVC vehicles with externalLPs. This results in the exclusion of 22 investors appearing in the Eikon U.S. sample (Europe

100 5 Identifying Corporate Venture Capital Investors: A Data-Cleaning Procedure
17), including prestigious CVCs such as Intel Capital. Looking at the VentureSource sampleswe excluded investors of similar magnitude resulting in a drop of 8 (9) percent of the remaininginvestors in the U.S. (European) sample.
5.4.7 CVC definition
The process deployed above yields the specified CVC vehicles. Of 629 (282), we consider 179 asCVCs in the Eikon sample (Europe 139). In VentureSource, we identify out of 235 (171) listedCVCs, 116 (115) for the USA (Europe). All other firms cannot be considered a CVC becausethey are funded by financial companies, partnerships, or multiple corporate parents, or have aforeign or unknown parent (Chemmanur et al., 2014).
A large number of the identified CVCs are present in both databases. In particular, we identify75 (65) shared CVC investors in the U.S. (European) sample. Overall, it appears that Eikon offersa greater availability of CVC investors. However, a closer look reveals that this is mainly drivenby past data points. More recently, VentureSource has caught up, offering similar numbers ofCVC investors (see Table 5.2). Examining the industry groups of the unique investors reveals that
Table 5.2: Comparison of unique CVCs and investment rounds (follow-on rounds excluded)covering the period 2000 to 2015
2000 2001 2002 2003 2004 2005 2006 2007Unique CVCs U.S. sample VentureSource 31 29 24 28 26 29 25 26
Eikon 63 58 36 44 37 43 38 38Investment rounds U.S. sample VentureSource 288 180 117 109 107 136 147 147
Eikon 716 321 166 134 150 161 214 227Unique CVCs European sample VentureSource 23 24 26 25 21 21 22 23
Eikon 26 25 23 19 20 21 14 21Investment rounds European sample VentureSource 78 103 79 94 80 81 78 103
Eikon 113 98 64 81 94 83 77 98
2008 2009 2010 2011 2012 2013 2014 2015Unique CVCs U.S. sample VentureSource 35 33 33 34 30 31 36 43
Eikon 45 34 35 42 36 38 43 45Investment rounds U.S. sample VentureSource 147 136 176 203 217 252 313 381
Eikon 234 159 210 244 246 263 284 354Unique CVCs European sample VentureSource 27 24 27 23 24 31 36 38
Eikon 29 19 23 22 29 27 31 38Investment rounds European sample VentureSource 104 77 78 110 173 85 110 122
Eikon 112 82 85 82 102 107 129 138
This table reports the number of uniquely identifiedCVC and investment rounds for theUnited States and Europe for both, VentureSourceand Eikon, over time.
Eikon is especially suited for U.S.-based CVCs from the transportation and utilities industries(Standard Industrial Classification (SIC) codes starting with 4). In comparison, VentureSourcehas a greater availability of European CVCs from the manufacturing industry (SIC codes starting

5.5 Conclusion 101
with 2 or 3) and U.S.-based CVCs from the service industry (SIC codes starting with 7 or 8).Regarding the covered investment rounds, Eikon systematically offers greater data coverage withone exception: VentureSource covers more investment rounds in the European sample betweenthe years 2011 and 2012.
5.5 Conclusion
This article seeks to address how CVC activity is measured and in which ways the commonlyused databases, namely Eikon and VentureSource can be used to reach a theoretically defineddataset of CVCs. Most published studies provide researchers with insufficient information aboutthe technical definition of CVC or base their empirical work on the definition of the commercialdata providers. We propose a data-cleaning procedure to promote future coherence in research.Future research could also apply our data-cleaning procedure to repeat previous studies. It wouldbe interesting to see whether differences in the results can be traced back to the data-cleaningprocedure. The presented results significantly contribute to the ongoing discussion of CVC.We provide a data-cleaning process allowing researchers to more generically define CVC. Thiswould increase comparability and replicability of the research results. Moreover, we providea comprehensive analysis of the data coverage in the commonly used databases of Eikon andVentureSource. This can help researchers decide which data provider is better suited for theirresearch question.
Acknowledgements This chapter is adapted from my publication “Identifying Corporate Venture Capital Investors: A Data-CleaningProcedure” in the journal Finance Research Letters in 2019. It was joint work with Patrick Röhm and Andreas Kuckertz, both from theUniversity of Hohenheim. We thank the audience at the G-Forum, Stuttgart 2018 for their helpful suggestions and comments.


Chapter 6Conclusion and Outlook
The goal of the presented work was to gain a more thorough understanding of the modernfinancial system’s function and its utilized infrastructure in developed countries.
The first part of this dissertation specifically looked at the role of banks in developed countries.Chapter 2 explored the importance of lending and payment and transaction services from banksfor SMEs, utilizing the unique situation of the U.S. marijuana industry. The presented paper useda mixed-method approach, consisting of event studies and a self-administered survey, to identifythe perceived value of different banking services. As expected, the study finds bank financingrelevant for SMEs. Rather surprisingly, the banks safekeeping depository and efficient paymentservices were found to be perceived significantly more important. Contrarily, in developingcountries, where only a small percentage of the population uses banking services, research hasfound that payments could be adequately covered by alternative service providers (FinTechs).One prominent example in literature is Kenya’s M-Pesa (Jack and Suri 2014; Beck et al. 2018).Based on the findings in this dissertation, however, in developed countries, it appears that bankstoday play a too integral part in transaction processing and safekeeping deposits, preventingwidespread use of alternatives. Thakor and Merton (2018) and Stulz (2019) trace this back tothe demand for safe assets and the existing deposit insurance, that make banks innately moretrustworthy than FinTechs. Thakor andMerton (2018) also point out that this distinction providesbanks with a competitive funding-cost advantage over non-depository lenders. The findings hereindicate that access to banking services in developed countries remains vital for SMEs. Today,specialized FinTechs have not yet taken away significant market shares from banks, and there iseven evidence that banks encourage experimentation in this space and often take over successfulFinTechs (Hornuf et al. 2018). The results should be considered in future policies. Future attemptsto boost the growth of SMEs should not only focus on providing adequate financing but alsoguarantee access to bank transaction and savings services.
Currently, banks are not only an integral part of payments and transactions on a national levelbut also are necessary for cross-border payments. Although national (or currency-zone-wide)payment systems have undergone continuous digitization and innovation over the last decades(Rysman and Schuh 2017), the cross-border payment system has barely changed (Committee onPayments and Market Infrastructures 2018). DLT has the potential to revolutionize cross-borderpayments, which currently are still carried out via correspondent banks. In aworldwhereBigTechfirms, like Amazon and Alibaba, enable online real-time payment and tracking, customersstruggle to accept opaque, costly and long-lasting cross-border payments processed by banks.The study presented in Chapter 3 showed theoretically that the use of a permissioned DLT system(e.g., RippleNet) could significantly reduce economy-wide transaction costs. A widespread use
103

104 6 Conclusion and Outlook
of DLT would make traditional correspondent banks needless because the technology allows thedirect interaction between the sender and the beneficiary bank. This increases the efficiency ofthe financial system and eases the trade of goods and services, stimulating economic growth. Sofar European and U.S. BigTech firms (in contrast to Alibaba in China) have not been very activein financial services. In case BigTechs start to branch out more from the provision of digital(platform) services into financial services, the banking landscape could profoundly change, alsoin developed countries. The digitization and potential entrance of BigTechs poses new researchquestions on risk sources, such as cyber risk, and might require a stronger focus of regulatorson consumer protection. Overall, however, based on the findings here, correspondent banks arelikely to disappear in the future.
The second part of this dissertation examined the effect of financial constraints and R&Dinvestment on innovation. Chapter 4 used an asymmetric contest model to theoretically answerunder what conditions small firms have an innovative advantage. The presented model revealsexplanations for different outcomes of R&D contests based on variation in the firms’ innovativeefficiency, patent valuation and financial resources. It is shown that small firms can be the patentwinner if their innovative efficiency is high enough to overcome their financial constraints, evenin cases of lower patent valuation. Although the findings here indicate that innovative efficiencycan be a lever to overcome financial constraints, small firms always require a certain levelof financial resources. Public policies designed to foster innovation should therefore facilitateaccess to finance for small firms. This is especially important because small firms are betterat generating major breakthroughs whereas larger firms focus more on incremental refinementsof products (Akcigit and Kerr 2018; Knott and Vieregger 2020). According to Howell (2017),R&D grants given on a one-time basis at an early stage are an effective medium. Alternatively,governments can use regulation to make financial markets more attractive and accessible forsmall firms (Kerr and Nanda 2009; Brown et al. 2013).More information on the interdependencyof financial constraints and innovative efficiency is still needed. In this context, the role of accessto non-financial resources is also a promising research area.
In addition to R&D grants by governments, recent empirical evidence shows that the uniquecombination of corporate expertise and research laboratories in the context of venture-backedstart-ups spurs innovation. CVCs not only promote innovation at the start-up level (Chemmanuret al. 2014; Colombo and Murtinu 2017) but also at the investor level (Dushnitsky and Lenox2005; Maula et al. 2013; Ma 2020). Empirical research on the impact and workings of CVCis difficult due to limited data. The majority of studies rely on data obtained from commercialvendors such as Thomson Reuters, Dow Jones, etc., that all have varying CVC definitions (Röhmet al. 2020). Chapter 5 provided a proposal for ways to standardize CVC research. A widespreaduse of the presented data-cleaning procedure would increase comparability and replicability ofempirical studies and thus promote future coherence in CVC research.

6 Conclusion and Outlook 105
In conclusion, in the future digitization is projected to drastically change the financial land-scape. The evolution of the bank-customer relationship in the last decades as a result of internet-enabled services (e.g., online banking) forebodes the potential future advancement. Already inthe near future, interbank intermediaries could become superfluous as a result of DLT. At thispoint, however, banks in general are still too integrated into the financial system of developedcountries. Predictingwhat role bankswill play for SMEs in the future is difficult and offers furtheropportunities for research. Innovation continues to be an important driver for economic growth.Using a theoretical model it was possible to explain why SMEs more often discover innovationsdespite being financially constrained. Large firms also utilize the higher innovative efficiency insmall firms by engaging in CVC. As CVCs are becoming ever more popular, research interestwill continue to increase. A broad application of the presented data-cleaning procedure wouldfacilitate to gauge progression of CVC research. Specifically, a deeper knowledge of CVCs andother financial intermediaries and markets on the amount and nature of firm-level innovationis needed. As the financial system develops, with new regulations and financial innovationchanging the landscape, new questions and challenges for researchers will arise.


References
Abadi, Joseph, and Markus Brunnermeier. 2019. “Blockchain Economics.” National Bureau of Economic Research Working Paper25407.
Aboody, David, and Baruch Lev. 2000. “Information Asymmetry, R&D, and Insider Gains.” Journal of Finance, 55(6): 2747–2766.https://doi.org/10.1111/0022-1082.00305.
Acs, Zoltan J., and David B. Audretsch. 1988. “Innovation in Large and Small Firms: An Empirical Analysis.” American EconomicReview, 78(4): 678–690. https://www.jstor.org/stable/1811167.
Afonso, Gara, and Hyun Song Shin. 2011. “Precautionary Demand and Liquidity in Payment Systems.” Journal of Money, Creditand Banking, 43: 589–619. https://doi.org/10.1111/j.1538-4616.2011.00454.x.
Aghion, Philippe, and Peter Howitt. 1992. “A Model of Growth Through Creative Destruction.” Econometrica, 60(2): 323–351.http://www.jstor.org/stable/2951599.
Aghion, Philippe, Thibault Fally, and Stefano Scarpetta. 2007. “Credit Constraints as a Barrier to the Entry and Post-Entry Growthof Firms.” Economic Policy, 22(52): 732–779. https://doi.org/10.1111/j.1468-0327.2007.00190.x.
Akcigit, Ufuk, and William R. Kerr. 2018. “Growth Through Heterogeneous Innovations.” Journal of Political Economy,126(4): 1374–1443. https://doi.org/10.1086/697901.
Allen, Franklin, Ana Babus, and Elena Carletti. 2012. “Asset Commonality, Debt Maturity and Systemic Risk.” Journal of FinancialEconomics, 104(3): 519–534. https://doi.org/10.1016/j.jfineco.2011.07.003.
Allen, Franklin, Elena Carletti, and XianGu. 2019. “The Roles of Banks in Financial Systems.” In The Oxford Handbook of Banking,ed. by Allen N. Berger, Philip Molyneux and John O. S. Wilson. Oxford University Press.
Almeida, Heitor, and Murillo Campello. 2007. “Financial Constraints, Asset Tangibility, and Corporate Investment.” Review ofFinancial Studies, 20(5): 1429–1460. https://doi.org/10.1093/rfs/hhm019.
Almeida, Heitor, Murillo Campello, and Michael S. Weisbach. 2004. “The Cash Flow Sensitivity of Cash.” Journal of Finance,59(4): 1777–1804. https://doi.org/10.1111/j.1540-6261.2004.00679.x.
Almeida, Heitor, Po-Hsuan Hsu, and Dongmei Li. 2013. “Less is More: Financial Constraints and Innovative Efficiency.”http://dx.doi.org/10.2139/ssrn.1831786. Accessed on April 8, 2019.
Altman, Alex. 2014. “Holder: Banks Should be Able to Handle Pot Money.” https://swampland.time.com/2014/01/24/signs-of-a-big-shift-on-u-s-marijuana-regulation/. Accessed on April 8, 2019.
Anhalt, Brian D. 2016. “Crafting a Model State Law for Today’s Beer Industry.” Roger Williams University Law Review, 21: 162.https://heinonline.org/hol-cgi-bin/get_pdf.cgi?handle=hein.journals/rwulr21§ion=9.
Archibugi, Daniele, Andrea Filippetti, and Marion Frenz. 2013. “Economic Crisis and Innovation: Is Destruction Prevailing overAccumulation?” Research Policy, 42(2): 303–314. https://doi.org/10.1016/j.respol.2012.07.002.
Armknecht, Frederik, Ghassan O. Karame, Avikarsha Mandal, Franck Youssef, and Erik Zenner. 2015. “Ripple: Overview andOutlook.” In International Conference on Trust and Trustworthy Computing, ed. by Mauro Conti, Matthias Schunter and IoannisAskoxylakis. Springer International Publishing.
Auer, Raphael, and Rainer Boehme. 2020. “The Technology of Retail Central Bank Digital Currency.” Bank for InternationalSettlements Quarterly Review, March: 85–100.
Ayyagari, Meghana, Asli Demirgüç-Kunt, and Vojislav Maksimovic. 2008. “How Important are Financing Constraints? The Roleof Finance in the Business Environment.” World Bank Economic Review, 22(3): 483–516. https://doi.org/10.1093/wber/lhn018.
Ayyagari, Meghana, Asli Demirgüç-Kunt, and Vojislav Maksimovic. 2011. “Firm Innovation in Emerging Markets: TheRole of Finance, Governance, and Competition.” Journal of Financial and Quantitative Analysis, 46(6): 1545–1580.https://doi.org/10.1017/S0022109011000378.
Ayyagari, Meghana, Asli Demirguc-Kunt, and Vojislav Maksimovic. 2013. “Financing in Developing Countries.” In Handbook ofthe Economics of Finance, Vol. 2, ed. by George M. Constantinides, Milton Harris and René M. Stulz. Elsevier.
Baik, Kyung Hwan. 1994. “Effort Levels in Contests with Two Asymmetric Players.” Southern Economic Journal, 61(2): 367–378.https://doi.org/10.2307/1059984.
Bank of Canada, Bank of England, and Monetary Authority of Singapore. 2018. “Cross-Border Interbank Payments and Set-tlements. Emerging Opportunities for Digital Transformation.” https://www.mas.gov.sg/-/media/MAS/ProjectUbin/Cross-Border-Interbank-Payments-and-Settlements.pdf. Accessed on April 30, 2020.
Baye, Michael R., and Heidrun C. Hoppe. 2003. “The Strategic Equivalence of Rent-Seeking, Innovation, and Patent-Race Games.”Games and Economic Behavior, 44(2): 217–226. https://doi.org/10.1016/S0899-8256(03)00027-7.
Beck, Thorsten, Asli Demirgüç-Kunt, and Vojislav Maksimovic. 2005. “Financial and Legal Constraints to Growth: Does Firm SizeMatter?” Journal of Finance, 60(1): 137–177. https://doi.org/10.1111/j.1540-6261.2005.00727.x.
107
108 References
Beck, Thorsten, Asli Demirgüç-Kunt, and Vojislav Maksimovic. 2008. “Financing Patterns Around the World: Are Small FirmsDifferent?” Journal of Financial Economics, 89(3): 467–487. https://doi.org/10.1016/j.jfineco.2007.10.005.
Beck, Thorsten, Haki Pamuk, Ravindra Ramrattan, and Burak Uras. 2018. “Payment Instruments, Finance and Development.”Journal of Development Economics, 133: 162–186. https://doi.org/10.1016/j.jdeveco.2018.01.005.
Beck, Thorsten, Ross Levine, and Norman Loayza. 2000. “Finance and the Sources of Growth.” Journal of Financial Economics,58(1-2): 261–300. https://doi.org/10.1016/S0304-405X(00)00072-6.
Bekaert, Geert, and Eric Engstrom. 2010. “Inflation and the Stock Market: Understanding the ‘Fed Model’.” Journal of MonetaryEconomics, 57(3): 278–294. https://doi.org/10.1016/j.jmoneco.2010.02.004.
Berger, Allen N., and Gregory F. Udell. 1998. “The Economics of Small Business Finance: The Roles of Private Equity andDebt Markets in the Financial Growth Cycle.” Journal of Banking and Finance, 22(6-8): 613–673. https://doi.org/10.1016/S0378-4266(98)00038-7.
Berger, Allen N., Phil Molyneux, and John O. S. Wilson. 2019. “Banks and the Real Economy: An Assessment of the Research.”Journal of Corporate Finance, 62: 101513. https://doi.org/10.1016/j.jcorpfin.2019.101513.
Berger, Elizabeth, and Nathan Seegert. 2020. “Half Banked: The Real Effects of Financial Exclusion on Firms.” Unpublished.Berg, Tobias. 2018. “Got Rejected? Real Effects of Not Getting a Loan.” Review of Financial Studies, 31(12): 4912–4957.
https://doi.org/10.1093/rfs/hhy038.Bernanke, Ben. 2008. “Remarks at the Economic Club of New York. Stabilizing the Financial Markets and the Economy.”
https://www.federalreserve.gov/newsevents/speech/bernanke20081015a.htm. Accessed on April 8, 2019.Bertoni, Fabio, Massimo G. Colombo, and Luca Grilli. 2013. “Venture Capital Investor Type and the Growth Mode of New
Technology-Based Firms.” Small Business Economics, 40(3): 527–552. https://doi.org/10.1007/s11187-011-9385-9.Bertrand, Marianne, and Sendhil Mullainathan. 2001. “Do People MeanWhat They Say? Implications for Subjective Survey Data.”
American Economic Review, 91(2): 67–72. https://doi.org/10.1257/aer.91.2.67.Bertrand, Marianne, Antoinette Schoar, and David Thesmar. 2007. “Banking Deregulation and Industry Structure: Evidence from
the French Banking Reforms of 1985.” Journal of Finance, 62(2): 597–628. https://doi.org/10.1111/j.1540-6261.2007.01218.x.Bhue, Gursharan. 2018. “Government Certification, Financial Access, and Growth: Evidence from the US Marijuana Industry.”
https://dx.doi.org/10.2139/ssrn.3263712. Accessed on April 8, 2019.Blind, Knut, Katrin Cremers, and Elisabeth Mueller. 2009. “The Influence of Strategic Patenting on Companies’ Patent Portfolios.”
Research Policy, 38(2): 428–436. https://doi.org/10.1016/j.respol.2008.12.003.Boar, Codruta, Henry Holden, and AmberWadsworth. 2020. “Impending Arrival – A Sequel to the Survey on Central Bank Digital
Currency.” Bank for International Settlements Paper 107.Boehmer, Ekkehart, JimMasumeci, and Annette B. Poulsen. 1991. “Event-Study Methodology Under Conditions of Event-Induced
Variance.” Journal of Financial Economics, 30(2): 253–272. https://doi.org/10.1016/0304-405X(91)90032-F.Böhme, Rainer, Nicolas Christin, Benjamin Edelman, and TylerMoore. 2015. “Bitcoin: Economics, Technology, and Governance.”
Journal of Economic Perspectives, 29(2): 213–38. https://www.aeaweb.org/articles?id=10.1257/jep.29.2.213.Bräuning, Falk, and Falko Fecht. 2017. “Relationship Lending in the InterbankMarket and the Price of Liquidity.” Review of Finance,
21(1): 33–75. https://doi.org/10.1093/rof/rfw042.Breuer, Wolfgang. 1993. Finanzintermediation im Kapitalmarktgleichgewicht. Springer-Verlag.Brewers Association. 2017. “Steady Growth for Small and Independent Brewers.” https://www.brewersassociation.org/press-
releases/2016-growth-small-independent-brewers. Accessed on April 8, 2019.Brody, Paul, Arwin Holmes, EliWolfsohn, and John Frechette. 2019. “Total Cost of Ownerhship for Blockchain Solutions.” Ernst &
Young LLP. https://www.ey.com/Publication/vwLUAssets/ey-total-cost-of-ownership-for-blockchain-solutions/$File/ey-total-cost-of-ownership-for-blockchain-solutions.pdf. Accessed on July 1, 2020.
Brown, James R., Gustav Martinsson, and Bruce C. Petersen. 2012. “Do Financing Constraints Matter for R&D?” EuropeanEconomic Review, 56(8): 1512–1529. https://doi.org/10.1016/j.euroecorev.2012.07.007.
Brown, James R., Gustav Martinsson, and Bruce C. Petersen. 2013. “Law, Stock Markets, and Innovation.” Journal of Finance,68(4): 1517–1549. https://doi.org/10.1111/jofi.12040.
Brown, Stephen J., and Jerold B. Warner. 1985. “Using Daily Stock Returns: The Case of Event Studies.” Journal of FinancialEconomics, 14(1): 3–31. https://doi.org/10.1016/0304-405X(85)90042-X.
Bruno, Phil, Olivier Denecker, andMarc Niederkorn. 2019. “Global Payments Report 2019: Amidst Sustained Growth, AcceleratingChallenges Demand Bold Actions.” McKinsey Global Banking Practice, September.
Calomiris, Charles W., and Mark Carlson. 2017. “Interbank Networks in the National Banking Era: Their Purpose and Their Rolein the Panic of 1893.” Journal of Financial Economics, 125(3): 434–453. https://doi.org/10.1016/j.jfineco.2017.06.007.
Casu, Barbara, and RuthWandhöfer. 2018. “The Future of Correspondent Banking Cross Border Payments.” Society for WorldwideInterbank Financial Telecommunication Institute Working Paper No. 2017-001.

References 109
Catalini, Christian, and Joshua S. Gans. 2019. “Some Simple Economics of the Blockchain.” National Bureau of Economic ResearchWorking Paper 22952.
CB Insights. 2017. “The History of CVC: from Exxon and DuPont to Xerox and Microsoft, How Corporates Began Chas-ing ‘the Future’.” https://rmksv.com/2018/01/01/history-of-cvc-from-exxon-and-dupont-to-xerox-and-microsoft-how-corporates-began-chasing-the-future/. Accessed on November 14, 2019.
CB Insights. 2020. “Our First Acquisition: CB Insights Acquires VentureSource Data from Dow Jones.”https://www.cbinsights.com/research/team-blog/dow-jones-venturesource-valuations/. Accessed on July 20, 2020.
Chemmanur, Thomas J., Elena Loutskina, and Xuan Tian. 2014. “Corporate Venture Capital, Value Creation, and Innovation.”Review of Financial Studies, 27(8): 2434–2473. https://doi.org/10.1093/rfs/hhu033.
Che, Yeon-Koo, and Ian Gale. 1997. “Rent Dissipation When Rent Seekers are Budget Constrained.” Public Choice, 92(1): 109–126.https://doi.org/10.1023/A:1017937708549.
Chiang, John. 2017. “Banking Access Strategies for Cannabis-Related Businesses.”http://www.treasurer.ca.gov/cbwg/resources/reports/110717-cannabis-report.pdf. Accessed on April 8, 2019.
Chodorow-Reich, Gabriel. 2014. “The Employment Effects of Credit Market Disruptions: Firm-Level Evidence from the 2008–9Financial Crisis.” Quarterly Journal of Economics, 129(1): 1–59. https://doi.org/10.1093/qje/qjt031.
Cohen, Lauren, Karl Diether, andChristopherMalloy. 2013. “Misvaluing Innovation.” Review of Financial Studies, 26(3): 635–666.https://doi.org/10.1093/rfs/hhs183.
Cohen, Wesley M. 2010. “FiftyYears of Empirical Studies of Innovative Activity and Performance.” In Handbook of the Economics ofInnovation, Vol. 1, ed. by Bronwyn H. Hall and Nathan Rosenberg. Elsevier.
Cole, James M. 2011. “Memorandum from James M. Cole, Deputy Attorney Gen., to United States Attorneys. Guidance Regardingthe Ogden Memo in Jurisdictions Seeking to Authorize Marijuana for Medical Use.” www.justice.gov/sites/default/files/oip/legacy/2014/07/23/dag-guidance-2011-for-medical-marijuana-use.pdf. Accessed on April 8, 2019.
Cole, James M. 2014. “Memorandum for all United States Attorneys. Guidance Regarding Marijuana Related Financial Crimes.”www.dfi.wa.gov/documents/banks/guidance-marijuana-related-business.pdf. Accessed on April 8, 2019.
Colombo, Massimo G., and Kourosh Shafi. 2016. “Swimming with Sharks in Europe: When are They Dangerous andWhat Can NewVentures Do to Defend Themselves?” Strategic Management Journal, 37(11): 2307–2322. https://doi.org/10.1002/smj.2572.
Colombo, Massimo G., and Samuele Murtinu. 2017. “Venture Capital Investments in Europe and Portfolio Firms’ Eco-nomic Performance: Independent Versus Corporate Investors.” Journal of Economics & Management Strategy, 26(1): 35–66.https://doi.org/10.1111/jems.12170.
Comin, Diego, and Ramana Nanda. 2019. “Financial Development and Technology Diffusion.” IMF Economic Review, 67(2): 395–419. https://doi.org/10.1057/s41308-019-00078-0.
Committee on Payments and Market Infrastructures. 2016. “Correspondent Banking.” Bank for International Settlement WorkingPaper, July.
Committee on Payments and Market Infrastructures. 2018. “Cross-Border Retail Payments.” Bank for International SettlementWorking Paper, February.
Committee on Payments and Market Infrastructures. 2019. “Correspondent Banking Data.” Bank for International SettlementMarket Analysis. https://www.bis.org/cpmi/paysysinfo/corr_bank_data/data_1905.xlsx. Accessed on March 13, 2020.
Corrado, Charles J. 1989. “A Nonparametric Test for Abnormal Security-Price Performance in Event Studies.” Journal of FinancialEconomics, 23(2): 385–395. https://doi.org/10.1016/0304-405X(89)90064-0.
Corrado, Charles J., and Terry L. Zivney. 1992. “The Specification and Power of the Sign Test in Event Study Hypothesis TestsUsing Daily Stock Returns.” Journal of Financial and Quantitative Analysis, 27(3): 465–478. https://doi.org/10.2307/2331331.
Craig, Ben, andGoetz von Peter. 2014. “Interbank Tiering andMoney Center Banks.” Journal of Financial Intermediation, 23(3): 322– 347. https://doi.org/10.1016/j.jfi.2014.02.003.
Credit Union National Association. 2016. “Inside Washington.” https://news.cuna.org/articles/109018-inside-washington. Accessedon April 8, 2019.
Custódio, Cláudia, Miguel A. Ferreira, and Pedro Matos. 2019. “Do General Managerial Skills Spur Innovation?” ManagementScience, 65(2): 459–476. https://doi.org/10.1287/mnsc.2017.2828.
Da Rin, Marco, Thomas Hellmann, and Manju Puri. 2013. “A Survey of Venture Capital Research.” In Handbook of the Economicsof Finance, Vol. 2, ed. by George M. Constantinides, Milton Harris and Rene M. Stulz. Elsevier.
Del Prete, Silvia, and Stefano Federico. 2019. “Does Trust Among Banks Matter for Bilateral Trade? Evidence from Shocks in theInterbank Market.” https://www.bancaditalia.it/pubblicazioni/temi-discussione/2019/2019-1217/en_Tema_1217.pdf. Accessed onJuly 1, 2020.
Demirgüç-Kunt, Asli, and Vojislav Maksimovic. 1998. “Law, Finance, and Firm Growth.” Journal of Finance, 53(6): 2107–2137.https://doi.org/10.1111/0022-1082.00084.
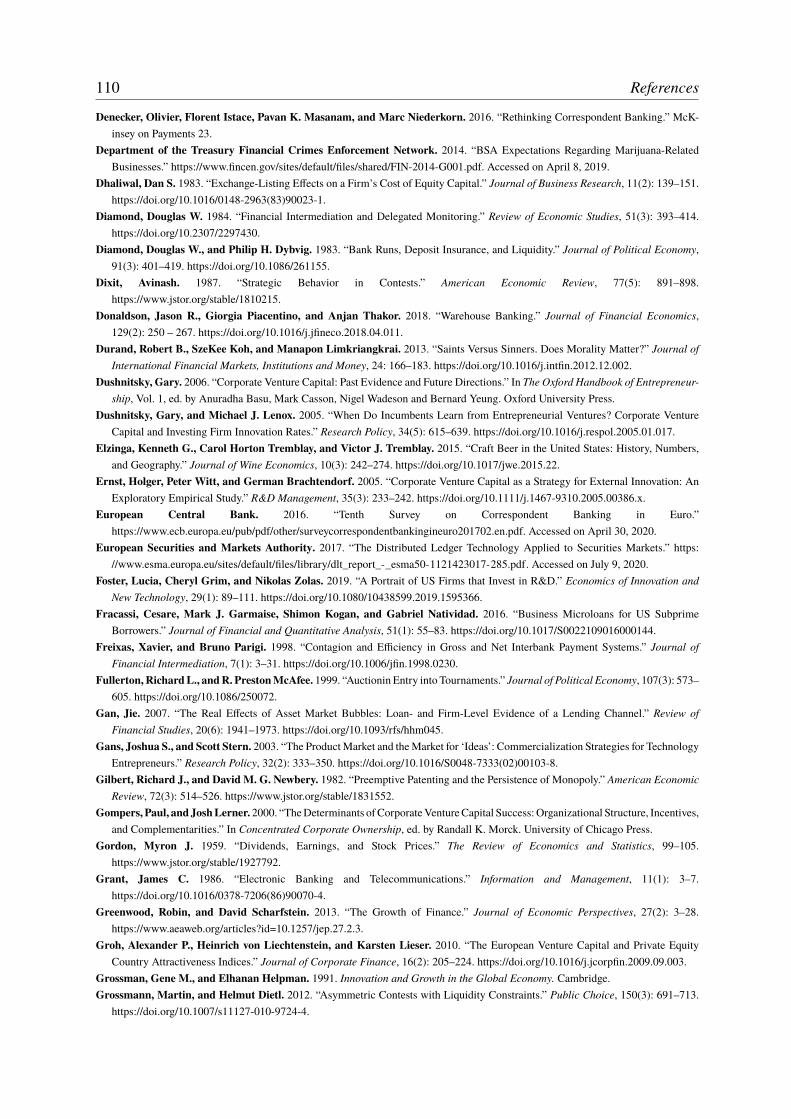
110 References
Denecker, Olivier, Florent Istace, Pavan K. Masanam, and Marc Niederkorn. 2016. “Rethinking Correspondent Banking.” McK-insey on Payments 23.
Department of the Treasury Financial Crimes Enforcement Network. 2014. “BSA Expectations Regarding Marijuana-RelatedBusinesses.” https://www.fincen.gov/sites/default/files/shared/FIN-2014-G001.pdf. Accessed on April 8, 2019.
Dhaliwal, Dan S. 1983. “Exchange-Listing Effects on a Firm’s Cost of Equity Capital.” Journal of Business Research, 11(2): 139–151.https://doi.org/10.1016/0148-2963(83)90023-1.
Diamond, Douglas W. 1984. “Financial Intermediation and Delegated Monitoring.” Review of Economic Studies, 51(3): 393–414.https://doi.org/10.2307/2297430.
Diamond, Douglas W., and Philip H. Dybvig. 1983. “Bank Runs, Deposit Insurance, and Liquidity.” Journal of Political Economy,91(3): 401–419. https://doi.org/10.1086/261155.
Dixit, Avinash. 1987. “Strategic Behavior in Contests.” American Economic Review, 77(5): 891–898.https://www.jstor.org/stable/1810215.
Donaldson, Jason R., Giorgia Piacentino, and Anjan Thakor. 2018. “Warehouse Banking.” Journal of Financial Economics,129(2): 250 – 267. https://doi.org/10.1016/j.jfineco.2018.04.011.
Durand, Robert B., SzeKee Koh, and Manapon Limkriangkrai. 2013. “Saints Versus Sinners. Does Morality Matter?” Journal ofInternational Financial Markets, Institutions and Money, 24: 166–183. https://doi.org/10.1016/j.intfin.2012.12.002.
Dushnitsky, Gary. 2006. “Corporate Venture Capital: Past Evidence and Future Directions.” In The Oxford Handbook of Entrepreneur-ship, Vol. 1, ed. by Anuradha Basu, Mark Casson, Nigel Wadeson and Bernard Yeung. Oxford University Press.
Dushnitsky, Gary, and Michael J. Lenox. 2005. “When Do Incumbents Learn from Entrepreneurial Ventures? Corporate VentureCapital and Investing Firm Innovation Rates.” Research Policy, 34(5): 615–639. https://doi.org/10.1016/j.respol.2005.01.017.
Elzinga, Kenneth G., Carol Horton Tremblay, and Victor J. Tremblay. 2015. “Craft Beer in the United States: History, Numbers,and Geography.” Journal of Wine Economics, 10(3): 242–274. https://doi.org/10.1017/jwe.2015.22.
Ernst, Holger, Peter Witt, and German Brachtendorf. 2005. “Corporate Venture Capital as a Strategy for External Innovation: AnExploratory Empirical Study.” R&D Management, 35(3): 233–242. https://doi.org/10.1111/j.1467-9310.2005.00386.x.
European Central Bank. 2016. “Tenth Survey on Correspondent Banking in Euro.”https://www.ecb.europa.eu/pub/pdf/other/surveycorrespondentbankingineuro201702.en.pdf. Accessed on April 30, 2020.
European Securities and Markets Authority. 2017. “The Distributed Ledger Technology Applied to Securities Markets.” https://www.esma.europa.eu/sites/default/files/library/dlt_report_-_esma50-1121423017-285.pdf. Accessed on July 9, 2020.
Foster, Lucia, Cheryl Grim, and Nikolas Zolas. 2019. “A Portrait of US Firms that Invest in R&D.” Economics of Innovation andNew Technology, 29(1): 89–111. https://doi.org/10.1080/10438599.2019.1595366.
Fracassi, Cesare, Mark J. Garmaise, Shimon Kogan, and Gabriel Natividad. 2016. “Business Microloans for US SubprimeBorrowers.” Journal of Financial and Quantitative Analysis, 51(1): 55–83. https://doi.org/10.1017/S0022109016000144.
Freixas, Xavier, and Bruno Parigi. 1998. “Contagion and Efficiency in Gross and Net Interbank Payment Systems.” Journal ofFinancial Intermediation, 7(1): 3–31. https://doi.org/10.1006/jfin.1998.0230.
Fullerton, RichardL., andR. PrestonMcAfee. 1999. “Auctionin Entry into Tournaments.” Journal of Political Economy, 107(3): 573–605. https://doi.org/10.1086/250072.
Gan, Jie. 2007. “The Real Effects of Asset Market Bubbles: Loan- and Firm-Level Evidence of a Lending Channel.” Review ofFinancial Studies, 20(6): 1941–1973. https://doi.org/10.1093/rfs/hhm045.
Gans, Joshua S., and Scott Stern. 2003. “The ProductMarket and theMarket for ‘Ideas’: Commercialization Strategies for TechnologyEntrepreneurs.” Research Policy, 32(2): 333–350. https://doi.org/10.1016/S0048-7333(02)00103-8.
Gilbert, Richard J., and David M. G. Newbery. 1982. “Preemptive Patenting and the Persistence of Monopoly.” American EconomicReview, 72(3): 514–526. https://www.jstor.org/stable/1831552.
Gompers, Paul, and JoshLerner. 2000. “TheDeterminants ofCorporateVentureCapital Success:Organizational Structure, Incentives,and Complementarities.” In Concentrated Corporate Ownership, ed. by Randall K. Morck. University of Chicago Press.
Gordon, Myron J. 1959. “Dividends, Earnings, and Stock Prices.” The Review of Economics and Statistics, 99–105.https://www.jstor.org/stable/1927792.
Grant, James C. 1986. “Electronic Banking and Telecommunications.” Information and Management, 11(1): 3–7.https://doi.org/10.1016/0378-7206(86)90070-4.
Greenwood, Robin, and David Scharfstein. 2013. “The Growth of Finance.” Journal of Economic Perspectives, 27(2): 3–28.https://www.aeaweb.org/articles?id=10.1257/jep.27.2.3.
Groh, Alexander P., Heinrich von Liechtenstein, and Karsten Lieser. 2010. “The European Venture Capital and Private EquityCountry Attractiveness Indices.” Journal of Corporate Finance, 16(2): 205–224. https://doi.org/10.1016/j.jcorpfin.2009.09.003.
Grossman, Gene M., and Elhanan Helpman. 1991. Innovation and Growth in the Global Economy. Cambridge.Grossmann, Martin, and Helmut Dietl. 2012. “Asymmetric Contests with Liquidity Constraints.” Public Choice, 150(3): 691–713.
https://doi.org/10.1007/s11127-010-9724-4.

References 111
Gupta, Anil K., and Vijay Govindarajan. 2000. “Knowledge Flows Within Multinational Corporations.” Strategic ManagementJournal, 21(4): 473–496. https://doi.org/10.1002/(SICI)1097-0266(200004)21:4<473::AID-SMJ84>3.0.CO;2-I.
Haag, Hendrik, and Jan L. Steffen. 2020. “Banking Regulation in Germany: Overview.” Hengeler Mueller.https://uk.practicallaw.thomsonreuters.com/w-007-4084?transitionType=Default&contextData=(sc.Default)&firstPage=true.Accessed on July 1, 2020.
Hall, Bronwyn H. 2008. “The Financing of Innovation.” In Handbook of Technology and Innovation Management, ed. by S. Shane.Wiley.
Hall, Bronwyn H., and Josh Lerner. 2010. “The Financing of R&D and Innovation.” In Handbook of the Economics of Innovation,Vol. 1, ed. by Bronwyn H. Hall and Nathan Rosenberg. Elsevier.
Harris, Christopher, and John Vickers. 1985. “Perfect Equilibrium in a Model of a Race.” Review of Economic Studies, 52(2): 193–209. https://doi.org/10.2307/2297616.
Haveman, Heather A. 1993. “Organizational Size and Change: Diversification in the Savings and Loan Industry After Deregulation.”Administrative Science Quarterly, 38(1): 20–50. https://doi.org/10.2307/2393253.
He, Dong, Ross B. Leckow, VikramHaksar, TommasoMancini-Griffoli, Nigel Jenkinson, Mikari Kashima, Tanai Khiaonarong,Céline Rochon, and Hervé Tourpe. 2017. “Fintech and Financial Services: Initial Considerations.” International Monetary FundStaff Discussion Note 17/05.
Hill, Julie A. 2015. “Banks, Marijuana, and Federalism.” Case Western Reserve Law Review, 65(3): 597–647.https://heinonline.org/HOL/P?h=hein.journals/cwrlrv65&i=637.
Holmström, Bengt. 1989. “Agency Costs and Innovation.” Journal of Economic Behavior and Organization, 12(3): 305–327.https://doi.org/10.1016/0167-2681(89)90025-5.
Hong, Harrison, and Marcin Kacperczyk. 2009. “The Price of Sin: The Effects of Social Norms on Markets.” Journal of FinancialEconomics, 93(1): 15–36. https://doi.org/10.1016/j.jfineco.2008.09.001.
Hornuf, Lars, Milan Klus, Todor Lohwasser, and Armin Schwienbacher. 2018. “How Do Banks Interact with Fintechs? Forms ofAlliances and Their Impact on Bank Value.” CESifo Working Paper Series No. 7170.
Hottenrott, Hanna, Bronwyn H. Hall, and Dirk Czarnitzki. 2016. “Patents as Quality Signals? The Implications for Financing Con-straints on R&D.” Economics of Innovation and New Technology, 25(3): 197–217. https://doi.org/10.1080/10438599.2015.1076200.
Howell, Sabrina T. 2017. “Financing Innovation: Evidence from R&D Grants.” American Economic Review, 107(4): 1136–64.https://doi.org/10.1257/aer.20150808.
Huber, Kilian. 2018. “Disentangling the Effects of a Banking Crisis: Evidence fromGerman Firms and Counties.” American EconomicReview, 108(3): 868–98. https://doi.org/10.1257/aer.20161534.
Iansiti, Marco, and Karim R. Lakhani. 2017. “The Truth About Blockchain.” Harvard Business Review, 95(1): 118–127.https://hbr.org/2017/01/the-truth-about-blockchain.
Jack, William, and Tavneet Suri. 2014. “Risk Sharing and Transactions Costs: Evidence from Kenya’s Mobile Money Revolution.”American Economic Review, 104(1): 183–223. https://doi.org/10.1257/aer.104.1.183.
Jayaratne, Jith, and Philip E. Strahan. 1996. “The Finance-Growth Nexus: Evidence from Bank Branch Deregulation.” QuarterlyJournal of Economics, 111(3): 639–670. https://doi.org/10.2307/2946668.
Jiménez, Gabriel, Steven Ongena, José-Luis Peydró, and Jesús Saurina. 2012. “Credit Supply and Monetary Policy:Identifying the Bank Balance-Sheet Channel with Loan Applications.” American Economic Review, 102(5): 2301–26.https://doi.org/10.1257/aer.102.5.2301.
Kahn, Charles M., and William Roberds. 2009. “Why Pay? An Introduction to Payments Economics.” Journal of FinancialIntermediation, 18(1): 1 – 23. https://doi.org/10.1016/j.jfi.2008.09.001.
Kahn, Charles M., Francisco Rivadeneyra, and Tsz-Nga Wong. 2019. “Should the Central Bank Issue E-Money?” Federal ReserveBank of St. Louis Working Paper 2019-003A.
Kamien, Morton I., and Nancy L. Schwartz. 1982. Market Structure and Innovation. Cambridge University Press.Kaplan, StevenN., Per Strömberg, andBerkA. Sensoy. 2002. “HowWell DoVenture Capital Databases Reflect Actual Investments?”
https://dx.doi.org/10.2139/ssrn.939073. Accessed on November 14, 2019.Kerr,WilliamR., andRamanaNanda. 2009. “DemocratizingEntry: BankingDeregulations, FinancingConstraints, andEntrepreneur-
ship.” Journal of Financial Economics, 94(1): 124–149. https://doi.org/10.1016/j.jfineco.2008.12.003.King, Robert G, and Ross Levine. 1993. “Finance, Entrepreneurship and Growth.” Journal of Monetary Economics, 32(3): 513–542.
https://doi.org/10.1016/0304-3932(93)90028-E.Kirchhoff, Bruce A., Scott L. Newbert, Iftekhar Hasan, and Catherine Armington. 2007. “The Influence of University R&D
Expenditures on New Business Formations and Employment Growth.” Entrepreneurship Theory and Practice, 31(4): 543–559.https://doi.org/10.1111/j.1540-6520.2007.00187.x.
Klapper, Leora, Luc Laeven, and RaghuramRajan. 2006. “Entry Regulation as a Barrier to Entrepreneurship.” Journal of FinancialEconomics, 82(3): 591–629. https://doi.org/10.1016/j.jfineco.2005.09.006.
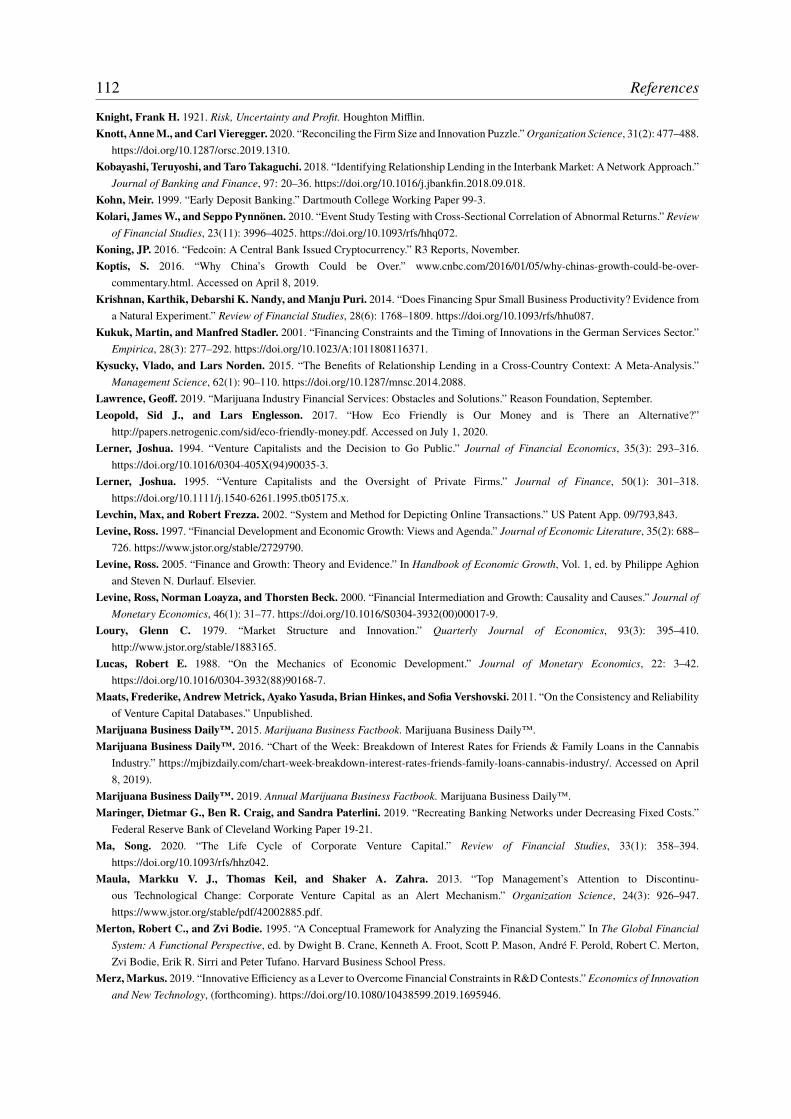
112 References
Knight, Frank H. 1921. Risk, Uncertainty and Profit. Houghton Mifflin.Knott, AnneM., andCarl Vieregger. 2020. “Reconciling the Firm Size and Innovation Puzzle.”Organization Science, 31(2): 477–488.
https://doi.org/10.1287/orsc.2019.1310.Kobayashi, Teruyoshi, and Taro Takaguchi. 2018. “Identifying Relationship Lending in the InterbankMarket: A Network Approach.”
Journal of Banking and Finance, 97: 20–36. https://doi.org/10.1016/j.jbankfin.2018.09.018.Kohn, Meir. 1999. “Early Deposit Banking.” Dartmouth College Working Paper 99-3.Kolari, JamesW., and Seppo Pynnönen. 2010. “Event Study Testing with Cross-Sectional Correlation of Abnormal Returns.” Review
of Financial Studies, 23(11): 3996–4025. https://doi.org/10.1093/rfs/hhq072.Koning, JP. 2016. “Fedcoin: A Central Bank Issued Cryptocurrency.” R3 Reports, November.Koptis, S. 2016. “Why China’s Growth Could be Over.” www.cnbc.com/2016/01/05/why-chinas-growth-could-be-over-
commentary.html. Accessed on April 8, 2019.Krishnan, Karthik, Debarshi K. Nandy, andManju Puri. 2014. “Does Financing Spur Small Business Productivity? Evidence from
a Natural Experiment.” Review of Financial Studies, 28(6): 1768–1809. https://doi.org/10.1093/rfs/hhu087.Kukuk, Martin, and Manfred Stadler. 2001. “Financing Constraints and the Timing of Innovations in the German Services Sector.”
Empirica, 28(3): 277–292. https://doi.org/10.1023/A:1011808116371.Kysucky, Vlado, and Lars Norden. 2015. “The Benefits of Relationship Lending in a Cross-Country Context: A Meta-Analysis.”
Management Science, 62(1): 90–110. https://doi.org/10.1287/mnsc.2014.2088.Lawrence, Geoff. 2019. “Marijuana Industry Financial Services: Obstacles and Solutions.” Reason Foundation, September.Leopold, Sid J., and Lars Englesson. 2017. “How Eco Friendly is Our Money and is There an Alternative?”
http://papers.netrogenic.com/sid/eco-friendly-money.pdf. Accessed on July 1, 2020.Lerner, Joshua. 1994. “Venture Capitalists and the Decision to Go Public.” Journal of Financial Economics, 35(3): 293–316.
https://doi.org/10.1016/0304-405X(94)90035-3.Lerner, Joshua. 1995. “Venture Capitalists and the Oversight of Private Firms.” Journal of Finance, 50(1): 301–318.
https://doi.org/10.1111/j.1540-6261.1995.tb05175.x.Levchin, Max, and Robert Frezza. 2002. “System and Method for Depicting Online Transactions.” US Patent App. 09/793,843.Levine, Ross. 1997. “Financial Development and Economic Growth: Views and Agenda.” Journal of Economic Literature, 35(2): 688–
726. https://www.jstor.org/stable/2729790.Levine, Ross. 2005. “Finance and Growth: Theory and Evidence.” In Handbook of Economic Growth, Vol. 1, ed. by Philippe Aghion
and Steven N. Durlauf. Elsevier.Levine, Ross, Norman Loayza, and Thorsten Beck. 2000. “Financial Intermediation and Growth: Causality and Causes.” Journal of
Monetary Economics, 46(1): 31–77. https://doi.org/10.1016/S0304-3932(00)00017-9.Loury, Glenn C. 1979. “Market Structure and Innovation.” Quarterly Journal of Economics, 93(3): 395–410.
http://www.jstor.org/stable/1883165.Lucas, Robert E. 1988. “On the Mechanics of Economic Development.” Journal of Monetary Economics, 22: 3–42.
https://doi.org/10.1016/0304-3932(88)90168-7.Maats, Frederike, AndrewMetrick, Ayako Yasuda, Brian Hinkes, and Sofia Vershovski. 2011. “On the Consistency and Reliability
of Venture Capital Databases.” Unpublished.Marijuana Business Daily™. 2015. Marijuana Business Factbook. Marijuana Business Daily™.Marijuana Business Daily™. 2016. “Chart of the Week: Breakdown of Interest Rates for Friends & Family Loans in the Cannabis
Industry.” https://mjbizdaily.com/chart-week-breakdown-interest-rates-friends-family-loans-cannabis-industry/. Accessed on April8, 2019).
Marijuana Business Daily™. 2019. Annual Marijuana Business Factbook. Marijuana Business Daily™.Maringer, Dietmar G., Ben R. Craig, and Sandra Paterlini. 2019. “Recreating Banking Networks under Decreasing Fixed Costs.”
Federal Reserve Bank of Cleveland Working Paper 19-21.Ma, Song. 2020. “The Life Cycle of Corporate Venture Capital.” Review of Financial Studies, 33(1): 358–394.
https://doi.org/10.1093/rfs/hhz042.Maula, Markku V. J., Thomas Keil, and Shaker A. Zahra. 2013. “Top Management’s Attention to Discontinu-
ous Technological Change: Corporate Venture Capital as an Alert Mechanism.” Organization Science, 24(3): 926–947.https://www.jstor.org/stable/pdf/42002885.pdf.
Merton, Robert C., and Zvi Bodie. 1995. “A Conceptual Framework for Analyzing the Financial System.” In The Global FinancialSystem: A Functional Perspective, ed. by Dwight B. Crane, Kenneth A. Froot, Scott P. Mason, André F. Perold, Robert C. Merton,Zvi Bodie, Erik R. Sirri and Peter Tufano. Harvard Business School Press.
Merz,Markus. 2019. “Innovative Efficiency as a Lever to Overcome Financial Constraints in R&DContests.” Economics of Innovationand New Technology, (forthcoming). https://doi.org/10.1080/10438599.2019.1695946.

References 113
Merz, Markus. 2020. “Contemporary Financial Intermediation – How DLT Changes the Cross-border Payment Landscape.” Unpub-lished.
Merz, Markus, and Jan Riepe. 2020. “SMEs with Legally Restricted Banking Access – Evidence from the U.S. Marijuana Industry.”Journal of Business Economics, (forthcoming). https://doi.org/10.1007/s11573-020-01017-6.
Mills, David C., Kathy Wang, Brendan Malone, Anjana Ravi, Jeffrey C. Marquardt, Clinton Chen, Anton Badev, TimothyBrezinski, Linda Fahy, Kimberley Liao, Vanessa Kargenian,Max Ellithorpe,Wendy Ng, andMaria Baird. 2016. “DistributedLedger Technology in Payments, Clearing, and Settlement.” Finance andEconomicsDiscussion Series 2016-095.Washington: Boardof Governors of the Federal Reserve System.
Mills, Karen, and Brayden McCarthy. 2016. “The State of Small Business Lending: Credit Access During the Recovery and HowTechnology May Change the Game.” Harvard Business School Working Paper 17-042.
Moreno-Sanchez, Pedro, Muhammad Bilal Zafar, and Aniket Kate. 2016. “Listening to Whispers of Ripple: Linking Walletsand Deanonymizing Transactions in the Ripple Network.” Proceedings on Privacy Enhancing Technologies, 2016(4): 436–453.https://doi.org/10.1515/popets-2016-0049.
Moreno-Sanchez, Pedro, Navin Modi, Raghuvir Songhela, Aniket Kate, and Sonia Fahmy. 2018. “Mind Your Credit: Assessingthe Health of the Ripple Credit Network.” 329–338. https://doi.org/10.1145/3178876.3186099.
Narayanan, Arvind, Joseph Bonneau, Edward Felten, Andrew Miller, and Steven Goldfeder. 2016. Bitcoin and CryptocurrencyTechnologies: A Comprehensive Introduction. Princeton University Press.
Natarajan, Harish, Solvej Krause, and Helen Gradstein. 2017. “Distributed Ledger Technology and Blockchain.” World BankFinTech Note, No. 1.
NBC NEWS. 2016. “Stocks Battered for Second Time in 2016 as China, Energy Weigh.” www.nbcnews.com/business/markets/stocks-battered-second-time-2016-china-energy-weigh-n491606. Accessed on April 8, 2019.
Newman, Harry, Olivier Denecker, Nunzio Digiacomo, Luc Meurant, Reinhard Höll, Wim Raymaekers, and Marc Niederkorn.2018. “A Vision for the Future of Cross-Border Payments.” SWIFT and McKinsey, Global Banking Practice, October.
Nti, Kofi O. 1999. “Rent-Seeking with Asymmetric Valuations.” Public Choice, 98(3): 415–430.https://doi.org/10.1023/A:1018391504741.
Pagano, Marco. 1993. “Financial Markets and Growth: An Overview.” European Economic Review, 37(2-3): 613–622.https://doi.org/10.1016/0014-2921(93)90051-B.
Pennebaker, James W., Ryan L. Boyd, Kayla Jordan, and Kate Blackburn. 2015. “The Development and Psychometric Propertiesof LIWC2015.” University of Texas at Austin.
Perdana, Arif, Alastair Robb, Vivek Balachandran, and Fiona Rohde. 2020. “Distributed Ledger Technology: Its EvolutionaryPath and the Road Ahead.” Information and Management, 103316. https://doi.org/10.1016/j.im.2020.103316.
Phillips, Gordon M., and Alexei Zhdanov. 2013. “R&D and the Incentives from Merger and Acquisition Activity.” The Review ofFinancial Studies, 26(1): 34–78. https://doi.org/10.1093/rfs/hhs109.
Pick, C. 2020. “XRP Core Report.” https://cryptoeq.io/coreReports/xrp-abridged. Accessed on March 20, 2020.Plyler, Meghan G., Sherri Haas, and Geetha Nagarajan. 2010. “Community-Level Economic Effects of M-Pesa in Kenya: Initial
Findings.” Iris Center, University of Maryland.Popov, Alexander. 2018. “Evidence on Finance and Economic Growth.” In Handbook of Finance and Development, ed. by Thorsten
Beck and Ross Levine. Edward Elgar Publishing.Quinn, Stephen. 1997. “Goldsmith-Banking: Mutual Acceptance and Interbanker Clearing in Restoration London.” Explorations in
Economic History, 34(4): 411 – 432. https://doi.org/10.1006/exeh.1997.0682.Quinn, Stephen, and William Roberds. 2008. “The Evolution of the Check as a Means of Payment: A Historical Survey.” Federal
Reserve Bank of Atlanta Vol. 93.Rapoport, Phillip, Patrick Griffin, Roman Leal, and Wellington Sculley. 2014. “The Ripple Protocol: A Deep Dive for Finance
Professionals.” http://cryptochainuni.com/wp-content/uploads/ripple-deep-dive-for-financial-professionals.pdf. Accessed on April30, 2020.
Raskin, Max, and David Yermack. 2018. “Digital Currencies, Decentralized Ledgers and the Future of Central Banking.” In ResearchHandbook on Central Banking, ed. by Peter Conti-Brown and Rosa M. Lastra. Edward Elgar Publishing.
Rebelo, Sergio. 1991. “Long-Run Policy Analysis and Long-Run Growth.” The Journal of Political Economy, 99(3): 500–521.https://doi.org/10.1086/261764.
Reinganum, Jennifer F. 1983. “Uncertain Innovation and the Persistence of Monopoly.” American Economic Review, 73(4): 741–748.https://www.jstor.org/stable/1816571.
Rice, Tara, Goetz von Peter, and Codruta Boar. 2020. “On the Global Retreat of Correspondent Banks.” Bank for InternationalSettlements Quarterly Review, March: 37–52.
Ripple. 2017. “Ripple Solution Overview.” https://ripple.com/files/ripple_solutions_overview.pdf. Accessed on April 30, 2020.

114 References
Robb, Alicia M., and David T. Robinson. 2014. “The Capital Structure Decisions of New Firms.” Review of Financial Studies,27(1): 153–179. https://doi.org/10.1093/rfs/hhs072.
Röhm, Patrick. 2018. “Exploring the Landscape of Corporate Venture Capital: A Systematic Review of the Entrepreneurial andFinance Literature.” Management Review Quarterly, 68(3): 279–319. https://doi.org/10.1007/s11301-018-0140-z.
Röhm, Patrick, Markus Merz, and Andreas Kuckertz. 2020. “Identifying Corporate Venture Capital Investors - A Data-CleaningProcedure.” Finance Research Letters, 32: 101092. https://doi.org/10.1016/j.frl.2019.01.004.
Rosner, Marcel T, and Andrew Kang. 2016. “Understanding and Regulating Twenty-First Century Payment Systems: The RippleCase Study.” Michigan Law Review, 114(4): 649. https://heinonline.org/HOL/P?h=hein.journals/mlr114&i=687.
Rysman, Marc, and Scott Schuh. 2017. “New Innovations in Payments.” Innovation Policy and the Economy, 17(1): 27–48.https://doi.org/10.1086/688843.
Schroth, Enrique, and Dezsö Szalay. 2009. “Cash Breeds Success: The Role of Financing Constraints in Patent Races.” Review ofFinance, 14(1): 73–118. https://doi.org/10.1093/rof/rfp020.
Schwienbacher, Armin. 2016. “The Internet, Crowdfunding and the Banking Industry.” In The Palgrave Handbook of EuropeanBanking, ed. by Thorsten Beck and Barbara Casu. Springer.
Seru, Amit. 2014. “Firm Boundaries Matter: Evidence from Conglomerates and R&D Activity.” Journal of Financial Economics,111(2): 381–405. https://doi.org/10.1016/j.jfineco.2013.11.001.
Shackelford, Brandon. 2013. “One in Five US Businesses with R&D Applied for a US Patent in 2008.” InfoBrief NSF-13-307,National Center for Science and Engineering Statistics. Arlington, VA: National Science Foundation.
Singh, Nirvikar, and Donald Wittman. 2001. “Contests Where There is Variation in the Marginal Productivity of Effort.” EconomicTheory, 18(3): 711–744. https://doi.org/10.1007/PL00004208.
Society for Worldwide Interbank Financial Telecommunication. 2016. “SWIFT: The Global Financial Messaging Provider.”https://www.swift.com/node/23621. Accessed on April 30, 2020.
Song, Fenghua, and Anjan V. Thakor. 2010. “Financial System Architecture and the Co-Evolution of Banks and Capital Markets.”The Economic Journal, 120(547): 1021–1055. https://doi.org/10.1111/j.1468-0297.2009.02345.x.
Souitaris, Vangelis, Stefania Zerbinati, and Grace Liu. 2012. “Which Iron Cage? Endo-and Exoisomorphism in Corporate VentureCapital Programs.” Academy of Management Journal, 55(2): 477–505. https://doi.org/10.5465/amj.2009.0709.
S&P Global. 2018. “S&P Client Solutions.” https://marketintelligence.spglobal.com/client-solutions/. Accessed on March 15, 2018.Stavins, Joanna. 2018. “Consumer Preferences for Payment Methods: Role of Discounts and Surcharges.” Journal of Banking and
Finance, 94: 35–53. https://doi.org/10.1016/j.jbankfin.2018.06.013.Stiglitz, Joseph E., and AndrewWeiss. 1981. “Credit Rationing in Markets with Imperfect Information.” American Economic Review,
71(3): 393–410. https://www.jstor.org/stable/1802787.Stulz, René M. 2019. “Fintech, Bigtech, and the Future of Banks.” Journal of Applied Corporate Finance, 31(4): 86–97.
https://doi.org/10.1111/jacf.12378.Sun, Flora. 2018. “UTXO vs Account/Balance Model.” https://medium.com/@sunflora98/utxo-vs-account-balance-model-
5e6470f4e0cf. Accessed on April 30, 2020.Swan, Melanie. 2015. Blockchain: Blueprint for a new economy. O’Reilly Media, Inc.Taylor, Curtis R. 1995. “Digging for Golden Carrots: An Analysis of Research Tournaments.” American Economic Review, 85(4): 872–
890. https://www.jstor.org/stable/2118237.Teece, David J. 1986. “Profiting from Technological Innovation: Implications for Integration, Collaboration, Licensing and Public
Policy.” Research Policy, 15(6): 285–305. https://doi.org/10.1016/0048-7333(86)90027-2.Thakor, Anjan V. 2020. “Fintech and Banking: What Do We Know?” Journal of Financial Intermediation, 41: 100833.
https://doi.org/10.1016/j.jfi.2019.100833.Thakor, Richard T., and Robert C. Merton. 2018. “Trust in Lending.” National Bureau of Economic ResearchWorking Paper 24778.Thompson, Neil C., and Jeffrey M. Kuhn. 2020. “Does Winning a Patent Race Lead to More Follow-On Innovation?” Journal of
Legal Analysis, 12: 183–220. https://doi.org/10.1093/jla/laaa001.Thomson Reuters. 2008. “Private Equity FAQs.” http://banker.thomsonib.com/ta/help/webhelp/Frequently_Asked_Questions_-
_PE.htm. Accessed on March 15, 2018.Thomson Reuters. 2010. “Thomson Glosarry.” https://vx.thomsonib.com/VxComponent/vxhelp/VEfaq.htm. Accessed on March 15,
2018.Thomson Reuters. 2018. “Thomson Reuters Eikon Private Equity.” https://eikon.thomsonreuters.com/index.html. Accessed on March
15, 2018.Travis, M. 2017. “Ripple. The Most (Demonstrably) Scalable Blockchain.” http://highscalability.com/blog/2017/10/2/ripple-the-most-
demonstrably-scalable-blockchain.html. Accessed on March 31, 2020.Truby, Jon. 2018. “Decarbonizing Bitcoin: Law and Policy Choices for Reducing the Energy Consumption of Blockchain Technologies
and Digital Currencies.” Energy Research and Social Science, 44: 399–410. https://doi.org/10.1016/j.erss.2018.06.009.

References 115
Vaughan, Pauline. 2007. “Early Lessons from the Deployment of M-Pesa, Vodaphones’s Own Mobile Transactions Service.” TheTransformational Potential of M-transactions, Vodaphone Policy Paper Series 6.
Ventura, Arnaud, Michael Koenitzer, Peer Stein, Peter Tufano, and Daniel Drummer. 2015. “The Future of FinTech: A paradigmShift in Small Business Finance.” World Economic Forum, Global Agenda Council on the Future of Financing and Capital Report.
VentureSource. 2018a. “VentureSourceGlossary.” http://privatemarkets.dowjones.com/Deals/Help/VSPremium/glossary.html?p=12.1.Accessed on December 19, 2018).
VentureSource. 2018b. “VentureSource Product Features.” https://www.dowjones.com/products/pevc/. Accessed on March 15, 2018.Weisskopf, Jean-Philippe. 2019. “Breaking Bad: An Investment in Cannabis.” Finance Research Letters, (forthcoming).
https://doi.org/10.1016/j.frl.2019.05.019.Yamazaki, Takeshi. 2008. “On the Existence and Uniqueness of Pure-Strategy Nash Equilibrium in Asymmetric Rent-Seeking
Contests.” Journal of Public Economic Theory, 10(2): 317–327. https://doi.org/10.1111/j.1467-9779.2008.00364.x.Zenger, ToddR. 1994. “ExplainingOrganizational Diseconomies of Scale in R&D:Agency Problems and theAllocation of Engineering
Talent, Ideas, and Effort by Firm Size.” Management Science, 40(6): 708–729. https://doi.org/10.1287/mnsc.40.6.708.Zetzsche, Dirk A., Ross P. Buckley, and Douglas W. Arner. 2018. “The Distributed Liability of Distributed Ledgers: Legal Risks of
Blockchain.” University of Illinois Law Review, 1361–1406. https://heinonline.org/HOL/P?h=hein.journals/unilllr2018&i=1377.
Related Documents