GIS Keeps Traffic Moving during Large-Scale Bridge Repair Project in State of Oregon By Matthew DeMeritt, Esri Writer With 12 percent of US bridges declared as structurally deficient by the Federal Highway Administration in 2006, bridge repair remains a top priority of most states. Three years before that, an extensive investi- gation of Oregon’s bridges conducted by the Oregon Department of Transportation (ODOT) found that 365 Oregonian bridges had structural problems that necessitated a large-scale bridge repair plan. Implementing that plan required the department to improve its GIS infrastructure and integrate a new traffic modeling application to ease congestion at multiple construction zones along the state’s highway system. Oregon Transportation Investment Act From 2001 to 2003, Oregon passed a series of funding packages called the Oregon Transportation Investment Act (OTIA I, II, and III) to improve its highway infrastructure. After an investigation that identified 365 bridges in critical need of repair in 2003, ODOT set aside a large portion of OTIA III funding to fix those bridges before Oregon’s freight network felt the effect of enforced closures. For the OTIA III State Bridge Delivery Program, ODOT turned to engineering consultants Oregon Bridge Delivery Partners (OBDP), a joint venture between HDR Engineering and Fluor Corporation, to oversee the task of managing the program. One of the primary goals of the program was to reduce the impact on The Oregon Department of Transportation’s OTIA III State Bridge Delivery Program is a 10-year, $1.3 billion program to repair or replace hundreds of aging bridges on Oregon’s highway system. commuter and business traffic during large- scale construction on its road system. Many of the bridges designed during the early development of Oregon’s highway system used a reinforced concrete deck girder (RCDG) design specified in the regulations of that time. As specifications became more stringent in the 1960s, Oregon transitioned to prestressed and post-tensioned concrete bridges that improved structural integrity at a reduced cost. Despite this, many RCDG bridges remained in service past their expira- tion dates and predictably began to show signs of deterioration on deeper investigation. “In 2001, ODOT inspectors noticed that cracks identified in previous inspections had grown to the point of threatening structural stabil- ity,” said Jim Cox, assistant manager of major projects at ODOT. “We immediately placed load restrictions on these bridges and started discussion on how to plan repairs with the least impact on commercial and commuter traffic.” GIS and Geodesign Established in 2004, ODOT’s GIS comprised the department’s information sharing for Transportation Summer 2012 Esri News

Esri News for Transportation - Summer 2012
Jan 17, 2015
Esri News for Transportation keeps you informed with software news, events, and user stories showing how GIS brings the geographic advantage to transportation organizations worldwide.
Stories in this issue showcase how GIS helps DOTs manage construction, capital budgeting projects, and maintenance.
Stories in this issue showcase how GIS helps DOTs manage construction, capital budgeting projects, and maintenance.
Welcome message from author
This document is posted to help you gain knowledge. Please leave a comment to let me know what you think about it! Share it to your friends and learn new things together.
Transcript
GIS Keeps Traffic Moving during Large-Scale Bridge Repair Project in State of OregonBy Matthew DeMeritt, Esri Writer
With 12 percent of US bridges declared as structurally deficient by the
Federal Highway Administration in 2006, bridge repair remains a top
priority of most states. Three years before that, an extensive investi-
gation of Oregon’s bridges conducted by the Oregon Department
of Transportation (ODOT) found that 365 Oregonian bridges had
structural problems that necessitated a large-scale bridge repair plan.
Implementing that plan required the department to improve its GIS
infrastructure and integrate a new traffic modeling application to ease
congestion at multiple construction zones along the state’s highway
system.
Oregon Transportation Investment ActFrom 2001 to 2003, Oregon passed a series of funding packages called
the Oregon Transportation Investment Act (OTIA I, II, and III) to improve
its highway infrastructure. After an investigation that identified 365
bridges in critical need of repair in 2003, ODOT set aside a large portion
of OTIA III funding to fix those bridges before Oregon’s freight network
felt the effect of enforced closures. For the OTIA III State Bridge Delivery
Program, ODOT turned to engineering consultants Oregon Bridge
Delivery Partners (OBDP), a joint venture between HDR Engineering
and Fluor Corporation, to oversee the task of managing the program.
One of the primary goals of the program was to reduce the impact on
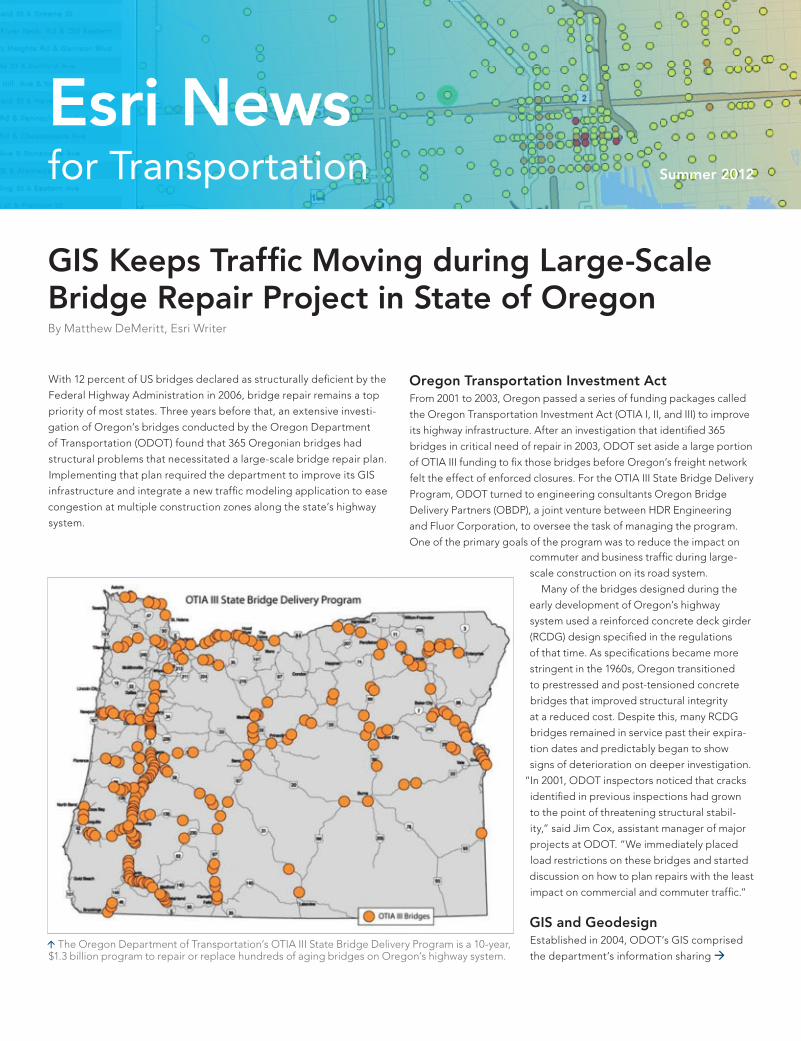
The Oregon Department of Transportation’s OTIA III State Bridge Delivery Program is a 10-year, $1.3 billion program to repair or replace hundreds of aging bridges on Oregon’s highway system.
commuter and business traffic during large-
scale construction on its road system.
Many of the bridges designed during the
early development of Oregon’s highway
system used a reinforced concrete deck girder
(RCDG) design specified in the regulations
of that time. As specifications became more
stringent in the 1960s, Oregon transitioned
to prestressed and post-tensioned concrete
bridges that improved structural integrity
at a reduced cost. Despite this, many RCDG
bridges remained in service past their expira-
tion dates and predictably began to show
signs of deterioration on deeper investigation.
“In 2001, ODOT inspectors noticed that cracks
identified in previous inspections had grown
to the point of threatening structural stabil-
ity,” said Jim Cox, assistant manager of major
projects at ODOT. “We immediately placed
load restrictions on these bridges and started
discussion on how to plan repairs with the least
impact on commercial and commuter traffic.”
GIS and GeodesignEstablished in 2004, ODOT’s GIS comprised
the department’s information sharing
for Transportation Summer 2012
Esri News
G53189_Transportation_130293.indd 1 7/6/12 1:21 PM

Summer 2012
Esri News for Transportation is a publication of the Transportation Group of Esri.
To contact the Esri Desktop Order Center, call 1-800-447-9778 within the United States or 909-793-2853, ext. 1-1235, outside the United States.
Visit the Esri website at esri.com.
View Esri News for Transportation online at esri.com/transportation or scan the code below with your smartphone.
Advertise with Us
E-mail [email protected].
Submit Content
To submit articles for publication in Esri News for Transportation,contact Terry Bills, industry solutions manager, at [email protected],or Matthew DeMeritt, editor, at [email protected].
Manage Your Subscription
To update your mailing address or subscribe or unsubscribe to Esri publications, visit esri.com/manageyoursubscription.
International customers should contact an Esri distributor to manage their subscriptions.
For a directory of distributors, visit esri.com/distributors.
Circulation Services
For back issues, missed issues, and other circulation services, e-mail [email protected]; call 909-793-2853, extension 2778; or fax 909-798-0560.
2 Esri News for Transportation Summer 2012
ContentsCover
1 GIS Keeps Traffic Moving during Large-Scale Bridge Repair Project in State of Oregon
Esri News
3 Uncover the Business Value of GIS at the Esri International User Conference
3 Esri Aeronautical Solution—Airports GIS Package Version 2 Improves Data Quality
5 Esri on the Road
Case Study
6 A Look at the Michigan Department of Transportation’s Lane Mile Inventory
10 Bulgarian Railway Network Management Is Streamlined with GIS
12 Florida Department of Transportation on the Map
14 Perth Airport Flies High with Geospatial Intelligence
16 Spanish Airports and Air Navigation Improves Aeronautical Charting
18 Reducing Roadway Fatalities and Increasing Public Awareness through GIS
The information contained in this work is the exclusive property of Esri or its licensors. This work is protected under United States copyright law and other international copyright treaties and conventions. No part of this work may be reproduced or transmitted in any form or by any means, electronic or mechanical, including photocopying and recording, or by any information storage or retrieval system, except as expressly permitted in writing by Esri. All requests should be sent to Attention: Contracts and Legal Services Manager, Esri, 380 New York Street, Redlands, CA 92373-8100 usa.
The information contained in this work is subject to change without notice.
The Geographic Advantage, Esri, the Esri globe logo, 3D Analyst, ArcAtlas, ArcCatalog, ArcData, ArcDoc, ArcEditor, ArcExplorer, ArcGIS, the ArcGIS logo, ArcGlobe, ArcIMS, ARC/INFO, ArcInfo, ArcLogistics, ArcMap, ArcNetwork, ArcNews, ArcObjects, ArcPad, ArcPress, ArcReader, ArcSDE, ArcSurvey, ArcToolbox, ArcTools, ArcUser, ArcView, ArcVoyager, ArcWatch, ArcWeb, ArcWorld, ArcXML, Business Analyst Online, BusinessMAP, CommunityInfo, EDN, Geography Network, GIS Day, MapData, MapObjects, Maplex, MapStudio, ModelBuilder, MOLE, NetEngine, RouteMAP, SDE, Sourcebook•America, StreetMap, Tapestry, @esri.com, esri.com, arcgis.com, geographynetwork.com, gis.com, and gisday.com are trademarks, service marks, or registered marks of Esri in the United States, the European Community, or certain other jurisdictions.
Other companies and products or services mentioned herein may be trademarks, service marks, or registered marks of their respective mark owners.
Copyright © 2012 Esri.All rights reserved. Printed in the United States of America.
G53189_Transportation_130293.indd 2 7/6/12 1:21 PM
Terry BillsEsri Industry ManagerTransportation and Logistics
I recently attended two events that left a strong
impression on me. The first was our Second Esri
European Aviation GIS Summit, held at Brussels
International Airport (you can read a synopsis at
http://bit.ly/ISlxl9). A majority of Europe’s major
airports professionals, along with a number
of the European Civil Aviation staff, were in
attendance, all presenting their latest develop-
ments with Esri technology. It was heartening
to see the progress that these agencies have
made as more and more of the day-to-day
operations of these airports become integrated
with GIS. The first day’s presentations were
from the airports themselves, while the second
day was devoted to the European Civil Aviation
and the EUROCONTROL initiatives in support
of the next generation of air traffic control
system—SESAR—in Europe.
The Spanish airports, Amsterdam’s Schiphol
Airport, and Brussels and Manchester airports
are all well on their way to enterprise systems,
with GIS supporting workflows across the
various divisions at their respective airports.
At the same time, many of these airports and
civil aviation administrations are being called
upon to deliver GIS-based data relating to their
airports, which will form part of the infrastruc-
ture for the new GPS-based air traffic control
systems. As the composition of our summit
illustrated, aviation air and land data require-
ments are certainly beginning to merge.
But by far, the major topic of discussion at
GIS-T was the rapid movement of many agen-
cies to the cloud. The Utah DOT’s enterprise
portal sits on ArcGIS Online for organizations,
and a large number of DOTs are beginning
to put their public-facing traveler information
websites in the cloud for quick scalability and
greater flexibility. You will see much more on
this in these pages in the coming months.
Enjoy.
Welcome
Esri News
Esri Aeronautical Solution—Airports GIS Package Version 2Improves Data Quality
The Aeronautical Solution—Airports GIS
Package version 2 is now available for down-
load from the Aeronautical Solution Resource
Center. This updated offering expands the
number and types of preconfigured auto-
mated validation checks to include checks
used by the Federal Aviation Administration
(FAA) during data submission as well as criti-
cal and noncritical attributes.
Esri Aeronautical Solution—Airports
GIS Package is a software suite specifically
developed to help US airports and the con-
sultant community meet the requirements of
the FAA Airports Surveying—GIS program.
Version 2 includes more than 300 preconfig-
ured validation checks developed from the
Uncover the Business Value of GIS at the Esri International User ConferenceAttend the Esri International User Conference
(Esri UC) to discover how GIS adds value
to transportation organizations. Learn best
practices that will show you ways GIS can help
locate success in the dynamic transportation
market. Come to the Esri UC to improve your
GIS, grow professionally, and be successful in
your work. Meet GIS experts, industry profes-
sionals, and a community of users who can
help you find the answers you need.• Explore the business value of GIS for
transportation.• Discover GIS product innovations that help
you meet your goals.• See how others are using GIS to increase
production and efficiency.
Esri International User ConferenceJuly 23–27, 2012, San Diego, California
FAA-18B specification, enabling airports to
improve their data quality and better comply
with FAA review.
For more information regarding Esri AeronauticalSolution—Airports GIS, visit esri.com/airportsgis.
Learn more and register at esri.com/uc.
3Summer 2012 esri.com/transportation
G53189_Transportation_130293.indd 3 7/6/12 1:21 PM

GIS Keeps Traffic Moving during Large-Scale Bridge Repair Project in State of Oregon continued from page 1
into a spreadsheet. “Gradually, that process evolved to incorporate
GIS processes,” Kirkman said. “Using macros and automation tools in
ArcGIS, ODOT’s traffic group was able to automatically populate the
spreadsheets with information from the database.”
Although much leaner, the spreadsheet-only approach experienced
crashes as the database grew ever larger. The traffic team worked with
OBDP on a more efficient GIS-based method for running traffic sce-
narios—one that tightly wove ODOT’s geospatial data into a dedicated
web-based analysis tool. Using common protocols, the team worked
on tying the department’s datasets together to give ODOT staff direct
access to the department’s databases from a single interface. Called
the Work Zone Traffic Analysis (WZTA) tool, the application allowed
traffic scenarios to be run and shared in a web browser.
WZTA serves as a repository for information on traffic and road data
that can be accessed and queried in a browser. The system allows
users to view ODOT data to determine the effects on mobility created
by lane closures related to construction and roadwork. Today, the
department can run traffic scenarios in a matter of minutes, eliminating
redundancy and enabling ODOT engineers to modify traffic plans on
the fly.
Using a GIS-based interface also improved accuracy by allowing the
ODOT analysts to select the location and information for a specific
project site from the map itself rather than tabular lists. “Lookup tables
using numbering systems aren’t intuitive to all users,” Kirkman said.
“GIS enabled users to find exactly what they were looking for and verify
the correct project information within a more appropriate map-based
user interface where spatial relationships are more obvious.”
infrastructure to plan and manage roadway projects. To integrate
with ODOT’s GIS, OBDP designed its system on the same ArcGIS plat-
form for flexibility and scalability throughout the project life cycle and
beyond. “We wanted easy adoption of tools and practices to smooth
transition during project closeout and ensure usefulness beyond that,”
said Robb Kirkman, GIS services manager for HDR Engineering. “GIS
provided the foundation to start linking program systems, automate
tasks, and better mitigate environmental impacts.”
Before shovel hit dirt, ODOT collected comprehensive environmental
data on more than 400 of its bridge sites to identify nearby environ-
mental resources. Standard ODOT practice involves consultation with
experts such as biologists, wetland specialists, and archaeologists
to get a better understanding of the effects of construction zones in
ecologically sensitive areas. “We took a different approach for the
OTIA III bridge program by conducting environmental fieldwork before
we did any design,” said Cox. “In ArcGIS, we drew a box around a
bridge site and identified all the resources inside the box. This allowed
the engineers to develop designs that minimized impacts on the sur-
rounding environment.”
Work Zone Traffic AnalysisPrior to its collaboration with OBDP, ODOT had been using spread-
sheets containing traffic counts and automatic traffic recorder informa-
tion from across the state to document and predict traffic impacts for
its various road construction projects. That process could take up to
four hours for each scenario because data had to be searched and
collected from multiple databases within the agency and then inserted
WZTA and the team that developed it won a
2007 Team Excellence Pathfinder Award from
the American Association of State Highway and
Transportation Officials.
4 Esri News for Transportation Summer 2012
G53189_Transportation_130293.indd 4 7/6/12 1:21 PM

ACI Europe 2012
June 20–22, 2012Madrid, Spainwww.aci-europe.org
Esri International User Conference
July 23–27, 2012San Diego, CA, USAesri.com/uc
ACI NA/World Annual Conference and Exhibition 2012
September 9–12, 2012Calgary, Canadahttp://2012.aci-na.org
AREMA 2012
September 16–19, 2012Chicago, IL, USAwww.arema.org
Post Expo 2012
September 18–20, 2012 Brussels, Belgiumwww.postexpo.com
Innotrans 2012
September 18–21, 2012Berlin, Germanywww.innotrans.de/en
Esri on the Road
Economist Documents Return on InvestmentIn 2010, ODOT and OBDP documented their experience with the tools
to evaluate the impact of ODOT’s investments and determine their
use after completion of the bridge program. With the assistance of
economic consultant Mark Ford, they analyzed every piece of soft-
ware OBDP created for the OTIA III bridge program to determine the
economic benefits and cost to the department. The study concluded
that ODOT experienced a combined benefit-cost ratio of 2:1 for all en-
terprise IT investments related to management of the bridge program.
“ODOT’s GIS infrastructure alone returned a [benefit-cost] ratio of
3:1,” Ford said. “Integration of formats and standards proved to be
important in generating value from the investment.”
In addition to these tangible benefits, ODOT experienced three
types of intangible benefits that could not be measured. Migrating
the data from disparate sources into a unified system allowed OBDP to
program consistent analysis methods and reduce the risk of calculation
errors. The centralized database also made it easier for ODOT to main-
tain data integrity and reduce the potential of analysts from different
locations working with outdated information. “Systems like ODOT’s
GIS infrastructure generate accurate, consistent, and timely informa-
tion for reporting and responding to inquiries,” Ford said. “WZTA and
GIS in particular have resulted in improved coordination with other
agencies and interest groups, increasing the credibility of both ODOT
and the bridge program in the eyes of the public and the legislature.”
At the beginning of 2011, 351 of the 365 bridges in the OTIA III
bridge program were free of construction zone delays. WZTA played
a primary role in expediting the construction process by allowing the
team to run lane closure traffic analyses in minutes as opposed to
hours. The tool is now being used by ODOT on other roadway main-
tenance and construction projects to quickly determine impacts from
lane closures across the state.
Ñ The Oregon Department of Transportation repaired the Snake River Bridge on Interstate 84 as part of the OTIA III State Bridge Delivery Program, which will repair or replace hundreds of aging bridges across Oregon.
Ñ As part of the OTIA III State Delivery Program, funds were dedicated to replace the Interstate 5Willamette RiverBridge in Eugene,Oregon. Constructionbegan in May 2009, and the project will be open to traffic in 2013.
5Summer 2012 esri.com/transportation
Esri News
G53189_Transportation_130293.indd 5 7/6/12 1:21 PM

A Look at the Michigan Department of Transportation’s Lane Mile Inventory
Cory Johnson and Kevin McKnight, transportation planners at Michigan Department of Transportation (MDOT), discuss developing a GIS-centric lane mile inventory (LMI) to collect and maintain MDOT’s lane mile assets. This interview was originally published in the United States Department of Transportation’s GIS in Transportation newsletter.
What is the history of the LMI?MDOT, like many other departments of trans-
portation, has struggled with the best method
to collect and maintain an LMI. In the past,
MDOT Central Maintenance would ask each of
MDOT’s seven regions to submit annual lane
mile totals based on ongoing projects and
estimated future construction. But without a
system to accurately track these assets based
on ongoing operations, it did not take long
for numbers to stray from reality. Inaccuracies
would force expensive system reviews,
which sometimes contained inconsistencies
themselves. Additionally, MDOT had multiple
lane mile inventories that met slightly different
business needs.
In 2009, MDOT leadership decided to
search for a new solution that would function
as the sole resource for lane miles paired with
a process to govern the inventory. MDOT’s
Asset Management Division was tasked
with developing a solution that would meet
MDOT’s needs to responsibly manage its
9,652 miles of state highway.
What is the purpose of the LMI?The primary purpose of MDOT’s LMI is to
provide a critical centralized resource that
supports MDOT in delivering annual main-
tenance and capital funds to MDOT regions
(each of which receives a certain amount
of maintenance funds per lane mile that it
manages).
MDOT defines a lane mile as one mile of
roadway that is designed as a driving lane.
This straightforward definition was intended
to provide a concise starting point and a clear
methodology for completing field collection
of inventory within one season. As the LMI
continues to mature, the definition will be
expanded to account for the complex nature
of maintaining roadway networks.
Where is the data stored?The foundation of the LMI is the Michigan
Geographic Framework [MGF] centerline GIS
file. The centerline file and linear referencing
system are maintained by the Michigan
Department of Technology, Management and
Budget’s Center for Shared Solutions [CSS],
with funding and staff support provided from
MDOT. MDOT’s Asset Management Division
staff teamed up with CSS to develop routines
to migrate the data forward to match ongoing
LRS [linear reference system] updates as
needed. Syncing the LMI with the MGF allows
PR Finder Application Showing the LMI
6 Esri News for Transportation Summer 2012
G53189_Transportation_130293.indd 6 7/6/12 1:21 PM
data to be centrally stored via Esri’s ArcGIS for
Server technology, thereby enabling broader
accessibility.
How was the inventory completed?The initial LMI was developed by modifying
a copy of the MGF state highway centerline
file, enabling it to host the required business
data for the LMI. This required data included
fields such as number of lanes, lane miles,
maintenance responsibility, and a “field
checked” date. Two staff members from the
Asset Management Division then verified the
accuracy of the GIS database in the field.
Once MDOT had established business logic
for what constituted a lane and how informa-
tion would be collected, it only needed a state
vehicle, a laptop, ArcGIS for Desktop, and a
“hockey puck” GPS receiver. Using this equip-
ment, the two-person crew was able to collect
information on the entire lane mile system in
one summer season.
How is the inventory maintained?After MDOT completed its initial investment in
collecting the entire system, the LMI entered
an ongoing maintenance mode. During this
phase, data [was] loaded into an ArcGIS for
Server instance. In addition, an official contact
person was established within each MDOT
region. This contact is responsible for provid-
ing Asset Management Division staff with
information about any ongoing operations
that impact the total number of lane miles.
This information provides the specific
“The LMI will continue to serve as a model of how to develop a GIS-centric solution to meet the larger goals of an organization.”Cory Johnson, MDOT
RouteSmart for NEWSPAPER DISTRIBUTION
RouteSmart for POSTAL & PARCEL DELIVERY
RouteSmart for PUBLIC WORKS
RouteSmart for UTILITIES
LoGIStics Solutions that Pick-up and Deliver.
RouteSmart Technologies understands the middle name of logistics is GIS! Over the past two decades we’ve delivered scalable, sustainable GIS-based routing solutions that operate using the Esri® technology platform. RouteSmart software is specifically designed to meet the demanding route planning needs of the newspaper, postal & parcel delivery, public works and utilities industries.
Powered by:
routesmart.com
|Esri trademarks provided under license from Esri.
7Summer 2012 esri.com/transportation
Case Study
G53189_Transportation_130293.indd 7 7/6/12 1:21 PM

A Look at the Michigan Department of Transportation’s Lane Mile Inventory continued from page 7
location data necessary for Asset Manage-
ment staff to field verify each location and
update the LMI as needed.
This “honest broker” role that the Asset
Management Division played allows the LMI
to function as one consistent resource for
MDOT to use in its annual budgeting process.
How does staff access the LMI?Staff members have several options for ac-
cessing the LMI to support their daily duties.
Provided they are on the state network,
staff can access the LMI via any Esri desktop
GIS software. They can also view the inventory
via the PR Finder web application, which is
available at www.mcgi.state.mi.us/prfinder.
Staff can view the inventory in spreadsheet
format broken down by geographic and
maintenance responsibility summaries.
How has the use of the LMI benefited MDOT?The new LMI has provided a reliable process
for updating MDOT’s inventory, a central
resource for information providing statewide
consistency, and a means for governing the
program. It has resulted in a better use of
resources and staff time. It has also enabled
MDOT to better compare costs per lane mile
across the department and between contract
agencies, leading to effective, data-driven
business decisions.
The LMI will continue to serve as a model of
how to develop a GIS-centric solution to meet
the larger goals of an organization.
What were the critical success factors?The most critical success factor was the fact
that MDOT leadership mandated and sup-
ported changes to a long-standing program.
Leadership also helped encourage staff mem-
bers to adopt the new LMI solution. Another
essential factor was the fact that Michigan
had a robust GIS centerline file maintained
through CSS. Finally, it was critical to develop
partnerships between Asset Management,
Central Maintenance, and regional staff.
What are future plans for the LMI?The MDOT staff will continue to improve the
LMI’s ability to account for difficult issues
such as parking, bike lanes, and highway
shoulders. There are also ongoing efforts
to create a work order-based web solution
for the LMI that will take greater advantage
LMI Displayed in ArcGIS for Desktop
of ArcGIS for Server technology and related
map services. MDOT is laying the groundwork
for implementing an enterprise asset
management system; the LMI is one of over
60 databases already loaded into ArcGIS for
Server. In 2012, MDOT expects to make some
critical decisions regarding enterprise asset
management software. This will help to chart
a solid and exciting course for the LMI and
related asset inventories while ensuring that
the LMI remains as a critical resource in the
budgeting process.
Get more information on the LMI:
Cory Johnson (e-mail at [email protected] call 517-335-2931)
Kevin McKnight (e-mail at [email protected] or call 517-241-4548)
8 Esri News for Transportation Summer 2012
G53189_Transportation_130293.indd 8 7/6/12 1:21 PM

The mandate is clear:Reduce costs and gain efficiency.
With government agencies being asked to do more with less, Dell’s highly fl exible solutions can help you consolidate data centers, increase cyber security and embrace cloud technology, saving potential energy, space and costs in the process. For more information visit dell.com/ITmandate.
©Dell Inc. All rights reserved.
Do more with Efficient IT
84674_us_pub_fy13q1_mag_wk13_gov_govexec_dtp1.indd 1 2/13/12 1:03 PM
G53189_Transportation_130293.indd 9 7/6/12 1:21 PM
Located in the heart of the Balkan Peninsula,
the Republic of Bulgaria plays a crucial stra-
tegic role for Europe because of its location.
It is a transportation crossroads between
western Europe, the Middle East, and the
Mediterranean, as well as an external border
for the European Union (EU). In addition, four
international land transport corridors pass
through its territory. All these factors make
the development and maintenance of the
Bulgarian transportation network a critical
priority, not only for Bulgaria but also for the
Balkan Peninsula and Europe as a whole.
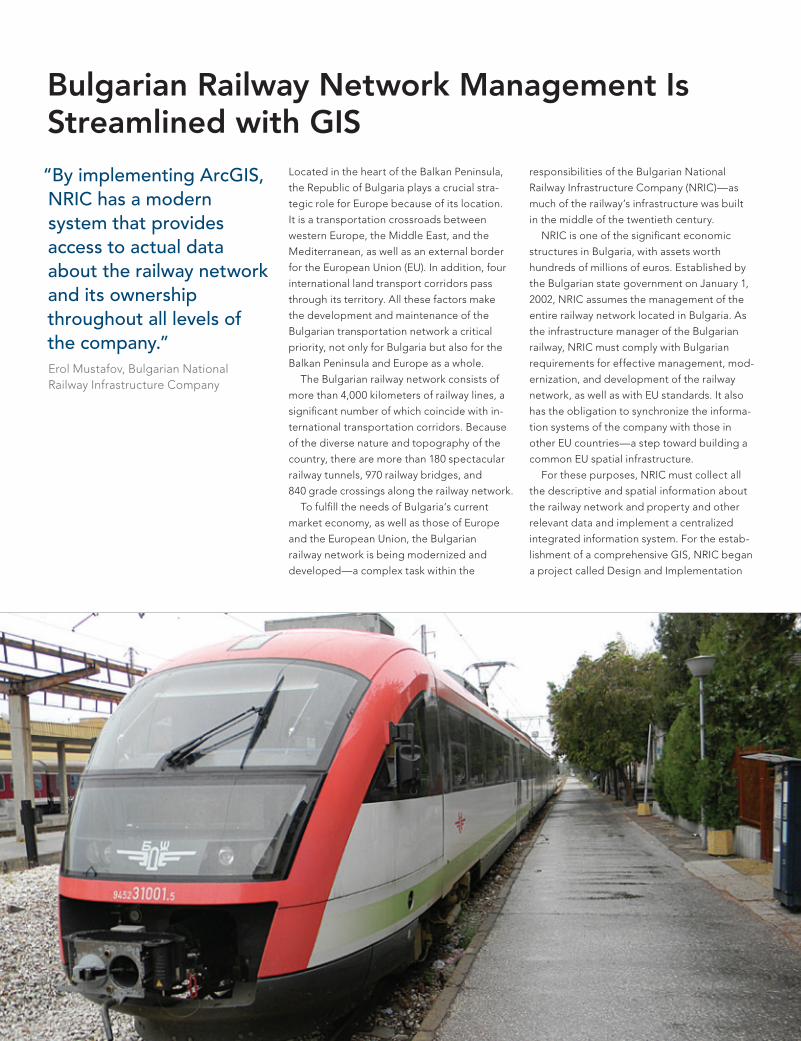
The Bulgarian railway network consists of
more than 4,000 kilometers of railway lines, a
significant number of which coincide with in-
ternational transportation corridors. Because
of the diverse nature and topography of the
country, there are more than 180 spectacular
railway tunnels, 970 railway bridges, and
840 grade crossings along the railway network.
To fulfill the needs of Bulgaria’s current
market economy, as well as those of Europe
and the European Union, the Bulgarian
railway network is being modernized and
developed—a complex task within the
Bulgarian Railway Network Management Is Streamlined with GIS
“By implementing ArcGIS, NRIC has a modern system that provides access to actual data about the railway network and its ownership throughout all levels of the company.”Erol Mustafov, Bulgarian National Railway Infrastructure Company
responsibilities of the Bulgarian National
Railway Infrastructure Company (NRIC)—as
much of the railway’s infrastructure was built
in the middle of the twentieth century.
NRIC is one of the significant economic
structures in Bulgaria, with assets worth
hundreds of millions of euros. Established by
the Bulgarian state government on January 1,
2002, NRIC assumes the management of the
entire railway network located in Bulgaria. As
the infrastructure manager of the Bulgarian
railway, NRIC must comply with Bulgarian
requirements for effective management, mod-
ernization, and development of the railway
network, as well as with EU standards. It also
has the obligation to synchronize the informa-
tion systems of the company with those in
other EU countries—a step toward building a
common EU spatial infrastructure.
For these purposes, NRIC must collect all
the descriptive and spatial information about
the railway network and property and other
relevant data and implement a centralized
integrated information system. For the estab-
lishment of a comprehensive GIS, NRIC began
a project called Design and Implementation
G53189_Transportation_130293.indd 10 7/6/12 1:21 PM

of Geographic Information System for NRIC’s
Needs. Esri Bulgaria Ltd., Esri’s distributor for
that country, was the selected contractor—a
company with more than 16 years of experi-
ence in implementing most of the biggest
national GIS projects in Bulgaria.
Activities on the Design and Implementation
of Geographic Information System for NRIC’s
Needs project started in May 2009 and ended
in November 2010. NRIC’s GIS is based on
ArcGIS and is designed for collection, accumu-
lation, storage, transmission, and analysis of
spatial and descriptive information about the
railway infrastructure, property, ownership, and
other relevant data and to provide conditions
for improving the operational, commercial, and
financial management of the company.
NRIC’s GIS provides access to a central-
ized database with geospatial parameters of
the railway infrastructure with the ability to
identify its objects and establish their location
in space, as well as perform geoanalysis and
effectively manage infrastructure operations.
This is particularly important for the company,
as it helps in providing services to railway
operators, emergency response, carrying out
planned repairs, and modernization of railways.
The GIS includes two major subsystems:
Railway, and Cadastre and Property Register.
Each subsystem has both a desktop and web
part. Furthermore, digital drawing archive and
administration modules were developed. All
these components are closely integrated and
By implementing ArcGIS, NRIC has a
modern system that provides access to actual
data about the railway network and its owner-
ship throughout all levels of the company. In
addition, the ability to generate various types
of reports results in improved planning and
management of the company.
The implementation of GIS in NRIC helps
improve the quality and efficiency of railway
structure management and creates condi-
tions for economic growth. The system gives
NRIC an advantage in achieving long-term
objectives for sustainable development and
modernization of the national transportation
infrastructure.
For more information, contact Erol Mustafov, MS, head of the GIS Unit and project manager, NRIC (e-mail: [email protected]), or Stefan Tchapkansky, technical marketing, Esri Bulgaria (e-mail: [email protected]).
used together. NRIC is planning to add other
subsystems in the future.
ArcGIS provides capabilities for monitoring,
evaluating, and analyzing sites and infrastruc-
ture facilities to integrate staff responsibilities
and address strategic and operational tasks.
By improving the management of the railway
infrastructure, significant economic perfor-
mance is achieved.
The system improves the processes for
asset management (rail infrastructure and
property) and ensures attainment of rail
transportation standards in the European
Community by introducing modern geospatial
information technologies. Moreover, it gives
the company the capability to manage cadas-
tral data and technical infrastructure using
NRIC’s intranet.
GIS supports operation, maintenance and
repair, inventory, inspection, investigation
and planning, analysis and reporting, decision
making, property management, and other
workflows.
NRIC’s GIS offers many advantages, includ-
ing quick access to integrated information
from different sources, effective management
of information in real time, strong analytic
capabilities, prioritization of efforts in plan-
ning and maintenance, multiple options for
information display, and implementation of
international standards and models. Being
able to rely on Esri Bulgaria’s expertise in GIS
design and implementation is another benefit.
An orthophoto map with 10 cm resolution of the railway infrastructure of Veliko Tarnova City (Image courtesy of NRIC)
An ArcGIS web application provides information about the railway infrastructure together with cadastral data.
11Summer 2012 esri.com/transportation
Case Study
G53189_Transportation_130293.indd 11 7/6/12 1:21 PM

is not normally collected for a project, such as
sidewalk locations, bus stops, school zones,
and property ownership, is also difficult.
Assembling the data needed for just one
project can take hundreds of man-hours.
“There is one element in common between
these disparate systems—location,” said José
Theiler, program services administrator, FDOT
District 4. “The only way to relate projects and
all the data that is needed is with location-
driven information managed with GIS.”
FDOT has hundreds of layers of geographic
information available to staff. Location infor-
mation specific to projects is captured through
a roadway identification number that is found
between every milepost on the freeway. In
the case of bridges, the actual geographic
coordinates of the structure are used. Staff
use ArcGIS to manage all the spatial informa-
tion from a pool of floating licenses. While
most geographic information is stored in one
geodatabase, staff also maintain separate
geodatabases of project-specific data.
To make this decentralized information
easier to access by anyone at District 4 who
needs it, such as managers of nearby or
adjacent projects and executive staff, Atkins
Global was hired. Atkins is the UK’s largest
engineering and design consultancy and the
world’s eleventh-largest design firm. The firm
worked with District 4 staff to create a project
website based on ArcGIS called ProjectSuite.
Now, approximately 200 District 4 staff mem-
bers, including project managers, find, store,
and analyze information for every project daily
using the website.
ProjectSuite essentially aggregates all
the data located in disparate systems and
performs nightly data pulls, including from a
mainframe located back in the central office
in Tallahassee. The most current information
from these sources is updated in a single
Microsoft SQL Server data warehouse at
District 4 and accessed through ProjectSuite.
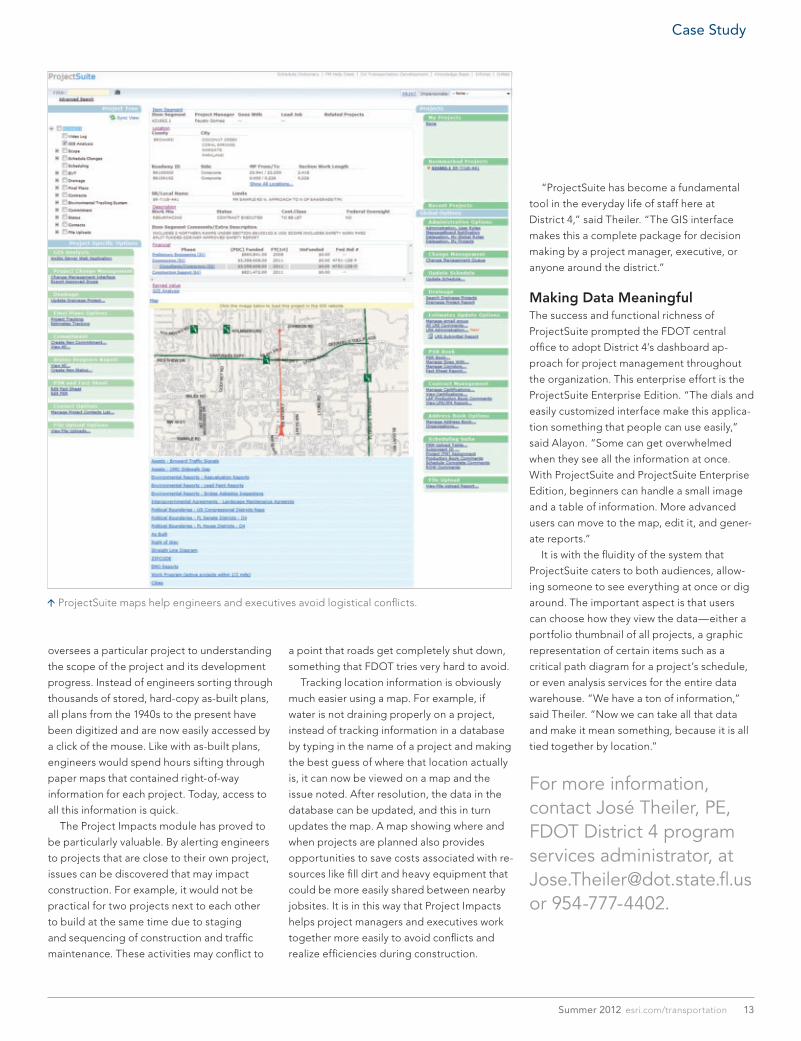
ProjectSuite Provides a Destination to Access InformationProjectSuite opens to an easy-to-use dash-
board application built on .NET using ArcGIS
Florida Department of Transportation on the MapDepartment’s District 4 Turns to ArcGIS for Better Project ManagementBy Karen Richardson, Esri Writer
Florida Department of Transportation (FDOT)
is in charge of a vast network that includes
trains, planes, automobiles, and boats. Almost
120,000 miles of state highways and local
roads, more than 700 aviation facilities,
14 seaports, and five active launch facilities are
maintained by FDOT to keep the state bustling.
To effectively manage the transportation
system, ensuring people and goods can move
safely while preserving the lush environment of
Florida, FDOT divides the workload between
its central office, located in Tallahassee,
Florida; seven districts that cover different re-
gions of the state; and one turnpike enterprise,
a business unit of FDOT that covers most toll
roads in the state. Each district creates and
maintains a five-year work program that details
specific maintenance and upgrades to roads,
bridges, rail lines, and other capital invest-
ments of the transportation system.
To get a better idea of the health of the
many projects open at any given time, FDOT’s
District 4 developed a sleek, easy-to-use
computerized dashboard connected to a
central repository of georeferenced informa-
tion. Every capital project—and its associated
data—is available to FDOT project managers
whenever they need it. From this application,
created using ArcGIS, project managers have
access to more than 100 transportation-rich
georeferenced datasets including proposed
designs, construction plans, as-built drawings,
and straight-line diagrams that are relevant to
their projects.
Location, the Common GroundAny given project has a vast array of informa-
tion, from scope and schedule to roadway
characteristics, asset inventory, as-built
construction plans of the existing structure,
financial and contractual information, and pro-
ject location, to name a few. Historically, there
has been no central system that maintains
this information. Instead, project managers
continually navigate between different project
databases for financial and contract data and
request hard-copy as-builts and diagrams
from other departments as they are needed.
Gathering information that can be helpful but
API for Microsoft Silverlight/WPF. The main
screen of ProjectSuite is divided into different
panes—the top pane allows the project
manager to search for projects of interest, the
left pane shows the project manager a list of all
the projects that have been assigned to him or
her, and a project tree in the top center of the
screen allows the manager to set up specific
options for each project and type in the pro-
ject number to see more detailed information.
Once a particular project is selected, all
the information available for that location is
displayed. This information includes the road-
way segment ID, project descriptions from the
mainframe, and financial information including
key performance indicators (KPIs) based on
the project budget and schedule.
After this displayed data, a list of modules
that gives the manager access to databases
that are relevant to each project is shown. One
of these modules is called Project Impacts,
which is how the GIS data is accessed. The
interface to this module is an interactive map
that displays every active project as a point
on the map, along with the boundaries of all
the projects. The map and data in this module
come from District 4’s GIS portal that is built
on ArcGIS for Server.
“This interface gives project manager[s]
a frame of reference for where their project
is,” said Manuel Alayon, software develop-
ment manager at Atkins. “We call this module
Project Impacts because it provides infor-
mation about what is around their projects
and allows them to see external factors that
may need to be considered for their project
completion.”
Under the map is a section that shows other
information that is tied to certain locations—
either roads or bridges—so the project man-
ager can access this easily. Documents such
as straight-line diagrams are scanned and
stored on a file server and tied to the roadway
segment. With a simple click on the segment,
the diagram can be opened.
Driving Efficient ProjectsProjectSuite is used throughout the district for
many purposes, from denoting which manager
12 Esri News for Transportation Summer 2012
G53189_Transportation_130293.indd 12 7/6/12 1:21 PM
a point that roads get completely shut down,
something that FDOT tries very hard to avoid.
Tracking location information is obviously
much easier using a map. For example, if
water is not draining properly on a project,
instead of tracking information in a database
by typing in the name of a project and making
the best guess of where that location actually
is, it can now be viewed on a map and the
issue noted. After resolution, the data in the
database can be updated, and this in turn
updates the map. A map showing where and
when projects are planned also provides
opportunities to save costs associated with re-
sources like fill dirt and heavy equipment that
could be more easily shared between nearby
jobsites. It is in this way that Project Impacts
helps project managers and executives work
together more easily to avoid conflicts and
realize efficiencies during construction.
ProjectSuite maps help engineers and executives avoid logistical conflicts.
“ProjectSuite has become a fundamental
tool in the everyday life of staff here at
District 4,” said Theiler. “The GIS interface
makes this a complete package for decision
making by a project manager, executive, or
anyone around the district.”
Making Data MeaningfulThe success and functional richness of
ProjectSuite prompted the FDOT central
office to adopt District 4’s dashboard ap-
proach for project management throughout
the organization. This enterprise effort is the
ProjectSuite Enterprise Edition. “The dials and
easily customized interface make this applica-
tion something that people can use easily,”
said Alayon. “Some can get overwhelmed
when they see all the information at once.
With ProjectSuite and ProjectSuite Enterprise
Edition, beginners can handle a small image
and a table of information. More advanced
users can move to the map, edit it, and gener-
ate reports.”
It is with the fluidity of the system that
ProjectSuite caters to both audiences, allow-
ing someone to see everything at once or dig
around. The important aspect is that users
can choose how they view the data—either a
portfolio thumbnail of all projects, a graphic
representation of certain items such as a
critical path diagram for a project’s schedule,
or even analysis services for the entire data
warehouse. “We have a ton of information,”
said Theiler. “Now we can take all that data
and make it mean something, because it is all
tied together by location.”
For more information, contact José Theiler, PE, FDOT District 4 program services administrator, at [email protected] or 954-777-4402.
oversees a particular project to understanding
the scope of the project and its development
progress. Instead of engineers sorting through
thousands of stored, hard-copy as-built plans,
all plans from the 1940s to the present have
been digitized and are now easily accessed by
a click of the mouse. Like with as-built plans,
engineers would spend hours sifting through
paper maps that contained right-of-way
information for each project. Today, access to
all this information is quick.
The Project Impacts module has proved to
be particularly valuable. By alerting engineers
to projects that are close to their own project,
issues can be discovered that may impact
construction. For example, it would not be
practical for two projects next to each other
to build at the same time due to staging
and sequencing of construction and traffic
maintenance. These activities may conflict to
13Summer 2012 esri.com/transportation
Case Study
G53189_Transportation_130293.indd 13 7/6/12 1:21 PM

Strategically located in relation to Southeast
Asia, Europe, and Africa, Perth Airport is
Australia’s fourth largest airport in terms
of passenger traffic. Under a 99-year lease
arrangement with the commonwealth govern-
ment, the airport is operated by Westralia
Airports Corporation Pty Ltd (WAC). The Perth
Airport estate encompasses more than 2,100
hectares and is the premier international,
domestic, and regional gateway to the state of
Western Australia.
Western Australia is home to a strong
economy led by natural resources, and since
Perth is Australia’s most isolated capital city,
Perth Airport is a critical infrastructure com-
ponent in the state. The airport has recently
experienced the highest passenger growth
rates of any Australian capital city airport,
Perth Airport Flies High with Geospatial IntelligenceAustralian Airport Gains Enterprise-Wide Access to Location Intelligence Tools
reporting a 7.5 percent increase in passenger
numbers for the 2009–2010 financial year.
More than 10.4 million passengers traveled
through Perth Airport in 2009–2010, and total
passenger movements per year are forecast to
more than double to 18.9 million by 2029.
To meet this growth projection and prepare
for the expansion of terminal facilities, WAC
sought to gather more data across the airport
estate, taking multiple safety and security,
operational, environmental, customer service,
commercial, and service infrastructure factors
into account. WAC wanted to be able to
integrate data from this range of complex
interrelated areas and understand how the
location of various factors was influencing
their use and constraints.
“Location intelligence is vital in planning the airport infrastructure for the construction or relocation of services and the maintenance of airport assets.”Fiona Lander, Westralia Airports Corporation Pty Ltd.
Enterprise Spatial Services for TransportationCritigen offers a broad range of enterprise consulting, spatial and application development services enabling our clients to realize value and minimize risk through the use of location intelligence and enterprise geo-integration. Critigen knows the planning, engineering and management issues faced by transportation agencies and has developed technology services and solutions to meet those challenges.
• Alternative impacts analysis• Asset and work order management• Data development & translation• Web-based development and hosting• Mobile data collection• Master planning• Infrastructure routing• Regulatory compliance• Permitting• Public safety and security
For more information contact: Ken Hill, Vice President, Consulting and [email protected] 1.865.560.2937
Trademarks provided under license from Esri
14 Esri News for Transportation Summer 2012
G53189_Transportation_130293.indd 14 7/6/12 1:21 PM

To achieve this, WAC required a solution
that provided more enhanced spatial infor-
mation management. During the research
and investigation process, WAC contacted
Esri Australia Pty. Ltd., Esri’s distributor in
Australia, which had developed a technology
that could help Perth Airport find a corporate-
wide location intelligence solution, and the
two companies decided to work together on
the project.
The team’s key goals were to create a solu-
tion using ArcGIS technology that would do
the following:• Provide a single authoritative source of
spatial information• Add value to the business and decision-
making processes• Improve efficiencies in repetitive or com-
plex tasks• Provide an intuitive way to locate informa-
tion held in business systems• Ensure that adequate and reliable technol-
ogy is deployed to support location-based
systems and business activities
At the heart of WAC’s location intelligence
solution was Esri GIS and Dekho software,
which was developed by Esri Australia. Based
on ArcGIS, Dekho helps WAC integrate
information from databases that have a loca-
tion element, including property and asset
management. The software enables WAC to
effectively disseminate and manage this data
throughout multiple departments, creating
Case Study
informed and therefore empowered to make
better business decisions.”
Beyond the ability to create maps and visu-
alize where assets are, location intelligence
is playing a major role in the planning and de-
velopment of the expanding airport precinct.
“Location intelligence is vital in planning
the airport infrastructure for the construction
or relocation of services and the maintenance
of airport assets,” said Lander. “Through
effective use of location intelligence, we will
be able to move to a more proactive mainte-
nance schedule and more efficiently allocate
and plan resources, resulting in significant
cost savings and a better-running suite of
assets.”
WAC has many more plans for using
location intelligence at Perth Airport to
optimize workflows and better understand
the dynamic nature of the site, for example,
further integration with the asset manage-
ment and maintenance processes, detailed
land-use reporting, enhanced utilization of
location intelligence for operational activities,
and mobile access to GIS.
work force efficiencies through time-saving
and near real-time information sharing
processes.
WAC is a significant service provider,
managing the power, gas, sewer, water, fuel,
drainage, and communications needs of two
terminals and more than 200 tenants. It is also
effectively the landlord, retail hub, and con-
servation authority within the Perth Airport
estate. The corporate-wide solution enables
WAC staff throughout the entire organization
to access essential location-related data to
support operation of the airport.
“Before we implemented GIS, all spatial
information requests were submitted to
the Design Office to generate the relevant
maps and data,” said Fiona Lander, general
manager, Corporate Services. “This meant
that departments did not have real-time
access to information, and the Design Office
could become bogged down fulfilling the
myriad of simple requests rather than utilizing
[staff] skills for design and spatial information
management.
“Through the implementation of GIS, we
now provide all staff with access to self-serve
maps,” Lander continued. “These can help
with anything from planning the location of a
new vending machine to scoping the environ-
mental impacts of building a new warehouse
on the estate. With so many stakeholders
using location intelligence to get a greater
insight into their working area, staff are better
Westralia Airports Corporation effectively disseminates and manages its data throughout multiple departments, creating work force efficiencies through time-saving and near real-time information sharing processes.
15Summer 2012 esri.com/transportation
G53189_Transportation_130293.indd 15 7/6/12 1:21 PM

More than 190 million passengers pass
through airports in the country of Spain each
year. Air transport in the country is managed
by the Spanish Public Authority for Airports
and Aerial Navigation (AENA), headquartered
in Madrid, Spain. AENA’s mission is to guar-
antee safe, fluid, effective, and economic air
travel. The Aeronautical Information Service
(AIS) at AENA is in charge of disseminating the
aeronautical information that is critical for this
safe and efficient air navigation for 47 airports
across the country. This is accomplished by
publishing several cartographic products.
AENA maintains 1,000 maps that are
updated every 28 days. These maps are used
for its AIS, which delivers air navigation and
safety-related data to pilots flying in Spanish
airspace. Typically more than 50 maps need to
be updated every working week. A considera-
ble amount of effort is spent on chart cleanup
Spanish Airports and Air Navigation Improves Aeronautical Charting
“Producing some aeronautical charts for the four runways at Madrid Barajas Airport took only one day instead of the traditional six it took before.”Javier Fenoll Rejas, AENA
and quality check operations. Sometimes
charts have to be delayed because of lack of
time and resources.
Because airspace charts change so frequent-
ly, multiple charts are needed to cover each
area. Different views of the same data need
to be provided to cover the needs of different
end users. This creates editing tasks that are
often highly repetitive and quality processes
that are very time-consuming to maintain co-
herence between all the products. These tasks
make keeping up with the current map produc-
tion cycle among the biggest challenges AENA
faces. The organization is under constant
pressure to ensure all products are accurate
and up-to-date using the diverse information
coming from various data originators.
Due to international agreements, there
continues to be a need to produce and
distribute paper printed aeronautical charts.
16 Esri News for Transportation Summer 2012
G53189_Transportation_130293.indd 16 7/6/12 1:21 PM
Case Study
Spanish Airports and Air Navigation Improves Aeronautical Charting
However, there is a growing demand for
access to digital products as well. AENA’s
legacy systems required separate systems for
cartography and digital transmission of data
in the industry interchange standard for aero-
nautical information, Aeronautical Information
Exchange Model (AIXM) format. AENA lacked
a true central database that could manage
both requirements and needed a system to
produce high-quality charts both digitally and
on paper. The ability to post the charts on the
web for publication was also a necessity.
After researching available solutions, the
Aeronautical Information Division at AENA se-
lected Esri technology as part of the agency’s
aeronautical information management system,
named INSIGNIA. The technology implement-
ed includes ArcGIS for Server Enterprise and
Esri Aeronautical Solution. The technology
solutions provide AENA with the flexibility it
required to manage complex, critical aeronau-
tical information in a spatial environment that
is centered on an aeronautical geodatabase.
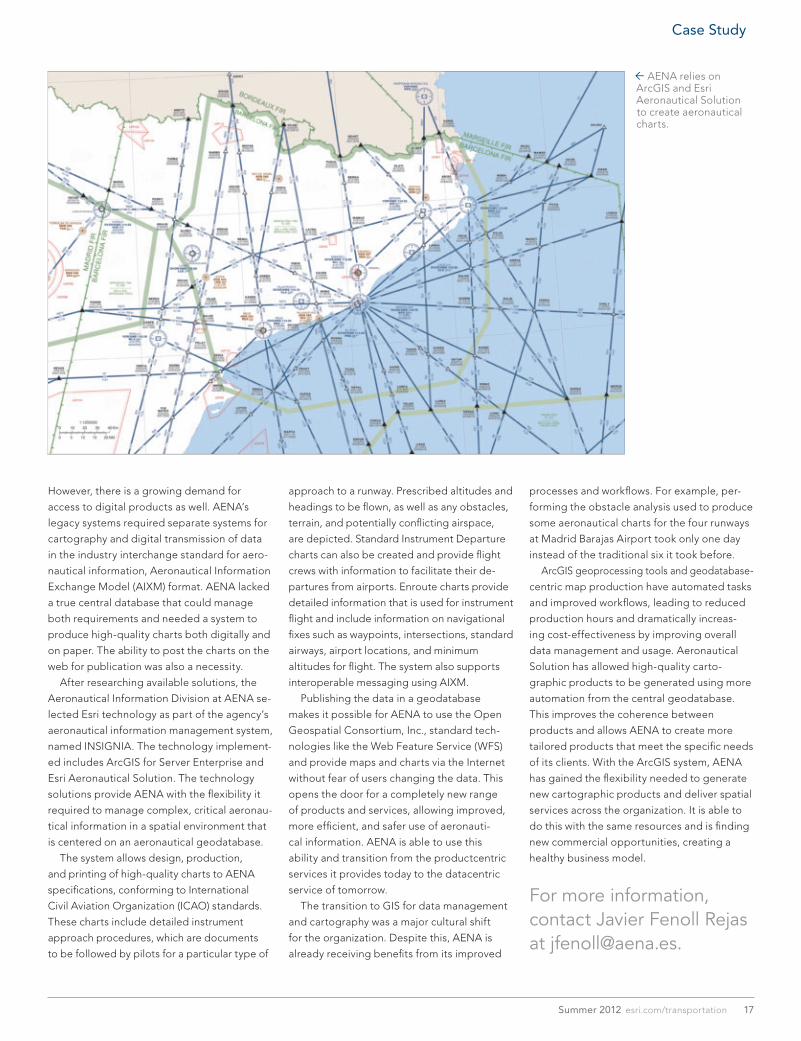
The system allows design, production,
and printing of high-quality charts to AENA
specifications, conforming to International
Civil Aviation Organization (ICAO) standards.
These charts include detailed instrument
approach procedures, which are documents
to be followed by pilots for a particular type of
processes and workflows. For example, per-
forming the obstacle analysis used to produce
some aeronautical charts for the four runways
at Madrid Barajas Airport took only one day
instead of the traditional six it took before.
ArcGIS geoprocessing tools and geodatabase-
centric map production have automated tasks
and improved workflows, leading to reduced
production hours and dramatically increas-
ing cost-effectiveness by improving overall
data management and usage. Aeronautical
Solution has allowed high-quality carto-
graphic products to be generated using more
automation from the central geodatabase.
This improves the coherence between
products and allows AENA to create more
tailored products that meet the specific needs
of its clients. With the ArcGIS system, AENA
has gained the flexibility needed to generate
new cartographic products and deliver spatial
services across the organization. It is able to
do this with the same resources and is finding
new commercial opportunities, creating a
healthy business model.
For more information, contact Javier Fenoll Rejas at [email protected].
approach to a runway. Prescribed altitudes and
headings to be flown, as well as any obstacles,
terrain, and potentially conflicting airspace,
are depicted. Standard Instrument Departure
charts can also be created and provide flight
crews with information to facilitate their de-
partures from airports. Enroute charts provide
detailed information that is used for instrument
flight and include information on navigational
fixes such as waypoints, intersections, standard
airways, airport locations, and minimum
altitudes for flight. The system also supports
interoperable messaging using AIXM.
Publishing the data in a geodatabase
makes it possible for AENA to use the Open
Geospatial Consortium, Inc., standard tech-
nologies like the Web Feature Service (WFS)
and provide maps and charts via the Internet
without fear of users changing the data. This
opens the door for a completely new range
of products and services, allowing improved,
more efficient, and safer use of aeronauti-
cal information. AENA is able to use this
ability and transition from the productcentric
services it provides today to the datacentric
service of tomorrow.
The transition to GIS for data management
and cartography was a major cultural shift
for the organization. Despite this, AENA is
already receiving benefits from its improved
Ñ AENA relies on ArcGIS and Esri Aeronautical Solution to create aeronautical charts.
17Summer 2012 esri.com/transportation
G53189_Transportation_130293.indd 17 7/6/12 1:21 PM
With approximately 40,000 automobile fatalities a year, traffic safety
is a major public health issue. Unfortunately, alarming statistics like
that don’t always get the commensurate attention they deserve. While
researching the role of information technology in making emergency
response systems more effective, Claremont Graduate University
(CGU) professor Tom Horan noticed that geographic information about
traffic fatalities wasn’t being used to its fullest potential.
“I’ve been working on a variety of research studies on health and
transportation,” said Horan, speaking from CGU’s School of Information
Systems and Technology (SISAT). “I started to think about the public
health problem that these fatalities represent.” Automobile accidents
are the number-one killer of teenagers in this country. With the intent
to increase understanding on this issue, Horan undertook a project to
make US traffic fatality statistics accessible from an easy-to-use website.
SafeRoadMaps was developed by SISAT research faculty member
Brian N. Hilton, who teaches classes in GIS solution development at
SISAT, along with several SISAT students. Working under the technical
direction of Hilton, the team created the SafeRoadMaps website, which
offers a variety of features, including interactive maps that display for
visitors where vehicular fatalities have occurred in their community.
When visitors type an address or ZIP Code into SafeRoadMaps, the site
displays information from state geodatabase records. SafeRoadMaps
uses data from the Fatality Analysis Reporting System (FARS) provided
by the National Highway Traffic Safety Administration for the years
2001–2010.
“SafeRoadMaps displays the key data on automobile accidents,”
said Horan. “Visitors can discover when the accident occurred, how
people were involved, whether the fatality was a driver or pedestrian,
and whether alcohol or some other inebriate was involved.” The site
also displays a photo of the location where the accident occurred.
FARS contains data on all fatal traffic crashes within the United States
where each case has more than 100 coded data elements that charac-
terize the crash, the vehicles, and the people involved.
Since its inception in 2008, the SafeRoadMaps website has logged
almost 12 million hits. It serves a variety of user types and needs and
houses an expanding spatial database.
Horan observed, “ArcGIS for Server provides us with the ability to
more easily integrate our growing quantity and variety of data sources,
allows us to perform more complex spatial queries, provides advanced
geoprocessing functionality, and facilitates the creation of map tiles
on the fly. In addition, we’re using ArcGIS Viewer for Flex for rapid
user interface development, something that was time-consuming and
unwieldy with the previous implementation.”
SafeRoadMaps version 1 was publicly launched on July 28, 2008, and
integrated a range of spatial data regarding motor vehicle crashes, trans-
portation policy legislation, and driver behavioral data presenting a visual
representation of traffic safety across the United States. SafeRoadMaps
version 2 was launched on July 1, 2009, and extended this functionality to
include national heat maps as a visual means for communicating
Reducing Roadway Fatalities and Increasing Public Awareness through GISBy Brian N. Hilton and Thomas A. Horan
the spatial density of traffic fatalities. Concurrent with the analysis and
development of the national heat maps, the top 100 rural and urban
hot spots were identified. SafeRoadMaps version 3 was launched on
July 1, 2010, and included data for all years that contain georeferenc-
ing information and featured several new user-friendly interfaces for
travelers, policy researchers, and analysts—My Travel, My Community,
My State, and Analysis & Tools. Hot spot analysis was also extended
across both spatial (rural/urban) and temporal (summer/nonsummer)
dimensions.
The SafeRoadMaps site is part of a multiyear collaboration with the
University of Minnesota’s National Center for Excellence in Rural Safety
(CERS). Lee Munnich, the center’s director, noted that “SafeRoadMaps
has provided an invaluable tool for communicating about the issue of
traffic safety and raised national policy awareness to this public health
problem.”
While the site was created for public use, Horan has been ap-
proached by a variety of organizations, such as driver’s education
programs, about creating specialized SafeRoadMaps modules.
Additionally, throughout its development, Horan has briefed James
L. Oberstar, former US representative (Minnesota’s 8th congressional
district) and chairman of the House Transportation and Infrastructure
Committee (2007–2011), who has also championed its use. Though
Horan’s research is novel and unique, he points out that it’s on
the continuum of the work that created the field of public health:
“Epidemiology got its start when there was a cholera outbreak in
London. An intrepid researcher named John Snow mapped the cases
and discovered it was originating from a specific public water pump.
What we’re trying to do is bring that same sensibility—a map, a visual
tool that can help people understand the problem of public safety—
and improve upon it.”
The maps have helped millions understand road conditions and
prevent fatal car accidents.
For more information, contact Thomas A. Horan, PhD, professor, or Brian N. Hilton, PhD, clinical assistant professor, both at the School of Information Systems and Technology, Claremont Graduate University, 130 East Ninth Street, Claremont, California 91711 (phone: 909-621-8209, fax: 909-621-8564, e-mail: [email protected] or [email protected]), or visit www.saferoadmaps.org.
Discover the Power of WhereTransportation professionals rely on NAVTEQ® Maps and Traffic to deliver high-value, comprehensive GIS-T solutions for managing, planning, and maintaining transportation systems.
• NAVTEQ Traffic™ delivers detailed information about road construction, traffic speeds and incidents such as accidents, allowing drivers to make better routing and re-routing decisions.
• NAVTEQ Transport™ data offers detailed road attributes including physical restrictions, legal restrictions, HAZMAT and specific POIs like truck stops
• Point Addressing is points adjusted to the road to provide a precise address location. Point Addressing enables more accurate to-the-door arrival as well as more reliable geocoding for transportation solutions.
For more information, email [email protected].
TransportationTrendsAd_V2.indd 1 5/18/2012 2:20:41 PM
18 Esri News for Transportation Summer 2012
G53189_Transportation_130293.indd 18 7/6/12 1:21 PM

Discover the Power of WhereTransportation professionals rely on NAVTEQ® Maps and Traffic to deliver high-value, comprehensive GIS-T solutions for managing, planning, and maintaining transportation systems.
• NAVTEQ Traffic™ delivers detailed information about road construction, traffic speeds and incidents such as accidents, allowing drivers to make better routing and re-routing decisions.
• NAVTEQ Transport™ data offers detailed road attributes including physical restrictions, legal restrictions, HAZMAT and specific POIs like truck stops
• Point Addressing is points adjusted to the road to provide a precise address location. Point Addressing enables more accurate to-the-door arrival as well as more reliable geocoding for transportation solutions.
For more information, email [email protected].
TransportationTrendsAd_V2.indd 1 5/18/2012 2:20:41 PM
G53189_Transportation_130293.indd 19 7/6/12 1:21 PM

Presorted Standard
US Postage Paid Esri
380 New York Street Redlands, California 92373-8100 usa
ArcGISSM Online… cloud GIS… mobile GIS… They all add up to one conclusion: this is not the year to miss the Esri International User Conference (Esri UC). This is where your ideas come together to shape the future of GIS.
Join us in San Diego, California, to discover the next generation of geospatial technology for your organization. Register online at esri.com/uc.
Get in-depth, hands-on training at preconference seminars July 21–22.
Copyright © 2012 Esri. All rights reserved.
Where ideas are born
Esri International User ConferenceJuly 23–27, 2012 | San Diego Convention Center
E_UC2012_HH0212_inhouse.indd 1 5/24/12 8:49 AM
130293 DUAL13.7M7/12tk
G53189_Transportation_130293.indd 20 7/6/12 1:21 PM
Related Documents