Esri ® Business Analyst ™ Location Analytics for Market Planning and Site Selection Powered by ArcGIS ®

Welcome message from author
This document is posted to help you gain knowledge. Please leave a comment to let me know what you think about it! Share it to your friends and learn new things together.
Transcript
Esri® Business Analyst™
Location Analytics for Market Planning and Site Selection
Powered by ArcGIS®
Reveal the Power of Where
Most business decisions are driven by “where.” Where do my target customers live? Where should I locate my new warehouse or office? Where is my competition? Where can I create new opportunities?
Esri® Business Analyst™ is a scalable system that enables you to answer the where questions. A single solution with robust demographic and business datasets, detailed maps, and advanced spatial analytics, Business Analyst helps you understand lifestyle, purchasing, and consumer spending behaviors. And when combined with your own corporate data, Business Analyst provides you with new insights about your customers, competition, and markets.
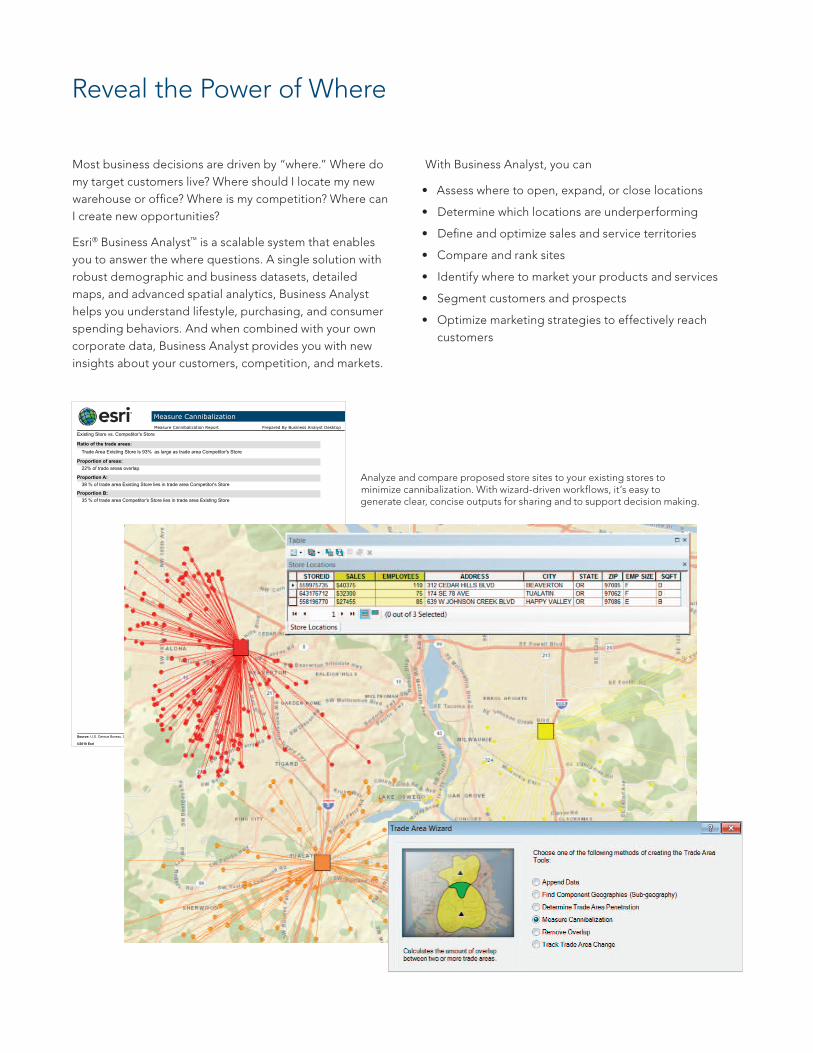
Analyze and compare proposed store sites to your existing stores to minimize cannibalization. With wizard-driven workflows, it’s easy to generate clear, concise outputs for sharing and to support decision making.
With Business Analyst, you can
• Assess where to open, expand, or close locations
• Determine which locations are underperforming
• Define and optimize sales and service territories
• Compare and rank sites
• Identify where to market your products and services
• Segment customers and prospects
• Optimize marketing strategies to effectively reach customers
Measure CannibalizationMeasure Cannibalization Report Prepared By Business Analyst Desktop
Existing Store vs. Competitor's Store
Ratio of the trade areas:Trade Area Existing Store is 93% as large as trade area Competitor's Store
Proportion of areas:22% of trade areas overlap.
Proportion A:38 % of trade area Existing Store lies in trade area Competitor's Store
Proportion B:35 % of trade area Competitor's Store lies in trade area Existing Store
Source: U.S. Census Bureau, Census 2010 Data. Esri forecasts for 2011 and 2016 ©2010 Esri Phone: 888-377-4575 - www.esri.com 06/14/2012 Page 1 of 1
Scale for a Single User or Your Enterprise
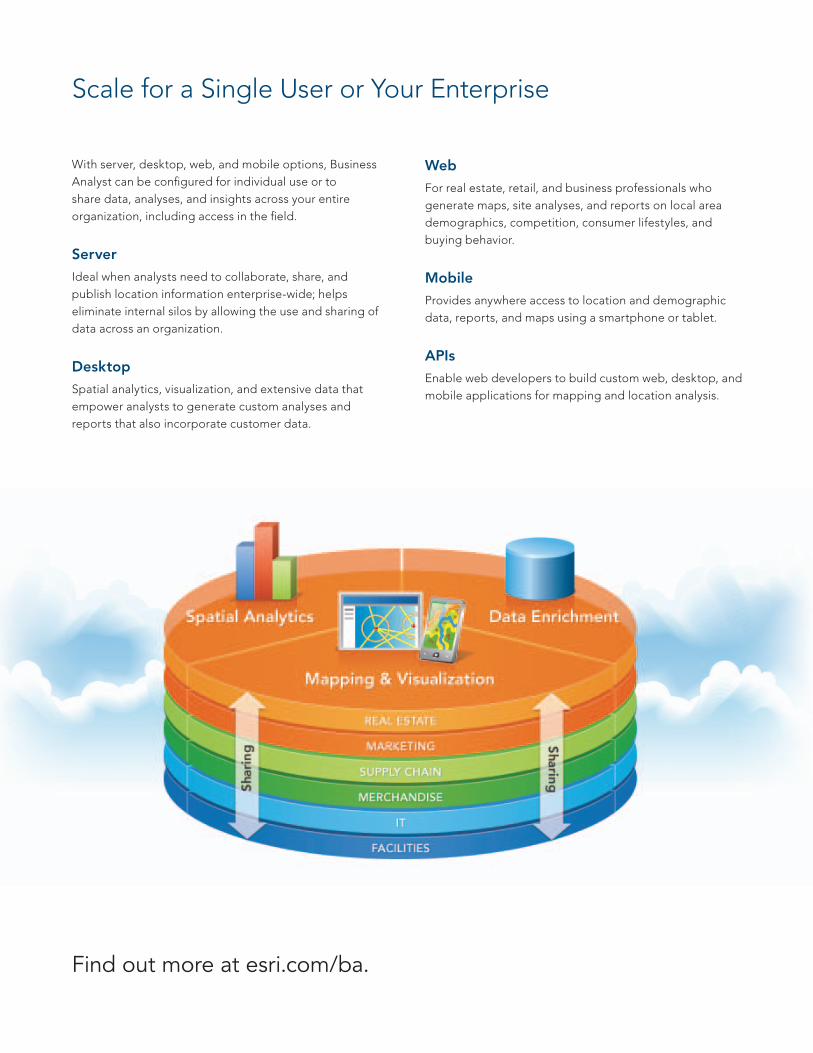
With server, desktop, web, and mobile options, Business Analyst can be configured for individual use or to share data, analyses, and insights across your entire organization, including access in the field.
ServerIdeal when analysts need to collaborate, share, and publish location information enterprise-wide; helps eliminate internal silos by allowing the use and sharing of data across an organization.
DesktopSpatial analytics, visualization, and extensive data that empower analysts to generate custom analyses and reports that also incorporate customer data.
WebFor real estate, retail, and business professionals who generate maps, site analyses, and reports on local area demographics, competition, consumer lifestyles, and buying behavior.
MobileProvides anywhere access to location and demographic data, reports, and maps using a smartphone or tablet.
APIsEnable web developers to build custom web, desktop, and mobile applications for mapping and location analysis.
Find out more at esri.com/ba.
Business Analyst Server
Business Analyst Server enables your organization to manage, share, and publish critical location-related information across the enterprise. Built on a standard IT stack, Business Analyst Server integrates easily with your existing business intelligence (BI), customer relationship management (CRM), financial, supply chain management, and other enterprise systems. It also helps standardize workflows and out-of-the-box web applications for location analytics.
Business Analyst Server
• Provides browser-based access to location-based analyses, queries, reports
• Includes prebuilt workflow templates and capabilities for building custom templates
• Supports cross-platform deployment
• Can be integrated with other business applications
• Reduces software deployment and maintenance costs
Seven of the top 10 US retailers use Business Analyst to help corporate decision makers and regional management: • Determine where to open or close stores or
change their footprint
• Compare costs and projected ROI for different locations
• Assess cannibalization
• Evaluate the impact of competitors
• Monitor sales and key store metrics
• Identify underperforming locations
Using Business Analyst Server adds value to other corporate
datasets by putting key metrics in a spatial context.
For more information, go to esri.com/baserver.
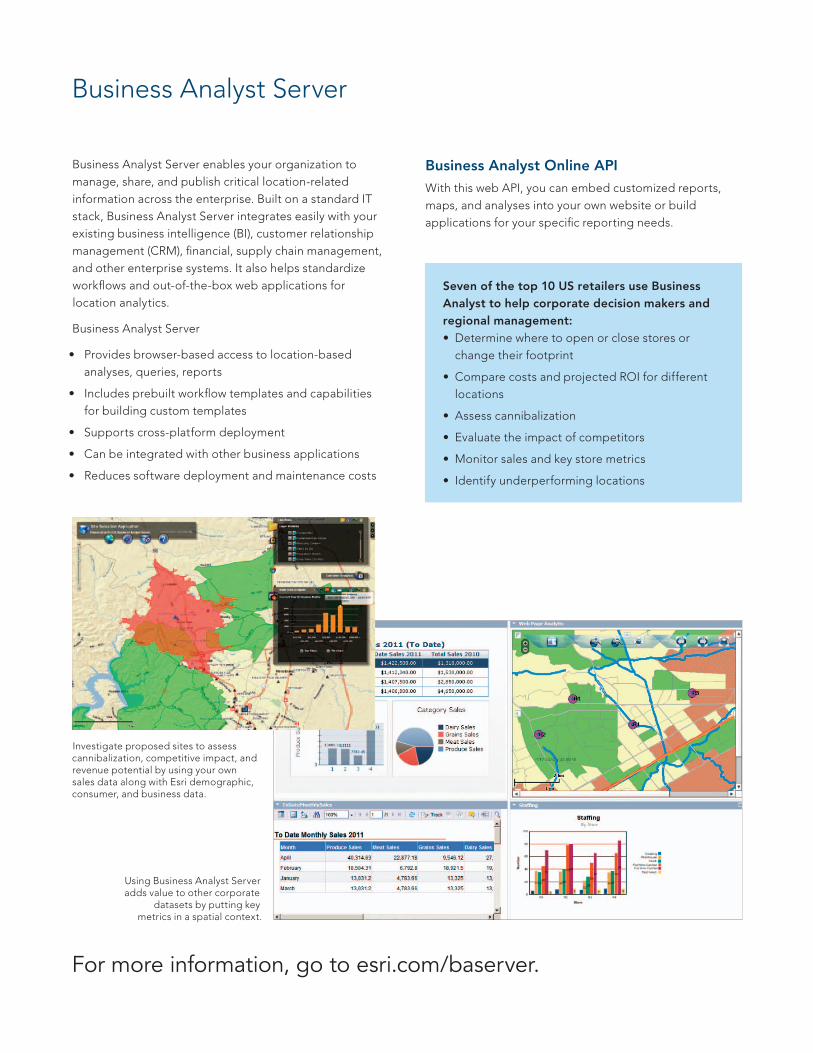
Investigate proposed sites to assess cannibalization, competitive impact, and revenue potential by using your own sales data along with Esri demographic, consumer, and business data.
Business Analyst Online APIWith this web API, you can embed customized reports, maps, and analyses into your own website or build applications for your specific reporting needs.
Business Analyst Desktop
Business Analyst Desktop is the must-have tool for professional analysts who need to understand customers and markets, perform detailed site analyses, assess store network performance, analyze cannibalization, and optimize trade areas or territories.
The software comes with workflow tools and wizards for standard analyses to help you explore different scenarios that improve understanding and decision making. Business Analyst Desktop also provides all the tools needed to develop customer models for advanced location analysis.
Business Analyst Add-InUsers of Esri’s ArcGIS® for Desktop can access Business Analyst demographic, consumer spending, segmentation, and business data through the Business Analyst OnlineSM (BAOSM) Reports Add-in.
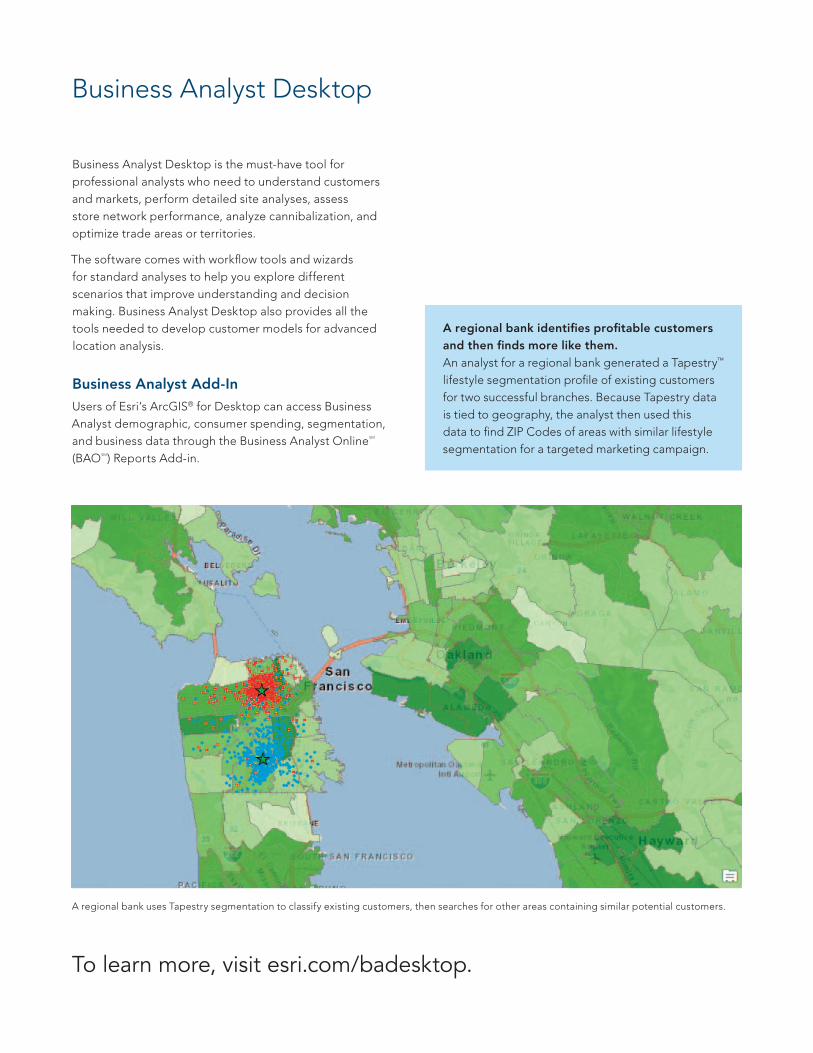
A regional bank identifies profitable customers and then finds more like them.An analyst for a regional bank generated a Tapestry™ lifestyle segmentation profile of existing customers for two successful branches. Because Tapestry data is tied to geography, the analyst then used this data to find ZIP Codes of areas with similar lifestyle segmentation for a targeted marketing campaign.
A regional bank uses Tapestry segmentation to classify existing customers, then searches for other areas containing similar potential customers.
To learn more, visit esri.com/badesktop.
Business Analyst Online
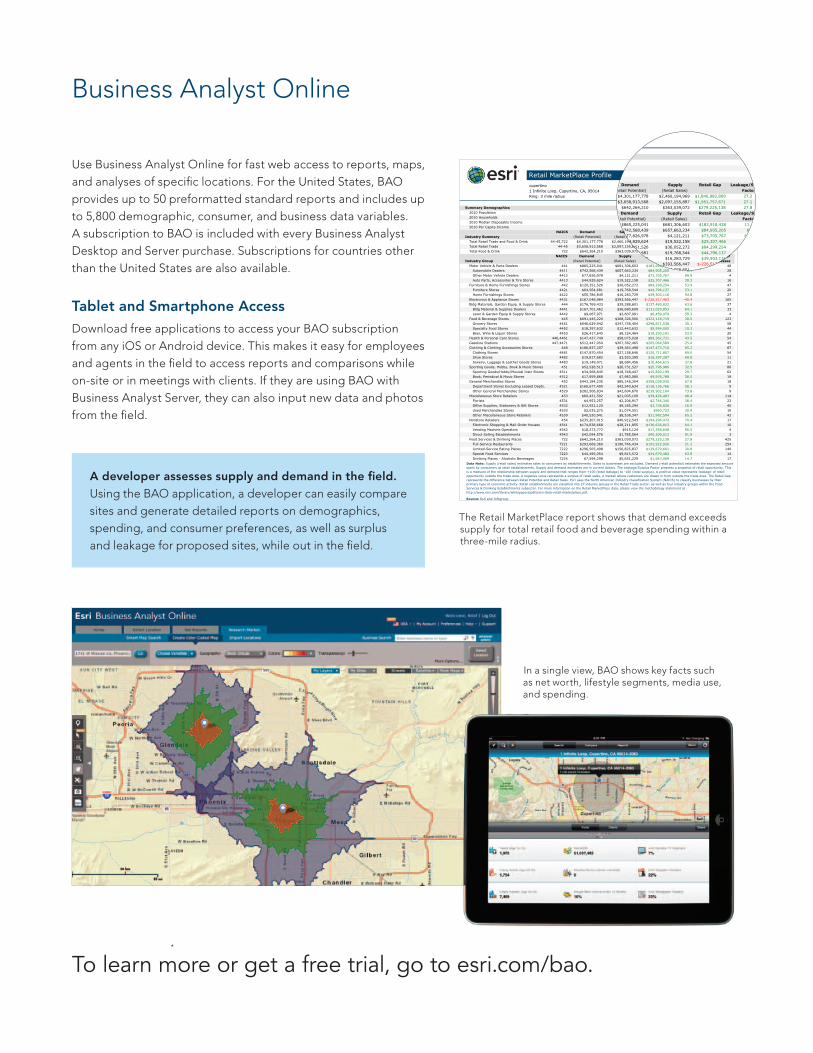
Use Business Analyst Online for fast web access to reports, maps, and analyses of specific locations. For the United States, BAO provides up to 50 preformatted standard reports and includes up to 5,800 demographic, consumer, and business data variables. A subscription to BAO is included with every Business Analyst Desktop and Server purchase. Subscriptions for countries other than the United States are also available.
Tablet and Smartphone AccessDownload free applications to access your BAO subscription from any iOS or Android device. This makes it easy for employees and agents in the field to access reports and comparisons while on-site or in meetings with clients. If they are using BAO with Business Analyst Server, they can also input new data and photos from the field.
*
A developer assesses supply and demand in the field.Using the BAO application, a developer can easily compare sites and generate detailed reports on demographics, spending, and consumer preferences, as well as surplus and leakage for proposed sites, while out in the field.
The Retail MarketPlace report shows that demand exceeds supply for total retail food and beverage spending within a three-mile radius.
In a single view, BAO shows key facts such as net worth, lifestyle segments, media use, and spending.
Retail MarketPlace Profilecupertino1 Infinite Loop, Cupertino, CA, 95014 Latitude: 37.33174Ring: 3 mile radius Longitude: -122.03072
Summary Demographics2010 Population 210,3272010 Households 79,5282010 Median Disposable Income $85,6242010 Per Capita Income $56,857
NAICS Demand Supply Retail Gap Leakage/Surplus Number ofIndustry Summary (Retail Potential) (Retail Sales) Factor Businesses
Total Retail Trade and Food & Drink 44-45,722 $4,301,177,778 $2,460,194,969 $1,840,982,809 27.2 1,260Total Retail Trade 44-45 $3,658,913,568 $2,097,155,897 $1,561,757,671 27.1 835Total Food & Drink 722 $642,264,210 $363,039,072 $279,225,138 27.8 425
NAICS Demand Supply Retail Gap Leakage/Surplus Number ofIndustry Group (Retail Potential) (Retail Sales) Factor Businesses
Motor Vehicle & Parts Dealers 441 $865,225,041 $681,306,603 $183,918,438 11.9 48 Automobile Dealers 4411 $742,568,439 $657,663,234 $84,905,205 6.1 28 Other Motor Vehicle Dealers 4412 $77,826,978 $4,121,211 $73,705,767 89.9 4 Auto Parts, Accessories & Tire Stores 4413 $44,829,624 $19,522,158 $25,307,466 39.3 16Furniture & Home Furnishings Stores 442 $120,351,526 $36,052,272 $84,299,254 53.9 47 Furniture Stores 4421 $64,564,681 $19,768,544 $44,796,137 53.1 20 Home Furnishings Stores 4422 $55,786,845 $16,283,729 $39,503,116 54.8 27Electronics & Appliance Stores 4431 $167,048,984 $393,566,447 $-226,517,463 -40.4 165Bldg Materials, Garden Equip. & Supply Stores 444 $176,769,433 $39,288,601 $137,480,832 63.6 37 Bldg Material & Supplies Dealers 4441 $167,701,462 $36,680,609 $131,020,853 64.1 33 Lawn & Garden Equip & Supply Stores 4442 $9,067,971 $2,607,991 $6,459,979 55.3 4Food & Beverage Stores 445 $691,445,220 $368,326,500 $323,118,719 30.5 123 Grocery Stores 4451 $646,629,942 $347,758,404 $298,871,538 30.1 58 Specialty Food Stores 4452 $18,397,632 $12,443,632 $5,954,000 19.3 44 Beer, Wine & Liquor Stores 4453 $26,417,645 $8,124,464 $18,293,181 53.0 20Health & Personal Care Stores 446,4461 $147,437,749 $58,075,028 $89,362,721 43.5 54Gasoline Stations 447,4471 $512,447,054 $307,382,465 $205,064,589 25.0 45Clothing & Clothing Accessories Stores 448 $186,837,207 $39,363,498 $147,473,710 65.2 87 Clothing Stores 4481 $147,870,454 $27,158,646 $120,711,807 69.0 54 Shoe Stores 4482 $19,817,682 $3,520,395 $16,297,287 69.8 11 Jewelry, Luggage & Leather Goods Stores 4483 $19,149,071 $8,684,456 $10,464,615 37.6 21Sporting Goods, Hobby, Book & Music Stores 451 $52,528,513 $26,731,527 $25,796,986 32.5 80 Sporting Goods/Hobby/Musical Instr Stores 4511 $34,568,645 $18,748,447 $15,820,199 29.7 62 Book, Periodical & Music Stores 4512 $17,959,868 $7,983,080 $9,976,788 38.5 19General Merchandise Stores 452 $443,184,235 $85,145,304 $358,038,930 67.8 18 Department Stores Excluding Leased Depts. 4521 $160,677,400 $42,540,634 $118,136,766 58.1 9 Other General Merchandise Stores 4529 $282,506,834 $42,604,670 $239,902,164 73.8 9Miscellaneous Store Retailers 453 $60,431,592 $21,005,109 $39,426,483 48.4 114 Florists 4531 $4,953,257 $2,206,917 $2,746,340 38.4 22 Office Supplies, Stationery & Gift Stores 4532 $12,922,120 $9,185,294 $3,736,826 16.9 40 Used Merchandise Stores 4533 $2,035,275 $1,074,551 $960,723 30.9 10 Other Miscellaneous Store Retailers 4539 $40,520,941 $8,538,347 $31,982,594 65.2 42Nonstore Retailers 454 $235,207,015 $40,912,543 $194,294,472 70.4 17 Electronic Shopping & Mail-Order Houses 4541 $174,838,668 $38,211,855 $136,626,813 64.1 10 Vending Machine Operators 4542 $18,273,772 $915,124 $17,358,648 90.5 4 Direct Selling Establishments 4543 $42,094,576 $1,785,564 $40,309,012 91.9 3Food Services & Drinking Places 722 $642,264,210 $363,039,072 $279,225,138 27.8 425 Full-Service Restaurants 7221 $293,669,360 $190,746,434 $102,922,926 21.2 254 Limited-Service Eating Places 7222 $296,505,498 $156,825,837 $139,679,661 30.8 140 Special Food Services 7223 $44,495,054 $9,815,572 $34,679,482 63.9 14 Drinking Places - Alcoholic Beverages 7224 $7,594,298 $5,651,229 $1,943,069 14.7 17
Data Note: Supply (retail sales) estimates sales to consumers by establishments. Sales to businesses are excluded. Demand (retail potential) estimates the expected amountspent by consumers at retail establishments. Supply and demand estimates are in current dollars. The Leakage/Surplus Factor presents a snapshot of retail opportunity. Thisis a measure of the relationship between supply and demand that ranges from +100 (total leakage) to -100 (total surplus). A positive value represents 'leakage' of retailopportunity outside the trade area. A negative value represents a surplus of retail sales, a market where customers are drawn in from outside the trade area. The Retail Gaprepresents the difference between Retail Potential and Retail Sales. Esri uses the North American Industry Classification System (NAICS) to classify businesses by theirprimary type of economic activity. Retail establishments are classified into 27 industry groups in the Retail Trade sector, as well as four industry groups within the FoodServices & Drinking Establishments subsector. For more information on the Retail MarketPlace data, please view the methodology statement athttp://www.esri.com/library/whitepapers/pdfs/esri-data-retail-marketplace.pdf.
June 28, 2012
Made with Esri Business Analyst©2012 Esri www.esri.com/ba 800-447-9778 Try it Now! Page 3 of 6
Source: Esri and Infogroup
To learn more or get a free trial, go to esri.com/bao.
Esri US Data and Tapestry Segmentation
U.S. Data
All Business Analyst components are bundled with extensive, industry-leading data and imagery.
Updated DemographicsGet detailed census, current-year estimates, and five-year projections of US population, household, income, age, race, and more. Esri’s demographic projections were proven most accurate in an independent study.
Tapestry SegmentationEsri’s segmentation system classifies US neighborhoods into 65 distinctive segments based on demographic, consumer behavior, and socioeconomic factors.
Consumer Spending and Market PotentialIdentify opportunities using current year total and average spending for retail overall, apparel, entertainment, food, home improvement, insurance, banking, and more. Also learn about consumer lifestyles, preferences, and interests.
Business Locations and Business SummaryThis database provides company name, location, sales, number of employees, and SIC/NAICS classification for more than 12 million US businesses.
Supply and DemandUnderstand surplus and leakage in a given area based on consumer spending vs. availability of various goods and services.
Major Shopping CentersAccess location, size, design, anchor stores, and other critical information for US shopping centers with gross leasable area (GLA) exceeding 225,000 square feet.
Street DataAccess high-quality street data for maps, routing, and drive-time analyses.
Aerial/Satellite ImageryWith high-resolution imagery, you get a real-world view of your project locations.
International Data
Business Analyst and Esri data for countries outside the United States is used by many large multinational corporations. Support location analysis and expansion in your global markets with Esri demographic, consumer spending, shopping center, and other data for many international markets.
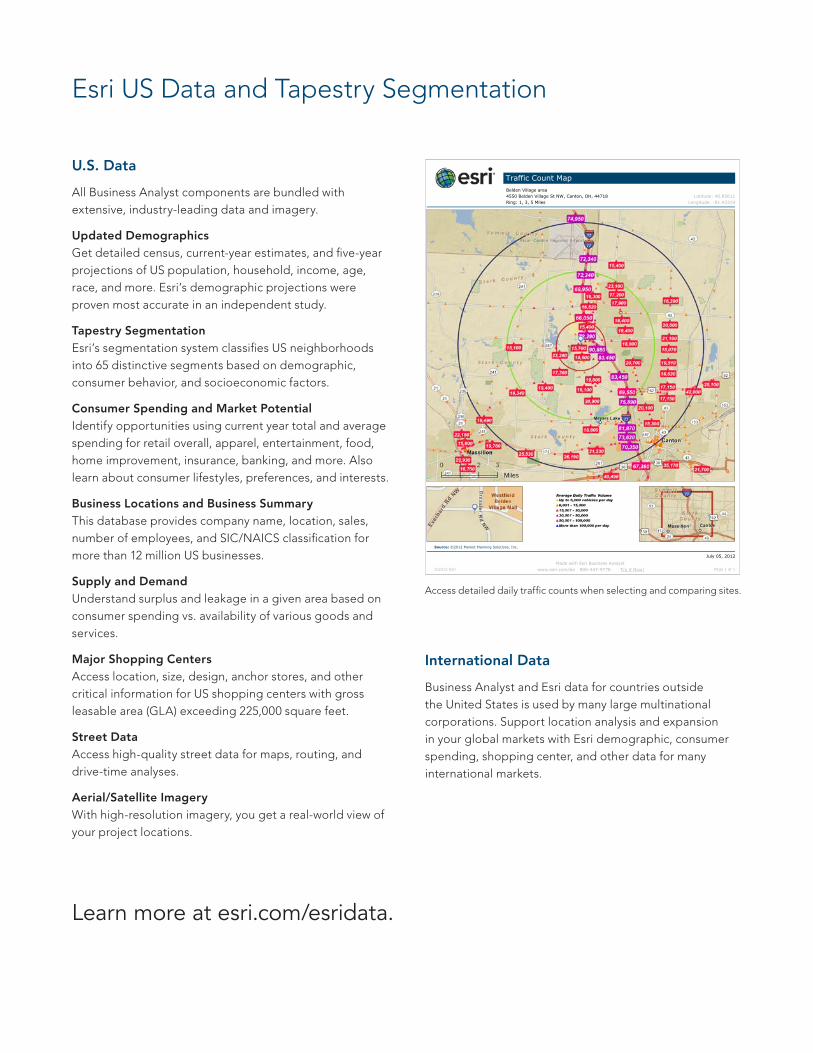
Access detailed daily traffic counts when selecting and comparing sites.
Learn more at esri.com/esridata.
Traffic Count MapBelden Village area4550 Belden Village St NW, Canton, OH, 44718 Latitude: 40.85611Ring: 1, 3, 5 Miles Longitude: -81.43319
July 05, 2012
Made with Esri Business Analyst©2012 Esri www.esri.com/ba 800-447-9778 Try it Now! Page 1 of 1
Source: ©2012 Market Planning Solutions, Inc.

Printed in USA
Contact Esri
380 New York Street Redlands, California 92373-8100 usa
1 800 447 9778 t 909 793 2853 f 909 793 5953 [email protected] esri.com
Offices worldwide esri.com/locations
Esri inspires and enables people to positively impact their future through a deeper, geographic understanding of the changing world around them.
Governments, industry leaders, academics, and nongovernmental
organizations trust us to connect them with the analytic knowledge
they need to make the critical decisions that shape the planet. For
more than 40 years, Esri has cultivated collaborative relationships
with partners who share our commitment to solving earth’s most
pressing challenges with geographic expertise and rational resolve.
Today, we believe that geography is at the heart of a more resilient
and sustainable future. Creating responsible products and solutions
drives our passion for improving quality of life everywhere.
Copyright © 2012 Esri. All rights reserved. Esri, the Esri globe logo, ArcGIS, Business Analyst, Business Analyst Online, BAO, Tapestry, @esri.com, and esri.com are trademarks, service marks, or registered marks of Esri in the United States, the European Community, or certain other jurisdictions. Other companies and products or services mentioned herein may be trademarks, service marks, or registered marks of their respective mark owners.
132118ESRI8/12ek
Related Documents