International Workplace Ltd | 110 Hills Road | Cambridge | CB2 1LQ Tel: 0871 777 8881 | Fax: 0871 777 8882 | www.internationalworkplace.com 1 Glenair Compliance with the Energy Savings Opportunity Scheme Prepared for: Gordon Hartley Glenair 40 Lower Oakham Way Oakham Business Park Mansfield Notts NG18 5BY Prepared by: Matthew Watkins Environmental Consultant International Workplace Issue date: May 2015 ESOS Report

Welcome message from author
This document is posted to help you gain knowledge. Please leave a comment to let me know what you think about it! Share it to your friends and learn new things together.
Transcript

International Workplace Ltd | 110 Hills Road | Cambridge | CB2 1LQ Tel: 0871 777 8881 | Fax: 0871 777 8882 | www.internationalworkplace.com
1
Glenair Compliance with the Energy Savings Opportunity Scheme Prepared for: Gordon Hartley Glenair 40 Lower Oakham Way
Oakham Business Park Mansfield Notts NG18 5BY
Prepared by: Matthew Watkins Environmental Consultant
International Workplace
Issue date: May 2015
ESOS Report
International Workplace Ltd | 110 Hills Road | Cambridge | CB2 1LQ Tel: 0871 777 8881 | Fax: 0871 777 8882 | www.internationalworkplace.com
2
Contents
Executive Summary ......................................................................... 3
ESOS ...................................................................................................................... 5
STATIC ENERGY USE PROFILES ........................................................................ 6
By energy source/location ............................................................................................................ 6
By activity ........................................................................................................................................ 7
CHRONOLOGICAL ENERGY USE PROFILES ..................................................... 9
NORMALISING FACTORS ................................................................................. 10
Phase 1 (2, 2.5) ............................................................................................................................. 12
Phase 3 ........................................................................................................................................... 12
Phase 4&5 ...................................................................................................................................... 12
EMO REGISTER .................................................................................................. 13
Reduced base-load ....................................................................................................................... 13
Energy awareness ........................................................................................................................ 13
Monitoring and targeting ........................................................................................................... 13
Reduced base-load ....................................................................................................................... 13
Energy awareness ........................................................................................................................ 14
Monitoring and targeting ........................................................................................................... 14
Energy Contracts ......................................................................................................................... 14
AC and heating control ............................................................................................................... 17
Solar PV .......................................................................................................................................... 19
International Workplace Ltd | 110 Hills Road | Cambridge | CB2 1LQ Tel: 0871 777 8881 | Fax: 0871 777 8882 | www.internationalworkplace.com
3
Executive Summary
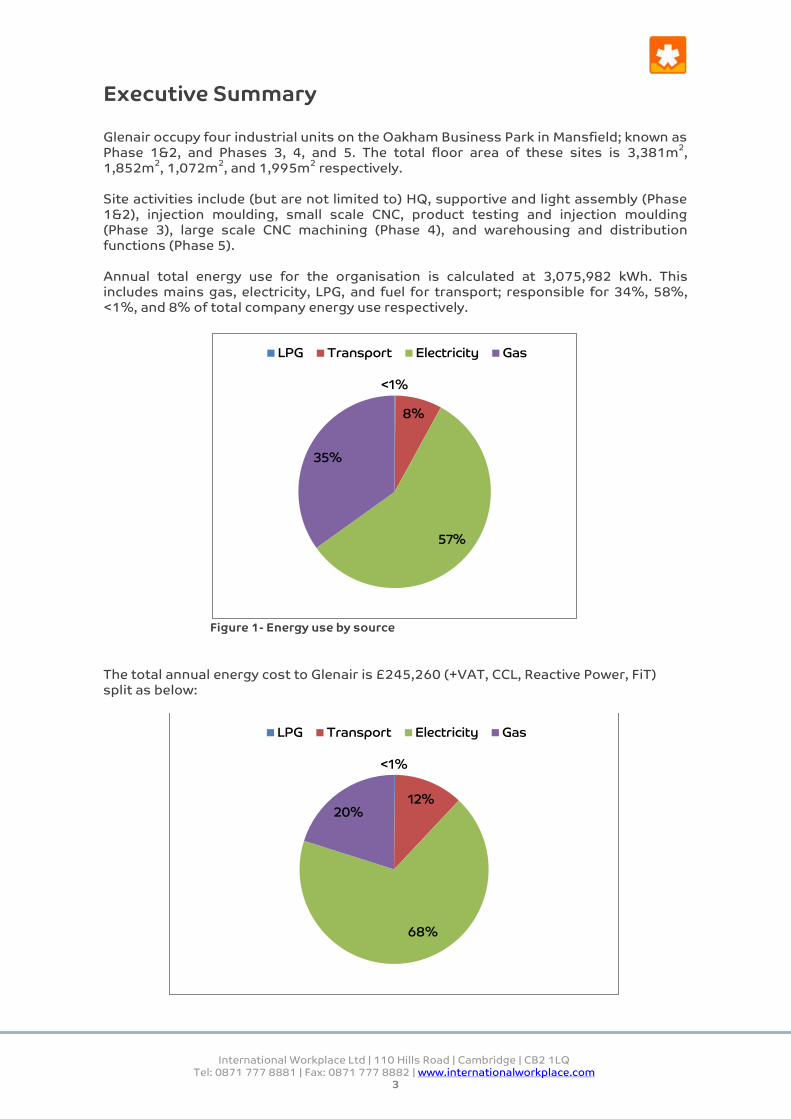
Glenair occupy four industrial units on the Oakham Business Park in Mansfield; known as Phase 1&2, and Phases 3, 4, and 5. The total floor area of these sites is 3,381m
2,
1,852m2, 1,072m
2, and 1,995m
2 respectively.
Site activities include (but are not limited to) HQ, supportive and light assembly (Phase 1&2), injection moulding, small scale CNC, product testing and injection moulding (Phase 3), large scale CNC machining (Phase 4), and warehousing and distribution functions (Phase 5). Annual total energy use for the organisation is calculated at 3,075,982 kWh. This includes mains gas, electricity, LPG, and fuel for transport; responsible for 34%, 58%, <1%, and 8% of total company energy use respectively.
Figure 1- Energy use by source
The total annual energy cost to Glenair is £245,260 (+VAT, CCL, Reactive Power, FiT) split as below:
<1%
8%
57%
35%
LPG Transport Electricity Gas
<1%
12%
68%
20%
LPG Transport Electricity Gas
International Workplace Ltd | 110 Hills Road | Cambridge | CB2 1LQ Tel: 0871 777 8881 | Fax: 0871 777 8882 | www.internationalworkplace.com
4
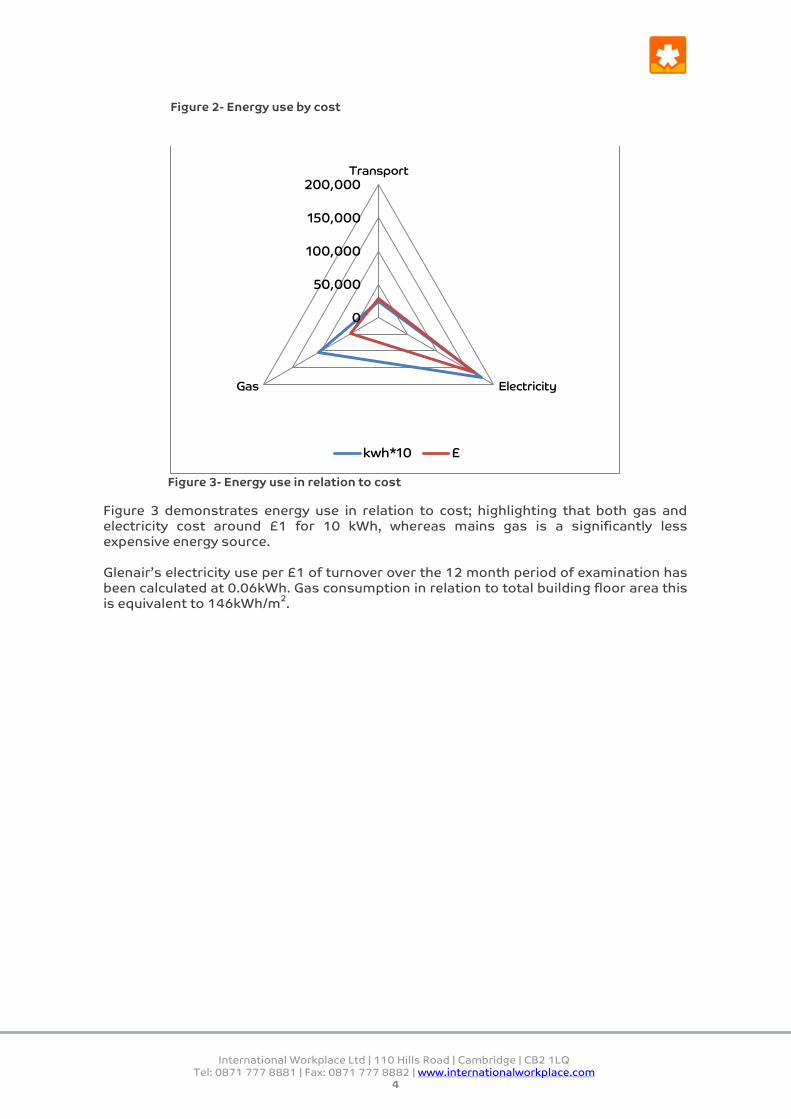
Figure 2- Energy use by cost
Figure 3- Energy use in relation to cost
Figure 3 demonstrates energy use in relation to cost; highlighting that both gas and electricity cost around £1 for 10 kWh, whereas mains gas is a significantly less expensive energy source. Glenair’s electricity use per £1 of turnover over the 12 month period of examination has been calculated at 0.06kWh. Gas consumption in relation to total building floor area this is equivalent to 146kWh/m
2.
0
50,000
100,000
150,000
200,000Transport
ElectricityGas
kwh*10 £

International Workplace Ltd | 110 Hills Road | Cambridge | CB2 1LQ Tel: 0871 777 8881 | Fax: 0871 777 8882 | www.internationalworkplace.com
5
Table 1.0 below summarises the Energy Saving Opportunities anticipated as a result of this project to yield the most significant financial and energy savings.
Table 1.0
EMO Capital cost
Cost savings ROI NPV
Reduced base-load
Minimal 16,647 (at 75% base-load reduction)
0 years £82,000 (5 year lifetime)
Energy awareness
£2,000 £12,263 0.2 years £58,406 (5 year lifetime)
Monitoring and targeting
Savings included in Energy Awareness above.
Energy Contracts
£0 £10,656 0 years £21,153 (2 year lifetime)
Lighting Upgrade Phase 4
£22,140 £2,336 9.5 years £-66 (8 year lamp lifetime)
AC & Heating control
£0 £8,435 0 years £41,550 (5 year lifetime)
Solar PV £500,000 £41,361
12.1 £285,340 (20 year lifetime)
Further non-defined energy efficiency measures
Further investigation required in order to quantify savings from these measures
ESOS ESOS is mandatory for UK organisations with over 250 employees, or which have an annual turnover of 50m Euros and a balance sheet greater than 43m Euros. Organisations included in the scope of ESOS will be those that meet these criteria on 31 December 2014. The scheme is estimated to lead to £1.6bn net benefits to the UK, with the majority of these being directly felt by businesses as a result of energy savings. DECC estimates that the average cost of ESOS will be £17,000 but that it will generate benefits to the average business of at least £56,000. ESOS Energy Audits have the potential to increase businesses profitability and competitiveness by identifying cost-effective savings which, if implemented, will improve energy efficiency.

International Workplace Ltd | 110 Hills Road | Cambridge | CB2 1LQ Tel: 0871 777 8881 | Fax: 0871 777 8882 | www.internationalworkplace.com
6
ESOS only affects UK business; however similar programmes will be launched in other EU member states under the EU Energy Efficiency Directive. It was determined that Glenair operations in Europe will not meet the entry criteria for inclusion in ESOS equivalent programmes implemented in other EU member states. Organisations included within ESOS:
• Need to measure total energy consumption (including buildings, transport and any industrial processes).
• At least 90% of total energy consumption must be covered by: ESOS compliant energy audits, Display Energy Certificates (DECs), Green Deal Assessments, or an ISO 50001 accredited energy management system.
• Energy auditing activities dating back to 2011 may be used as long as it meets the minimum ESOS auditing criteria.
• ESOS assessments must be conducted or reviewed by a qualified ESOS Lead Assessor.
• The ESOS report must be reviewed by a board level director.
• The organisation must notify the Environment Agency of compliance with the scheme and maintain a compliance pack demonstrating the ESOS activities carried out (to be presented upon request).
• Submit ESOS returns on 5 December. ESOS will work on four-yearly cycles following the initial implementation of the regulations so the next compliance period will be from 2015-2019 and so forth.
Static Energy use profiles
By energy source/location
Table 2 below details Glenair’s estimated annual energy consumption together with associated spend, based on the period 01/01/2014 - 31/12/2014.
Table 2- Energy use by source and spend
Source kWh £ % total (kWh)
Electricity (P1,2,2.5) 716,661 65,268.58 27% Electricity (P3) 531,237 49,121 20% Electricity (P4) 470,183 45,342 18% Electricity (P5) 67,830 6,783 3%
Gas (P1,2) 340,016 11,343 5% Gas (P3) 216,818 8,258 3% Gas (P4) 279,621 20,487 9% Gas (P5) 213,465 9,233 3%
LPG 4,080 390 0% Fuel card 180,229 7,050 3% Grey fleet 55,842 21,985 9%
Total 3,075,981.99 245,260.04 100%

International Workplace Ltd | 110 Hills Road | Cambridge | CB2 1LQ Tel: 0871 777 8881 | Fax: 0871 777 8882 | www.internationalworkplace.com
7
Figure 4 below presents electricity and gas consumption by Phase as a proportion of total consumption. It can be seen that most of Glenair’s energy use occurs in Phase 1,2,2.5.
Figure 4- Electricity and gas use by Phase
By activity
Phase 1 activity summary
Activities undertaken in Phase 1(2 & 2,5) include office and administration, IT (including a server room), design, light assembly work (including fibre optics, and pure air equipment, component testing, and storage. Auxiliary energy uses include production of compressed air and HVAC equipment.
17%
20%
6%
24% 1%
1% 6%
12%
13%
Electricity use Phase 1
Lighting AC
IT Process equipment
Kitchen Heat
Compressed air Main ventilation & extract
Unaccounted
32%
21%
27%
20%
Gas Use
Phase 1,2,2.5 Phase 3 Phase 4 Phase 5
40%
30%
26%
4%
Electricity use
Phase 1,2,2.5 Phase 3 Phase 4 Phase 5
International Workplace Ltd | 110 Hills Road | Cambridge | CB2 1LQ Tel: 0871 777 8881 | Fax: 0871 777 8882 | www.internationalworkplace.com
8
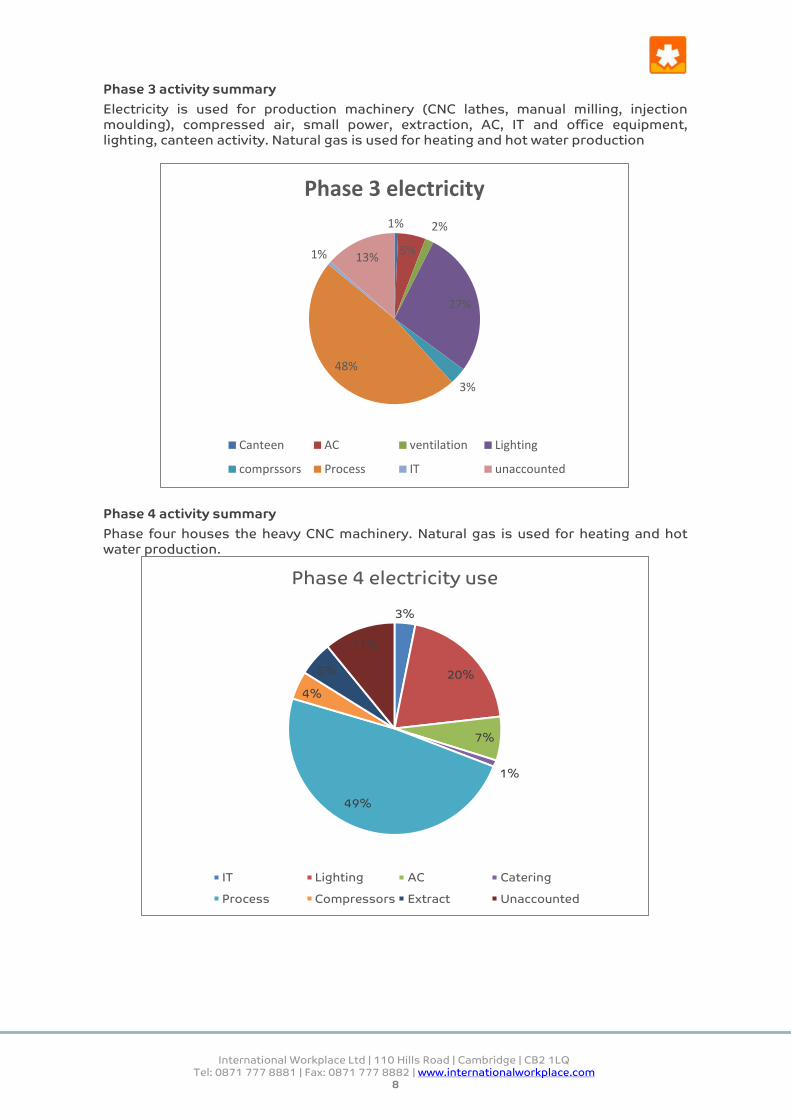
Phase 3 activity summary
Electricity is used for production machinery (CNC lathes, manual milling, injection moulding), compressed air, small power, extraction, AC, IT and office equipment, lighting, canteen activity. Natural gas is used for heating and hot water production
Phase 4 activity summary
Phase four houses the heavy CNC machinery. Natural gas is used for heating and hot water production.
1%
5%
2%
27%
3%
48%
1% 13%
Phase 3 electricity
Canteen AC ventilation Lighting
comprssors Process IT unaccounted
3%
20%
7%
1%
49%
4%
5%
11%
Phase 4 electricity use
IT Lighting AC Catering
Process Compressors Extract Unaccounted

International Workplace Ltd | 110 Hills Road | Cambridge | CB2 1LQ Tel: 0871 777 8881 | Fax: 0871 777 8882 | www.internationalworkplace.com
9
Phase 5 activity summary
Electricity is used for AC, lighting, FLT recharge, compressors, and some light assembly activities, canteen, IT and office equipment. Natural gas is used for heating and hot water production.
(The above profiles are based largely on site observation of rating plates, auditor experience and sparse direct measurement; they are as accurate as possible given the constraints of the project. We recommend sub-metering as a means of gathering data with increased accuracy in future).
Chronological energy use profiles
Table 3- Annual energy use profiles (by month)
Jan Feb March April May June July Aug Sept Oct Nov Dec
Electricity
(P1,2)
69274 62409 58755 53536 55080 58540 70717 57068 59274 55686 52893 63429
Electricity
(P3)
46679 40945 44799 42953 40441 44188 47936 47394 46853 44551 42249 42249
Electricity
(P4)
32593 46951 36949 41070 43244 35150 45743 33590 37994 41347 38854 36698
Electricity
(P5)
5653 5653 5653 5653 5653 5653
5653 5653 5653 5653 5653 5653
Gas
(P1,2)
58464 55904 40391 37185 12164 1172 1651 3025 4223 20366 42889 74276
Gas (P3) 64683 59562 23090 6163 4974 1729 851 281 2900 18456 34129 63003
Gas (P4) 23302 23302 23302 23302 23302 23302 23302 23302 23302 23302 23302 23302
Gas (P5) 17789 17789 17789 17789 17789 17789 17789 17789 17789 17789 17789 17789
Total
34%
13%
2%
11%
16%
24%
Phase 5 electricity use
Lighting
IT
compressor
Process
AC
Unaccounted

International Workplace Ltd | 110 Hills Road | Cambridge | CB2 1LQ Tel: 0871 777 8881 | Fax: 0871 777 8882 | www.internationalworkplace.com
10
Figure 5- Electricity use by month
Figure 6- Gas use by month
As anticipated, gas use is almost zero in the summer months; meaning that the site heating is reasonably well adjusted in terms of thermostat setting.
Normalising factors Table 4- Heating Degree days and turnover by month
Jan Feb March Apr May June July Aug Sept Oct Nov Dec
HDD (15.5
oC)
322 280 254 167 113 81 54 56 41 123 188 263
Turnover
£2,239,620
£2,318,729
£3,111,036
£1,934,147
£2,023,993
£1,879,066
£2,504,724
£3,311,272
£2,503,503
£2,153,849
£2,122,218
£1,832,036
0
10000
20000
30000
40000
50000
60000
70000
80000
Jan Feb March April May June July Aug Sept Oct Nov Dec
Phase 1,2,2.5 Phase 3 Phase 4
0
10000
20000
30000
40000
50000
60000
70000
80000
Jan Feb March April May June July Aug Sept Oct Nov Dec
Phase 1,2,2.5 Phase 3

International Workplace Ltd | 110 Hills Road | Cambridge | CB2 1LQ Tel: 0871 777 8881 | Fax: 0871 777 8882 | www.internationalworkplace.com
11
Figure 7- kWh gas use/HDD (Heating Degree Day)
Figure 8- kWh electricity use/£1 turnover
Figure 9 shows that use of heating in comparison to exterior temperature is least efficient over the winter months - with heating being relatively well controlled over the summer. Electricity use per £1 of turnover varies throughout the year with no clear discernible chronological pattern; however it should be noted that energy efficiency in relation to turnover is greatest when turnover is high - demonstrating the high base-load of installed equipment. Building energy use per m
2 floor area is variable through the different Phases at Glenair
based on the heterogonous site activities and is therefore not useful to analyse. Gas use
in Phases 1 and 2 are in accordance with what would be expected, however gas use in Phase 4 is over twice what would be anticipated, potentially due to significant consumption from braising equipment.
-
100.00
200.00
300.00
400.00
500.00
600.00
Jan Feb March April May June July Aug Sept Oct Nov Dec
kWh/HDD
0.00
0.01
0.02
0.03
0.04
0.05
0.06
0.07
0.08
0.09
Jan Feb March April May June July Aug Sept Oct Nov Dec
kWh/£

International Workplace Ltd | 110 Hills Road | Cambridge | CB2 1LQ Tel: 0871 777 8881 | Fax: 0871 777 8882 | www.internationalworkplace.com
12
Figure 9- Electricity and gas use per m
2 of floor area in comparison to benchmarks
Power Factor and Base-load consumption
Phase 1 (2, 2.5)
Phase one has a base-load of between 46-58kW. 5.8-8.6% of monthly energy use on Sundays, averaging 51,600kWh per annum, at an annual cost of £9,441. Power factor of Phase 1 was not available at the time of this review.
Phase 3
Phase three has a base load of between 22-36kW. 5.4-8% of monthly energy use on Sundays, averaging 35,593kWh per annum, at an annual cost of £5,551. Power factor during the 12 month study period varied from 0.958907-1.000000; meaning that PF correction is functioning well and that there is no scope for reducing electricity bills through further improvement.
Phase 4&5
No half hourly electricity consumption reports are currently available for Phase 4&5.
0
50
100
150
200
250
300
350
400
450
500
Phase 1 Phase 3 Phase 4
gas/m2 elect/m2 gas benchmark

International Workplace Ltd | 110 Hills Road | Cambridge | CB2 1LQ Tel: 0871 777 8881 | Fax: 0871 777 8882 | www.internationalworkplace.com
13
EMO Register
EMO Capital cost
Cost savings ROI NPV
Reduced base-load
Minimal 16,647 (at 75% base-load reduction)
0 years £82,000 (5 year lifetime)
Energy awareness
£2,000 £12,263 0.2 years £58,406 (5 year lifetime)
Monitoring and targeting
Savings included in Energy Awareness above.
Energy Contracts
£0 £10,656 0 years £21,153 (2 year lifetime)
Lighting Upgrade Phase 4
£22,140 £2,336 9.5 years £-66 (8 year lamp lifetime)
AC & Heating control
£0 £8,435 0 years £41,550 (5 year lifetime)
Solar PV £500,000 £41,361
12.1 £285,340 (20 year lifetime)
Further non-defined energy efficiency measures
Further investigation required in order to quantify savings from these measures
(NPV calculated at a rate of 0.5% in line with that of the bank of England)
Reduced base-load
Base-load energy consumption can be significant at between 46-58kW (Phase 1) and between 22-36kW (Phase 3). Reducing this offers significant potential for electricity cost reduction. This base-load results in consumption of 126,533kWh and 70,567kWh of electricity consumption in Phase 1 and Phase 3 respectively between 20:00 and 04.00, and a financial cost of £9,441 and £5,551 (Monday to Friday). Electricity use on Sundays in Phase 1 and Phase 3 constitutes 5.4-7.2% of total electricity consumption; equating to 87,192kWh and an annual cost of £7,204.
Previous surveys of items left turned on overnight around the Glenair sites has revealed significant scope for improvement, with monitors, computers, ovens, extraction, lighting and other equipment turned on when not in use. General staff awareness and motivation is one potential cause of this increased electricity base-load, however a further solution would be to designate one or more environmental champions who would have responsibility for ensuring all equipment is turned off when not required. If required this could be incentivised by the same programme used to encourage first aiders and other increases in staff responsibility level. Alternatively, responsibility could be assigned to the site night security guard for

International Workplace Ltd | 110 Hills Road | Cambridge | CB2 1LQ Tel: 0871 777 8881 | Fax: 0871 777 8882 | www.internationalworkplace.com
14
turning off equipment. The total out of hours consumption at Phase 1 and Phase 3 amounts to £22,196 in electricity. Data showing base-load consumption at Phase 4 and Phase 5 was not available at the time of this review, however further investigation may yield equivalent potential savings.
Figure 10-Data Logging from overmoulding machine Phase 4
These findings from half hourly billing are reinforced by data collection on-site. A data logger was used on one over-moulding machine in Phase 3 which recorded out of hours consumption (18:00-06:00) of 1.3kW. This machine is therefore costing an estimated £351 per annum to leave turned on at night when not required.
Energy awareness
Once annual resource consumption and spend has been determined, work with colleagues and other building users to achieve target reductions. The Carbon Trust states that savings of between 5% and 10% can be realised through a successful awareness campaign. How the message is communicated depends on a range of variables but it will need to be well planned and consider what support and resources might be needed, the current situation, the target audience, the reduction targets, and possible message and communication channels. It is recognised that this may be challenging in the setting of Glenair. The new IEMA Working with Environmental Sustainability, Managing with Environmental Sustainability, and Leading with Environmental Sustainability courses offer environmental training for the non-specialist and could potentially assist with employee engagement. At a 5% total consumption saving; this would equate to 141,792kWh and £10,792. Assuming that appropriate training may be implemented for a cost of £2,000; this would make an extremely attractive investment.
Monitoring and targeting
Energy monitoring and target setting will not in itself achieve savings but taking regular meter readings will enable the identification of unwanted peaks in energy use. It is
important to collect accurate consumption data so that what it is that’s driving your consumption can be determined, realistic reduction targets can be set and the success of any efficiency measures can be quantified. Reduction targets should consider attitudinal and behavioural change as well as the impact that any physical measures might have.
Energy Contracts
Gas contract prices are highly variable between Phases. Phase 4 has one contract with Npower with a unit has a rate of 7.22p/kWh and a standing charge of £74.47 per ¼. The Southern Electric contracts for Phases 1 & 3 is priced at 2.504p/kWh with a monthly
International Workplace Ltd | 110 Hills Road | Cambridge | CB2 1LQ Tel: 0871 777 8881 | Fax: 0871 777 8882 | www.internationalworkplace.com
15
charge of £235.75, the pricing of Phase 5 contracts was not known at the time of this review. The 2.504p/kWh rate is a good price for mains gas, however the rate of 7.22p/kWh (even with the lower standing charges) is too high. Based on current annual consumption on this contract of 279,621kWh at a current annual cost of (£20,487 + CCL + VAT), savings of £10,656 (+CCL +VAT) would be generated by switching to the same SE contract as the other Phase buildings. The electricity contract for Phase 1 is with EDF Energy and is charged at £0.089078p/kWh (Day) and £0.060145p/kWh (Night), with a standing charge of £0.907685p/Day. Further charges include an availability charge of £1.16186p/kWh and a reactive power charge of £0.00159p/KVArh. Electricity for Phase 3 is provided by Npower at a cost of £0.095040 (Day) and £0.062300 (Night), with further charges for availability and reactive power.
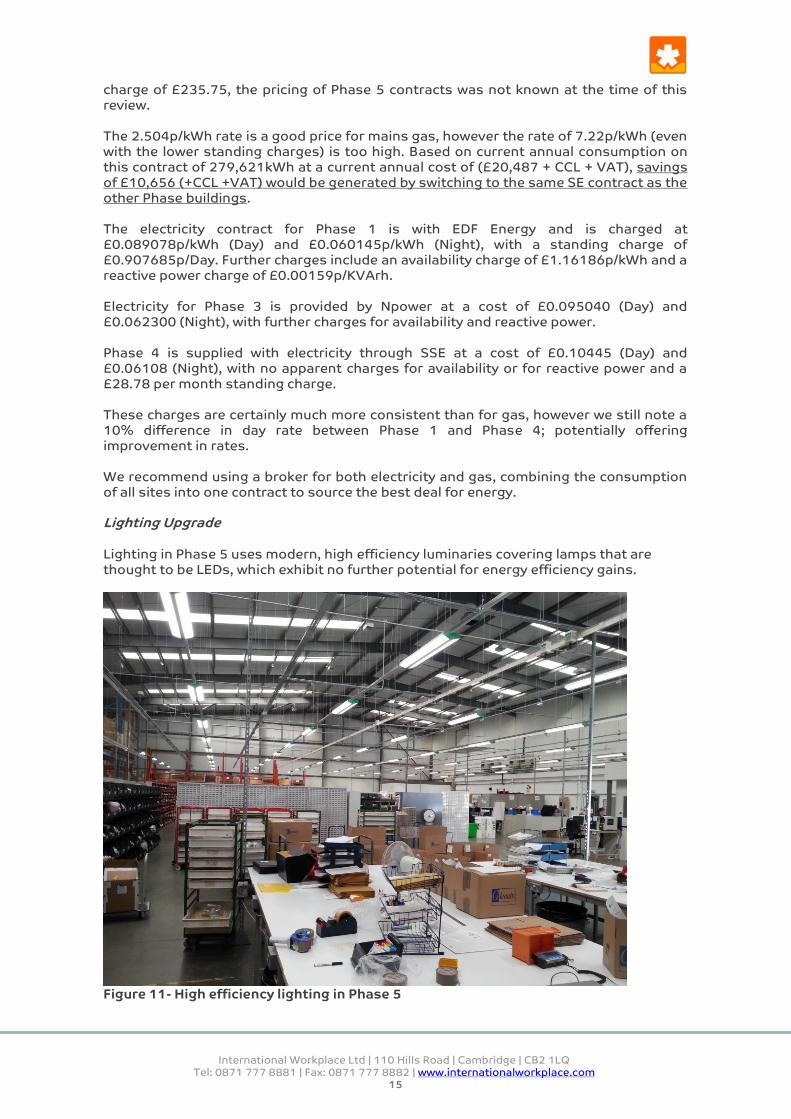
Phase 4 is supplied with electricity through SSE at a cost of £0.10445 (Day) and £0.06108 (Night), with no apparent charges for availability or for reactive power and a £28.78 per month standing charge. These charges are certainly much more consistent than for gas, however we still note a 10% difference in day rate between Phase 1 and Phase 4; potentially offering improvement in rates. We recommend using a broker for both electricity and gas, combining the consumption of all sites into one contract to source the best deal for energy. Lighting Upgrade Lighting in Phase 5 uses modern, high efficiency luminaries covering lamps that are thought to be LEDs, which exhibit no further potential for energy efficiency gains.
Figure 11- High efficiency lighting in Phase 5
International Workplace Ltd | 110 Hills Road | Cambridge | CB2 1LQ Tel: 0871 777 8881 | Fax: 0871 777 8882 | www.internationalworkplace.com
16
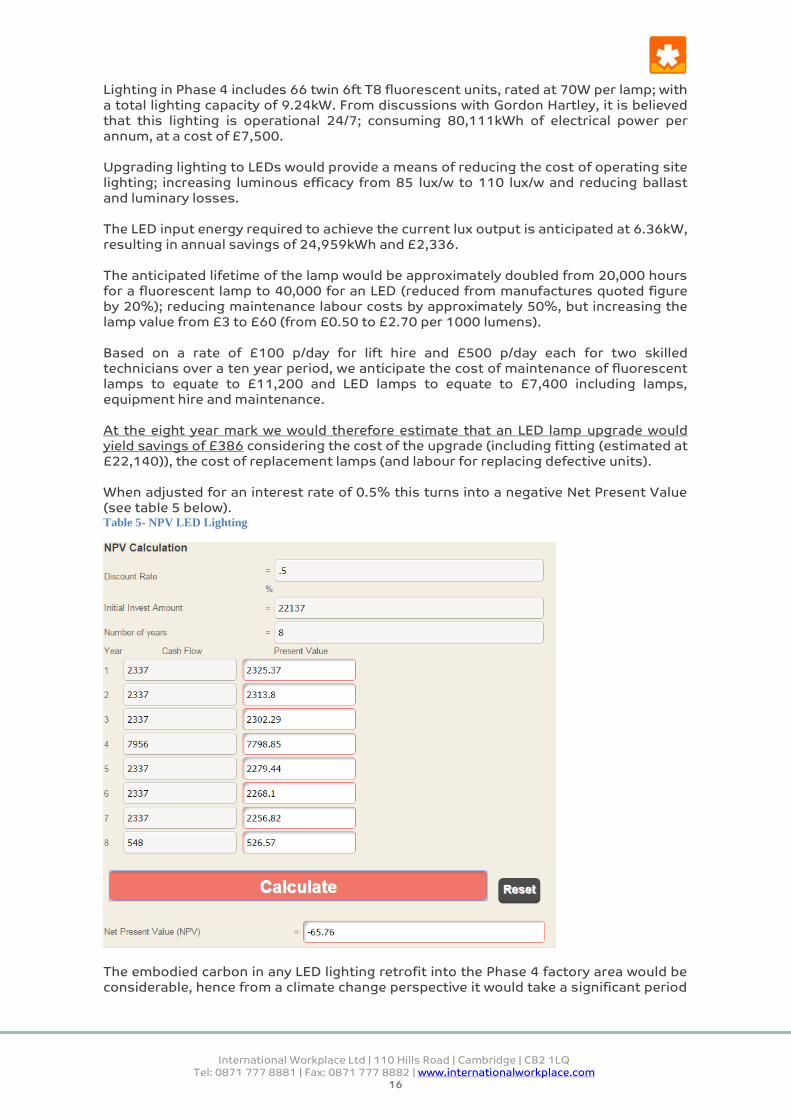
Lighting in Phase 4 includes 66 twin 6ft T8 fluorescent units, rated at 70W per lamp; with a total lighting capacity of 9.24kW. From discussions with Gordon Hartley, it is believed that this lighting is operational 24/7; consuming 80,111kWh of electrical power per annum, at a cost of £7,500. Upgrading lighting to LEDs would provide a means of reducing the cost of operating site lighting; increasing luminous efficacy from 85 lux/w to 110 lux/w and reducing ballast and luminary losses. The LED input energy required to achieve the current lux output is anticipated at 6.36kW, resulting in annual savings of 24,959kWh and £2,336. The anticipated lifetime of the lamp would be approximately doubled from 20,000 hours for a fluorescent lamp to 40,000 for an LED (reduced from manufactures quoted figure by 20%); reducing maintenance labour costs by approximately 50%, but increasing the lamp value from £3 to £60 (from £0.50 to £2.70 per 1000 lumens).
Based on a rate of £100 p/day for lift hire and £500 p/day each for two skilled technicians over a ten year period, we anticipate the cost of maintenance of fluorescent lamps to equate to £11,200 and LED lamps to equate to £7,400 including lamps, equipment hire and maintenance. At the eight year mark we would therefore estimate that an LED lamp upgrade would yield savings of £386 considering the cost of the upgrade (including fitting (estimated at £22,140)), the cost of replacement lamps (and labour for replacing defective units). When adjusted for an interest rate of 0.5% this turns into a negative Net Present Value (see table 5 below). Table 5- NPV LED Lighting
The embodied carbon in any LED lighting retrofit into the Phase 4 factory area would be considerable, hence from a climate change perspective it would take a significant period

International Workplace Ltd | 110 Hills Road | Cambridge | CB2 1LQ Tel: 0871 777 8881 | Fax: 0871 777 8882 | www.internationalworkplace.com
17
of time to offset this through operation of the new system, however this report focuses solely on energy and financial costs. Phases 1,2, and 3 would also benefit from LED lighting upgrade, however returns would be lower for areas without 24 hour use.
Figure 12- T8 Lighting in Phase 3
AC and heating control
Glenair has invested in multiple AC units over the past two years. In Phase 4, there are 14 stand-alone systems with split exterior and interior units. They have a combined input of 20.71kW for cooling and 22.63kW for heating. There are currently no policies in place to restrict the use of these units; reducing overheating/overcooling and concurrent operation of building gas fired heating and electric cooling systems. This setup is potentially extremely inefficient. AC in other Phases includes a further 83 split units. Based on extrapolating the
researched kW consumption of devices in Phase 4; we believe that the remaining systems to have an input of approximately 123kw for cooling and 134kw for heating.

International Workplace Ltd | 110 Hills Road | Cambridge | CB2 1LQ Tel: 0871 777 8881 | Fax: 0871 777 8882 | www.internationalworkplace.com
18
Figure 13 AC Units in Phase 5
Estimated annual consumption of this system operation over all Phases of operations is 225,266kWh and an annual cost of £21,087 when operating at 19
oC (as anecdotal
evidence indicates). By changing all operations to use AC at 20.5oC instead; savings of
£8,435 could be generated through reduced use. This may entail significant behavioural change (and assumes current operating temperatures as detailed above, cost reductions would be less significant for systems that currently use a higher set-point). Gas fired heating
Phase 5 uses an Ideal Imax W60 boiler; this is a modern high efficiency model that functions at 89.1% efficiency. Phase 3 uses a Remeha Gas 1000 boiler and Phase 4 uses an Ideal Mexico Super 2 unit; neither of which are condensing units and will function at 70-80% energy conversion efficiency, this could be improved by 10% by upgrading to a modern boiler. Offices constitute around 30% of the floor area in Phase 3 and 25% of the floor area in Phase 4 (however, the heated volume of air will be significantly smaller than in the high ceilinged factory area).
It is estimated that savings from upgrading boilers in these two locations would not achieve ROI that would be considered by Glenair (9-18 years with savings of £168 and £326 for Phase 4 and Phase 3 respectively).
International Workplace Ltd | 110 Hills Road | Cambridge | CB2 1LQ Tel: 0871 777 8881 | Fax: 0871 777 8882 | www.internationalworkplace.com
19
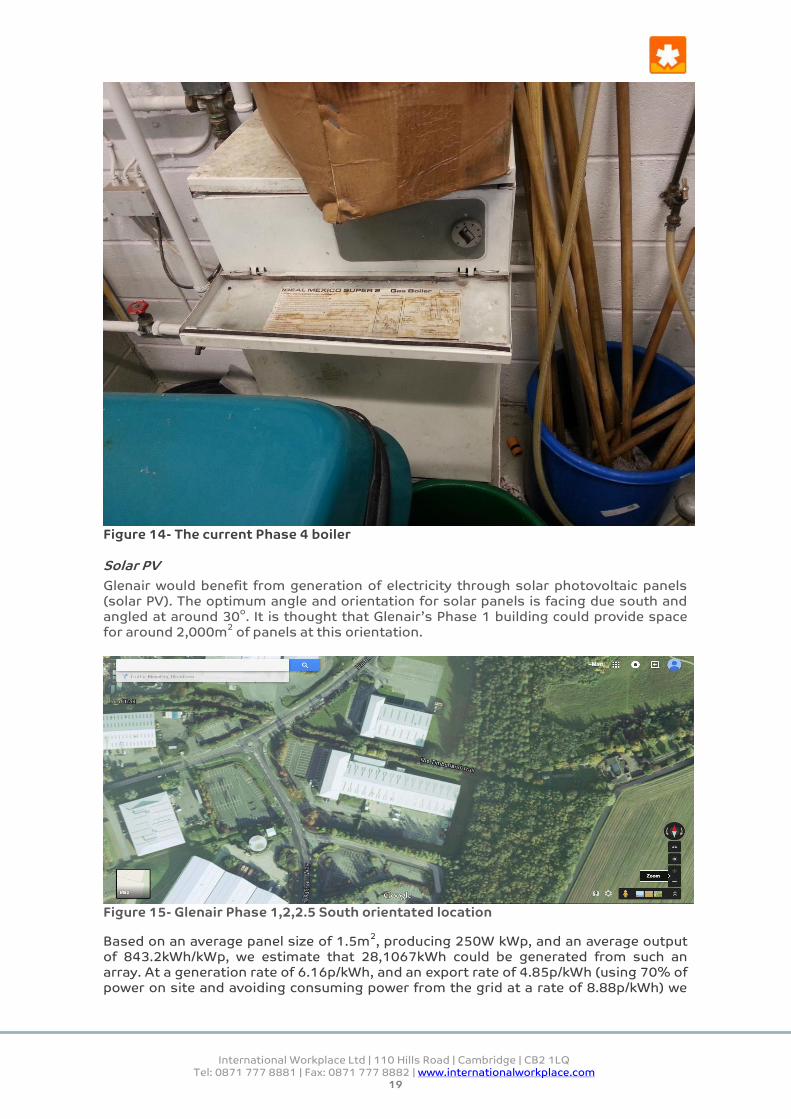
Figure 14- The current Phase 4 boiler
Solar PV
Glenair would benefit from generation of electricity through solar photovoltaic panels (solar PV). The optimum angle and orientation for solar panels is facing due south and angled at around 30
o. It is thought that Glenair’s Phase 1 building could provide space
for around 2,000m2 of panels at this orientation.
Figure 15- Glenair Phase 1,2,2.5 South orientated location
Based on an average panel size of 1.5m2, producing 250W kWp, and an average output
of 843.2kWh/kWp, we estimate that 28,1067kWh could be generated from such an array. At a generation rate of 6.16p/kWh, and an export rate of 4.85p/kWh (using 70% of power on site and avoiding consuming power from the grid at a rate of 8.88p/kWh) we
International Workplace Ltd | 110 Hills Road | Cambridge | CB2 1LQ Tel: 0871 777 8881 | Fax: 0871 777 8882 | www.internationalworkplace.com
20
estimate that £19,958 would be avoided in electricity bill payments and a total income of £21,403 would be generated. We estimate the cost of such an investment at approximately equal to £400,000; however several quotes would be required to determine “real-world” installation costs. High Efficiency Motors It was noted at the time of the site visit that Glenair uses a significant amount of machinery with inductive motors. High efficiency motors should be specified as replacements when required, especially for machinery in operation for a significant number of annual hours. VSDs Variable Speed Drives mean that motors are not required to run constantly at full capacity; instead consumption of electrical power is reduced where this is feasible. VSDs can be useful in applications requiring a fixed specified motor output but will usually generate more significant savings when applied to an application where output can sometimes be reduced. Motors fitted with a VSD have the capacity to reduce output
accordingly. Building Envelope The building envelope at Glenair was inspected at the time of the site visit and was found to be modern (post 1980) and in a good state of repair. That said; the buildings were all largely constructed with a single skin corrugated metal fabric with little insulative value. Considering the total gas cost of >£49,000 p/a, the insulation level of any new building should be considered (the cost of applying insulation to current Glenair premises is likely prohibitive to undertaking a retrofit).
Related Documents


![8 Eigenvectors and the Anisotropic Multivariate Normal …jrs/189/lec/08.pdf · 2021. 2. 18. · 777 777 777 777 777 5 [diagonal matrix of eigenvalues] Defn. of “eigenvector”:](https://static.cupdf.com/doc/110x72/61216d94413a4f35294f60ea/8-eigenvectors-and-the-anisotropic-multivariate-normal-jrs189lec08pdf-2021.jpg)