© Copyright of risklab GmbH Distribution or reproduction of this material only with prior written consent E.S.G. Risk Factors in a Portfolio Context Integrated Modeling of Environmental, Social and Governance Risk Factors An Innovative Study for Institutional Investors Munich, 2010 Dr. Steffen Hörter | risklab GmbH | Director | Phone +49 89 1220-7704 | e-mail: [email protected] Dr. Wolfgang Mader | risklab GmbH | Senior Vice President | Phone +49 89 1220-7759 | e-mail: [email protected] Barbara Menzinger | risklab GmbH | Vice President | Phone +49 89 1220-7754 | e-mail: [email protected]

Welcome message from author
This document is posted to help you gain knowledge. Please leave a comment to let me know what you think about it! Share it to your friends and learn new things together.
Transcript
© Copyright of risklab GmbHDistribution or reproduction of this material only with prior written consent
E.S.G. Risk Factors in a Portfolio Context Integrated Modeling of Environmental, Social and Governance Risk Factors
An Innovative Study for Institutional Investors
Munich, 2010
Dr. Steffen Hörter | risklab GmbH | Director | Phone +49 89 1220-7704 | e-mail: [email protected]. Wolfgang Mader | risklab GmbH | Senior Vice President | Phone +49 89 1220-7759 | e-mail: [email protected] Barbara Menzinger | risklab GmbH | Vice President | Phone +49 89 1220-7754 | e-mail: [email protected]

2© Copyright of risklab GmbHDistribution or reproduction of this material only with prior written consent
Integration of E.S.G. Risk Factors into Strategic Asset Allocation
For executive summaries of the risklab study`E.S.G. risk factors in a portfolio context´ please refer to
Responsible Investor - Quant study shows significant, long-term ESG risk reduction and return boost
http://www.responsible-investor.com/home/article/risklab/)
IPE - ESG risk in a portfolio context - 1 April 2010
http://www.ipe.com/magazine/esg-risk-in-a-portfolio-context_34522.php)
PROJECT M - Study: ESG delivers financial benefit
http://www.projectm-online.com/en/globalopportunities/2009_3/Pages/52StudyFinds.aspx
The study was also published as an article in German ´Nachhaltige Investments im Portfoliokontext (Hörter, Mader, Menzinger)´ in ´Absolute Report 53/2010`
http://www.absolut-report.de/absolutreport/ausgaben/)
1
2
3
4
3© Copyright of risklab GmbHDistribution or reproduction of this material only with prior written consent
Agendarisklab Study E.S.G. Risk Factors in a Portfolio Context
1. risklab Approach Towards Responsible Investing
2. Modeling of E.S.G. Risk Factors
3. Portfolio Optimization and E.S.G. Risk Factors
4. Key Conclusions for Investors
Back-up

4© Copyright of risklab GmbHDistribution or reproduction of this material only with prior written consent
risklab Approach Towards Responsible Investing
5© Copyright of risklab GmbHDistribution or reproduction of this material only with prior written consent
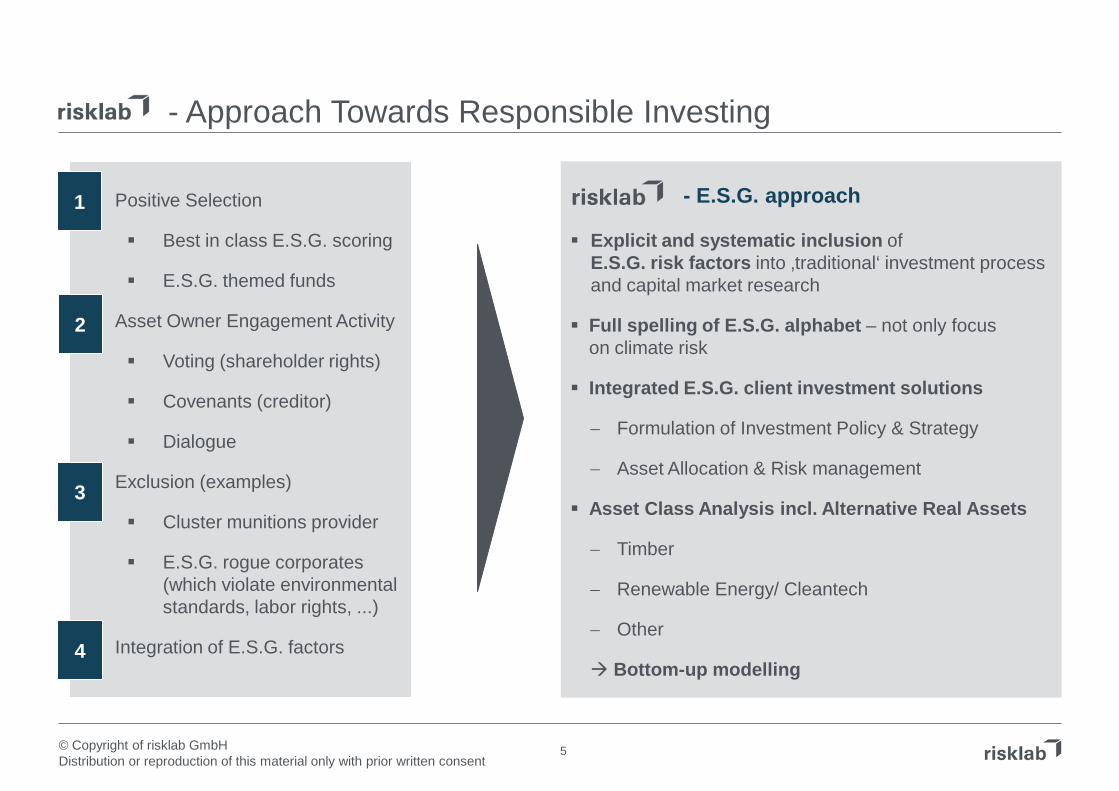
Positive Selection
Best in class E.S.G. scoring
E.S.G. themed funds
1. Asset Owner Engagement Activity
Voting (shareholder rights)
Covenants (creditor)
Dialogue
2. Exclusion (examples)
Cluster munitions provider
E.S.G. rogue corporates(which violate environmentalstandards, labor rights, ...)
3. Integration of E.S.G. factors
- Approach Towards Responsible Investing
Explicit and systematic inclusion of E.S.G. risk factors into ‚traditional‘ investment process and capital market research
Full spelling of E.S.G. alphabet – not only focus on climate risk
Integrated E.S.G. client investment solutions
− Formulation of Investment Policy & Strategy
− Asset Allocation & Risk management
Asset Class Analysis incl. Alternative Real Assets
− Timber
− Renewable Energy/ Cleantech
− Other
Bottom-up modelling
1
2
3
4
- E.S.G. approach

6© Copyright of risklab GmbHDistribution or reproduction of this material only with prior written consent
II.Manager Selection
I.Investment & Risk Strategy
V.Investment Controlling & Reporting
III.Portfolio
ManagementSubfunds
E.S.G. Investment Beliefs, Policy & Objectives
E.S.G. factor optimized SAA/ ALM and portfolio strategy
−Core/ E.S.G. Satellite
−E.S.G. Core/ E.S.G. Satellite
Active / passive E.S.G. mandate
RfP: Definition of E.S.G. criteria and objectives
Evaluation of E.S.G. related manager competence
Alpha Management in the different E.S.G. asset class segments
Passive E.S.G. index tracking
Integration of E.S.G. Key Performance Indicators (KPI)
− E.S.G. related performance attribution
− E.S.G. related investment risk reporting
Integration of E.S.G. risk factors into
− Beta Management
− Risk Budgeting
− Overlay Management
IV.Dynamic Risk Management
Considering E.S.G. Factors Along the Investment Process
Source: risklab
7© Copyright of risklab GmbHDistribution or reproduction of this material only with prior written consent
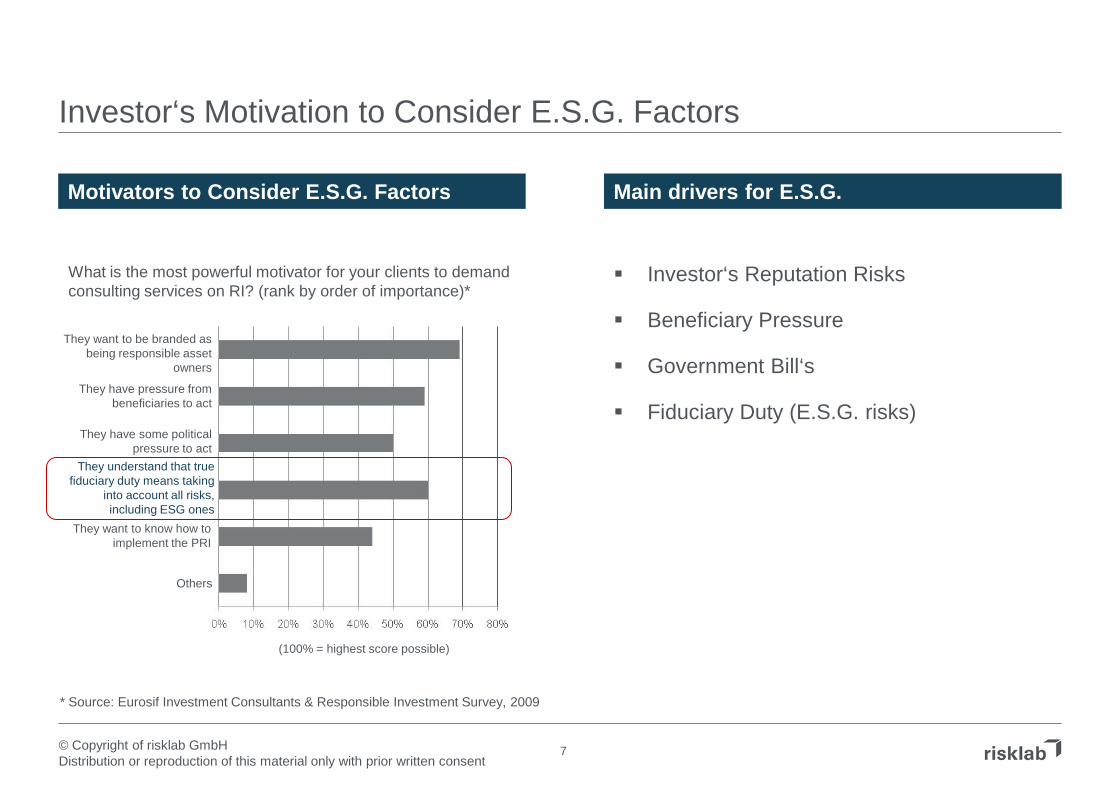
Investor‘s Motivation to Consider E.S.G. Factors
Main drivers for E.S.G. Motivators to Consider E.S.G. Factors
Investor‘s Reputation Risks
Beneficiary Pressure
Government Bill‘s
Fiduciary Duty (E.S.G. risks)
What is the most powerful motivator for your clients to demandconsulting services on RI? (rank by order of importance)*
They want to be branded as being responsible asset
owners
They have pressure from beneficiaries to act
They have some politicalpressure to act
They understand that truefiduciary duty means taking
into account all risks, including ESG ones
They want to know how to implement the PRI
Others
(100% = highest score possible)
* Source: Eurosif Investment Consultants & Responsible Investment Survey, 2009

8© Copyright of risklab GmbHDistribution or reproduction of this material only with prior written consent
Modeling of E.S.G. Risk Factors

9© Copyright of risklab GmbHDistribution or reproduction of this material only with prior written consent
Missing Link Between E.S.G. Investing and Strategic Asset Allocation
Focus of E.S.G. Investing Research So far research has mainly focused on E.S.G. compliant equity investments from a bottom-up
investment process perspective. The evidence on the performance of SRI Funds is mixed. Usually, there is no bottom up link of E.S.G. investment research and portfolio level
E.S.G. Factors not Fully Recognized on Portfolio Level Other top down SAA research has been often rather qualitative and focused on one element within
the ESG acronym— usually the environmental as it relates to climate change
There exists no systematic, long-term quantitative analysis explicitly examining E.S.G. risk factors and their portfolio impact.
Importance of Strategic Asset Allocation risklab views Strategic Asset Allocation (SAA) as the most important factor driving long-term portfolio
returns. Estimates conclude it accounts for up to 90% of portfolio risks, outweighing market timing and stock
selection in importance.
10© Copyright of risklab GmbHDistribution or reproduction of this material only with prior written consent
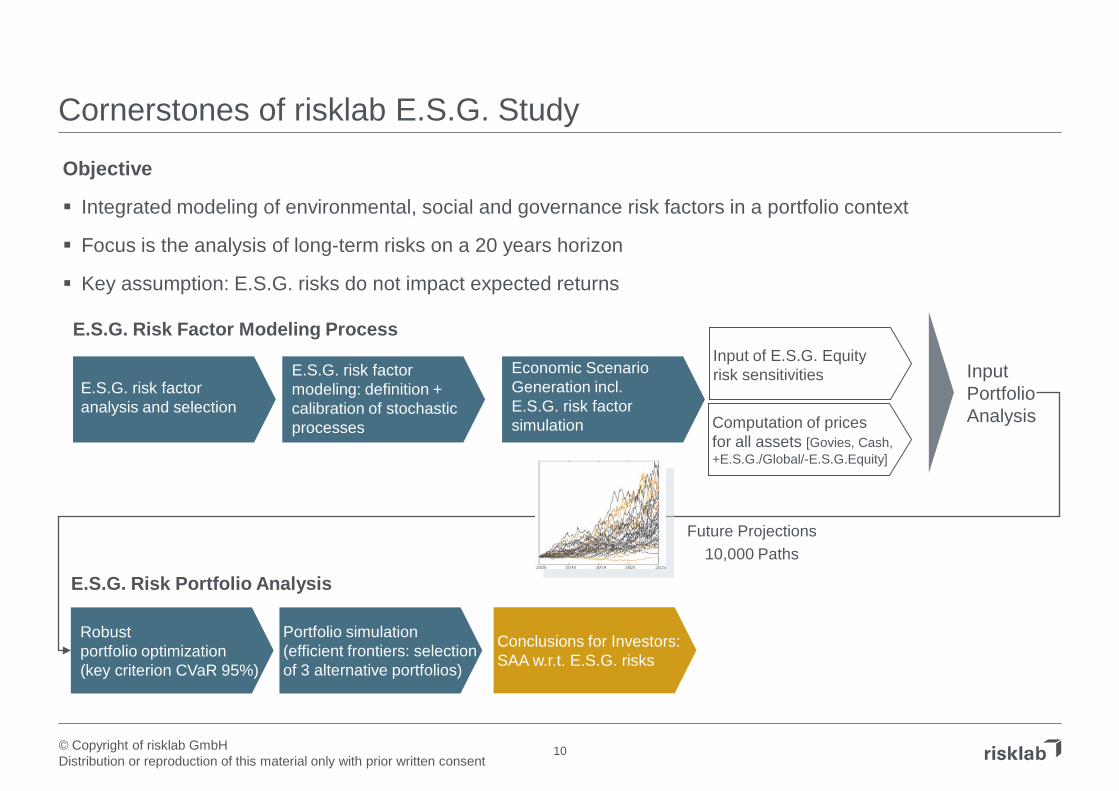
Cornerstones of risklab E.S.G. Study
InputPortfolioAnalysis
E.S.G. risk factor analysis and selection
E.S.G. risk factor modeling: definition + calibration of stochastic processes
Economic Scenario Generation incl. E.S.G. risk factor simulation
Input of E.S.G. Equity risk sensitivities
Computation of prices for all assets [Govies, Cash, +E.S.G./Global/-E.S.G.Equity]
Robustportfolio optimization(key criterion CVaR 95%)
Portfolio simulation (efficient frontiers: selection of 3 alternative portfolios)
E.S.G. Risk Factor Modeling Process
E.S.G. Risk Portfolio Analysis
Conclusions for Investors:SAA w.r.t. E.S.G. risks
Future Projections10,000 Paths
Objective
Integrated modeling of environmental, social and governance risk factors in a portfolio context
Focus is the analysis of long-term risks on a 20 years horizon
Key assumption: E.S.G. risks do not impact expected returns
11© Copyright of risklab GmbHDistribution or reproduction of this material only with prior written consent
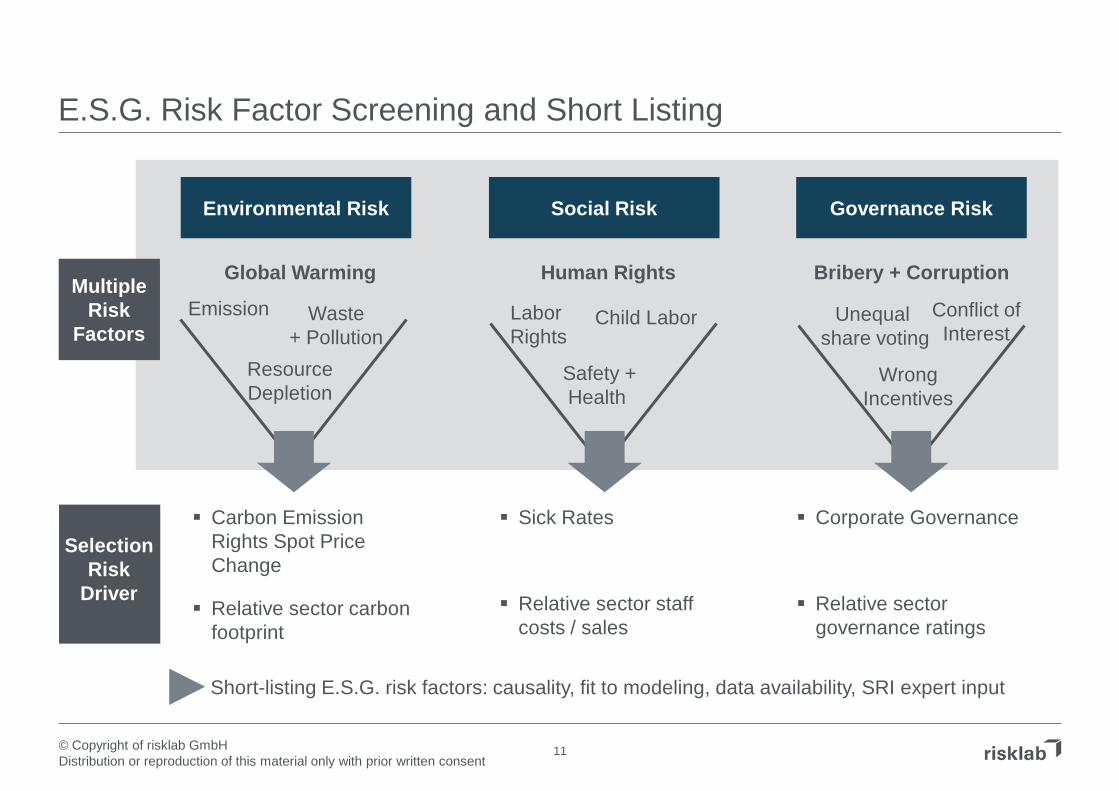
E.S.G. Risk Factor Screening and Short Listing
Environmental Risk Social Risk Governance Risk
Global Warming
ResourceDepletion
Emission Waste+ Pollution
Human Rights
Safety +Health
Labor Rights
Child Labor
Bribery + Corruption
WrongIncentives
Unequal share voting
Conflict ofInterest
MultipleRisk
Factors
SelectionRisk
Driver
Carbon Emission Rights Spot Price Change
Relative sector carbon footprint
Sick Rates
Relative sector staff costs / sales
Corporate Governance
Relative sector governance ratings
Short-listing E.S.G. risk factors: causality, fit to modeling, data availability, SRI expert input

12© Copyright of risklab GmbHDistribution or reproduction of this material only with prior written consent
12
Return adjustment
E.S.G. factor modeling
Environmental:
Social:
Corporate Governance:
Environmental:
Social:
Corporate Governance:
Modeling the E.S.G. Influence on Equity Returns
process stochasticr~E =
Equity Returns rEQ
Sensitivity derivation
Capital market scenarios
0=ρ
βββ−+
S
Global
SS,,
βββ−+
G
Global
GG,,
βββ−+ ,Sector
E
Global,Sector
E
,Sector
E,,
βββ−+ ,Sector
S
Global,Sector
S
,Sector
S,,
βββ−+ ,Sector
G
Global,Sector
G
,Sector
G,,
Sector weighting
βββ−+
E
Global
EE,,
w
r~r~r~ EQEQ++ ∆+=
r~r~r~ EQEQ−− ∆+=
process stochasticr~S =process stochasticr~G =
Finally, the E.S.G. return difference is added to the equity return before inclusion of E.S.G. obtained from the Economic Scenario Generator.
r~r~r~r~r~r~r~ GGSSEEGSE β+β+β=∆+∆+∆=∆ +++++++
r~r~r~r~r~r~r~ GGlobalGS
GlobalSE
GlobalE
GlobalG
GlobalS
GlobalE
Global β+β+β=∆+∆+∆=∆
r~r~r~r~r~r~r~ GGSSEEGSE β+β+β=∆+∆+∆=∆ −−−−−−−
r~r~r~ GlobalEQ
GlobalEQ ∆+=

13© Copyright of risklab GmbHDistribution or reproduction of this material only with prior written consent
We model three equity assets: Equity of companies that are in line with E.S.G. criteria (+), of those that are not (-) and of those that have an average exposure to E.S.G. risk.
A sensitivity to the environmental factor isderived for each sector.
The sector sensitivities are weighted according to the sector representation in the MSCI World.
1313
Modeling the E.S.G. Influence on Equity ReturnsExample: Environmental Risk
E.S.G. factor modeling
Sensitivity derivation
0]r~[E E =
The environmental factor is modeled as a stochastic process.
The CO2 Emission rights spot price represents our environmental factor.
process stochasticr~E =
βββ−+ ,Sector
E
Global,Sector
E
,Sector
E,,
where
β∑ββ∑β ==++ Global,Sector
ESectors
SectorGlobal
E
,Sector
ESectors
Sector
E ww ,
β∑β−−
=,Sector
ESectors
Sector
E w
( )FootprintCarbonfGlobal,Sector
E=β
MSCI AC Average of
Carbon Footprints
MSCI ACNormalized
Carbon Footprints
(β)
+E.S.G. Equity (β)
-E.S.G. Equity (β)
MSCI AC (Weights)
Financials -2.471 -0.067 -0.053 -0.080 21.92%Consumer Discretionary -1.826 -0.108 -0.087 -0.130 8.82%
IT -1.314 -0.141 -0.113 -0.170 11.75%Health Care -1.150 -0.152 -0.122 -0.183 9.34%
Telecom Services -0.975 -0.163 -0.131 -0.196 5.10%Industrials -0.643 -0.185 -0.148 -0.222 9.99%
Consumer Staples -0.488 -0.195 -0.156 -0.234 9.49%Energy 1.048 -0.294 -0.235 -0.353 11.19%
Materials 5.472 -0.581 -0.464 -0.697 7.74%Utilities 11.954 -1.000 -0.800 -1.200 4.66%
Weighted Average -0.027 -0.225 -0.180 -0.270
Sensitivity: Analysis of Carbon Footprint Data E.S.G. factor modeling: Simulation Results CO-2 Emission Right Spot Price Change

14© Copyright of risklab GmbHDistribution or reproduction of this material only with prior written consent
Expert Modeling E.S.G. Risk
Environmental Risk Social Risk Governance Risk
Data Availability
Comparatively good
+Fractal
− −
Somewhat better
oRisk Factor Risk Driver Carbon Emission Rights
Spot Price Change Sick Rates Corporate Governance
Stochastic Model
Regime Switching Geometrical Brownian Motion
Regime Switching
Risk Sensitivity(Equity)
Relative Sector Footprint
Carbon emission footprint Staff Costs / Sales Governance Ratings
Data Source “Relative Carbon Footprint in MSCI All Countries
World” based on monthly ratings (2005-2009) from
Trucost
Computations of staff costs / sales on the basis
of Worldscope for staff costs and Datastream
across GICS
Relative Corporate Governance Ratings in MSCI
All Countries World” for different sectors on monthly
ratings (2005-2009) from RiskMetrics.
Relative Weighting Equal weighting between E.S.G. risk factors

15© Copyright of risklab GmbHDistribution or reproduction of this material only with prior written consent
Cascade 1 (Economic Factors)
Cascade 2 (Yield Curve)
Cascade 3 (Equity)
— Gross Domestic Product (GDP)
— Inflation Rate or Consumer Price Index (CPI)
— Treasury Yield Curve
— Credit Spreads
Integration of E.S.G. Generating Future Market Scenarios - Economic Scenario Generator
Government Bond+E.S.G. Equity -E.S.G. Equity
Inclusion of E.S.G. risk influence on equity returns
CashAssets
Cascade Model
Global Equity
Equity Returns

16© Copyright of risklab GmbHDistribution or reproduction of this material only with prior written consent
Portfolio Optimization and E.S.G. Risk Factors

17© Copyright of risklab GmbHDistribution or reproduction of this material only with prior written consent
E.S.G. Risk Factors: What Does it Mean for Investors?
Possible impact of E.S.G. risks in the equity and portfolio context
Additional E.S.G. Equity investment risk – how much?
Solution space alternative portfolios?
- efficient frontiers (+E.S.G./ Global / -E.S.G. Equity)
- example portfolios
Optimal strategic asset allocation?
- risk reduction
- return enhancement
1
2
3

18© Copyright of risklab GmbHDistribution or reproduction of this material only with prior written consent
Risk / Return Characteristics of Equity Returns
Key findings
In comparison the CVaR risk of +E.S.G./Global/-E.S.G. Equity is very different.
The CVaR risk of +E.S.G. Equity is approx. one-third less than Global Equity*.
The CVaR risk of –E.S.G. is approximately double that of +E.S.G. Equity.
E.S.G. risk is assumed to have no impact on expected equity returns but is a risk driver.
1
* Global Equity represents an equity allocation with an average E.S.G. exposure
Return / Risk Metric
(average values p.a. over 20 years)
+E.S.G. Global -E.S.G.
Equity Equity Equity
Expected Return 7.6% 7.6% 7.6%
CVaR 95% -26.7% -38.8% -52.3%
Volatility 15.5% 19.3% 23.7%
CVaR (95%):Conditional Value at Risk (CVaR) 95%: Average expected return incurred in the 5% worst case scenarios p.a.
Please note: concerning the return and risk related information please refer to the disclaimer at the end of the document.

19© Copyright of risklab GmbHDistribution or reproduction of this material only with prior written consent
CVaR 95%
Expe
cted
Ret
urn
Result of Optimization: CVaR Applied as Key Criterion
Starting point
Blue line shows efficient frontier with Government Bonds, Cash and Global Equity.
Orange line same except full allocation of equity into -E.S.G. Equity.
Green line same except full allocation of equity into +E.S.G. Equity.
Optimization opportunities
Enhance return for given level of CVaR.
Reduced CVaR for given level of return.
2
Global Equity
+ ESG Equity
- ESG Equity
Please note: concerning the return and risk related information please refer to the disclaimer at the end of the document.
20© Copyright of risklab GmbHDistribution or reproduction of this material only with prior written consent
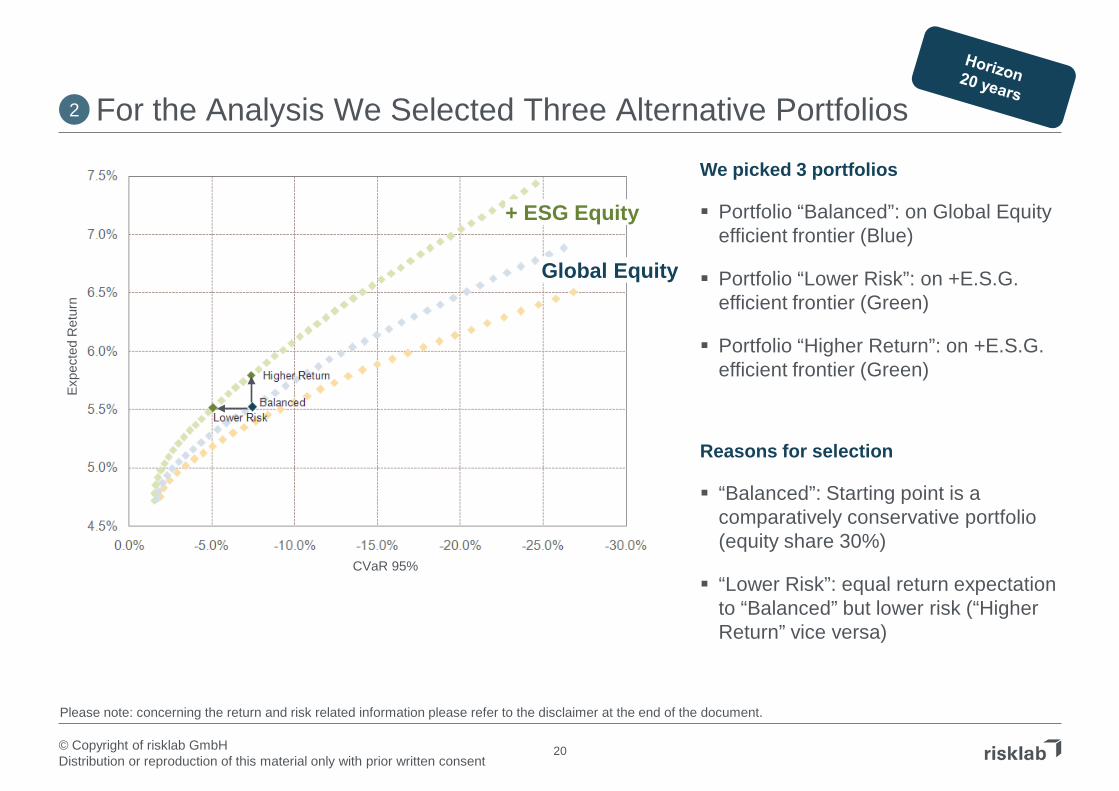
For the Analysis We Selected Three Alternative Portfolios
We picked 3 portfolios
Portfolio “Balanced”: on Global Equity efficient frontier (Blue)
Portfolio “Lower Risk”: on +E.S.G. efficient frontier (Green)
Portfolio “Higher Return”: on +E.S.G. efficient frontier (Green)
Reasons for selection
“Balanced”: Starting point is a comparatively conservative portfolio (equity share 30%)
“Lower Risk”: equal return expectationto “Balanced” but lower risk (“Higher Return” vice versa)
2
CVaR 95%
Expe
cted
Ret
urn
Global Equity
+ ESG Equity
Please note: concerning the return and risk related information please refer to the disclaimer at the end of the document.

21© Copyright of risklab GmbHDistribution or reproduction of this material only with prior written consent
Cash, 6%
Government Bonds, 64%
Global Equity, 30%
Cash, 8%
Government Bonds, 62%
Equities +E.S.G., 30%
Significant Optimization Opportunities Through + E.S.G. Equity Allocation
Starting Point: Portfolio “Balanced” Comparatively conservative portfolio with Global
Equity allocation of 30%
Option A: Portfolio “Lower Risk” Risk can be reduced at same levels of return with
the same Equity (+E.S.G.) allocation.
Option B: Portfolio “Higher Return” Return expectation can be increased at same level
of risk.
A
3
Portfolio “Balanced”
Portfolio “Lower Risk”
Portfolio “Higher Return”
Cash, 6%
Government Bonds, 55%
Equities +E.S.G., 40%B
Please note: concerning the return and risk related information please refer to the disclaimer at the end of the document.

22© Copyright of risklab GmbHDistribution or reproduction of this material only with prior written consent
Risk / Return Characteristics of Selected Portfolios
Portfolio “Lower Risk” (Option A):
All risks can be reduced at the same level of return compared to portfolio “Balanced”.
Portfolio “Higher Return” (Option B):
Expected return can be increased at similar level of risks.
3
Return / Risk Metric Portfolio Portfolio Portfolio"Balanced" "Lower Risk" "Higher Return"
Expected Return 5.5% 5.5% 5.8%
CVaR 95% -7.4% -5.1% -7.4%
Volatility 6.2% 5.2% 6.5%
Please note: concerning the return and risk related information please refer to the disclaimer at the end of the document.
23© Copyright of risklab GmbHDistribution or reproduction of this material only with prior written consent
CVaR 95%
Expe
cted
Ret
urn
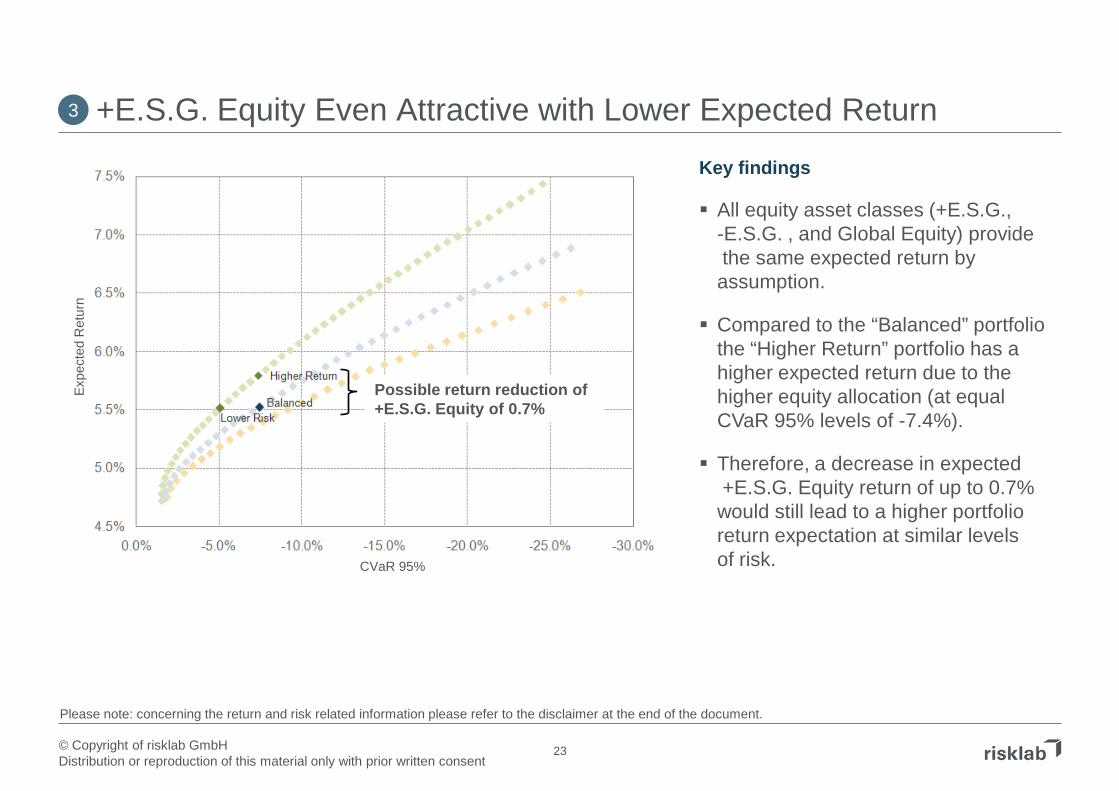
+E.S.G. Equity Even Attractive with Lower Expected Return
Key findings
All equity asset classes (+E.S.G., -E.S.G. , and Global Equity) providethe same expected return by assumption.
Compared to the “Balanced” portfoliothe “Higher Return” portfolio has a higher expected return due to the higher equity allocation (at equal CVaR 95% levels of -7.4%).
Therefore, a decrease in expected+E.S.G. Equity return of up to 0.7% would still lead to a higher portfolio return expectation at similar levels of risk.
Possible return reduction of +E.S.G. Equity of 0.7%
3
Please note: concerning the return and risk related information please refer to the disclaimer at the end of the document.
24© Copyright of risklab GmbHDistribution or reproduction of this material only with prior written consent
Key Conclusions for Investors

25© Copyright of risklab GmbHDistribution or reproduction of this material only with prior written consent
E.S.G. Risk Factors: Key Conclusions for Investors
In the long-term, over 20 years, E.S.G. factors are expected to have significant risk impact on Equity investments.
Therefore, investors should strive to optimize their Global Equity investments and minimize exposure to E.S.G. risk.
This can be achieved by choosing Equity investments, where corporate management proactively mitigates these risk factors.
On the basis of a comparatively conservative portfolio with a global equity allocation of approx. one third, optimized Equity allocation offers:
- Either a portfolio risk reduction (CVaR 95%) of ca. 30% at same levels of expected return.
- Or an increase of expected portfolio return by 0.3%-pts. at similar levels of expected portfolio risk.
The effects illustrated amplify even more when comparing more risky portfolios e.g. when the equity allocation is even higher.

26© Copyright of risklab GmbHDistribution or reproduction of this material only with prior written consent
BACK UP

27© Copyright of risklab GmbHDistribution or reproduction of this material only with prior written consent
Back Up: Motivation of Study

28© Copyright of risklab GmbHDistribution or reproduction of this material only with prior written consent
General Research Sources Used for Scoping the Study (1/3)
E.S.G. factors and sustainable investing (overall) “The SRI Navigator – Objectively assessing Environmental, Social, and Governance Risks” by Valerie Luclas-Leclin et al for Societe General, May 2009 – the
risk indicators of this survey served as a good orientation for our study and helped to calibrate the risk factor weightings. “Socially Responsible Investments” by Sven Hross, Christofer Vogt and Rudi Zagst in “World Scientific Review”, 2009 – this article gives a great overview over on
SRI in general, market development and the question “how sustainable is SRI”. A case study based on simulated returns of an auto-regressive Markov-Switching model with underlying data from 1992 to 2008 shows that risk-averse investors mix SRI investments in their portfolio in order to diversify – but it also claims that “the less risk-averse an investor is, the more he invests in SRI”.
“In Pursuit of a Sustainable Word – Socially Responsible Investing and Eco Investments” by Darius Abde-Yazani et all – Bachelor Thesis by six students that summarizes very well the recent developments in SRI investing, introduces a Sustainability Scorecard to help companies implement E.S.G. standards, and builds the hypothesis that E.S.G. can indeed lead to competitive advantage. Other than the aforementioned “Socially Responsible Investments” report by Hros, Vogt, and Zagst, it finds that “risk-averse investors mix SRI/Eco indices to their existing bonds‐stocks‐portfolio in order to gain an optimal portfolio in terms of risk‐return measures”
“The Materiality of Social, Environmental and Corporate Governance Issues to Equity Pricing” by UNEP Finance Initiative - 11 Sector Studies “Demystifying responsible investment performance – A Review of key academic and broker research on E.S.G. factors” by UNEP Finance and Mercer,
October 2007 “Fearless Forecast” by Mercer 2006 - Surveys about the perceived importance of E.S.G. issues among financial professionals “Climate Change Risk – Looking ahead: Implications for Strategic Asset Allocation” lecture by Antoine de Salins for FRR at the UN Principles of Responsible
Investing PRI in Person Conference on July 3rd 2009 in Sydney – describes a two level approach to assess financial risks under different financial scenarios. “Innovest Integrated Oil- and Gas Sector Report” by Christian Maede for Innovest, 2006 - This sector report covers a wide range of 'non-traditional' risk factors and
value drivers for the integrated oil & gas sector. Areas such as strategic governance, environment, stakeholders and human capital are covered. A global selection of 28 companies is ranked according to social, environmental and combined ratings, as well as on a number of sub-factors. The report is notable for its comprehensive discussion of risk factors and a broad coverage of companies, including leading companies from emerging markets. But it stops short of assessing potential financial impacts of the described risk factors and proposing integrated company valuation approaches.
“Pharmaceuticals: Integration E.S.G. (Goldman Sachs Sustainability)” by Sarah Forest for Goldman Sachs, 2007 - the sector-adapted E.S.G. framework is used as a proxy for overall management quality, and as an indicator for cash returns and therefore fair value. The report weaves the E.S.G. story with other, 'orthodox' strategic drivers, and is quite transparent in its E.S.G. methodology.
“Green Winners – The performance of sustainability focused companies during the financial crisis” by AT Kearney “Conference report: New Frontiers in Emerging Markets Investments” by Who Cares Wins, 2007 – an initiative to integrate E.S.G. issues into mainstream
investment decision-making. Provides good insight in E.S.G.-awareness in emerging markets. “Clean Investor 2009 - Investing in sustainable themed funds: the new generation of returns?” by Responsible Investor, 2009

29© Copyright of risklab GmbHDistribution or reproduction of this material only with prior written consent
General Research Sources Used for Scoping the Study (2/3)
Climate Change and mitigation costs with a view on global economy
“The Stern review on the Economics of Climate Change” by Nicholas Stern (Baron Stern of Brentford) (and updates): A 700-page report for the British government, which discusses the effect of climate change and global warming on the world economy. Its main conclusions are that one percent of GDP per annum is required to be invested in order to avoid the worst effects of climate change, and that failure to do so could risk global GDP being up to twenty percent lower than it otherwise might be. It provides prescriptions including environmental taxes to minimize the economic and social disruptions. In June 2008 Stern increased the estimate to 2% of GDP to account for faster than expected climate change.
“The Global Deal” by Nicholas Stern (Baron Stern of Brentford), 2009 – newest update on political and economic plans to mitigate climate change and fight global warming and poverty.
“Pathways to a low-carbon economy – V2 Global Greenhouse Gas Abatement Cost Curve”, McKinsey & Company, 2009
“The Economics of Climate Change” by the Select Committee on Economics of the UK House of Lords, 2006
“A question of Balance” by W. Nordhaus – about the mitigation costs of global warming
“Climate Change: The costs of inaction and the cots of adaption” by the European Environment Agency, 2007
“A Climate for Recovery” by HSBC, February 2009 - reviews 20 economic recovery plans published by then to combat the credit crisis: 15% of the assets (or $432bn)of a total $2.8trn in fiscal measures could be associated with investments consistent with stabilizing and subsequently cutting global emissions of greenhouse gases.
Provides insight how the crisis effects the combat against climate change.

30© Copyright of risklab GmbHDistribution or reproduction of this material only with prior written consent
General Research Sources Used for Scoping the Study (3/3)
Effects of Climate Change on different sectors / regions
“Utilities 2020 Vision: favor low carbon generators, cautions on high carbon intensity” by Graeme Moyse, 2008 for Goldman Sachs - a long-term (2020), generally quantitative analysis that tests various scenarios. The report takes a wide-ranging look at energy provision and its implications in Europe, including the role of clean tech, carbon capture & storage and nuclear energy. The authors are transparent regarding their assumptions and how they arrive at their conclusions.
“Adaption and Vulnerability to Climate Change: Role of the Finance Industry” by UNEP Finance Initiative Climate Change Working Group, November 2006 - co-authored by Armin Sandhövel of Allianz Climate Solutions, this is a good summary of potential threats and challenges of climate change to the financial sector.
“Carbon Crunch: Meeting the Cost” by UNEP Finance Initiative Climate Change Working Group, December 2007 – it continues the work from the previous article now with Armin Sandhövel as chair of the working group, now with more details and figures about the finance sector.
“Climate Change and the ASX100: An Assessment of Risks and Opportunities” by Bruce Rolph for Citigroup, 2006 - A comprehensive climate impact study, which covers not only the impact of rising carbon prices on ASX100 companies, but also the effects of potential physical impacts. The analysis distinguishes between two scenarios for carbon prices and two scenarios for physical impacts.
“A Climate for Change” by Mercer – a brief discussion on climate change effect on various asset classes
“Climate Change and Equity valuations” a briefing for Equity analysts by PricewaterhouseCoopers for the Carbon Trust and the Institutional Investors Group on Climate Change, 2007 – good summary with focus on Europe and the US, stresses out that regulation and market response are still very uncertain and impacts vary widely between sectors.
“Up in Smoke – Threats from, and responses to, the impact of global warming on human development” by Andrew Simms et al for The Working Group on Climate Change and Development, 2004 – very good report with interesting case studies, strong bias on developing countries.
“Africa up in Smoke” by Andrew Simms et al for The Working Group on Climate Change and Development, 2005 – follow up on the previous report, good source for climate change-related issues in Africa

31© Copyright of risklab GmbHDistribution or reproduction of this material only with prior written consent
Back Up: Modeling of E.S.G. Risk Factors

32© Copyright of risklab GmbHDistribution or reproduction of this material only with prior written consent
Expert Modeling E.S.G. Risk (1/2)
Environmental risks For environmental factor data availability and quality is comparatively good
— risklab expert modeling of Emissions Rights Spot Price Change (regime switching property)— On the basis of EU Emissions Right Spot Price data— Equity risk sensitivity derived on the basis of “Relative Carbon Footprint in MSCI All Countries World” for
different sectors based on monthly ratings (2005-2009) from Trucost
Social risks The challenge is that there is only fractal data available to model social risk factors
— Diverse interpretation of social risk (fatality rates, sick rates, staff turnover rates, …)— No time series available to derive a stochastic process for the returns/price changes (like the CO2 emission
rights spot prices)— Assumptions have to be made regarding the type of the stochastic process
risklab expert modeling of the social risk factor represents the general expected return impact of company standards and policy w.r.t. social aspects on Equity (positive or negative)— It is modeled with a Geometrical Brownian Motion, i.e. a normally distributed process characterized by mean
and volatility— Equity risk sensitivity is derived through computations of staff costs / sales on the basis of Worldscope for staff
costs and Datastream across sectors

33© Copyright of risklab GmbHDistribution or reproduction of this material only with prior written consent
Expert Modeling E.S.G. Risk (2/2)
Governance Risks There is somewhat better data available to model governance risk factors compared to social risks
— Diverse interpretation of governance risk (bribery, insufficient corporate governance boards, …)— No time series available to derive a stochastic process for the returns/price changes (like the CO2 emission
rights spot prices)— Assumptions have to be made regarding the type of the stochastic process
risklab expert modeling of the governance risk factor represents the general return impact of company policy w.r.t. governance aspects on Equity (positive or negative)— Like environmental risk it is modeled with Regime Switching property— Equity risk sensitivity is derived through “Relative Corporate Governance Ratings in MSCI All Countries World”
across different sectors on the basis of monthly governance ratings (2005-2009) from RiskMetrics.
SRI Expert Cross Checks The modeling and calibrating of E.S.G. risk by risklab has been challenged and as a result partly adapted upon
expert input and review of AllianzGI Europe, in particular the AllianzGI French Equity team.

34© Copyright of risklab GmbHDistribution or reproduction of this material only with prior written consent
E.S.G. factor modeling
Sensitivity derivation
Modeling Environmental Risk: Key Data Sources
“Relative Carbon Footprint in MSCI All Countries World: tilts of the Carbon Footprint for different sectors against MSCI AC World” provided by IDS GmbH based on monthly ratings (2005-2009) from Trucost.
According to their own reports, Trucost has generated environmental impact profiles for over 464 different business activities. Trucost uses these profiles, along with financial and segmental analysis, to produce an estimate of a company's direct impacts. An input-output model is used to quantify the indirect impacts that a company has. Trucost then searches for any public disclosures that have been made by the company and incorporates them. Once the quantity profile has been calculated, an external cost is applied to each resource and emission to generate the external cost profile. Once the analysis has been completed, a verification sheet is sent to the company for feedback. Feedback is analysed and relevant additional data is incorporated, with Trucost monitoring any new environmental disclosures from the company. All in all, their database contains environmental data for 4,500 companies globally covering all the major investable indices including the MSCI AWD. In the MSCI AWD 22% of companies provide full disclosure and those that provide partial disclosure take the total to 48%. For data on the remaining 52% of the companies, they relay on their own model that calculates the likely emissions for each company in the index.
risklab expert modeling on the basis of EU Emissions Rights Spot Price Change.
The initial idea was to start with regional CO2 prices for Europe, US and China and to merge them in a single common CO2-price in the year 2020. This idea was disregarded, as only few sectors are part of an established emissions trading scheme and the price can be passed on to the end-consumer in different ways - so we used the EU Emissions Rights Spot Price Change as the most important input variable as sudden price changes pose bigger risks to the companies than long-term price-hikes. Also, companies that invest in sustainable techniques early on should be less susceptible to CO2 price changes.
“European emission data” since 2005 from http://dataservice.eea.europa.eu/dataservice/metadetails.asp?id=1078 (for an overview see the pivotal application "European Union Emissions Trading Scheme Data Viewer“).
As the Carbon Footprint data doesn’t show the actual amount of tons of CO2 but just the tilts between different sectors and regions, we were looking for absolute data. In this precise form, they exist only in Europe and cover only the sectors with a trading scheme.

35© Copyright of risklab GmbHDistribution or reproduction of this material only with prior written consent
Selection
Modeling Environmental Risk: Additional Sources Analyzed
“Modeling the price dynamics of CO2 emission allowances” by Benz, E. and Trück, S., in Energy Economics 31, 4–15, 2009.
36© Copyright of risklab GmbHDistribution or reproduction of this material only with prior written consent
E.S.G. factor modeling
Sensitivity derivation
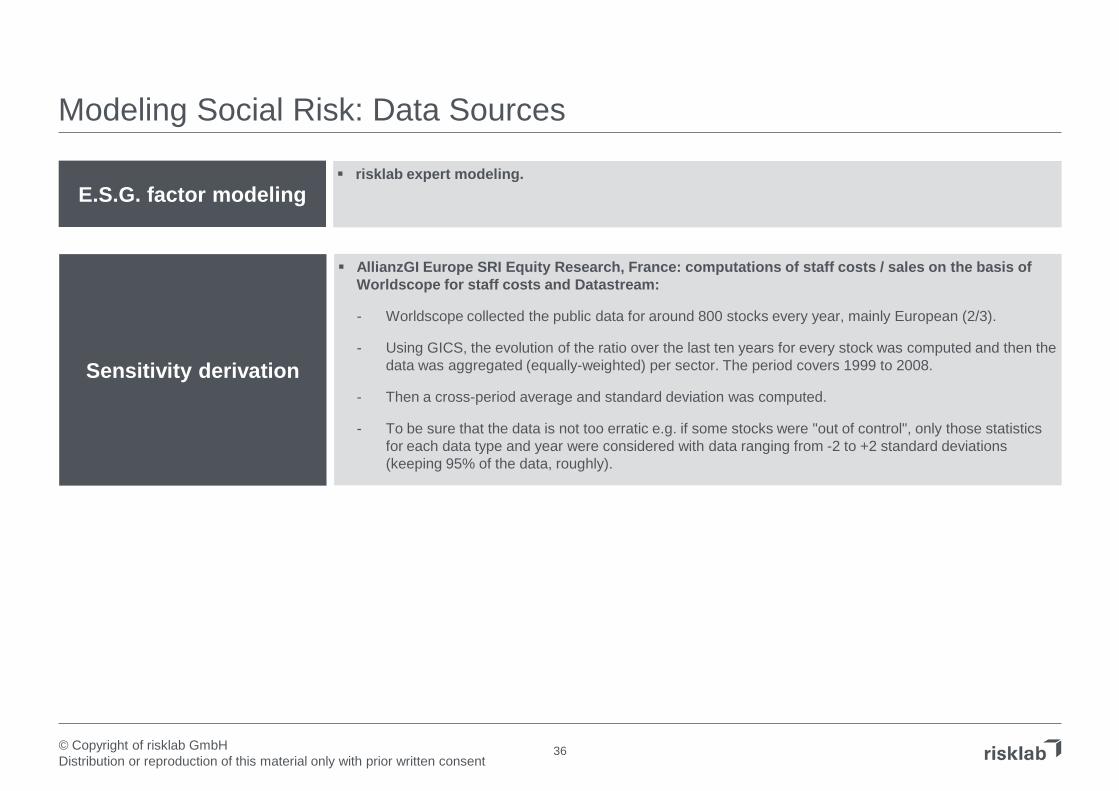
Modeling Social Risk: Data Sources
AllianzGI Europe SRI Equity Research, France: computations of staff costs / sales on the basis of Worldscope for staff costs and Datastream:
- Worldscope collected the public data for around 800 stocks every year, mainly European (2/3).
- Using GICS, the evolution of the ratio over the last ten years for every stock was computed and then the data was aggregated (equally-weighted) per sector. The period covers 1999 to 2008.
- Then a cross-period average and standard deviation was computed.
- To be sure that the data is not too erratic e.g. if some stocks were "out of control", only those statistics for each data type and year were considered with data ranging from -2 to +2 standard deviations (keeping 95% of the data, roughly).
risklab expert modeling.
37© Copyright of risklab GmbHDistribution or reproduction of this material only with prior written consent
Selection
Modeling Social Risk: Additional Sources Analyzed
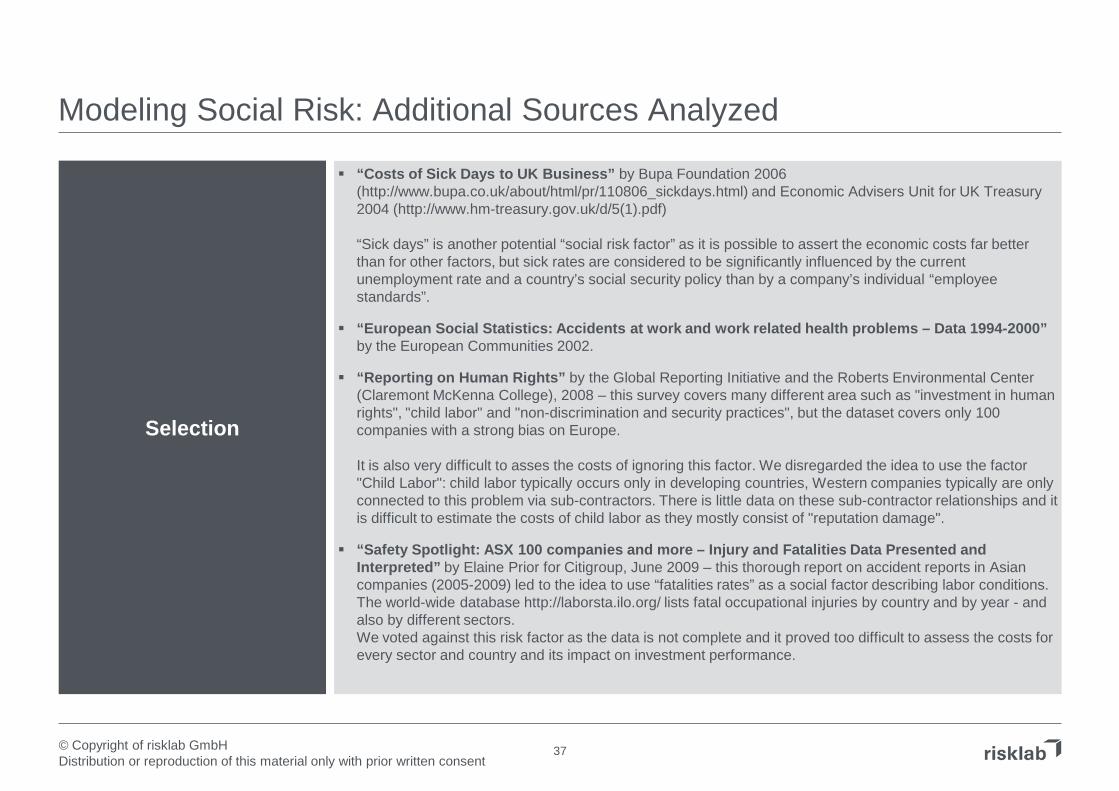
“Costs of Sick Days to UK Business” by Bupa Foundation 2006 (http://www.bupa.co.uk/about/html/pr/110806_sickdays.html) and Economic Advisers Unit for UK Treasury 2004 (http://www.hm-treasury.gov.uk/d/5(1).pdf)
“Sick days” is another potential “social risk factor” as it is possible to assert the economic costs far better than for other factors, but sick rates are considered to be significantly influenced by the current unemployment rate and a country’s social security policy than by a company’s individual “employee standards”.
“European Social Statistics: Accidents at work and work related health problems – Data 1994-2000”by the European Communities 2002.
“Reporting on Human Rights” by the Global Reporting Initiative and the Roberts Environmental Center (Claremont McKenna College), 2008 – this survey covers many different area such as "investment in human rights", "child labor" and "non-discrimination and security practices", but the dataset covers only 100 companies with a strong bias on Europe.
It is also very difficult to asses the costs of ignoring this factor. We disregarded the idea to use the factor "Child Labor": child labor typically occurs only in developing countries, Western companies typically are only connected to this problem via sub-contractors. There is little data on these sub-contractor relationships and it is difficult to estimate the costs of child labor as they mostly consist of "reputation damage".
“Safety Spotlight: ASX 100 companies and more – Injury and Fatalities Data Presented and Interpreted” by Elaine Prior for Citigroup, June 2009 – this thorough report on accident reports in Asian companies (2005-2009) led to the idea to use “fatalities rates” as a social factor describing labor conditions. The world-wide database http://laborsta.ilo.org/ lists fatal occupational injuries by country and by year - and also by different sectors. We voted against this risk factor as the data is not complete and it proved too difficult to assess the costs for every sector and country and its impact on investment performance.

38© Copyright of risklab GmbHDistribution or reproduction of this material only with prior written consent
E.S.G. factor modeling
Sensitivity derivation
Modeling Governance Risk: Data Sources
“Relative Corporate Governance Ratings in MSCI All Countries World: tilts of the Corporate Governance Quotient (CGQ®) for different sectors against MSCI AC World” provided by IDS based on monthly ratings (2005-2009) from RiskMetrics.
This data proves to be very reliable and is available in a similar matrix as the Carbon Footprint data: relative monthly ratings since January 2005 for different sectors (Consumer Disc, Consumer Staples, Energy, Financials, IT, Industrials, Materials, Health Care, Telecom, and Utilities).
RiskMetrics employ a “bottom up” approach to collect and analyze data from public disclosure documents, press releases and corporate websites and verify it with their in-house experts. The CGQ covers 7.400 companies worldwide, with underlying data points for up to 65 individual corporate governance variables in eight areas of focus: Board of Directors; Audit practices; Charter and bylaw provisions; Anti-takeover provisions; Executive and director compensation; Progressive practices; Ownership structure; Director education. These variables are weighted in the scoring methodology based on their statistical correlation to a range of risk and performance metrics. In some cases, variables are reviewed together based on the premise that corporate governance is enhanced when specific combinations of these factors are adopted. The exact weighting method was not revealed to us, but the resulting ratings proved to be similar to the other governance ratings.
risklab expert modeling.

39© Copyright of risklab GmbHDistribution or reproduction of this material only with prior written consent
Selection
Modeling Governance Risk: Additional Sources Analyzed
“The Economic Costs of Corruption: A Survey and new Evidence” by Axel Dreher and Thomas Herzfeld, June 2005 – links corruption level with GDP growth rate.
“Aggregate Governance Indicators 1996-2008” from by the Wordbank (www.govindicators.org) – ranks 212 countries by voice & accountability, political stability & no violence, government effectiveness, regulatory quality, rule of law, and control of corruption.
We liked the quality of those rating but decided against using those data as there was no sector breakdown available.
“The KPMG Survey on international corporate responsibility reporting” by KPMG available for the years 2002, 2005 and 2005 - it summarizes how many companies submit reports on corporate governance, differentiated by sectors and countries. For a short overview, look at table 3.1 and 3.3. as well as 4.3 and 4.4. We decided not to use this as a source as it covers only companies that adhere to ethical standards and do regularly publish their efforts.
“The Bribe Payers Index” by Transparency International for 1999, 2002, 2006, and 2008 - unfortunately, the sample and the method of calculation have changed over time, so it is difficult to compare the 2008 BPI directly with earlier editions of the index. Same is true for the “Corruption Perceptions Index” which goes back until 1995 – we used both to verify the other available ratings.

40© Copyright of risklab GmbHDistribution or reproduction of this material only with prior written consent
We model three equity assets: Equity of companies that are in line with E.S.G. criteria (+), of those that are not (-) and of those that have an average exposure to E.S.G. risk.
A sensitivity to the environmental factor isderived for each sector.
The sector sensitivities are weighted according to the sector representation in the MSCI World.
4040
Equity: A Closer Look at the Environmental Factor
E.S.G. factor modeling
Return adjustment
Sensitivity derivation
0]r~[E E =
The environmental factor is modeled as a stochastic process.
The CO2 Emission rights spot price represents our environmental factor.
process stochastic~ =r E
Environmental factor and relevant sensitivity are combined to give a return difference.
r~r~ EEE β=∆ ++
r~r~ EGlobalE
GlobalE β=∆
The return differences due to a social and corporate governance factor are determined likewise.An overall return difference is obtained hereafter: r~r~r~r~ /Global/
G/Global/
S/Global/
E/Global/ −+−+−+−+ ∆+∆+∆=∆
βββ−+ ,Sector
E
Global,Sector
E
,Sector
E,,
where
β∑ββ∑β ==++ Global,Sector
ESectors
SectorGlobal
E
,Sector
ESectors
Sector
E ww ,
β∑β−−
=,Sector
ESectors
Sector
E w
( )FootprintCarbonfGlobal,Sector
E=β
r~r~ EEE β=∆ −−
41© Copyright of risklab GmbHDistribution or reproduction of this material only with prior written consent
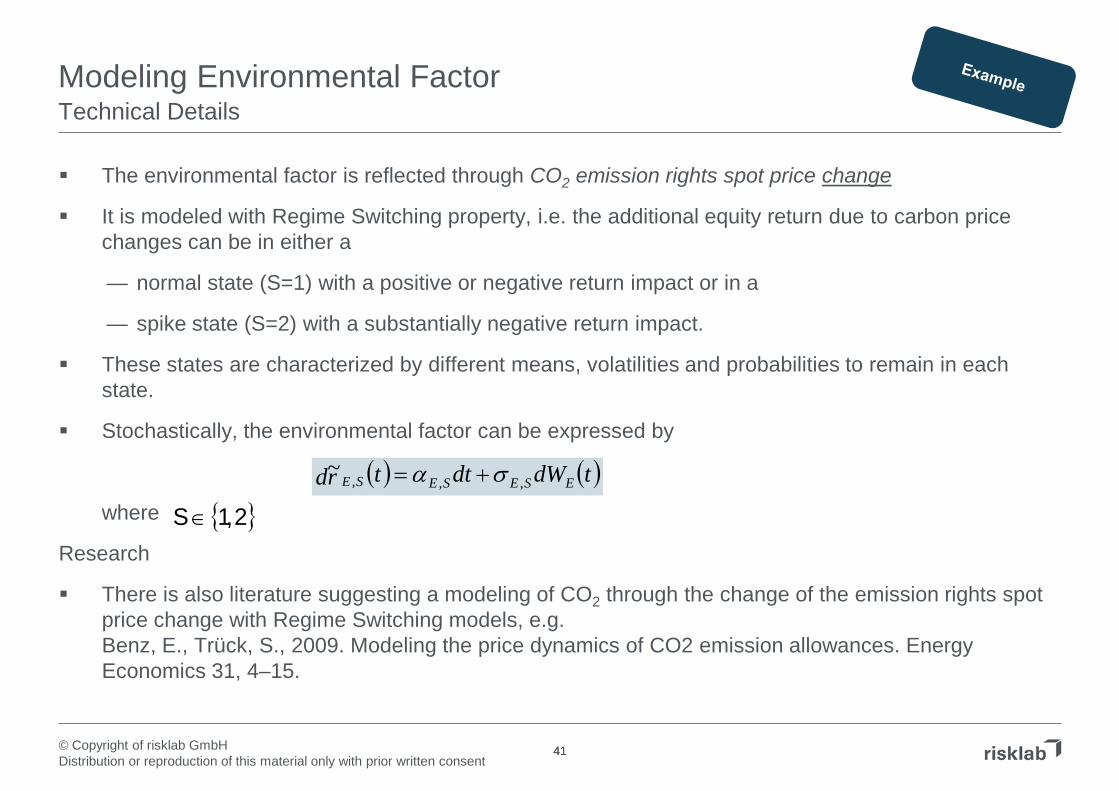
Modeling Environmental FactorTechnical Details
The environmental factor is reflected through CO2 emission rights spot price change
It is modeled with Regime Switching property, i.e. the additional equity return due to carbon price changes can be in either a
— normal state (S=1) with a positive or negative return impact or in a
— spike state (S=2) with a substantially negative return impact.
These states are characterized by different means, volatilities and probabilities to remain in each state.
Stochastically, the environmental factor can be expressed by
where
Research
There is also literature suggesting a modeling of CO2 through the change of the emission rights spot price change with Regime Switching models, e.g. Benz, E., Trück, S., 2009. Modeling the price dynamics of CO2 emission allowances. Energy Economics 31, 4–15.
41
( ) ( )tdWdttrd ESESESE ,,,~ σα +=
{ }2,1S∈

42© Copyright of risklab GmbHDistribution or reproduction of this material only with prior written consent
Left chart: the expected CO2 emission rights spot price change is assumed to be zero over time (it has no drift); however, it is expected to be quite volatile (volatility approx. 45%).
Right chart: on average the CO2 emission rights spot price is assumed to be constant over time (it does not change); since the price change is very volatile, the price can become very low or very high with a low probability.
Modeling Environmental FactorSimulation Results CO-2 Emission Right Spot Price
42
CO2 Emission Right Spot Price Change (p.a.) CO2 Emission Right Spot Price (USD)
Note: the level of the price is irrelevant for our approach since the return of the +E.S.G. Equity and -E.S.G. Equity only depends on the price change.
43© Copyright of risklab GmbHDistribution or reproduction of this material only with prior written consent
Sensitivity Derivation of Environmental FactorAnalysis of Carbon Footprint Data
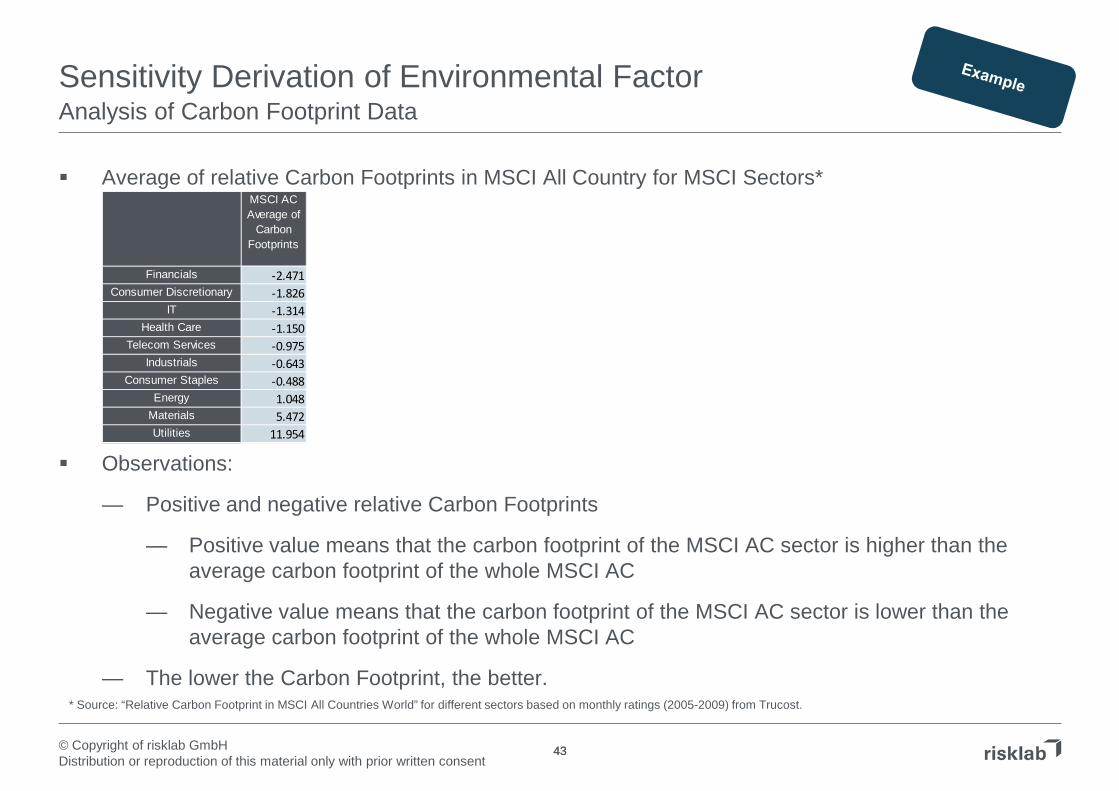
Average of relative Carbon Footprints in MSCI All Country for MSCI Sectors*
Observations:
— Positive and negative relative Carbon Footprints
— Positive value means that the carbon footprint of the MSCI AC sector is higher than the average carbon footprint of the whole MSCI AC
— Negative value means that the carbon footprint of the MSCI AC sector is lower than the average carbon footprint of the whole MSCI AC
— The lower the Carbon Footprint, the better.
43
* Source: “Relative Carbon Footprint in MSCI All Countries World” for different sectors based on monthly ratings (2005-2009) from Trucost.
MSCI AC Average of
Carbon Footprints
Financials -2.471Consumer Discretionary -1.826
IT -1.314Health Care -1.150
Telecom Services -0.975Industrials -0.643
Consumer Staples -0.488Energy 1.048
Materials 5.472Utilities 11.954

44© Copyright of risklab GmbHDistribution or reproduction of this material only with prior written consent
Sensitivity Derivation of Environmental FactorAnalysis of Carbon Footprint Data
Steps to derive the sensitivity of factor E
Normalization of Carbon Footprints to the interval [-1;0]*: the normalized values are equivalent to an average sensitivity of the sector w.r.t. CO2emission right price changes
Applying a constant factor (here -/+ 20%) to the average sensitivities to determine the sensitivities (β) for +E.S.G. and -E.S.G. Equity
Calculating the weighted averages of the sensitivities with MSCI AC sector weights** (see last line of the table)
These sensitivities are used to adjust the equity return to obtain the returns of the +E.S.G., Global and -E.S.G. Equity
44
* Note: A value of -1 means that the sector has the highest exposure w.r.t. CO2 emission rights price changes and vice versa** As per 31/08/2009
MSCI AC Average of
Carbon Footprints
MSCI ACNormalized
Carbon Footprints
(β)
+E.S.G. Equity (β)
-E.S.G. Equity (β)
MSCI AC (Weights)
Financials -2.471 -0.067 -0.053 -0.080 21.92%Consumer Discretionary -1.826 -0.108 -0.087 -0.130 8.82%
IT -1.314 -0.141 -0.113 -0.170 11.75%Health Care -1.150 -0.152 -0.122 -0.183 9.34%
Telecom Services -0.975 -0.163 -0.131 -0.196 5.10%Industrials -0.643 -0.185 -0.148 -0.222 9.99%
Consumer Staples -0.488 -0.195 -0.156 -0.234 9.49%Energy 1.048 -0.294 -0.235 -0.353 11.19%
Materials 5.472 -0.581 -0.464 -0.697 7.74%Utilities 11.954 -1.000 -0.800 -1.200 4.66%
Weighted Average -0.027 -0.225 -0.180 -0.270

45© Copyright of risklab GmbHDistribution or reproduction of this material only with prior written consent
Relative Weighting of E.S.G. Risks
It is not obvious how to scale the influence of factors E., S. & G. amongst each other with respect to their relative impact on equity risks
We have applied equal weightings for E., S., & G. upon discussion with SRI experts
For consistency matters of our assumptions we also took account of SocGen`s S.R.I Navigator Equity study*
*Source: The SRI Navigator (methodology), Societe Generale Cross Asset Research 2009

46© Copyright of risklab GmbHDistribution or reproduction of this material only with prior written consent
Relative Weighting E.S.G. Risks (1/2)Basis: SRI Navigator Results
Source: The SRI Navigator (methodology), Societe Generale Cross Asset Research 2009
Weighting results SRI Navigator (Equity research based)

47© Copyright of risklab GmbHDistribution or reproduction of this material only with prior written consent
Relative Weighting E.S.G. Risks (2/2)risklab computations on basis of SRI navigator
Steps to derive the weighting scheme
* Note: Averaging if there are several industry sectors within a MSCI sector. Stakeholder capital is omitted.
Calculating the proportions per MSCI sector* Mapping of data to MSCI sectors (GICS)

48© Copyright of risklab GmbHDistribution or reproduction of this material only with prior written consent
Expected Return
Average Influence on Global Equity (Volatility)
Factor E 0.0% 10.1%Factor S 0.0% 10.1%Factor G 0.0% 10.1%
The expected return of the risk factors E., S. & G. is zero. Therefore, the expected returns of the +E.S.G., Global and -E.S.G. Equity remain unchanged.
The risk factors E., S. & G. are calibrated in such a way that their average influence on Global Equity is equal.
Equity Return Adjustment by E.S.G. FactorsSimulation Results
Please note: concerning the return and risk related information please refer to the disclaimer at the end of the document.

49© Copyright of risklab GmbHDistribution or reproduction of this material only with prior written consent
Back Up: Portfolio Optimization and E.S.G. Risk Factors
50© Copyright of risklab GmbHDistribution or reproduction of this material only with prior written consent
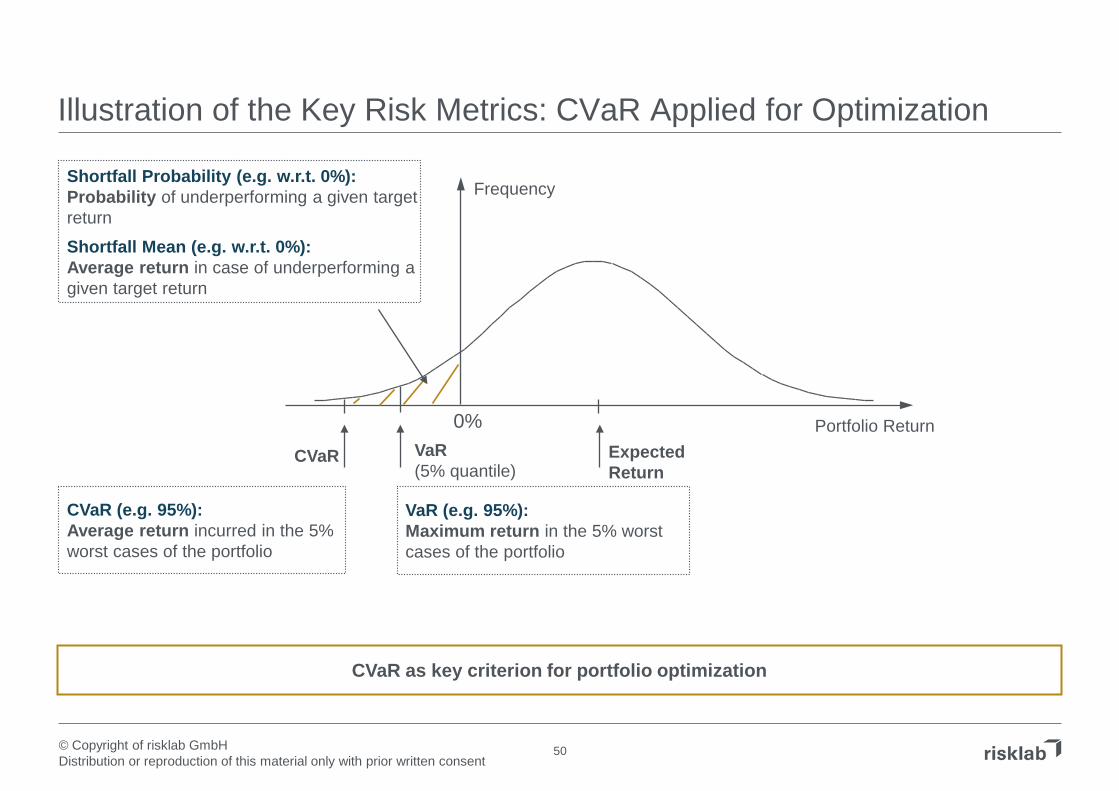
Illustration of the Key Risk Metrics: CVaR Applied for Optimization
Frequency
0% Portfolio ReturnExpected Return
VaR(5% quantile)
CVaR
VaR (e.g. 95%):Maximum return in the 5% worst cases of the portfolio
CVaR (e.g. 95%):Average return incurred in the 5% worst cases of the portfolio
Shortfall Probability (e.g. w.r.t. 0%):Probability of underperforming a given target return
Shortfall Mean (e.g. w.r.t. 0%):Average return in case of underperforming a given target return
CVaR as key criterion for portfolio optimization

51© Copyright of risklab GmbHDistribution or reproduction of this material only with prior written consent
Return / Risk Metric Definition
Expected Return Average expected return p.a.
CVaR 95% Conditional Value at Risk (CVaR) 95%: Average expected return incurred in the 5% worst case scenarios p.a.
VaR 95% Value at Risk (VaR) 95%: Average 5% quantile of all scenarios p.a.
Volatility Average return volatility p.a.
Shortfall Probability Average probability of a negative annual performance, i.e. return < 0% p.a.
Shortfall Mean Average expected return in case of a negative annual performance, i.e. return < 0% p.a.
Definition of Risk / Return Metrics Analyzed in E.S.G. Study
52© Copyright of risklab GmbHDistribution or reproduction of this material only with prior written consent
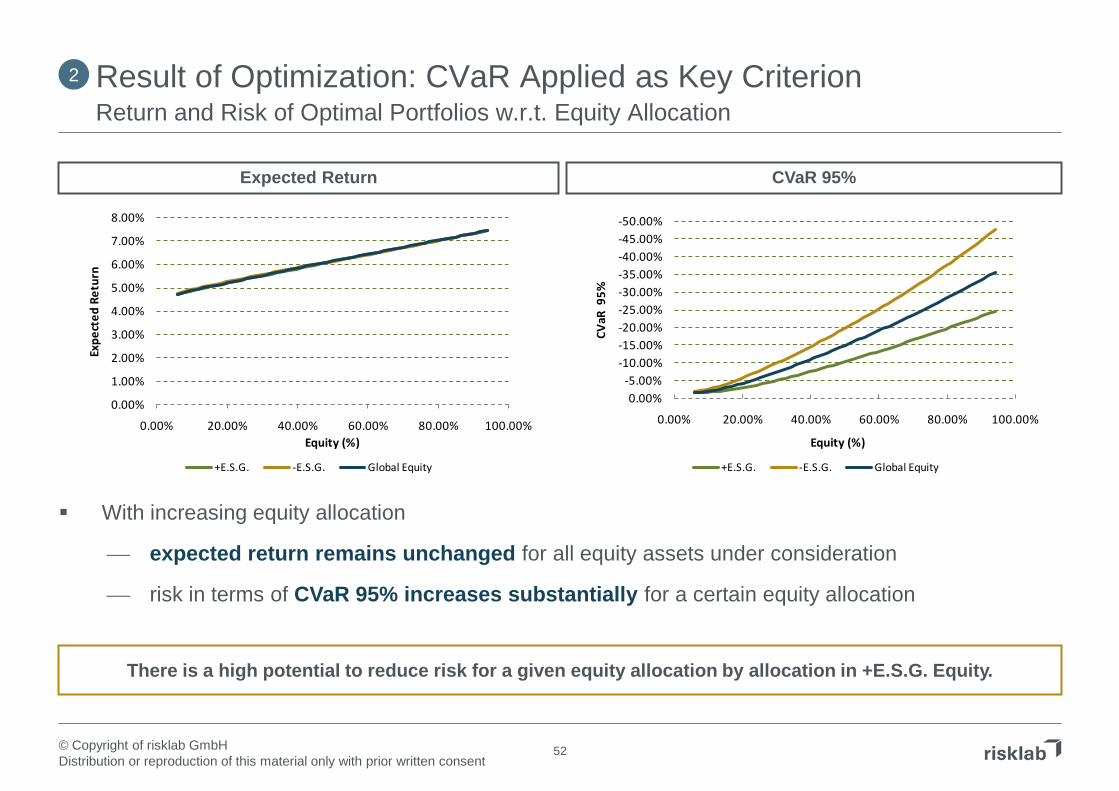
With increasing equity allocation
expected return remains unchanged for all equity assets under consideration
risk in terms of CVaR 95% increases substantially for a certain equity allocation
Result of Optimization: CVaR Applied as Key CriterionReturn and Risk of Optimal Portfolios w.r.t. Equity Allocation
Expected Return CVaR 95%
There is a high potential to reduce risk for a given equity allocation by allocation in +E.S.G. Equity.
2
0.00%
1.00%
2.00%
3.00%
4.00%
5.00%
6.00%
7.00%
8.00%
0.00% 20.00% 40.00% 60.00% 80.00% 100.00%
Expe
cted
Ret
urn
Equity (%)
+E.S.G. -E.S.G. Global Equity
-50.00%-45.00%-40.00%-35.00%-30.00%-25.00%-20.00%-15.00%-10.00%
-5.00%0.00%
0.00% 20.00% 40.00% 60.00% 80.00% 100.00%
CVaR
95%
Equity (%)
+E.S.G. -E.S.G. Global Equity
53© Copyright of risklab GmbHDistribution or reproduction of this material only with prior written consent
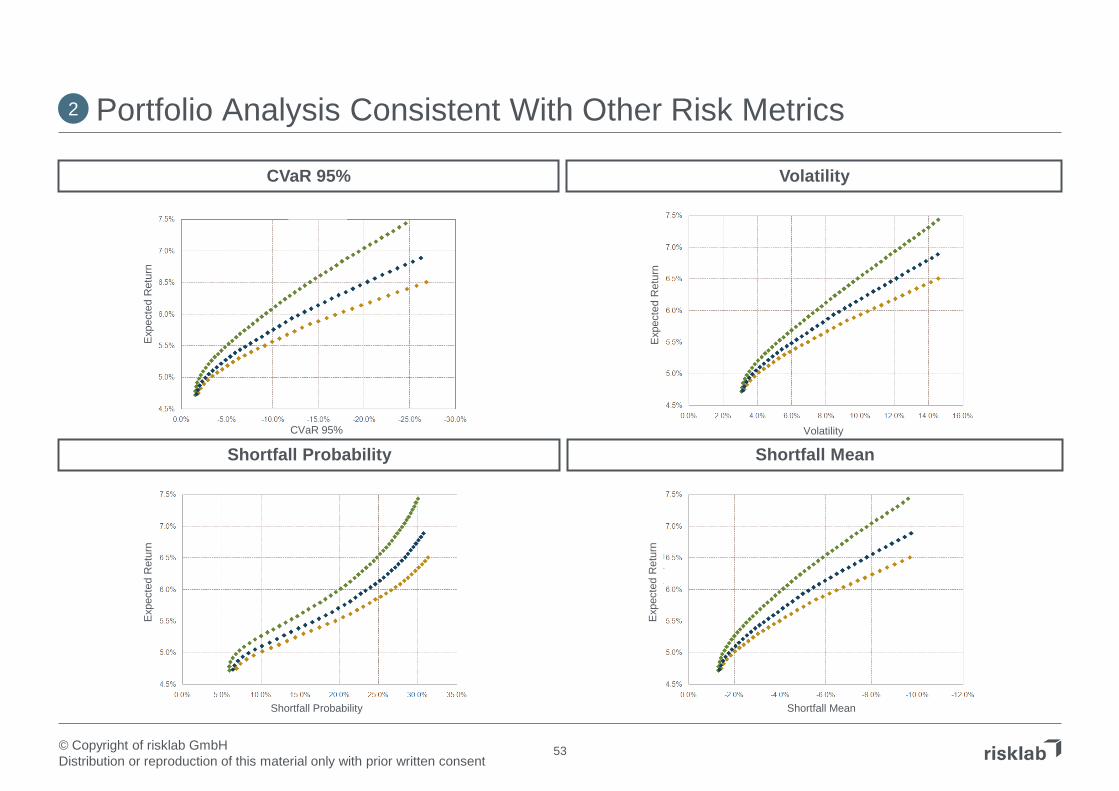
Portfolio Analysis Consistent With Other Risk Metrics
CVaR 95% Volatility
2
CVaR 95%
Exp
ecte
d R
etur
n
Shortfall ProbabilityVolatility
Exp
ecte
d R
etur
n
Shortfall Mean
Shortfall Probability
Exp
ecte
d R
etur
n
Shortfall Mean
Exp
ecte
d R
etur
n

54© Copyright of risklab GmbHDistribution or reproduction of this material only with prior written consent
Disclaimer
This material has been prepared for your personal use and for information purposes only. Any form of noticing, publishing, copying and circulating is forbidden, if you are not the intended recipient. It has not been prepared to give a legal or a tax advice.
We do not take liability for the completeness, the reliability and the exactness of this material or other information which is provided or made available to the recipient in writing, verbally or in any other way, with the exception of proven willful or grossly negligent conduct. The correctness of public data which is included in the document has been assumed, however, has not been proved again independently. The content of this document is not legally binding, unless it or parts of it are confirmed in written accordingly. Statements to the addressee are subject to the regulations of the proposal or contract respectively.
Past performance is not indicative of future results. No representation is being made that any individual account will or is likely to achieve profits or losses similar to those shown nor is any representation being made that any individual account will or is likely to achieve the level of accuracy of past projects. Hypothetical or simulated performance and risk results such as back-tested performance and risk have certain inherent limitations. Unlike an actual performance record, simulated results do not represent actual trading. Also, since the trades have not actually been executed, the results may have under- or overcompensated for the impact, if any, of certain market factors, such as lack of liquidity.
A backtest represents a model based on selection criteria applied backwards in time. The results are not indicative of how the proposed fund may perform in the future, and the model results have limitations as a representation of past performance.
The proposed risklab investment strategies may involve risk factors not characteristic of the risks of traditional investments in stocks and bonds, including the volatile and speculative qualities of commodities, emerging markets, currencies and variance swaps, the possible illiquidity of derivatives, the magnified loss potential of investments involving leverage, and the possible mispricing or improper valuation of derivatives. The proposed investment strategy may also involve short sales, in which the "covering" of borrowed securities could lead to losses for the fund under certain market conditions.
The risklab brand name is used according to the trademark license agreement between risklab GmbH, Seidlstrasse 24-24aD-80335 Munich, Germany (licensee) and Algorithmics Trademarks LLC, having its principal place of business at 1209 Orange St., Wilmington, Delaware, USA and Algorithmics Incorporated, having its principal place of business at 185 Spadina Ave., Toronto, Ontario, Canada (licensor).
The following names are registered trade marks of risklab GmbH: risklab Dynamic Surplus Return Management ™ , risklab Dynamic Strategy Portfolio (DSP)™ , risklab Variance Premium Trading Index™ , risklab Commodities 4 Seasons Index™ .
Related Documents