1 ESB ESB - EPRI Smart Grid EPRI Smart Grid Demonstration Project Demonstration Project Anthony Walsh ESB Networks Anthony Walsh ESB Networks PNM, Albuquerque, 13 PNM, Albuquerque, 13 th th Oct 2009 Oct 2009 EPRI Smart Grid Demo Peer Review ESB “Host-Site” Project EPRI Smart Grid Demonstration Peer Review Web-cast • Purpose: – Share project with Collaborators & Peer Review Team – Get Feedback from members & peer review team (Sanity Check) • ESB’s proposal has gone through EPRI’s Technical Review • Currently 5 Smart Grid “Host-Site” demonstration Projects Utility Collaborator Submits Demonstration Candidate Project EPRI Technical Review Smart Grid Peer Review EPRI Board of Directors Review Feedback / Criteria Test Project meets Criteria

Welcome message from author
This document is posted to help you gain knowledge. Please leave a comment to let me know what you think about it! Share it to your friends and learn new things together.
Transcript

1
ESB ESB -- EPRI Smart Grid EPRI Smart Grid Demonstration ProjectDemonstration Project
Anthony Walsh ESB NetworksAnthony Walsh ESB NetworksPNM, Albuquerque, 13PNM, Albuquerque, 13thth Oct 2009Oct 2009
EPRI Smart Grid Demo Peer ReviewESB “Host-Site” Project
EPRI Smart Grid Demonstration Peer Review Web-cast
• Purpose: – Share project with Collaborators
& Peer Review Team– Get Feedback from members &
peer review team (Sanity Check)• ESB’s proposal has gone through
EPRI’s Technical Review• Currently 5 Smart Grid “Host-Site”
demonstration Projects
Utility CollaboratorSubmits Demonstration
Candidate Project
EPRI TechnicalReview
Smart Grid PeerReview
EPRIBoard of Directors
Review
Feedback / Criteria Test
Project meetsCriteria

2
ESB NETWORKS
ESB ESB -- EPRI Smart Grid EPRI Smart Grid Demonstration ProjectDemonstration Project
Anthony WalshAnthony Walsh
Republic of Ireland – BackgroundESB Group:
• € 8b assets ; ESBN €5b
• € 3.5b turnover (2008), € 0.3b Net Profit
• 2,2m Electricity Customers
– Population 4 M - 40% live in countrysideArea: 70,000 km2
– Total GWh 23GWh - 5,500kWh pa /Domestic Customer
– System Peak: 5,035 MW
• ESB Employees 7,900; ESBN 3,500

3
Interconnectors
IndependentGenerators
2.2 millionCustomers
IndependentSuppliers
ESB Generation
ESB Customer Supply
TransmissionSystem
DistributionSystem
Market
Electricity Industry Structure…
ESB Networks
Transmission Transmission 6,300 km of Overhead Network6,300 km of Overhead Network
140 km of Underground Cables140 km of Underground Cables165 HV Stations165 HV Stations
€€1b RAB Value 1b RAB Value
DistributionDistribution140,000 km of OH Lines140,000 km of OH Lines
19,000 km of UG Cables19,000 km of UG Cables630 HV Substations630 HV Substations230,000 MV Transformers/Units230,000 MV Transformers/Units2m meters2m meters
€€5b RAB Value 5b RAB Value
Transmission
400kV 220kV 110kV 38kV MV 20 kV & 10 kV
Distribution
LV 400 & 230 V
Network Assets

4
€m
PR2 - Infrastructure InvestmentInvestment in Network Assets by year – in present-day money values
0
100
200
300
400
500
600
700
800
1980 1985 1990 1995 2000 2005 2010
Very Large Capital Very Large Capital Programme has been Programme has been
delivereddelivered
PR1PR1
€€3.3Bn3.3Bn
PR2PR2
€€3.1Bn3.1Bn
90,101MV Total
kMClass
26,83420kV Already
7,63120kV ‘09
16,57020kV ’10-‘15
39,06510kV
16,000km of NRP in 2005 …..
Lower Achill to Los Angeles and back !Lower Achill to Los Angeles and back !

5
ESBN’s Strategic Vision To 2020
And to be a Leader in Carbon Management And to be a Leader in Carbon Management and Energy Efficiencyand Energy Efficiency
World Class Sustainable NetworksRenewables at >40% connected
Electric Vehicles – 10% by 2020
Smart Grid – Smart Meter
Carbon Zero by 2035
Sustainability Strategy
Internal Sustainability
A sustainable energy system connecting with energy aware interactive customers
Renewables& Clean
GenerationSmart Networks
SmartMetering
ConnectedHome
Distributed Energy Storage
(Plug-in ElectricalVehicles)

6
Evolving Smart Networks Model
Renewables& Clean
Generation Smart Network Smart Metering Connected Home Electric Vehicle
Operational Efficiencies
Telecommunications
Network/IT Architecture
New billing and payment opportunitiesRate choices (TOU) to manage costs
Energy information for analysisSecurity
DER (Microgen) EV Infrastructure and metering
Smart thermostats and lighting
Energy smart appliances
Remote disconnect
Network Data Modeling
Fault detection and management
Energy flow
Information flow
Smarter NetworksBuilding Blocks Already Underway
MDM/ARMMDM/ARMIWMIWM
Renewables Renewables IntegrationIntegration
IntegratedIntegratedICT/SAPICT/SAPPlatformPlatform
SCADA/OMSSCADA/OMS
GIS/GIS/GeoDARTGeoDART
Integrated Integrated NCCNCC
CentralisedCentralisedMV ControlMV Control
AutomatedAutomatedSwitchesSwitches
Smarter Smarter NetworksNetworks
7
ESB Networks IT Landscape 2009 (NITA - €100m)
Business Warehouse
(BW )
Enterprise Portal
FMIS
PHR ARM
IS-U
SAP R/3
Capital Portfolio Mgt
(xRPM )
Capital Portfolio Mgt
(xRPM )
SAP Applications
GIS DFIS
WebFramme Viewer
Geodart
Geolas
MapinfoAreas
Replacement
CLICK Schedule
SCADA
ABB
OMS
Oracle
IS-U • Meter Operations• Meter Reading• DUoS Billing• Change of Supplier• Data Aggregation
Business Warehouse• Management Reporting
Enterprise Portal• Transaction updates•Userability
SCADA • Remote Switching• System Operation Mgt• Alarms/Event
OMS• Outage Management• Call Centre support• Event
GIS• Plotting/ Network Diagrams • Network connectivity• Centre Site UpdatesAreas
• Customer Appointment Mgt• Call Centre support• Daily Scheduling
Completed
Work in Progress
Mobile Data Mgt
Asset ManagementAsset Management
Programme PlanningProgramme Planning
Project ManagementProject Management
MRSOMRSO
MaintenanceMaintenance
ConstructionConstruction
DesignDesign
Connection agreementsConnection agreements
Service DeliveryService Delivery
Meter readingMeter reading
MV90MV90
MVRSMVRS
MAU /MAMMAU /MAM
SAP MISAP MI
SAP ISUSAP ISU
SAP XI / SAP XI / SeebeyondSeebeyond
Enterprise PortalEnterprise Portal
Business Warehouse Business Warehouse
xRPMxRPM
StreamserveStreamserve
AREASAREAS
DWMSDWMS
ProcurementProcurement
Materials ManagementMaterials Management
Management AccountingManagement Accounting
ETC ETC ETCETC
SCCSCC
ISCISC
MCCMCC
BW teamBW team
WEB teamWEB team
ABAPABAP
BASISBASIS
SecuritySecurity
Business Process Business Process IT SystemIT System Support TeamsSupport Teams
VMSVMS
SAP R/3SAP R/3
Business Process / IT System interdependence – Not joking!!

8
ESBESB--EPRI Smart Grid Demonstration ProjectEPRI Smart Grid Demonstration Project
Wind GenerationWind Generation
Smart Meter Customer Behaviour TrialsSmart Meter Customer Behaviour Trials
Smart Green CircuitsSmart Green Circuits
Electric VehiclesElectric Vehicles
Alignment with EPRI Critical ElementsAlignment with EPRI Critical Elements
Wind GenerationWind Generation
Smart Meter Customer Behaviour TrialsSmart Meter Customer Behaviour Trials
Smart Smart ––Green CircuitsGreen Circuits
Electric VehiclesElectric Vehicles
Alignment with EPRI Critical ElementsAlignment with EPRI Critical Elements
ESBESB--EPRI Smart Grid Demonstration ProjectEPRI Smart Grid Demonstration Project

9
Connected: BlueIn Progress: RedLicence `Issuing : Black
Wind Connections MW
1,161
ConnectedConnectedConnected
1,2691,269
InProgress
3,9403,940
Being Licensed Connected+Licensed
6,370
InQueue
4,600
October ‘09

10
Freq. %WindSystem MW
• A. Exploration of Voltage / Var control on Distribution connected windfarms
• B. Use of voltage regulators to limit voltage rise• C. Single transformer cluster stations for
windfarms
ESB EPRI Wind Demonstration Project
11
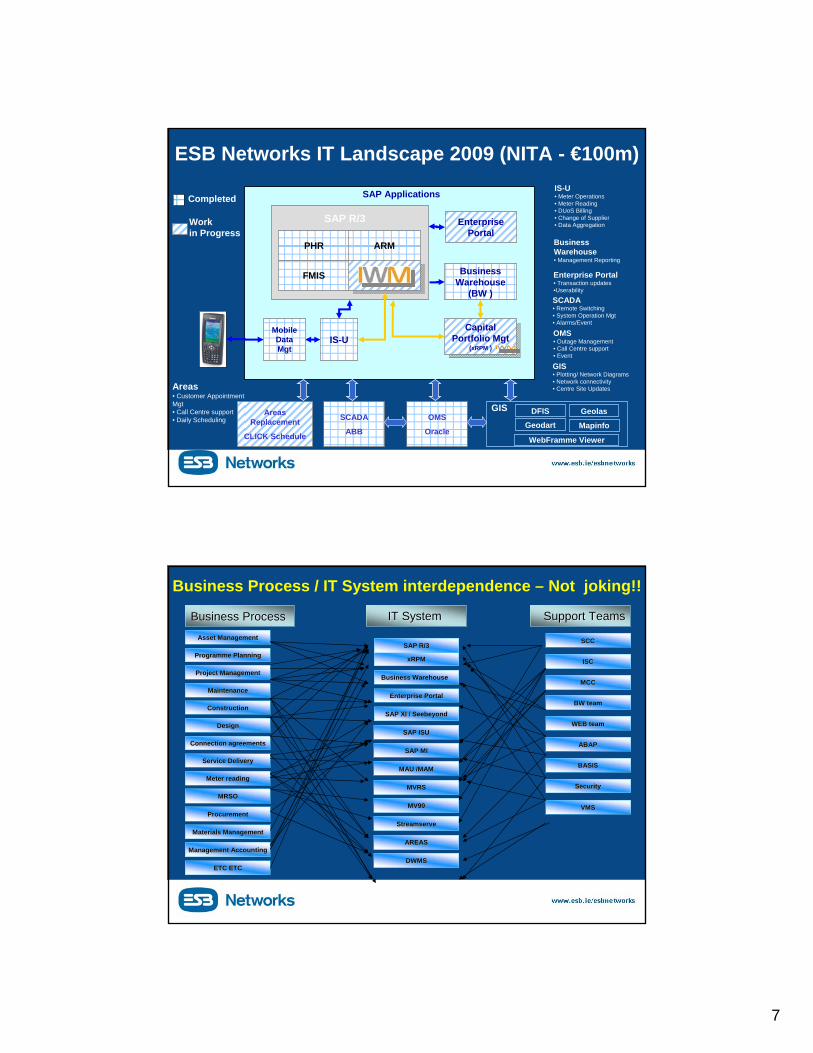
Project A - Exploration of Voltage/Varcontrol - Drivers
• Modern wind turbines have to varying degrees, the ability to operate in various modes and at a range of Power Factors
• Distribution/Grid Codes now require this capability
• Eirgrid want to see DSO take a more active part in VAR control
• Distribution connected Wind farms may wish to avail of ancillaryservice contracts
Project A Objectives• To prove the viability of distribution connected windfarms operating
in constant voltage mode
• To assess impact on DSO busbar voltage
• To assess potential for hunting between controllers
• To verify software modelling so that it can be used in future installations
• To inform second stage where load customers are directly affected

12
Proposed stage 1 sites• Knockawarriga and
Tournafulla windfarms are connected via 38kV cable to a dedicated 110/38kV 63MVA transformer
• In Knockawarriga, Nordex are keen to demonstrate new features of the turbines there.
Load
Trien 110kV busbar
19km 38kV cable
Tournafulla WF 17.2 MWKnockawarriga WF 22.5 MW
4km 38kV cable4km 38kV cable
Implementation steps – Stage 1
1. Secure agreement in principle with owners – Done2. Meet owners to agree details and agree risk cover/spread3. Ensure that pre-trial data is logged from on-site PQ meters4. Determine an appropriate voltage setpoint for Knockawarriga and
model behaviour5. Set Knockawarriga to constant voltage operation6. Monitor for x months – compare with predicted behaviour7. Determine an appropriate voltage setpoint for Tournafulla and
model behaviour8. Set Knockawarriga to constant voltage operation9. Monitor for x months – compare with predicted behaviour
Evaluate overall results – particularly impact on 38kV voltage at Trien

13
Project B - Use of voltage regulators to limit voltage rise - Background
• Voltage rise on Distribution networks due generation is a well known phenomenon
• For the situation as shown below, the voltage at the windfarm site will be higher than that at the regulated DSO busbar
• The voltage at the WF site cannot be allowed to exceed certain limits
Windfarm
Voltage rise
MW
Regulated DSO busbar
Use of voltage regulators to limit voltage rise - Situation
• Innovation: Use 38kV voltage regulator on backfeed
Windfarm
110kV station A 110kV station B38kV voltage regulator

14
Project B Objectives
• To select a site for implementation [Done]
• Monitor voltage at relevant nodes post installation
• Verify loadflow modelling
Project C - Single Trafo Cluster Station
• Develop economic design of HV/MV substation which can facilitateconnection of large amounts of radially fed windfarms using single trafo station design
• Reliability less than for conventional station but costs are substantially reduced
• Windfarms do not require high reliability connections.

15
Example of Sequential Approach
110/38kV Stn
110kV
38kV
MV?
38kV/MV Stn
38kV/MV Stn
38kV
38kV
• Windfarms connected in sequence shown• 38kV re-enforcements are driven until windfarm 4 uses all available capacity• When windfarm 5 is processed, there is no more local capacity left
No. 1
No. 2No. 3
No. 4
No. 5
Example of Gate Processing
110kV
38kV
110/38kV Stn
38kV/MV Stn
38kV/MV Stn
110kV
38kV
• When all five are considered together, it becomes clear that themost efficient connection method is a new 110kV “cluster “station

16
Single transformer cluster stations for windfarms- Background
• Gate System drives the need for new build cluster stations
• In the determination of the least cost method of connection for the group, DSO constrained to use combinations of standard size transformers available
• Standard sizes evolved from load planning philosophy
Project Objectives• Seek input from wind industry on possible transformer
sizes [Done]• Engage ESBI to study and report on such aspects as:
– Short level implications– Percentage impedance– Voltage Rise– Switchgear implications SC and TRV– Spares
• Discuss outcome internally• If positive, go to enquiry for additional transformer sizes

17
Wind GenerationWind Generation
Smart Meter Customer Behaviour TrialsSmart Meter Customer Behaviour Trials
SmartSmart--Green CircuitsGreen Circuits
Electric VehiclesElectric Vehicles
Alignment with EPRI Critical ElementsAlignment with EPRI Critical Elements
ESBESB--EPRI Smart Grid Demonstration ProjectEPRI Smart Grid Demonstration Project
Objectives of Customer Behaviour Trial• Objective is ‘to ascertain the potential for smart meter technology to
effect measurable change in consumer behaviour, which will result in the reduction of peak demand and overall energy use, when operated with appropriate DSM initiatives’– 6,400 customers– One year profile data per customer (at least 6 actual months) for
benchmark period– One year of stimuli– Real Tariffs applied to Real customers– Suppliers to be given daily validated half hourly data each day– Final conclusions by CER based on ESRI National Business Case
Study Q1 2011
Q3 Q4 Q1 Q2 Q3 Q4 Q1 Q2 Q3 Q4 Q1 Q220112008 2009 2010
Baseline Data
Selection & Recruitment
DecommissionLive TOU Bills & Monitoring
Results
Installation
Q2Q1

18
Energy Awareness
Tariff Incentives/penalties
Prepayment Options
Control Opportunities
Electricity Import / Export
Managing Demand & Consumption
Sample Monthly Bill

19
ToU Tariffs for Pilot• Jan 09 on
• ‘make whole concept’
• Multi TOU Trial tariffs based on baseline tariff
• Control Group
• CER final decision
In Home Display Developed for Pilot – by Customers

20
AMI is more than just meters – it’s a complex integration of sensors, devices, communications, and software
technologies
9
Meter Data Management System
4 Field staff 6 Field staff
5LAN
3Meters7 WAN
1Load Control Devices
10 IT System Operators
Suppliers
Customers
2Displays
8 Data Collection Systems
11 Integration with Existing Distributor Systems
GIS
ERP
OMS
CIS
Web
12 External Data Provision
CustomerPremise
Last MileLAN
WAN Data Center –NMS and MDMS
Data Center –Legacy Apps
Customers and Other Stakeholders

21
Project Objectives• Target is how smart meters to enable demand and consumption in
countries with a winter peak - Largest trial of its kind in Europe
• independently verified statistical experiment
• Findings on %reduction accurate to within 1%.
• Its success is key to the roll out of smart metering in Ireland.
• Puts the customer requirements at the centre of smart metering system design
• ESBN would be pleased to share our learnings with EPRI.
Wind GenerationWind Generation
Smart Meter Customer Behaviour TrialsSmart Meter Customer Behaviour Trials
SmartSmart--Green CircuitsGreen Circuits
Electric Vehicles Electric Vehicles
Alignment with EPRI Critical ElementsAlignment with EPRI Critical Elements
ESBESB--EPRI Smart Grid Demonstration ProjectEPRI Smart Grid Demonstration Project

22
Objectives• To assess the network impact of electric vehicles, with an emphasis
on field trials, customer participation and charging strategies.
Assessment on amount of EV/Charging allowable on existing networkIdentification of low cost investments required to increase Network EV Capacity Assessment of impact on Power Quality of EV and how this can be kept within standard without unduly limiting use of EVAssess scope for use of EV in DSMAssess scope for future use of Electric Vehicle to Grid.
Electric Vehicles Are Back!

23
Informal EV Standardisation GroupElectric Utilities Automotive
Manufacturers
ESBN research Standard Charging Fast Charging Pilot

24
Project Scope
– Suburban with mix of OH/UG Networks e.g. Goatstown in Dublin– Rural – 15kVA Transformer feeding EV e.g. Ennis
Model Network – Measure load characteristics of typical EV’s– Populate model with varying penetrations of EV’s– Assess impact on Voltage, Capacity and PQ of EV’s
Equip up to 20 houses with EV Charging points beside outside Meter Box & SmartMeter
– Assess Charging Point arrangement– Trial EV Charging by loaning EV to selected residents.– Compare Measured results with model
• Assess feasibility of faster charging on LV network by using SmartMeter to share charging capacity
• Assess capacity of LV Network for EV, based on likely statistical household load patterns, influenced by Tariffs (e.g. inference from Night Tariff impact on use of Day load)
• Assess potential barriers to future Vehicle to Grid
• Assess possibility of using EV as ballast load for WIND, using HAN to control in response to Wind level on system
• Establish upstream impact of high EV Penetration rates (MV, 38kV and 110kV)
Project Scope

25
Possible area for Smart Meters and EV Project – Roebuck Downs, Goatstown
- In Dun Laoghaire/Rathdown and about a mile beyond Dublin Corporation
- Mixture of new UG Network, Older OH Network in Semi-Detatched estates
-Mixture of Infill Apartment blocks with large School and Mosque
-Close to UCD
Roebuck Downs – UG LV
Gledswood – OH LV

26
Domestic Charging Of Electric Vehicles
Smart MeterSmart Meter
Electric VehicleElectric Vehicle
External Charge Unit beside Meter Box Type Electrical Resulting
Charge Power
Standard230V 16A1 or 3 phase
100%6 – 8 h
3kW10KW
Opportunity400V 32A
50% in 30 mins22kW
Emergency 20km in 10 mins
Range Extension
400 v 63A80% in 30 mins 44kW

27
Impact of 10% Passenger Vehicles on Demand Profile in 2020
Potential Benefits to ESB
In Depth assessment of impact of EV on Urban and Rural networks
Testing EV Charging in Domestic Premises
Evaluation of potential to increase charging rates or expand charging times without incurring extra costs for network Infrastructure

28
Wind GenerationWind Generation
Smart Meter Customer Behaviour TrialsSmart Meter Customer Behaviour Trials
SmartSmart--Green CircuitsGreen Circuits
Electric VehiclesElectric Vehicles
Alignment with EPRI Critical ElementsAlignment with EPRI Critical Elements
ESBESB--EPRI Smart Grid Demonstration ProjectEPRI Smart Grid Demonstration Project
Objectives• To develop and test improved methods for estimating
losses on rural feeders
• To assess and demonstrate methods of reducing losses.– Voltage Upgrading i.e. 20kV Conversion– Dynamic re-configuration of networks to minimise losses– Re-conductoring– Amorphous core transformers– Installation of Capacitor banks– Lower average supply voltage using line drop compensation
29
Efficient Networks GreenFleet
ISO 14001
Wise upto Waste
Renewables
DSM
EfficientNetworks
Harmonywith our
environment
SmartMeters
Smart Networks
GreenFleet
ISO 14001
Wise upto Waste
Renewables
DSM
EfficientNetworks
Harmonywith our
environment
GreenFleet
GreenFleet
ISO 14001
ISO 14001
Wise upto WasteWise upto Waste
RenewablesRenewables
DSMDSM
EfficientNetworksEfficientNetworks
Harmonywith our
environment
Harmonywith our
environment
SmartMetersSmartMeters
Smart Networks
Smart Networks
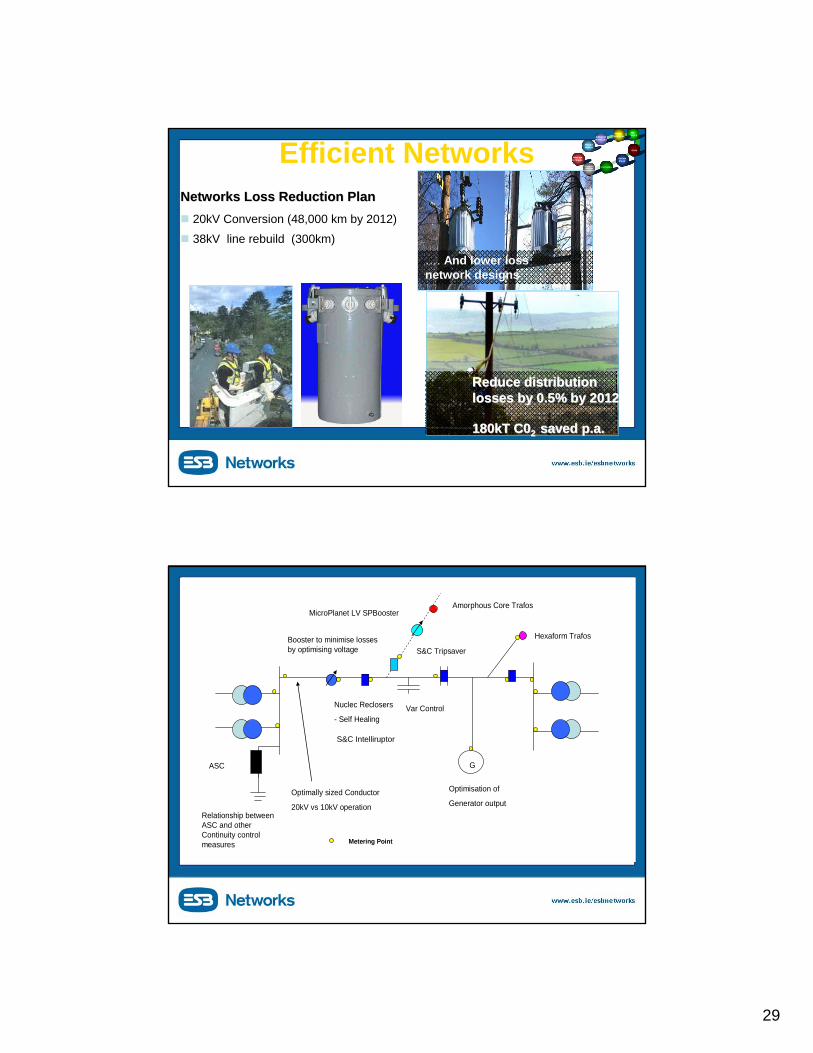
Networks Loss Reduction PlanNetworks Loss Reduction Plan20kV Conversion (48,000 km by 2012)38kV line rebuild (300km)
…. And lower lossnetwork designs
Reduce distribution Reduce distribution losses by 0.5% by 2012losses by 0.5% by 2012
180kT C0180kT C02 2 saved p.a.saved p.a.
Amorphous Core Trafos
S&C Tripsaver
Nuclec Reclosers
- Self Healing
Booster to minimise losses by optimising voltage
G
Optimally sized Conductor
20kV vs 10kV operation
Var Control
Optimisation of
Generator output
ASC
Relationship between ASC and other Continuity control measures
Hexaform Trafos
MicroPlanet LV SPBooster
Metering Point
S&C Intelliruptor

30
Green Circuits Proposed• 4 MV circuits proposed
– 10kV Circuit with 660kW Windfarm– 20kV Circuit with High Losses where Landfill Gas DG to be connected– 2 x 10kV Circuits where analysis shows 20kV Conversion apposite
• MV Circuit Typical Features :– Circuit contains two interconnected feeders between two
38/MVsubstations– 25 – 40 km Route length between 38kV stations– Serves 800 – 1,200 customers – 250 - 400 single phase transformers + some three phase transformers – Existing losses believed to be significant. – Some small scale dispersed wind generation

31
Analysis • Phase 1 : Use ½ Hour load flows and DSS to
estimate losses impact of:– 20kV conversion– Dynamic sectionalising – Capacitor banks– Losses impact of better phase balancing– Voltage Reduction at MV using Regulator, at LV using
Microplanet– Economics of amorphous core transformers
• Phase 2 : Test out /demonstrate solutions that indicate positive Cost Benefit
Expected Benefits to ESB
• More effective planning of rural networks– Better method for estimating load, voltage and losses
• New techniques to minimise losses may be established– Re-balancing of the network
– Dynamic re-configuration
– Capacitor banks (not currently deployed by ESB)
– Voltage reduction

32
Summary
• ESB looking forward to working with EPRI on Smart-Networks Initiative
• ESB welcomes comments and suggestions from all other utility participants
• ESB network happy to share any points of learning with utilities here today
Wind Generation Wind Generation
Smart Meter Customer Behaviour TrialsSmart Meter Customer Behaviour Trials
SmartSmart--Green CircuitsGreen Circuits
Electric VehiclesElectric Vehicles
Alignment with EPRI Critical ElementsAlignment with EPRI Critical Elements
ESBESB--EPRI Smart Grid Demonstration ProjectEPRI Smart Grid Demonstration Project
33
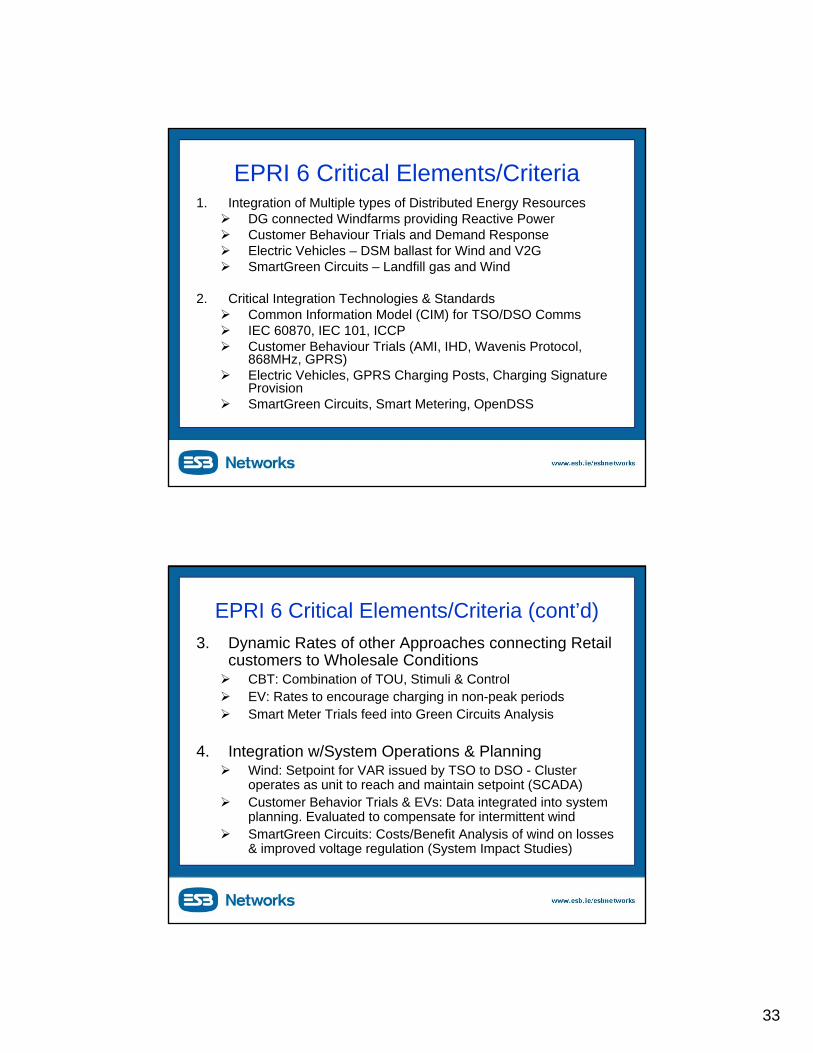
EPRI 6 Critical Elements/Criteria1. Integration of Multiple types of Distributed Energy Resources
DG connected Windfarms providing Reactive PowerCustomer Behaviour Trials and Demand ResponseElectric Vehicles – DSM ballast for Wind and V2GSmartGreen Circuits – Landfill gas and Wind
2. Critical Integration Technologies & StandardsCommon Information Model (CIM) for TSO/DSO CommsIEC 60870, IEC 101, ICCPCustomer Behaviour Trials (AMI, IHD, Wavenis Protocol, 868MHz, GPRS)Electric Vehicles, GPRS Charging Posts, Charging Signature ProvisionSmartGreen Circuits, Smart Metering, OpenDSS
EPRI 6 Critical Elements/Criteria (cont’d)3. Dynamic Rates of other Approaches connecting Retail
customers to Wholesale ConditionsCBT: Combination of TOU, Stimuli & ControlEV: Rates to encourage charging in non-peak periodsSmart Meter Trials feed into Green Circuits Analysis
4. Integration w/System Operations & PlanningWind: Setpoint for VAR issued by TSO to DSO - Cluster operates as unit to reach and maintain setpoint (SCADA)Customer Behavior Trials & EVs: Data integrated into system planning. Evaluated to compensate for intermittent windSmartGreen Circuits: Costs/Benefit Analysis of wind on losses & improved voltage regulation (System Impact Studies)

34
EPRI 6 Critical Elements/Criteria (cont’d)5. Compatibility with EPRI’s Initiative & Approach
Leverage IntelliGrid Methodology: Use Case DevelopmentCost Benefit AnalysisProject will support integrating varying types of DER at multiple levels of ESB’s system
6. Leverage Additional Funding SourcesProject Funded By ESBNInkind support from turbine manufacturer & VendorsSupport from Irish Electricity Regulator (CBT)ESBN/Government Partnership on EV’sUniversity Analysis supported by Science Foundation of Ireland
Time’s up!
Who has the first question?
Email Feedback or questions to: [email protected]

35
Support SlidesSupport Slides
Related Documents