ESA Application Notes By Dr.Howard Penrose Assembled by:Prescon Engineering

Welcome message from author
This document is posted to help you gain knowledge. Please leave a comment to let me know what you think about it! Share it to your friends and learn new things together.
Transcript
ESA Application Notes By Dr.Howard Penrose
Assembled by:Prescon Engineering
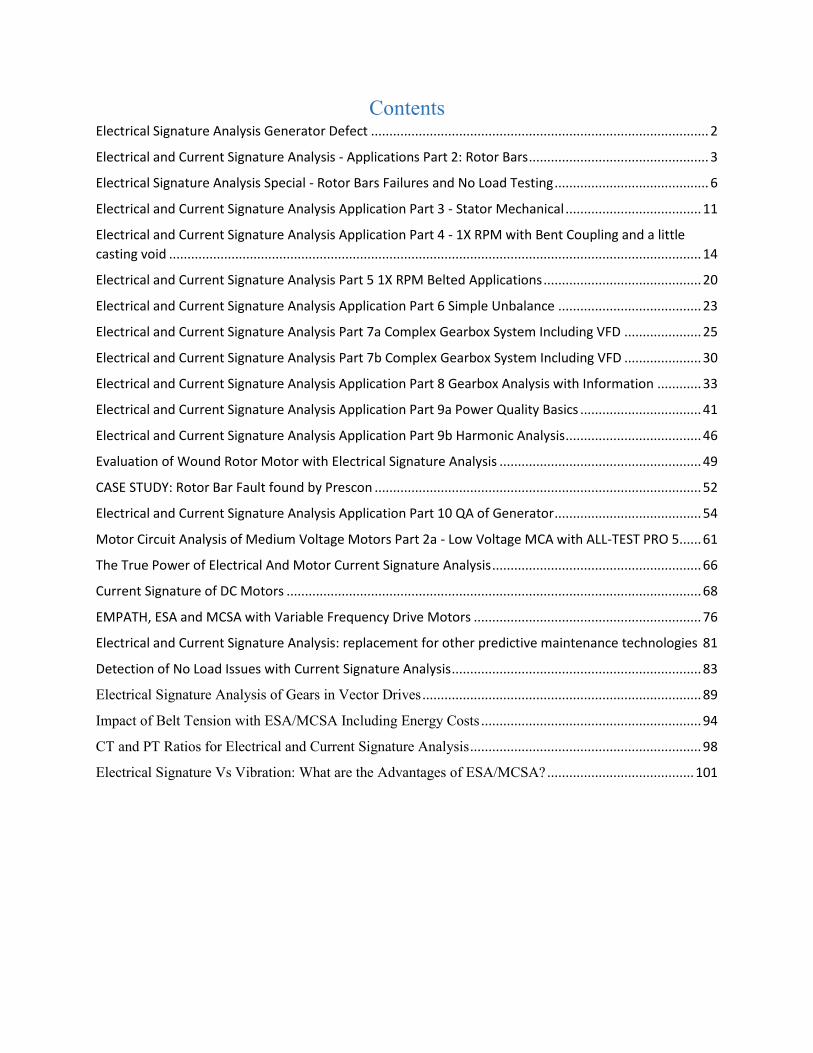
Contents Electrical Signature Analysis Generator Defect ............................................................................................ 2
Electrical and Current Signature Analysis - Applications Part 2: Rotor Bars ................................................. 3
Electrical Signature Analysis Special - Rotor Bars Failures and No Load Testing .......................................... 6
Electrical and Current Signature Analysis Application Part 3 - Stator Mechanical ..................................... 11
Electrical and Current Signature Analysis Application Part 4 - 1X RPM with Bent Coupling and a little
casting void ................................................................................................................................................. 14
Electrical and Current Signature Analysis Part 5 1X RPM Belted Applications ........................................... 20
Electrical and Current Signature Analysis Application Part 6 Simple Unbalance ....................................... 23
Electrical and Current Signature Analysis Part 7a Complex Gearbox System Including VFD ..................... 25
Electrical and Current Signature Analysis Part 7b Complex Gearbox System Including VFD ..................... 30
Electrical and Current Signature Analysis Application Part 8 Gearbox Analysis with Information ............ 33
Electrical and Current Signature Analysis Application Part 9a Power Quality Basics ................................. 41
Electrical and Current Signature Analysis Application Part 9b Harmonic Analysis ..................................... 46
Evaluation of Wound Rotor Motor with Electrical Signature Analysis ....................................................... 49
CASE STUDY: Rotor Bar Fault found by Prescon ......................................................................................... 52
Electrical and Current Signature Analysis Application Part 10 QA of Generator ........................................ 54
Motor Circuit Analysis of Medium Voltage Motors Part 2a - Low Voltage MCA with ALL-TEST PRO 5 ...... 61
The True Power of Electrical And Motor Current Signature Analysis ......................................................... 66
Current Signature of DC Motors ................................................................................................................. 68
EMPATH, ESA and MCSA with Variable Frequency Drive Motors .............................................................. 76
Electrical and Current Signature Analysis: replacement for other predictive maintenance technologies 81
Detection of No Load Issues with Current Signature Analysis .................................................................... 83
Electrical Signature Analysis of Gears in Vector Drives ............................................................................ 89
Impact of Belt Tension with ESA/MCSA Including Energy Costs ............................................................ 94
CT and PT Ratios for Electrical and Current Signature Analysis ............................................................... 98
Electrical Signature Vs Vibration: What are the Advantages of ESA/MCSA? ........................................ 101
Electrical Signature Analysis Generator Defect
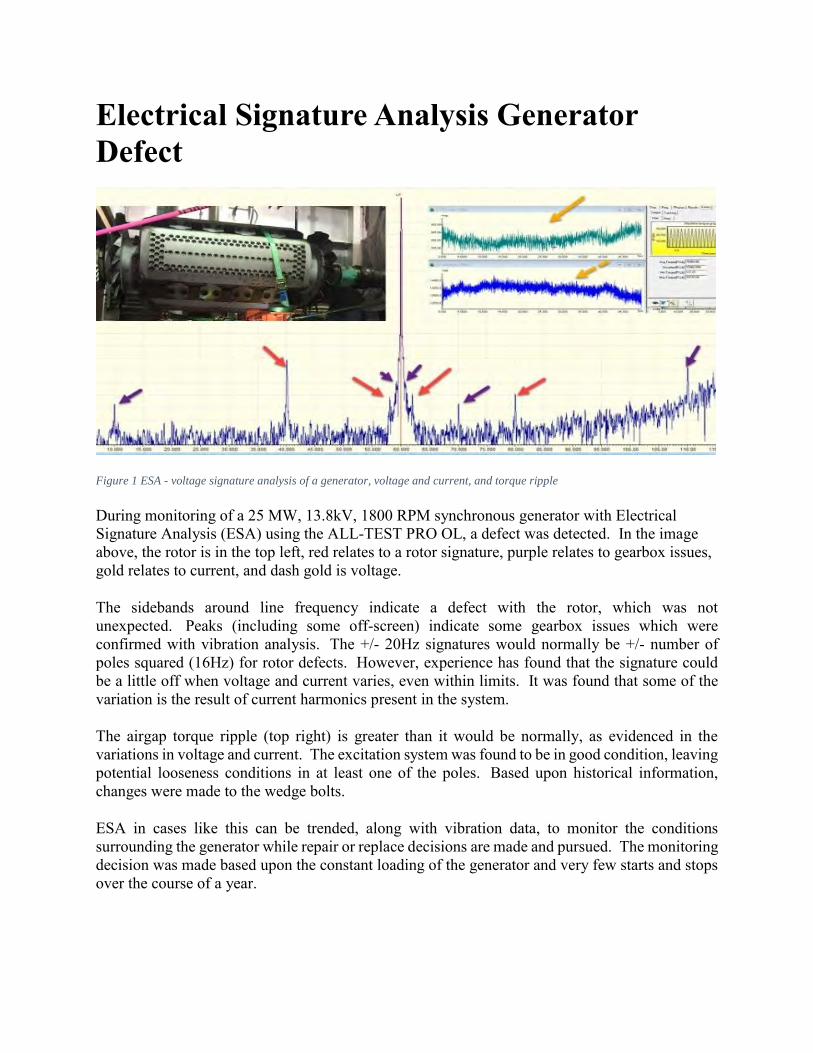
Figure 1 ESA - voltage signature analysis of a generator, voltage and current, and torque ripple
During monitoring of a 25 MW, 13.8kV, 1800 RPM synchronous generator with Electrical Signature Analysis (ESA) using the ALL-TEST PRO OL, a defect was detected. In the image above, the rotor is in the top left, red relates to a rotor signature, purple relates to gearbox issues, gold relates to current, and dash gold is voltage.
The sidebands around line frequency indicate a defect with the rotor, which was not unexpected. Peaks (including some off-screen) indicate some gearbox issues which were confirmed with vibration analysis. The +/- 20Hz signatures would normally be +/- number of poles squared (16Hz) for rotor defects. However, experience has found that the signature could be a little off when voltage and current varies, even within limits. It was found that some of the variation is the result of current harmonics present in the system.
The airgap torque ripple (top right) is greater than it would be normally, as evidenced in the variations in voltage and current. The excitation system was found to be in good condition, leaving potential looseness conditions in at least one of the poles. Based upon historical information, changes were made to the wedge bolts.
ESA in cases like this can be trended, along with vibration data, to monitor the conditions surrounding the generator while repair or replace decisions are made and pursued. The monitoring decision was made based upon the constant loading of the generator and very few starts and stops over the course of a year.
Electrical and Current Signature Analysis - Applications Part 2: Rotor Bars
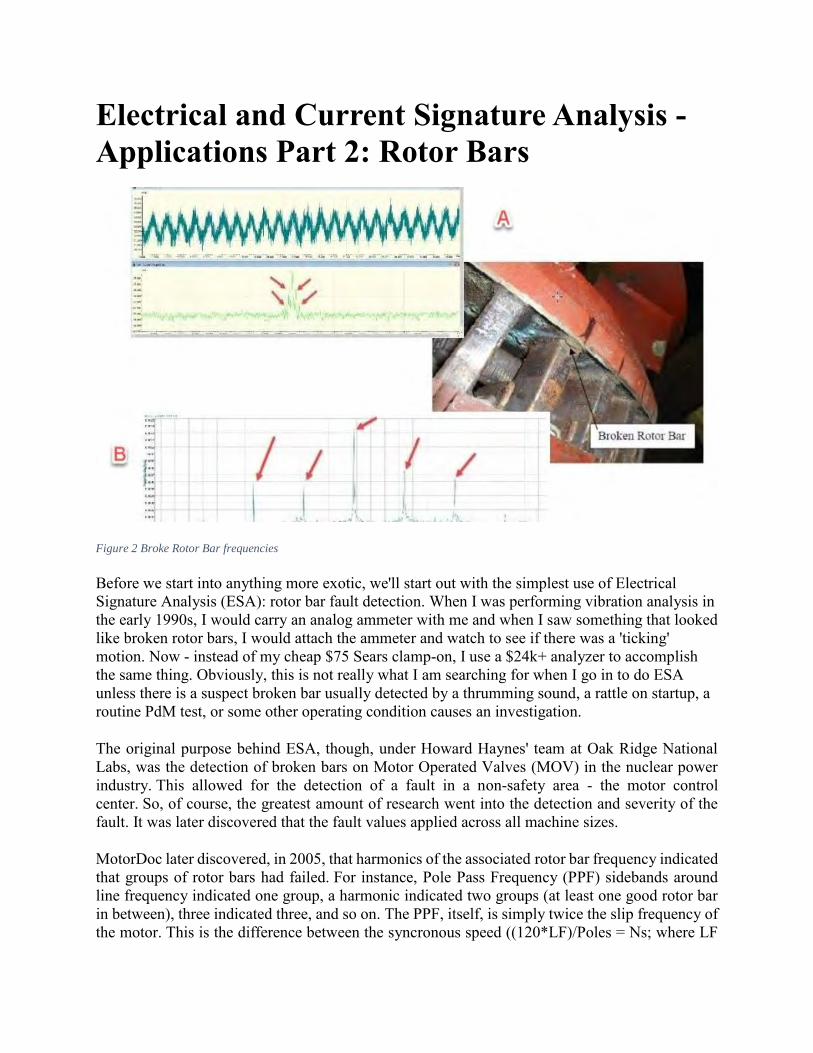
Figure 2 Broke Rotor Bar frequencies
Before we start into anything more exotic, we'll start out with the simplest use of Electrical Signature Analysis (ESA): rotor bar fault detection. When I was performing vibration analysis in the early 1990s, I would carry an analog ammeter with me and when I saw something that looked like broken rotor bars, I would attach the ammeter and watch to see if there was a 'ticking' motion. Now - instead of my cheap $75 Sears clamp-on, I use a $24k+ analyzer to accomplish the same thing. Obviously, this is not really what I am searching for when I go in to do ESA unless there is a suspect broken bar usually detected by a thrumming sound, a rattle on startup, a routine PdM test, or some other operating condition causes an investigation.
The original purpose behind ESA, though, under Howard Haynes' team at Oak Ridge National Labs, was the detection of broken bars on Motor Operated Valves (MOV) in the nuclear power industry. This allowed for the detection of a fault in a non-safety area - the motor control center. So, of course, the greatest amount of research went into the detection and severity of the fault. It was later discovered that the fault values applied across all machine sizes.
MotorDoc later discovered, in 2005, that harmonics of the associated rotor bar frequency indicated that groups of rotor bars had failed. For instance, Pole Pass Frequency (PPF) sidebands around line frequency indicated one group, a harmonic indicated two groups (at least one good rotor bar in between), three indicated three, and so on. The PPF, itself, is simply twice the slip frequency of the motor. This is the difference between the syncronous speed ((120*LF)/Poles = Ns; where LF
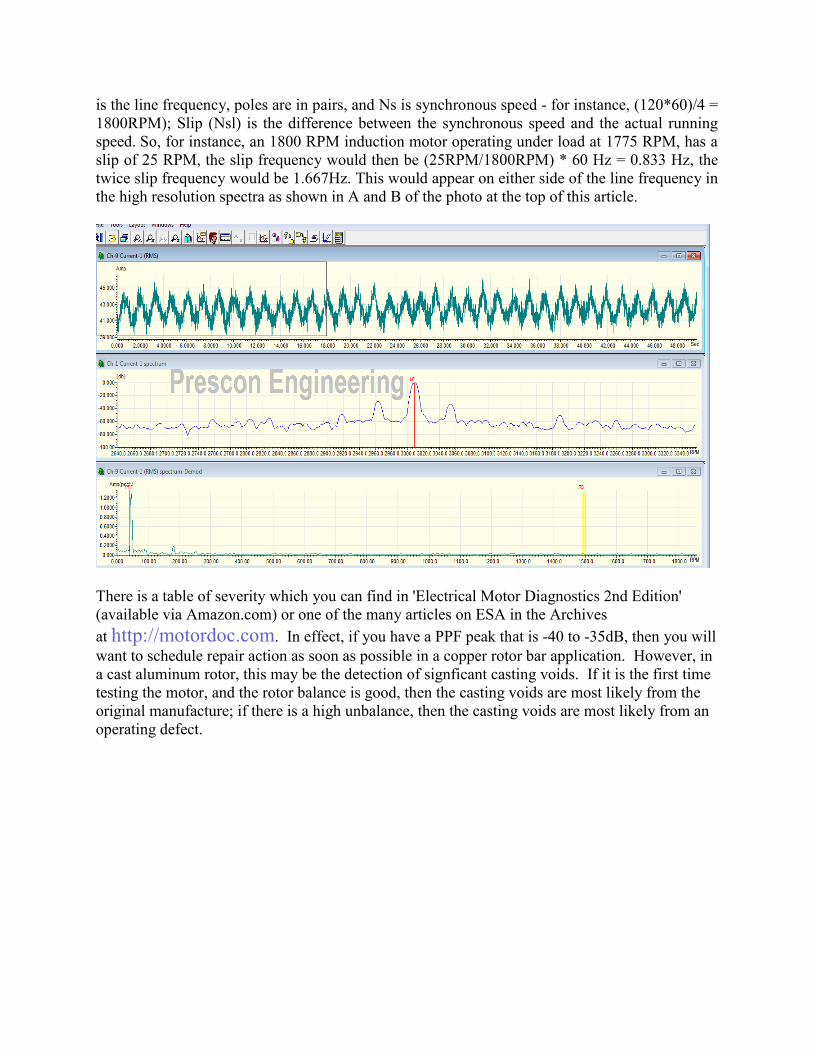
is the line frequency, poles are in pairs, and Ns is synchronous speed - for instance, (120*60)/4 = 1800RPM); Slip (Nsl) is the difference between the synchronous speed and the actual running speed. So, for instance, an 1800 RPM induction motor operating under load at 1775 RPM, has a slip of 25 RPM, the slip frequency would then be (25RPM/1800RPM) * 60 Hz = 0.833 Hz, the twice slip frequency would be 1.667Hz. This would appear on either side of the line frequency in the high resolution spectra as shown in A and B of the photo at the top of this article.
There is a table of severity which you can find in 'Electrical Motor Diagnostics 2nd Edition' (available via Amazon.com) or one of the many articles on ESA in the Archives at http://motordoc.com. In effect, if you have a PPF peak that is -40 to -35dB, then you will want to schedule repair action as soon as possible in a copper rotor bar application. However, in a cast aluminum rotor, this may be the detection of signficant casting voids. If it is the first time testing the motor, and the rotor balance is good, then the casting voids are most likely from the original manufacture; if there is a high unbalance, then the casting voids are most likely from an operating defect.
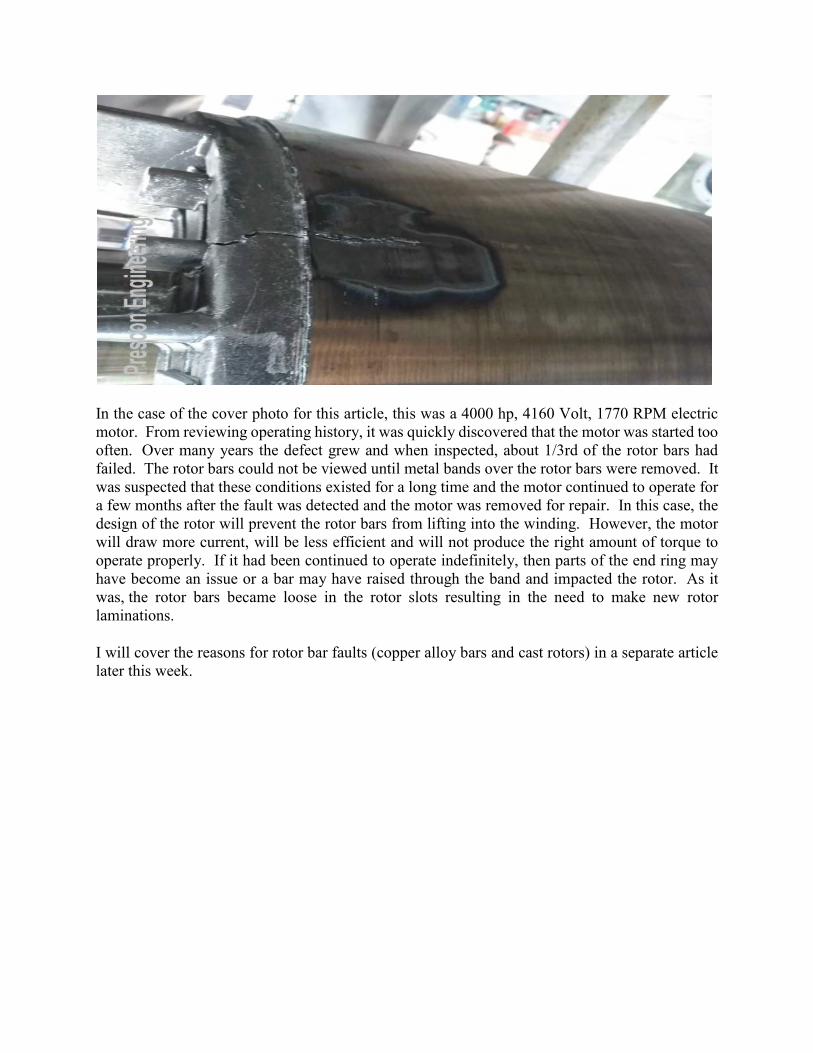
In the case of the cover photo for this article, this was a 4000 hp, 4160 Volt, 1770 RPM electric motor. From reviewing operating history, it was quickly discovered that the motor was started too often. Over many years the defect grew and when inspected, about 1/3rd of the rotor bars had failed. The rotor bars could not be viewed until metal bands over the rotor bars were removed. It was suspected that these conditions existed for a long time and the motor continued to operate for a few months after the fault was detected and the motor was removed for repair. In this case, the design of the rotor will prevent the rotor bars from lifting into the winding. However, the motor will draw more current, will be less efficient and will not produce the right amount of torque to operate properly. If it had been continued to operate indefinitely, then parts of the end ring may have become an issue or a bar may have raised through the band and impacted the rotor. As it was, the rotor bars became loose in the rotor slots resulting in the need to make new rotor laminations.
I will cover the reasons for rotor bar faults (copper alloy bars and cast rotors) in a separate article later this week.
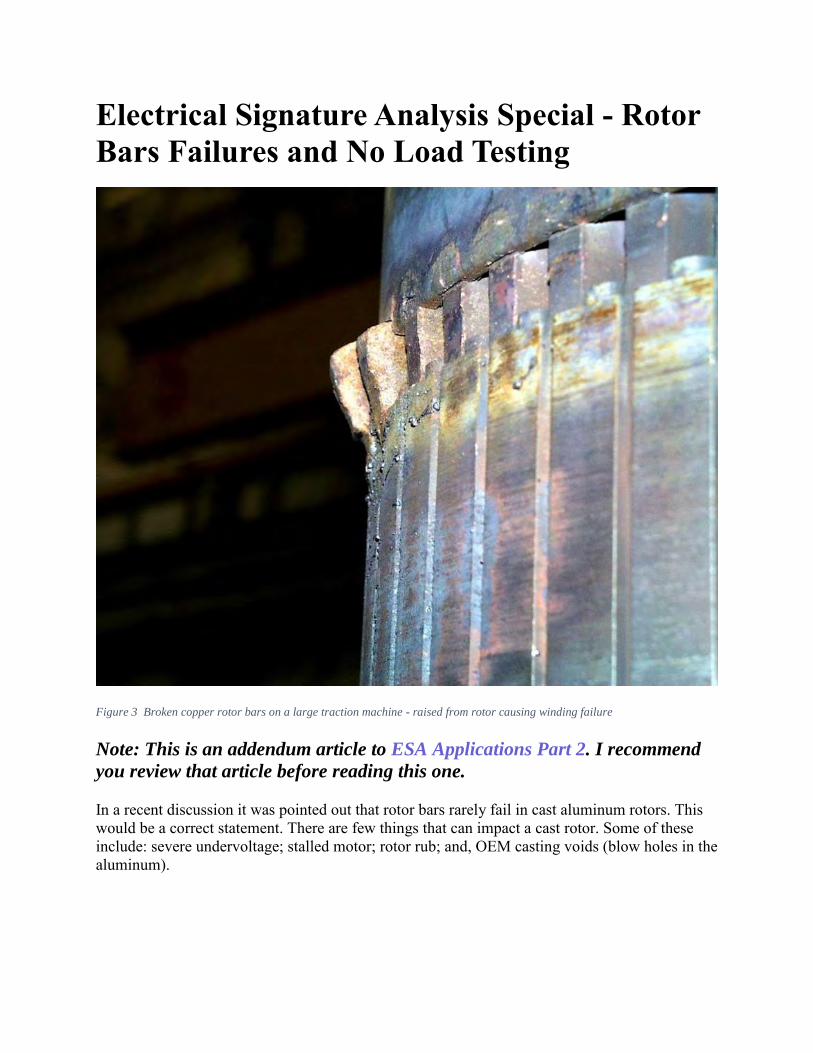
Electrical Signature Analysis Special - Rotor Bars Failures and No Load Testing
Figure 3 Broken copper rotor bars on a large traction machine - raised from rotor causing winding failure
Note: This is an addendum article to ESA Applications Part 2. I recommend
you review that article before reading this one.
In a recent discussion it was pointed out that rotor bars rarely fail in cast aluminum rotors. This would be a correct statement. There are few things that can impact a cast rotor. Some of these include: severe undervoltage; stalled motor; rotor rub; and, OEM casting voids (blow holes in the aluminum).
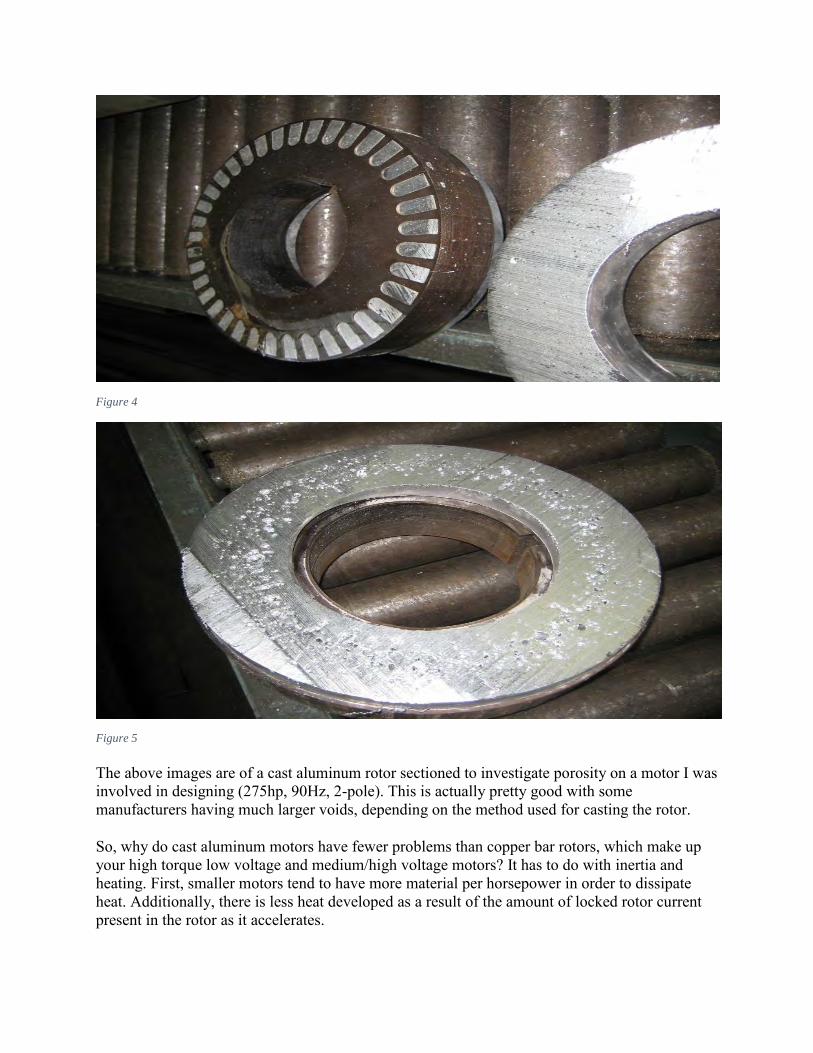
Figure 4
Figure 5
The above images are of a cast aluminum rotor sectioned to investigate porosity on a motor I was involved in designing (275hp, 90Hz, 2-pole). This is actually pretty good with some manufacturers having much larger voids, depending on the method used for casting the rotor.
So, why do cast aluminum motors have fewer problems than copper bar rotors, which make up your high torque low voltage and medium/high voltage motors? It has to do with inertia and heating. First, smaller motors tend to have more material per horsepower in order to dissipate heat. Additionally, there is less heat developed as a result of the amount of locked rotor current present in the rotor as it accelerates.
The difference between a cast rotor and a copper bar rotor has to do with the mass and endrings, in addition to the dimensions of the rotor. With a cast aluminum rotor, the complete rotor and casting is a single mass, so the inertia and forces are calculated as one. With a copper alloy bar, the end rings and main mass of the rotor are calculated separately, as there is usually a separation between the rotor core and the end ring. Each time a larger motor starts, the heat builds up and the bars twist as the inertia is different. When a larger motor is started too often, the bars heat up significantly, which also occurs if there is a long starting time, and the bars twist, resulting in hardening of the copper and embrittlement. At some point, the forces will cause fractures to occur usually where the bars leave the slots or at the end rings.
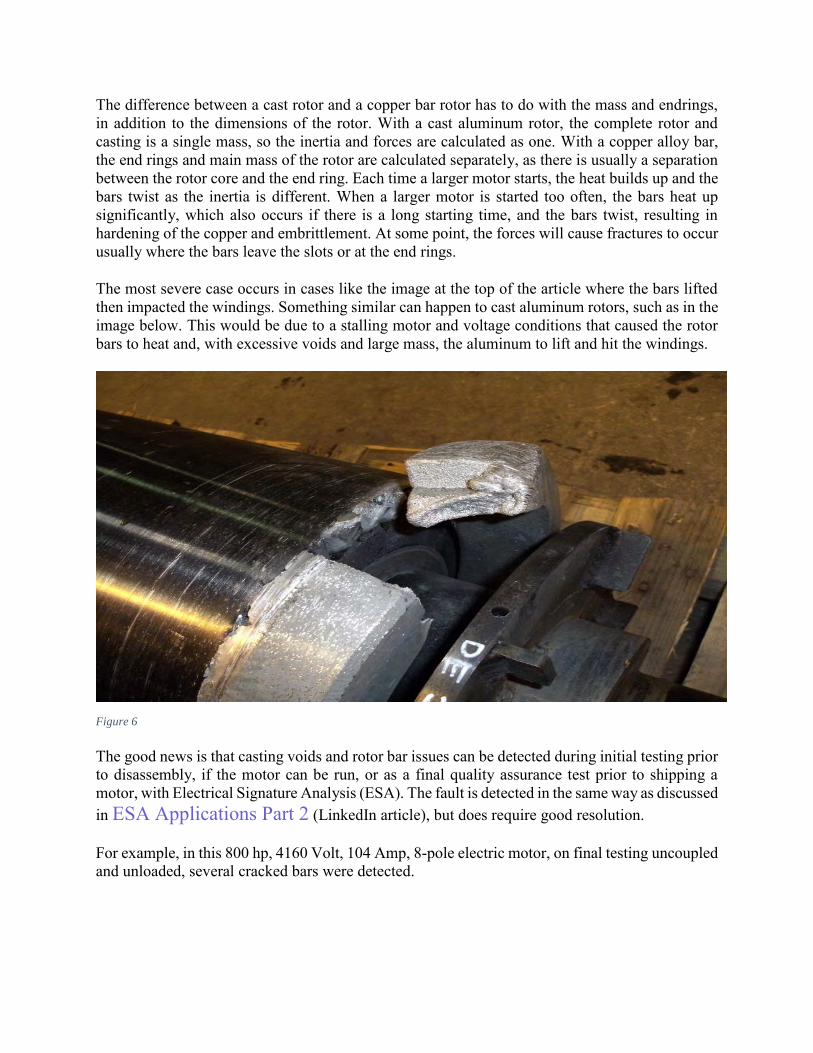
The most severe case occurs in cases like the image at the top of the article where the bars lifted then impacted the windings. Something similar can happen to cast aluminum rotors, such as in the image below. This would be due to a stalling motor and voltage conditions that caused the rotor bars to heat and, with excessive voids and large mass, the aluminum to lift and hit the windings.
Figure 6
The good news is that casting voids and rotor bar issues can be detected during initial testing prior to disassembly, if the motor can be run, or as a final quality assurance test prior to shipping a motor, with Electrical Signature Analysis (ESA). The fault is detected in the same way as discussed in ESA Applications Part 2 (LinkedIn article), but does require good resolution.
For example, in this 800 hp, 4160 Volt, 104 Amp, 8-pole electric motor, on final testing uncoupled and unloaded, several cracked bars were detected.
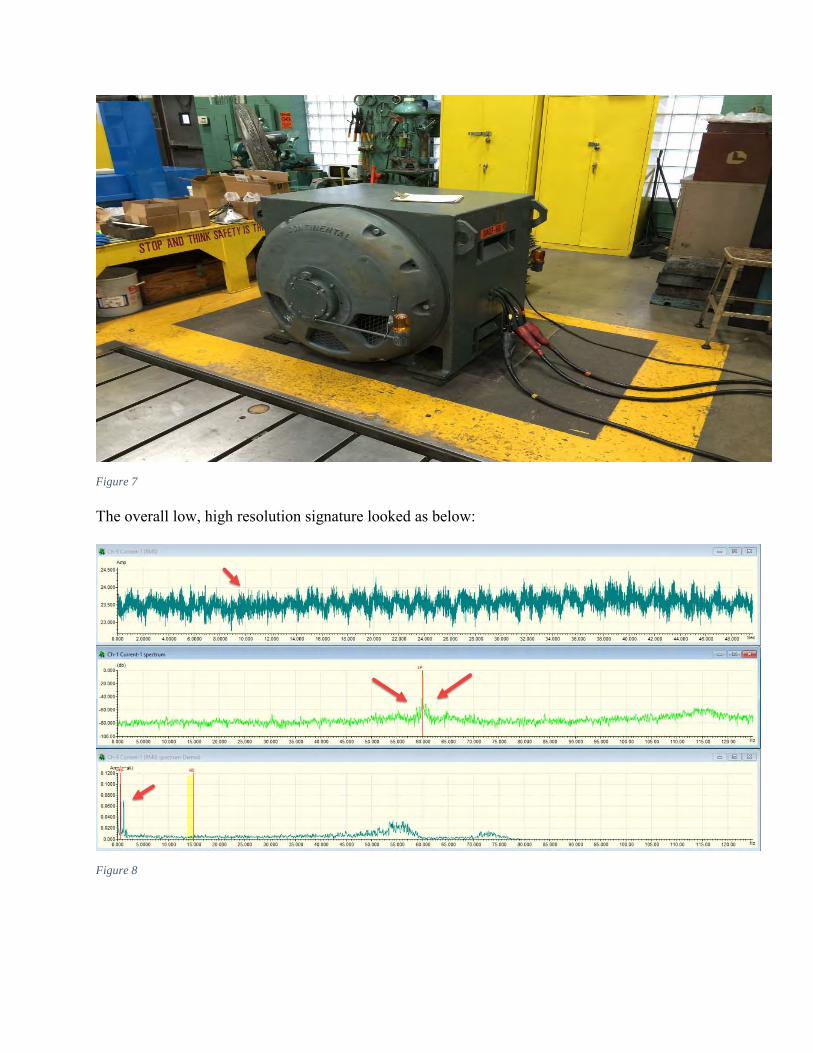
Figure 7
The overall low, high resolution signature looked as below:
Figure 8

Figure 9
As noted, the peaks are tighter on the line frequency with harmonics. As mentioned in ESA Applications Part 2, the harmonics indicate that there are at least two sets of fractured bars in this machine.
One way to get the same results in cases where an electric motor operates near synchronous speed is to reduce the final test voltage on the motor, uncoupled. This will cause the rotor to slow, increasing the PPF and allowing any faults to be detected. With the motor uncoupled and unloaded in a repair environment, you can perform this with little worry for a short time. Many motor repair shops have adjustable voltage or you can run a medium voltage motor for a short time at low voltage. For instance, a 4160 Vac motor operated at 480 Vac. I have performed this testing on machines as small as 1hp (746 Watts).
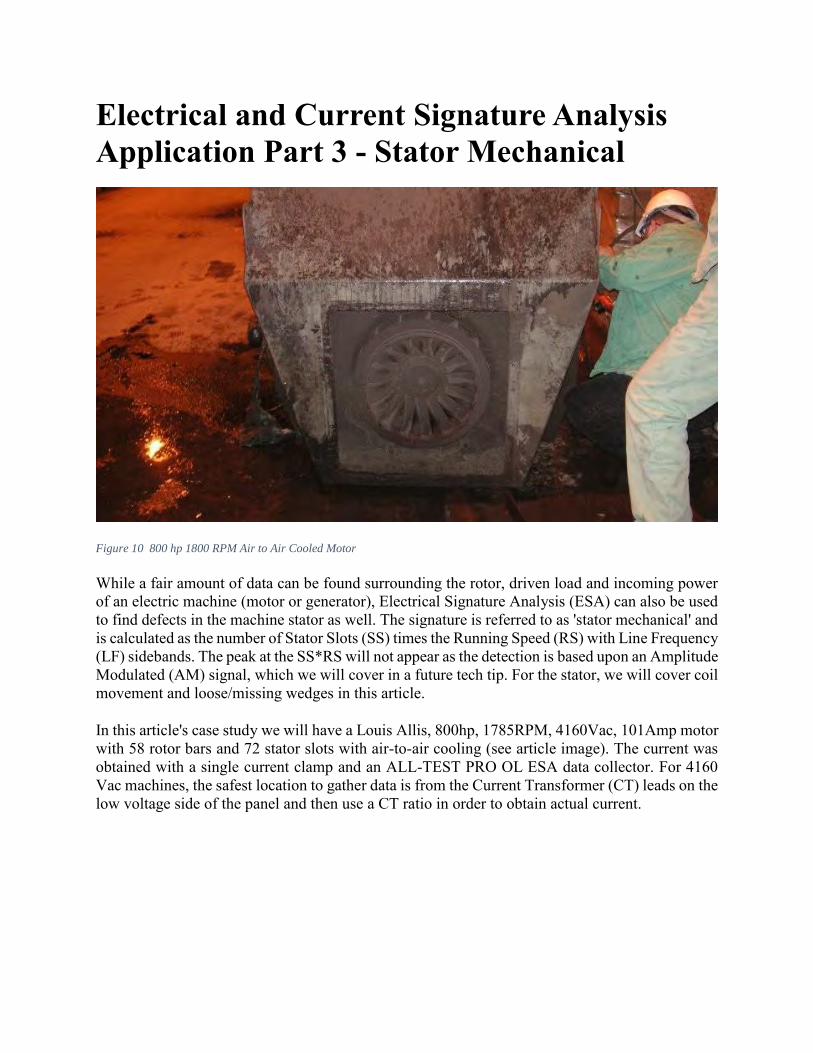
Electrical and Current Signature Analysis Application Part 3 - Stator Mechanical
Figure 10 800 hp 1800 RPM Air to Air Cooled Motor
While a fair amount of data can be found surrounding the rotor, driven load and incoming power of an electric machine (motor or generator), Electrical Signature Analysis (ESA) can also be used to find defects in the machine stator as well. The signature is referred to as 'stator mechanical' and is calculated as the number of Stator Slots (SS) times the Running Speed (RS) with Line Frequency (LF) sidebands. The peak at the SS*RS will not appear as the detection is based upon an Amplitude Modulated (AM) signal, which we will cover in a future tech tip. For the stator, we will cover coil movement and loose/missing wedges in this article.
In this article's case study we will have a Louis Allis, 800hp, 1785RPM, 4160Vac, 101Amp motor with 58 rotor bars and 72 stator slots with air-to-air cooling (see article image). The current was obtained with a single current clamp and an ALL-TEST PRO OL ESA data collector. For 4160 Vac machines, the safest location to gather data is from the Current Transformer (CT) leads on the low voltage side of the panel and then use a CT ratio in order to obtain actual current.
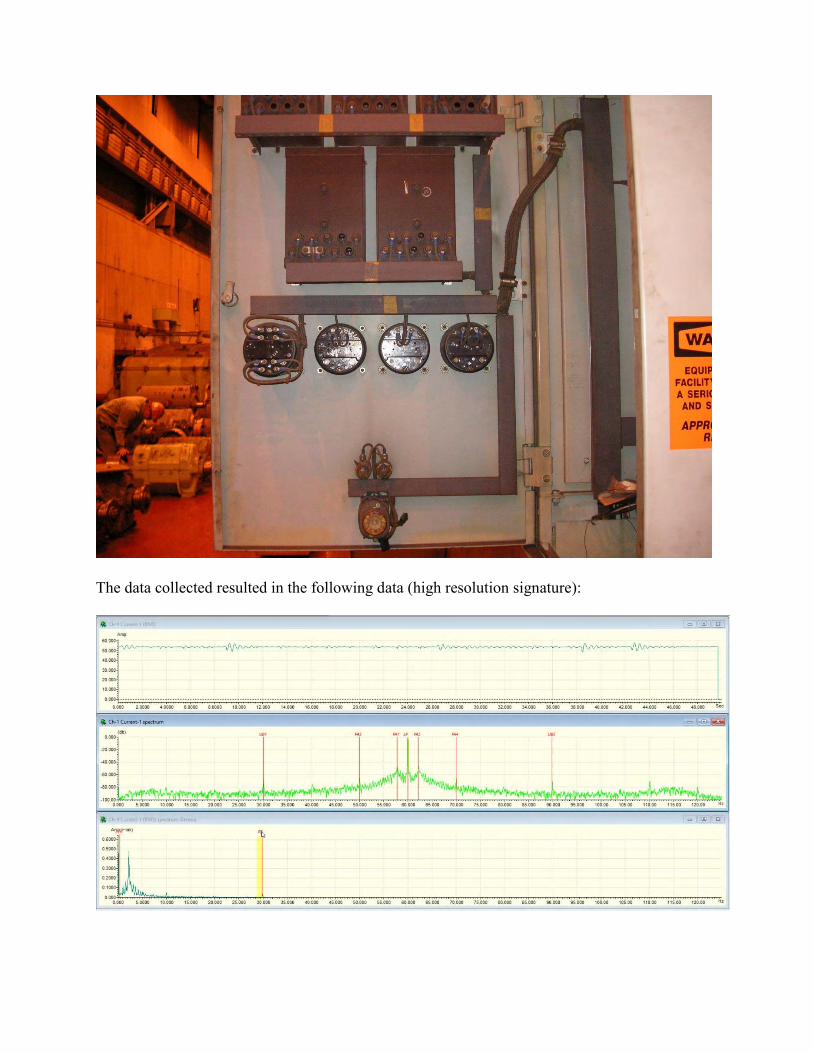
The data collected resulted in the following data (high resolution signature):
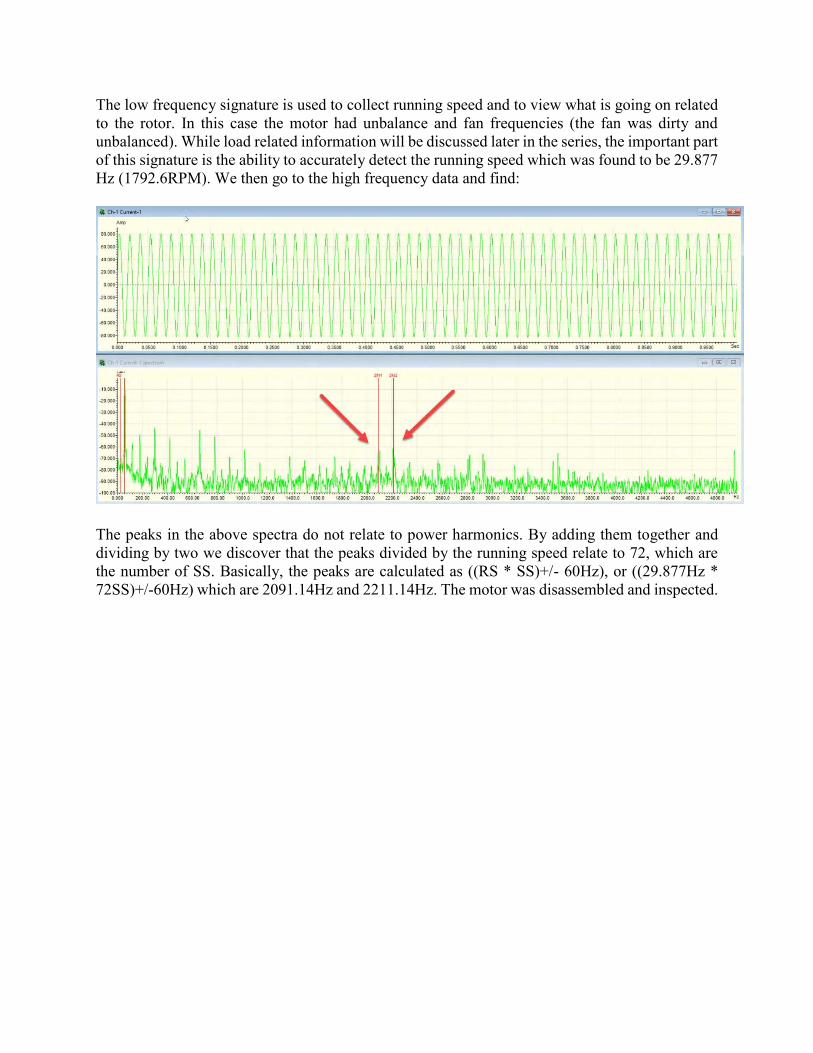
The low frequency signature is used to collect running speed and to view what is going on related to the rotor. In this case the motor had unbalance and fan frequencies (the fan was dirty and unbalanced). While load related information will be discussed later in the series, the important part of this signature is the ability to accurately detect the running speed which was found to be 29.877 Hz (1792.6RPM). We then go to the high frequency data and find:
The peaks in the above spectra do not relate to power harmonics. By adding them together and dividing by two we discover that the peaks divided by the running speed relate to 72, which are the number of SS. Basically, the peaks are calculated as ((RS * SS)+/- 60Hz), or ((29.877Hz * 72SS)+/-60Hz) which are 2091.14Hz and 2211.14Hz. The motor was disassembled and inspected.
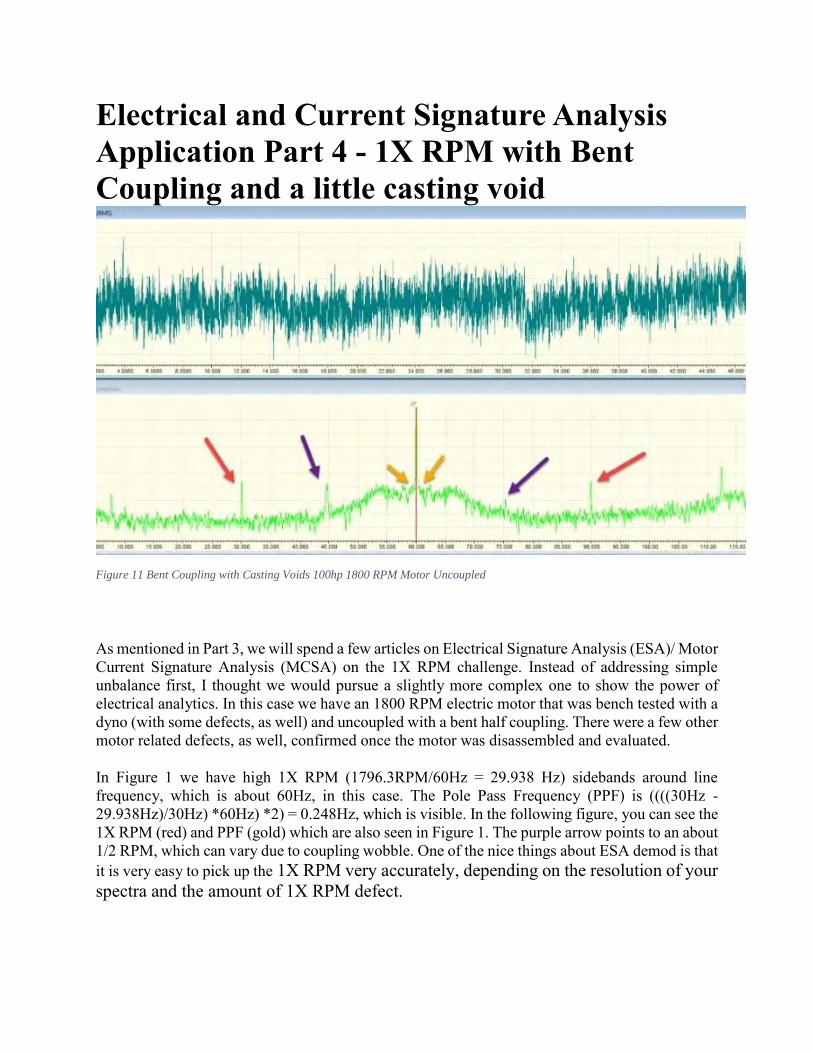
Electrical and Current Signature Analysis Application Part 4 - 1X RPM with Bent Coupling and a little casting void
Figure 11 Bent Coupling with Casting Voids 100hp 1800 RPM Motor Uncoupled
As mentioned in Part 3, we will spend a few articles on Electrical Signature Analysis (ESA)/ Motor Current Signature Analysis (MCSA) on the 1X RPM challenge. Instead of addressing simple unbalance first, I thought we would pursue a slightly more complex one to show the power of electrical analytics. In this case we have an 1800 RPM electric motor that was bench tested with a dyno (with some defects, as well) and uncoupled with a bent half coupling. There were a few other motor related defects, as well, confirmed once the motor was disassembled and evaluated.
In Figure 1 we have high 1X RPM (1796.3RPM/60Hz = 29.938 Hz) sidebands around line frequency, which is about 60Hz, in this case. The Pole Pass Frequency (PPF) is ((((30Hz - 29.938Hz)/30Hz) *60Hz) *2) = 0.248Hz, which is visible. In the following figure, you can see the 1X RPM (red) and PPF (gold) which are also seen in Figure 1. The purple arrow points to an about 1/2 RPM, which can vary due to coupling wobble. One of the nice things about ESA demod is that it is very easy to pick up the 1X RPM very accurately, depending on the resolution of your spectra and the amount of 1X RPM defect.
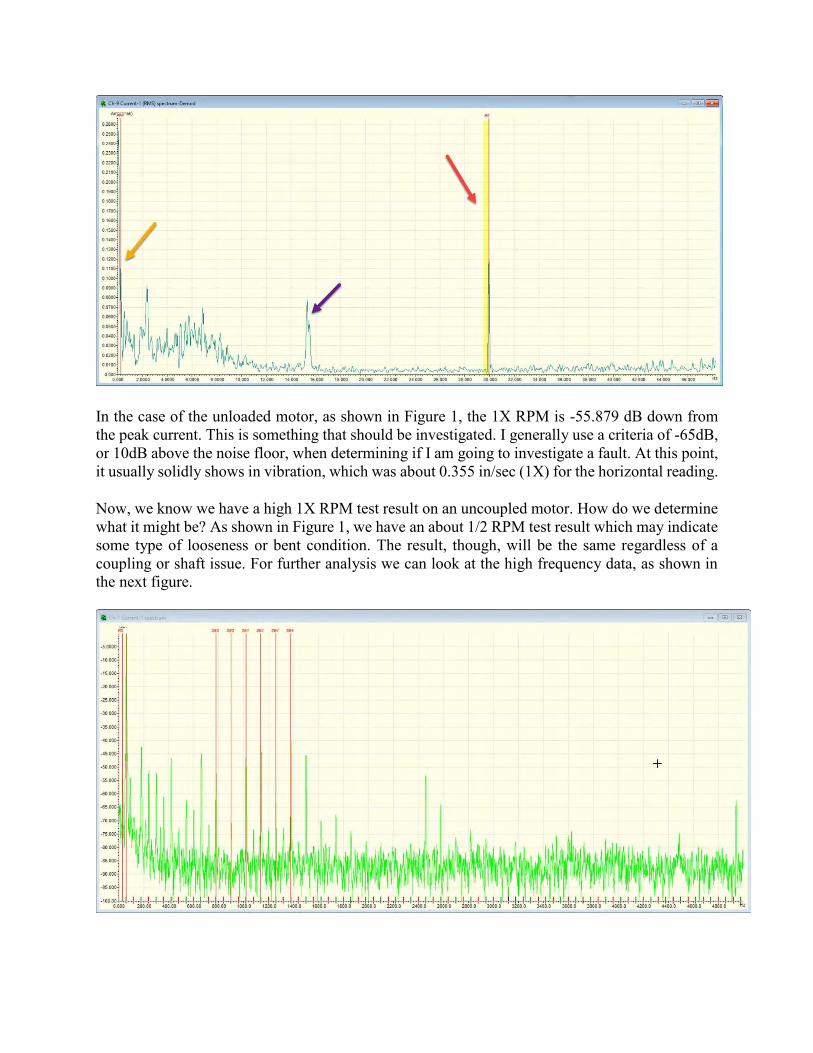
In the case of the unloaded motor, as shown in Figure 1, the 1X RPM is -55.879 dB down from the peak current. This is something that should be investigated. I generally use a criteria of -65dB, or 10dB above the noise floor, when determining if I am going to investigate a fault. At this point, it usually solidly shows in vibration, which was about 0.355 in/sec (1X) for the horizontal reading.
Now, we know we have a high 1X RPM test result on an uncoupled motor. How do we determine what it might be? As shown in Figure 1, we have an about 1/2 RPM test result which may indicate some type of looseness or bent condition. The result, though, will be the same regardless of a coupling or shaft issue. For further analysis we can look at the high frequency data, as shown in the next figure.
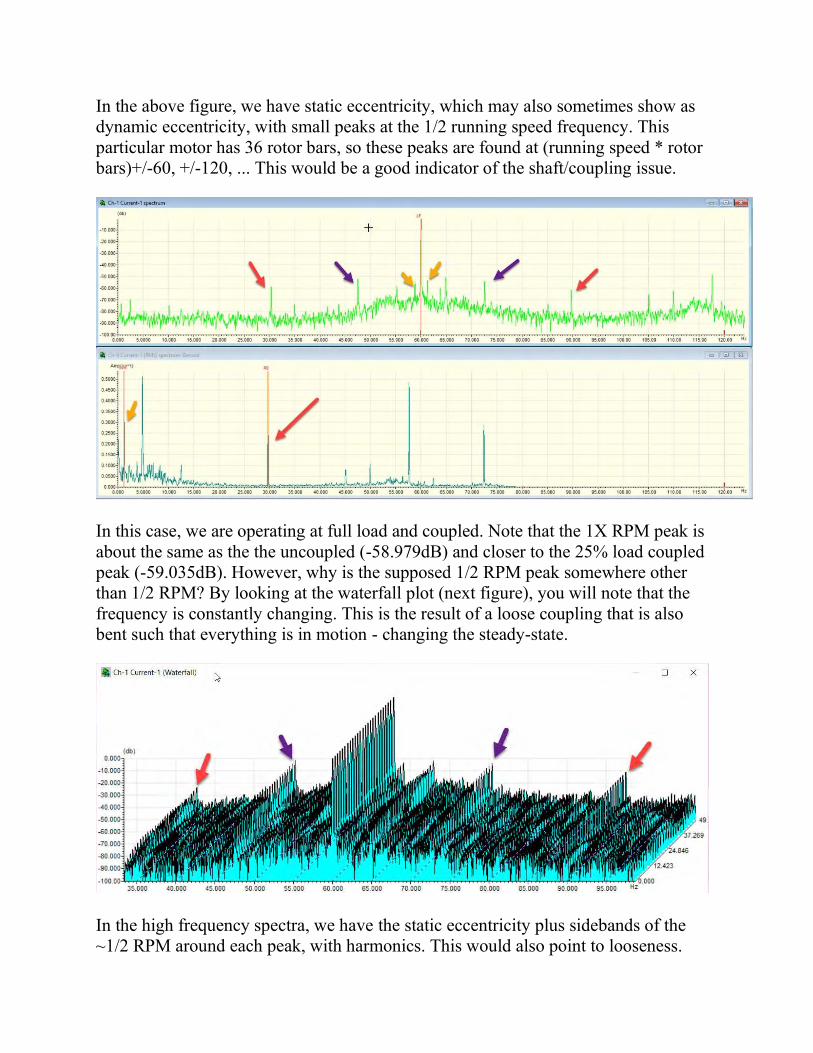
In the above figure, we have static eccentricity, which may also sometimes show as dynamic eccentricity, with small peaks at the 1/2 running speed frequency. This particular motor has 36 rotor bars, so these peaks are found at (running speed * rotor bars)+/-60, +/-120, ... This would be a good indicator of the shaft/coupling issue.
In this case, we are operating at full load and coupled. Note that the 1X RPM peak is about the same as the the uncoupled (-58.979dB) and closer to the 25% load coupled peak (-59.035dB). However, why is the supposed 1/2 RPM peak somewhere other than 1/2 RPM? By looking at the waterfall plot (next figure), you will note that the frequency is constantly changing. This is the result of a loose coupling that is also bent such that everything is in motion - changing the steady-state.
In the high frequency spectra, we have the static eccentricity plus sidebands of the ~1/2 RPM around each peak, with harmonics. This would also point to looseness.
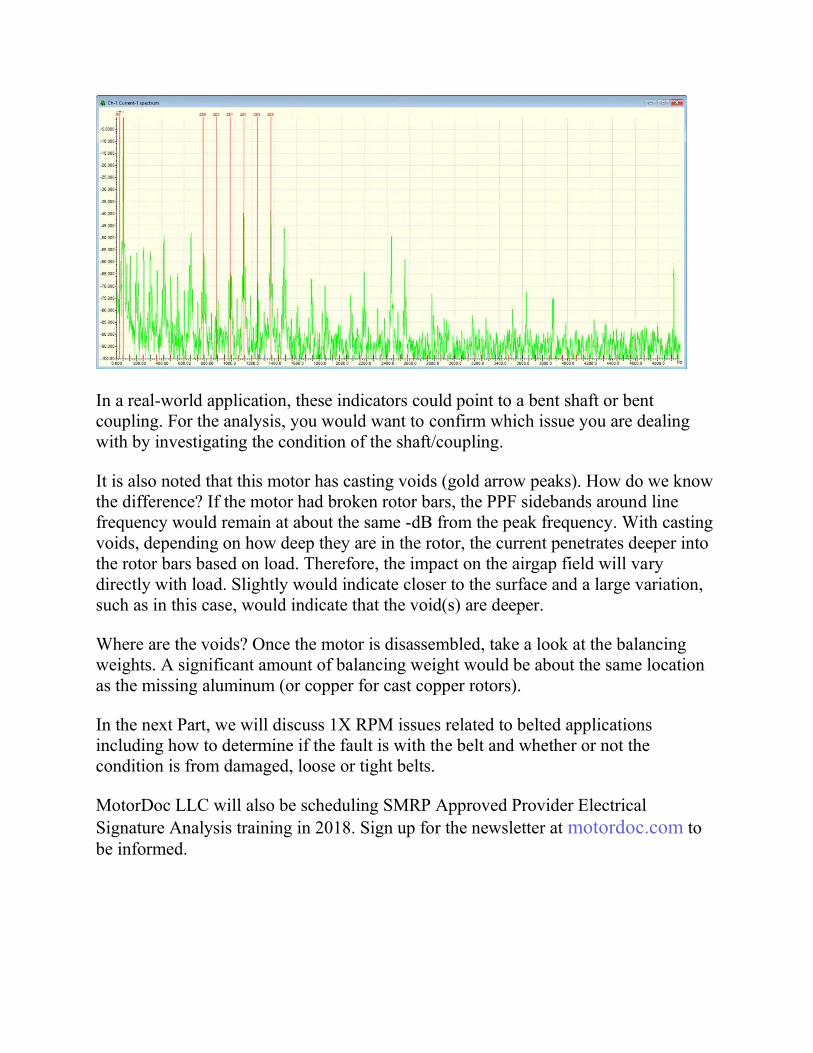
In a real-world application, these indicators could point to a bent shaft or bent coupling. For the analysis, you would want to confirm which issue you are dealing with by investigating the condition of the shaft/coupling.
It is also noted that this motor has casting voids (gold arrow peaks). How do we know the difference? If the motor had broken rotor bars, the PPF sidebands around line frequency would remain at about the same -dB from the peak frequency. With casting voids, depending on how deep they are in the rotor, the current penetrates deeper into the rotor bars based on load. Therefore, the impact on the airgap field will vary directly with load. Slightly would indicate closer to the surface and a large variation, such as in this case, would indicate that the void(s) are deeper.
Where are the voids? Once the motor is disassembled, take a look at the balancing weights. A significant amount of balancing weight would be about the same location as the missing aluminum (or copper for cast copper rotors).
In the next Part, we will discuss 1X RPM issues related to belted applications including how to determine if the fault is with the belt and whether or not the condition is from damaged, loose or tight belts.
MotorDoc LLC will also be scheduling SMRP Approved Provider Electrical Signature Analysis training in 2018. Sign up for the newsletter at motordoc.com to be informed.
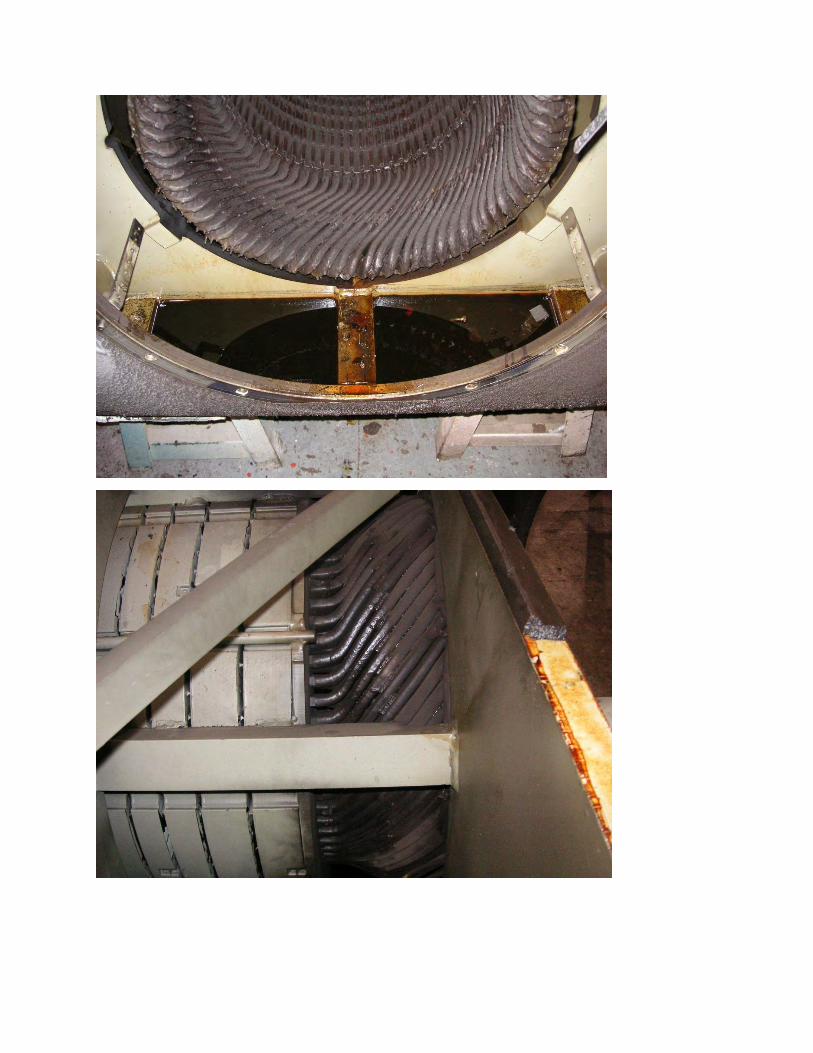
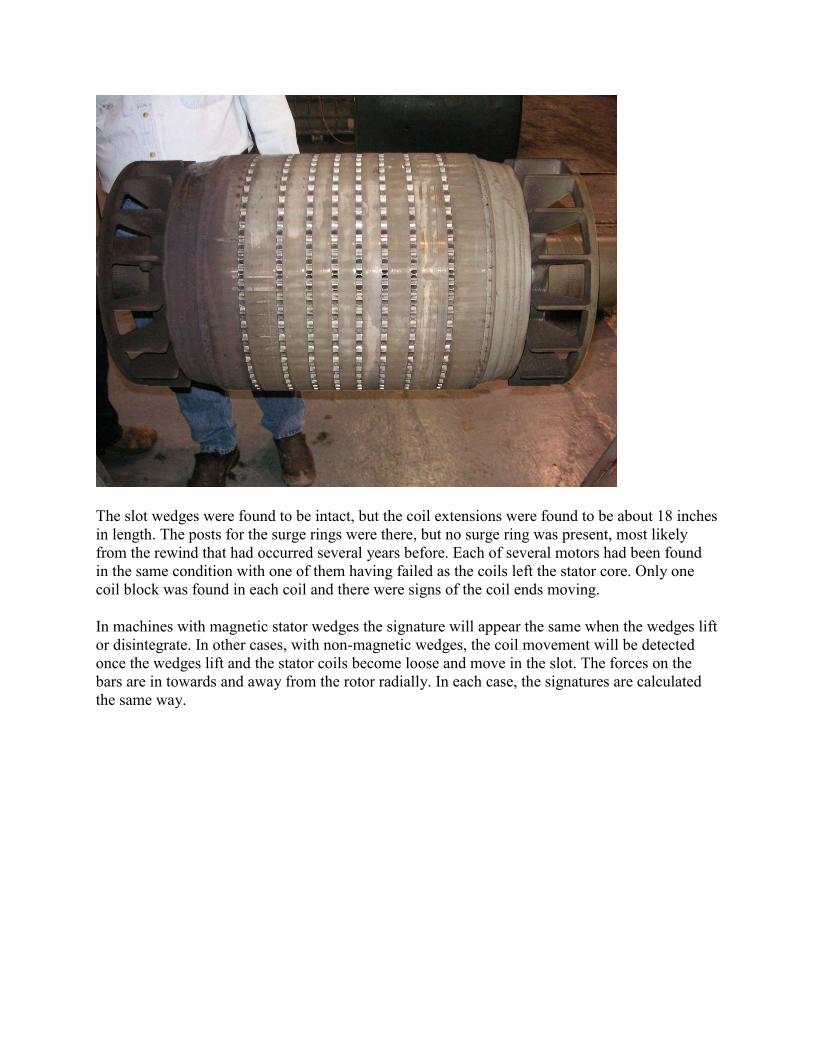
The slot wedges were found to be intact, but the coil extensions were found to be about 18 inches in length. The posts for the surge rings were there, but no surge ring was present, most likely from the rewind that had occurred several years before. Each of several motors had been found in the same condition with one of them having failed as the coils left the stator core. Only one coil block was found in each coil and there were signs of the coil ends moving.
In machines with magnetic stator wedges the signature will appear the same when the wedges lift or disintegrate. In other cases, with non-magnetic wedges, the coil movement will be detected once the wedges lift and the stator coils become loose and move in the slot. The forces on the bars are in towards and away from the rotor radially. In each case, the signatures are calculated the same way.
Electrical and Current Signature Analysis Part 5 1X RPM Belted Applications
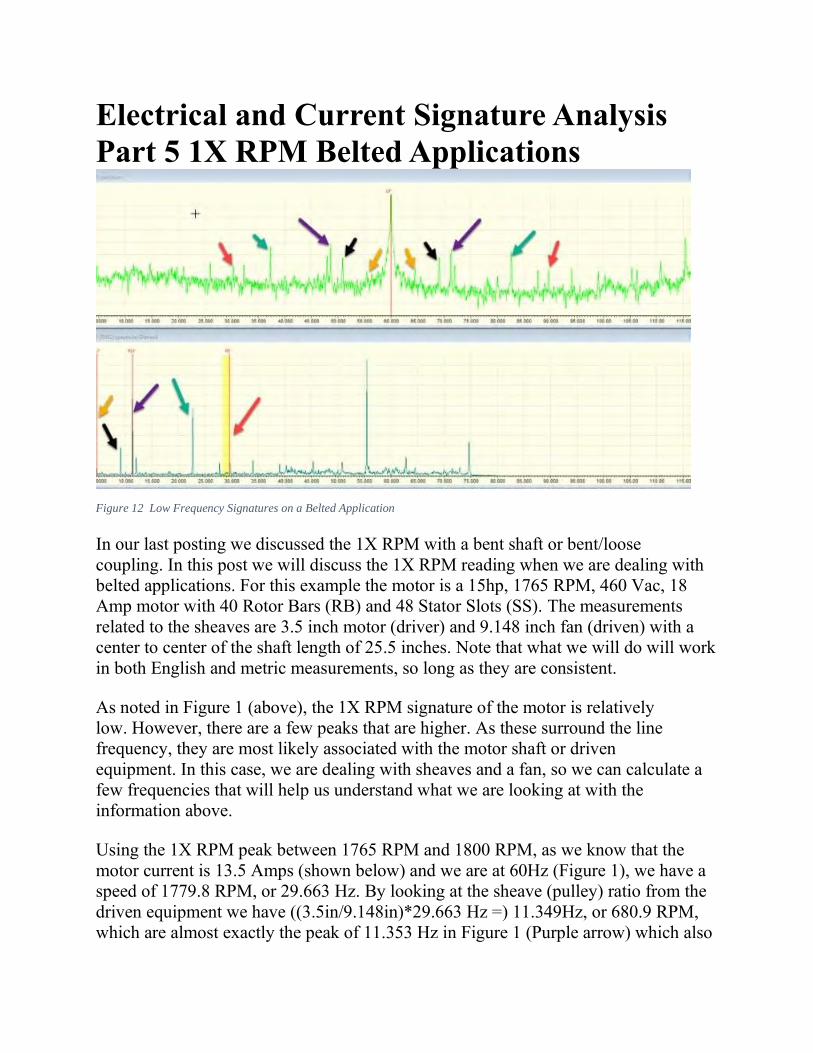
Figure 12 Low Frequency Signatures on a Belted Application
In our last posting we discussed the 1X RPM with a bent shaft or bent/loose coupling. In this post we will discuss the 1X RPM reading when we are dealing with belted applications. For this example the motor is a 15hp, 1765 RPM, 460 Vac, 18 Amp motor with 40 Rotor Bars (RB) and 48 Stator Slots (SS). The measurements related to the sheaves are 3.5 inch motor (driver) and 9.148 inch fan (driven) with a center to center of the shaft length of 25.5 inches. Note that what we will do will work in both English and metric measurements, so long as they are consistent.
As noted in Figure 1 (above), the 1X RPM signature of the motor is relatively low. However, there are a few peaks that are higher. As these surround the line frequency, they are most likely associated with the motor shaft or driven equipment. In this case, we are dealing with sheaves and a fan, so we can calculate a few frequencies that will help us understand what we are looking at with the information above.
Using the 1X RPM peak between 1765 RPM and 1800 RPM, as we know that the motor current is 13.5 Amps (shown below) and we are at 60Hz (Figure 1), we have a speed of 1779.8 RPM, or 29.663 Hz. By looking at the sheave (pulley) ratio from the driven equipment we have ((3.5in/9.148in)*29.663 Hz =) 11.349Hz, or 680.9 RPM, which are almost exactly the peak of 11.353 Hz in Figure 1 (Purple arrow) which also
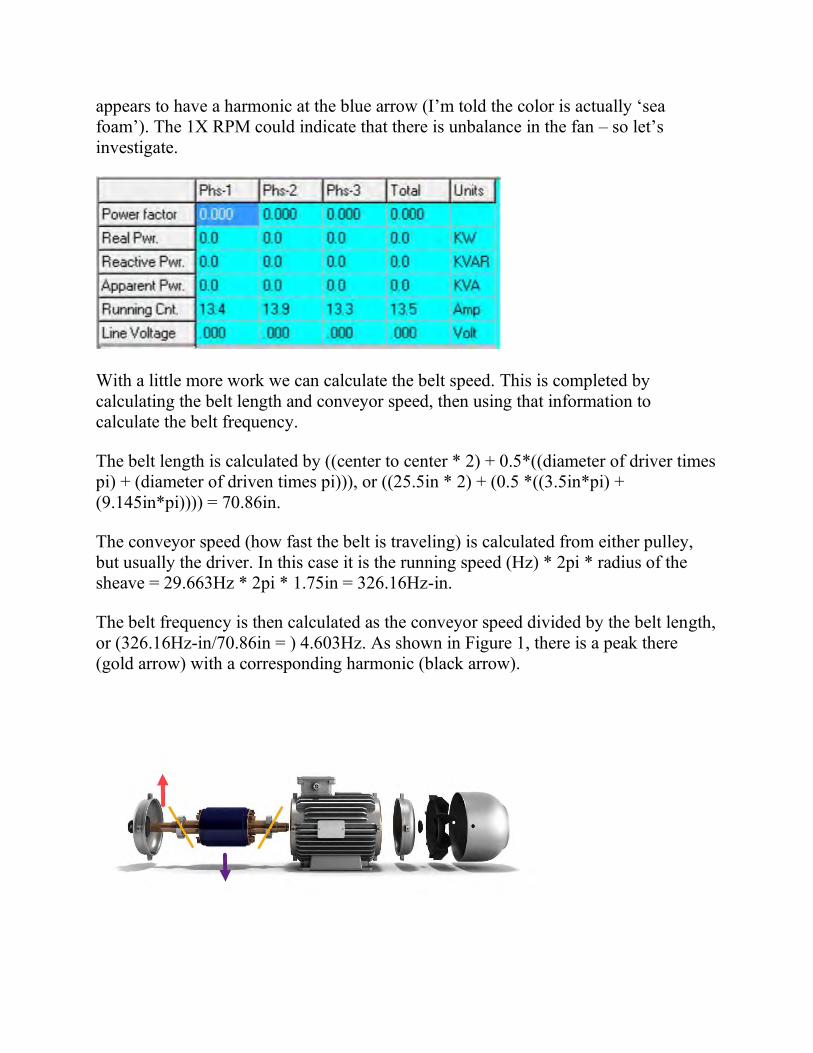
appears to have a harmonic at the blue arrow (I’m told the color is actually ‘sea foam’). The 1X RPM could indicate that there is unbalance in the fan – so let’s investigate.
With a little more work we can calculate the belt speed. This is completed by calculating the belt length and conveyor speed, then using that information to calculate the belt frequency.
The belt length is calculated by ((center to center * 2) + 0.5*((diameter of driver times pi) + (diameter of driven times pi))), or ((25.5in * 2) + (0.5 *((3.5in*pi) + (9.145in*pi)))) = 70.86in.
The conveyor speed (how fast the belt is traveling) is calculated from either pulley, but usually the driver. In this case it is the running speed (Hz) * 2pi * radius of the sheave = 29.663Hz * 2pi * 1.75in = 326.16Hz-in.
The belt frequency is then calculated as the conveyor speed divided by the belt length, or (326.16Hz-in/70.86in = ) 4.603Hz. As shown in Figure 1, there is a peak there (gold arrow) with a corresponding harmonic (black arrow).
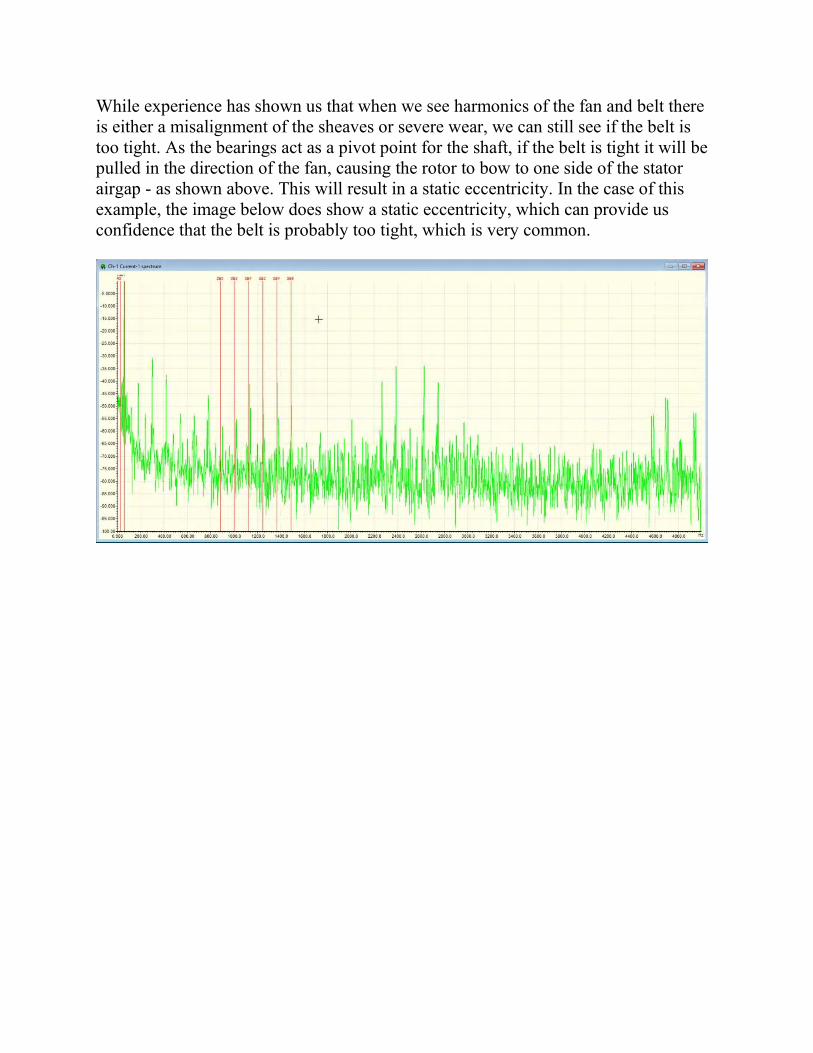
While experience has shown us that when we see harmonics of the fan and belt there is either a misalignment of the sheaves or severe wear, we can still see if the belt is too tight. As the bearings act as a pivot point for the shaft, if the belt is tight it will be pulled in the direction of the fan, causing the rotor to bow to one side of the stator airgap - as shown above. This will result in a static eccentricity. In the case of this example, the image below does show a static eccentricity, which can provide us confidence that the belt is probably too tight, which is very common.
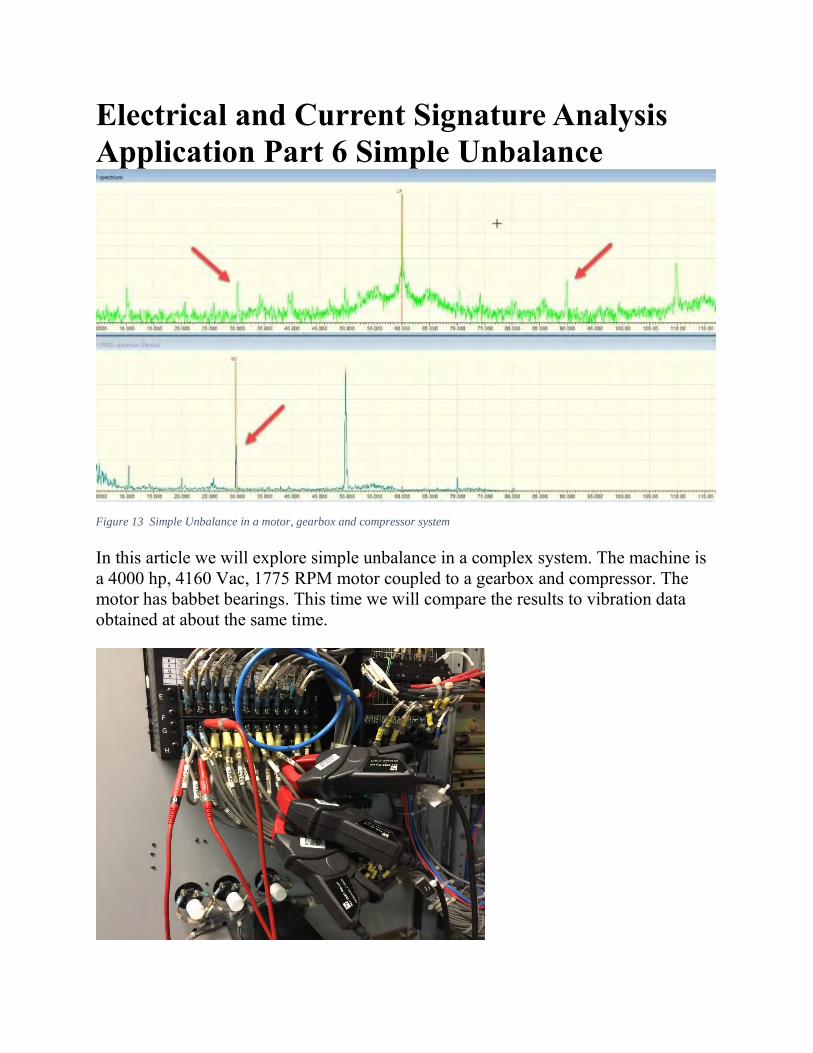
Electrical and Current Signature Analysis Application Part 6 Simple Unbalance
Figure 13 Simple Unbalance in a motor, gearbox and compressor system
In this article we will explore simple unbalance in a complex system. The machine is a 4000 hp, 4160 Vac, 1775 RPM motor coupled to a gearbox and compressor. The motor has babbet bearings. This time we will compare the results to vibration data obtained at about the same time.
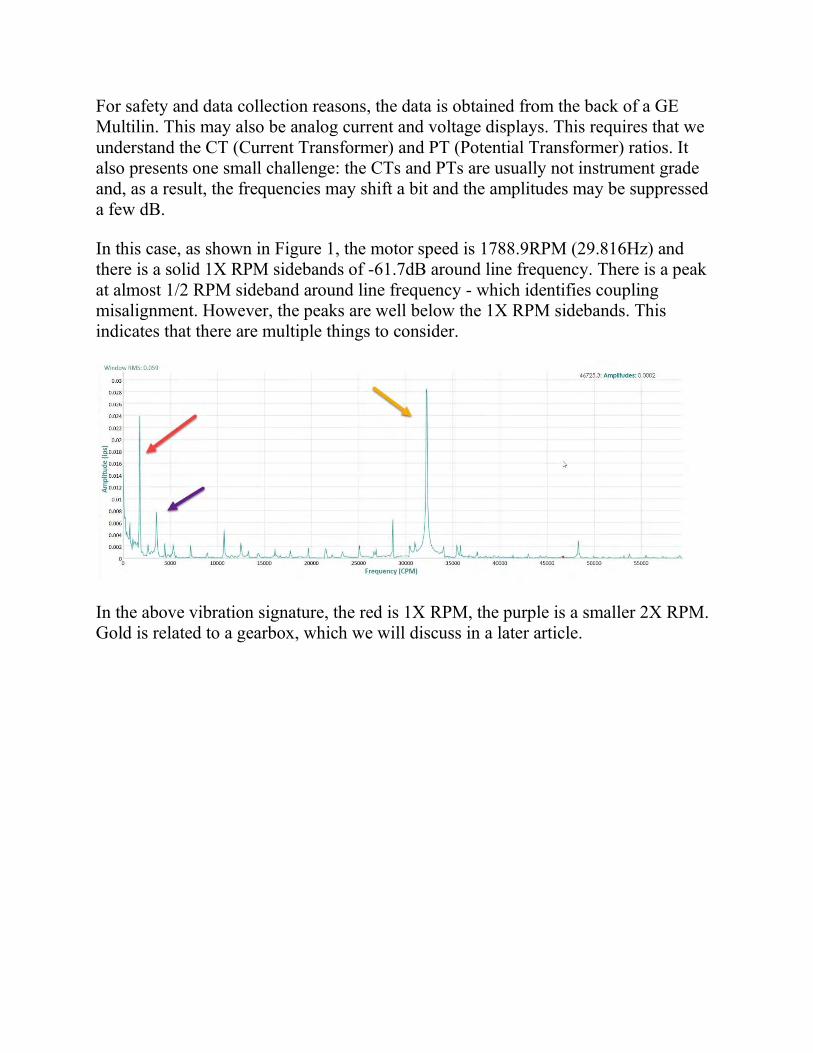
For safety and data collection reasons, the data is obtained from the back of a GE Multilin. This may also be analog current and voltage displays. This requires that we understand the CT (Current Transformer) and PT (Potential Transformer) ratios. It also presents one small challenge: the CTs and PTs are usually not instrument grade and, as a result, the frequencies may shift a bit and the amplitudes may be suppressed a few dB.
In this case, as shown in Figure 1, the motor speed is 1788.9RPM (29.816Hz) and there is a solid 1X RPM sidebands of -61.7dB around line frequency. There is a peak at almost 1/2 RPM sideband around line frequency - which identifies coupling misalignment. However, the peaks are well below the 1X RPM sidebands. This indicates that there are multiple things to consider.
In the above vibration signature, the red is 1X RPM, the purple is a smaller 2X RPM. Gold is related to a gearbox, which we will discuss in a later article.
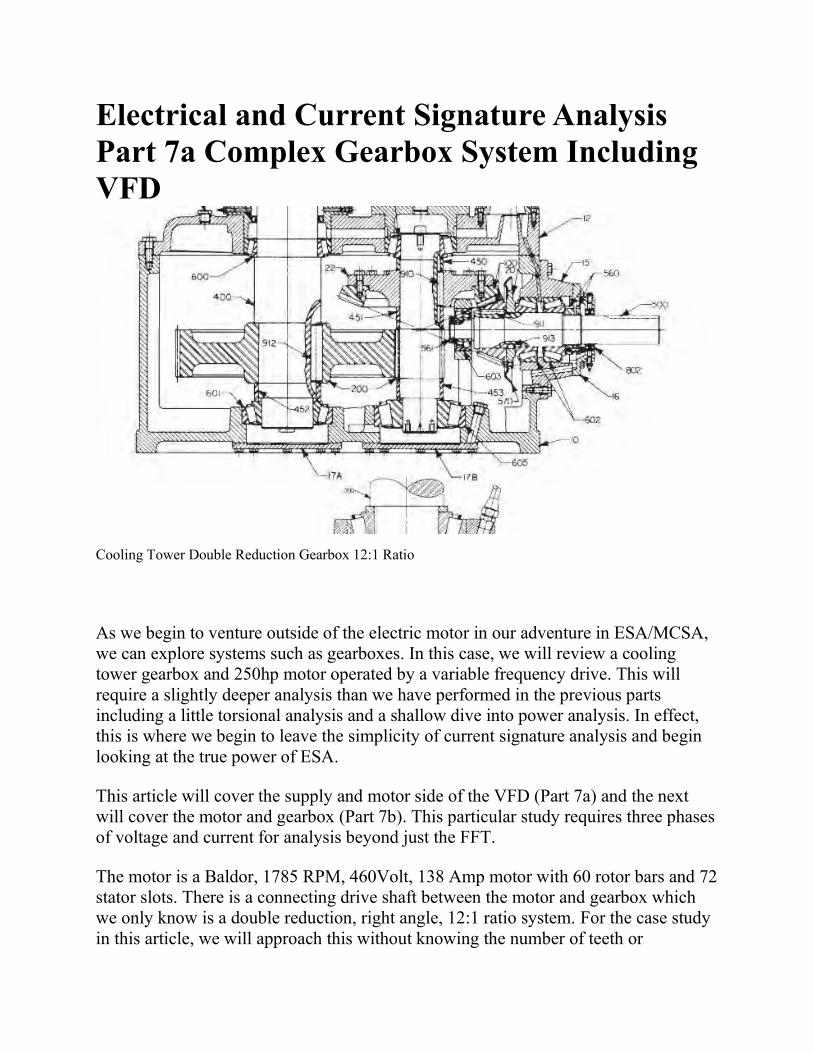
Electrical and Current Signature Analysis Part 7a Complex Gearbox System Including VFD
Cooling Tower Double Reduction Gearbox 12:1 Ratio
As we begin to venture outside of the electric motor in our adventure in ESA/MCSA, we can explore systems such as gearboxes. In this case, we will review a cooling tower gearbox and 250hp motor operated by a variable frequency drive. This will require a slightly deeper analysis than we have performed in the previous parts including a little torsional analysis and a shallow dive into power analysis. In effect, this is where we begin to leave the simplicity of current signature analysis and begin looking at the true power of ESA.
This article will cover the supply and motor side of the VFD (Part 7a) and the next will cover the motor and gearbox (Part 7b). This particular study requires three phases of voltage and current for analysis beyond just the FFT.
The motor is a Baldor, 1785 RPM, 460Volt, 138 Amp motor with 60 rotor bars and 72 stator slots. There is a connecting drive shaft between the motor and gearbox which we only know is a double reduction, right angle, 12:1 ratio system. For the case study in this article, we will approach this without knowing the number of teeth or
components in the gearbox. The VFD is an older design with a large line reactor on the input side and a smaller line reactor on the output.
What can we do with ESA in this environment? We have a VFD, motor, gearbox and fan blades and we expect to be able to take a reading or two and determine what is going on in the system? Of course! In fact, we will be able to go far deeper using readings on both sides of the VFD. This is important because a standard PWM VFD works as a 'dam,' due to the DC bus, which prevents ESA from seeing the motor from the input side of the VFD and upstream of the VFD from the output side. Therefore, if I am studying a system and not just performing motor PdM, I will take a reading on both sides of the drive to look at the system and determine if there are defects in the VFD.
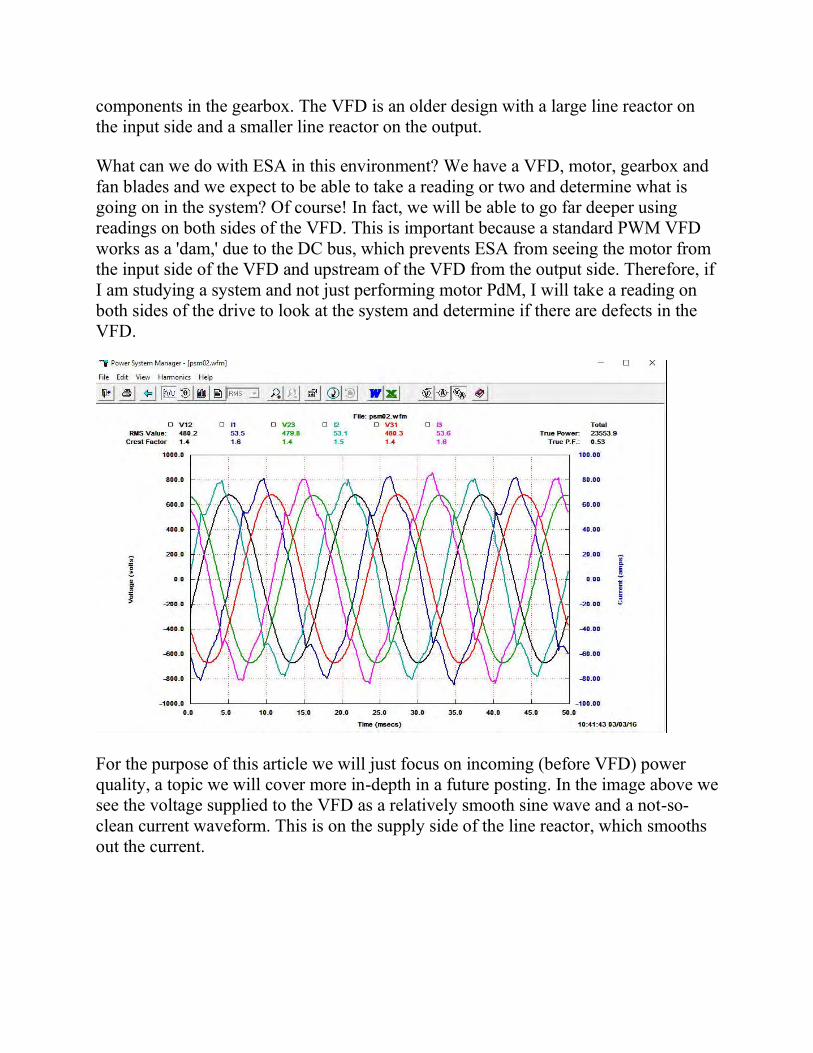
For the purpose of this article we will just focus on incoming (before VFD) power quality, a topic we will cover more in-depth in a future posting. In the image above we see the voltage supplied to the VFD as a relatively smooth sine wave and a not-so-clean current waveform. This is on the supply side of the line reactor, which smooths out the current.
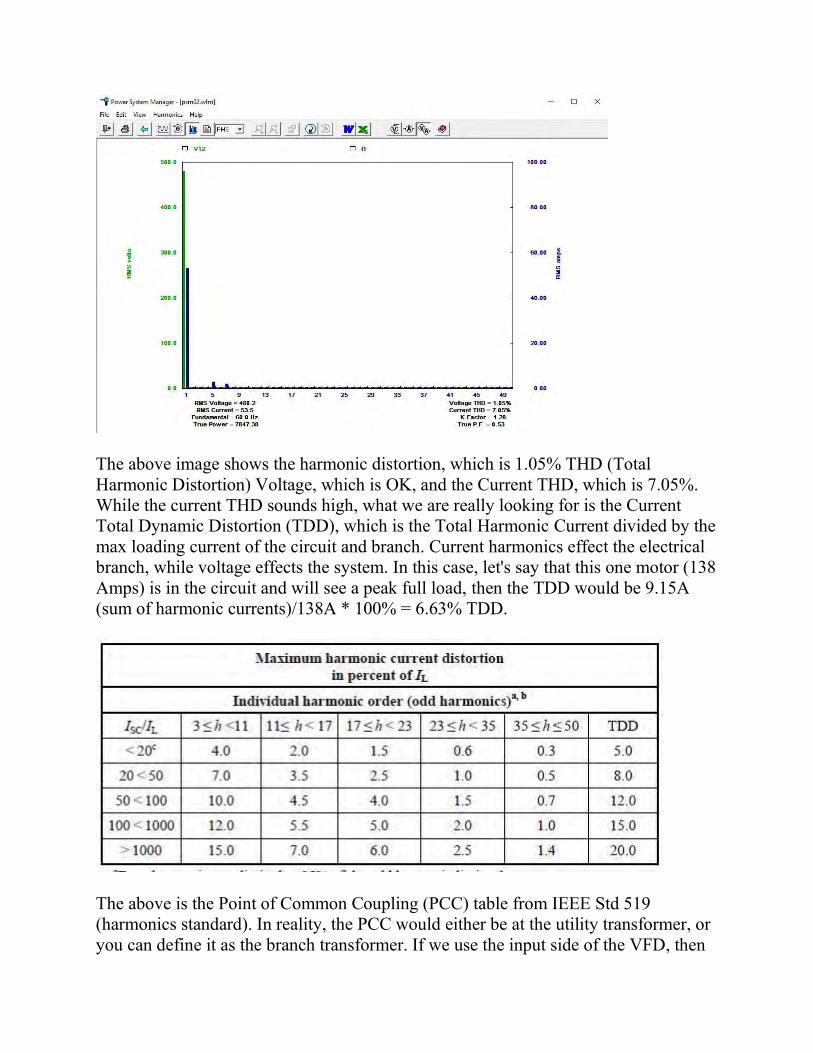
The above image shows the harmonic distortion, which is 1.05% THD (Total Harmonic Distortion) Voltage, which is OK, and the Current THD, which is 7.05%. While the current THD sounds high, what we are really looking for is the Current Total Dynamic Distortion (TDD), which is the Total Harmonic Current divided by the max loading current of the circuit and branch. Current harmonics effect the electrical branch, while voltage effects the system. In this case, let's say that this one motor (138 Amps) is in the circuit and will see a peak full load, then the TDD would be 9.15A (sum of harmonic currents)/138A * 100% = 6.63% TDD.
The above is the Point of Common Coupling (PCC) table from IEEE Std 519 (harmonics standard). In reality, the PCC would either be at the utility transformer, or you can define it as the branch transformer. If we use the input side of the VFD, then
we would fall under the first row, which would result in a high reading. However, the results will depend on where you are testing. The good news is that the Volts THD is the item that we are more concerned about as it will have a greater impact on components in the system. For the purpose of this article, the Volt THD and Current TDD are within tolerance (skipping ahead to the future article on power analysis).
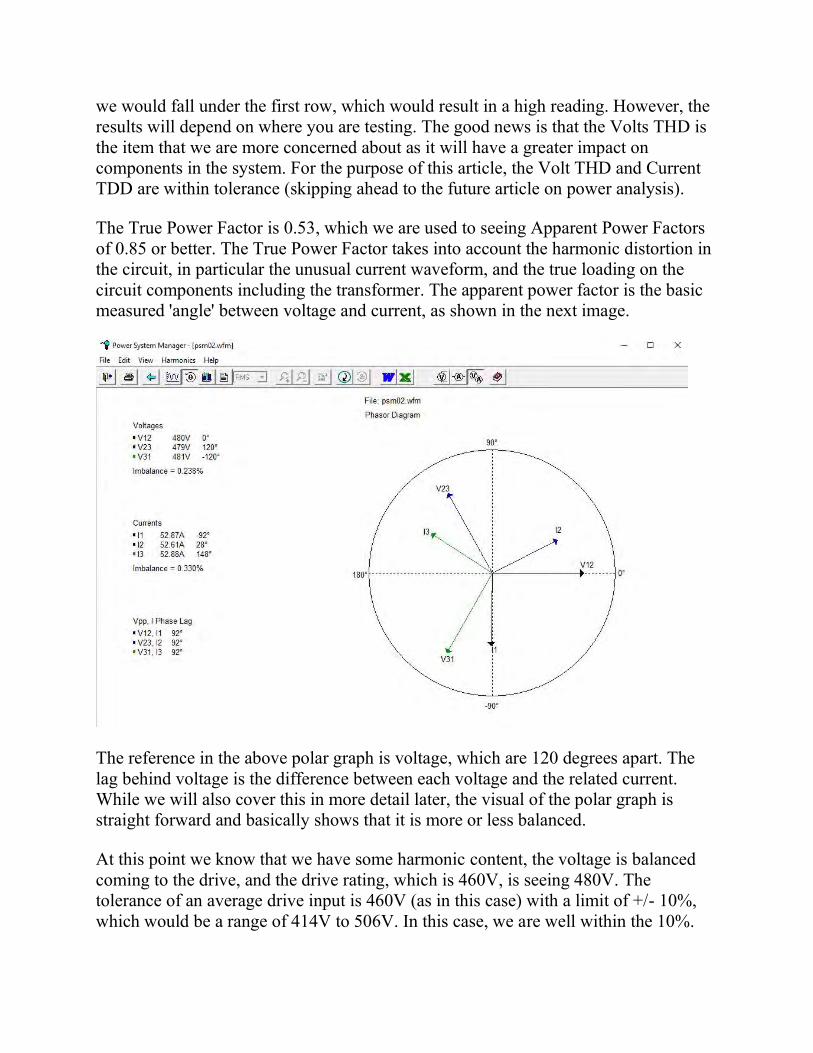
The True Power Factor is 0.53, which we are used to seeing Apparent Power Factors of 0.85 or better. The True Power Factor takes into account the harmonic distortion in the circuit, in particular the unusual current waveform, and the true loading on the circuit components including the transformer. The apparent power factor is the basic measured 'angle' between voltage and current, as shown in the next image.
The reference in the above polar graph is voltage, which are 120 degrees apart. The lag behind voltage is the difference between each voltage and the related current. While we will also cover this in more detail later, the visual of the polar graph is straight forward and basically shows that it is more or less balanced.
At this point we know that we have some harmonic content, the voltage is balanced coming to the drive, and the drive rating, which is 460V, is seeing 480V. The tolerance of an average drive input is 460V (as in this case) with a limit of +/- 10%, which would be a range of 414V to 506V. In this case, we are well within the 10%.
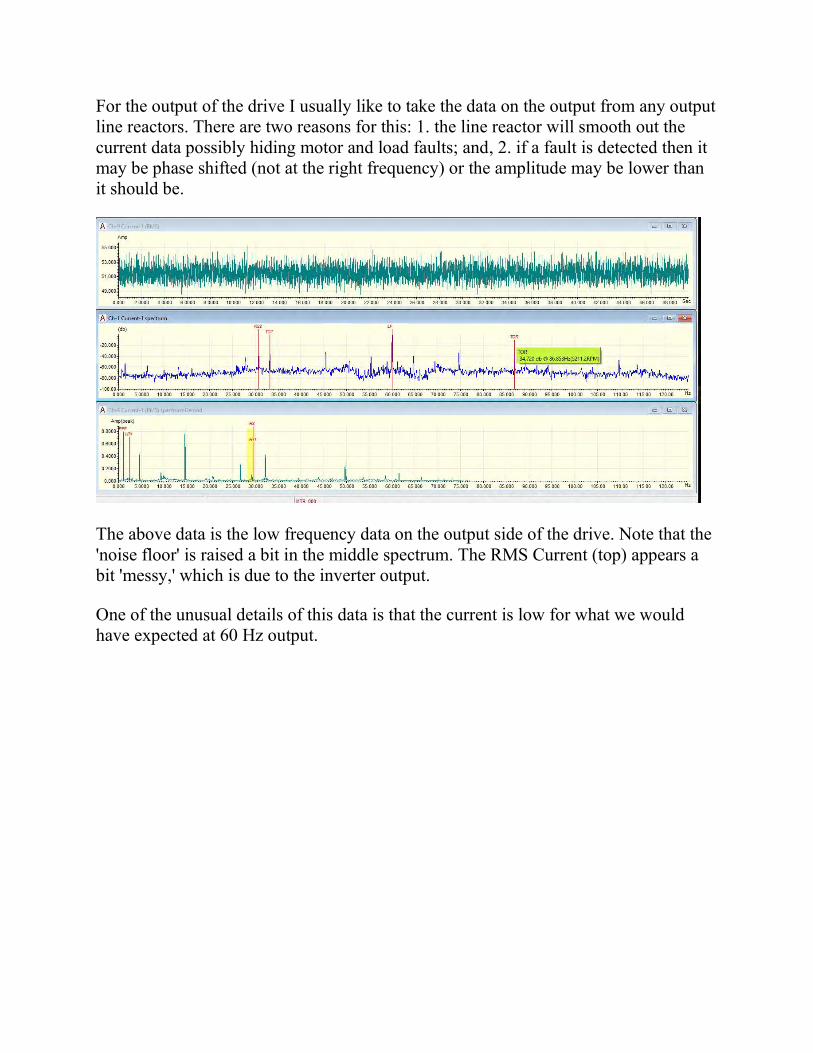
For the output of the drive I usually like to take the data on the output from any output line reactors. There are two reasons for this: 1. the line reactor will smooth out the current data possibly hiding motor and load faults; and, 2. if a fault is detected then it may be phase shifted (not at the right frequency) or the amplitude may be lower than it should be.
The above data is the low frequency data on the output side of the drive. Note that the 'noise floor' is raised a bit in the middle spectrum. The RMS Current (top) appears a bit 'messy,' which is due to the inverter output.
One of the unusual details of this data is that the current is low for what we would have expected at 60 Hz output.
Electrical and Current Signature Analysis Part 7b Complex Gearbox System Including VFD
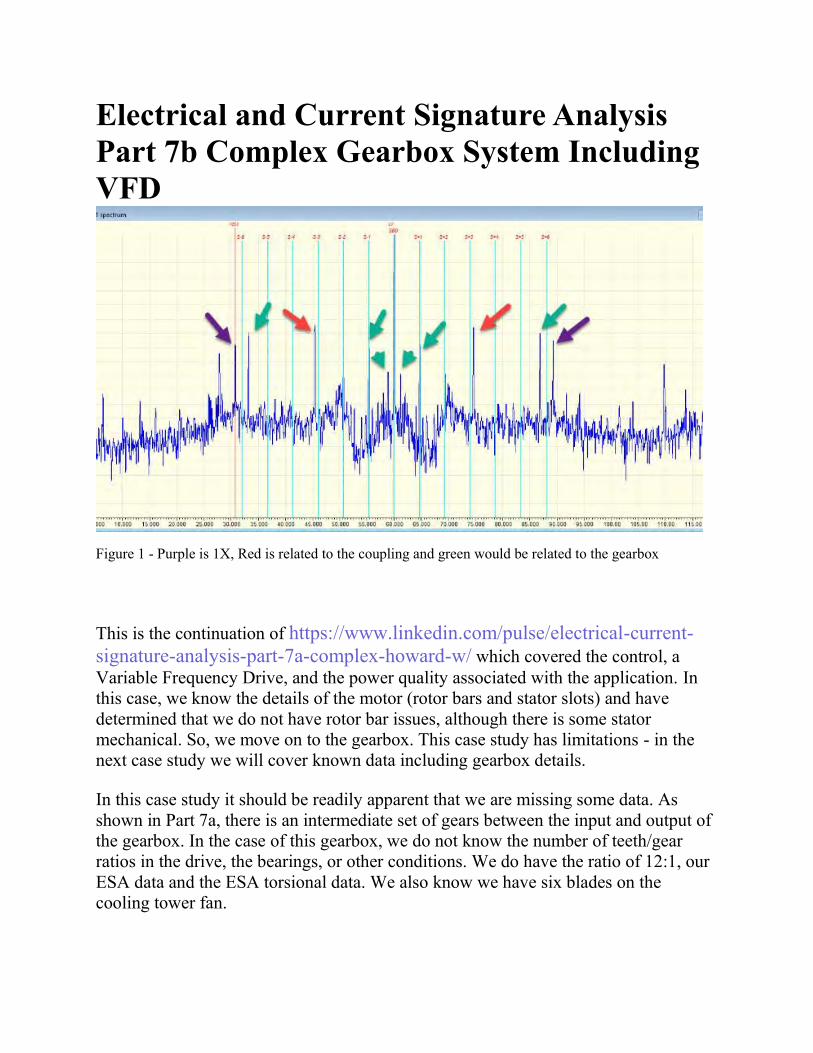
Figure 1 - Purple is 1X, Red is related to the coupling and green would be related to the gearbox
This is the continuation of https://www.linkedin.com/pulse/electrical-current-signature-analysis-part-7a-complex-howard-w/ which covered the control, a Variable Frequency Drive, and the power quality associated with the application. In this case, we know the details of the motor (rotor bars and stator slots) and have determined that we do not have rotor bar issues, although there is some stator mechanical. So, we move on to the gearbox. This case study has limitations - in the next case study we will cover known data including gearbox details.
In this case study it should be readily apparent that we are missing some data. As shown in Part 7a, there is an intermediate set of gears between the input and output of the gearbox. In the case of this gearbox, we do not know the number of teeth/gear ratios in the drive, the bearings, or other conditions. We do have the ratio of 12:1, our ESA data and the ESA torsional data. We also know we have six blades on the cooling tower fan.
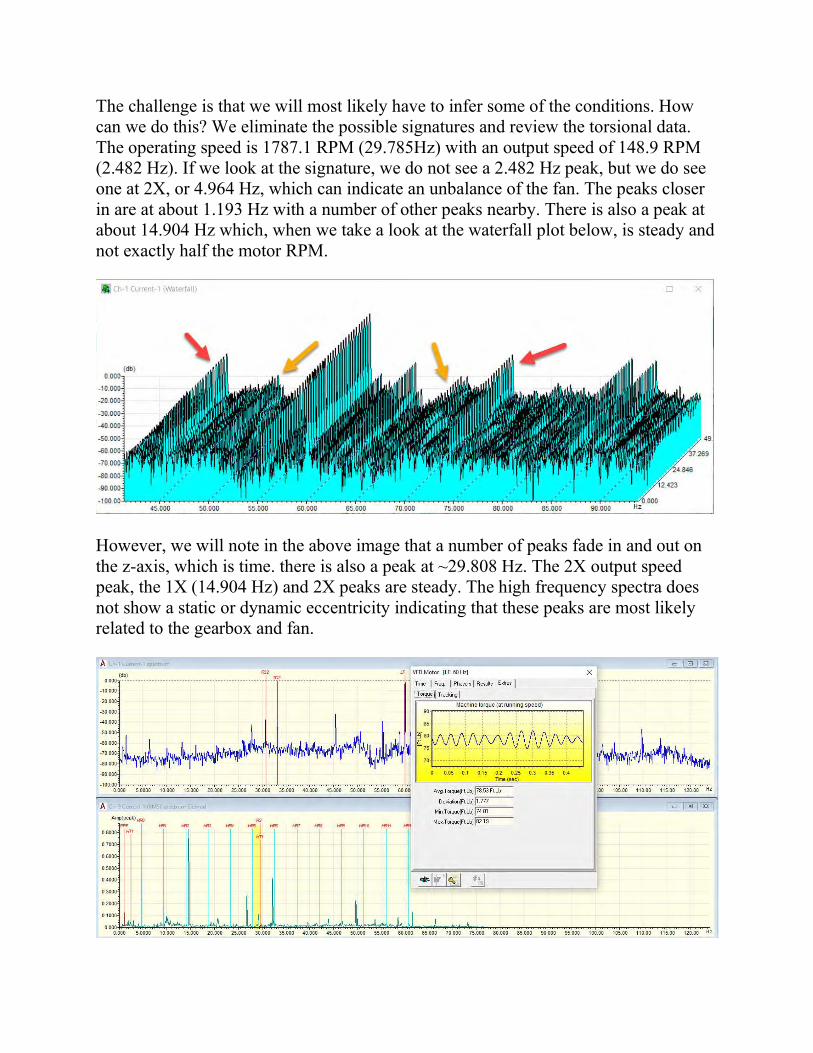
The challenge is that we will most likely have to infer some of the conditions. How can we do this? We eliminate the possible signatures and review the torsional data. The operating speed is 1787.1 RPM (29.785Hz) with an output speed of 148.9 RPM (2.482 Hz). If we look at the signature, we do not see a 2.482 Hz peak, but we do see one at 2X, or 4.964 Hz, which can indicate an unbalance of the fan. The peaks closer in are at about 1.193 Hz with a number of other peaks nearby. There is also a peak at about 14.904 Hz which, when we take a look at the waterfall plot below, is steady and not exactly half the motor RPM.
However, we will note in the above image that a number of peaks fade in and out on the z-axis, which is time. there is also a peak at ~29.808 Hz. The 2X output speed peak, the 1X (14.904 Hz) and 2X peaks are steady. The high frequency spectra does not show a static or dynamic eccentricity indicating that these peaks are most likely related to the gearbox and fan.

The torque ripple above shows variation in operation while the RPM in the waterfall plot remains steady. This usually indicates that there is some type of binding during operation. In addition the max torque was 83.91 ftlbs and the min torque was 75.54 ftlbs (difference of 8.37 ftlbs) at about running speed frequency, which would indicate ((Torque * RPM)/5252) or ((8.37ftlbs * 1787.1RPM)/5252) = 2.85hp which we can apply to the actual motor horsepower such that ((2.85hp/31.1hp)*100% = 9.2%). The other machines in this application are seeing variations under 5%, which would indicate that there are most likely binding issues.
Without knowing the gear teeth numbers or gear ratios, gearbox bearing information or other components of the gearbox, the most you can do at this point is indicate that the readings are high and that these should be investigated. If you are collecting data and see these types of signatures with limited data then observation or other testing methods, such as vibration, can be used to confirm the conditions.
Yes, I apologize that I cannot give you better than this on this case. I wanted to use an example to show that accurate data is important to provide an accurate conclusion. Partial data leaves you in a situation where you have to give your best experienced guess. In this case, however, we know that the gearbox was in poor condition and needed to be replaced following this data collection. The teeth were severely worn and were meshing signficantly with significant backlash.
In Part 8 we will discuss a gearbox application where all of the data is provided.
MotorDoc LLC is a service company that provides PdM, quality assurance and forensics of machinery failures. For more information, contact us at [email protected]. You can also find additional information at http://motordoc.com.
MotorDoc LLC will also be scheduling SMRP Approved Provider Electrical Signature Analysis training in 2018. Sign up for the newsletter at motordoc.com to be informed.
Electrical and Current Signature Analysis Application Part 8 Gearbox Analysis with Information
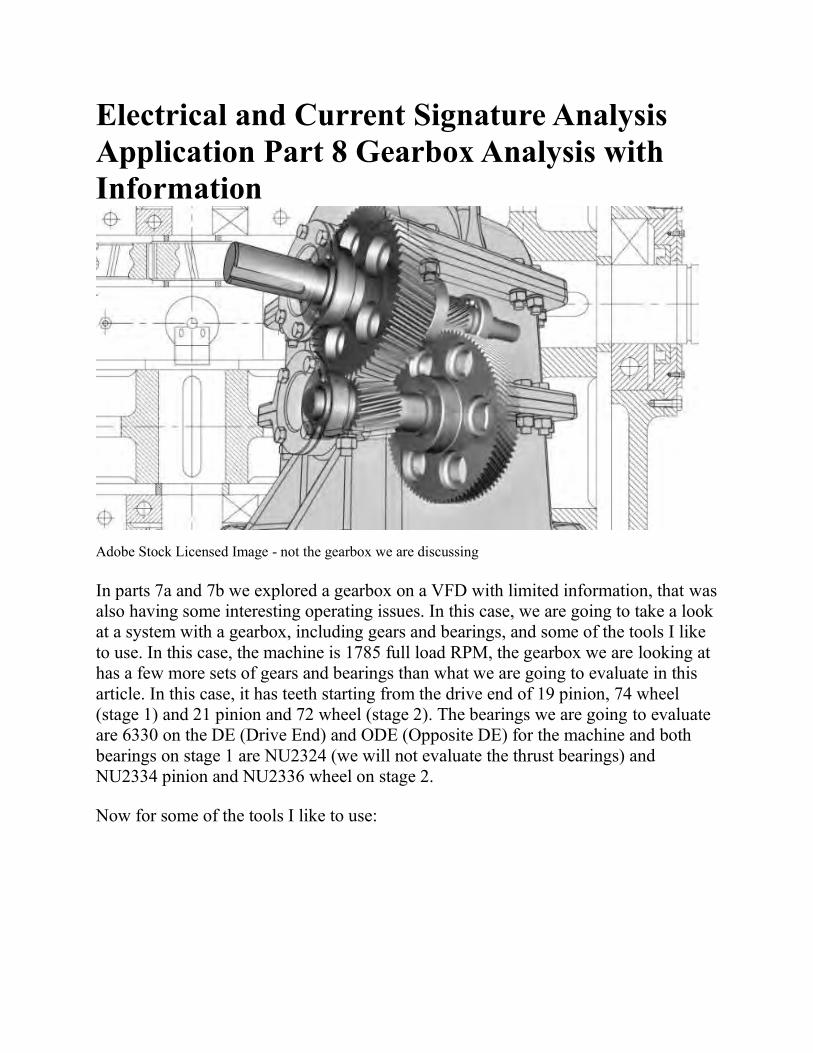
Adobe Stock Licensed Image - not the gearbox we are discussing
In parts 7a and 7b we explored a gearbox on a VFD with limited information, that was also having some interesting operating issues. In this case, we are going to take a look at a system with a gearbox, including gears and bearings, and some of the tools I like to use. In this case, the machine is 1785 full load RPM, the gearbox we are looking at has a few more sets of gears and bearings than what we are going to evaluate in this article. In this case, it has teeth starting from the drive end of 19 pinion, 74 wheel (stage 1) and 21 pinion and 72 wheel (stage 2). The bearings we are going to evaluate are 6330 on the DE (Drive End) and ODE (Opposite DE) for the machine and both bearings on stage 1 are NU2324 (we will not evaluate the thrust bearings) and NU2334 pinion and NU2336 wheel on stage 2.
Now for some of the tools I like to use:

The above is an iPhone and iPad app for calculating gears in a gearbox. In this case it also allows you to create a custom gearbox in the app, which we will do here, to provide a visual with resulting outputs. We will also talk about how we do simple calculations to accomplish the same thing.
The above is also a good app for bearing multipliers. However, it does not have all of the bearings we are interested in. The software I use for ESA does have a good database of bearings and you can also go to the bearing manufacturers sites to obtain the 1X multipliers. These become important whether you are performing ESA or vibration analysis.
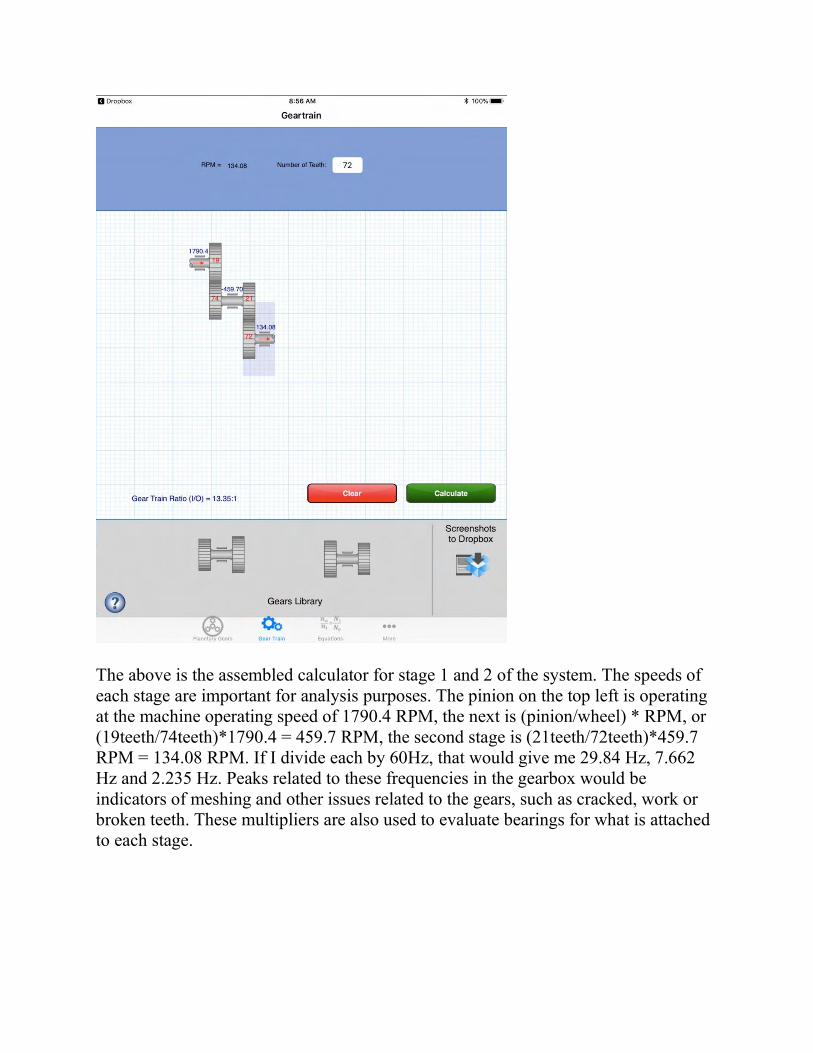
The above is the assembled calculator for stage 1 and 2 of the system. The speeds of each stage are important for analysis purposes. The pinion on the top left is operating at the machine operating speed of 1790.4 RPM, the next is (pinion/wheel) * RPM, or (19teeth/74teeth)*1790.4 = 459.7 RPM, the second stage is (21teeth/72teeth)*459.7 RPM = 134.08 RPM. If I divide each by 60Hz, that would give me 29.84 Hz, 7.662 Hz and 2.235 Hz. Peaks related to these frequencies in the gearbox would be indicators of meshing and other issues related to the gears, such as cracked, work or broken teeth. These multipliers are also used to evaluate bearings for what is attached to each stage.
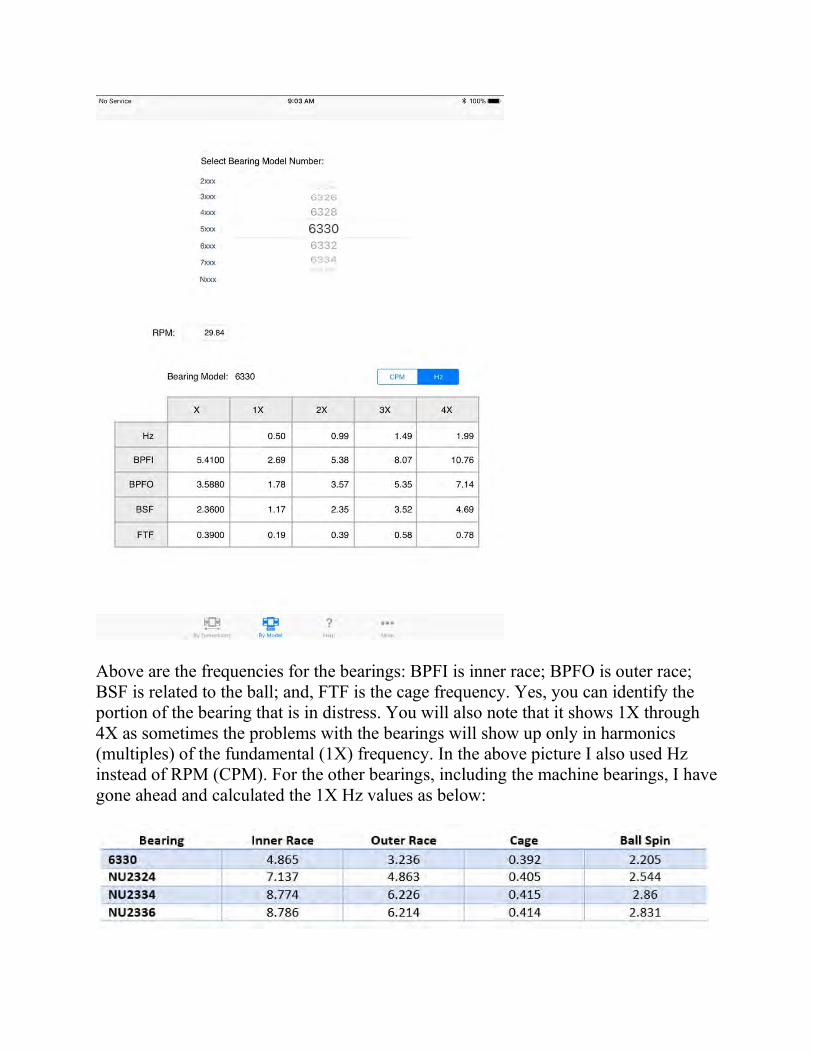
Above are the frequencies for the bearings: BPFI is inner race; BPFO is outer race; BSF is related to the ball; and, FTF is the cage frequency. Yes, you can identify the portion of the bearing that is in distress. You will also note that it shows 1X through 4X as sometimes the problems with the bearings will show up only in harmonics (multiples) of the fundamental (1X) frequency. In the above picture I also used Hz instead of RPM (CPM). For the other bearings, including the machine bearings, I have gone ahead and calculated the 1X Hz values as below:
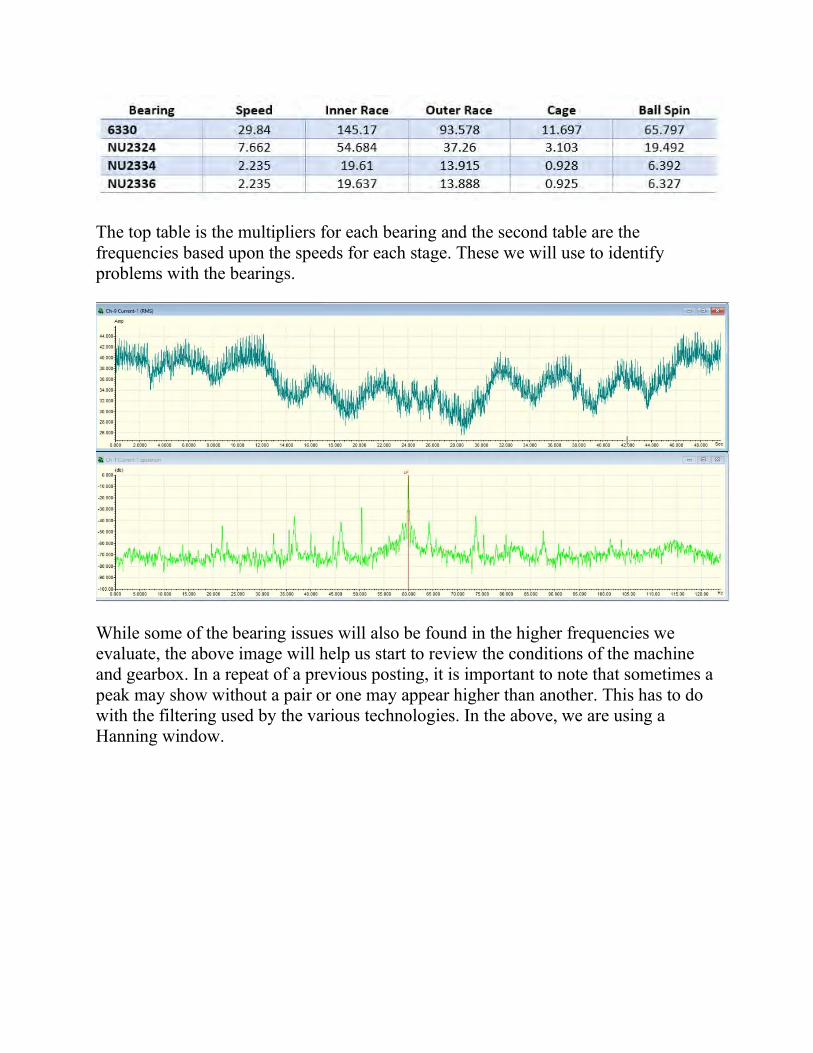
The top table is the multipliers for each bearing and the second table are the frequencies based upon the speeds for each stage. These we will use to identify problems with the bearings.
While some of the bearing issues will also be found in the higher frequencies we evaluate, the above image will help us start to review the conditions of the machine and gearbox. In a repeat of a previous posting, it is important to note that sometimes a peak may show without a pair or one may appear higher than another. This has to do with the filtering used by the various technologies. In the above, we are using a Hanning window.
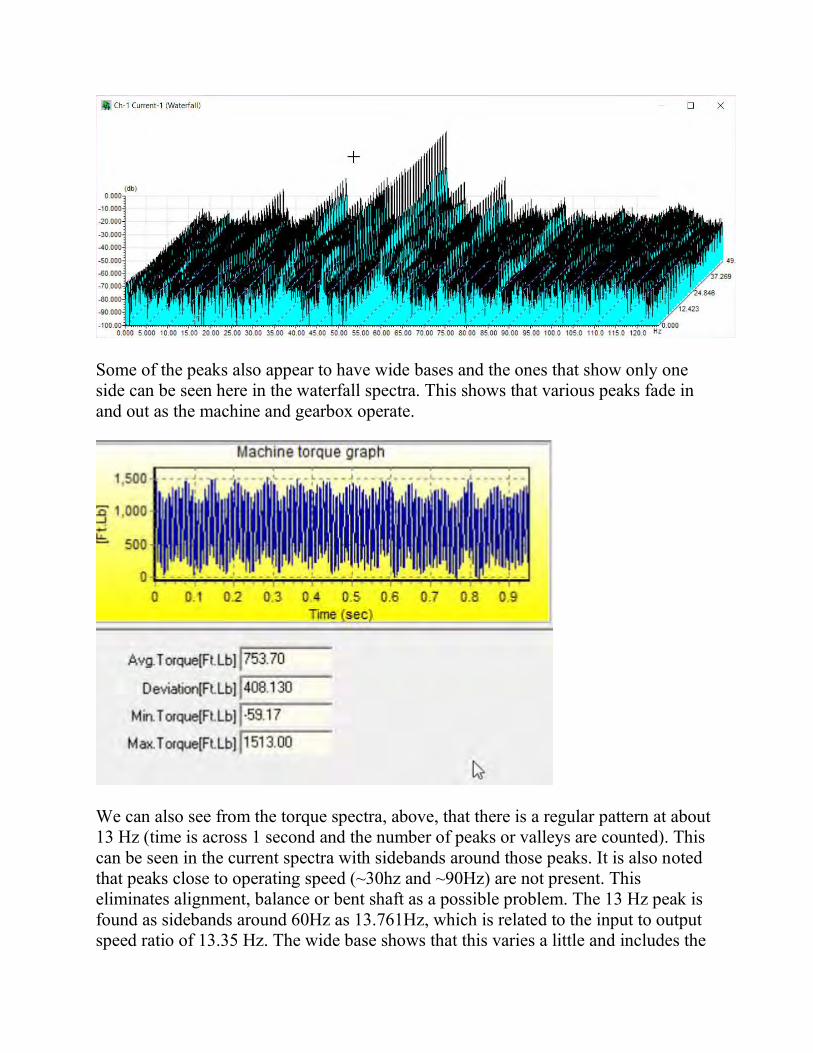
Some of the peaks also appear to have wide bases and the ones that show only one side can be seen here in the waterfall spectra. This shows that various peaks fade in and out as the machine and gearbox operate.
We can also see from the torque spectra, above, that there is a regular pattern at about 13 Hz (time is across 1 second and the number of peaks or valleys are counted). This can be seen in the current spectra with sidebands around those peaks. It is also noted that peaks close to operating speed (~30hz and ~90Hz) are not present. This eliminates alignment, balance or bent shaft as a possible problem. The 13 Hz peak is found as sidebands around 60Hz as 13.761Hz, which is related to the input to output speed ratio of 13.35 Hz. The wide base shows that this varies a little and includes the

13.35Hz, resulting in the identification that something is binding in the gearbox at the second stage.
The ratios are calculated from the high speed, or machine speed. So, the first stage has a ratio of 3.89, which is also found to the right of the line frequency at 64.209Hz with a slight base. The sidebands in close to the line frequency show at similar frequencies to the sidebands about the 13.761 Hz peaks. An evaluation of the PPF indicates that these do not relate to the rotor, but are related to the gearbox, indicating possible severe wear or even a cracked/fractured tooth.
With the bearings we are evaluating, we are also seeing peaks at the sidebands around line frequency related to the second stage bearings (NU2334 and NU2336) inner race. (I will note that the other peaks are indicative of other bearings not being evaluated in this article) This may indicate that there are orbiting issues with the second stage of the gearbox. The peaks are high with sidebands around the 13 Hz signature, indicating that the problem is relatively severe.
The recommendation was to have the gearbox evaluated for second stage issues of which damaged inner bearing race(s) of the bearings and gear tooth wear/fractures were possible. Both issues were confirmed.
In Part 9 we will take a look at evaluating your system with the power quality aspect of ESA.
MotorDoc LLC is a service company that provides PdM, quality assurance and forensics of machinery failures. For more information, contact us at [email protected]. You can also find additional information at http://motordoc.com.
MotorDoc LLC will also be scheduling SMRP Approved Provider Electrical Signature Analysis training in 2018. Sign up for the newsletter at motordoc.com to be informed.
Electrical and Current Signature Analysis Application Part 9a Power Quality Basics
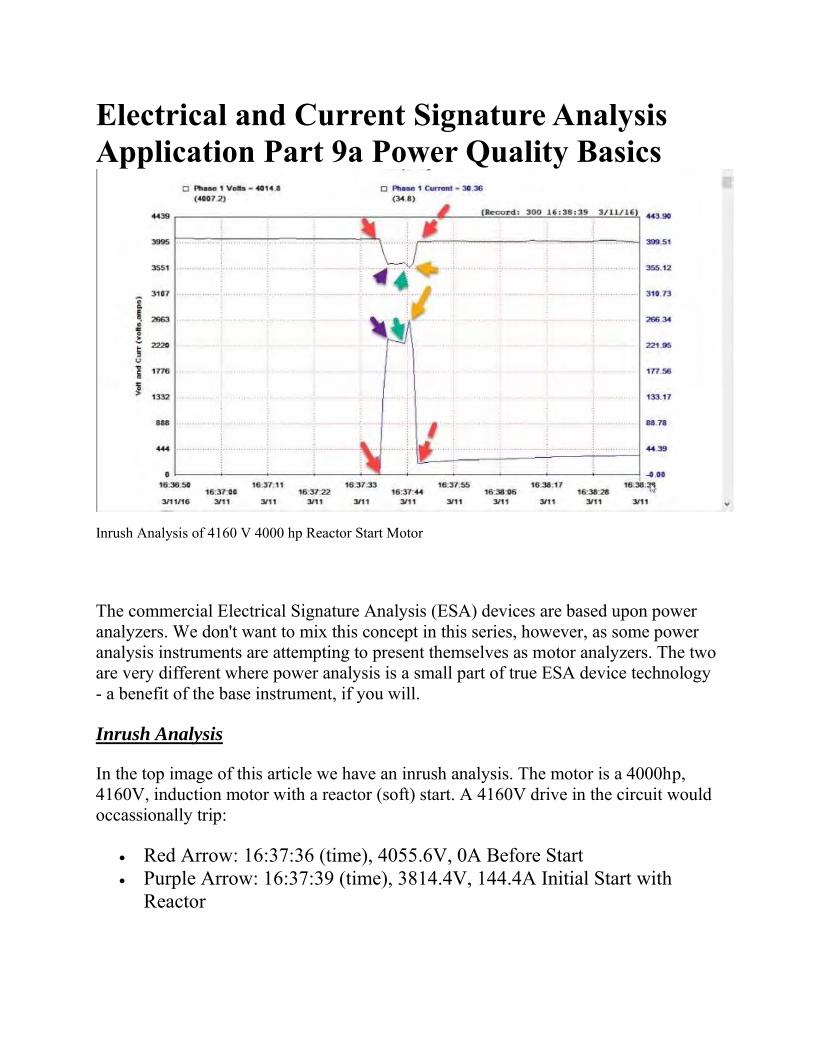
Inrush Analysis of 4160 V 4000 hp Reactor Start Motor
The commercial Electrical Signature Analysis (ESA) devices are based upon power analyzers. We don't want to mix this concept in this series, however, as some power analysis instruments are attempting to present themselves as motor analyzers. The two are very different where power analysis is a small part of true ESA device technology - a benefit of the base instrument, if you will.
Inrush Analysis
In the top image of this article we have an inrush analysis. The motor is a 4000hp, 4160V, induction motor with a reactor (soft) start. A 4160V drive in the circuit would occassionally trip:
Red Arrow: 16:37:36 (time), 4055.6V, 0A Before Start Purple Arrow: 16:37:39 (time), 3814.4V, 144.4A Initial Start with
Reactor
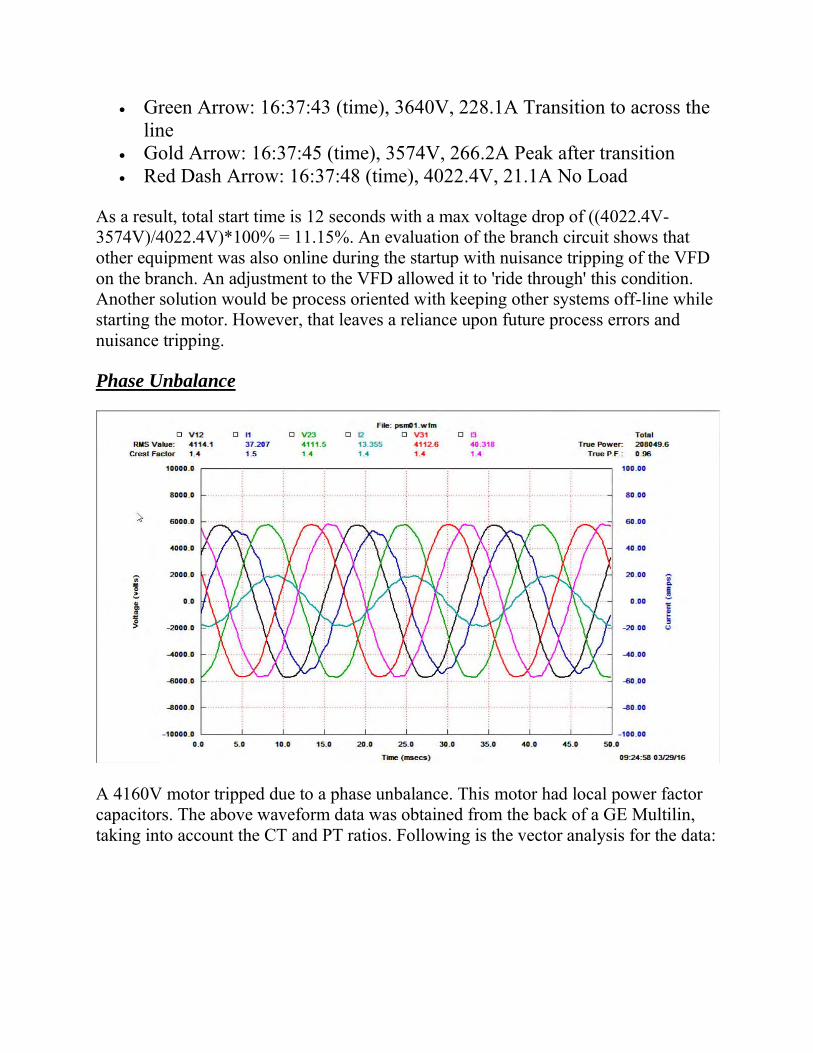
Green Arrow: 16:37:43 (time), 3640V, 228.1A Transition to across the line
Gold Arrow: 16:37:45 (time), 3574V, 266.2A Peak after transition Red Dash Arrow: 16:37:48 (time), 4022.4V, 21.1A No Load
As a result, total start time is 12 seconds with a max voltage drop of ((4022.4V-3574V)/4022.4V)*100% = 11.15%. An evaluation of the branch circuit shows that other equipment was also online during the startup with nuisance tripping of the VFD on the branch. An adjustment to the VFD allowed it to 'ride through' this condition. Another solution would be process oriented with keeping other systems off-line while starting the motor. However, that leaves a reliance upon future process errors and nuisance tripping.
Phase Unbalance
A 4160V motor tripped due to a phase unbalance. This motor had local power factor capacitors. The above waveform data was obtained from the back of a GE Multilin, taking into account the CT and PT ratios. Following is the vector analysis for the data:
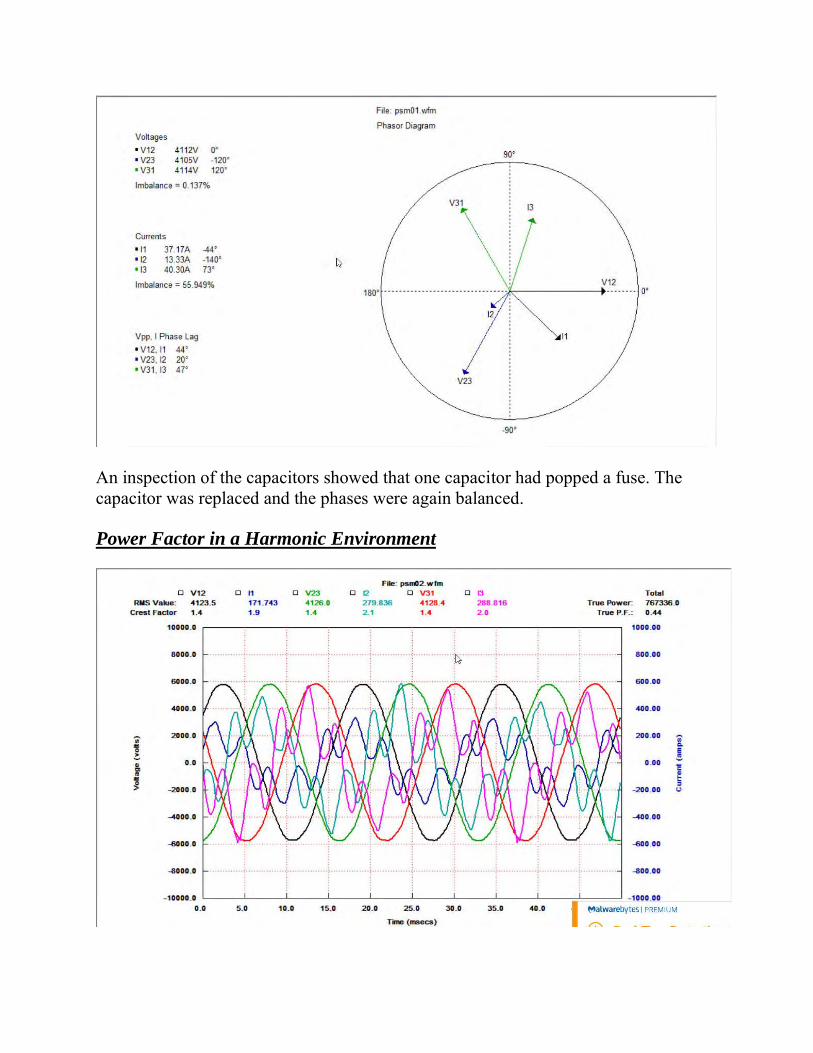
An inspection of the capacitors showed that one capacitor had popped a fuse. The capacitor was replaced and the phases were again balanced.
Power Factor in a Harmonic Environment
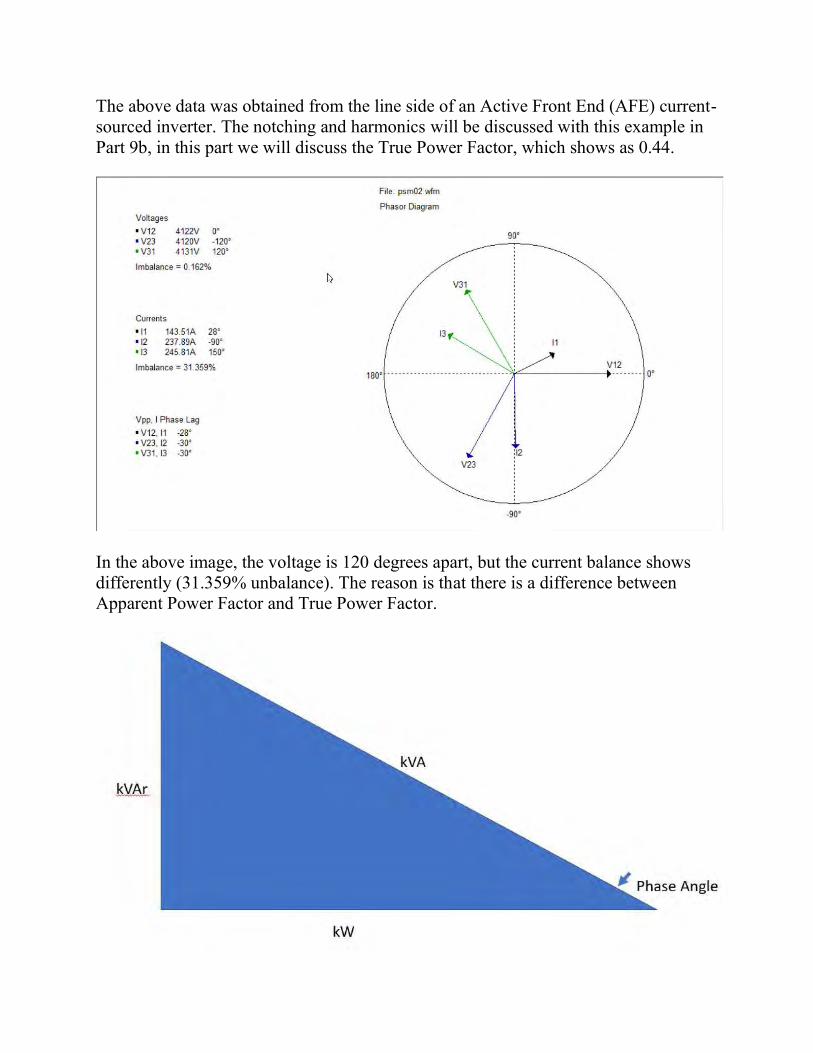
The above data was obtained from the line side of an Active Front End (AFE) current-sourced inverter. The notching and harmonics will be discussed with this example in Part 9b, in this part we will discuss the True Power Factor, which shows as 0.44.
In the above image, the voltage is 120 degrees apart, but the current balance shows differently (31.359% unbalance). The reason is that there is a difference between Apparent Power Factor and True Power Factor.
The power factor is a range from 0 to 1, with 0 being a fully reactive (inductive) load and 1 being a fully resistive load. The apparent power is measured voltage and current, or kVA. The kW is the actual work that is performed, such as the shaft power of a motor. The kVAr, is the reactive power, or the power necessary to maintain a magnetic field, the kVAr can be either inductive or capacitive. For instance, if we want to correct a poor power factor, we can size capacitors to reduce the kVAr. If the kVAr is large, then the apparent current increases with the kVA, which means that the current read on an ammeter would increase or decrease along with changes in power factor with the same kW and Voltage. Therefore, with the same load and voltage, as the power factor drops from 1 towards 0, the current would increase. In a relatively balanced system, the apparent power factor is basically kW/kVA = PFa
With the Phase Unbalance example above, you will note that the current changed as a result of a bad capacitor.
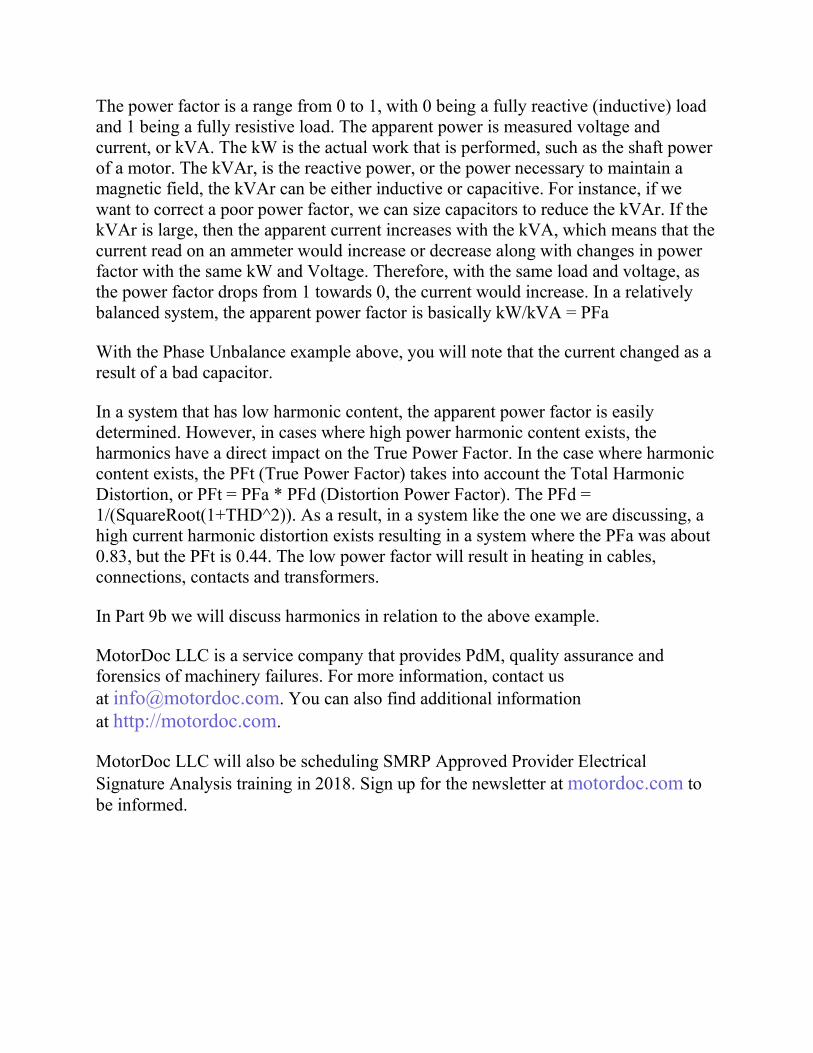
In a system that has low harmonic content, the apparent power factor is easily determined. However, in cases where high power harmonic content exists, the harmonics have a direct impact on the True Power Factor. In the case where harmonic content exists, the PFt (True Power Factor) takes into account the Total Harmonic Distortion, or PFt = PFa * PFd (Distortion Power Factor). The PFd = 1/(SquareRoot(1+THD^2)). As a result, in a system like the one we are discussing, a high current harmonic distortion exists resulting in a system where the PFa was about 0.83, but the PFt is 0.44. The low power factor will result in heating in cables, connections, contacts and transformers.
In Part 9b we will discuss harmonics in relation to the above example.
MotorDoc LLC is a service company that provides PdM, quality assurance and forensics of machinery failures. For more information, contact us at [email protected]. You can also find additional information at http://motordoc.com.
MotorDoc LLC will also be scheduling SMRP Approved Provider Electrical Signature Analysis training in 2018. Sign up for the newsletter at motordoc.com to be informed.
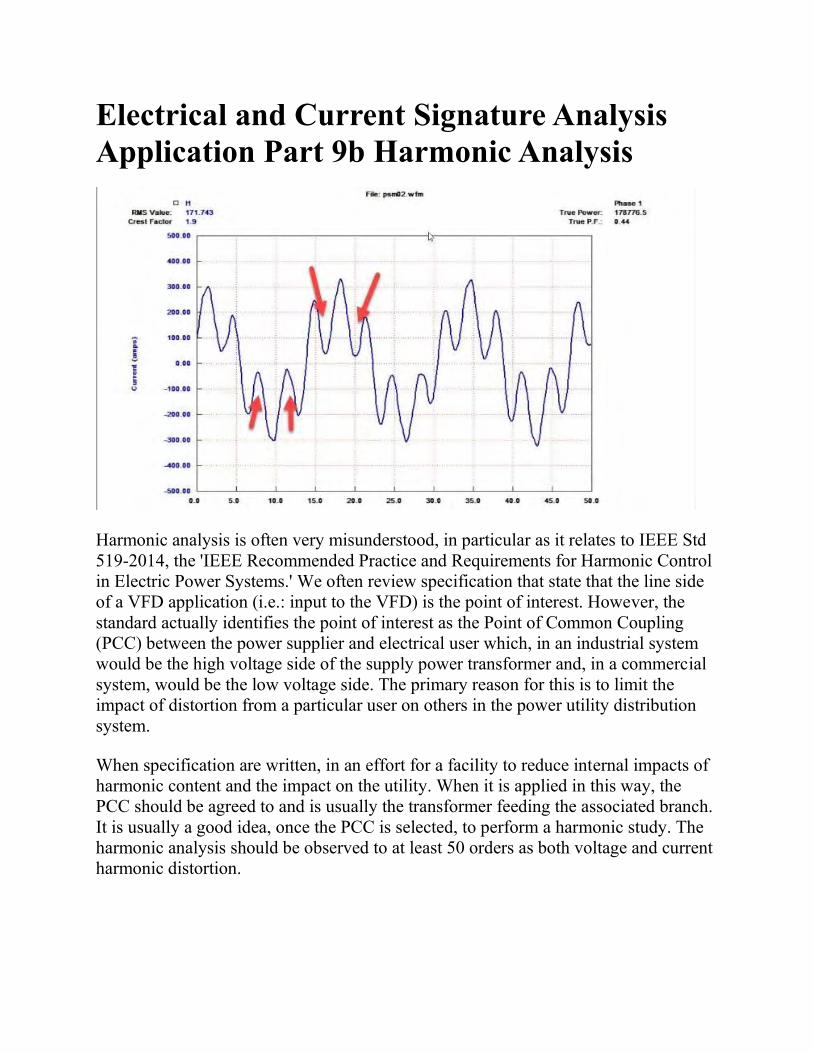
Electrical and Current Signature Analysis Application Part 9b Harmonic Analysis
Harmonic analysis is often very misunderstood, in particular as it relates to IEEE Std 519-2014, the 'IEEE Recommended Practice and Requirements for Harmonic Control in Electric Power Systems.' We often review specification that state that the line side of a VFD application (i.e.: input to the VFD) is the point of interest. However, the standard actually identifies the point of interest as the Point of Common Coupling (PCC) between the power supplier and electrical user which, in an industrial system would be the high voltage side of the supply power transformer and, in a commercial system, would be the low voltage side. The primary reason for this is to limit the impact of distortion from a particular user on others in the power utility distribution system.
When specification are written, in an effort for a facility to reduce internal impacts of harmonic content and the impact on the utility. When it is applied in this way, the PCC should be agreed to and is usually the transformer feeding the associated branch. It is usually a good idea, once the PCC is selected, to perform a harmonic study. The harmonic analysis should be observed to at least 50 orders as both voltage and current harmonic distortion.
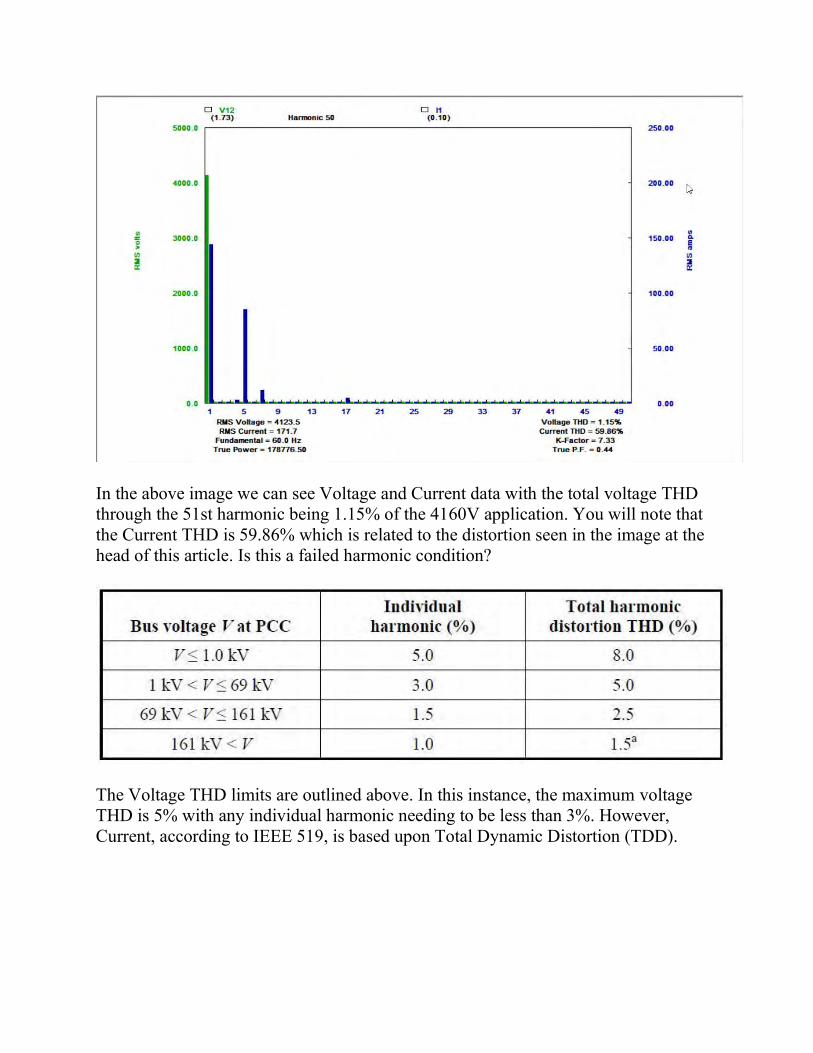
In the above image we can see Voltage and Current data with the total voltage THD through the 51st harmonic being 1.15% of the 4160V application. You will note that the Current THD is 59.86% which is related to the distortion seen in the image at the head of this article. Is this a failed harmonic condition?
The Voltage THD limits are outlined above. In this instance, the maximum voltage THD is 5% with any individual harmonic needing to be less than 3%. However, Current, according to IEEE 519, is based upon Total Dynamic Distortion (TDD).
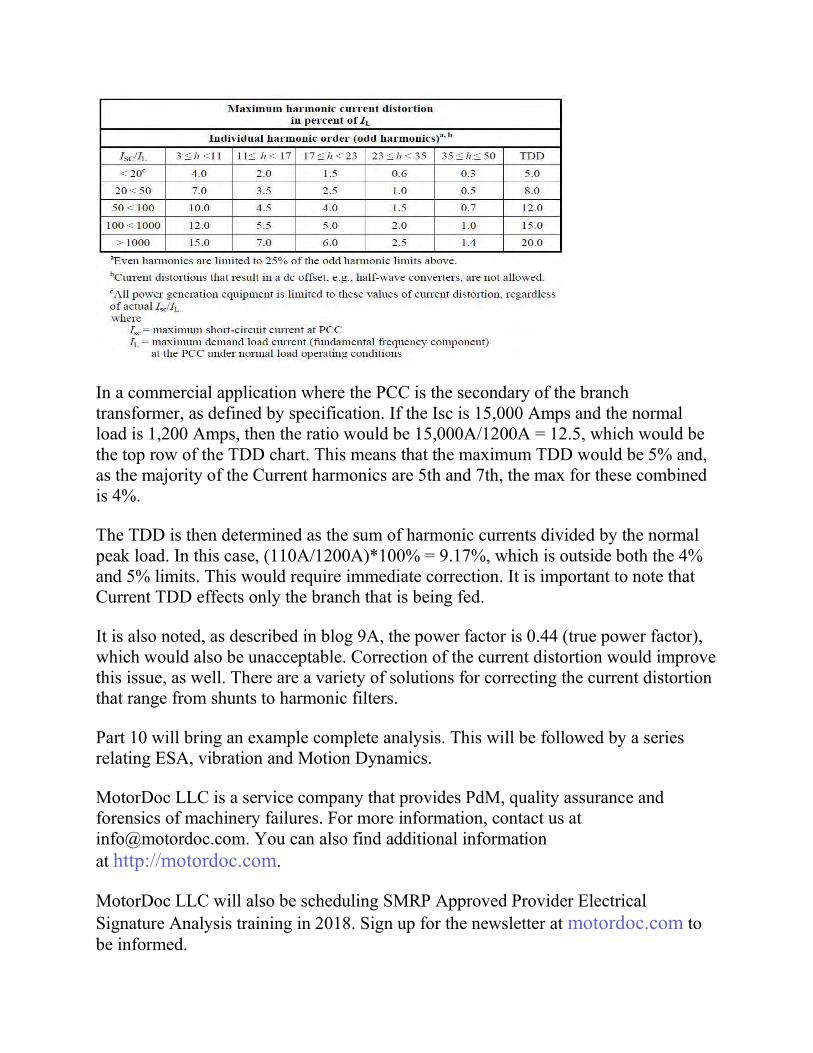
In a commercial application where the PCC is the secondary of the branch transformer, as defined by specification. If the Isc is 15,000 Amps and the normal load is 1,200 Amps, then the ratio would be 15,000A/1200A = 12.5, which would be the top row of the TDD chart. This means that the maximum TDD would be 5% and, as the majority of the Current harmonics are 5th and 7th, the max for these combined is 4%.
The TDD is then determined as the sum of harmonic currents divided by the normal peak load. In this case, (110A/1200A)*100% = 9.17%, which is outside both the 4% and 5% limits. This would require immediate correction. It is important to note that Current TDD effects only the branch that is being fed.
It is also noted, as described in blog 9A, the power factor is 0.44 (true power factor), which would also be unacceptable. Correction of the current distortion would improve this issue, as well. There are a variety of solutions for correcting the current distortion that range from shunts to harmonic filters.
Part 10 will bring an example complete analysis. This will be followed by a series relating ESA, vibration and Motion Dynamics.
MotorDoc LLC is a service company that provides PdM, quality assurance and forensics of machinery failures. For more information, contact us at [email protected]. You can also find additional information at http://motordoc.com.
MotorDoc LLC will also be scheduling SMRP Approved Provider Electrical Signature Analysis training in 2018. Sign up for the newsletter at motordoc.com to be informed.
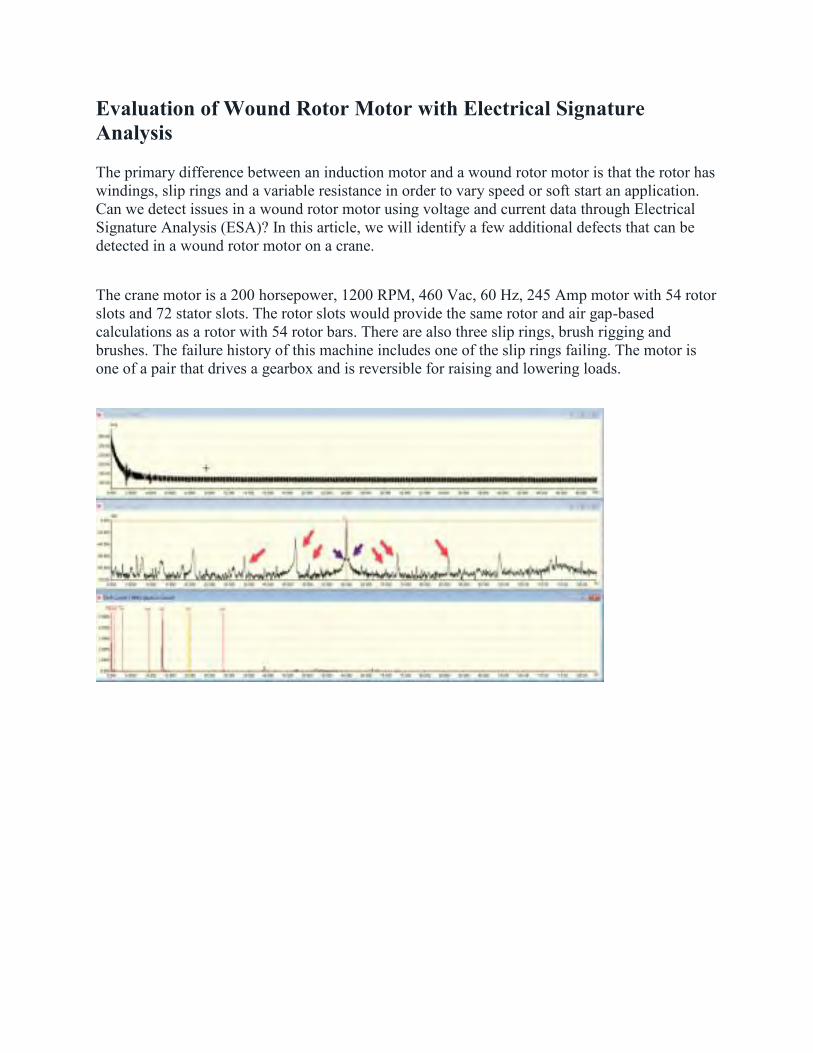
Evaluation of Wound Rotor Motor with Electrical Signature Analysis The primary difference between an induction motor and a wound rotor motor is that the rotor has windings, slip rings and a variable resistance in order to vary speed or soft start an application. Can we detect issues in a wound rotor motor using voltage and current data through Electrical Signature Analysis (ESA)? In this article, we will identify a few additional defects that can be detected in a wound rotor motor on a crane.
The crane motor is a 200 horsepower, 1200 RPM, 460 Vac, 60 Hz, 245 Amp motor with 54 rotor slots and 72 stator slots. The rotor slots would provide the same rotor and air gap-based calculations as a rotor with 54 rotor bars. There are also three slip rings, brush rigging and brushes. The failure history of this machine includes one of the slip rings failing. The motor is one of a pair that drives a gearbox and is reversible for raising and lowering loads.
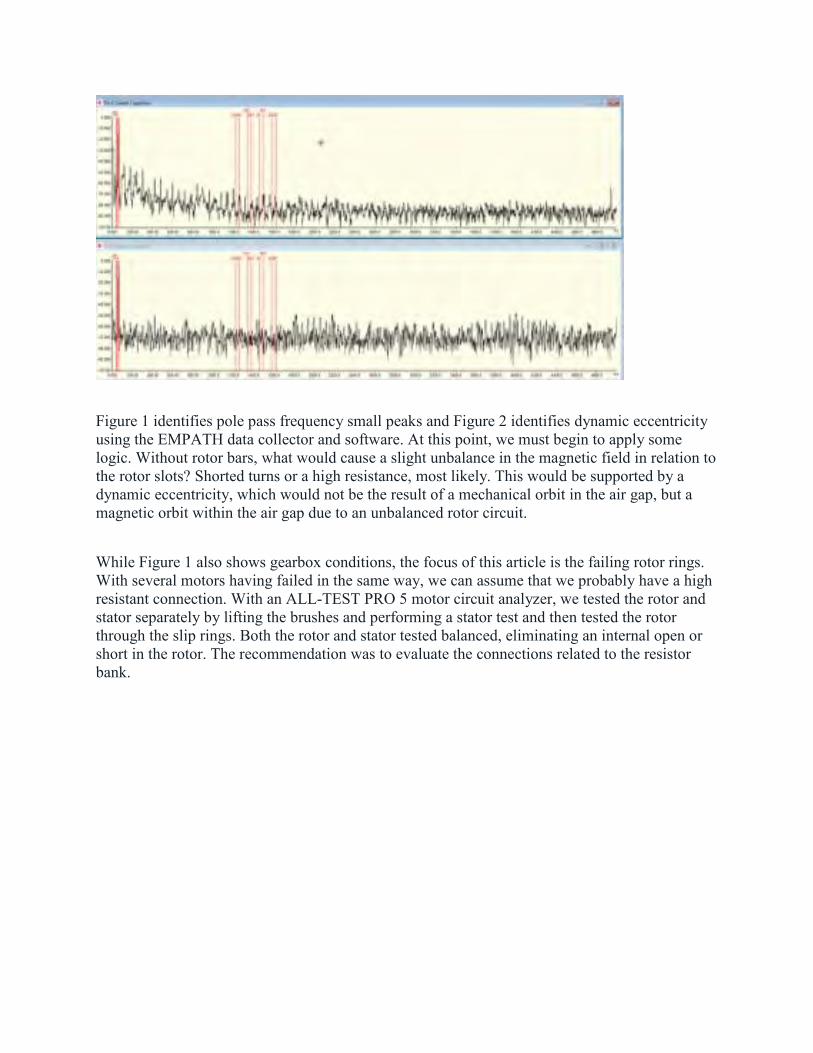
Figure 1 identifies pole pass frequency small peaks and Figure 2 identifies dynamic eccentricity using the EMPATH data collector and software. At this point, we must begin to apply some logic. Without rotor bars, what would cause a slight unbalance in the magnetic field in relation to the rotor slots? Shorted turns or a high resistance, most likely. This would be supported by a dynamic eccentricity, which would not be the result of a mechanical orbit in the air gap, but a magnetic orbit within the air gap due to an unbalanced rotor circuit.
While Figure 1 also shows gearbox conditions, the focus of this article is the failing rotor rings. With several motors having failed in the same way, we can assume that we probably have a high resistant connection. With an ALL-TEST PRO 5 motor circuit analyzer, we tested the rotor and stator separately by lifting the brushes and performing a stator test and then tested the rotor through the slip rings. Both the rotor and stator tested balanced, eliminating an internal open or short in the rotor. The recommendation was to evaluate the connections related to the resistor bank.
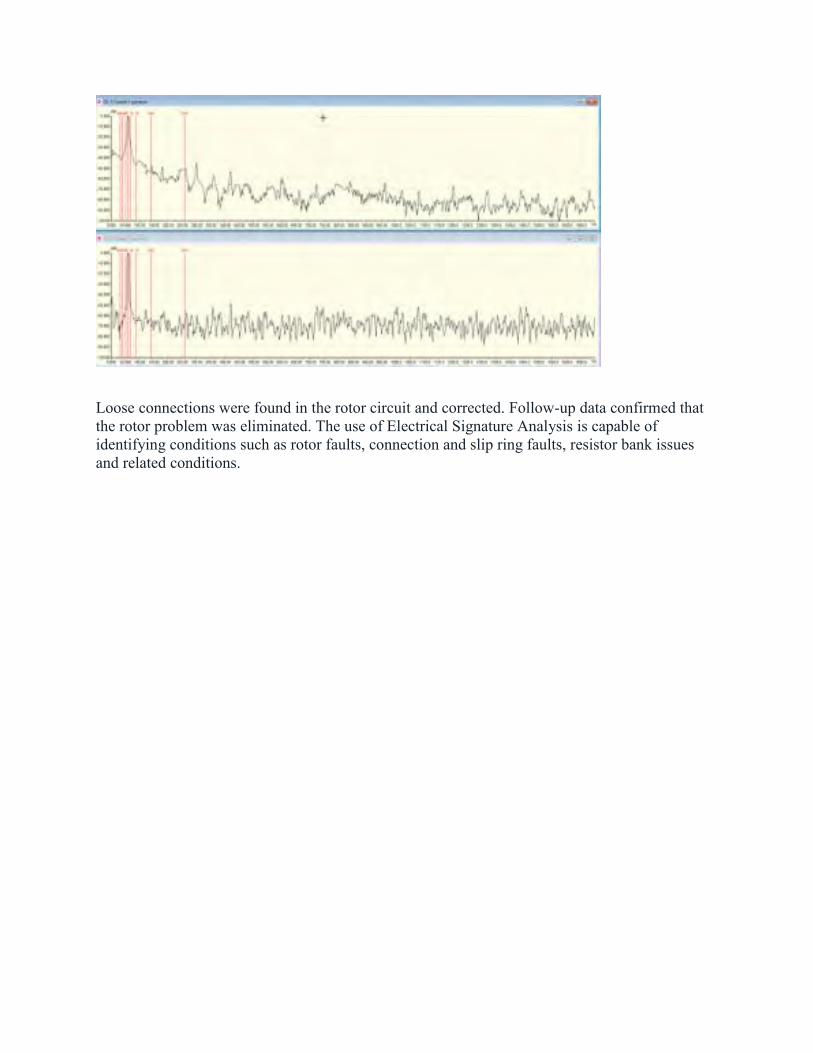
Loose connections were found in the rotor circuit and corrected. Follow-up data confirmed that the rotor problem was eliminated. The use of Electrical Signature Analysis is capable of identifying conditions such as rotor faults, connection and slip ring faults, resistor bank issues and related conditions.
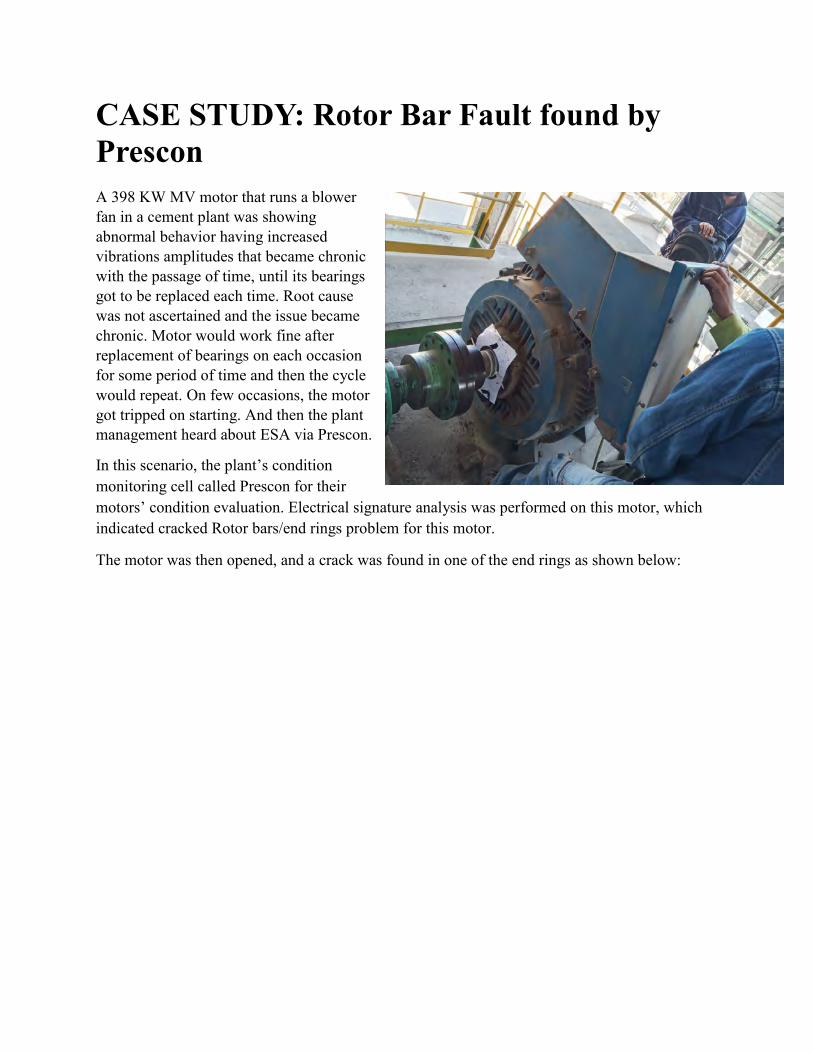
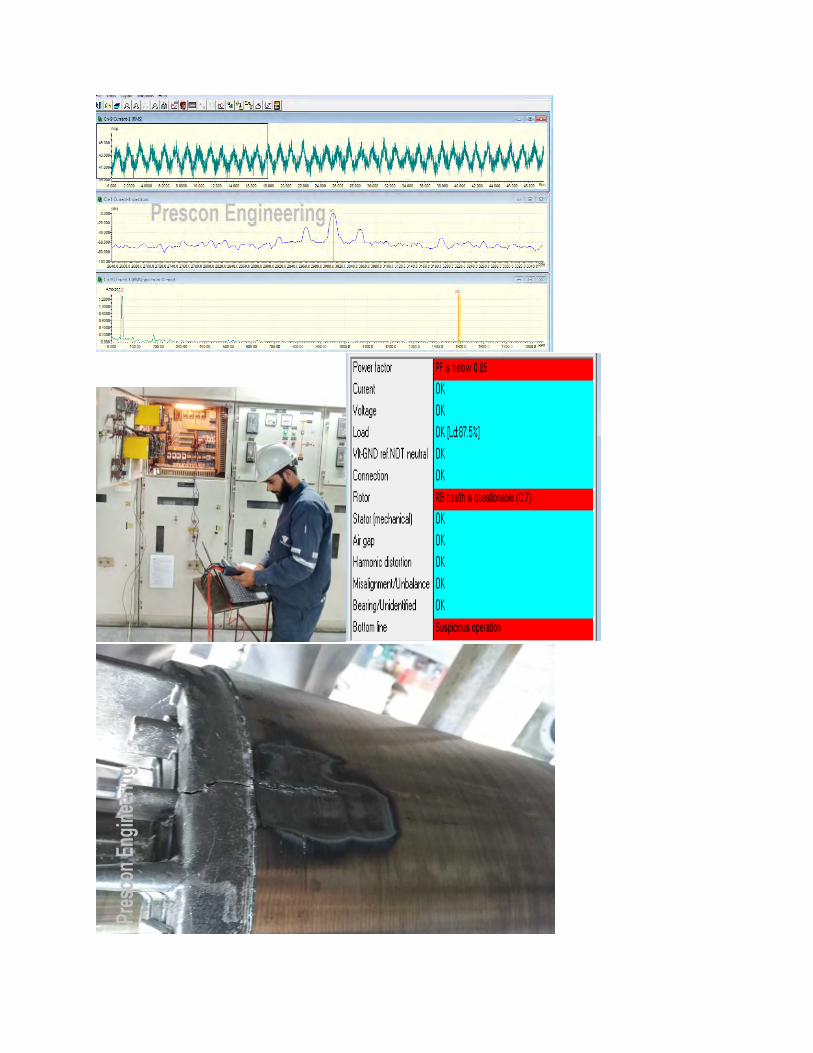
CASE STUDY: Rotor Bar Fault found by Prescon A 398 KW MV motor that runs a blower fan in a cement plant was showing abnormal behavior having increased vibrations amplitudes that became chronic with the passage of time, until its bearings got to be replaced each time. Root cause was not ascertained and the issue became chronic. Motor would work fine after replacement of bearings on each occasion for some period of time and then the cycle would repeat. On few occasions, the motor got tripped on starting. And then the plant management heard about ESA via Prescon.
In this scenario, the plant’s condition monitoring cell called Prescon for their motors’ condition evaluation. Electrical signature analysis was performed on this motor, which indicated cracked Rotor bars/end rings problem for this motor.
The motor was then opened, and a crack was found in one of the end rings as shown below:
Electrical and Current Signature Analysis Application Part 10 QA of Generator There's nothing more fun that being able to visibly prove you are correct. In this study we will look at misalignment and a few other issues based upon a generator rebuild contractor versus QA inspection. In the past, with vibration and Electrical Signature Analysis (ESA), there is always a disagreement. The addition of Motion Amplification, coupled with the technologies we bring to bear, is a huge game changer. Starting in 2018, we have implemented motion amplification to our arsenal.
An ~25MW, 1800 RPM, 13.8kV cogen unit was overhauled and cleaned. While some of the QA was contentious, overall there was good teamwork to get the system up and running. During the alignment process it was stated by the contractor that because the feet were not moved that the alignment was OK. QA disagreed.
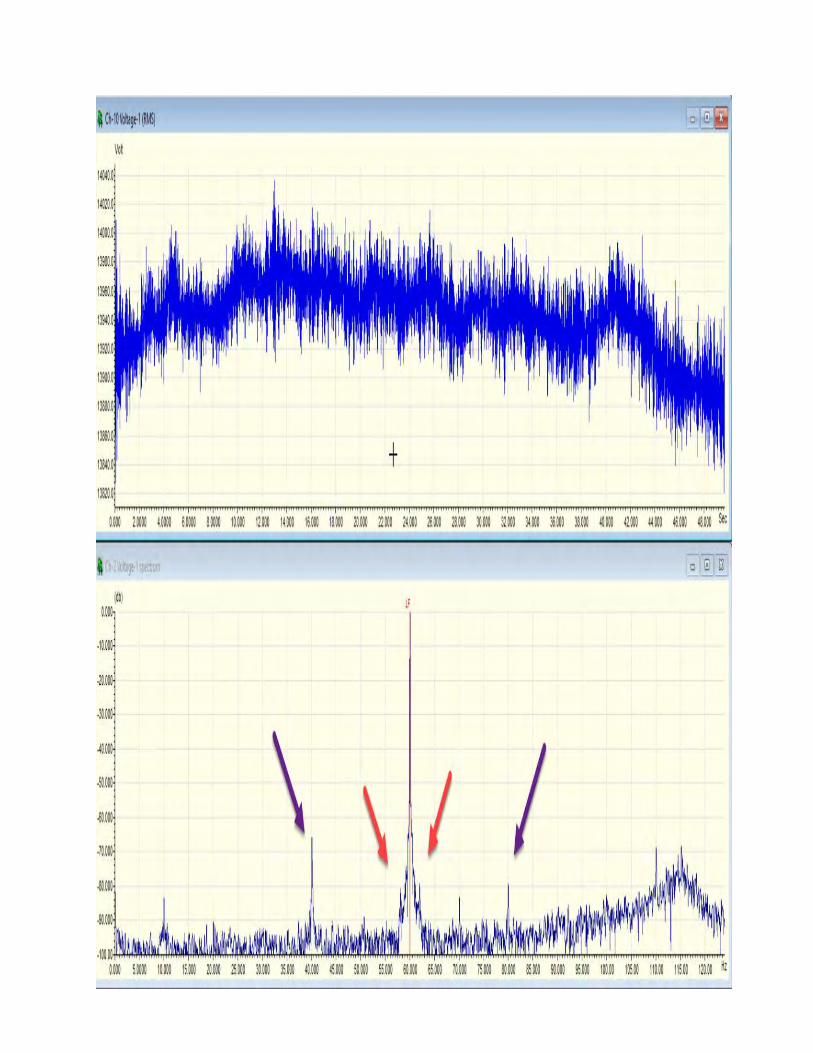
Figure 1 shows one of the vibration points (Horizontal) taken on the casing under low load through a babbitt style bearing. There is clearly some small misalignment. However, there was some confusion as we would normally see a high 1X RPM in either voltage or current in ESA. Instead we see a 20Hz high peak in both voltage and current (purple) as well as rotor condition indicators (these are close peaks around line frequency in synchronous motors - red) and a number of poles squared sideband (low). These are actually indicators of rotor-related conditions.
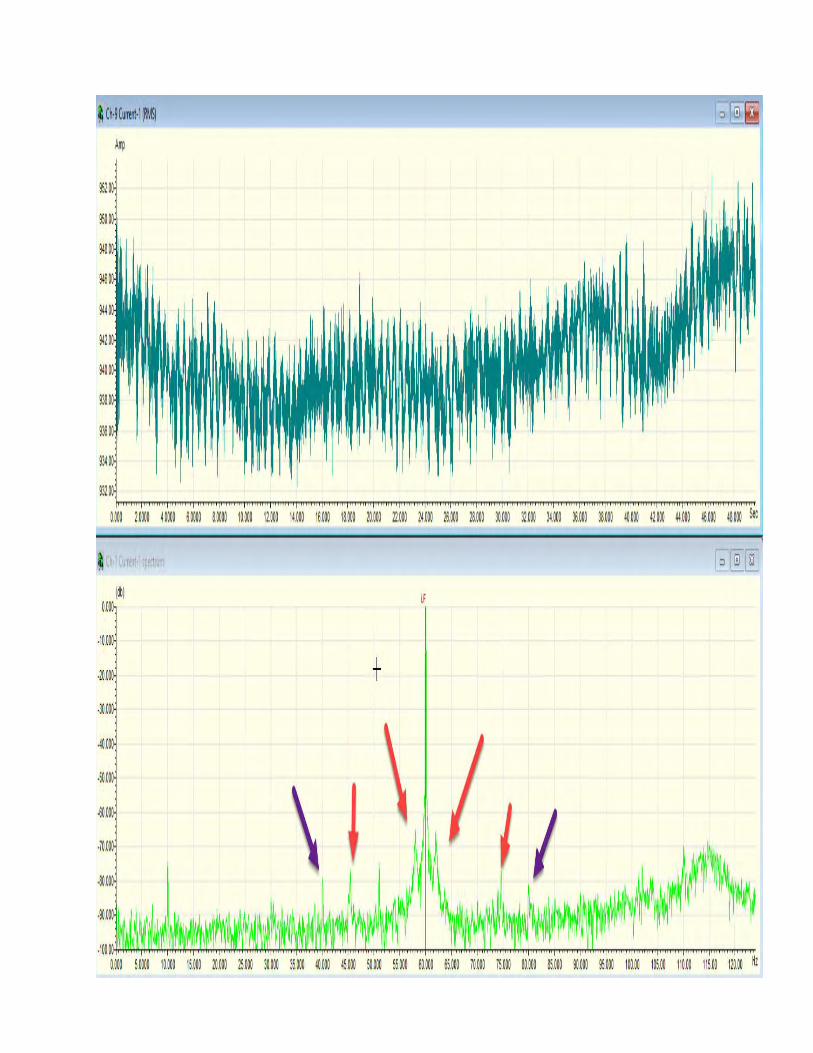

This would normally be a point that would have to be discussed in depth related to acceptance or rejection of the machine. While test results were within parameters, the floor and vibration on the deck did not 'feel' right. The disagreement between technologies added to the confusion.
Motion Amplification was brought into play:
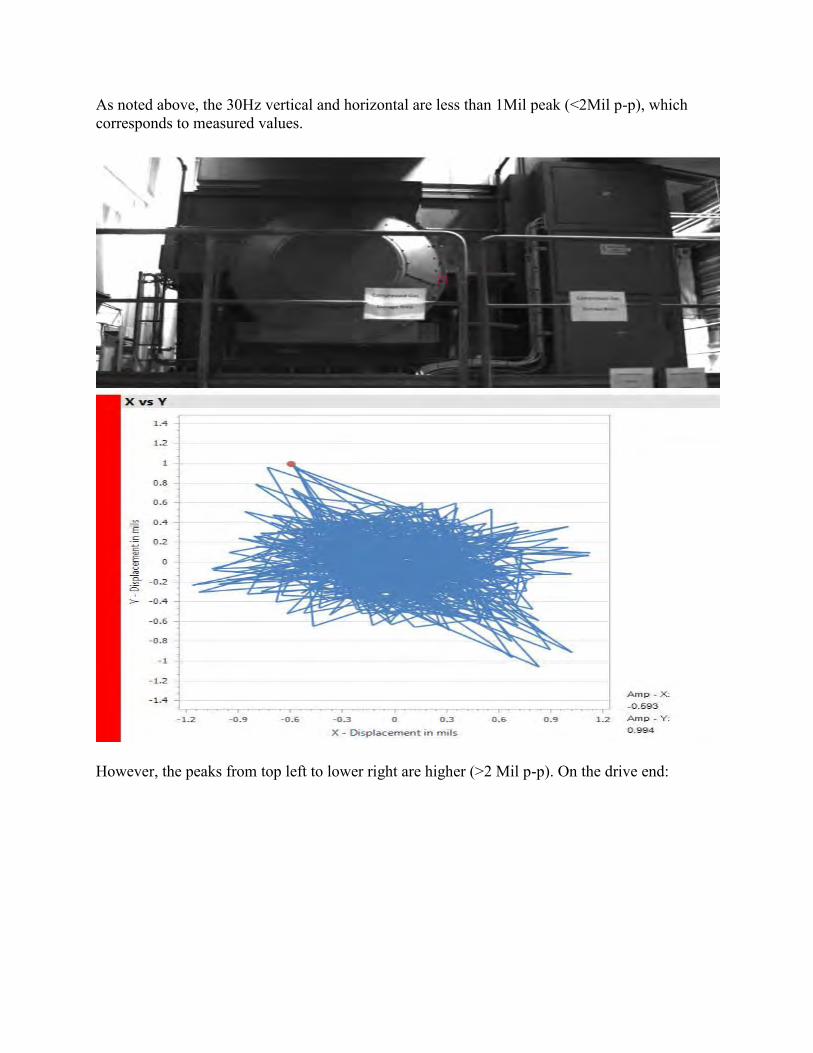
As noted above, the 30Hz vertical and horizontal are less than 1Mil peak (<2Mil p-p), which corresponds to measured values.
However, the peaks from top left to lower right are higher (>2 Mil p-p). On the drive end:
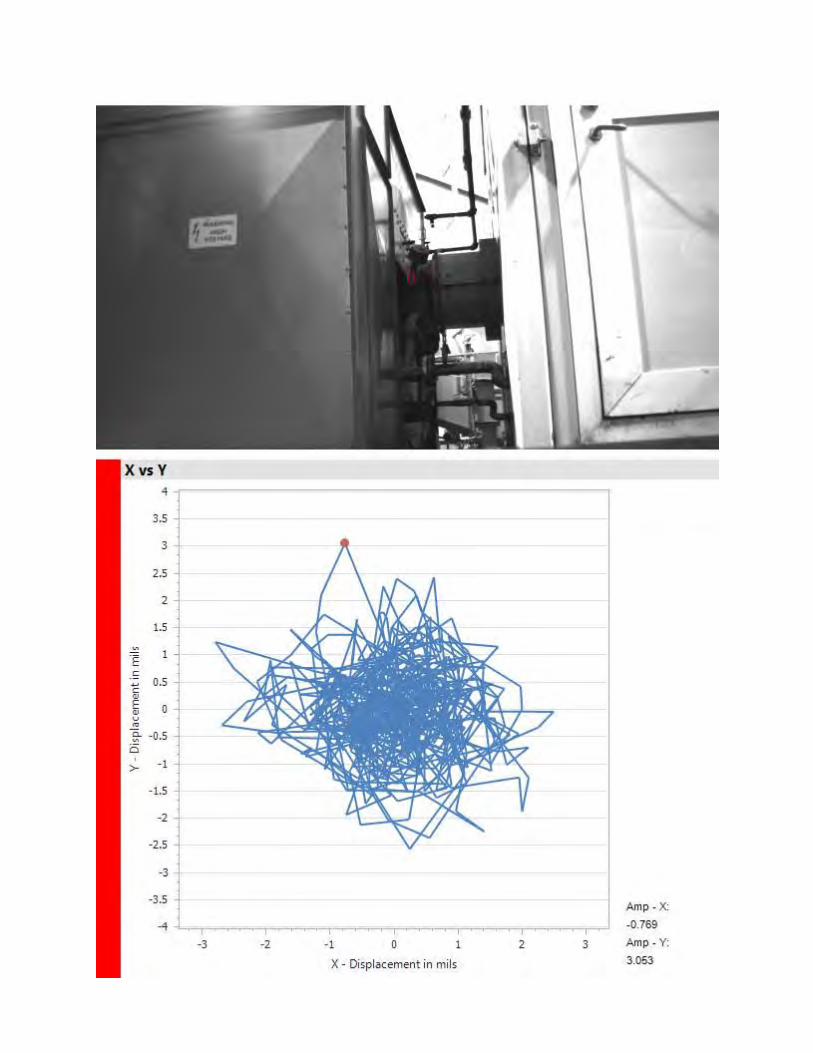
On the drive end at the bearing of the motor the orbit shows a slightly different condition. The frequencies fall around 20Hz and include both a vertical and thrust component. So, the next step is to put it through amplification and see what it looks like (see video at end).
For those with experience, yes, there are definitely other issues in this system which go beyond the scope of this article. In this case, however, we are focused just on the misalignment and improper coupling issue which has generated a high axial vibration, not detected by permanently installed sensors. The lack of a 1X RPM by ESA is atributable to the CTs and PTs in the system filtering out some frequencies - and dampening others. However, the 20Hz thrust issue was detected.
When we test systems with CTs and PTs we look at the comprehensive set of data that we collect. Rarely, when called in for a one time analysis of a system do we use just one technology. The use of vibration and ESA for running tests provided us with a much needed three dimensions, the implementation of motion amplification has added a fourth.

Motor Circuit Analysis of Medium Voltage Motors Part 2a - Low Voltage MCA with ALL-TEST PRO 5
Part 2 will encompass several of the technologies that are used for Motor Circuit Analysis (MCA) including both low voltage and high voltage test methods. The 'low' and 'high' refer to the outputs of the technologies and not the types of equipment that they are used to test. In this article we will start with the ALL-TEST PRO 5 technology and it's application on form wound machines through 13.8kV. The ATPro5 is a hand-held, low voltage output instrument that focuses on measurements related to the insulating material conditions between turns and to ground. We will discuss the types of tests performed and then a case study using the technology on a 13.8kV, 4500hp, 1800RPM form-wound motor.
The basic measurements of the ATPro5 include: Resistance, Inductance, Impedance, Phase Angle, Current/Frequency Response (I/F), Capacitance, Dissipation Factor and Insulation Resistance. These are based upon a specific frequency at low voltage.
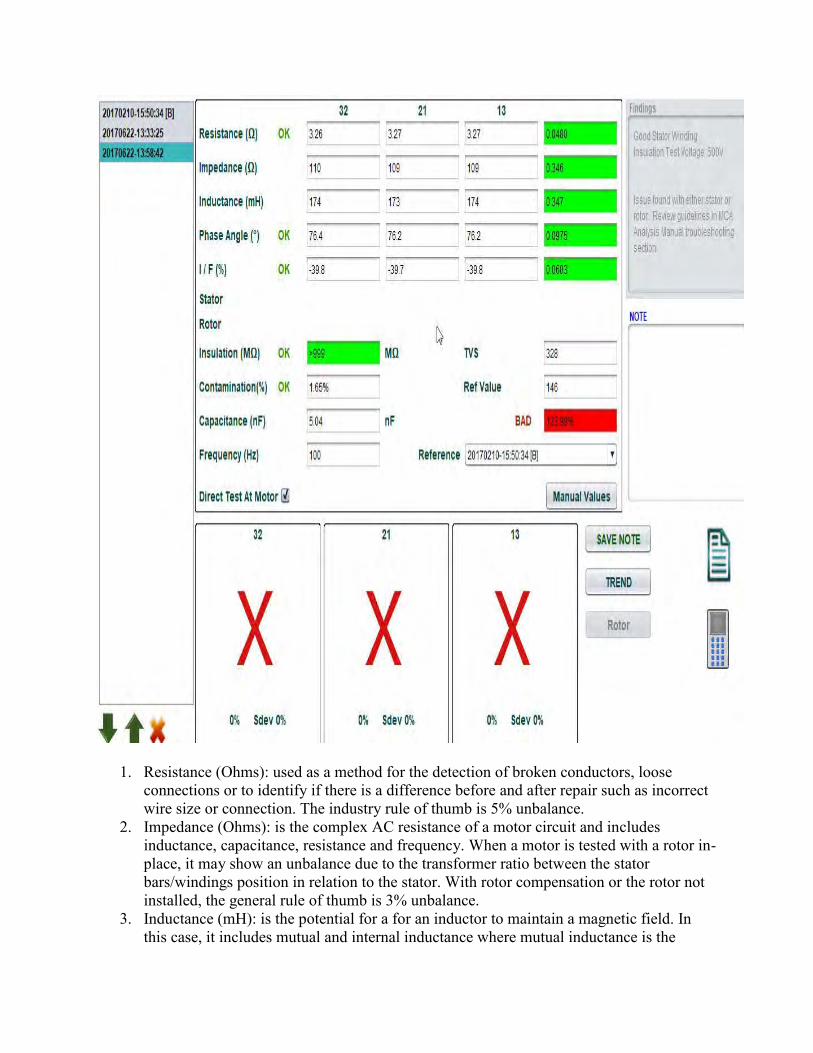
1. Resistance (Ohms): used as a method for the detection of broken conductors, loose connections or to identify if there is a difference before and after repair such as incorrect wire size or connection. The industry rule of thumb is 5% unbalance.
2. Impedance (Ohms): is the complex AC resistance of a motor circuit and includes inductance, capacitance, resistance and frequency. When a motor is tested with a rotor in-place, it may show an unbalance due to the transformer ratio between the stator bars/windings position in relation to the stator. With rotor compensation or the rotor not installed, the general rule of thumb is 3% unbalance.
3. Inductance (mH): is the potential for a for an inductor to maintain a magnetic field. In this case, it includes mutual and internal inductance where mutual inductance is the
transformer ratio, just as with impedance above, and internal means in relation to other turns in a coil or winding. Just as with impedance, this has the potential of being impacted by the rotor position. With rotor compensation or the rotor not installed, the general rule of thumb is 5-7% unbalance.
4. Phase Angle (Fi): in the case of this type of technology, this is not the power factor of the machine, but is the power factor of the insulation material in the circuit being tested at the frequency of test. This may also be considered the Q (quality) factor of the capacitance of the circuit. With the Voltage being the X-axis and Current being the Y-axis in a perfect capacitance, the angle between would be 90 degrees. However, in real insulation materials, there is a loss angle (delta) resulting in a phase angle less than 90 degrees. In a good system, this angle is balanced between phases or relatively balanced with a rotor in place. This value is affected by the applied frequency. This is presented in degrees. The tolerance is generally +/- 1 of the average with a rotor installed or +/- 0 with just a stator.
5. Current/Frequency Response (I/F): is a ratio of capacitive current before and after the frequency is doubled. This is presented as a 'reduction in current' or a negative percentage which should be below -50% in an insulation system. In an induction motor this value will often reside between -49% to -38% and will be balanced between phases or relatively balanced with a rotor in-place. This measured as a percentage. The tolerance is generally +/- 1 of the average with a rotor installed or +/- 0 with just a stator.
6. Capacitance (mF, uF, pF): is the capacitance of the circuit to ground. This is a value that is trend-able but is effected by temperature, humidity and other environmental conditions. This is usually only used as a measurement for comparison with other test results.
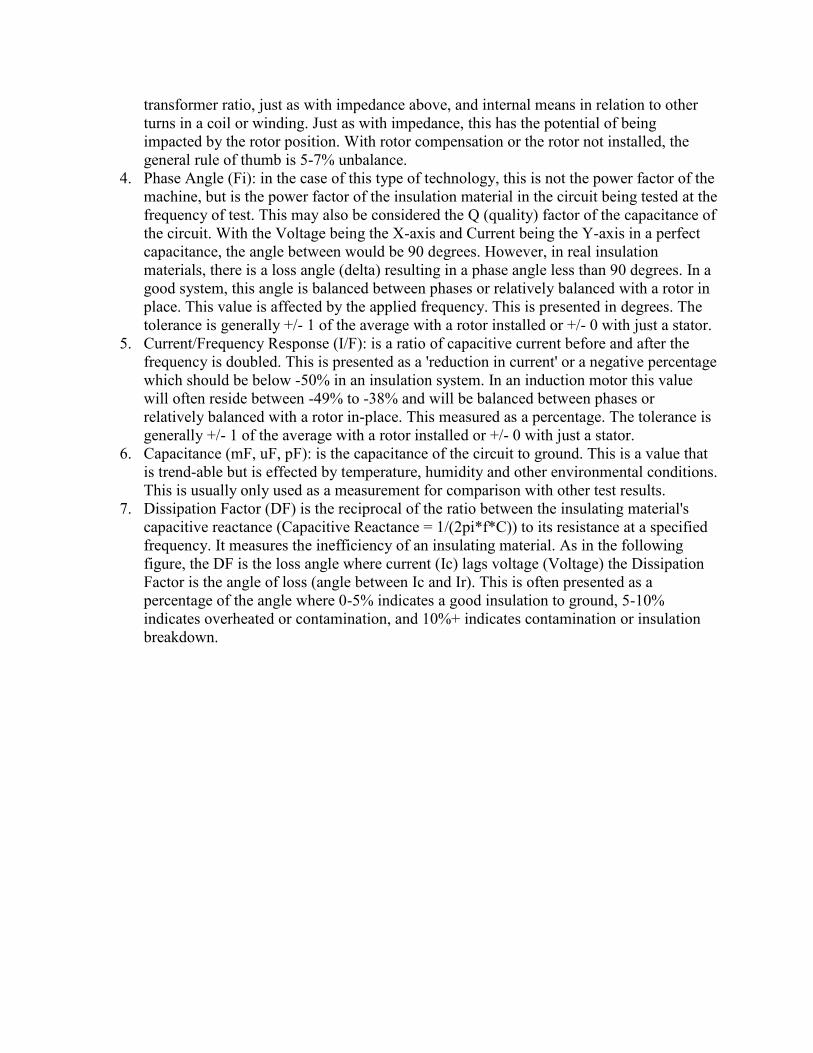
7. Dissipation Factor (DF) is the reciprocal of the ratio between the insulating material's capacitive reactance (Capacitive Reactance = 1/(2pi*f*C)) to its resistance at a specified frequency. It measures the inefficiency of an insulating material. As in the following figure, the DF is the loss angle where current (Ic) lags voltage (Voltage) the Dissipation Factor is the angle of loss (angle between Ic and Ir). This is often presented as a percentage of the angle where 0-5% indicates a good insulation to ground, 5-10% indicates overheated or contamination, and 10%+ indicates contamination or insulation breakdown.
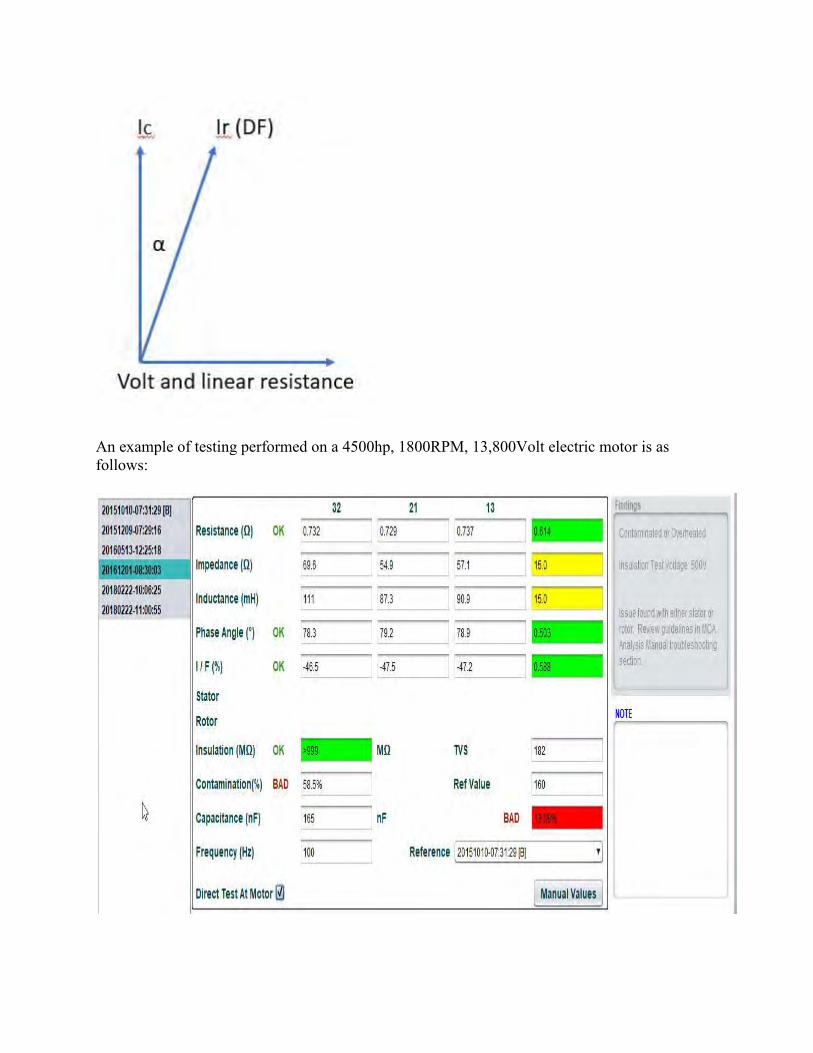
An example of testing performed on a 4500hp, 1800RPM, 13,800Volt electric motor is as follows:
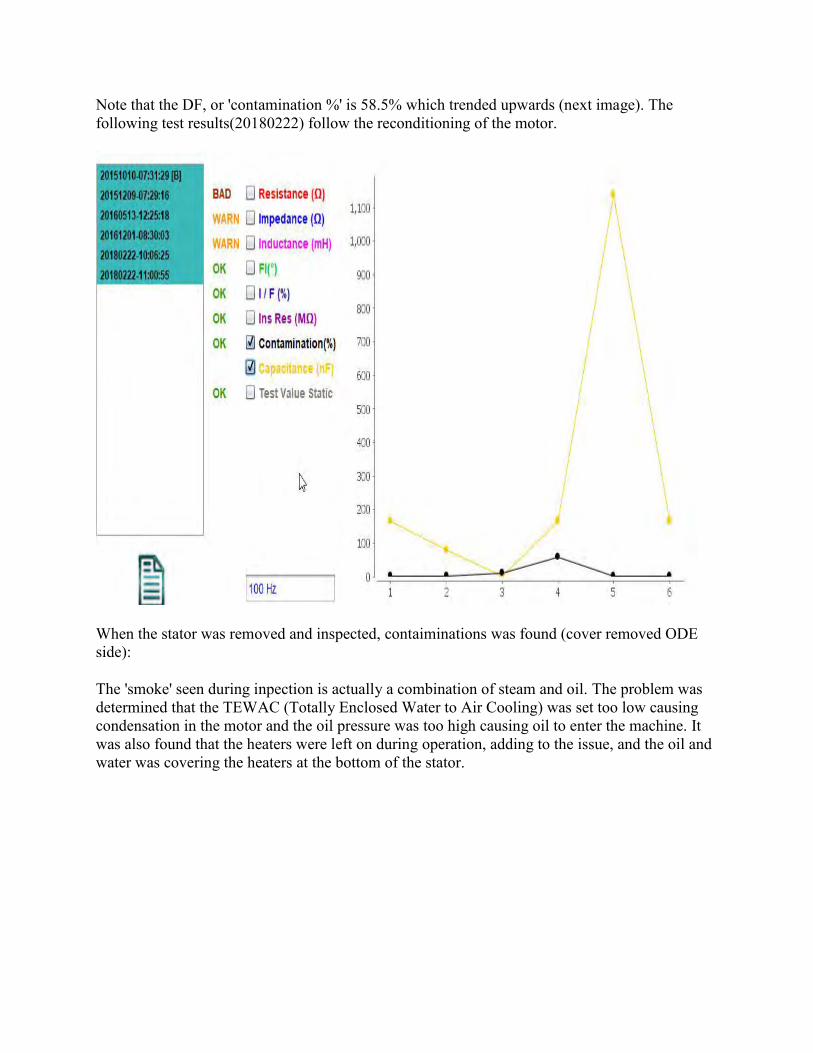
Note that the DF, or 'contamination %' is 58.5% which trended upwards (next image). The following test results(20180222) follow the reconditioning of the motor.
When the stator was removed and inspected, contaiminations was found (cover removed ODE side):
The 'smoke' seen during inpection is actually a combination of steam and oil. The problem was determined that the TEWAC (Totally Enclosed Water to Air Cooling) was set too low causing condensation in the motor and the oil pressure was too high causing oil to enter the machine. It was also found that the heaters were left on during operation, adding to the issue, and the oil and water was covering the heaters at the bottom of the stator.
The True Power of Electrical And Motor Current Signature Analysis Right now you probably have transducers all over your electric motors to either perform vibration analysis remotely, or you send someone out to each motor and all of the components to check each part with a variety of technologies. Each one senses the electric motor and the components outside of the machine and powertrain with the potential of being dampened by surrounding noise or the materials of the machine, itself. If you really want to have fun, try taking bearing data on a hermetic chiller. In order to ensure accuracy you also have to make sure that you are performing data in exactly the same way and at similar loads, or have a profile at different loads.
What if you could walk to one location, test the motor and not only get a look at the rotor, stator, bearings and other motor components, but also detect the rest of the system including incoming power, coupling, driven equipment, belts, gears, impellors, fans, driven bearings, etc. regardless of the load? Even the speed if you are operating on variable frequency drive or perform the same on a DC motor system and DC drive? Why not evaluate the AC or DC drive while you are at it? What if all of this is done with a single technology that can perform much of the analysis for you?
Welcome to Electrical Signature Analysis (ESA), sometimes referred to as Motor Current Signature Analysis (MCSA), where the transducer is the electric motor or generator itself. You now are looking at the condition of all of the components and their impact from the inside out and, with a combination of voltage signature and current signature, you can easily separate whether conditions are coming from the machine you are testing or from somewhere else. Even more interesting is the fact that variations in the load have only a very small impact on the amplitude of the signature as it is related to the peak voltage or current.
I use a lot of different technologies including vibration, offline motor circuit analysis, offline high voltage testing (surge and PD surge), and motion amplification, to name a few. However, I will often use them to support findings in ESA - and we have a lot of success. What I've always found interesting, though, is that most will spend a signficant amount of time chasing problems with component-based testing instead of using a broad system-based test (ESA) then use the component testing technologies to support the findings.
The original founder of ESA, Howard Haynes, and his team from Oak Ridge National Labs, envisioned the far more effective ability to take all of the data from Motor Control Centers (MCCs) instead of a multitude of points on equipment in a variety of locations. This would include putting yourself at risk getting close to rotating components. Trust me, I perform many of these site data collections where you are having to contort around things in order to land a vibration transducer on a machine in order to get reasonable data. To make things safer, permanently installed vibration transducers can go in place - but how accurate are they? Will they pick up electrical conditions? Or, am I primarily looking for bearing issues and problems that suddenly occur?
In our case, the signficant indicator of the difference between the technologies was the application on wind turbines in the field. In about 90 seconds of voltage and current data collection, we end

up with a complete view of the controls, generator, coupling, gears, planetary gears, generator and gearbox bearings, the main shaft bearings and even the blade pass frequency as each blade passes the tower. So long as the turbine is running instead of personnel having to climb towers that do not have vibration transducers in place, then having to take data at specific loads we simply hook into the voltage and current at the base of the tower (or on the generator side of any controls or transformers). Personally, I am at an age where climbing a tower might seem cool, but is a little daunting.
There are some limitations on ESA. You can review some of my past articles, which are pretty basic for what we are doing with the technology, to cover some of those. This article kicks off the next series which will look at some of the more complex systems that are evaluated and some new ways that are coming into the industry.
Current Signature of DC Motors A few people have tried to explain to me that DC motors are obsolete and others have attempted to explain how there are no DC motors left. It is actually far from the truth. In 2002, the US Department of Energy's 'US Industrial Electric Motor Systems Market Opportunities Assessment' identified that 9.7% of industrial electric motor energy consumption was from DC motors with one of the heaviest use in the primary metals industry (steel and aluminum) at 31.6% of motor energy. In commercial applications you will find DC machines in high rise elevators with slow replacement of these machines with AC geared electric motors. The DC applications tend to be 'gearless' such as in the picture above with the elevator cables being directly attached to a drum on the armature shaft. You will also find a large number of DC traction motors in railroad applications, and, of course, there are many other applications anywhere on the globe.
Many of the DC elevator machines that I have found in service are older Westinghouse motors, most likely wound by my grandfather and great grandfather who were winders for Westinghouse starting in the early to mid-1900s. A great number of the elevator motors I have found date back over 50 years but may have another 50+ years of useful application (even including rewind repairs) with some of the challenges including getting the motors down from higher floors in the first place. Yes, many of these older beasts can last 75-100 years in application, and have, where their AC counterparts may only have 20-30 years of useful life.
One of the challenges with the perception that DC motors have disappeared is the lack of understanding surrounding testing, materials and troubleshooting. We will usually evaluate DC machines with an ALL-TEST PRO 5 motor circuit analyzer, an ALL-TEST PRO OL or EMPATH electrical signature analyzer, GTI Predictive vibration analysis, visual inspections and infrared, as well as a few other techniques for remaining life projection. Alternative methods of DC field testing include voltage drop tests and bar to bar testing of armatures, both of which can be traumatic for the machine. In this article, we will just give a couple of examples of the results surrounding DC motor current signature analysis.
One of the strengths of electrical and current signature analysis is the evaluation of the DC drive and the armature and effects from defective fields and interpoles. One of the considerations for evaluating the motor using current signature is understanding that there is a DC ripple that sits on top of the DC voltage and current that will be the number of SCR (converter) and line frequency. For a full-wave rectified circuit, this will be sets of 6 SCRs and 60 Hz in the USA which will result in (6x60Hz =) a 360Hz peak. If a 60Hz (line frequency) peak shows up, as well as any multiples of 60 Hz, it will often indicate that AC power is leaking through, with the result of a bad SCR, card or armature (due to unbalanced circuit impedance). The AC ripple will usually be around 10% of the total current.
Note 1: I will sometimes use an AC clamp to evaluate DC machines as I will be performing FFT analysis of the ripple and not the total DC current. In the two case studies in this article, I used a 1-1000Amp CT on the armature circuit. In other cases I may use a Hall Effect CT, depending on my purpose for analysis.
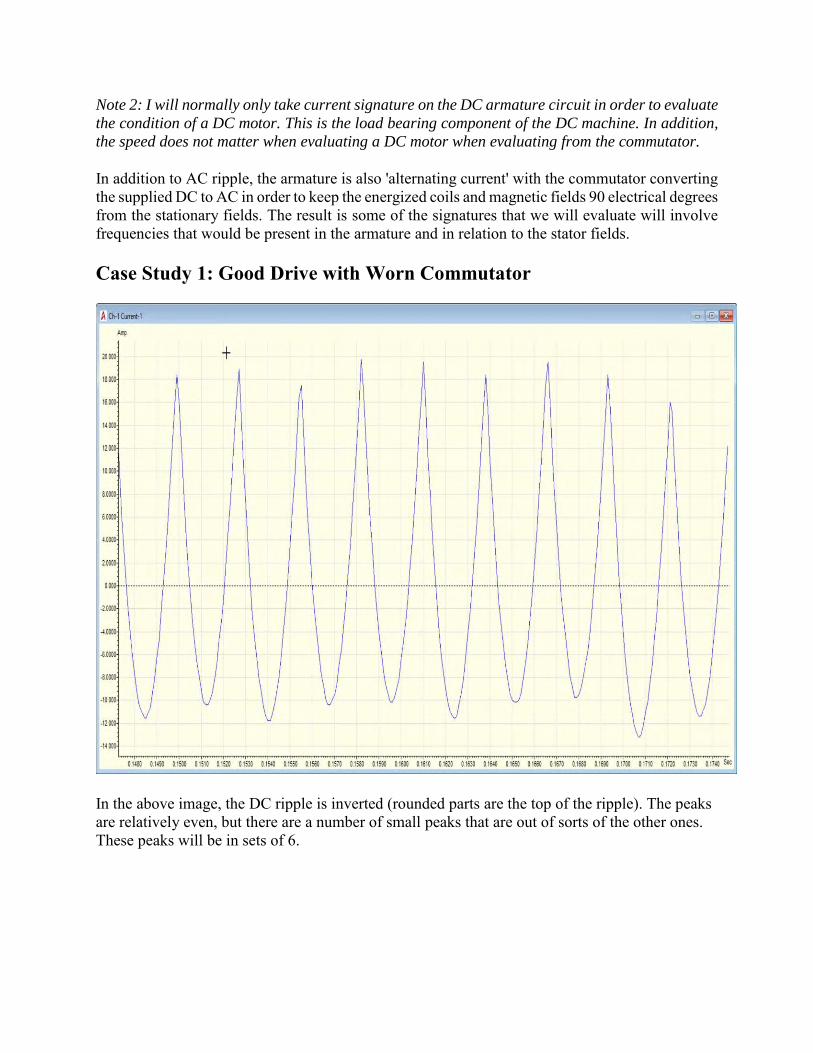
Note 2: I will normally only take current signature on the DC armature circuit in order to evaluate
the condition of a DC motor. This is the load bearing component of the DC machine. In addition,
the speed does not matter when evaluating a DC motor when evaluating from the commutator.
In addition to AC ripple, the armature is also 'alternating current' with the commutator converting the supplied DC to AC in order to keep the energized coils and magnetic fields 90 electrical degrees from the stationary fields. The result is some of the signatures that we will evaluate will involve frequencies that would be present in the armature and in relation to the stator fields.
Case Study 1: Good Drive with Worn Commutator
In the above image, the DC ripple is inverted (rounded parts are the top of the ripple). The peaks are relatively even, but there are a number of small peaks that are out of sorts of the other ones. These peaks will be in sets of 6.
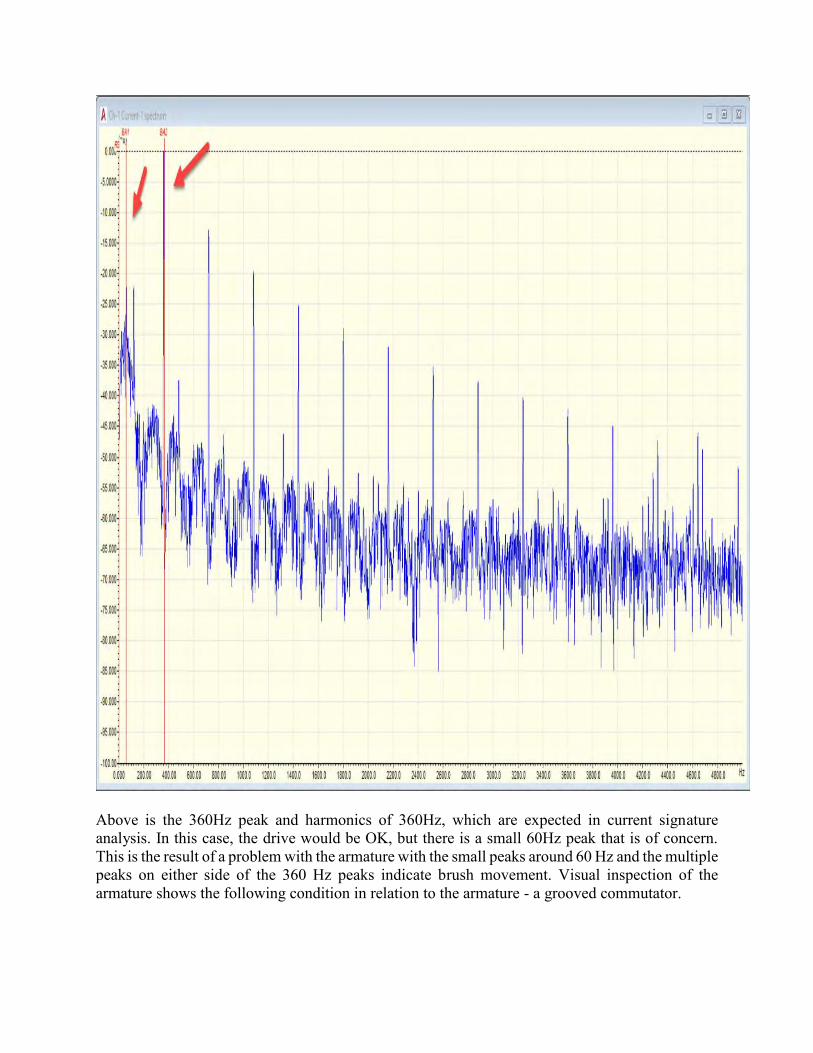
Above is the 360Hz peak and harmonics of 360Hz, which are expected in current signature analysis. In this case, the drive would be OK, but there is a small 60Hz peak that is of concern. This is the result of a problem with the armature with the small peaks around 60 Hz and the multiple peaks on either side of the 360 Hz peaks indicate brush movement. Visual inspection of the armature shows the following condition in relation to the armature - a grooved commutator.
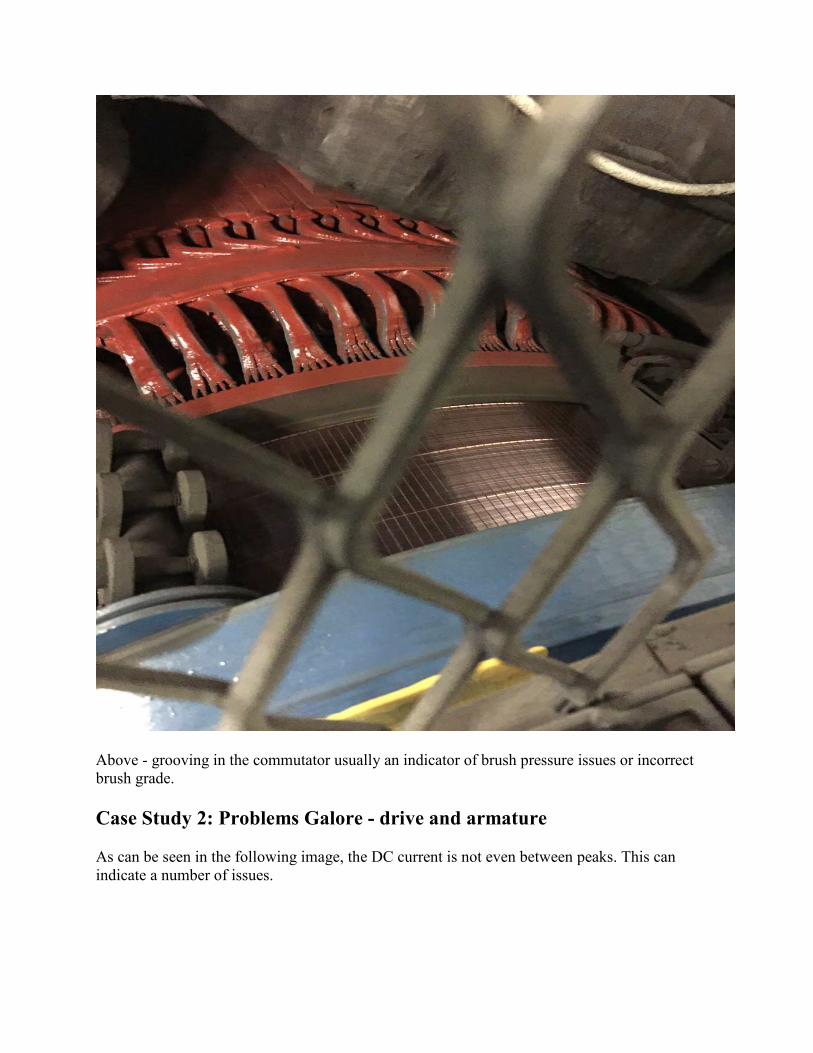
Above - grooving in the commutator usually an indicator of brush pressure issues or incorrect brush grade.
Case Study 2: Problems Galore - drive and armature
As can be seen in the following image, the DC current is not even between peaks. This can indicate a number of issues.
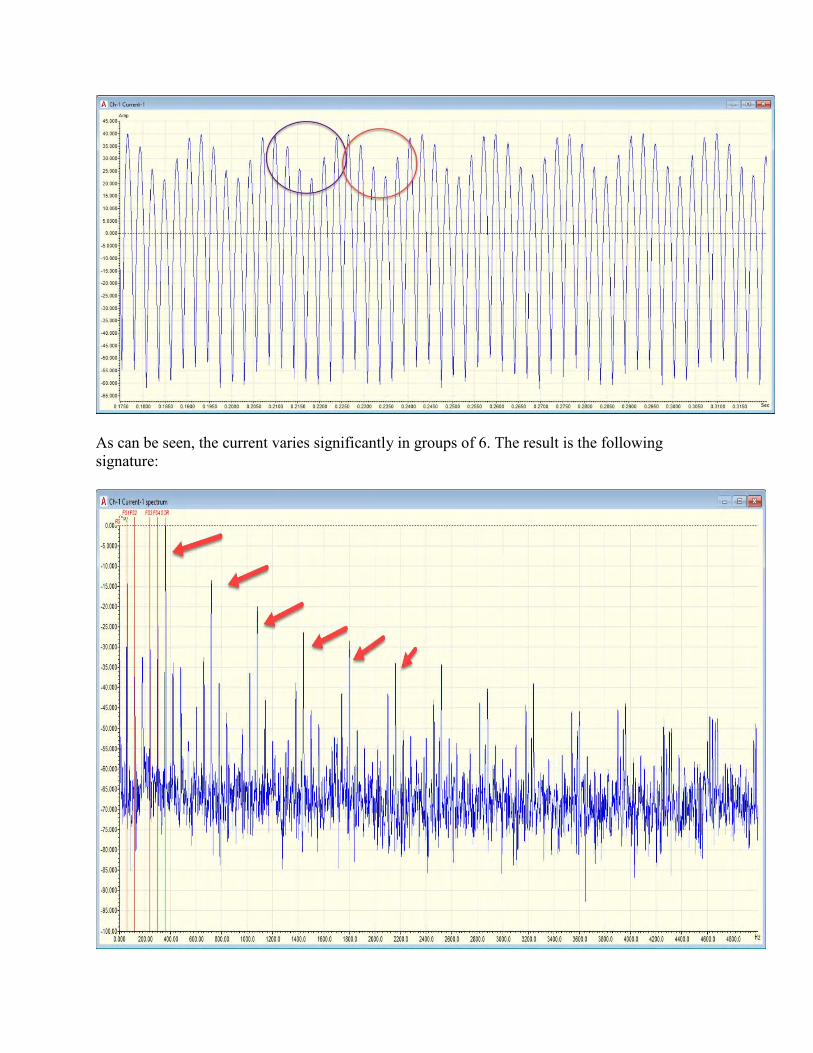
As can be seen, the current varies significantly in groups of 6. The result is the following signature:

As can be seen, in addition to a high 60Hz peak indicating an issue with the armature as well as an SCR issue due to multiple sub 360 Hz peaks and 60Hz sidebands around the 360 Hz harmonics. This is one of the more severe issues that we've run into. The visual of the commutator and armature was as follows:
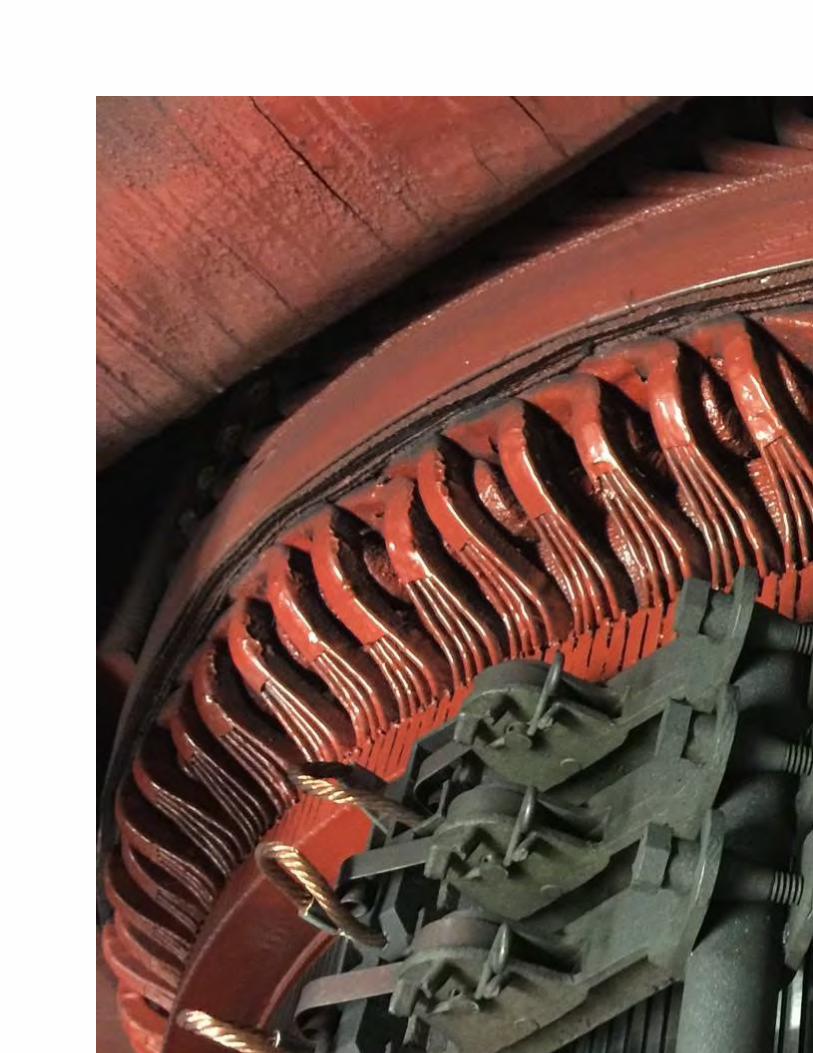

As can be seen, the commutator bars are burned. This would go along with problems from the drive - upon further investigation we found that the drive was undersized. Another problem when this type of condition occurs can be loosening of the commutator bars. An inspection when running showed the following results with the clicking sound being the brushes bouncing. The burn patterns on the commutator also indicate other conditions.
There are a great many additional capabilities when testing DC machines in operation with current signature analysis. These are just a few easily confirmed findings.
Conclusion
The evaluation of DC motors with current signature analysis is performed normally from the armature circuit and is not dependant upon load or speed. In this article, we focused on the armature, commutator and drive. However, bearing and other mechanical conditions can be evaluated easily. Additional articles will be available on DC applications and details on current and electrical signature analysis of machines can be found in 'Electrical Motor Diagnostics 2nd Edition found on http://motordoc.com.
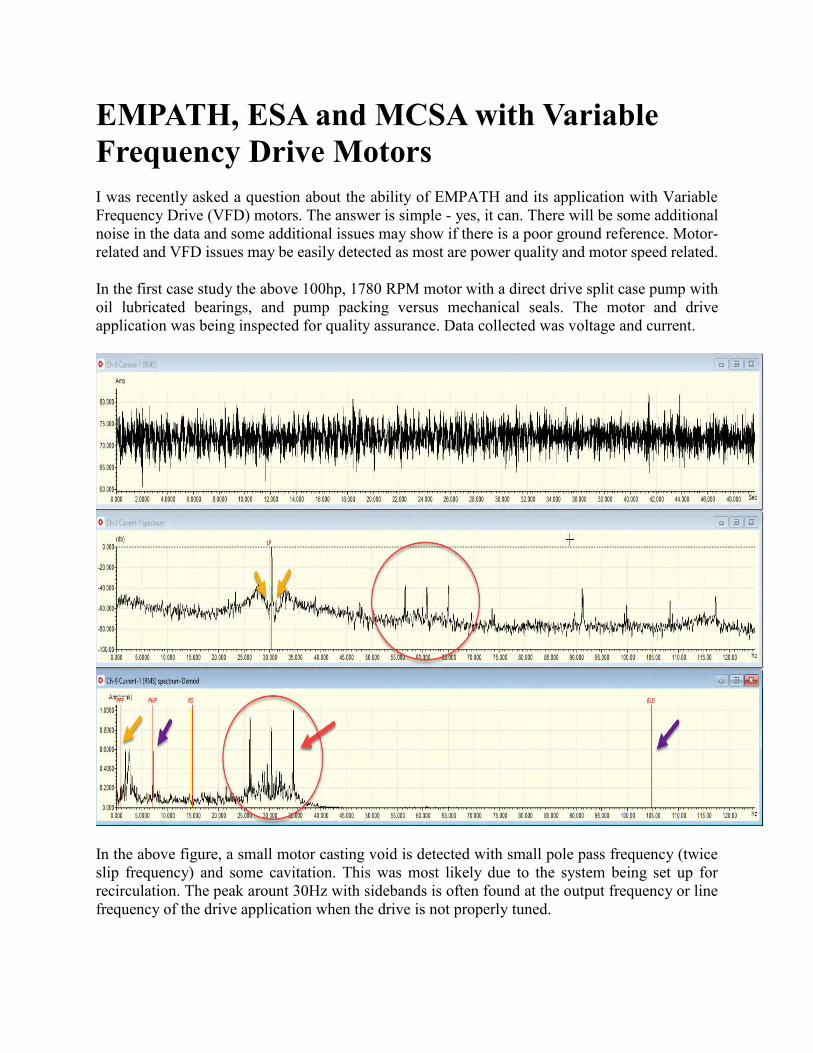
EMPATH, ESA and MCSA with Variable Frequency Drive Motors I was recently asked a question about the ability of EMPATH and its application with Variable Frequency Drive (VFD) motors. The answer is simple - yes, it can. There will be some additional noise in the data and some additional issues may show if there is a poor ground reference. Motor-related and VFD issues may be easily detected as most are power quality and motor speed related.
In the first case study the above 100hp, 1780 RPM motor with a direct drive split case pump with oil lubricated bearings, and pump packing versus mechanical seals. The motor and drive application was being inspected for quality assurance. Data collected was voltage and current.
In the above figure, a small motor casting void is detected with small pole pass frequency (twice slip frequency) and some cavitation. This was most likely due to the system being set up for recirculation. The peak arount 30Hz with sidebands is often found at the output frequency or line frequency of the drive application when the drive is not properly tuned.
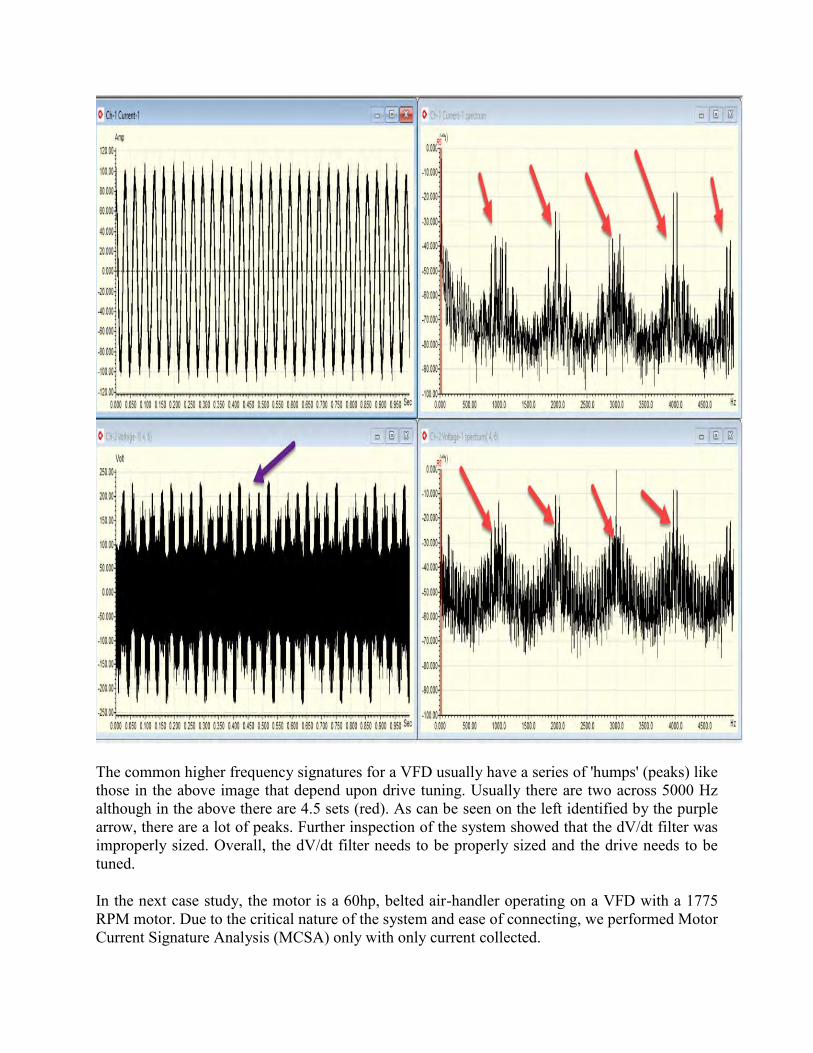
The common higher frequency signatures for a VFD usually have a series of 'humps' (peaks) like those in the above image that depend upon drive tuning. Usually there are two across 5000 Hz although in the above there are 4.5 sets (red). As can be seen on the left identified by the purple arrow, there are a lot of peaks. Further inspection of the system showed that the dV/dt filter was improperly sized. Overall, the dV/dt filter needs to be properly sized and the drive needs to be tuned.
In the next case study, the motor is a 60hp, belted air-handler operating on a VFD with a 1775 RPM motor. Due to the critical nature of the system and ease of connecting, we performed Motor Current Signature Analysis (MCSA) only with only current collected.
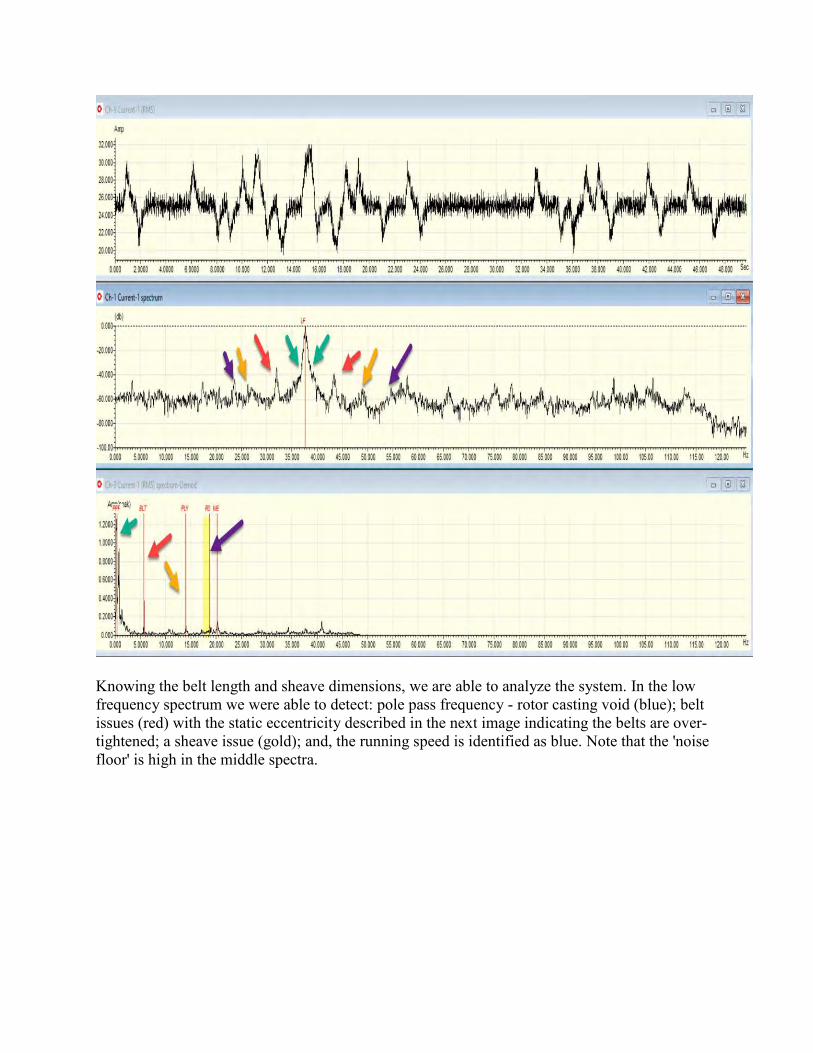
Knowing the belt length and sheave dimensions, we are able to analyze the system. In the low frequency spectrum we were able to detect: pole pass frequency - rotor casting void (blue); belt issues (red) with the static eccentricity described in the next image indicating the belts are over-tightened; a sheave issue (gold); and, the running speed is identified as blue. Note that the 'noise floor' is high in the middle spectra.
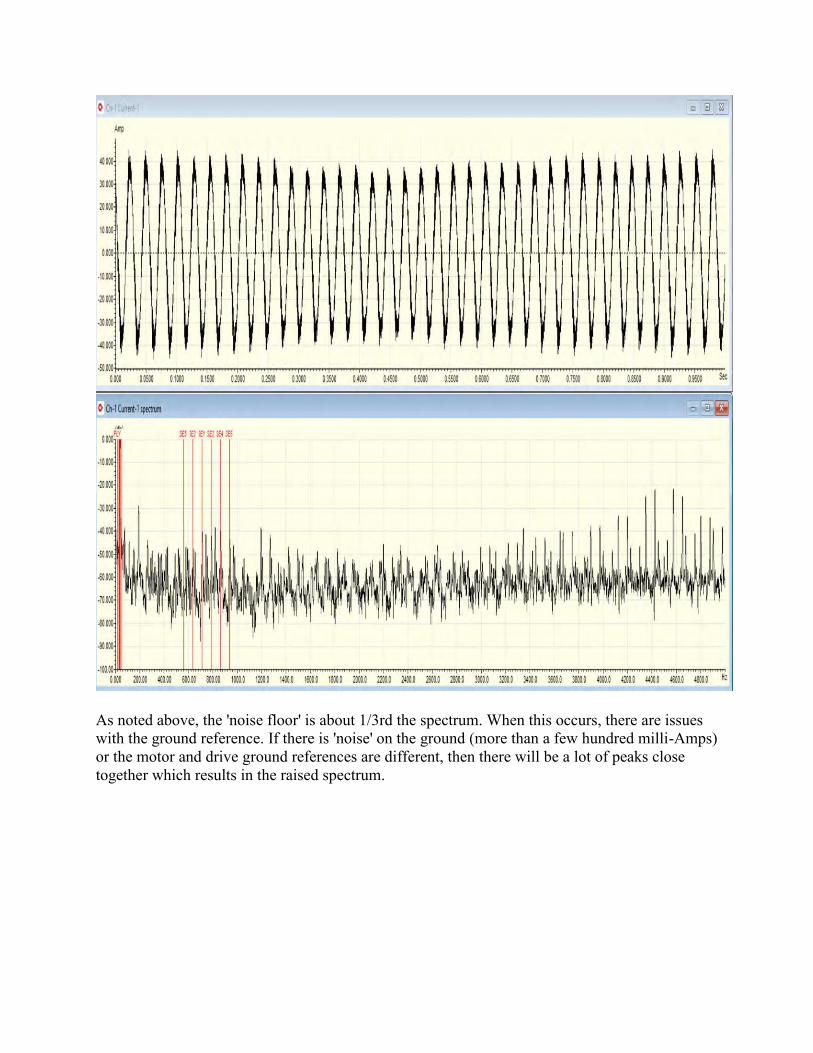
As noted above, the 'noise floor' is about 1/3rd the spectrum. When this occurs, there are issues with the ground reference. If there is 'noise' on the ground (more than a few hundred milli-Amps) or the motor and drive ground references are different, then there will be a lot of peaks close together which results in the raised spectrum.
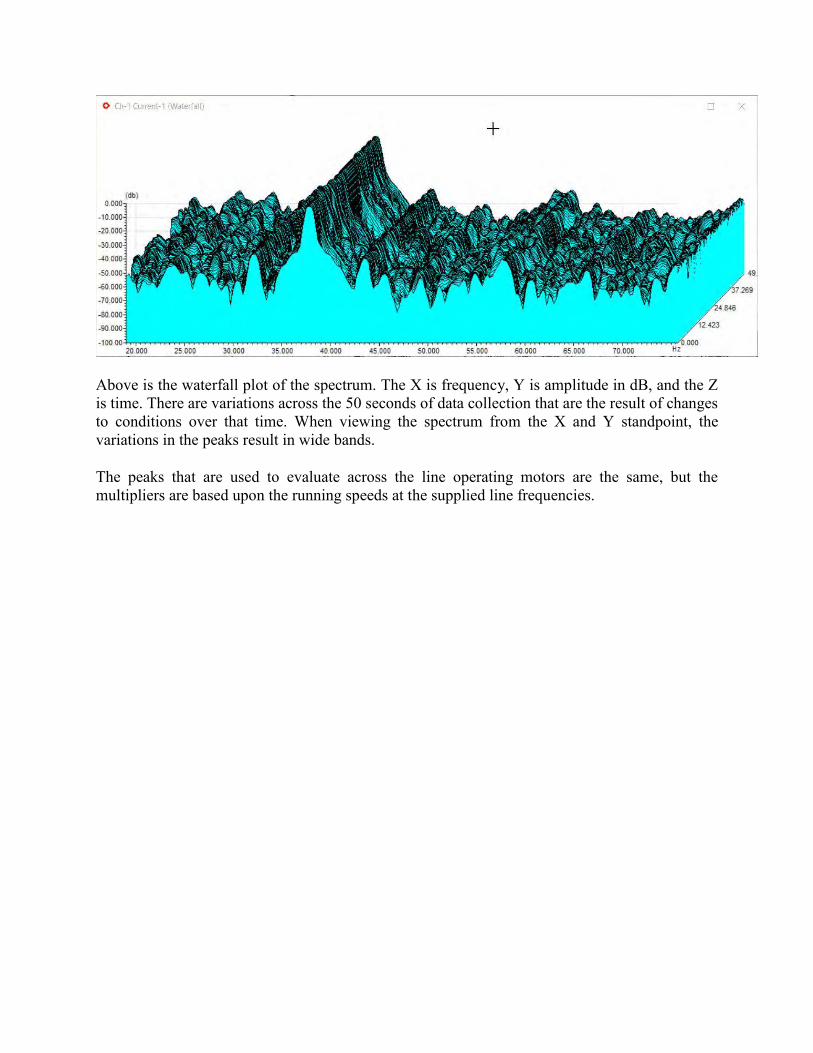
Above is the waterfall plot of the spectrum. The X is frequency, Y is amplitude in dB, and the Z is time. There are variations across the 50 seconds of data collection that are the result of changes to conditions over that time. When viewing the spectrum from the X and Y standpoint, the variations in the peaks result in wide bands.
The peaks that are used to evaluate across the line operating motors are the same, but the multipliers are based upon the running speeds at the supplied line frequencies.
Electrical and Current Signature Analysis: replacement for other predictive maintenance technologies The primary benefit of Electrical Signature Analysis (ESA) and Motor Current Signature Analysis (MCSA) is that the data can be gathered from one location for an entire system. In effect, it is a system analyzer versus just testing a specific component or part of a system. It will detect both mechanical and electrical conditions and will provide immediate feedback on the impact of changes to the system or process.
With all of this capability, what is keeping such a straight-forward system-based analysis technology from dominating the market over other technologies? There seem to be a number of small issues including: a lag behind technologies such as vibration; it requires access to electrical panels; and, most electricians and electrical engineers are not as readily exposed to spectra analysis. There may be other issues, but we usually find these are the most common types of response.
Is there a technological issue that is holding ESA back from general implementation? Not really, there are a few idiosyncrasies that require a little more experience to review, but overall, its not too terribly different than what you would see while analyzing vibration data. One of these include the 1X RPM signature: is it a bent shaft, unbalance, or misalignment? The other condition is the amplitude of the associated failure peaks: exactly what value indicates a fault? Finally, one of the barriers to a vibration technologist’s review of data is that problems count down from a peak voltage or current versus from a base up to a peak. In effect, the data is the inverse of what a vibration analyst would look for.
However, there are specific benefits available with ESA above most other technologies. Because the peaks that are being evaluated count down from the peak voltage or current, the load on the machine does not matter. The relationship between the peak voltage or current and the peaks of interest will remain similar as the values change. This is one of the reasons why the values analyzed in ESA are in dB (decibels), or force, in relationship with the primary source. Even if I change speeds or operating frequency, the only changes would be the frequency relationship, but the amplitude relationship would not change significantly.
In the case of periodic or continuous testing, the amplitude will change as conditions change. For instance, gear wear in driven equipment that is failing or stressed will have a gradual increase in amplitude as the condition worsens. This means that the condition can be trended and action can be planned.
The most significant benefit is that the equipment owner does not have to select those components of a system that need attention. For instance, how many vibration transducers are required in order to identify all of the faults in a motor, gearbox, and chiller compressor system? With ESA one set of sensors is all that is required, then understanding the same items you would need to understand

for the other technologies: bearings, gears, rotor bars, stator slots, blades, etc. is all that is necessary.
The real difference between the technologies are:
1. ESA is a system analysis versus point test technology;
2. Point test technologies are able to confirm findings by ESA selected based upon the type of findings;
3. ESA is the only technology that can detect both electrical and mechanical issues with a high degree of accuracy.
In the end, ESA provides a huge opportunity to evaluate a complete electrical machine (motor and generator) system from incoming power to driven equipment with a single set of sensors. It is a powerful tool that can work solo or in tandem with point systems such as vibration, ultrasound and infrared.
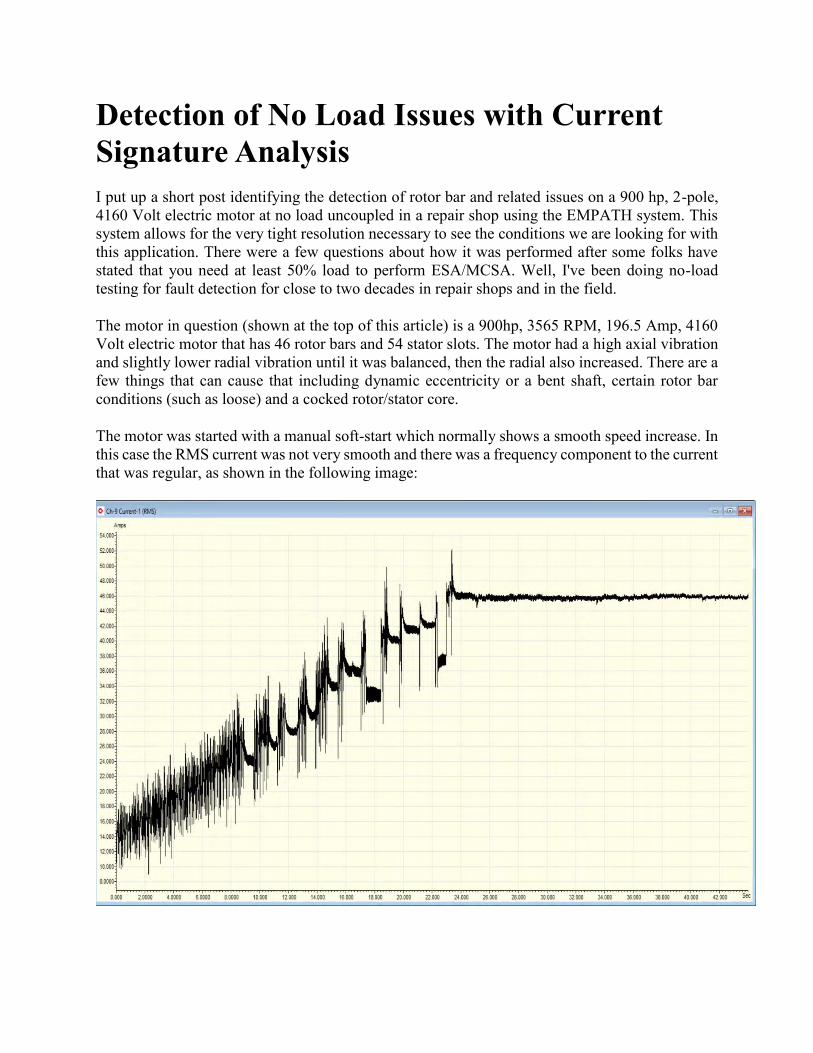
Detection of No Load Issues with Current Signature Analysis I put up a short post identifying the detection of rotor bar and related issues on a 900 hp, 2-pole, 4160 Volt electric motor at no load uncoupled in a repair shop using the EMPATH system. This system allows for the very tight resolution necessary to see the conditions we are looking for with this application. There were a few questions about how it was performed after some folks have stated that you need at least 50% load to perform ESA/MCSA. Well, I've been doing no-load testing for fault detection for close to two decades in repair shops and in the field.
The motor in question (shown at the top of this article) is a 900hp, 3565 RPM, 196.5 Amp, 4160 Volt electric motor that has 46 rotor bars and 54 stator slots. The motor had a high axial vibration and slightly lower radial vibration until it was balanced, then the radial also increased. There are a few things that can cause that including dynamic eccentricity or a bent shaft, certain rotor bar conditions (such as loose) and a cocked rotor/stator core.
The motor was started with a manual soft-start which normally shows a smooth speed increase. In this case the RMS current was not very smooth and there was a frequency component to the current that was regular, as shown in the following image:
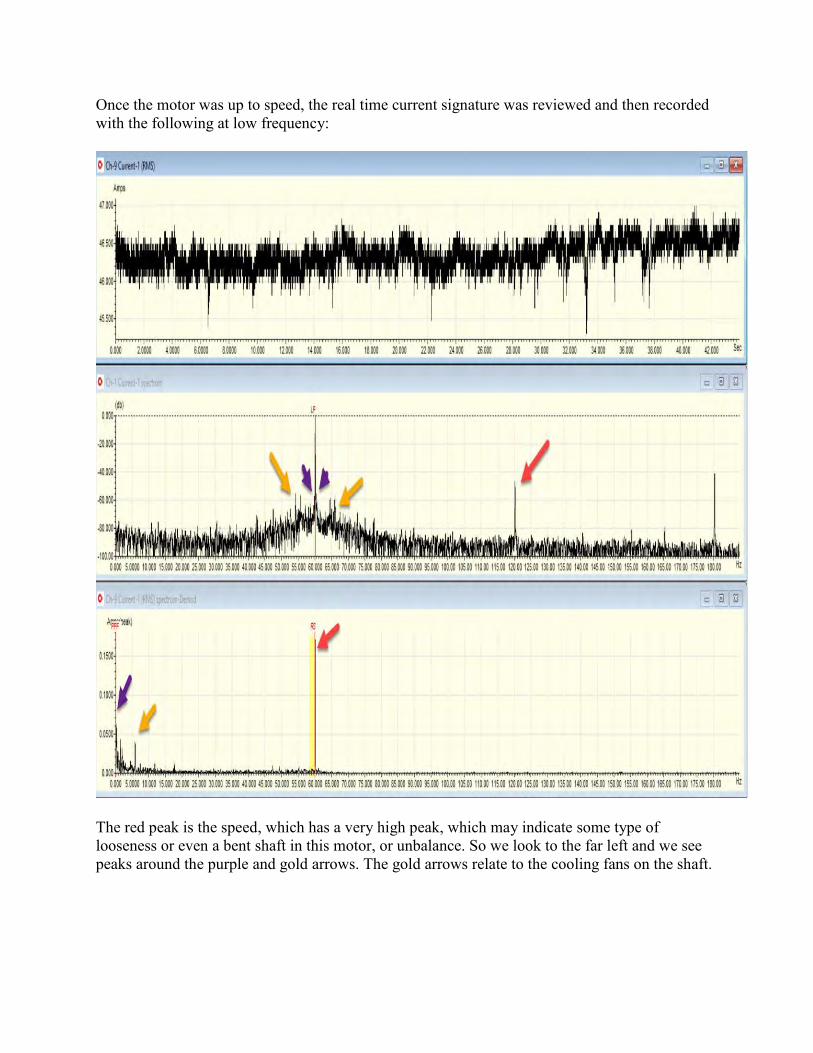
Once the motor was up to speed, the real time current signature was reviewed and then recorded with the following at low frequency:
The red peak is the speed, which has a very high peak, which may indicate some type of looseness or even a bent shaft in this motor, or unbalance. So we look to the far left and we see peaks around the purple and gold arrows. The gold arrows relate to the cooling fans on the shaft.
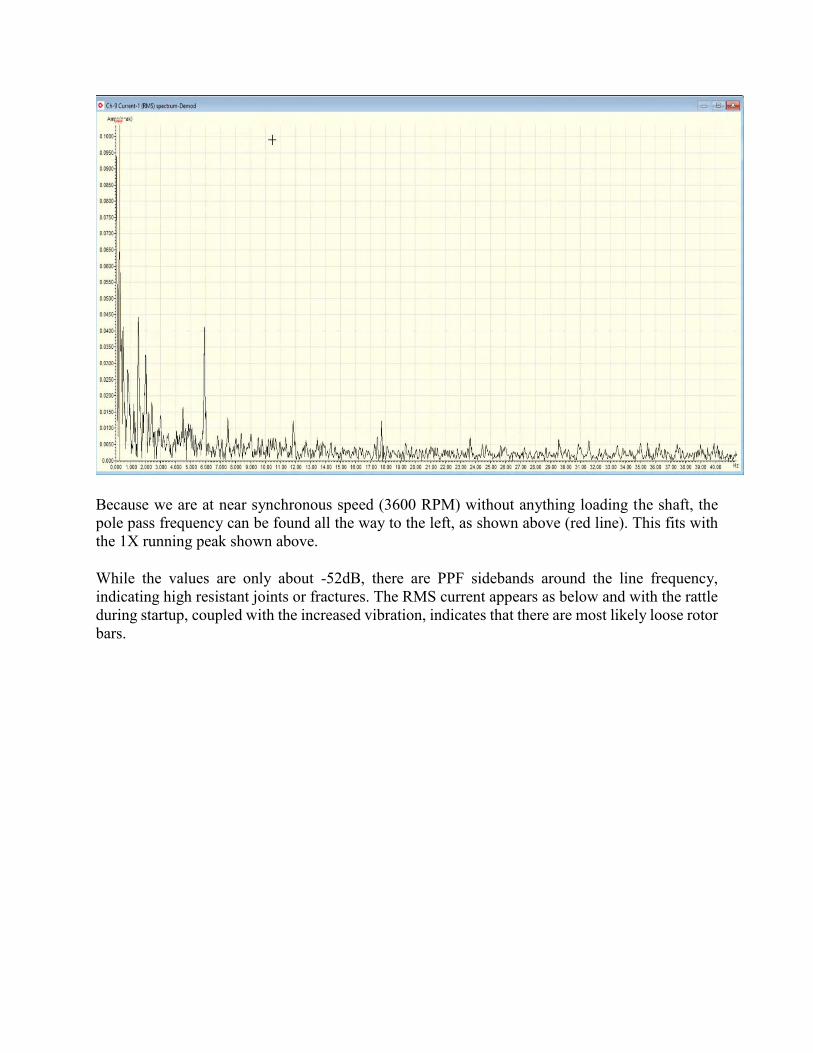
Because we are at near synchronous speed (3600 RPM) without anything loading the shaft, the pole pass frequency can be found all the way to the left, as shown above (red line). This fits with the 1X running peak shown above.
While the values are only about -52dB, there are PPF sidebands around the line frequency, indicating high resistant joints or fractures. The RMS current appears as below and with the rattle during startup, coupled with the increased vibration, indicates that there are most likely loose rotor bars.
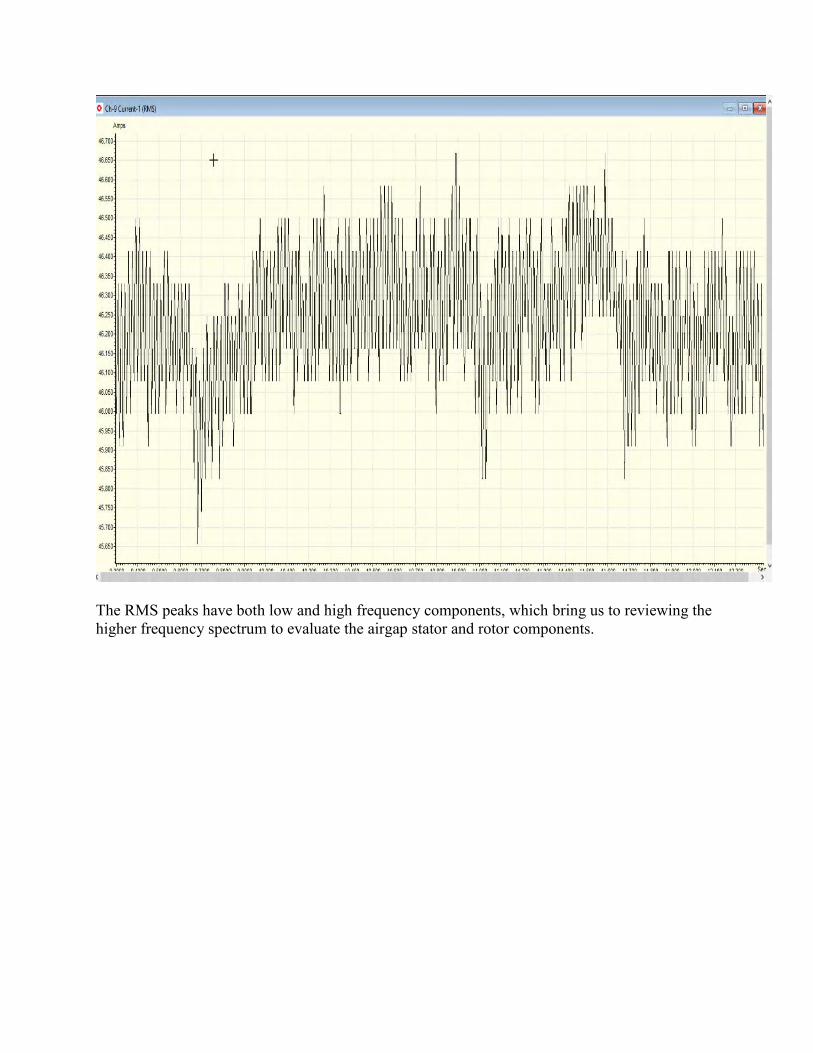
The RMS peaks have both low and high frequency components, which bring us to reviewing the higher frequency spectrum to evaluate the airgap stator and rotor components.
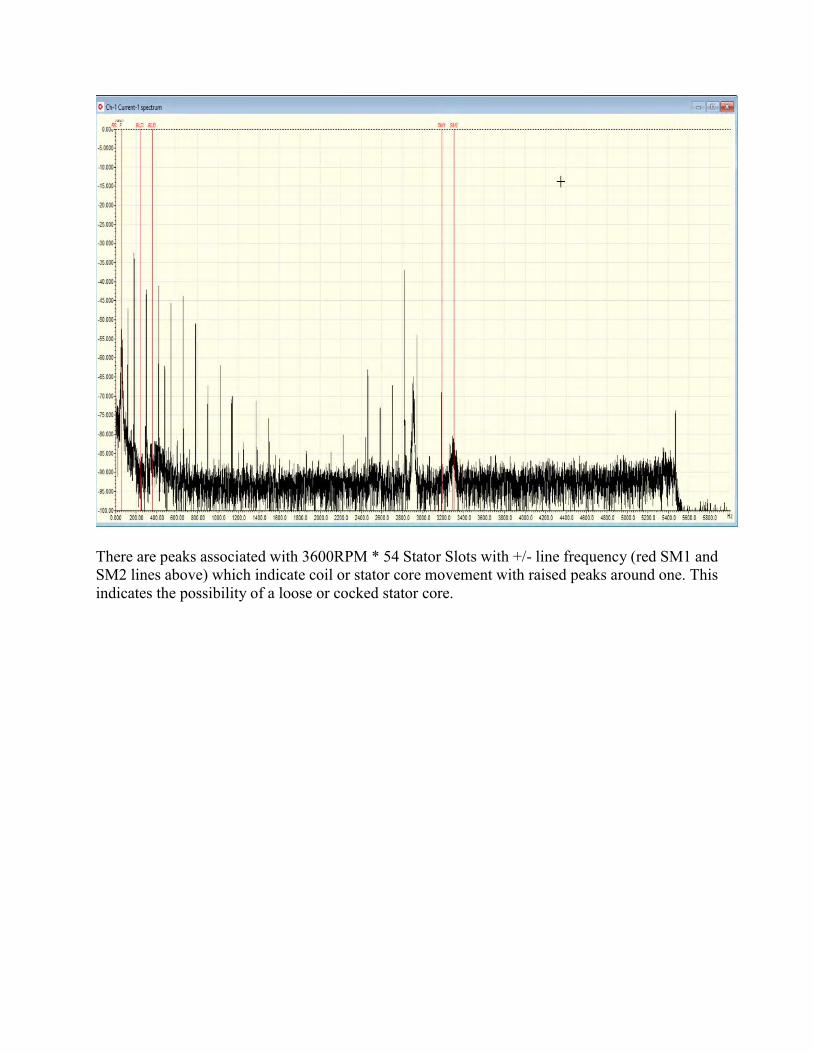
There are peaks associated with 3600RPM * 54 Stator Slots with +/- line frequency (red SM1 and SM2 lines above) which indicate coil or stator core movement with raised peaks around one. This indicates the possibility of a loose or cocked stator core.
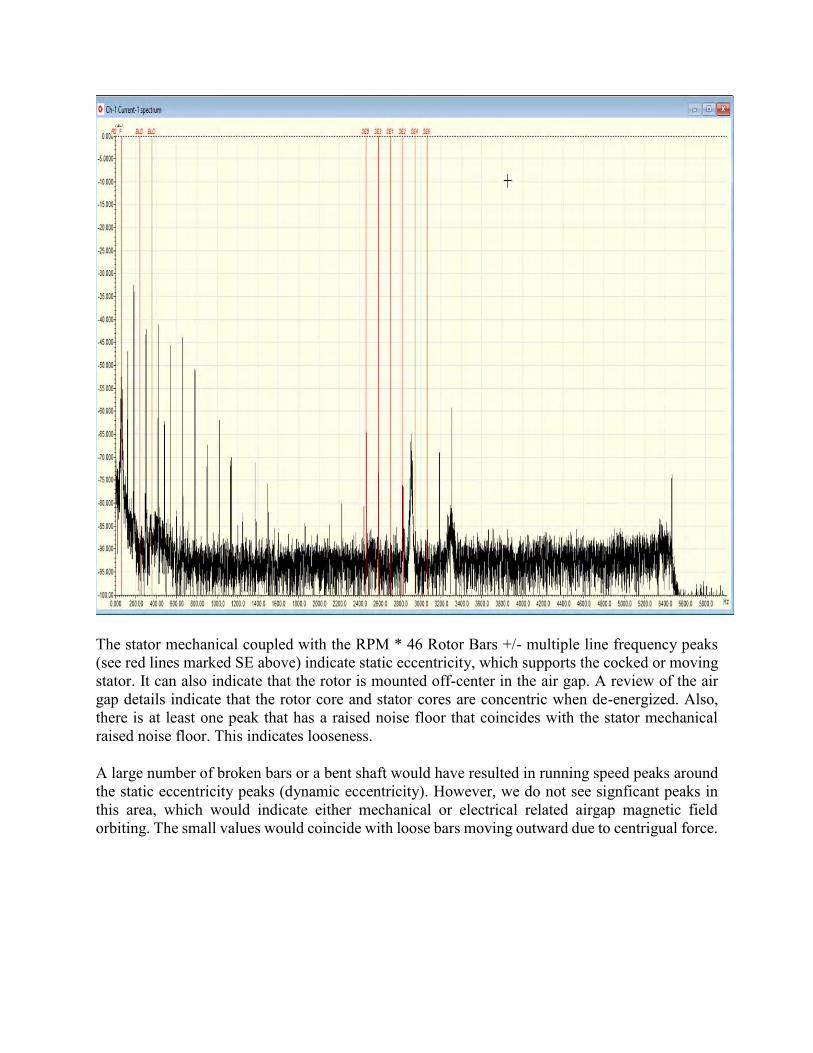
The stator mechanical coupled with the RPM * 46 Rotor Bars +/- multiple line frequency peaks (see red lines marked SE above) indicate static eccentricity, which supports the cocked or moving stator. It can also indicate that the rotor is mounted off-center in the air gap. A review of the air gap details indicate that the rotor core and stator cores are concentric when de-energized. Also, there is at least one peak that has a raised noise floor that coincides with the stator mechanical raised noise floor. This indicates looseness.
A large number of broken bars or a bent shaft would have resulted in running speed peaks around the static eccentricity peaks (dynamic eccentricity). However, we do not see signficant peaks in this area, which would indicate either mechanical or electrical related airgap magnetic field orbiting. The small values would coincide with loose bars moving outward due to centrigual force.
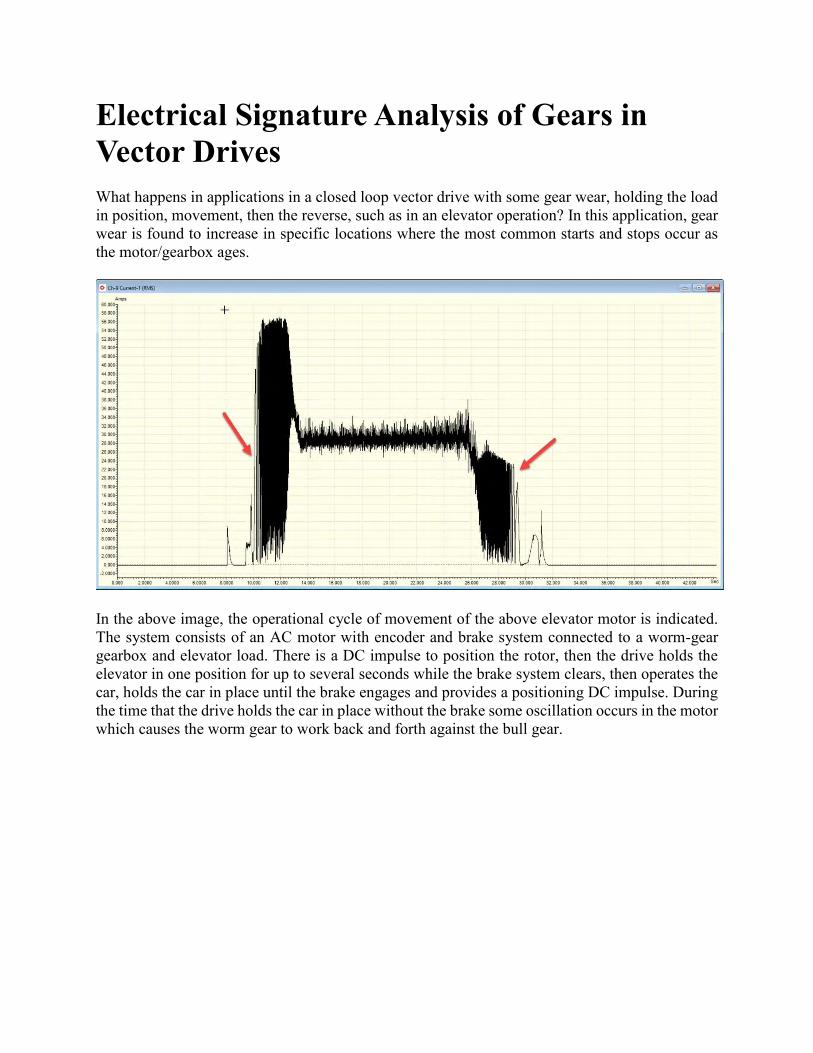
Electrical Signature Analysis of Gears in Vector Drives What happens in applications in a closed loop vector drive with some gear wear, holding the load in position, movement, then the reverse, such as in an elevator operation? In this application, gear wear is found to increase in specific locations where the most common starts and stops occur as the motor/gearbox ages.
In the above image, the operational cycle of movement of the above elevator motor is indicated. The system consists of an AC motor with encoder and brake system connected to a worm-gear gearbox and elevator load. There is a DC impulse to position the rotor, then the drive holds the elevator in one position for up to several seconds while the brake system clears, then operates the car, holds the car in place until the brake engages and provides a positioning DC impulse. During the time that the drive holds the car in place without the brake some oscillation occurs in the motor which causes the worm gear to work back and forth against the bull gear.
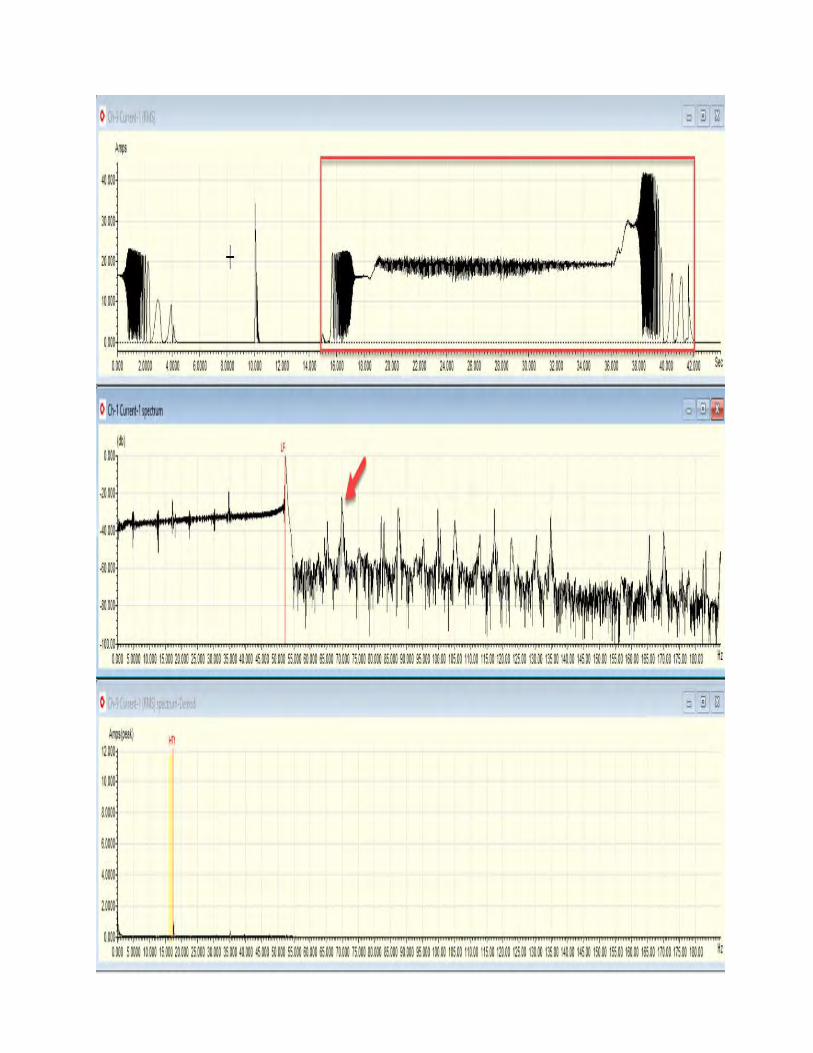
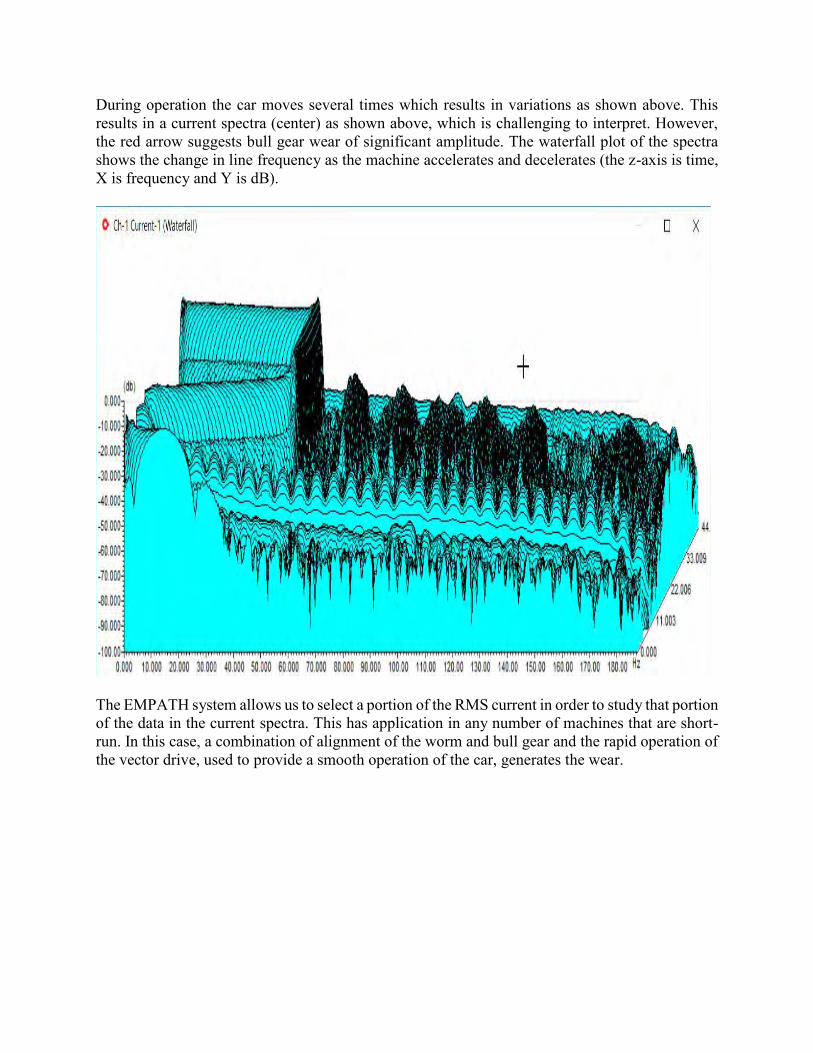
During operation the car moves several times which results in variations as shown above. This results in a current spectra (center) as shown above, which is challenging to interpret. However, the red arrow suggests bull gear wear of significant amplitude. The waterfall plot of the spectra shows the change in line frequency as the machine accelerates and decelerates (the z-axis is time, X is frequency and Y is dB).
The EMPATH system allows us to select a portion of the RMS current in order to study that portion of the data in the current spectra. This has application in any number of machines that are short-run. In this case, a combination of alignment of the worm and bull gear and the rapid operation of the vector drive, used to provide a smooth operation of the car, generates the wear.
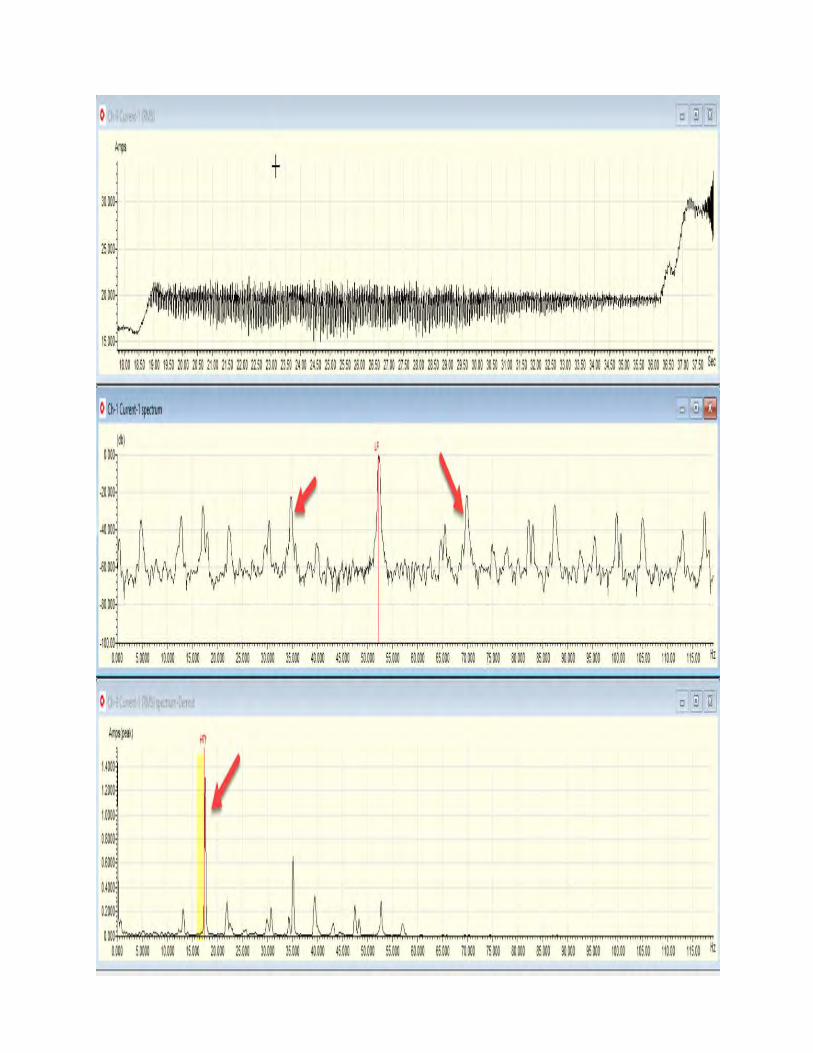
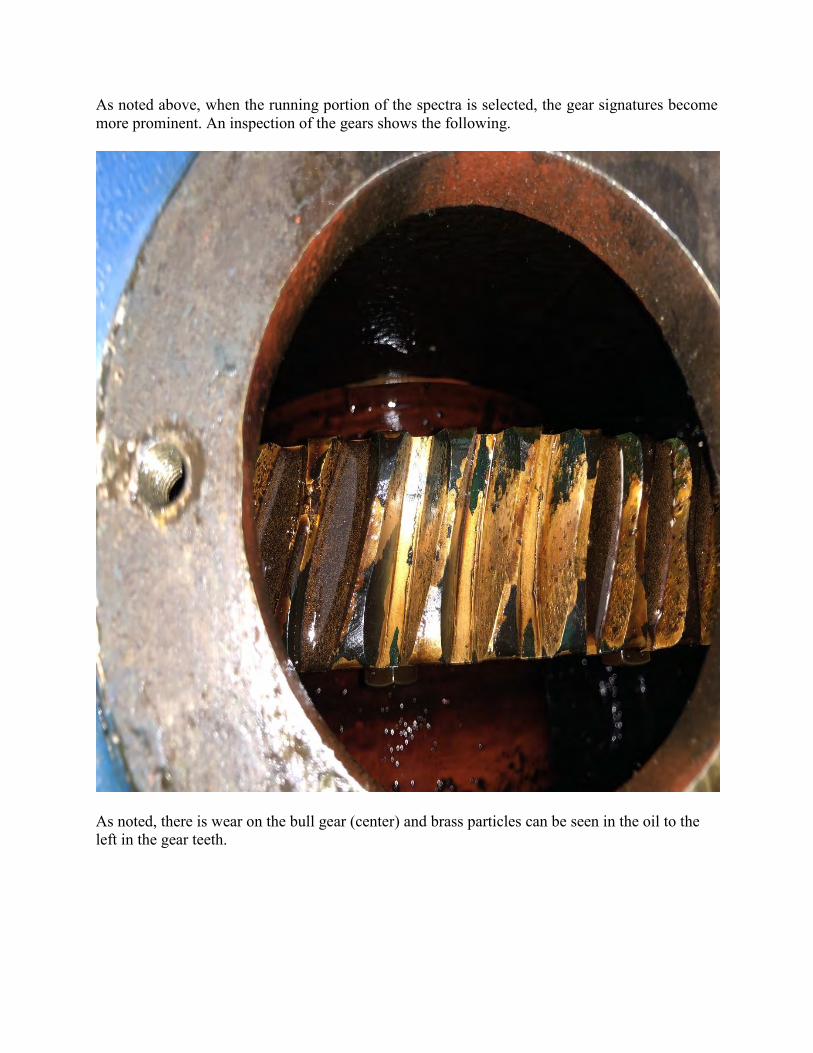
As noted above, when the running portion of the spectra is selected, the gear signatures become more prominent. An inspection of the gears shows the following.
As noted, there is wear on the bull gear (center) and brass particles can be seen in the oil to the left in the gear teeth.
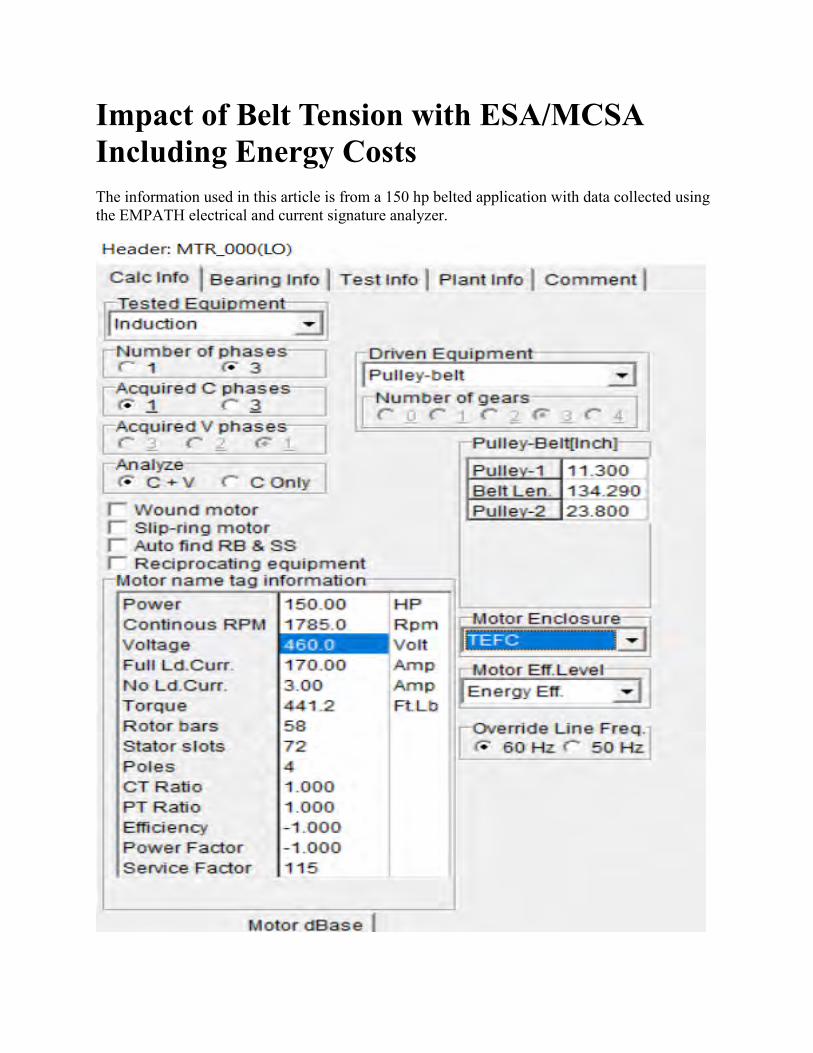
Impact of Belt Tension with ESA/MCSA Including Energy Costs The information used in this article is from a 150 hp belted application with data collected using the EMPATH electrical and current signature analyzer.
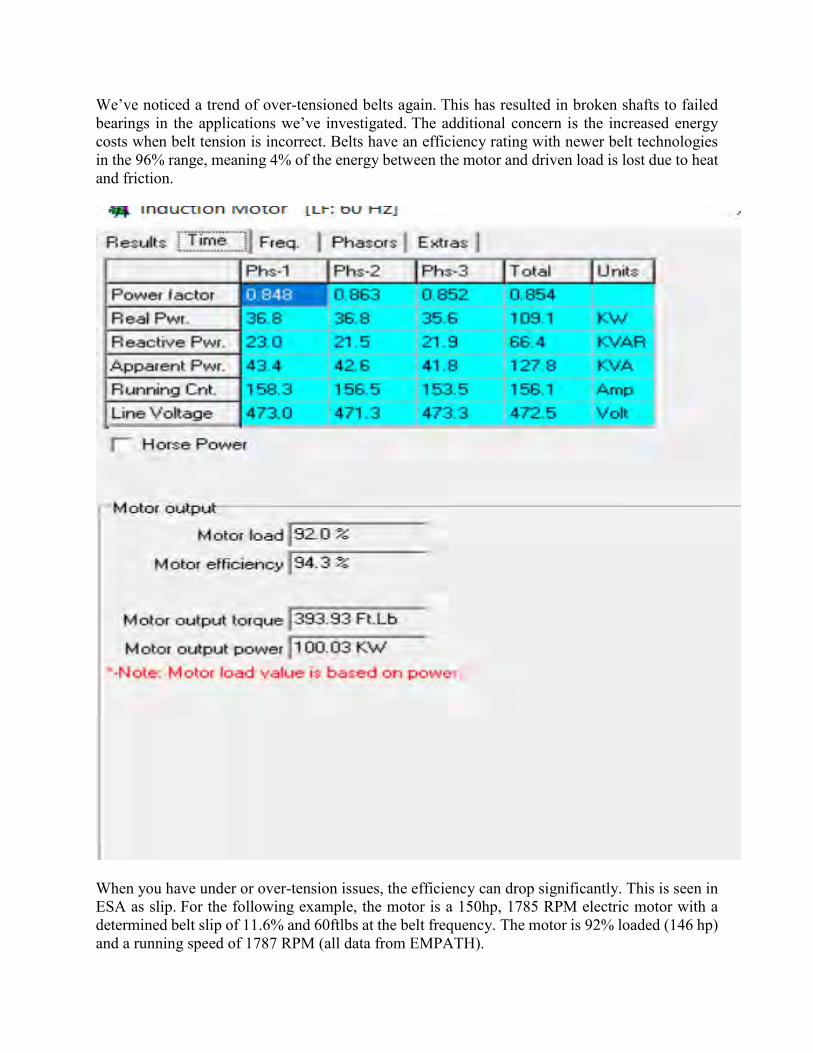
We’ve noticed a trend of over-tensioned belts again. This has resulted in broken shafts to failed bearings in the applications we’ve investigated. The additional concern is the increased energy costs when belt tension is incorrect. Belts have an efficiency rating with newer belt technologies in the 96% range, meaning 4% of the energy between the motor and driven load is lost due to heat and friction.
When you have under or over-tension issues, the efficiency can drop significantly. This is seen in ESA as slip. For the following example, the motor is a 150hp, 1785 RPM electric motor with a determined belt slip of 11.6% and 60ftlbs at the belt frequency. The motor is 92% loaded (146 hp) and a running speed of 1787 RPM (all data from EMPATH).
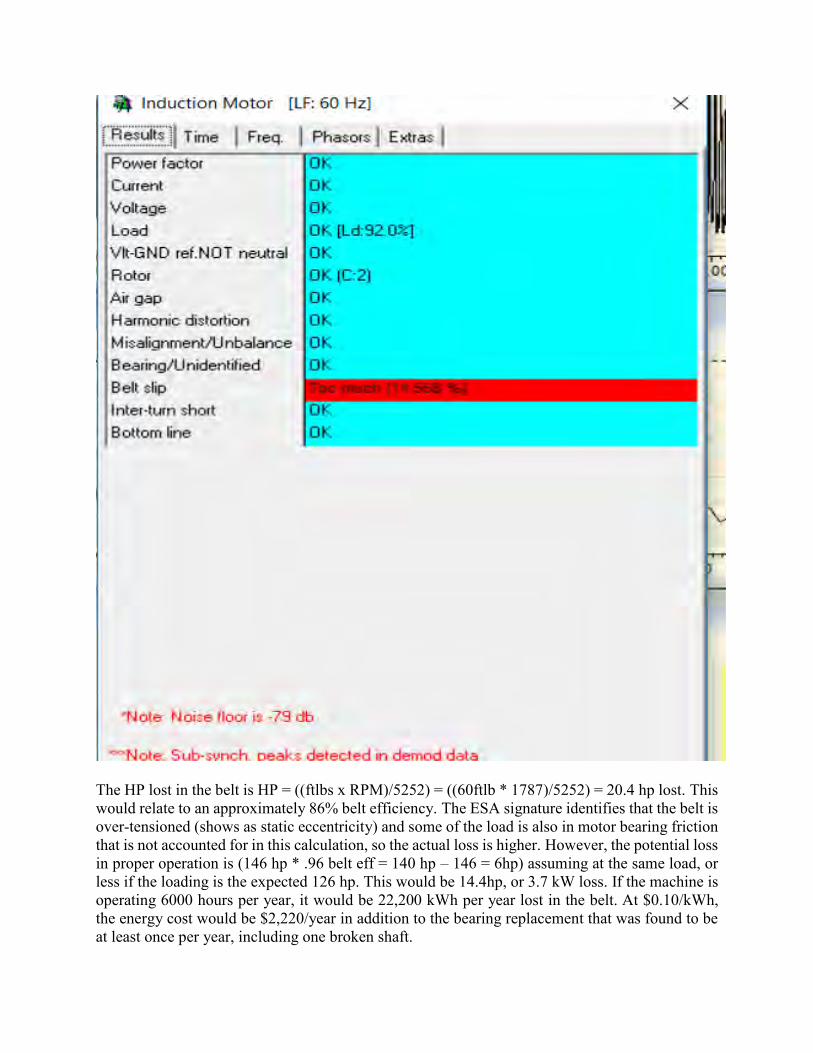
The HP lost in the belt is HP = ((ftlbs x RPM)/5252) = ((60ftlb * 1787)/5252) = 20.4 hp lost. This would relate to an approximately 86% belt efficiency. The ESA signature identifies that the belt is over-tensioned (shows as static eccentricity) and some of the load is also in motor bearing friction that is not accounted for in this calculation, so the actual loss is higher. However, the potential loss in proper operation is (146 hp * .96 belt eff = 140 hp – 146 = 6hp) assuming at the same load, or less if the loading is the expected 126 hp. This would be 14.4hp, or 3.7 kW loss. If the machine is operating 6000 hours per year, it would be 22,200 kWh per year lost in the belt. At $0.10/kWh, the energy cost would be $2,220/year in addition to the bearing replacement that was found to be at least once per year, including one broken shaft.
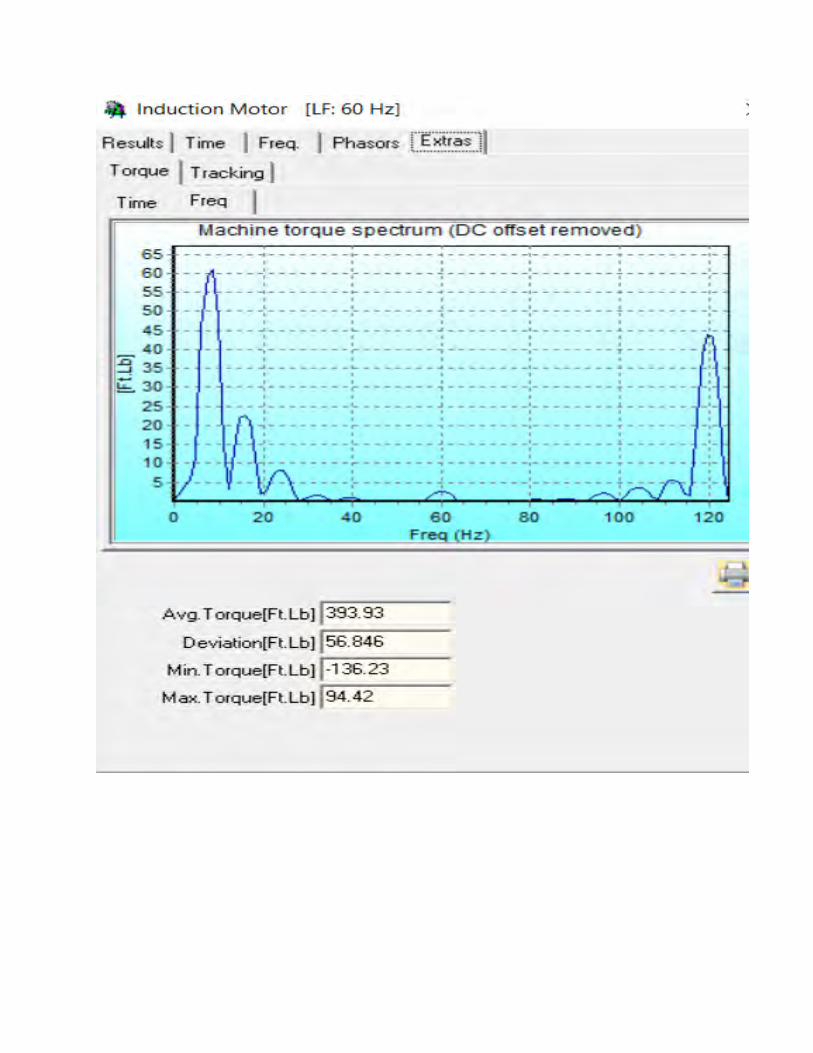
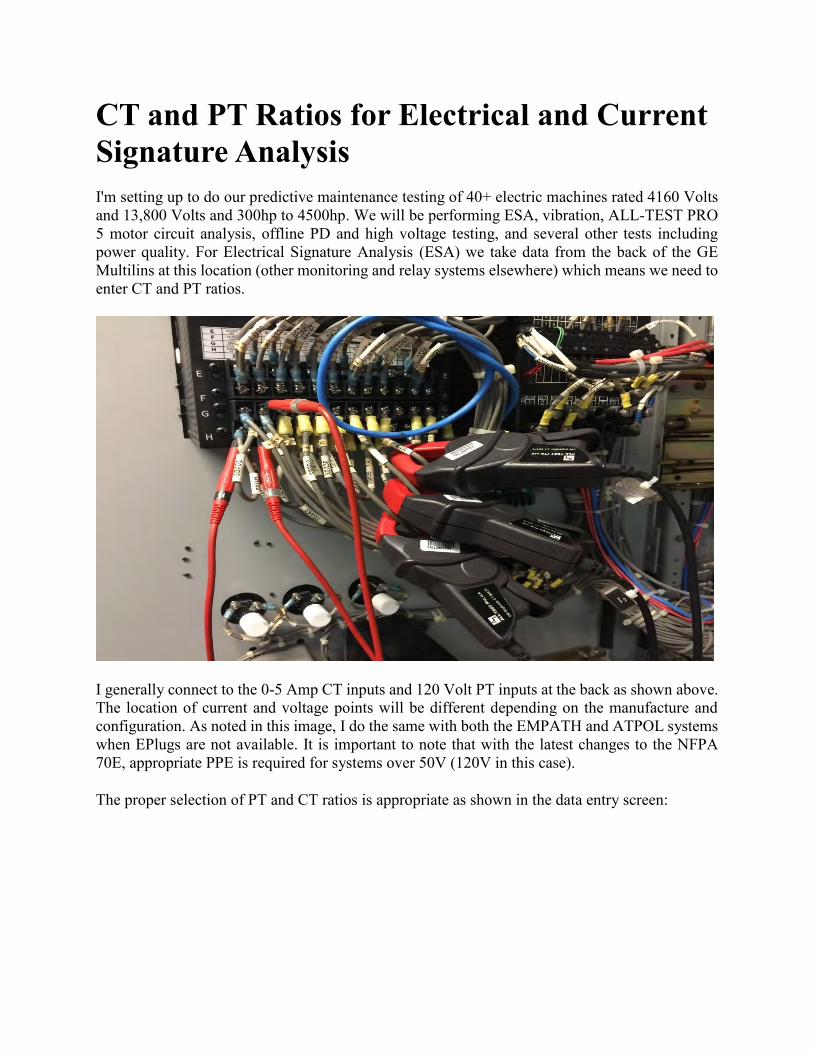
CT and PT Ratios for Electrical and Current Signature Analysis I'm setting up to do our predictive maintenance testing of 40+ electric machines rated 4160 Volts and 13,800 Volts and 300hp to 4500hp. We will be performing ESA, vibration, ALL-TEST PRO 5 motor circuit analysis, offline PD and high voltage testing, and several other tests including power quality. For Electrical Signature Analysis (ESA) we take data from the back of the GE Multilins at this location (other monitoring and relay systems elsewhere) which means we need to enter CT and PT ratios.
I generally connect to the 0-5 Amp CT inputs and 120 Volt PT inputs at the back as shown above. The location of current and voltage points will be different depending on the manufacture and configuration. As noted in this image, I do the same with both the EMPATH and ATPOL systems when EPlugs are not available. It is important to note that with the latest changes to the NFPA 70E, appropriate PPE is required for systems over 50V (120V in this case).
The proper selection of PT and CT ratios is appropriate as shown in the data entry screen:
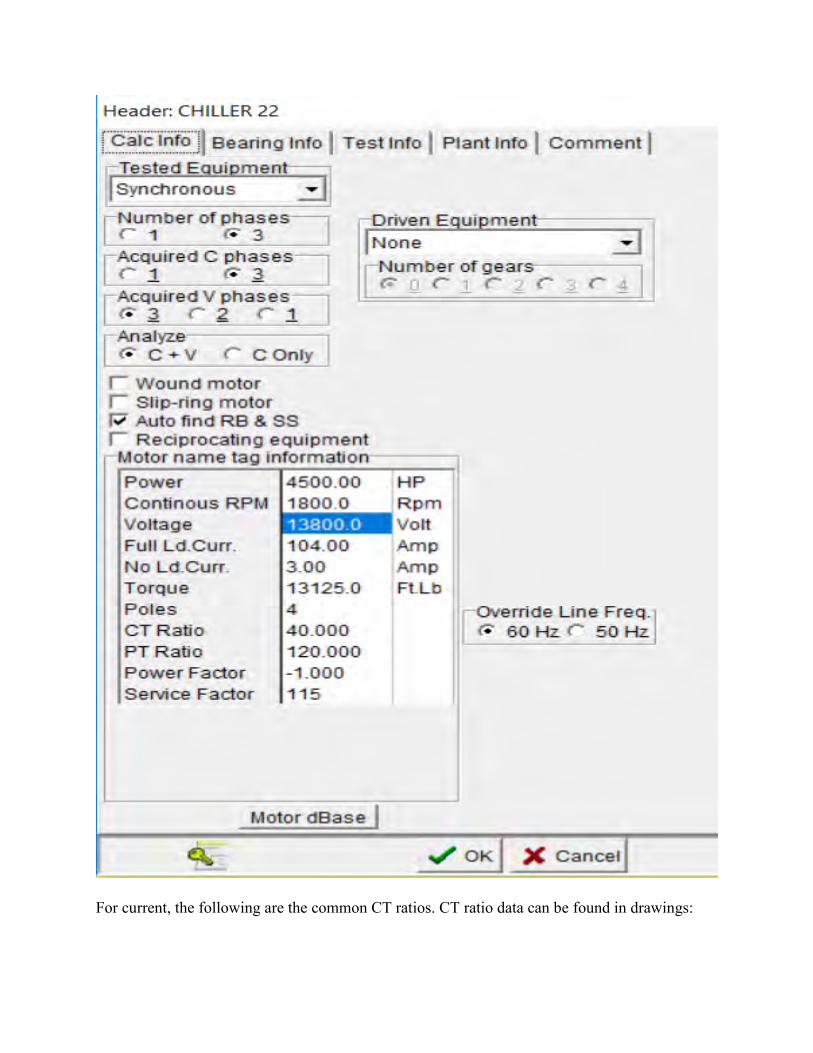
For current, the following are the common CT ratios. CT ratio data can be found in drawings:
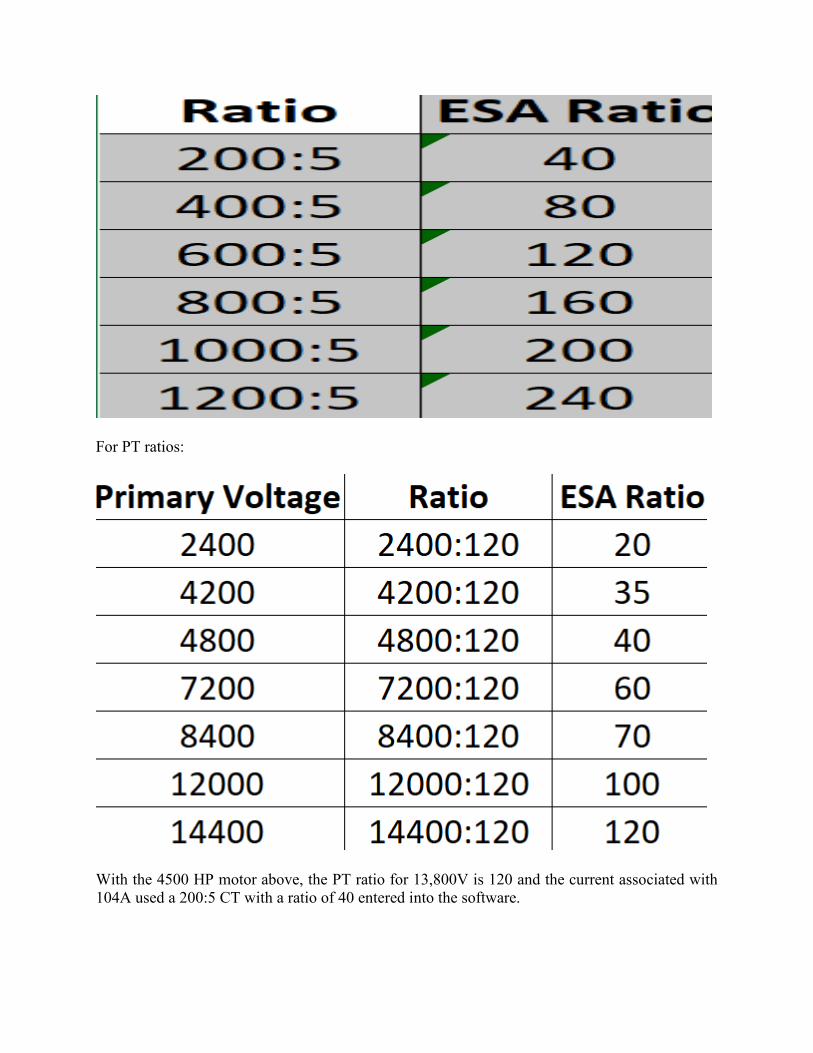
For PT ratios:
With the 4500 HP motor above, the PT ratio for 13,800V is 120 and the current associated with 104A used a 200:5 CT with a ratio of 40 entered into the software.
Electrical Signature Vs Vibration: What are the Advantages of ESA/MCSA? Well, for one thing, the data taken on the specialty systems above were accessed in a 72F control room while it was 32F and raining outside where the equipment was located. Add in that the motors operating under vacuum have a gap between the operating components and surfaces as well as being mounted in a bunker. Total time performing across-the-speed range of 6 of the 10 motors that had not had winding failures was 1.5 days including operational setup. In effect, much faster. However, what is fast if you cannot detect anything?
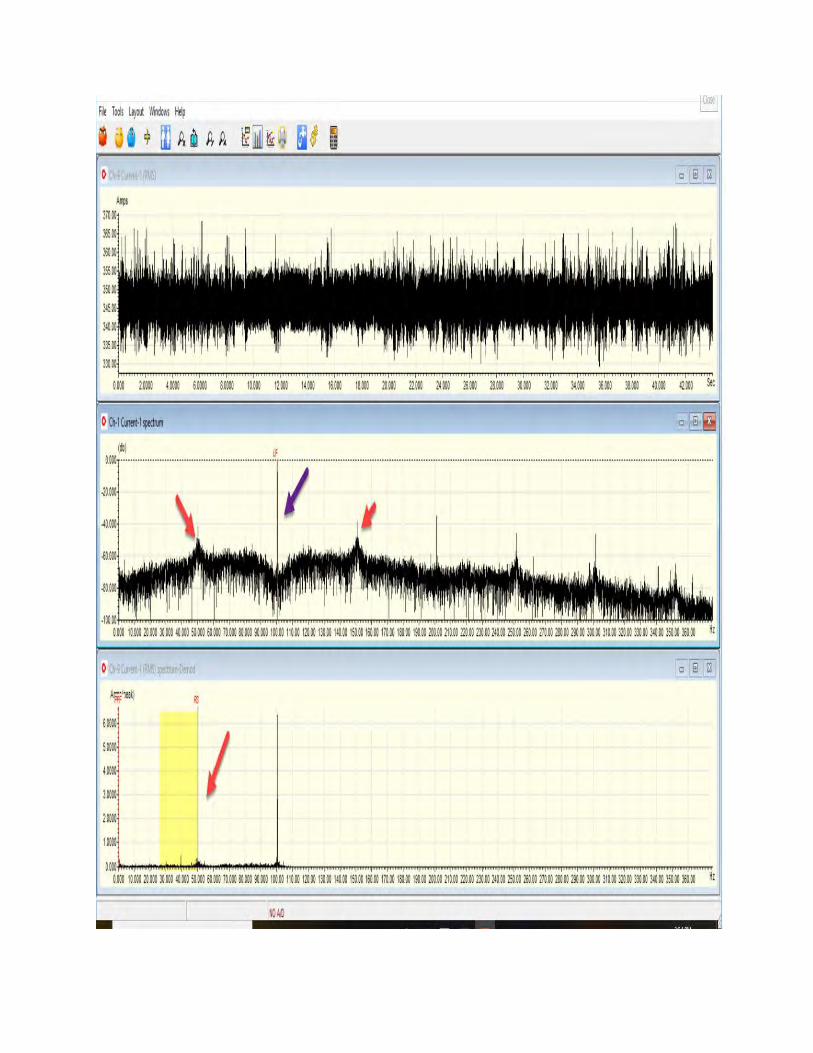
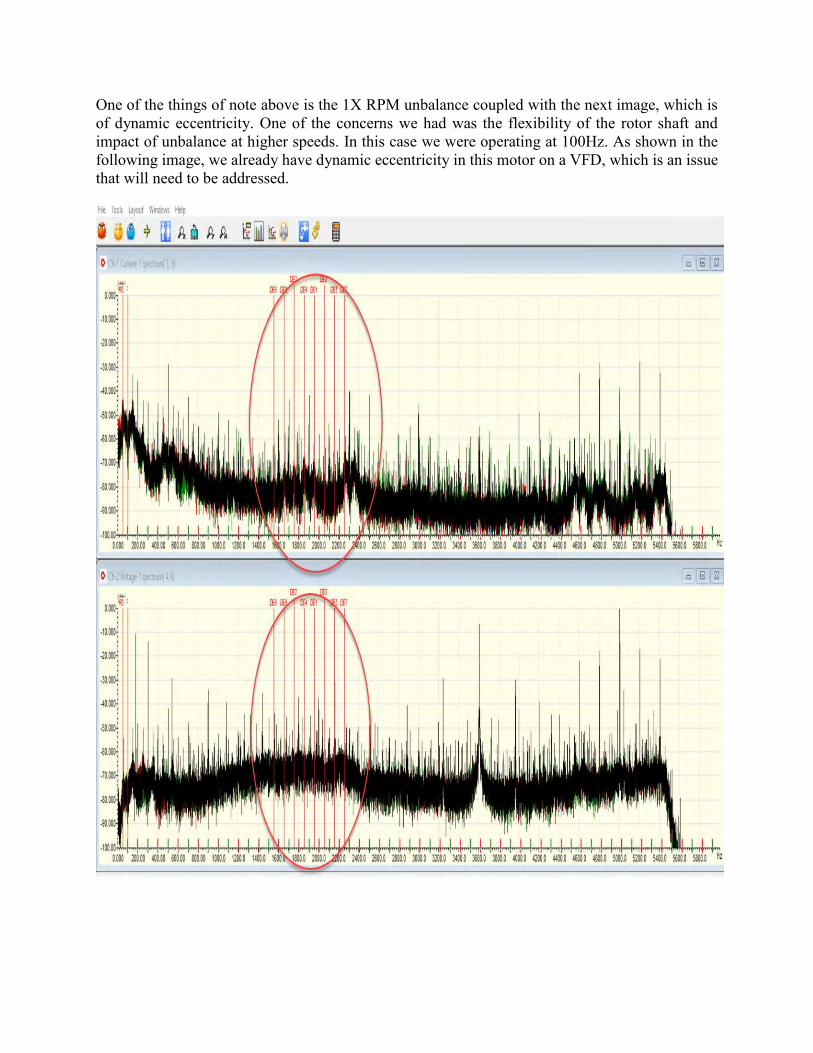
One of the things of note above is the 1X RPM unbalance coupled with the next image, which is of dynamic eccentricity. One of the concerns we had was the flexibility of the rotor shaft and impact of unbalance at higher speeds. In this case we were operating at 100Hz. As shown in the following image, we already have dynamic eccentricity in this motor on a VFD, which is an issue that will need to be addressed.
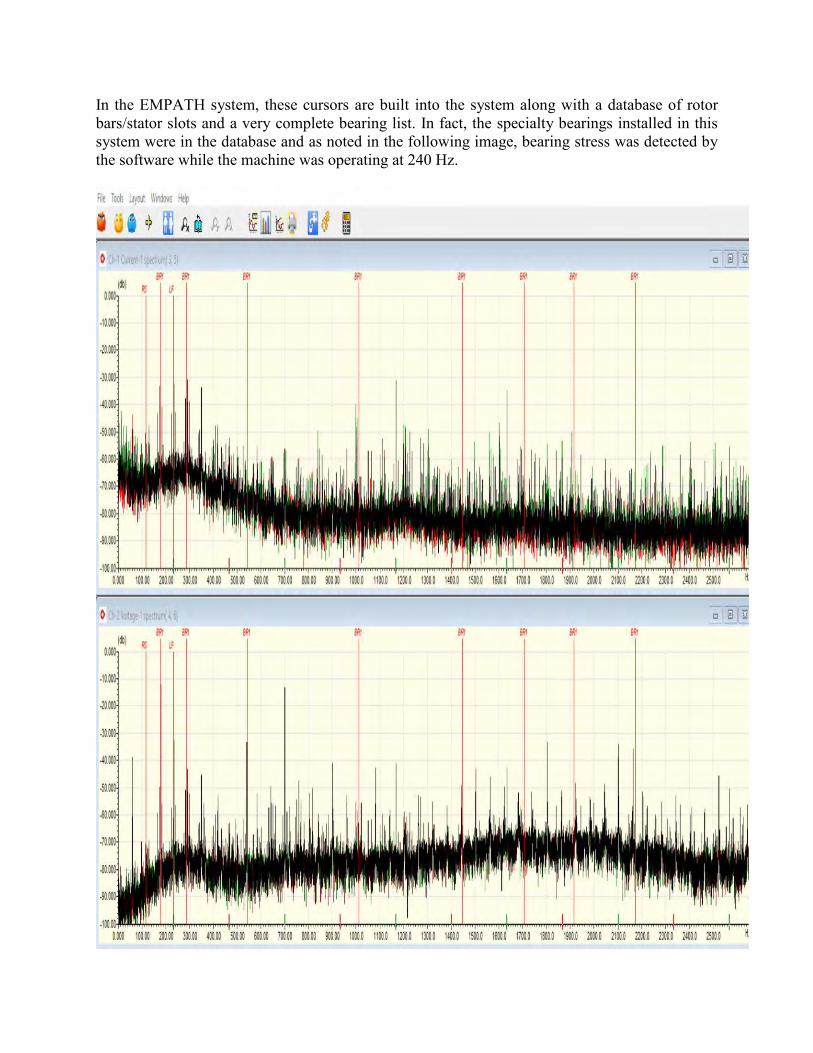
In the EMPATH system, these cursors are built into the system along with a database of rotor bars/stator slots and a very complete bearing list. In fact, the specialty bearings installed in this system were in the database and as noted in the following image, bearing stress was detected by the software while the machine was operating at 240 Hz.
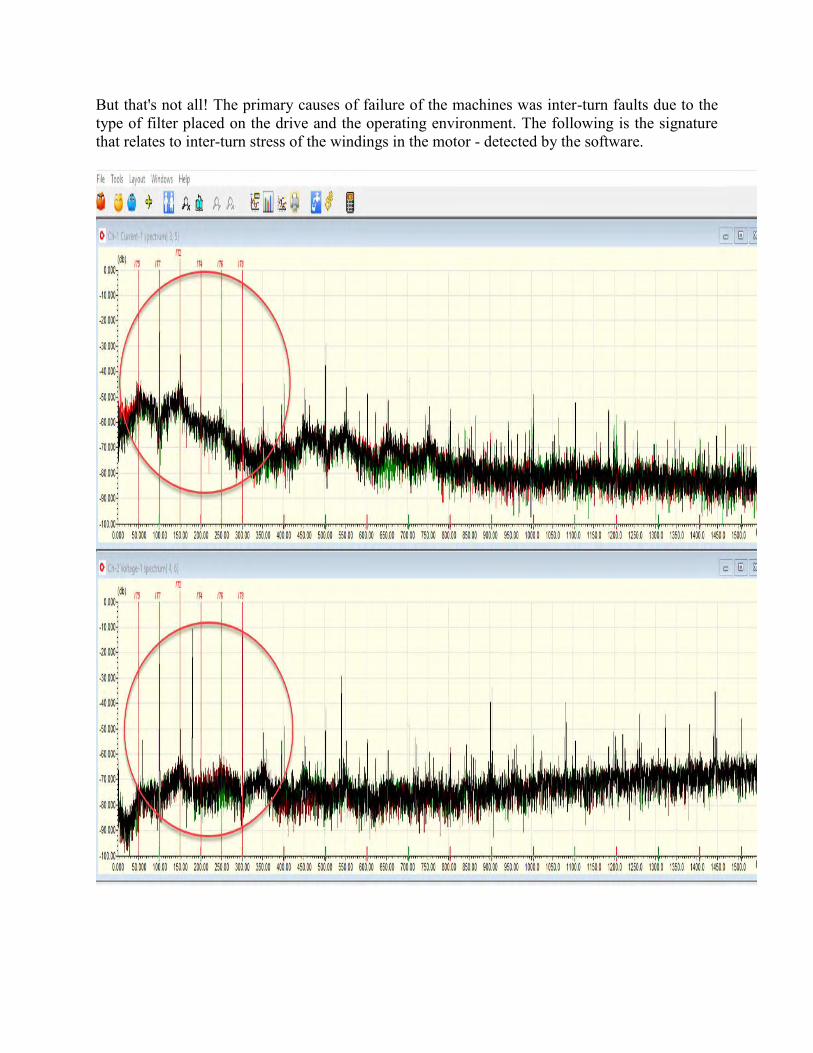
But that's not all! The primary causes of failure of the machines was inter-turn faults due to the type of filter placed on the drive and the operating environment. The following is the signature that relates to inter-turn stress of the windings in the motor - detected by the software.
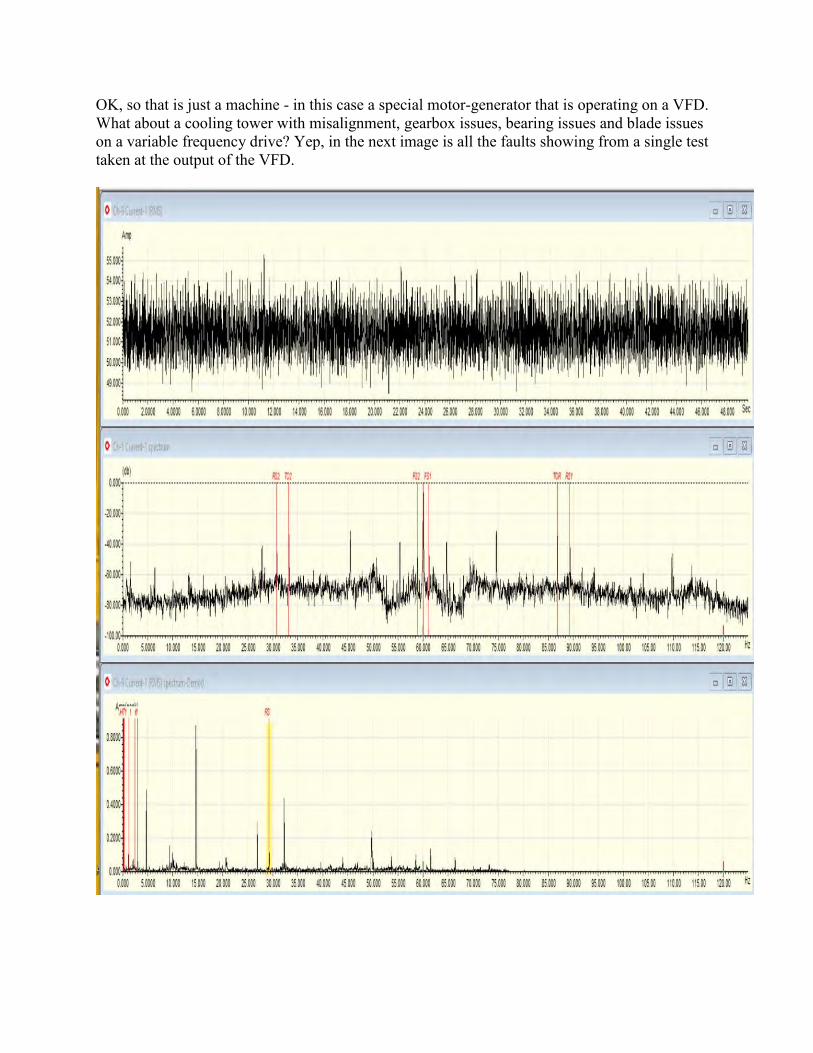
OK, so that is just a machine - in this case a special motor-generator that is operating on a VFD. What about a cooling tower with misalignment, gearbox issues, bearing issues and blade issues on a variable frequency drive? Yep, in the next image is all the faults showing from a single test taken at the output of the VFD.
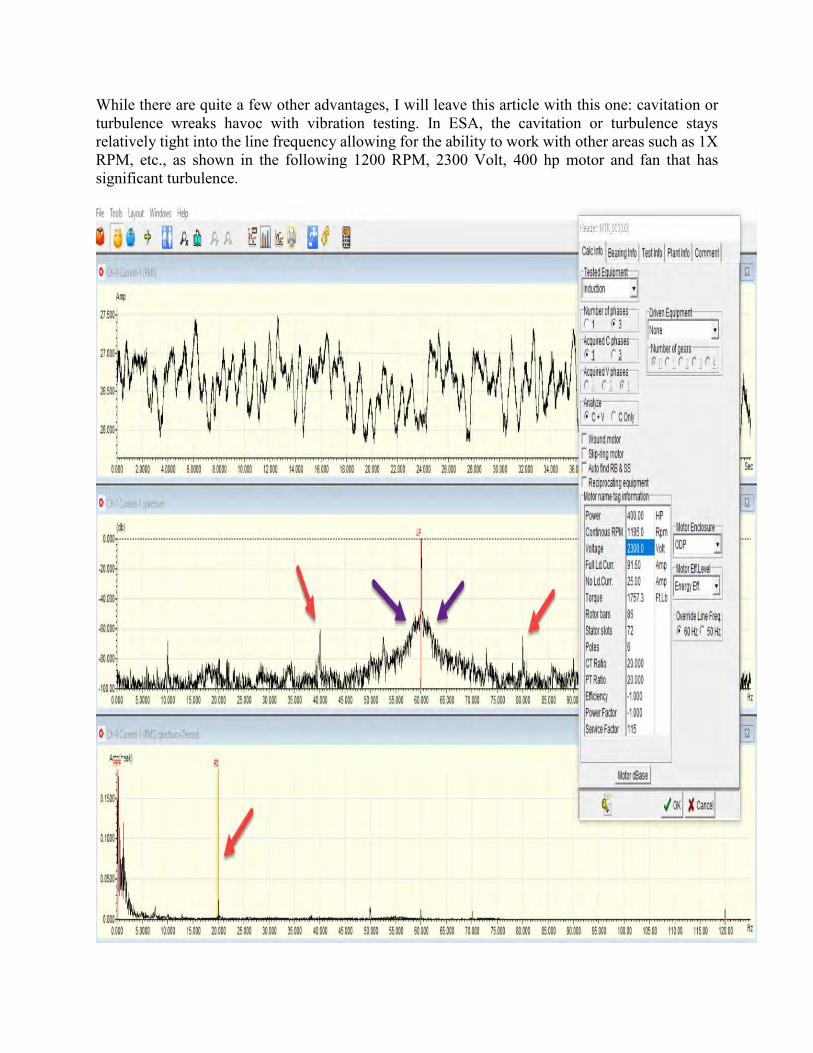
While there are quite a few other advantages, I will leave this article with this one: cavitation or turbulence wreaks havoc with vibration testing. In ESA, the cavitation or turbulence stays relatively tight into the line frequency allowing for the ability to work with other areas such as 1X RPM, etc., as shown in the following 1200 RPM, 2300 Volt, 400 hp motor and fan that has significant turbulence.

In summary, ESA/MCSA has signficicant advantages for troubleshooting and trending including the ability to see the entire system at one time. It is also not load-depedent and data can be taken from more convenient areas. The ability to take data is much faster than traditional point-detection and is not a concern when detecting faults through layers of steel or even hermetic systems. Is it a replacement for vibration? In a lot of circumstances it is for monitoring and effective analysis, even including real-time continuous monitoring systems. Most other machine monitoring systems are point-detection requiring proper placement and a high level of skill.

Related Documents


