EROSION RATE OF STAINLESS STEEL DUE TO THE IMPACT OF SOLID PARTICLES D. AQUARO Università degli Studi di Pisa, Dipartimento di Ingegneria Meccanica Nucleare e della Produzione Via Diotisalvi 2, 56100 Pisa, Italy [email protected] ABSTRACT This paper deals with the erosion rate of stainless steels due to the impact of solid particulate. These materials are used in high temperature applications. Several theoretical models have been developed for determining the erosion resistance of ductile materials. These approaches assume a failure mode (so called micro cutting) which does not seem to be adequate, as has been proved experimentally. Moreover these models derive formulas for the eroded volume of material that depend on several constants which need to be determined experimentally. The great uncertainty of the experimental results, intrinsic to the erosion tests, together with the high expense involved led the author to develop alternative methods based on numerical simulations. On the basis of theoretical models, the author developed erosion criteria for ductile materials which could be implemented as Fortran routines in commercial FEM codes. The numerical simulations concern with multiple impacts of particles on stainless steel target. The erosion criterion, which looks like the energetic criterion of the fracture mechanic , was applied to the elements of the mesh step by step during the transient. A damage indicator for each element in a tensile stress state was calculated in every time step. This indicator represents the eroded fraction of the element in each time step and permits to eliminate the dependence of the results from the mesh size. Several analyses were performed considering different plasticity criteria, the dependence of the erosion rate on the strain rate, the temperature. The numerical results were compared with experimental and theoretical results. In spite of some simplifying assumptions, there was a good agreement between the numerical and experimental results. Moreover a theoretical erosion model for ductile material, developed by the author, agreed better than the other models being examined. The described numerical method could be a powerful means of assessing the erosion resistance of components in real operating conditions. KEYWORDS Erosion model, impact wear, Finite Element, stainless steel erosion, Continuum Mechanic . AITC-AIT 2006 International Conference on Tribology 20-22 September 2006, Parma, Italy

Welcome message from author
This document is posted to help you gain knowledge. Please leave a comment to let me know what you think about it! Share it to your friends and learn new things together.
Transcript
EROSION RATE OF STAINLESS STEEL DUE TO THE IMPACT OF SOLID PARTICLES
D. AQUARO
Università degli Studi di Pisa, Dipartimento di Ingegneria Meccanica Nucleare e della Produzione Via Diotisalvi 2, 56100 Pisa, Italy [email protected]
ABSTRACT This paper deals with the erosion rate of stainless steels due to the impact of solid particulate. These materials are used in high temperature applications. Several theoretical models have been developed for determining the erosion resistance of ductile materials. These approaches assume a failure mode (so called micro cutting) which does not seem to be adequate, as has been proved experimentally. Moreover these models derive formulas for the eroded volume of material that depend on several constants which need to be determined experimentally. The great uncertainty of the experimental results, intrinsic to the erosion tests, together with the high expense involved led the author to develop alternative methods based on numerical simulations. On the basis of theoretical models, the author developed erosion criteria for ductile materials which could be implemented as Fortran routines in commercial FEM codes. The numerical simulations concern with multiple impacts of particles on stainless steel target. The erosion criterion, which looks like the energetic criterion of the fracture mechanic , was applied to the elements of the mesh step by step during the transient. A damage indicator for each element in a tensile stress state was calculated in every time step. This indicator represents the eroded fraction of the element in each time step and permits to eliminate the dependence of the results from the mesh size. Several analyses were performed considering different plasticity criteria, the dependence of the erosion rate on the strain rate, the temperature. The numerical results were compared with experimental and theoretical results. In spite of some simplifying assumptions, there was a good agreement between the numerical and experimental results. Moreover a theoretical erosion model for ductile material, developed by the author, agreed better than the other models being examined. The described numerical method could be a powerful means of assessing the erosion resistance of components in real operating conditions. KEYWORDS Erosion model, impact wear, Finite Element, stainless steel erosion, Continuum Mechanic .
AITC-AIT 2006International Conference on Tribology
20-22 September 2006, Parma, Italy
1 INTRODUCTION
The impact of solid particles, entrained in a fluid flow, erodes components like gas turbines, heat exchangers, cyclones and so on and is one of the primary reasons of the damage of these components. Their surfaces, impacted by these particles, undergo a continuous decrease in thickness, which could impair the component resistance. It is of great interest to find predictive methods by means of which to calculate the erosion resistance of the materials used for the construction of the above mentioned components. The erosion mechanism of brittle materials is different from that of ductile materials. Ceramics and brittle materials erode by cracking and chipping. Therefore, the erosion strongly depends on the toughness of material. The maximum erosion rate is obtained with normal impact on the target (impact angle a = 90 °) [1]. Ductile materials erode due to mechanisms which consist of the sequential steps of micro extrusion, forging and fracture. The most important mechanism is the plastic deformation and maximum erosion is obtained with impact angle ranging between 20° -30°. Several theoretical methods have been developed for determining the volume of eroded material as a function of the main variables that the erosion mechanism depends on. The theoretical approaches derive formulas for the eroded volume of material that depend on several constants which need to be determined experimentally [3]. The stochastic characteristic of erosion makes the evaluation of these constants difficulty by means of the experimental tests. The fluid dynamic interaction between the erodent flow and the target, which determines the true value of the velocity vector (direction and magnitude), the actual value of particle energy transmitted to the target, the shielding effects produced by the rebounding of the particles, the actual friction coefficient between particle and target are only some of the possible causes which influence the variability of the results. Moreover, it is extremely important to have information about the mechanical properties, about the manufacturing technology and about the micro structural characteristics of the target material. Experimental erosion rates data, found in the literature, often refer to particular materials without specifying their properties and reporting only the main operating conditions (particle radius, velocity and impact angle). Therefore, the experimental erosion rate, reported by different authors for the same material, can differ greatly (even by some orders of magnitude [4]-[5]). The most reliable experimental results can be obtained by performing erosion tests on sections of true scale components considering the actual operating conditions. But experimental tests on sections of full scale components are very expensive. Therefore, it is necessary to estimate the most severe test conditions, which would enable us to obtain a conservative life prediction of the tested components. Numerical simulations performed with Finite Element Method (FEM) codes can anticipate the behaviour of the component, if a reliable model of erosion mechanisms is implemented. In this context, the author developed numerical predictive methods to determine the erosion resistance of materials [4]-[5].. The erosion rate was obtained by means of numerical simulations of multiple particle impacts on the material under examination. Failure criteria, based on the fracture energy, were implemented in a commercial computer code dedicated to the impulsive mechanic. The energy, which fractures the material, is due to a tensile stress state. Erosion occurs in a plastic deformation regime for ductile materials. In addition, a method for eliminating the dependence of the mesh on the results was envisaged. This method involves the definition of a damage indicator for each element in a tensile stress state, which is calculated in each time step. This indicator represents the eroded fraction of the element in each time step. Only when the
0.00
0.50
1.00
1.50
2.00
2.50
3.00
3.50
0 50 100 150 200 250
velocity (m/s)
ero
sio
n r
ate
(mg
/g)
exp.results - 30° exp..results - 90°
bitter model - 30° bitter model - 90°
cumulative deformation energy reaches the value of the energy necessary to fracture the entire surface of the element, this element is eliminated from the mesh.
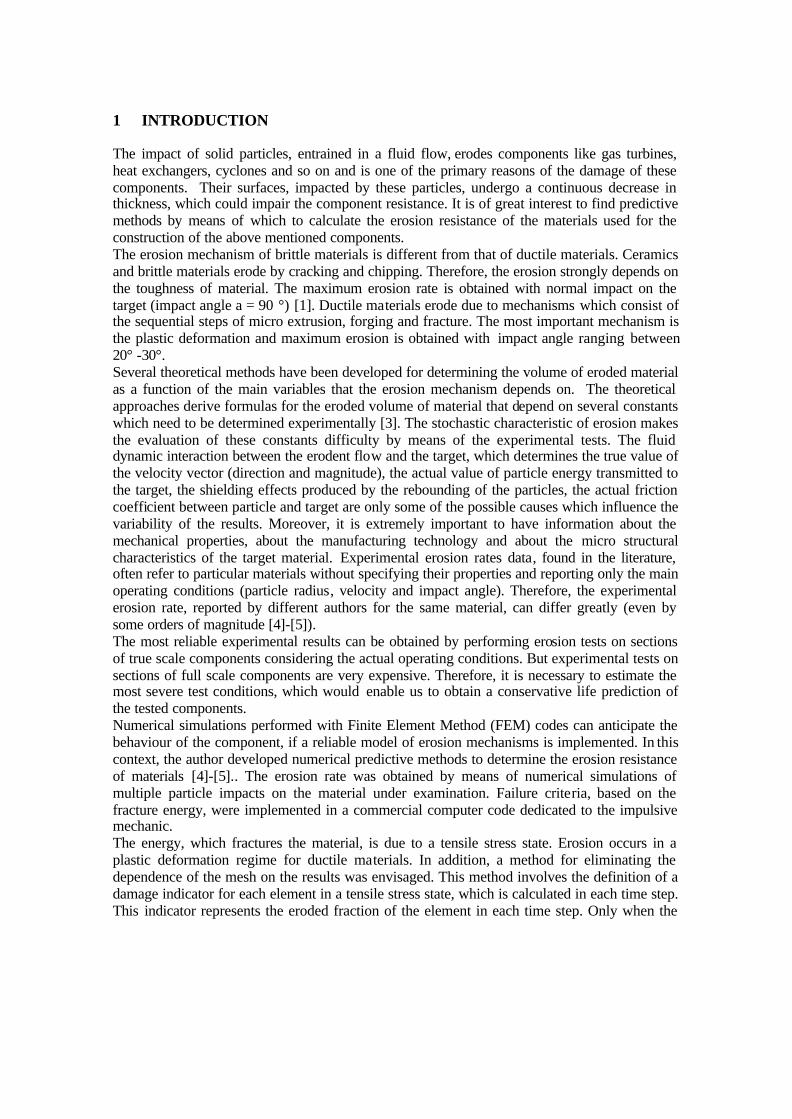
Figure 1: Fitting of experimental results with a modified Bitter model.
Several simulations have been performed varying the diameter, the velocity and the impact angle of the particles and the constitutive equation of the target material. A target of stainless steel, having the mechanical characteristics of the AISI 304, was considered. The particles were considered rigid and with the density of the silicon carbide. The numerical results have been compared with erosion rate data found in the literature. The comparison shows that the implemented model can be used as a powerful means of assessing the resistance to erosion of components in real operating conditions.
In the following sections, some theoretical methods of the erosion of ductile materials are illustrated and a comparison with experimental and numerical results is performed.
2 THEORETICAL PREDICTIVE METHODS OF THE EROSION OF DUCTILE MATERIAL
Several Authors (Bitter[3], Finnie[2] , Levin[7]) agree that the erosion of ductile materials
depends strongly on the plastic deformation of the target caused by the impact of the particles. Their models calculate the fraction of the initial energy of the particle transmitted to the target and absorbed as plastic deformation energy. The eroded volume is determined dividing the plastic deformation energy by the energy, obtained experimentally, needed to remove a unit volume of material. Several other constants need to be experimentally determined in order to evaluate the eroded volume.

( ) ( )( ) Φ−−= /sincos 2/321
2221 kkMV pppC αωαω
)/()/1(55.125.02/5
2 smEyk pρ=5.0225.021 )/()/(82.0 smEyyk pρ=
( ) Nmsyyc p / /)/(288.0 2/1325.0 ⋅= ρ
Bitter’s model [3] assumes that the eroded material is the sum of the volume removed by plastic deformation, VD, and by cutting VC. The expressions of VD and VC are as follows:
Ω−= /)sin( 222
1 kMV ppD αω (1) for α≥αc
(2a)
for α≤αc ( )( ) αωαωαωαωαω sin/sin/sincos)sin(2 2
22
2 ppppppC kckcMV Φ−−−= (2b) where
)/(/)1(/)1( 222 NmEEE pptt νν −−−=
αc ( critical angle) is the minimum impact angle for the which the component of velocity parallel to the target becomes zero at the instant of time in which the component normal of the velocity becomes zero. αc is obtained assuming that the equations 2a) and 2b) have to give the same value for α=αc:
( ) 4/52/14/12/12/3 576.02sin/cos −Φ=Φ= yc PpPcc ωρωαα (4)
Ω and Φ are the energy needed to remove an unit volume of material by means plastic deformation and cutting, respectively.
The energy Ω (called also deformation wear factor) is partly used for plastic deformation and partly for winning the bonding forces among the molecules. For the ductile materials the last term is negligibly small respect with the plastic deformation energy.
Bitter assumes that the energy Φ can be determined calculating the area under the strain-stress curve, considering the strain rate effect, the work hardening and the temperature softening. Levin[7] calls the energy Φ ‘tensile toughness’ and determines it as the area under the true strain –true stress curve, obtained in high strain-rate compression tests. The upper limit of the stress ( the fracture stress) is estimated from micro hardness tests performed on eroded samples, beneath the eroded surface.
k2 is the maximum velocity of the particle, which does not produce plastic deformation and, therefore, erosion. Moreover k2 is also equal to the rebound velocity of the particle.
y is the elastic load limit. Bitter considers the hardening produced by the particle impact and assumes y equal to the Vickers hardness of the material. The y value is estimated to range between 1.59 Sy and 3.2 Sy, being Sy the static yielding stress. The lower value (1.59 Sy) is considered the most probable value in the case of low impact velocities as occur in the erosion.
The Bitter model is applied to a target, made of AISI 304 stainless steel eroded by particles of silicon carbide. The mechanical characteristics of the target and of the erodent are shown in Table 1. Using the data of Table 1 we obtain the following values of the critical angle versus the impact velocity:
- for ωp= 200 m/s αc = 3.8° - for ωp= 150 m/s αc = 4.4° - for ωp= 100 m/s αc = 4.8°

Ω= 12
21 /)sin( FMV ppD αω
0
0.5
1
1.5
2
2.5
3
3.5
0.00 20.00 40.00 60.00 80.00 100.00
impact angle (°)
ero
sio
n r
ate
(mg
/g)
v=100 m/s v=150 m/s v=200m/s
Material
Bulk modulus (MPa)
Shear modulus (MPa)
Yielding stress(MPa)
Ultimate tensile stress(MPa)
Fracture Energy (J/m2)
Fracture strain
Density (Kg/m3)
SiC 209500 191000 4000 400 20 0.04 3200 Aisi 304 166000 76900 240 500 850000 0.5 7800
Table 1. Target and erodent material properties
Therefore, according to the Bitter model, the eroded volume is calculated by means of the equations 1) and 2a) for all the velocities taken into consideration. The velocity k2, which produces only elastic deformation, is equal to k2= 1.6 10-3 m/s. Moreover, k1=4.6 10-5 (m/s)0.5 and c=4.06 10-11.( m3 s)1/2/N Indeed k1 and k2 have unrealistically small values. Substituting these values in the equations 1) and 2a), we conclude wrongly that all the particle kinetic energy is absorbed by the target and contributes to the erosion.
Figure 2: AISI 304 erosion rate versus impact angle obtained fitting the experimental results with a modified Bitter model. Therefore we can simply transform the equations 1) and 2a) in one realistic form:
(5)
( )( ) Φ= 2
2221 /cos FMV ppC αω
(6)
Where 1/F1 is the fraction of the kinetic energy, corresponding to the normal component of the velocity, which produces deformation wear while 1/F2 is the fraction of the kinetic energy, corresponding to the tangential component of the velocity, producing cutting wear. We can estimate F1Ω and F2Φ fitting experimental results with the equations (5) and (6). Figure 1 shows experimental results of erosion rate of AISI 304 stainless steel eroded by 250 µ of diameter silicon carbide particles [1]. The erosion rate values relate to different impact velocities and to two impact angles ( 30° and 90°). The fitting of the experimental results with the equation (5) and (6) is obtained assuming F1Ω=7.5 1010 J/m3 and F2Φ=5 1010 J/m3. The experimental results show that the erosion rates relating to an impact angle of 90° are 1.5 lesser than those obtained with impact angle of 30°. Replacing in the equation 1), 2a) and 2b) the values of F1Ω and F2Φ instead of Ω and Φ , we obtain the curves , shown in Figure 2, of erosion rate versus the impact angle for different values of the velocity. The unsuccessful application of the Bitter model has put in evidence that an reliable theoretical model has to determine the fraction of kinetic energy absorbed by the target as well as the fraction of this energy which contributes to the erosion. Moreover two material constants Ω and Φ have to be experimentally determined with well defined tests. Numerical models permit easily to reach the first objective, that is, the determination of the energy absorbed by the target as plastic deformation energy. More difficult is the second stage because it needs to establish an erosion criterion valid at the finite element level. Moreover a limit value of the erosion criterion, depending only on the material, has to be determined. In the following section, an erosion model for ductile materials, developed by the author and implemented in a commercial FEM code is illustrated. The model is applied to the erosion of the AISI 304 stainless steel with silicon carbide particles.
3 NUMERICAL SIMULATION OF THE EROSION OF DUCTILE MATERIAL
The theoretical models of the erosion of ductile materials, illustrated in the previous section, helped to implement a numerical model of the damage caused by solid particle impacts. The erosion is due to the material cracking determined by plastic deformation under a tensile stress state. Piece of material is removed when cracks ( i.e., fracture surfaces) form. Therefore the deformation energy, stored in this piece of material, has to be equal or greater than the value necessary to form the fracture surfaces. Thus the fundamental variable of the erosion phenomenon is assumed to be the fracture surface energy. This variable is a material constant, the value of which is very large for ductile materials which fail due to plastic deformation. Experimentally the fracture energy for the ductile materials is obtained from impact tests (Charpy tests). These are standard tests used for the characterization of the material. The impact energy obtained from Charpy tests has to be elaborated in order to be applied to the FEM model. In fact the deformation in the Charpy tests is due to bending loads while in the target erosion the deformation is due to normal loads. The assumed value of the fracture energy is Efr=3.27 109 J/m3.
)1))(/ln(1)(( *mo
npy TCBA −++= εεεσ &&
oε&
sec/1039 4−⋅=oε&
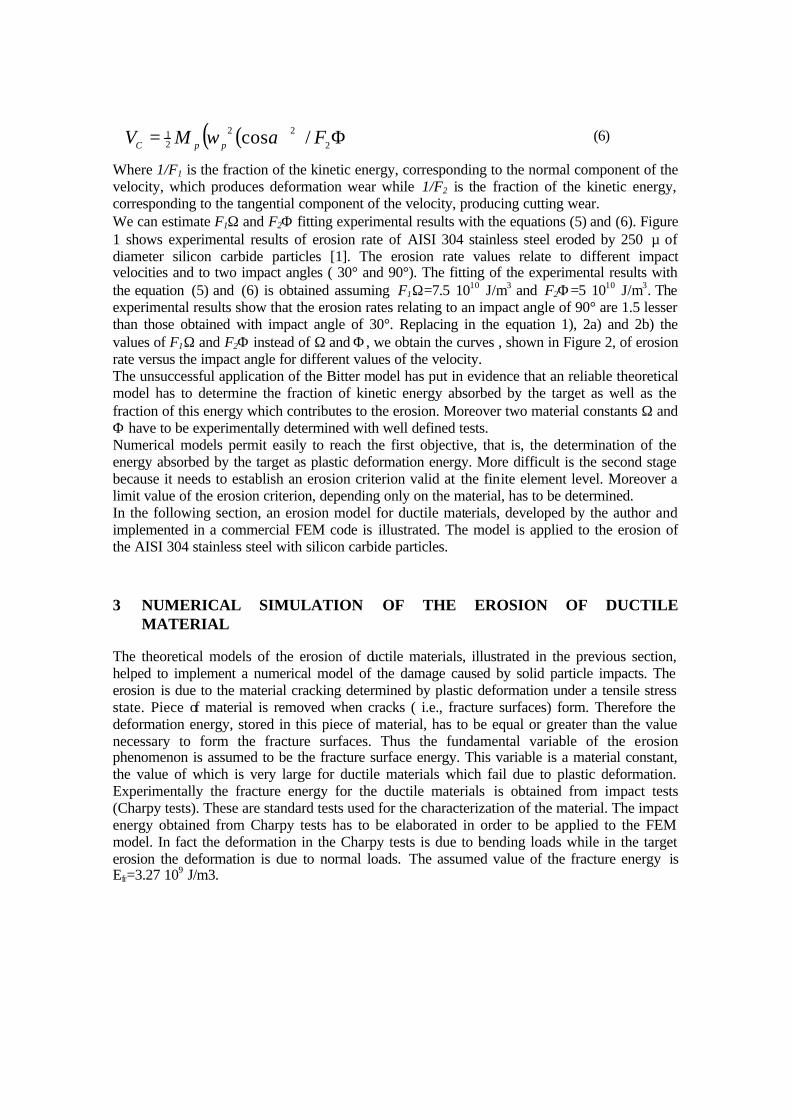
Figure 3: Mesh of the FEM model
The simulations were performed considering multiple impacts of particles at the same point of the target. The maximum erosion of ductile materials is obtained with an impact angle of 20°. Therefore several simulations of the impact of 8 particles against an AISI 304 target were performed . The erodent particles 50 µ of diameter are assumed to be rigid and their mass corresponds to a density of 3200 Kg/m3 . The simulations were performed considering an impact angle of 20° , while the impact velocity and the constitutive equation of the target were varied. Two constitutive behaviors of the target were considered:
- an elastic – perfectly plastic behavior ,following the Von Mises yielding criterion - an elastic, work hardening, rate sensitive and temperature dependent behavior,
described by means of the Johnson-Cook law. The Johnson – Cook law is expressed by the following equation: were σy is the yielding stress, εp the plastic strain, ε& the strain rate, T*=(T-Tr)/(Tm-Tr), T the temperature, Tr a reference temperature, Tm melting temperature.
, A, B, C, n and m are constants of the material. The values assumed in the simulations are: A=239 MPa, B=522 MPa, C=0.1, m=0.63,
Three impact velocities (100,150 and 200 m/s) were considered. The figure 3 shows the mesh of the target and the erodent.
3.1 Model of erosion of ductile materials The main hypotheses of the erosion model are as follows: - erosion occurs due to plastic deformation determined by a tensile stress state. The first invariant of stress tensor was used as an indicator of the stress state.
) /(E fr∫=elV
elelijijeli VdVD εσ
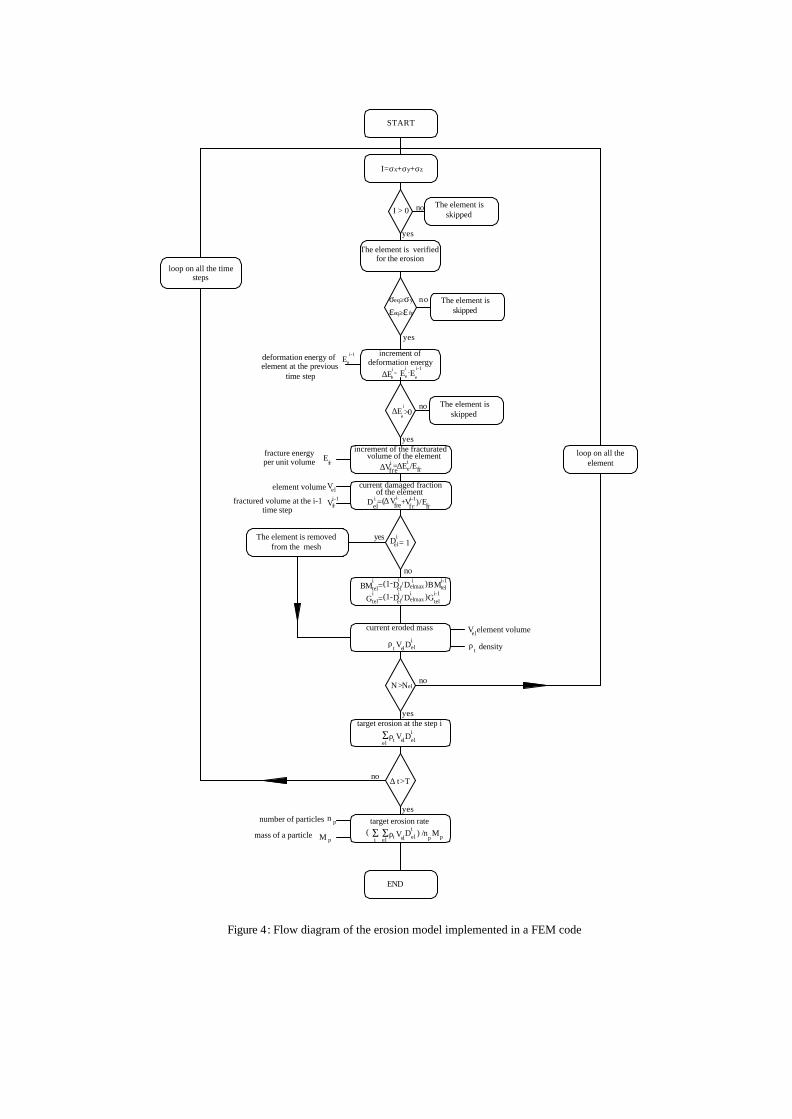
- the element begins to be fractured when the equivalent stress is equal to the yielding stress and the equivalent strain is greater than the fracture strain - the fractured element fraction is calculated by dividing the deformation energy stored in the element by the energy needed to form fracture surfaces, equal to the total surface of the element. This ratio can be considered as a damage function Deli , which decreases the strength of the material. If Deli becomes equal to 1, the element is removed by the mesh. - the eroded mass is determined multiplying the damage Deli by the element mass and adding it to that of all the fractured elements. Therefore, indicating with I1=σx+σy+σz the first invariant of stress tensor, the model only considers the elements in which I1 > 0 and the equivalent stress is equal or greater than the yielding stress and calculates the element damage function Deli as:
(6) while the erosion rate is calculated as:
ppelielitrateros MnVDE /)(_ ∑= ρ (7)
where
∫elV
elijij dV εσ is the deformation energy, Efr the fracture energy of the material per unit of
volume, Vel the volume of the element, np the number of erodent particles. If Deli =1 , the element is considered eroded and is removed by the mesh. If Deli <1, the element is considered partially eroded. In this case it is assumed that the material strength of the element is reduced. This reduction is taken into account by decreasing the bulk modulus, BMt., and the shear modulus, Gt ,of the material of the partially eroded element using the following expression : BM itel=(1-Deli / Delimax)BMt Gi
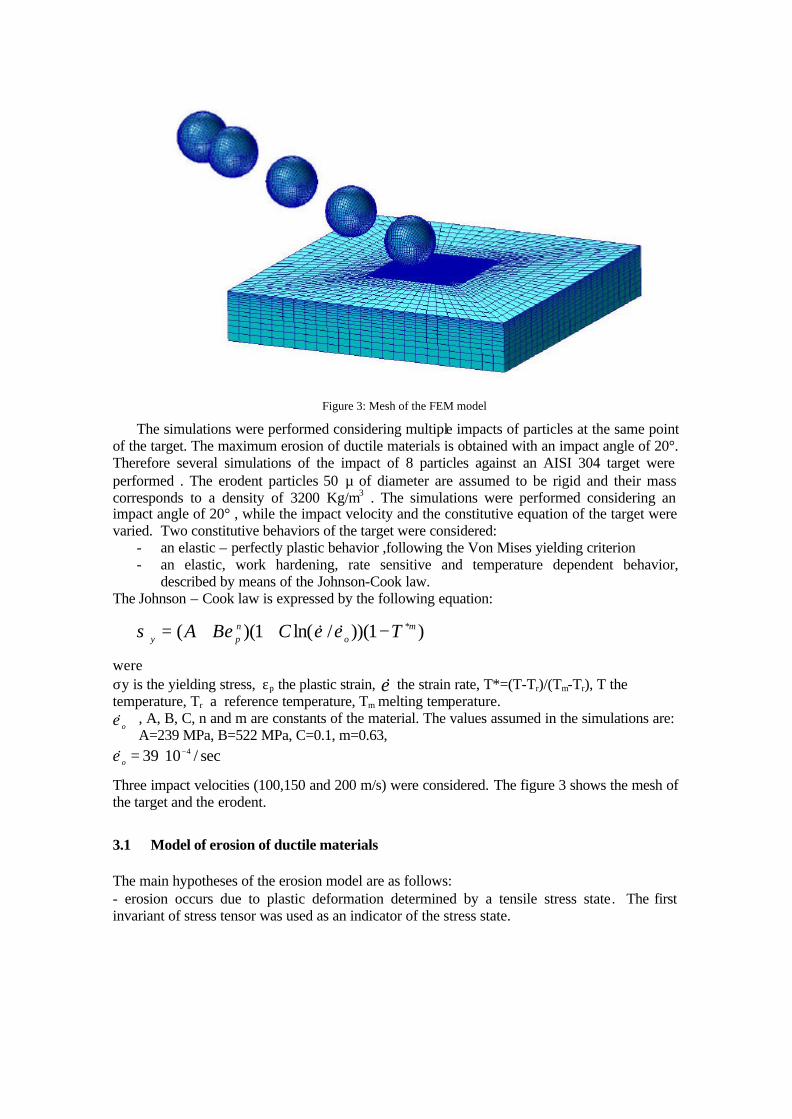
tel=(1-Deli / Delimax)Gt Delimax=0.7 in order to avoid numerical instabilities. The damage function Deli enables us to implement an erosion model independent of mesh size. In fact the element is eliminated only when the deformation energy of the element is equal to the energy needed to crack the element surface (Deli =1). The model of erosion was implemented using several Fortran Routines in a commercial FEM code (MSC-DYTRAN). The flow diagram of the model is illustrated in Figure 5.
4 MAIN RESULTS OF THE NUMERICAL SIMULATIONS
As mentioned above, the erosion rate depends on the fraction of the particle kinetic energy adsorbed by the target as plastic deformation energy. Figure 6 shows the diagrams of the velocity absolute value versus time for three different impact velocity. This figure corresponds to the target simulated as elastic perfectly plastic .
I=σx+σy+σz
I > 0
The element is verified for the erosion
increment ofdeformation energy
increment of the fracturated
∆E
∆E
current damaged fraction
fre
current eroded mass
V
eli
>Nel
START
END
volume of the element
of the element
el
i
target erosion at the step i V
target erosion rate V
Vel element volume
fractured volume at the i-1 time step
tΣρ
M
number of particles
mass of a particlep
n p
Σ (i
Σρel t
no ∆ t
el
The element is removed from the mesh
N
ρt
BM
i-1frV
=
=i
Gtel
teli
D-(1
(1 D-
yes
=Deli
ielD
(∆ Vi
loop on all the time steps
deformation energy of element at the previous
time step
E fracture energy per unit volume fr ∆Vfre=
i
∆E =e
i
Ei-1
e
elD
) /n MiDel el
yes
p
>T
el
p
element volume
t
el
yes
i
no
Del eli
ρ
V
i-1tel
BM
elmax
elmaxi/D
D/ i
no
)
)G
)/
= 1
V+ fri-1
frE
i-1tel
density
The element is skipped
The element is skipped
frei E/
yes
i-1
>0e
i
-Ee
iEe
no
yes
σeq≥σy
εeq≥ε fr
no
The element is skipped
no
yes
loop on all the element
Figure 4: Flow diagram of the erosion model implemented in a FEM code
elastic-perfectly plastic material
0
50
100
150
200
250
0 0.02 0.04 0.06 0.08 0.1
time (microsec)
velo
city
(m
/s)
v=100 m/sv=150 m/sv=200 m/s
elastic-perfectly plastic material
0
5
10
15
20
25
30
35
40
45
50
0 2 4 6 8 10
impactab
sorb
ed e
ner
gy
(%)
v=100 m/s
v=150 m/s
v=200 m/s
0
1
2
3
4
5
6
7
8
9
0 2 4 6 8 10
Number of impact
ero
sio
n r
ate
(mg
/g)
v=200 m/s v=150 m/s v=100 m/s
Figure 5: Absolute value of the particle velocity during the impact
Figure 6: Percentage of the kinetic energy of the particle absorbed by the target
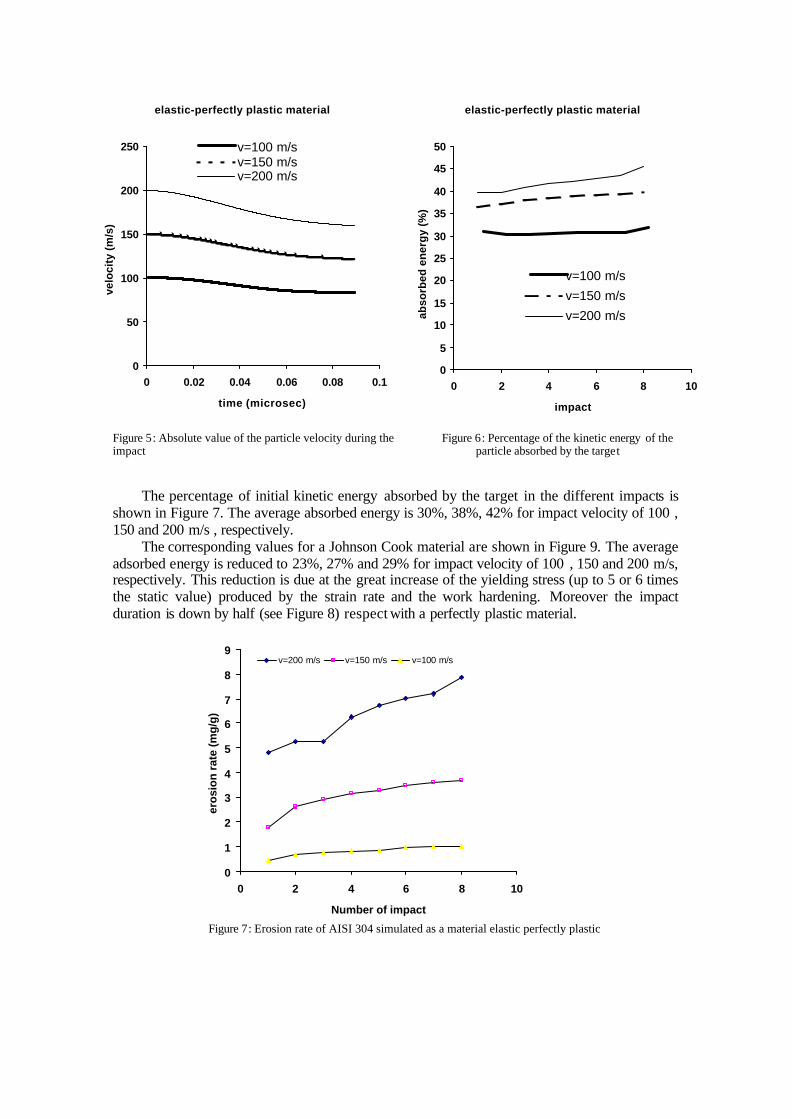
The percentage of initial kinetic energy absorbed by the target in the different impacts is shown in Figure 7. The average absorbed energy is 30%, 38%, 42% for impact velocity of 100 , 150 and 200 m/s , respectively.
The corresponding values for a Johnson Cook material are shown in Figure 9. The average adsorbed energy is reduced to 23%, 27% and 29% for impact velocity of 100 , 150 and 200 m/s, respectively. This reduction is due at the great increase of the yielding stress (up to 5 or 6 times the static value) produced by the strain rate and the work hardening. Moreover the impact duration is down by half (see Figure 8) respect with a perfectly plastic material.
Figure 7: Erosion rate of AISI 304 simulated as a material elastic perfectly plastic

Johnson-Cook material
0
50
100
150
200
250
0 0.02 0.04 0.06 0.08 0.1
time (microsec)
velo
city
(m
/s)
v=100 m/s
v=150 m/s
200 m/s
Johnson-Cook material
0
5
10
15
20
25
30
35
0 2 4 6 8 10
impact
abso
rbed
en
erg
y (%
)
v=100 m/s
v=150 m/s
v=200 m/s
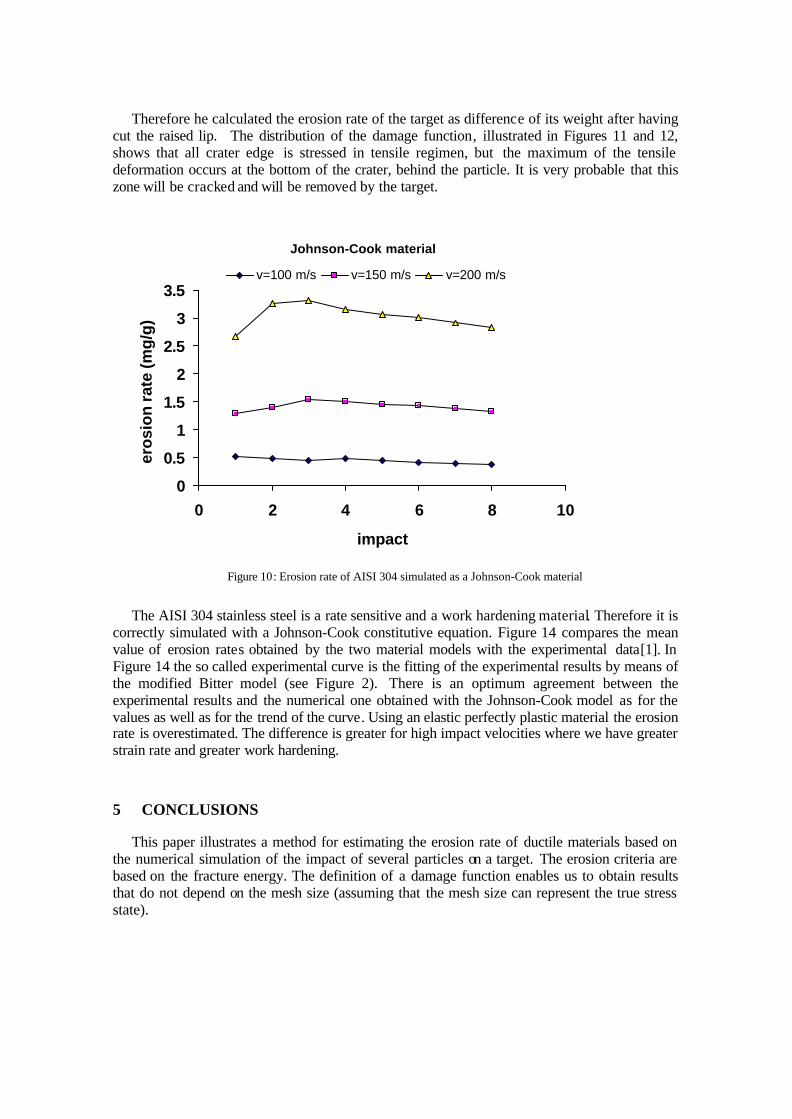
The AISI 304 erosion rates mobile mean versus the particle impacts is shown in Figures 7 and 10 for the perfectly plastic and the Johnson-Cook material, respectively. We can see the great difference between the values of erosion rate for the two differently simulated materials.
For the different impact velocit ies and after 8 impacts of particles, the mean value of the erosion rate is the following: perfectly plastic material Johnson-Cook material V=100 m/s 1.02 mg/g 0.37 mg/g V=150 m/s 3.68 mg/g 1.32 mg/g V=200 m/s 7.9 mg/g 2.82 mg/g
The erosion rates of the perfectly plastic material are about 2.8 greater than those of Johnson-Cook material. The different behavior is also shown by the Figures 11 and 12 which illustrate the distribution of the damage function in correspondence of the impacted zone. These figures report also the deformed of the target at the final instant of the examined transients. The material simulated as perfectly plastic presents a greater cavity produced by the particles. The extension of the damaged zone is greater for the perfectly plastic material but the maximum values of the damage function are obtained for the Johnson Cook material.
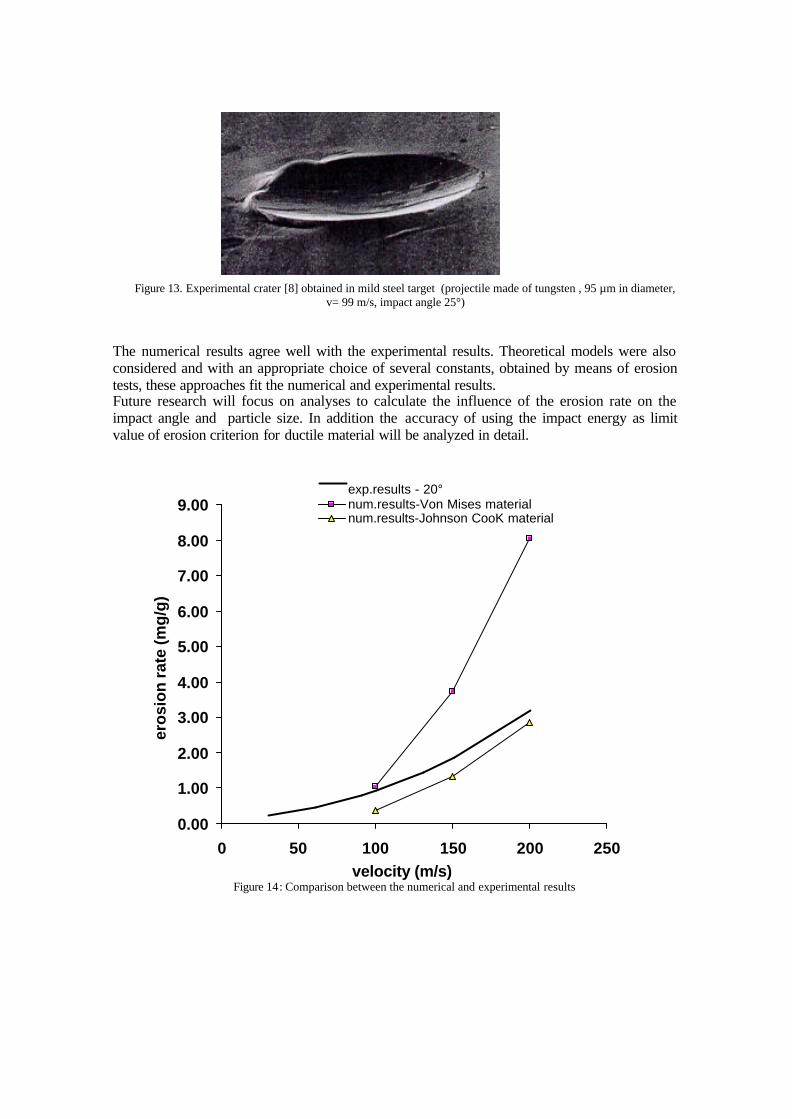
The Figures 11 and 12 show also the main characteristics of the crater produced by the particles and the points in which the erosion will develop. A raised lip forms in front of the particle during the impact and the crater looks like an ellipse. The boundary of the crater , behind the particle, has a sharp edge. This numerical results agree perfectly with the experimental crater obtained by Hutchings [8] and shown in Figure 13. Hutchings assumes that the raised lip is the part which is eroded by the target by means of a forging action due to the following impacts. Moreover he observed in other tests that the lip was cracked and forged like a platelet
Figure 8: Absolute value of the particle velocity during the impact
Figure 9: Percentage of the kinetic energy of the particle absorbed by the target
Johnson-Cook material
0
0.5
1
1.5
2
2.5
3
3.5
0 2 4 6 8 10
impact
ero
sio
n r
ate
(mg
/g)
v=100 m/s v=150 m/s v=200 m/s
Therefore he calculated the erosion rate of the target as difference of its weight after having cut the raised lip. The distribution of the damage function, illustrated in Figures 11 and 12, shows that all crater edge is stressed in tensile regimen, but the maximum of the tensile deformation occurs at the bottom of the crater, behind the particle. It is very probable that this zone will be cracked and will be removed by the target.
Figure 10: Erosion rate of AISI 304 simulated as a Johnson-Cook material
The AISI 304 stainless steel is a rate sensitive and a work hardening material. Therefore it is
correctly simulated with a Johnson-Cook constitutive equation. Figure 14 compares the mean value of erosion rates obtained by the two material models with the experimental data[1]. In Figure 14 the so called experimental curve is the fitting of the experimental results by means of the modified Bitter model (see Figure 2). There is an optimum agreement between the experimental results and the numerical one obtained with the Johnson-Cook model as for the values as well as for the trend of the curve. Using an elastic perfectly plastic material the erosion rate is overestimated. The difference is greater for high impact velocities where we have greater strain rate and greater work hardening.
5 CONCLUSIONS
This paper illustrates a method for estimating the erosion rate of ductile materials based on the numerical simulation of the impact of several particles on a target. The erosion criteria are based on the fracture energy. The definition of a damage function enables us to obtain results that do not depend on the mesh size (assuming that the mesh size can represent the true stress state).
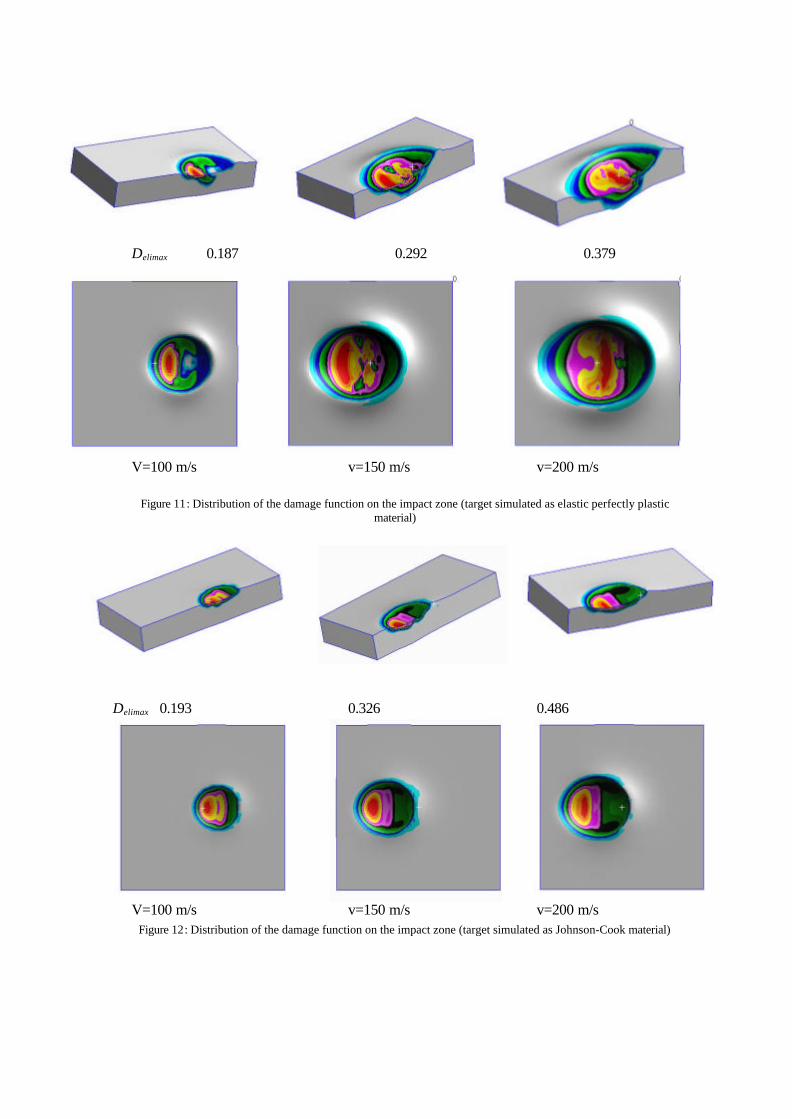
Delimax 0.187 0.292 0.379
V=100 m/s v=150 m/s v=200 m/s
Figure 11: Distribution of the damage function on the impact zone (target simulated as elastic perfectly plastic material)
Delimax 0.193 0.326 0.486
V=100 m/s v=150 m/s v=200 m/s Figure 12: Distribution of the damage function on the impact zone (target simulated as Johnson-Cook material)
0.00
1.00
2.00
3.00
4.00
5.00
6.00
7.00
8.00
9.00
0 50 100 150 200 250velocity (m/s)
ero
sio
n r
ate
(mg
/g)
exp.results - 20°num.results-Von Mises materialnum.results-Johnson CooK material
Figure 13. Experimental crater [8] obtained in mild steel target (projectile made of tungsten , 95 µm in diameter, v= 99 m/s, impact angle 25°)
The numerical results agree well with the experimental results. Theoretical models were also considered and with an appropriate choice of several constants, obtained by means of erosion tests, these approaches fit the numerical and experimental results. Future research will focus on analyses to calculate the influence of the erosion rate on the impact angle and particle size. In addition the accuracy of using the impact energy as limit value of erosion criterion for ductile material will be analyzed in detail.
Figure 14: Comparison between the numerical and experimental results
References [1] Levy A.V. Solid Particle Erosion and Erosion Corrosion of Materials ASM Int. 1997
[2] I. Finnie, J. Wolak, Y.Kabil, ‘, Erosion of metals by solid particles’ J. Mater. Vol 2,1967 682-700
[3] Bitter J.G.A. A study of erosion phenomena : Part I Wear 6 (1963) 5-21; Part II Wear 6 (1963) 169-190
[4] D.Aquaro, E.Fontani, Erosion of ductile and brittle materials: comparison between theoretical and numerical models and experimental data, 2000 AIMETA International Tribology Conference, 20-22 September 2000, Aquila, Italy
[5] D.Aquaro, E.Fontani, Erosion of ductile and brittle materials Meccanica 36 (2001) 651-661
[6] W. Goldsmith ‘ Impact- the theory and physical behavior of colliding solids’ – Edward Arnold – Publ.- London 1960
[7]B.F.Levin, K.S.Vecchio, J.N. DuPont, A.R. Marder ‘Modelling solid particle erosion of ductile alloys’ Metallurgical and Mat. Trans. Vol.30A, (1999) 1763-1774
[8]I.M. Hutchings, R.E.Winter,J.E.Field Solid particle erosion of metals: the removal of surface material by spherical projectiles’ Proc. R.Soc. Lond. A.348, (1976) 379-392
Related Documents