CSIR COLLEGE OF SCIENCE AND TECHNOLOGY USE OF IMPROVED SUN AND SOLAR DRYING METHODS TO PRODUCE DRIED ANCHOVIES (Engraulis encrasicolus) AND ATLANTIC BUMPER FISH (Chloroscombrus chrysurus) POWDER AND INCORPORATE THEM INTO NEW FOOD FORMULATIONS ERNESTINA ASANTEWAA AYEH 2021

Welcome message from author
This document is posted to help you gain knowledge. Please leave a comment to let me know what you think about it! Share it to your friends and learn new things together.
Transcript
CSIR COLLEGE OF SCIENCE AND TECHNOLOGY
USE OF IMPROVED SUN AND SOLAR DRYING METHODS TO
PRODUCE DRIED ANCHOVIES (Engraulis encrasicolus) AND
ATLANTIC BUMPER FISH (Chloroscombrus chrysurus) POWDER AND
INCORPORATE THEM INTO NEW FOOD FORMULATIONS
ERNESTINA ASANTEWAA AYEH
2021

© Ernestina Asantewaa Ayeh
CSIR College of Science and Technology

CSIR COLLEGE OF SCIENCE AND TECHNOLOGY
USE OF IMPROVED SUN AND SOLAR DRYING METHODS TO
PRODUCE DRIED ANCHOVIES (Engraulis encrasicolus) AND
ATLANTIC BUMPER FISH (Chloroscombrus chrysurus) POWDER AND
INCORPORATE THEM INTO NEW FOOD FORMULATIONS
BY
ERNESTINA ASANTEWAA AYEH
Thesis submitted to the Department of Agro-processing Technology and Food
Biosciences of the CSIR College of Science and Technology, in partial
fulfilment of the requirements for the award of Master of Philosophy degree in
Food Science and Technology
AUGUST 2021

ii
DECLARATION
Candidate’s Declaration
I hereby declare that this thesis is the result of my own original research and
that no part of it has been presented for another degree in this College or
elsewhere.
Candidate’s Signature ………………………………..Date……………………
Name: Ernestina Asantewaa Ayeh
Supervisors’ Declaration
We hereby declare that the preparation and presentation of the thesis were
supervised in accordance with the guidelines on supervision of the thesis laid
down by CSIR College of Science and Technology.
Principal Supervisor’s Signature………………………Date…………………..
Name: Prof. Paa-Nii T. Johnson
Co-Supervisor’s Signature…………………………Date…………………….
Name: Prof. Wisdom Kofi Amoa-Awua
iii
ABSTRACT
Open sun drying remains one of the cheapest and predominant
methods of fish processing in Ghana. However, this method has always had
challenges with contaminations from dust particles, blowflies as well as major
postharvest losses. The aim of the study was therefore to use improved sun-
drying and solar drying methods in the production of dried anchovies and
Atlantic bumper fish powder and incorporate them into new food
formulations. The fish samples were processed using the following: solar
drying and sun drying on the bare ground, raised concrete platform (RCP) and
raised concrete platform with netted drying racks (RCP+NDR). The samples
were analysed for their microbiological and nutritional qualities. Consumer
acceptability was also performed on fish fortified biscuit and instant cereal
mix produced from the fish powder. Samples dried in the solar dryer had the
fastest drying rate, lowest moisture content thereby the highest concentration
of nutrients (p<0.05). Microbial quality of solar and RCP+NDR dried fish
samples were comparable. Aerobic mesophilic count of the bare ground dried
fish samples was the highest amongst all the samples with 5.89 log10 CFU/g
for anchovies and 5.70 log10 CFU/g for Atlantic bumper fish. RCP+NDR dried
fish samples proved to have better safety qualities than those sampled from the
processing sites. Consumer acceptability of fish fortified biscuit and instant
cereal mix showed that products with lower fish concentrations (5 % and 3 %
fish powder respectively) were preferred. Traditional bare ground method of
drying fish should be replaced with RCP+NDR since it produces safer
products which meet regulatory requirements and have better nutritional and
organoleptic qualities comparable to the solar dried fish.

iv
KEY WORDS
Anchovy
Atlantic bumper fish
Dried fish fortified cereal products
Drying curve
Solar drying
Sun drying
v
ACKNOWLEGDEMENTS
This work was facilitated by CSIR-Food Research Institute under the
Institute’s donor funded project; ‘Small Fish and Food Security: Towards
innovative integration of fish in African food systems to improve nutrition”
(SmallFishFood) project. It was funded by LEAP AGRI, a joint Europe Africa
research and innovation initiative related to food and nutrition security and
sustainable agriculture through Research Council of Norway and the Federal
Ministry of Food and Agriculture (BMEL) based on a decision of the
Parliament of the Federal Republic of Germany via the Federal Office for
Agriculture and Food (BLE).
My sincere gratitude goes to Mrs. Amy Atter (Principal investigator)
and the project team for giving me the opportunity to an aspect of this project
as my thesis work. I greatly appreciate my supervisors Prof. Paa-Nii T.
Johnson and Prof. Wisdom Kofi Amoa-Awua for their time, patience and
investment for the fruition of this thesis.
Also, I am deeply grateful for the support shown me by Richard
Asante (my husband), Naomi Asante (my selfless sister-in-law) and Dr.
Bernard Tawiah Odai (Ghana Atomic Energy Commission) for contributing
immensely to the success of my academic journey.
Lastly, to my colleague Evans Rockson Tawiah (FDA) and to all the
staff of the Chemistry department, Microbiology and the Test Kitchen all of
CSIR-FRI, I say a big thank you.

vi
DEDICATION
To my family and loved ones

vii
TABLE OF CONTENTS
Page
DECLARATION ii
ABSTRACT iii
KEY WORDS iv
ACKNOWLEDGEMENTS v
DEDICATION vi
LIST OF TABLES xi
LIST OF FIGURES xiii
LIST OF ACRONYMS xv
LIST OF APPENDICES xvi
CHAPTERS ONE: INTRODUCTION 1
Background to the Study 1
Statement of the Problem 4
Purpose of the Study 5
Research Objectives 5
Hypothesis 6
Significance of the Study 6
Delimitation 8
Limitations 8
Organisation of the Study 8
CHAPTER TWO: LITERATURE REVIEW 9
Fish Production in Ghana 9
Importance of Small Fish and their Products 11
Fish Microbial Activities/Fish Spoilage Mechanism 15

viii
Traditional Fish Processing Methods 18
Improved Sun-Drying Methods 30
Effect of Drying on Physical, Chemical and Sensory Qualities of Sun-
dried and Solar-dried Fish
33
Principles of Fish Drying 36
Safety of Traditionally Processed Fish 41
Fortification of Ready-to-eat-food Using Fish Powder 43
CHAPTER THREE: MATERIALS AND METHODS 48
Research Design for the Study 48
Sources of Fish Samples 49
Facilities used in Experiment for Drying Fish 51
Description of Procedures used for the Drying of Fish 55
Processing of Dried Fish Samples into Flour 60
Laboratory Analyses on the Fresh and Dried Fish Samples 61
Microbiological Analysis of Fish Samples 69
Food Products Preparation 74
Consumer Acceptability Test 77
Statistical Analysis 78
CHAPTER FOUR: RESULTS 79
Drying Curves of Anchovy Fish Using Three Sun Drying and Solar
Drying Methods
79
Drying Curve of Atlantic Bumper Fish Using Solar Drying and Sun
Drying Methods
82
Proximate Composition of Fresh and Dried Anchovies from the 84

ix
Different Drying Methods
Mineral and Histamine Contents of Fresh and Dried Anchovies from
the Different Drying Methods
86
Proximate Composition of Fresh and Dried Atlantic bumper Fish from
the Different Drying Methods
88
Mineral and Histamine Contents of Fresh and Dried Atlantic Bumper
Fish from the Four Different Drying Methods
90
Proximate Composition of Fresh and Dried anchovies from the Four
Different Processing Sites
92
Minerals and Histamine Contents of Fresh and Dried Anchovies from
the Four Different Processing Sites
95
Proximate Compositions of Fresh and Dried Atlantic Bumper fish from
the Four Different Processing Sites
97
Mineral and Histamine Contents of Fresh and Dried Atlantic Bumper
Fish from the Four Different Processing Sites
99
Microbial Counts of Fresh and Dried Fish (Anchovy and Atlantic
bumper fish) from the Four Different Drying Methods
101
Microbial Quality of Fresh and Dried Anchovy from the Four Different
Processing Sites
105
Microbial Quality of Fresh and Dried Atlantic Bumper Fish from the
Four Different Processing Sites
109
Consumer Acceptability of Biscuit Prepared from Fish Powder 113
Consumer Acceptability of Instant Cereal Mix Prepared from Fish
Powder
115
CHAPTER FIVE: DISCUSSION 117

x
Drying Curves of Anchovy and Atlantic Bumper Fish During the
Drying Process
117
Nutrient Composition of Fresh and Dried Anchovies from the Different
Drying Methods
120
Nutrient Composition of Fish (Anchovies and Atlantic Bumper Fish)
from Improved Drying Method (RCP+NDR) Compared to the
Traditional Sun Drying Method
123
Microbial Counts of Fresh and Dried Fish (Anchovy and Atlantic
Bumper Fish) from the Four Different Drying Methods
125
Microbial Quality of Fresh and Dried Fish (Anchovies and Atlantic
Bumper Fish) from the Four Different Processing Sites
128
Consumer Acceptability of Biscuit Prepared from Fish Powder 131
Consumer Acceptability of Instant Cereal Mix Prepared from Fish
Powder
133
CHAPTER SIX: SUMMARY, CONCLUSIONS AND
RECOMMENDATIONS
135
Summary 135
Conclusions 136
Recommendations 137
REFERENCES 139
APPENDICES 171

xi
LIST OF TABLES
Table Page
1 Flour Proportions for Biscuit Preparation 75
2 Mixture Formulations for Instant Cereal Mix 76
3
Proximate Composition on Dry Weight basis of Fresh and
Dried Anchovies after Drying for 20 h
85
4
Mineral and Histamine Contents of Fresh and Dried
Anchovies after Drying for 20 h
87
5
Proximate Compositions of Fresh and Dried Atlantic Bumper
Fish after Drying for 20 h
89
6
Mineral and Histamine Contents of Atlantic Bumper Fish after
Drying for 20 h
91
7
Proximate Composition of Fresh and Dried Anchovies from
the Four Different Processing Sites
94
8
Minerals and Histamine Contents of Fresh and Dried
Anchovies from the Four Different Processing Sites
96
9
Proximate Compositions of Fresh and Dried Atlantic Bumper
Fish from the Four Different Processing Sites
98
10
Mineral and Histamine Contents of Atlantic bumper Fish from
the Four Different Processing Sites
100
11
Microbial Quality (log10 CFU/g) of Fresh and Dried
Anchovies from the Four Different Drying Methods
102
12
Microbial Quality (log10 CFU/g) of Fresh and Dried Atlantic
Bumper Fish from the Four Different Drying Methods
104
13 Microbial Quality (log10 CFU/g) of Fresh and Dried 106
xii
Anchovies from the Four Different Processing Sites
14
Microbial Quality (log10 CFU/g) of Fresh and Dried
Anchovies from the Four Different Processing Sites
107
15
Microbial Quality (log10 CFU/g) of Fresh and Dried Atlantic
Bumper Fish from the Four Different Processing Sites
110
16
Microbial Quality (log10 CFU/g) of Fresh and Dried Atlantic
Bumper Fish from the four Different Processing Sites
112
17
Consumer Acceptability Results of Biscuit Prepared from Fish
Powder
114
18
Consumer Acceptability Results of Instant Cereal Mix
Prepared from Fish Powder
116

xiii
LIST OF FIGURES
Figure Page
1 Drying of fish in open sun 28
2 Packaging and storage of fish 29
3 Fish samples 50
4
Isometric drawing of the raised concrete platform with netted
drying racks
53
5
Isometric drawing of the Hohenheim Solar Tunnel Dryer used
for the study
54
6 The raised concrete platform with netted drying rack 55
7 Drying of fish on the bare ground 56
8
Flow diagram showing the process of traditional sun-drying of
fish
57
9 Drying fish on raised concrete platforms 58
10 Drying on the raised concrete platform with netted drying racks 59
11 Drying fish in the Hohenheim Solar Tunnel Dryer 60
12 Fish flour samples in sealed in polythene bags 61
13
Drying curves of anchovies using the three sun-drying methods:
Bare Ground, RCP and RCP+NDR as well as the recorded
ambient temperature during the drying process
80
14
Drying curve of Anchovies in the Solar-dryer and ambient
temperature
80
15
Drying curves of Atlantic bumper fish using the three sun-
drying
methods: Bare Ground, RCP and RCP+NDR as well as
83

xiv
recorded ambient temperature during the drying process
16
Drying curve of Atlantic bumper fish in the Solar-dryer and
ambient temperature inside the dryer
83
17 Fortified biscuits products prepared from fish powder 113
18
Anchovy fortified instant cereal mix (A) and Bumper fish
fortified biscuit (B) prepared from fish powder
115

xv
LIST OF ACRONYMS
CSIR - Council for Scientific and Industrial Research
FAO -Food and Agriculture Organisation
FPP - Fish Protein Powder
FRI - Food Research Institute
GSA - Ghana Standards Authority
ICMSF - International Commission on Microbiological Specifications
for Foods
RCP - Raised Concrete Platform
RCP+NDR - Raised Concrete Platform with Netted Drying Racks

xvi
LIST OF APPENDICES
Appendix Page
1
Study Questionnaire on Consumer Acceptability of Fish
Fortified Biscuit
171
2 Consumer Acceptability Test (Fish-Rice Instant Mix) 173
3 ANOVA Tables 176
4
3D Impression of raised Concrete Platform with Netted
Drying Racks
205
1
CHAPTER ONE
INTRODUCTION
This chapter introduces the study by giving the background
information of the research, statement of the problem, hypothesis and
justification of research. It also provides the objectives of the study,
delimitations and limitations as well as the organization of the entire study.
Background to the Study
In recent years, demand for fish and seafood products has steadily
increased because fish is now accepted as a major animal protein in many
parts of the world. This development may be due to the greater understanding
of the unique qualities of fish nutrients by consumers. It has been estimated
that fish supplies 16 % of the total animal protein consumed worldwide (Food
and Agricultural Organisation [FAO], 2018). This is especially the case in
countries with low wages since it is more affordable compared to beef. In
Ghana, fish contributes 60-70 % of the animal protein consumed. Total annual
requirement for fish for the country is estimated at 880,000 metric tons
(Frimpong & Adwani, 2015). Many studies have highlighted its nutritional
properties, showing that apart from its rich protein content, fish contains
essential micro-nutrients such as riboflavin, iron, calcium and fatty acids
(omega-3) , which are essential for human health, especially during childhood
(FAO).
Fresh fish is highly susceptible to spoilage since it contains up to 80 %
water (Reza, Azimiddin, Islam, & Kamal, 2006). The main causes for rapid
fish spoilage are the autolytic and microbial processes, which are initiated

2
immediately after the death of the fish, as well as during processing and
sometimes storage (Anihouvi, Kindossi, & Hounhouigan, 2012). Fish is also
often the source of food poisoning because of the presence of food poisoning
microorganisms such as Clostridium botulinum, Escherichia coli, Salmonella,
Staphylococcus aureus, Vibro species and Bacillus cereus (Saritha,
Immaculate, Aiyamperumal, & Patterson, 2012). Processing of fresh fish into
stable and safe products is therefore important to enhance quality and shelf-
life.
Fishing and fish processing (mainly smoking and drying) are the most
common means of livelihood in coastal towns in Ghana. Fish, depending on
the species, is either smoked, fried, fermented or sundried in the open for the
improvement of its sensory quality and preservation. Anchovy (Engraulis
encrasicolus) is one of the pelagic fishes mostly sun-dried or smoked in these
areas. Open air sun-drying is a highly economical traditional method of
processing and preserving foods in Ghana. However, it is largely carried out
under unhygienic conditions exposing the food to dust, flies, rodents, and
adverse weather conditions. This also facilitates microbial contamination of
the food thus compromising the quality and safety of the food; subsequently
leading to losses and health risks. (Akinola & Bolaji, 2006; Alonzo & Alexie,
2015).
Globally, the loss of fish caught due to poor handling, processing, and
distribution has been estimated at 10 % by Davies and Davies (2009).
However, losses during small-scale fish processing are said to be particularly
high and figures as high as 40 % are sometimes reported. This waste also
translates into huge financial losses and reduction in the quantity of available
3
fish supplied for human consumption, thereby threatening food security
(Akintola & Fakoya, 2017).
The drying operation, even though a very ancient practice for food
preservation, presently continues to be an important industrial process of
treatment for diversified food products. Much innovation and technological
advancements have led to better drying processes, which are more efficient
and allow a better preservation of the organoleptic and nutritional qualities
(Guine, 2018). In view of this, some countries have developed inexpensive
and user-friendly improved platforms and racks for sun drying of fish. This
helps to reduce microbial contamination to a minimum by providing a
covering for the fish against flies, dust etc. and reduce human contact during
drying. Overall, small fishes are rich in micronutrients and its frequent
consumption in everyday diets, contributes to the intake of multiple
micronutrients and proteins from a meal (Abbey, Glover-Amengor, Atikpo,
Atter, & Toppe, 2017).
The Ghanaian diet largely consists of starchy staple foods like cassava,
yams, bananas and cereals (rice, maize, millet, sorghum), with fish being
central in the local cuisine serving as a complementary addition (Nti, 2008;
FAO, 2010; Kawarazuka & Béné, 2011; Weichselbaum, Coe, Buttriss, &
Stanner, 2013). There is however an increasing shift towards quality and safe
ready- to -eat snacks or convenience foods (Staatz & Hollinger, 2016). The
incorporation of fish powder as a form of fortifying snacks such as biscuits,
waffles and instant cereal mix for infants can therefore be exploited. This will
go a long way to reduce micronutrient deficiency that persist amongst the

4
population especially amongst children under five years and pregnant women
(Hasselberg et al., 2020b).
Statement of the Problem
Sun-drying remains one of the ancient and predominant methods of
fish processing in Ghana. The availability of the sun’s energy for food
processing makes this method one of the cheapest. Sun -drying processing of
fish thereby serves as a means of livelihood for many processors in Sub-
Saharan Africa. However, the traditional open air-drying method of processing
mainly involves drying the fish on the bare ground. This exposes the fish to
flies, dust, rodents and other agents which serve as a conduit for microbial
contamination. The contamination may not be limited to spoilage
microorganisms, but to growth and multiplication of pathogenic bacteria,
which raises concerns about the safety and quality of sun-dried fish. This is
particularly important since subsequent processing may not eliminate such
microbial hazard. In addition, whilst being dried using the traditional method,
fish is exposed to adverse weather conditions and this leads to huge revenue
losses to the fish processors, who happen to be mostly women.
Even though solar drying has been proven to produce safer and better
quality dried fish, the cost of construction may not be affordable to low
income fish processers, as research has shown. This has resulted in the
continual usage of the traditional sun-drying processing. A research by Sankat
and Mujiaffar (2004) showed that some limitations of sun-drying can be
eliminated or reduced by raising the drying fish rack off the ground on
wooden frames. This allows air to circulate in all directions, thus facilitating
5
water evaporation from both sides and reducing contamination from dust.
However, there is limited information of such approaches being used for fish
processing in Ghana. There is therefore the need to investigate an alternative
means of processing fish by sun drying with improved, cost effective and user
friendly technologies.
Low value/ underutilized fishes (especially small pelagic fishes) are
usually used for fish meal production to feed livestock. They are also used in
some indigenous foods. With the increasing demand for convenience foods
cutting across income groups, these low value/underutilised fishes may be
converted to highly valuable products that are rich in micronutrients (Arason,
Shaviklo, Thorkelsson, Sveinsdottir, & Rafipour, 2011b; Shaviklo, 2016).
However, despite widespread recognition of their nutritional values, few
examples exist on the use of dried fishes and their powders in food product
development.
Purpose of the Study
The objective of the study was to use improved sun-drying and solar drying
methods in the production of dried anchovies (Engraulis encrasicolus) and
Atlantic bumper fish (Chloroscombrus chrysurus) powder and incorporate
them into new food formulations.
Research Objectives
1. To compare the effects of the use of solar- drying and two improved
sun-drying methods (raised concrete platform and netted racks) on the
proximate composition of dried anchovies and Atlantic bumper fish.

6
2. To assess the effect of solar-drying and the two improved sun-drying
methods on the microbiological safety of dried anchovies and Atlantic
bumper fish.
3. To develop new food formulations using dried anchovies and Atlantic
bumper fish powder and assess their consumer acceptability.
Hypothesis
Ha: Improved sun- drying method of fish, using netted drying racks on
raised concrete platform, would produce better quality and safer dried fish
than open-air sun-drying method, but comparable to those by solar drying
method.
Ho: Improved sun drying of fish, using netted drying racks on raised
concrete platform, would produce fish of the same quality and safety as that of
the open-air sun-drying method and will not be comparable to those from
solar-drying.
Significance of the Study
Sun- drying processing of fish aids in reducing postharvest losses of
fish and serves as a means of livelihood for most of the processors. However,
the traditional rudimentary processing method involving the use of traditional
open sun-drying has not received much improvement over the years. This
improvement include reducing the exposure of fish being dried to dust, flies,
adverse weather condition and other agents of contamination. Several studies
carried out on the use of solar dryers have shown that it is the best method for
preventing microbial and other forms of contamination during the drying of
7
fish. Due to the design of the solar dryer, drying parameters such as
temperature (normally 60 oC), relative humidity and air speed are more
controlled resulting in products with lower water activity. This ensures that
certain microorganisms do not grow and multiply on the fish. Further, other
enzymatic processes do not occur making the fish dried by solar assuredly
safer than those by sun-drying (Banda et al., 2017). Notwithstanding,
construction of a long-lasting solar dryer comes at a cost which may not be
affordable for low-income fish processers (Chiwaula, Kawiya, & Kambewa,
2020).
This study is therefore aimed at developing fairly inexpensive and
user-friendly raised concrete platforms, with netted drying racks, for sun-
drying of fish, which will reduce drudgery associated with traditional sun-
drying and also postharvest losses. In addition, microbial and physical
contamination as a result of processing will be reduced since fish is protected
because of less human contact during processing. This will go a long way to
produce safer and better quality sun dried fish comparable to those of the solar
dried fish. Also, the growing consumer demand for convenience foods
including snacks can be exploited by developing nutritious and healthy snack
fortified with fish powder produced from underutilized small fishes.
Increasing the protein content of snack foods may further improve their
consumer appeal and acceptance. The development of ready-to-eat snack such
as waffles and biscuits with small pelagic fishes will diversify the usage and
also maximize their utilization. This could lead to the provision of ready
market for sun dried fish and lead to the strengthening of food security and
sustainable livelihoods among fish processors and consumers in Ghana.
8
Delimitation
Although there are various methods of fish processing, this research
was focused on using an improved sun-drying method that incorporated netted
drying racks on raised concrete platform to improve the open-air sun drying of
fish.
Limitations
The outcome of the drying processing is highly dependent on the use
of two small fishes, anchovies and Atlantic bumper for the research and may
require several varieties of fish species to be used before results are
generalized. Also, consumer acceptability outcome of products is subject to
the discretion of the panellist, therefore the need to replicate in larger sample
size to increase the generalization of the results.
Organisation of the Study
The study is presented in six chapters. Chapter one provides
information on the background of the study, statement of problem, hypothesis,
justification of research, including objectives of the study, delimitations and
limitations of the study, and the organization of the study. An in-depth review
of relevant literature to the subject area is presented in chapter two. The third
chapter gives details of the methods used in achieving the study objectives.
The results of the study and the discussion of the results are provided in
chapters four and five, respectively. The last chapter, chapter six, summarizes
the entire study, draws conclusions from the results and gives
recommendations based on the findings of the study.

9
CHAPTER TWO
LITERATURE REVIEW
In this chapter, relevant literature pertaining to the thesis was reviewed.
Topics that were reviewed in relation to the thesis include: fish production in
Ghana and its importance, drying methods for harvested fish and the principles
behind them. In addition, the effect of the drying methods on the nutritional,
microbial and the drying rate of fish were also presented. Finally, information
on the use of fish in food fortification to meet the nutritional needs of
consumers was also presented.
Fish Production in Ghana
The most preferred source of animal protein in Ghana is fish,
accounting for about 60 % of animal protein intake. Ghana has a high per
capita consumption of fish estimated at 25 kg compared to world average of
16 kg per capita per annum for the period 2009- 2011. About 75 % of the total
domestic production of fish is consumed locally (Visciano, Schirone, Tofalo,
& Suzzi, 2012). The marine fisheries sector in Ghana is composed of four
main fishing subsectors: artisanal fisheries, inshore fisheries, industrial trawl
fisheries and tuna or large pelagic fisheries. The artisanal fisheries subsector is
the most important with respect to landed weight of fish, contributing about
60- 70 % of total annual marine fish output. Small pelagic fish species such as
round sardinella, flat sardinella, mackerel (horse mackerel, chub mackerel),
and anchovies, represent over 80 % of the total small pelagic fish stocks in
Ghana. The fisheries sector plays an important role in its contribution to the
nation's gross domestic product (GDP), accounting for about 5 % of the

10
agricultural GDP, with total earnings of approximately 62 million US Dollars
in 2010 from fish and fishery products (Antwi-Asare & Abbey, 2011; Dovlo,
Amador, & Nkrumah, 2016).
The sector’s performance is critical for economic growth, food
security, poverty reduction and sustainability of the coastal communities since
it employs about 107,518 fishermen and 4,241 fish processors which are
mostly women. The returns accruing to artisanal fisheries are affected by
several factors including limited value addition and consequent post-harvest
losses, weak backward-forward market linkages, poor infrastructure, low
bargaining power, as well as low and lack of variety of catch (Quagrainie,
2019).
Traditionally, about 60 % of fish in Ghana is smoked, 10 % is sundried
or salted using traditional methods and the rest fried, grilled or steamed or sold
as fresh fish in the open market. Other than for human consumption, some fish
such as anchovy and tuna officially are used for fish meal (Visciano et al.,
2012). The artisanal sector employs 80 % of Ghanaian fishers. Although, it is
typically men, women play an important role in artisanal fisheries, being
almost solely responsible for selling the fish in markets (Akrofi, 2002). They
control the marketing, dominate the processing and distribution of fresh fish
and even contribute to the acquisition of new fishing nets and canoes (Nunoo,
Asiedu, & Kombat, 2015). An informal but strong institutional framework
governs artisanal fisheries at the village level (Bennett, 2000; Bailey et al.,
2010).

11
Importance of Small Fish and their Products
The marine fish resources of Ghana are usually grouped as small
pelagics; large pelagics; demersal; mollusc and crustaceans. The small
pelagics cover a wide range of species and are the most abundant marine
resources in Ghanaian waters. Four species that are of economic importance
are the round sardinella (Sardinella aurita), flat sardinella (S. maderensis),
chub mackerel (Scomber japonicus) and anchovy (Engraulis encrasicolus)
also known as ‘abobi or amoni’ (Ewe) or ‘keta school boys’ (Ga). The large
pelagics are mainly tunas. However, small fish have been categorized as
having been overfished and there have been declining stocks over the past 28
years (Sarpong, Quartey, & Harvey, 2005; Environmental Justice Foundation
[EJF], 2020). Household surveys suggest that small fish, some aquatic
animals and processed fish of low market value play a very important role in
the diet of the poor. Other advantages small fish offer include the following:
1. They can be processed and stored for a long period of time.
2. They are more affordable for the poor and vulnerable groups
particularly in rural and urban areas where limited economic resources
prevent dietary diversity.
3. They can also be purchased in small quantities; and can be more
evenly divided among household members (Kawarazuka & Bene,
2011).
Consuming small- sized fish species whole (with the bones inclusive), head
and viscera contributes significantly to reducing the level of micronutrient and
protein malnutrition, as these parts are where most micronutrients are

12
concentrated. (Thilsted, Roos, & Hassan, 1997; Chamnan et al., 2009; Roos,
2001; Abbey et al., 2017)
Fish in general are a good source of protein containing almost all the
required essential amino acids including the likes of methionine, and cysteine.
Small pelagic fish have a known protein content of about 14 to 22 % of the
live body weight and as such provide very high-quality animal protein
proportional to their muscle biomass. They are particularly high in essential
amino acids. Their lysine content is recorded to be more than 10 % of their
total protein content and this varies depending on the fish species. This makes
fish suitable for complementing the high carbohydrate diets prevailing among
the poorer population in both the developed and developing countries. The
incorporation of even little quantities of this small fishes can significantly
improve the biological value of the diet of young children and lactating
women whose protein requirements are much higher.
Small fishes are more nutritious than big ones because they supply
relatively higher amounts of minerals per unit weight given that they are often
consumed whole with bones and everything, providing exceptional quantities
of calcium and other minerals (Thilsted & Roos, 1990). Vitamins A, B1, B2
and B3, D and E are also present in substantial quantities in small fish.
Generally, vitamin A from fish sources are much higher and more readily
accessible to the body compared to that from plant sources. Again, it has been
discovered that the vitamin A content of some small fish is twice as high as
the content of carrot or spinach. Thus, the frequent consumption of small fish
in the absence of vegetables especially among poor rural families, can help
meet their daily requirements (Roos, 2001; Chamnan et al., 2009). In a study

13
by Roos, Chamnan, and Loeung (2007), it was discovered that daily intake of
small fish contributed to about 40 % of one’s daily vitamin A requirement as
well as 31 % of that of calcium at household levels.
Small and fatty pelagic fish like small tuna, mackerel and sardines
contain incomparable components for the diets of pregnant and lactating
women, since they are the richest source of the fat necessary for the correct
development of the brain in unborn babies and infants (Lymer, Funge-Smith,
Clausen, & Miao, 2008).
Locally available fish have often been utilised as an ingredient in
complementary feeding for infants in some developing countries where under
nutrition is a public health concern. A study in Ghana on the nutritional role of
local fish in complementary food established that, fish powder from smoked
anchovies mixed with local fermented maize porridge supported growth of
infants to the same extent as a cereal-legume blend with a vitamin- and
mineral-fortified supplement. This indicates the potential role of local fish in
improving infant growth (Lartey, Manu, Brown, Peerson, & Dewey, 1999).
Sardinella and other small pelagics are also widely used in the traditional hot
pepper sauce (shito) popular with students, homes and eating joints in Ghana
(Kawarazuka, 2010). A research in Uganda also reported that dried small fish
used to supplement porridge for undernourished children gave a better
outcome in weight growth and mortality as compared to the diets of imported
skimmed milk used for undernourished children in hospitals. Fish can
therefore be used as an alternative for complementary food for children where
milk is not available or affordable (Greco, Balungi, Amono, & Iriso, 2006).
Small pelagic fish including anchovies also provide significant amount of fatty

14
acids especially the polyunsaturated fatty acids, which includes omega-3 fatty
acids. This lowers blood pressure, reduces the risk of heart disease (Wang et
al., 2006), and possibly improves infant growth and cognitive development
(Koletzko, Cetin, & Brenna, 2007; Tacon & Metian, 2009).
Additionally, fish contains large amounts of haem iron which is
characterized by high bioavailability as opposed to non-haem iron found in
plants. A study conducted in Cambodia found that the serving of sour soup
made with small fish species, supplied an average of 45 % of the daily
requirement of iron in women of childbearing age and 42 % of that in children
(Roos et al., 2007). Small fish are also rich in zinc compared with other
animal-source foods and large fish species. Another survey showed that fish
contribute between 33 to 39 % of the total daily requirement of zinc in
children and women, respectively (Chamnan et al., 2009). Small fish in a
plant-based diet is therefore expected to increase zinc intake considerably and
to compensate for the low bioavailability induced by the phytate of the staple
foods. Overall, all small fish consumed with bones have high calcium content
with a bioavailability comparable to that of milk (Hansen et al., 1998). Some
species however have higher calcium content up to eight times higher than in
milk and can provide for the calcium requirement in populations with low
intakes of milk and milk products (Larsen, Thilsted, & Kongsbak, 2000).
According to a study conducted in Bangladesh, an average daily small fish
consumption of 65 g/person can meet 31 % of the average daily requirement
of calcium in adults (Roos et al., 2007), and 53 % in children (Gibson,
Yeudall, & Drost, 2003; Kawarazuka & Bene, 2011). The fact remains that
small pelagic fish are nutrient dense and can provide an affordable and much

15
needed source of high-quality animal protein and essential amino acids,
omega-3 fatty acids, vitamins, minerals, and trace elements at affordable
prices. This is mostly because the fish is eaten wholly with the head and
bones. It is no doubt that the production and consumption of small fishes can
help contribute significantly to nutritional as well as livelihood of individuals,
particularly people living in the rural areas. It is therefore imperative that more
resources are channelled towards ensuring a more balanced approach for the
sustainable production of small fish.
Fish Microbial Activities/Fish Spoilage Mechanism
Fresh fish after harvest is highly susceptible to spoilage due to high
moisture and nutrients content, making it a good substrate for pathogenic and
spoilage microorganism if not handled appropriately. Due to the high
mesophilic bacteria load on fish harvested in the tropics, it turns to decay
faster if chilling is delayed since temperatures between 35-37 oC are
favourable for their proliferation (Smulders & Collins, 2002). Spoilage of
harvested fish is mainly caused by microbial, metabolic, chemical oxidation of
lipids and biochemical changes (involving enzymatic and oxidative reactions)
(Pal, 2012). The time required for spoilage to commence in a fish may be due
to a number of factors; high moisture content, ambient temperature, the fish
species, unhygienic handling and time, high fat content, high protein content,
the method of capture and weak muscle tissue of the fish. These factors, if not
controlled result in the formation of aldehydes, alcohols, ketones etc., which
are associated with unpleasant odours, texture and off-flavours (Gram &
Dalgaard, 2002). In high temperature zones, spoilage usually starts after 15-20

16
h of capture. At the fish death, there is first a loss of freshness due to autolytic
enzyme activity. This is followed by the movement and spreading of microbes
present in the fish through the muscle fibres leading to spoilage. Spoilage
occurs both in fresh and lightly preserved fish and fish products. The action of
bacteria during the spoilage process degrades available proteins and leads to a
decrease in the nutritional value. Bacterial spoilage in fresh fish can also
produce toxins (eg. histamine) which cause food poisoning.
It is estimated that one-fourth of global food supply and 30 % of the
world’s fish landed is lost through microbial contamination alone (Ghaly,
Dave, Budge, & Brooks, 2010). A prime source of microbial exposure to any
fish is its habitat. Fish microbes can be found both on the outside on the
skin/slime and inside in the gills and the gut. Huss (1995) estimated the total
number of microorganisms that could be found in the guts and the surface of
fish to be between 103-109 CFU/g and 102-107 CFU/g respectively.
Adebayo-Tayo, Onilude, Bukola, Abiodun and Ukpe (2006), reported that the
types of microorganisms found in the intestines of fish are psychotrophs, and
could possibly give an indication of the general contamination in the aquatic
environment. Pseudomonas angulluseptica and Streptococcus spp are among
the identified potentially pathogenic bacterial species likely to be observed in
any fish (Emikpe, Adebisi, & Adedeji, 2011). Other bacteria include
Enterococcus, Shewanella, Escherichia coli, Aeromonas, Listeria,
Alcaligenes, and Enterobacter. Fungi such as the Candida, Rhodotorula
Aspergillus, and Cryptococcus spp. were also identified (Pal, 2012).
According to Gram and Huss (1996), the high composition of non–
protein nitrogen compounds and low acidity (pH> 6) of the flesh of seafoods

17
are the major cause of their spoilage, as these conditions favor the growth of
spoilage microorganisms. These microbes in turn produce metabolites that
affect the organoleptic properties of the products and render them undesirable
attributes. Similarly, autolytic activities by endogenous enzymes of seafoods
also result in products that initially cause lose of the characteristic fresh odour
and taste of fish and then softens the flesh. These changes start short after the
death of fish and progress to produce a number of volatile compounds which
give the products their spoilage characteristics (Mahmud, Abraha,
Mohammedidris, & Mahmud, 2018).
The spoilage of the local anchovies is increased due to poor handling,
since the fish, because of its small size, is not gutted during processing, and
not stored on ice in spite of the high ambient temperature. These conditions
accelerate the viscera releasing bacteria and enzymes which invade the flesh
(Abbey, 1998). Therefore, in preserving fish, temperature must be well
considered as this can greatly influence microbial activity especially between
the range of zero (0) to 25 °C. At zero (0) °C however, the growth rate of
microbes is less than one-tenth of the rate at the optimum growth temperature.
The number and diversity of microbes associated with fish depend on the
geographical location, season and the method of harvest.
Direct transfers through surface contact and factors such as personnel,
pests, air movements through activities such as the handling, stowing, cutting,
cleaning, and packaging of fish also lead to enhanced microbial activities in
fish (Pal, 2012). Bremner (2002), found that fish handling, washing, salting,
drying and storage are the critical control points in fish processing since
potential hazards are bound to occur at these processing points. Even though

18
the spoilage patterns of fish progress simultaneously, speeding up the overall
spoilage of the products, the preservation methods intended to stop the various
spoilage patterns are directed to target these causes in different approaches to
extended the shelf life of processed fish (Mahmud et al., 2018).
Traditional Fish Processing Methods
The perishable nature of fresh fish demands it to be preserved shortly
after capture to maintain its quality. This can be carried out either on board the
fishing vessel or on land depending on the method being used. In Ghana, there
are several available methods for preserving fish including both traditional and
modern techniques. The choice of preservation method is very key as this can
influence flavour and texture, thus, resulting in a range of different products.
Besides the benefit of increasing shelf life, preserving fish helps to reduce
food waste in times of abundant harvest and also makes packaging easy for
transportation. Preserving fish can be done by applying either the concept of
moisture content reduction by salting, smoking and drying; cooking via
boiling or frying; pH reduction by fermentation or temperature control with
the use of ice or refrigerators. Salting, fermenting and drying/smoking are
three commonly practiced methods of preservation in Ghana.
The post-harvest management of fish is mostly carried out by the
informal sector of the Ghanaian economy. It is a form of livelihood to many
traditional processors living in near-shore towns in Ghana (Ames, Gorham, &
Abrams, 1999; Mustapha, Ajibola, Salako, & Ademola, 2014). Wazed, Islam,
and Uddin (2009) estimated that about 30 % (about 307,500 MT) of the
freshly harvested fish is spoiled every year due to lack of proper preservation

19
facility. About 40 % (71,750 MT, dry weight) of the remaining harvested fish
is dried. Among the dry fishes, about 60% (43,050 MT) is contaminated by
both insects and insecticides and therefore are not fit for human consumption.
Generally, fish processing methods could be high or low temperature
treatments. These include chilling, freezing, canning, smoking, drying, salting,
frying and fermenting, sun-drying, solar drying and grilling. Various
combinations of these do give the fish product a form which is attractive, fresh
to the consumers with prolonged storage life. These processing methods have
different applications, techniques and significant influence and effect on the
chemical, physical and nutritional composition of processed fish. This is
because heating, freezing and exposure to high concentration of salt lead to
chemical and physical changes. Ultimately different quality could be obtained
through these methods, hence subsequent effect on processed fish’s shelf life
also varies (Lourdes, Fernaldo, & Carrenol, 2007; Abraha, Xia, & Fang,
2018).
Fermentation
The process of fermentation is known to be indigenous with African
culture. In Ghana, just as in many other African countries., it remains one of
the commonest methods of preserving fish. Fermentation of fish is the
controlled action of the desirable or beneficial microorganisms in order to alter
the flavour or texture of the fish and extend the shelf life. These bacteria
increase the acidity of the fish and therefore prevent the growth of spoilage
and food-poisoning bacteria. The fermentation and degradation of the fish-
protein are controlled by the addition of salt. The concentration must be high
20
enough to inhibit the growth of pathogenic and spoilage bacteria, but still at a
level where fermentative microorganisms and enzymes can be active to soften
(break down) the flesh (Wazed et al., 2009).
Enzymatic ripening and maturation are important processes constantly
taking place in every semi-preserved cold stored fish product which has not
been heat treated. This means that both textural and organoleptic properties
change during storage. Enzymes in the cell such as cathepsins although
present in low concentrations partly digest muscle proteins and even
connective tissues during long storage, giving the products a softer texture and
a more rich flavour. Application of such methods normally concerns major
fish products like fillets or whole fish, but salting is also applied for semi-
preservation of by-products like tongue, cheeks and even cod swim bladder
which is an attractive consumption product in Southern Europe (Bremner,
2002). The fermentation period takes several months. In Africa, mainly
partially fermented products are consumed. The processing often involves
salting and drying, and the fermentation period lasts only a few days. Due to
the breakdown of protein these products have in general a quite strong odour
(Sampels, 2015). In Ghana, fermented fish is locally known as Koobi, Ewule,
Kako or Momone and they differ not just in terms of the type of fish species
used but also by the duration of fermentation. The basic processes involved
includethoroughly washing and dressing fish, salting, and leaving the fish to
ferment for a couple of days.
21
Smoking
Smoking is one of the oldest methods of processing and preserving fish
as well as creating new products with certain organoleptic characteristics and
texture (Arvanitoyannis & Kotsanopoulos, 2012). During the smoking
process, pre-salted, whole or filleted fish are treated with smoke from
incomplete wood burning or combustion. Traditionally, hardwoods such as
maple, oak, alder, hickory, birch and fruitwoods are normally used (Moody,
Silva, Prinyawiwatkul, & Day 2002). The various techniques and the types of
wood used lead to the typical taste of the final product (Jonsdottir, Olafsdottir,
Chanie, & Haugen, 2008). Various compounds such as organic acids,
alcohols, carbonyls, hydrocarbons, phenols etc., arise during the pyrolysis of
the wood. These are responsible for the preserving, antimicrobial and
antioxidant effect of the smoke (Hall, 2011). Smoking have a drying effect and
therefore decreases the water activity and also increases the inhibition of
bacterial growth thereby minimizing spoilage, increasing storage shelf life and
the availability of fish to consumers. In addition, the dried surface of the
smoked fish or products is a barrier against microbes (Hall).
Smoke density, concentration of active components of smoke in
combination with salt content, and time and temperature of smoking, affect the
spoilage and pathogenic microflora of smoked products (Adeyeye & Oyewole,
2016). Therefore if the time, temperature and type of wood is not controlled
and selected as per the standards, chemical, physical and nutritional contents
of smoked fish products will be affected. There is a production of polycyclic
aromatic hydrocarbons (PAHs) which contaminate smoked fish especially if
the process is not controlled adequately (Guillen, Sopelana, & Partearroyo,
22
1997). This poses certain diseases on consumers from carcinogenic effect of
woods. The changes resulting from smoking of fish are hard texture, colour
change ranging from golden brown to black and loss of heat sensitive nutrients
(Horner, 1997).
Smoking of fish can be categorized into hot and cold smoking,
depending on the amount of temperature and preference of consumers. The
temperature of cold smoking does not exceed 30 or 33 °C, whiles hot smoking
temperature can reach up to 80 or even 100 °C resulting in fully cooked
products (Moody et al., 2002; Hall, 2011; Arvanitoyannis & Kotsanopoulos,
2012). The intensity of heat generated during smoking can lead to the
denaturation of protein and amino acid of fish and this leads to alteration in the
physical and chemical properties of protein. This causes a reduction in the
biological availability of protein. Belitz, Gorsch and Schieberle (2009) showed
that overheating might occur in most traditional smoking methods of fish
processing. This significantly reduces the availability of essential amino acids
(methionine, tryptophan and lysine) (Abraha et al., 2018).
Solar drying
Solar dryers have been developed worldwide as a means of
concentrating solar energy for drying, cooking and other purposes (Eyo,
2001). It differs from open sun-drying in that a structure, often very simple in
construction is used to enhance the effect of the sun’s radiation since solar
dryers are enclosed structure (Ojutiku, Kolo, & Mohammed, 2009). Most
designs have a glass or plastic cover that increases the temperature of the air
around the fish, and hence accelerates the drying. The solar dryer depends on
23
concentration of radiation through plastic or the glass surfaces; combined with
the greenhouse effect for trapping heat within a small enclosure where fish is
placed. The trapped solar energy increases drying efficiency by reducing
relative humidity in the enclosure which helps to evaporate moisture from the
fish. This method has found wide application in the drying of fish (Olokor &
Ngwu, 2001). Solar drying as an improved method of sun-drying, minimizes
or eliminates some of the limitations of open sun-drying. Solar-drying protects
food from dust, insects, pests and minimizes case hardening which may occur
from direct exposure to sunlight (Sacilik, Keskin, & Elicin, 2006; Jon &
Kiang, 2008).
A research on different forms of drying of fish showed that solar tent
dryer required less time; 58 h, to complete the drying process. This is due to
the circulation of hot air within the solar tent dryer, which increased internal
dryer temperature and reduced drying time. Raised bamboo platform placed in
the open place required 82 h for drying fish. The fish dried on black polythene
required the longest drying time of 130 h. This was due to the accumulation of
water on the black polythene sheet, which was absorbed by the fish again.
Abraha, Samuel, Mohammud, Admassu and Al-hajj (2017) and Relekar et al.
(2014) observed that 3 days were required for fish drying in solar tent dryer.
Also they reported that fish dried on sloping rack-required 4 days for reducing
moisture up to 20 percent. A research on solar tunnel dryer designed by the
Asian Institute of Technology (AIT) showed that the dryer was efficient for
the processing of products, with better biochemical, microbiological, as well
as good textural qualities and pleasant odour (Chavan, Yakupitiyage, &

24
Kumar, 2011). The dryer had an efficiency of 19.87 percent when used in
drying of mackerel which was stored up to 120 days.
Solar dryers can be categorized into two classes based on the mode of
air flow through the dryer- natural convection and forced convection. Dryers
that employ forced convection require a source of motive power, usually
electricity, to drive the fan that provides the air flow. In many areas of tropical
developing countries, motive power from any source is either unavailable or,
at best, unreliable and expensive, and forced-convection dryers would not be a
practical proposition for the majority of artisanal fishermen in these areas.
Some examples of innovative solar dryers include; Solar Tent Dryer (STD),
Plastic Dryers, Mosquito Net Dryers, Aluminium Dryers and Glass Dryers
(which contain black stones) (Akintola & Fakoya, 2017).
Improved dryers capable of rapid drying under dust-proof conditions
have the following characteristics:
1. Greenhouse effect by fitting transparent air-tight coverings over the
products exposed to the sun
2. Increased thermic absorption by blackened surfaces
3. Air circulation by convection (air inlet low-air outlet high)
4. Possibility of increasing thermal absorption by arranging black
surfaces in rows alternating with rows of exposed products in upwards
order
Possibility of certain adjustments: regulation of air circulation by partial
closure (total closure during night) of air inlets and outlets, shade drying by
covering or semi-covering of exposed products (Akintola & Fakoya, 2017).
The solar energy received by the drying chamber of solar dryers is dependent
25
on the sunshine hours, climate, weather, atmospheric clearness, and location
(Dhumne, Vipin Bipte, & Jibhkate., 2016). According to Ekechukwu and
Norton (1997), solar dryers may further be sub-grouped into three categories:
integral type (direct mode), distributed type (indirect type) and mixed mode.
In a direct type, solar drying material is placed in a drying chamber with a
transparent cover through which solar radiation enters and heats the food
materials to be dried. In an indirect type, solar energy is captured by a solar
collector, which in turn heats the air. This heated air is then passed to the
drying cabinet/chamber. In mixed mode, solar energy is collected in separate
solar collector and heated air is then passed over the drying material. The
drying materials absorb the solar energy directly through the transparent cover
(Dhumne et al.).
Sun drying
Traditionally, sun drying of fish carried out under the open sun is the
simplest and cheapest preservation technique used from days immemorial to
preserve the fish (Jain & Pathare, 2007). Effective open sun drying is mainly
dependent on the environmental temperature, relative humidity and wind
speed. Drying temperature and time are the main factors which affect
nutritional composition of fish. Taking this into consideration, drying would
be appropriate at 60 °C for 15 h or 70 °C for 10 h (Idah, 2013; Abraha et al.,
2018a).
Drying as a method of preservation improves the stability or shelf life
of fish by reducing the water and microbial activity as well as physical and
chemical changes during storage. This maintains the quality of the fish in

26
terms of its nutrient, flavour, texture, and appearance, (Darvishi, Farhang,
Hazbavi., 2012; Abraha et al., 2018) and brings a substantial reduction in
weight and volume, minimizing packaging, storage and transportation costs
(Vega-Galvez et al., 2009). It also reduces post-catch losses especially in the
period of glut, thereby ensuring continuous availability of cheap animal
protein to people all year round.
Traditionally, whole small fish or split large fish are spread in the sun
on the sandy -ground, or on mats, nets, roofs or on raised racks, on rocks,
grasses along the beach for a period of one to three days to dry (Wazed et al.,
2009; Olokor & Ngwu, 2001). This method is preferred only for very small
fish species (e.g. anchovies) which can be dried within hours. Salting the fish
by dipping in brine have been found to reduce the incidence of fly larvae
infestation, as does raising the fish off the ground onto racks. With the fish
placed on the ground the fly larvae can move easily into the fish and return to
the ground when the fish are either too hot or too dry.
Some major disadvantages with traditional open sun drying include;
inability to control weather conditions or uncertainties, long processing time
and poor hygiene of product. Contamination of fish with dust and other
foreign particles as well as high labour cost and requirement of large drying
area are additional disadvantages (Jain & Pathare, 2007; Mahmud et al., 2018).
These go a long way to affect the quality of dried fish by causing yellowing
discolorations, off-odours, high sand contents and belly bursting. These lower
the prices of products (Karim, Sufi, & Hasan, 2017). Also, exposure of fish for
long period of time to sunlight can oxidize the lipids, which can reduce
nutritional quality and increase health risks of consumers. According to

27
Smida, Bolje and Ouerhani (2014), drying has a great negative effect on
protein content at a lower drying speed (Abraha et al., 2018b). In addition, an
uncontrolled growth of microbes due to prolonged processing time may lead
to serious public health implications. Therefore keeping of quality and safety
of the product is of utmost importance (Relekar et al., 2014; Ochieng, Oduor,
& Nyale, 2015). Reza, Bapary, Azimuddin, Nurullah, and Kamal (2005) and
Alam (2007) reported that anchovies which are spread on bamboo mat that lay
on the ground are as disadvantaged as those spread on the bare ground. Having
the fish on racks during sun drying have been found to allow air circulation
below the fish. It is also more convenient to gather up the fish for storage
under cover overnight, or when it rains (Plahar, Nerquaye-Tetteh, & Annan ,
1999; Bremner, 2002).
In Ghana, Small pelagics or small fish, especially anchovies (Engraulis
encrasicolus), atlantic bumper (Chloroscombrus chrysurus) and african
moonfish (Selene dorsalis) are mainly dried under the sun directly by
spreading the fish on the bare ground or beach sand for 2 to 5 days depending
on the intensity of the sun. The processors mostly wash the fish once with sea
water and strain, sprinkle some of the sea water on the ground and follow it
with the sprinkling of the fish. Some processors also dry on concrete
pavements by the roadside, stones, footbridges and open racks. Others sprinkle
immediately after purchasing without any form of washing. When dried, the
fish is swept into a heap with a standing broom, collected into huge baskets
and covered with thick polyethylene for keeping (7 to 12 months) either in the
open, under shed or store rooms until ready to be sold. Examples of these
processes are found in Figure 1 and Figure 2.

28
(a) (b)
(c) (d)
Figure 1: Drying of fish in open sun (a). washing (b). sprinkling of fish (c) and
(d). drying on bare ground.
Source: Field data (2020)
29
(a) (b)
(c) (d)
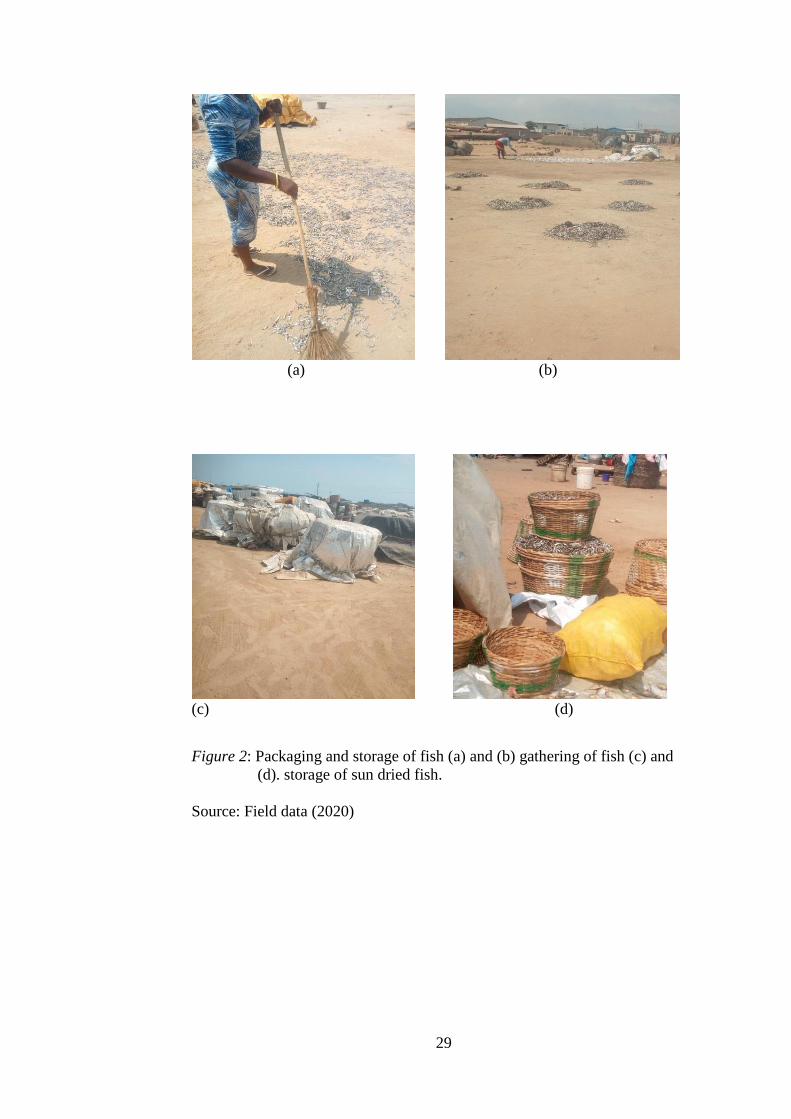
Figure 2: Packaging and storage of fish (a) and (b) gathering of fish (c) and
(d). storage of sun dried fish.
Source: Field data (2020)

30
Improved Sun-Drying Methods
Traditionally, many fish processors spread fish on the ground, on rocks
or on beaches to dry in the sun. Others dry on mats or reeds laid on the ground
in order to minimize contamination of the fish by dirt, mud and sand. Due to
the numerous disadvantages associated with open sun-drying, the use of raised
sloping drying racks has been introduced as a simple, but often effective
improvement in recent years (Davies & Davies, 2009). A cleaner product is
obtained from rack drying since the fish do not come into contact with the
ground. They are also less accessible to domestic animals and pests, such as
mice, rats and crawling insects, which contaminate or consume them.
Protection from rain is simply accomplished by covering the rack with a sheet
of waterproof material (e.g. plastic); if fish on the ground are covered, they are
protected from falling rain but not from water on the ground itself. Drying
rates are also higher because air currents are stronger above the ground and air
can pass under the fish as well as over them. The use of a sloping rack allows
any exudate to drain away.
Nunoo et al. (2015) reported that, sardine processors in United
Republic of Tanzania who use raised platform in the drying of fish
acknowledge that they dry faster and free from sand. The buyers also find the
quality to be good and are prepared to pay a higher price. In Uganda however,
due to limited awareness among consumers of the quality and safety
advantages of rack dried over ground-dried fish the same product does not
attract a better price (Nunoo et al.).
A survey conducted in Nigeria showed the need for improved methods
for drying of fish. It showed that fish when lifted from the ground on a net
31
(instead of being dried on the ground) increases the quality of the dried fish so
much that drying in a solar dryer would not add further value to the fish
(Jensen Frank, & Kristensen, 1999; Akintola & Fakoya, 2017). Sun-drying can
be improved considerably by raising the fish off the ground on wooden
frames. This allows air to circulate beneath the fish, thus facilitating drying
from both sides. It also breaks the cycle of insect reproduction. Research has
shown that, drying fish on racks with mosquito netting reduces contamination
and insect infestation considerably (Sankat & Mujiaffar, 2004; Relekar et al.,
2014). The quality of sardine dried with fish rack, solar dryer and traditional
sun drying was evaluated. It was observated that, fish rack assisted sundried
and solar dried sardines tend to have better quality than traditionally sun dried
sardines (Immaculate, Sinduja, & Jamila, 2012; Praveen et al., 2017)
A research into raised open racks for sardine drying showed that there
was a significant moisture reduction of the samples and takes lesser days of
drying than the traditional method. This was attributed to the efficient air
circulation beneath the racks which blew away the humid water vapour
collecting below the racks. The availability of mesh pores raised above the
ground allowed water dripping from the samples and provided a wider flatter
surface allowing single spreading of samples (Ochieng et al., 2015). Drying
racks offer air circulation below the fish, reduces the incidence of fly larvae
infestation and offer more convenience to gather up the fish for storage. A
simple and hygienic wooden frame rack with tunnel structure roofs have been
proposed for fish drying (Karim et al., 2017).
Process hygiene is greatly improved if, instead of spreading produce
on open ground, a clean firm, smooth surface is employed - such as plastic
32
sheets, cement, concrete, wood or metal. Where land is available for the
purpose, specially constructed drying floors are used, or platforms raised
above ground level. The improvement in hygiene may be accompanied by a
minor improvement in drying efficiency arising from the fact that the
materials used to make the floor or platform absorb solar radiation more
efficiently than soil, and thus becomes hotter and transfer more energy to the
produce. This effect is most evident when metal sheeting such as the flat roof
of a building is used. Some improved methods also involve the use of
blackened surfaces. Black surfaces absorb solar radiation more efficiently than
others, and so platforms for drying can be improved in this way. Jon and
Kiang (2008) demonstrated that the time required to dry cassava chips on a
concrete floor is reduced by about 15 % if the floor is painted black.
The use of woven matting for sun drying has also been found to speed
up drying to some extent by facilitating air movement around the produce
(Alam, 2007). It also makes it convenient handling the fish. Drying on mesh
trays made of plastic netting stretched on wooden frames and supported by
chicken wire is essentially a wind assisted drying method. The trays are
mounted on bamboo supports at an angle, facing the direction of the prevailing
wind. Where wind conditions are favorable, appreciable drying also occurs
overnight for products which are spread in late afternoon. This effect does not
occur to any significant extent for chips spread overnight on blackened
concrete surfaces. This practice is adopted in Australia for sun-air drying of
fruits mainly grapes and in Colombia for coffee and cassava drying. Drying on
these mesh trays do not require intermittent turning of the product.
Notwithstanding, it is important to maintain the required hygiene during the

33
different phases of fish drying in order to obtain products free of
contamination (Relekar et al., 2014).
Effect of Drying on Physical, Chemical and Sensory Qualities of Sun-
dried and Solar-dried Fish
Despite the numerous advantages of processing by drying, the
chemical composition and nutrients of the food product can be significantly
altered. Changes in nutritional value of dried foods may be due to the type of
food, drying method, intensity of treatment (pre-treatments), and operating
conditions (particularly temperature). Some measures that can be taken to
reduce nutrient losses include: minimizing drying time, use of lower
temperatures, and maintaining low levels of moisture and oxygen
concentration during storage. One effect frequently observed when drying
foods is shrinkage, which considerably affects their structure and texture
(Guine, 2015; Adak, Heybeli, & Ertekin, 2017; Guine, 2018).
A study by Dewi (2002) on the effect of salting, drying and cooking
protein pattern changes by electrophoresis, reported that fish proteins undergo
undesirable changes in functionality and nutritional quality when processed by
these methods. Fish drying tends to increase the solubility of proteins, thus
degrading myosin to smaller units with lower molecular weight. Salting and
drying also results in lipid oxidation by concentrating unsaturated fatty acids.
This results in physical and chemical changes such as amino acid destruction,
decrease in protein solubility due to polymerization, formation of amino acid
derivatives and reactive carbonyl as well as changes in protein digestibility
(Abraha et al., 2018a).
34
Generally, high moisture content of dried products favours microbial
growth and infestation of the product by flies resulting in serious consumer
food borne illnesses (Huang et al., 2010). Research has also revealed that
when moisture content is reduced to 25 %, contaminating agents cannot
survive and autotypic activity is greatly reduced. However, to prevent mould
growth during storage, moisture content must be further reduced to 15 %.
Typical microbial species of fish can generally withstand at temperature range
of 45-50 oC before proteins are denatured or cooking starts (Wazed et al.,
2009 ). Dried-salted fish with salt content of 10-15 %, can effectively inhibit
fish spoilage, but may be a limiting factor to consumer acceptance. Some
vitamins are sensitive to heat and sunlight. According to Roos, Mohammed
and Thilsted (2003), almost all vitamin A in small sized fish is destroyed after
sun-drying. During drying, food loses its moisture content, which results in
increasing the concentration of nutrients in the remaining mass. Some
vitamins are however sensitive to heat, sunlight and water, while other
nutrients such as protein, fat, iron and calcium are stable, even after processing
and cooking. A study in Thailand revealed that, boiling and sun drying of
small fish destroys 90 % of vitamin A whiles an alternative steamed and oven-
dried method resulted in only 50 % loss (Chittchang, Jittinandana, Sungpuag,
Chavasit, & Wasantwisut, 1999).
Ochieng et al. (2015) also reported that reduced moisture content
increased protein contents in dried sardines. Chukwu and Shaba (2009)
investigated protein content increase in cat fish (Clarias gariepinus) and
reported that since protein nitrogen was not lost during drying, an observed
increase of proteins in dried fish samples can be attributed to the dehydration
35
of water molecules present between the proteins and which causes
concentration of proteins in the dried fish products. Also lipid contents
decreases in dried than fresh samples and the variation could have resulted
from the evaporation of moisture content with lipids. Drying methods that
depend on high temperature treatment have also been found to trigger lipid
oxidation and result in off flavoured fish products (Mahmud et al., 2018).
Tunison et al. (1990), Ojutiku et al. (2009) and Ochieng et al. (2015) all
reported a slightly lower ash content, protein and fat in raised open rack dried
samples than samples dried on the bare ground. However, the product quality
values were slightly lower in terms of protein, fat and ash contents. This
probably resulted from the nutrient concentrated waters dripping away from
the samples through the rack pores during processing.
A research by Kituu, Shitanda and Kanali (2007) suggested that
brining can be used to minimize the effect of drying on chemical composition
of fish when used as pre-treatment. Brining reduced moisture content and
played a significant role in reducing drying rate and preserving fish nutrient.
Other studies have also shown that application of drying to dehydrate fish does
not only remove water, but excess of such heat can affect the valuable
nutritional content of the dried fish and its products. Oparaku and Nwaka
(2013) studied the effect of processing on the nutritional qualities of three fish
species (Synodontis clarias, Trachurus trecae and Clarias gariepinus). The
findings showed that the fat loss phenomenon was intensive in the boiling and
solar dried fish than in smoked samples. Fat may exude with the moisture
evaporation through extended heat treatments (Mahmud et al., 2018).

36
Mean microbial load in raised open rack dried samples was less
1.48×10² CFU/ g for yeast and moulds and 1.56×10² CFU/ g for bacteria than
those dried using the traditional drying method. This was attributed to the
hygienic and safe practices during processing. This microbial load reduction in
the raised open rack dried sardines suggests a safer product similar to that
reported by Rahman, Guizani, Al-Ruzeiki and Al Khalasi (2000) in the case of
convection air-drying where they observed significant differences in total
bacterial counts (Ochieng et al., 2015).
Principles of Fish Drying
Drying is a process of simultaneous heat and mass transfer operation
for which energy must be supplied (Yilbas, Hussain, & Dincer, 2003). The
main objectives of drying are to preserve foods and increase their shelf life by
reducing the water activity; reducing the need of expensive cooling systems;
reducing space requirements for storage and transport; and diversifying the
supply of foods with different flavours and textures, thus offering the
consumers a great choice when buying foods (Guine, 2018). The principle of
drying process is the removal or lowering free water available in the matrix of
foods that support the growth of microorganisms, termed as water activity
(aw). This method has been proven to be effective in extending the shelf life
of fishery products since fish and fishery products are known for their high
moisture content in their fresh state which makes them conducive for
microbial growth. However, if the drying is too rapid, it might result in layer/
case hardening (hard texture) and thus affects the palatability feature of the
product undesirably. In addition, if the drying process is slow, undesirable

37
microbes might survive and grow (Mahmud et al., 2018; Cassens, 1994). The
water activity levels of microorganisms are different (Mahmud et al., 2018).
The drying process begins with fish drying by the process of
convection mass transfer immediately it is exposed to air. That is, heat is
transferred to the product from the heating medium (air) resulting in mass
transfer of moisture from the interior of the product to its surface and from the
surface to the surrounding air. The water is moved to surface of the food by
diffusion. Air speed rate and humidity are the main factors that affect the
evaporation of water from fish surfaces when it is exposed. The evaporation of
water from the surface continues at a constant rate until the surface begins to
dry creating a moisture concentration gradient between the surface and the
interior. This gradient increases water movement from the interior unto the
surface. Over a period of time, the moisture loss slows down, when the
moisture concentration gradient decreases, thereby decreasing the drying rate,
this is referred to as the falling rate period. Moisture content of the fish will
continue to decrease progressively until equilibrium is reached such that there
is no further change in the moisture content of the fish. This process induces
chemical and physical changes in the material undergoing dehydration.
(Bremner, 2002).
Drying which involves the use of heat to vaporize water present in the
food combines both heat and mass transfer for which energy must be supplied.
To use hot air flowing over the food is the most common way of transferring
heat to a drying material. This process is carried out mainly by convection
(Cruz, Guine & Gonçalves, 2015; Guine, 2018).

38
Drying rate of small fishes (drying rate curve)
There are two stages in a typical drying process: the first stage is the
removal of surface moisture; the second stage is the removal of internal
moisture from within the solid material. Perry and Sumaila (2007) reported
that drying rate periods could be categorized as: Constant rate period, First
falling rate period and Second falling rate period. During the constant rate-
drying period, the surface of the material is still wet and the rate of drying is
governed by evaporation of free moisture from the products surface or near
surface areas.
The falling-rate period of drying is controlled largely by the product
and is dependent upon the movement of moisture within the material from the
centre to the surface by liquid diffusion (Minkah, 2007). The water that
migrates to the surface carries solutes from the food, originating tensions in
the structure, variable according to the type of food, its composition and the
processing parameters. The drying may cause some changes in mechanical
properties, structure, volume, porosity and density of the foods (Guine, 2018).
The drying process of agricultural material takes place in the falling rate
period (Saeed, Sopian, & Zainol, 2006; Falade & Abbo, 2007; Nguyen &
Price, 2007; Singh Shrivastava, & Kumar, 2018). This means that diffusion is
the dominant physical mechanism governing moisture movement in the
material (Akpinar, Bicer, & Midilli, 2003; Doymaz, 2007).
The influence of drying rate parameters on moisture ratio and drying
rate of tilapia fillets was studied and it was observed that drying took place
only in falling rate period. Moisture ratio decreased and drying rate increased
with increase in drying temperature, drying velocity and decrease of fillet

39
thickness (Guan, Wang, Li, & Jiang, 2013; Praveen et al., 2017). The rate of
drying is dependent on the vapour pressure difference between the surface of
the product and the air. Drying air temperature, air velocity, shape and size of
the drying particles can significantly affect the drying rate (Muliterno,
Rodrigues, de Lima, Ida, & Kurozawa, 2017).
The dehydration temperature has great influence on the texture of the
food and, in general, faster processes and higher temperatures cause greater
changes. The high temperature causes profound physical and chemical
alterations on the surface of the foods, thus leading to the formation of a hard
surface layer, which keeps the foods dried at the surface but moist inside. The
structural changes during drying influence the texture of the final product,
according to the rate of water elimination. According to Idah (2013), drying
temperature and time are the main factors which affect nutritional composition
of fish. Taken this into consideration, drying would be appropriate at 60 °C for
15 hours or 70 °C for 10 hours.
If shrinkage occurs, as found in the air-dried foods, a very dense
structure is formed and the dried product is harder. On the contrary, if no
shrinkage occurs, like in the case of lyophilized foods, a highly porous
structure is formed and the product has a smoother texture (Guine, 2018). The
rate of drying was observed to be greater in sun-dried fish during the first two
days of a research than that of those inside a solar dryer due to the greater flow
of air around the sample. However, the drying rate during the later stage was
greater inside the solar dryer. It was also reported that the quality of fish dried
in the solar dryer was extremely good in terms of odour, rancidity and
microbial or insect attack (Sablani, Rahman, Mahgoub, & Al-Marzouki ,

40
2002). Also, the air temperature when drying on the bare sand were found to
be similar to that of the ambient air and the drying rates observed were higher
due to the conductive heat transfer from the sand to the fish samples by direct
contact. However, the potential of contaminations when drying on the bare
sand was much higher (Sablani et al.).
Drying curve
Drying kinetics is generally monitored experimentally by measuring
the weight of a drying sample as a function of time (Sopian, Saeed, & Abidin,
2008). Drying curves may be represented in different ways; averaged moisture
content versus time, drying rate versus time, or drying rate versus averaged
moisture content (Coumans, 2000; Sopian et al.). Kane, Ahmed and Kauhila
(2009) reported that drying time decreased as drying temperature was
increased from 40 to 70 °C and drying air flow rate was increased from 0.028 -
0.056 m2/s. The drying air conditions have an important influence on the rate
of these curves. It is apparent that drying rate decreases continuously with the
moisture content. Rate of drying also increases with the increase of air-drying
temperature.
Drying curves are used to show the influence of the factors, which
affect the rate of drying, example: temperature, air velocity, particle size and
thickness. Typically, the moisture content falls from the initial value with
drying time. As drying progresses, the drying rate falls further and tends to
zero as the moisture content approaches the equilibrium value.
41
Safety of Traditionally Processed Fish
Microbialogical safety
Fish is a highly perishable food product due to its high moisture and
nutrient content. This makes it a good substrate for the growth of a wide range
of spoilage and pathogenic microorganism. Improper handling and processing
of seafoods, including fish, can also lead to its contamination and subsequent
growth of pathogenic microorganisms. In addition, the natural occurrence of
aquatic bio-toxins and natural pathogenic flora of the aquatic environment also
contribute to seafood borne diseases (Mahmud et al., 2018). Good hygiene and
manufacturing practices as well as temperature control are therefore important
requirements for the prevention and inhibition of microbial growth (Sofos &
Geornaras, 2010).
Plahar et al. (1999) observed that quality assurance systems which help
to produce high quality fish products are not in place in the whole raw material
procurement, processing, storage and distribution chain of fish in Ghana.
Foodborne pathogens such as Salmonella spp, Escherichia coli, Shigella spp,
Vibrio spp., Clostridium botulinum, Staphylococcus aureus and Clostridium
perfringens in tropical fish (Feldhusen, 2000) may survive, grow and
eventually reach infectious levels or produce toxins (Medvedova, Valík, &
Studenicova, 2009) under poor storage and handling conditions. Nketsia-
Tabiri (2004) reported Total Viable Count (TVC) between 4.11 - 6.78 log
CFU/g, counts of S. aureus between 2.85 - 4.15 log CFU/g and mould and
yeast count of between 1.38-3.38 log CFU/g in market samples of salted and
dried tilapia (koobi) in Ghana. The total viable count in this product increased
to 7.5 ± 2.5 log CFU/g after 4 weeks storage under ambient conditions.
42
Anihouvi, Sakyi-Dawson, Ayernor and Hounhouigan (2007) also reported S.
aureus in 17.7 % of salted and fermented traditional fish products as well as
histamine, moulds and Clostridium spp., however, the presence of Salmonella
was not reported.
One practice which reduces the product quality of anchovies and has
the tendency of causing food poisoning is washing anchovies with turbid/dirty
seawater which is normally the practice of traditional processors as the
anchovies are taken from boats and taken to drying space. This reduces the
cleanliness and appearance of the dried anchovies (Setiabudi, Herawati,
Purnomo, & Sehabudin, 2018). Blowfly infestation of traditionally processed
fish in some developing countries is a serious problem that results in
significant physical and economic losses. Insects such as blowflies and beetle
have been identified as vectors of bacteria in fish, as well as agents of physical
damage to fish. Fish spoilage is normally characterized by softening of the
muscle tissue, offensive odour with the subsequent rotting of the fish mainly
caused by microbial activity.
Throughout processing, the wet fish are attacked by blowflies which
lay their eggs on them and later form intensive infestation by maggots (larval
stages) that penetrate the fish bodies causing significant postharvest losses
Flies try to protect their eggs by laying them in depressions such as incisions
in the flesh of fish or in orifices such as gills and mouth; hence by products
such as heads and skeletons are ideal breeding ground for flies. The smell,
especially from off-flavours resulting from microbial processes, attracts flies
to the fish products. The practice of not covering fish during transportation

43
after catch also exposes fish to flies. Fish dried on the ground also easily gets
infected with fly larvae that stay in the soil (Getu & Misganaw, 2015).
Chemical safety
Histamine level in fish is another quality index for spoilage in fish.
These monoamines, according to Onal (2007), are biogenic amines formed
when products such as fish in storage or under process is going bad under the
action of the bacteria with histidine decarboxylase enzymes. Typical examples
are the Enterobacteriaceae and Enterococcus family, which are mostly found
in the gills, gut cavity, or added accidentally through poor handling. Histamine
contamination is prevalent among pelagic fish such as mackerel and sardine.
Therefore, icing of fish was suggested by Abbey (1998) to minimize histamine
formation. Histamine levels above 40-100 mg and higher has been reported to
cause severe food poisoning which can lead to ill health and death. Onal
suggested the maximum level of histamine between 50-100 mg/kg. Codex
(2007) set limits of 10 mg/ kg as indicator of decomposition and 20mg/kg as
indicator of poor handling..
Generally, processing mainly controls microbiological hazards, but
leaves chemical hazards or biotoxins virtually unaffected. Effective control of
chemical hazards and biotoxins has to be applied mostly during primary
production and the pre–harvest stages (Mahmud et al., 2018).
Fortification of Ready-to-eat-food Using Fish Powder
Food fortification is the addition of one or more nutrients to foods with
the objective of increasing the level of consumption of the added nutrients to

44
improve nutritional status of a given population. Micronutrient fortification of
foods commonly consumed by a given population can be a powerful strategy
to combat micronutrient deficiencies in a sustainable manner. By selecting the
right food ingredient to act as a ‘food vehicle’ of specific micronutrient(s), the
need for encouraging individual compliance or changes in the customary diet
will be minimized (Lotfi, Mannar, & Merx, 1996; Pee & Bloem, 2009). Even
though fish constitutes 50- 80 % of consumed animal protein in Ghana
(Sumberg, Jatoe, Kleih, & Flynn, 2016; FAO, 2018b), the burdens of
malnutrition are a persistent and on-going challenge in Ghana. Several studies
in Ghana have shown high prevalence of undernutrition, stunting, anaemia and
vitamin A deficiency among children<5 years of age co-occurring with
increasing obesity rates in the adult population (GSS et al., 2015; Hasselberg
et al., 2020b).
To improve the nutritional status of moderately undernourished
children, it is estimated that approximately one-third of protein should be
provided by animal-source foods in the diet. By doing so, lysine from animal
source foods can be fully utilised to compensate the shortage of lysine in
staple foods subsequently having a significant impact on their growth
(Michaelsen et al., 2009). In this respect, fish is more affordable and
accessible animal-source foods, and therefore fish, frequently consumed by
the poor is very important, especially for women in the reproductive age and
children. The incorporation of low cost but highly nutritious species of fish
into our diet such as snacks for school children will help to meet partly their
dietary requirement of proteins for the day and enhance micronutrient intakes.

45
Small pelagic forage fish such as anchovy and sardine are rich in
polyunsaturated fatty acids. They are cheaper and preferably consumed by
low-income households and thus have a high potential to address
micronutrient deficiencies when used for fortification (Tacon & Metian,
2009). Fish bones are very rich in calcium which is about eight times higher
than that of milk, and has the same bioavailability as milk (Hansen et al.,
1998; Larsen et al., 2000). Therefore, small fish consumed with bones or in a
form of powder are important as a source of calcium, especially in populations
with low intakes of milk and milk products.
Inclusion of small fish as a complementary food during the first 1,000
days of life have been found to significantly contribute to both macro- and
micronutrient intakes in infants and young children and represents a promising
food-based strategy towards improving nutrition (Bogard, Thilsted, & Marks,
2015). In a study by Egbi et al. (2015), the effect of adding small amounts (3
%) of fish powder made of anchovy or sardine and vitamin C to school meals
proved beneficial, resulting in the prevalence of anaemia being reduced among
study participants (Hasselberg et al., 2020a). Gibson et al. (2003) also
introduced fermented porridge mixed with whole- dried fish with bones and
fruit as a complementary food (Kawarazula & Bene, 2011).
In recent times, demand for ready-to-eat foods that are quick and easy
to prepare and consume is an increasing trend cutting across the population
especially income groups. Due to lack of time, consumers are willing to pay
for processors and street-food vendors to carry out some or all of the food
processing and preparation for them This has led to the growing demand for
post-harvest activities in the food system. At the same time, there are

46
increasing concerns about food safety, quality and healthfulness (Staatz &
Hollinger, 2016). Ready-to-eat foods can be readily consumed without further
preparation or processing and thus are extremely convenient for present-day,
busy consumers (Farber, Ross, & Harwig, 1996). Market for children’s food is
growing and children have an increasing influence on future convenience
foods and purchasing behaviour (Dodds, 2008).
Consumption of starchy snack products which are low in protein and
high in fat and carbohydrates is on the increase (Ranhotra & Vetter, 1991;
Rhee, Kim, Jung, & Rhee, 2004). Incorporation of functional ingredients such
as fish protein powder into these starchy snack products can increase their
nutritional value (Riaz 2001; Veronica, Olusola, & Adebowable, 2006).
Demands for fish protein ingredients including dried fish protein to
develop functional food or ready-to-eat products are gradually growing in the
world to help increase the nutrient content in diets and to expand the
utilization of fishery resources (Thorkelsson, Slizyte, Gildberg, & Kristinsson,
2009; Vakily, Seto, & Pauly, 2012). Underutilized/ low value fish species and
the by- products of fish processing are sources for developing fish protein
ingredients (Arason et al., 2009a; Thorkelsson et al., 2009). According to
several studies, sensory attributes of fish protein powder (FPP) are similar to
dry fish and can therefore be successfully marketed in the areas where fish
powder from dried fish is used in tasty, spicy dishes consumed with the staple
dish. (Venugopal, 2006; Shaviklo, Thorkelsson, Kristinsson, Arason, &
Sveinsdottir, 2010). Venugopal showed that, nutritive value of cereal proteins
could be increased when combined with a fish protein powder (FPP). That is,
the addition of 3 % of FPP to wheat flour (protein content, 10.4 %) increased
47
its protein content to 12.4 % with an increase of net protein utilisation (NPU)
from 50 to 67. Successful fortification of products such as puffed corn snack,
ice cream, bread, biscuits, mayonnaise, crackers with FPP have been reported.
Extruded puffed corn snacks seasoned with 18 % FPP were liked by Iranian
children aged 7–12 years old. This gives a further option for the utilization of
fish powder (Shaviklo, Kargari, & Zanganeh, 2013). The physicochemical and
sensory properties of a high-protein noodle produced by the incorporation of
FPP were also evaluated. Results showed no significant difference in the
colour, hardness and elasticity between the control and noodles incorporated
with 5 % FPP. (Shaviklo, 2016).
Notwithstanding, fish-derived ingredients may have a negative impact
on sensory characteristics despite improving nutritional and functional quality
of the products (Shaviklo et al., 2013). Studies on sensory quality of fish-
enriched foods ingredients gave negative reports both on flavour and odour, if
the enrichments are done at inappropriate levels. Therefore, the level of
enrichment should not affect acceptance and sensory properties of the product
(Shaviklo, 2011).
48
CHAPTER THREE
MATERIALS AND METHODS
This chapter describes the materials and the methods used for the
study. It covers the acquisition of the raw material; (fresh anchovy and atlantic
bumper fish) through to processing, using four drying processing facilities to
obtain the dried fish. The dried fish was then milled into fish powder, which
was then utilized in the production of two food products; instant cereal mix
and biscuit. In addition, fresh and traditionally dried fish samples were
obtained from four artisanal processing sites and used for comparative study.
Microbiological and chemical analyses were carried out on both the fresh and
dried samples from the experiment and that from the processors.
Research Design
This research was mainly a quantitative type of research since
experiments were done to explain phenomena by collecting numerical data
that can be analysed using statistical approaches (Aliaga & Gunderson, 2000;
Creswell, 2003). The experimental design was basically a 2 x 4 factorial
design; thus factor 1 (2 fish species): factor 2 (4 drying methods). The design
chosen helped to investigate the comparative potential of solar drying and
traditional sun-drying as well as two improved sun-drying methods for
production of shelf-stable and quality dried anchovies and Atlantic bumper
fishes. The improved sun-drying methods consisted of a raised concrete
platform (RCP) only and also a raised concrete platform with netted drying
racks.

49
Sources of Fish Samples
Source of fish for experiment
About 20 kg each of freshly landed anchovies and Atlantic bumper fish
(Figure 3) were purchased from purposively selected fish mongers at the Tema
Canoe beach in Tema Newtown, Greater Accra Region. The fish samples were
then transported in an ice chest the same day to the CSIR-Food Research
Institute, Accra for drying using four different methods;
1. Sun drying on the bare ground (open air drying)
2. Sun drying directly on the raised concrete platform dryer (RCP)
3. Sun drying on the raised concrete platform dryer with netted drying
racks (RCP+NDR)
4. Solar drying using the Hohenheim Solar Tunnel Dryer.
Fresh fish samples, after receiving were first washed in clean potable water to
get rid of sand and debris. They were further rinsed in already prepared clean
brine solution of about 5 g/100 ml. Straining was done using a clean
perforated basket or rubber strainer to remove as much excess water as
possible before the drying process was started.
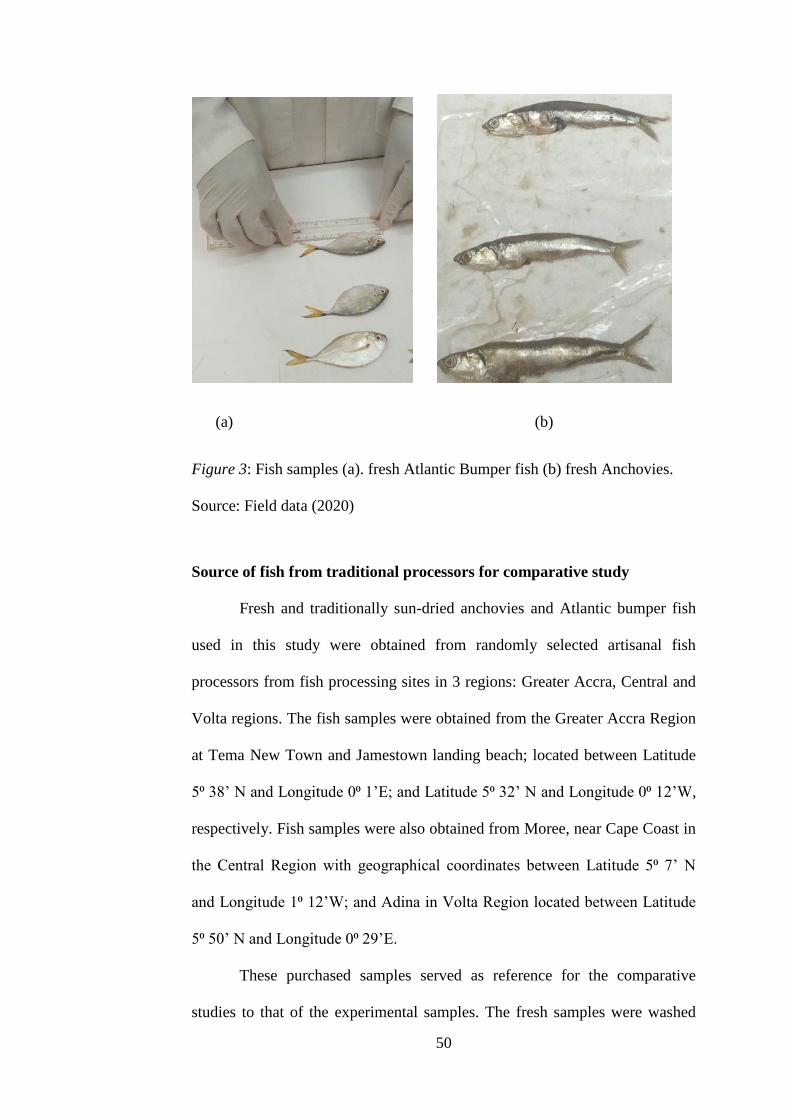
50
(a) (b)
Figure 3: Fish samples (a). fresh Atlantic Bumper fish (b) fresh Anchovies.
Source: Field data (2020)
Source of fish from traditional processors for comparative study
Fresh and traditionally sun-dried anchovies and Atlantic bumper fish
used in this study were obtained from randomly selected artisanal fish
processors from fish processing sites in 3 regions: Greater Accra, Central and
Volta regions. The fish samples were obtained from the Greater Accra Region
at Tema New Town and Jamestown landing beach; located between Latitude
5⁰ 38’ N and Longitude 0⁰ 1’E; and Latitude 5⁰ 32’ N and Longitude 0⁰ 12’W,
respectively. Fish samples were also obtained from Moree, near Cape Coast in
the Central Region with geographical coordinates between Latitude 5⁰ 7’ N
and Longitude 1⁰ 12’W; and Adina in Volta Region located between Latitude
5⁰ 50’ N and Longitude 0⁰ 29’E.
These purchased samples served as reference for the comparative
studies to that of the experimental samples. The fresh samples were washed
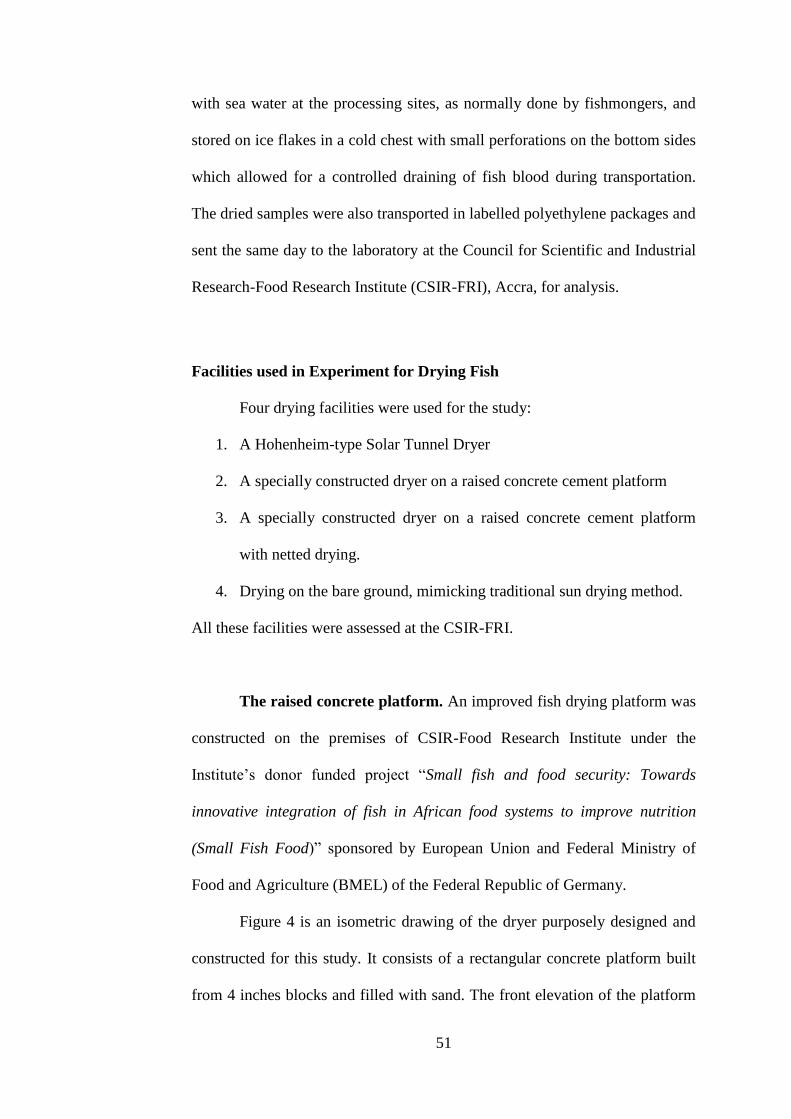
51
with sea water at the processing sites, as normally done by fishmongers, and
stored on ice flakes in a cold chest with small perforations on the bottom sides
which allowed for a controlled draining of fish blood during transportation.
The dried samples were also transported in labelled polyethylene packages and
sent the same day to the laboratory at the Council for Scientific and Industrial
Research-Food Research Institute (CSIR-FRI), Accra, for analysis.
Facilities used in Experiment for Drying Fish
Four drying facilities were used for the study:
1. A Hohenheim-type Solar Tunnel Dryer
2. A specially constructed dryer on a raised concrete cement platform
3. A specially constructed dryer on a raised concrete cement platform
with netted drying.
4. Drying on the bare ground, mimicking traditional sun drying method.
All these facilities were assessed at the CSIR-FRI.
The raised concrete platform. An improved fish drying platform was
constructed on the premises of CSIR-Food Research Institute under the
Institute’s donor funded project “Small fish and food security: Towards
innovative integration of fish in African food systems to improve nutrition
(Small Fish Food)” sponsored by European Union and Federal Ministry of
Food and Agriculture (BMEL) of the Federal Republic of Germany.
Figure 4 is an isometric drawing of the dryer purposely designed and
constructed for this study. It consists of a rectangular concrete platform built
from 4 inches blocks and filled with sand. The front elevation of the platform
52
is 950 mm high, whilst back elevation is 800 mm, giving the platform a gentle
slope of 9 o. The dryer has a set of tubes of diameter 101.6 mm inserted in the
middle of the platform both lengthwise and breadthwise to serve as heat vents
on all the four sides of the platform. The purpose of the heat vents is to
prevent heat build-up within the platform, which could cause cracks on the
surface of the platform. The slope of 9 o of the surface of the platform ensures
that oils and other fluids from fish being dried do not accumulate on the
platform to serve as hotspots for bacteria growth. The slope also ensures that
these fluids are drained off the fish and makes it easier to clean the platform
after drying. The concrete construction of the platform is strengthened with
iron rod reinforcements and 3-inch thick plastering. On top of this rectangular
block is a drying rack made from reinforced iron rods, which holds the drying
fish. The height of the platform is at the waist level and this helps reduce
drudgery associated frequent bending as with the traditional fish drying floors
used by processors. The dryer with regular use is expected to last for about 3
years.
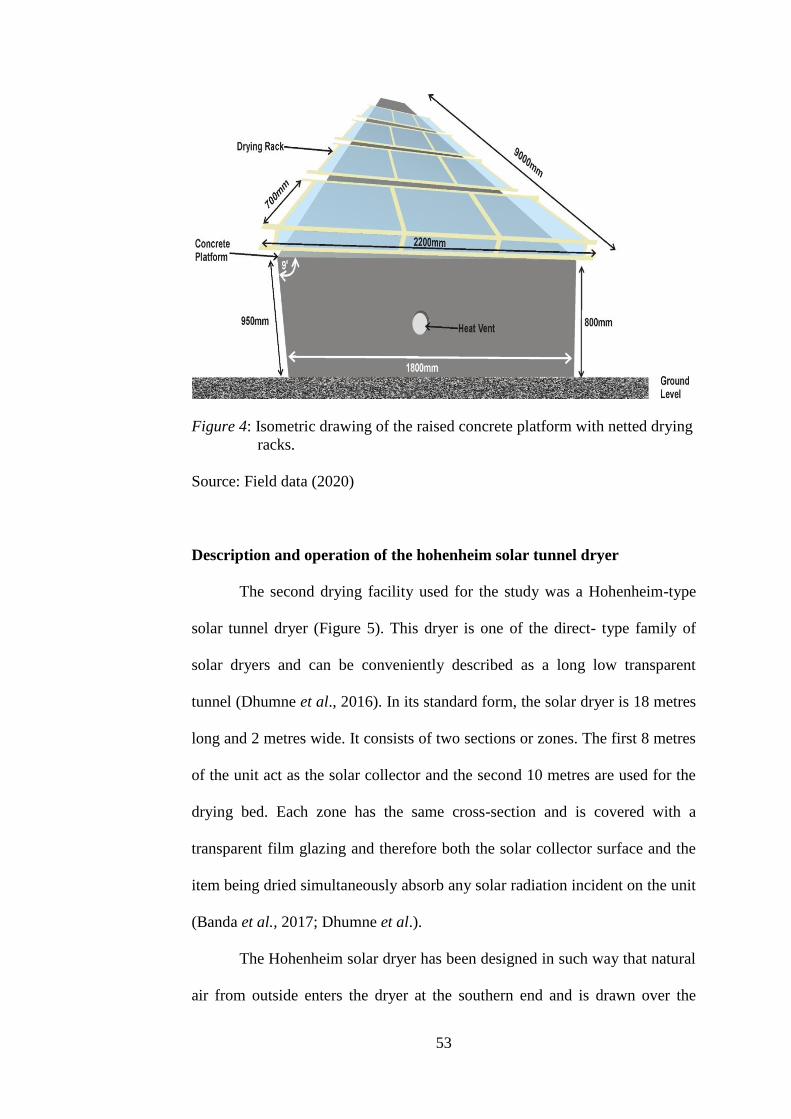
53
Figure 4: Isometric drawing of the raised concrete platform with netted drying
racks.
Source: Field data (2020)
Description and operation of the hohenheim solar tunnel dryer
The second drying facility used for the study was a Hohenheim-type
solar tunnel dryer (Figure 5). This dryer is one of the direct- type family of
solar dryers and can be conveniently described as a long low transparent
tunnel (Dhumne et al., 2016). In its standard form, the solar dryer is 18 metres
long and 2 metres wide. It consists of two sections or zones. The first 8 metres
of the unit act as the solar collector and the second 10 metres are used for the
drying bed. Each zone has the same cross-section and is covered with a
transparent film glazing and therefore both the solar collector surface and the
item being dried simultaneously absorb any solar radiation incident on the unit
(Banda et al., 2017; Dhumne et al.).
The Hohenheim solar dryer has been designed in such way that natural
air from outside enters the dryer at the southern end and is drawn over the

54
heating chamber of the dryer, which constitutes the black body section of the
solar dryer. The air becomes heated and assisted by two extractor fans,
powered by photovoltaic cells mounted over the top of the solar, flows over
the drying fish and then out of the dryer at the northern end. The drying tunnel
is connected in a series to supply hot air directly into the drying tunnel using
two DC fans operated by a solar module (Dhumne et al., 2016).
Figure 5: Isometric Drawing of the Hohenheim Solar Tunnel Dryer used for
the study.
Source: Patil and Gawande (2016)
Description of the netted drying racks. Fish drying racks were
purposely constructed for the study. Each pair of drying racks consists of a
rectangular wooden frame on which is mounted an iron mesh with two
wooden handles at each end (Figure 6). The two racks are joined together on
one of the lengthwise sides of the rectangular racks with hinges to form one
unit, making it possible to open and close the joined racks. With this design,
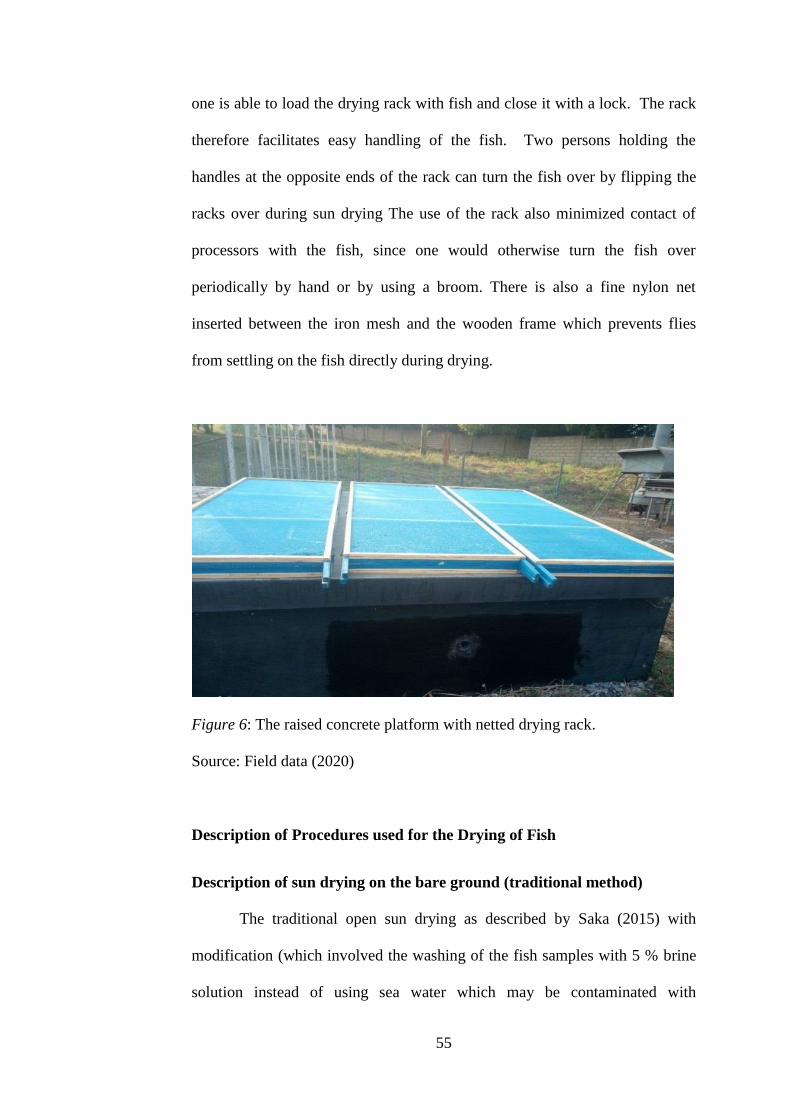
55
one is able to load the drying rack with fish and close it with a lock. The rack
therefore facilitates easy handling of the fish. Two persons holding the
handles at the opposite ends of the rack can turn the fish over by flipping the
racks over during sun drying The use of the rack also minimized contact of
processors with the fish, since one would otherwise turn the fish over
periodically by hand or by using a broom. There is also a fine nylon net
inserted between the iron mesh and the wooden frame which prevents flies
from settling on the fish directly during drying.
Figure 6: The raised concrete platform with netted drying rack.
Source: Field data (2020)
Description of Procedures used for the Drying of Fish
Description of sun drying on the bare ground (traditional method)
The traditional open sun drying as described by Saka (2015) with
modification (which involved the washing of the fish samples with 5 % brine
solution instead of using sea water which may be contaminated with
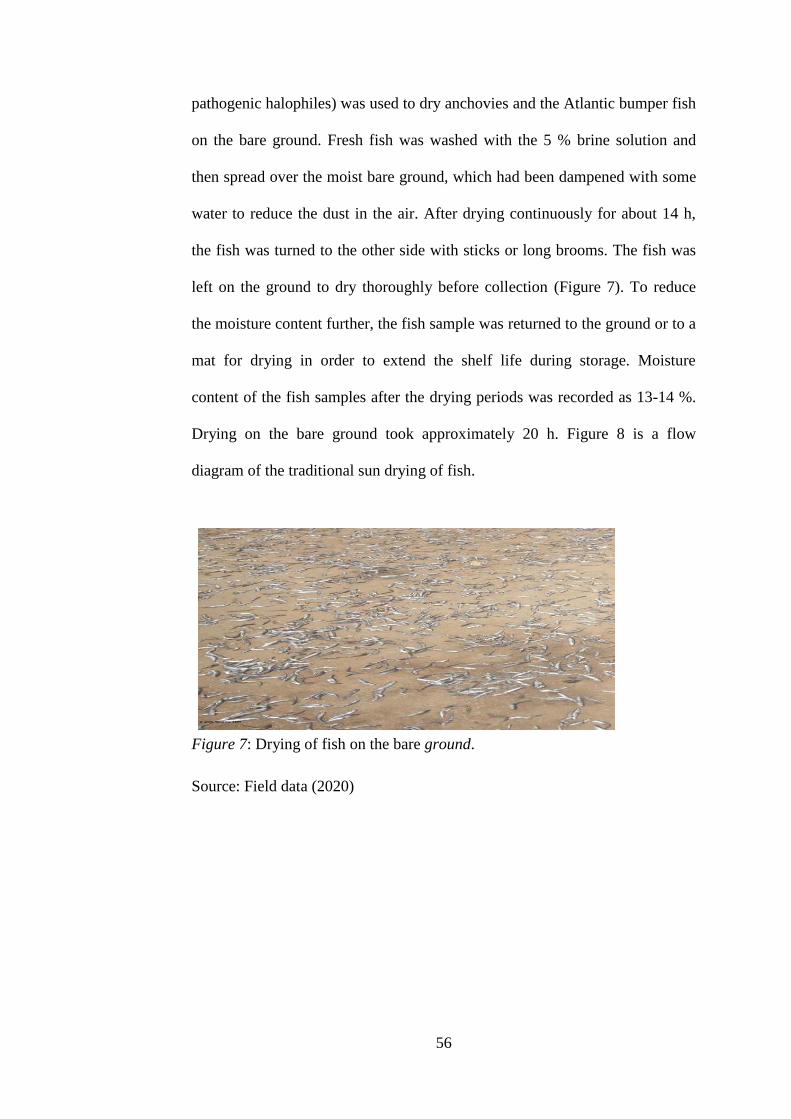
56
pathogenic halophiles) was used to dry anchovies and the Atlantic bumper fish
on the bare ground. Fresh fish was washed with the 5 % brine solution and
then spread over the moist bare ground, which had been dampened with some
water to reduce the dust in the air. After drying continuously for about 14 h,
the fish was turned to the other side with sticks or long brooms. The fish was
left on the ground to dry thoroughly before collection (Figure 7). To reduce
the moisture content further, the fish sample was returned to the ground or to a
mat for drying in order to extend the shelf life during storage. Moisture
content of the fish samples after the drying periods was recorded as 13-14 %.
Drying on the bare ground took approximately 20 h. Figure 8 is a flow
diagram of the traditional sun drying of fish.
Figure 7: Drying of fish on the bare ground.
Source: Field data (2020)

57
Figure 8: Flow diagram showing the process of traditional sun-drying of fish.
Source: Field data (2020)
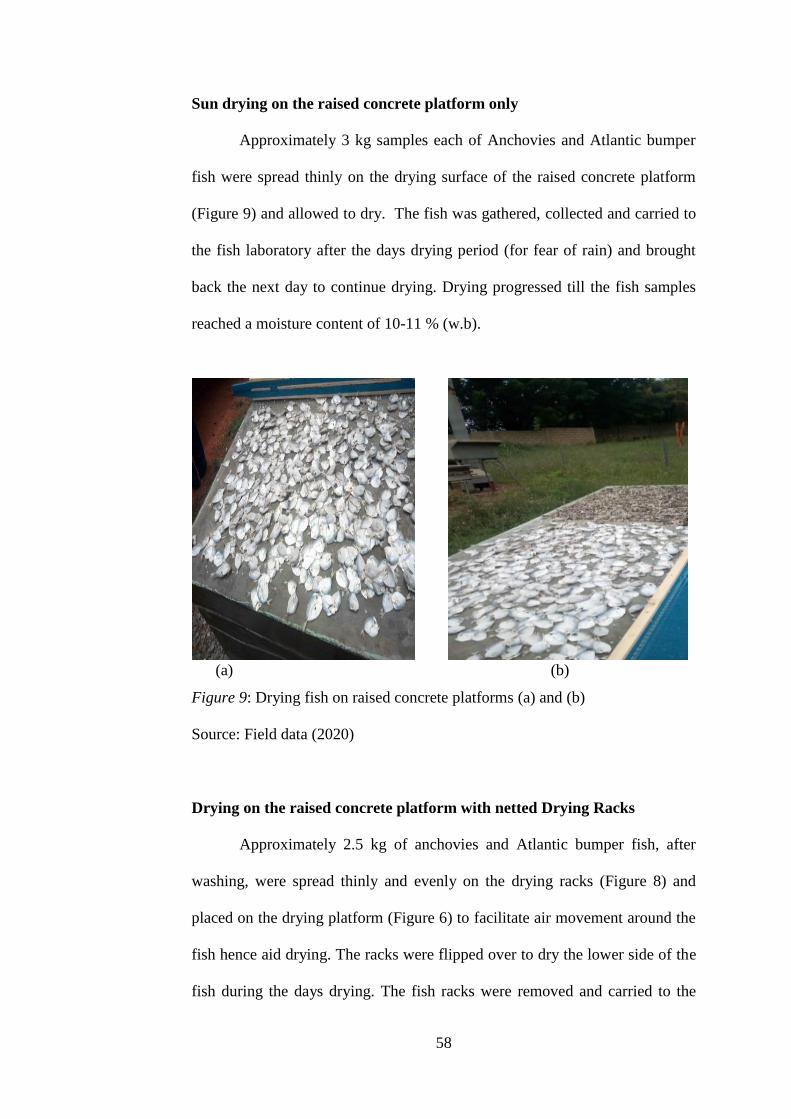
58
Sun drying on the raised concrete platform only
Approximately 3 kg samples each of Anchovies and Atlantic bumper
fish were spread thinly on the drying surface of the raised concrete platform
(Figure 9) and allowed to dry. The fish was gathered, collected and carried to
the fish laboratory after the days drying period (for fear of rain) and brought
back the next day to continue drying. Drying progressed till the fish samples
reached a moisture content of 10-11 % (w.b).
(a) (b)
Figure 9: Drying fish on raised concrete platforms (a) and (b)
Source: Field data (2020)
Drying on the raised concrete platform with netted Drying Racks
Approximately 2.5 kg of anchovies and Atlantic bumper fish, after
washing, were spread thinly and evenly on the drying racks (Figure 8) and
placed on the drying platform (Figure 6) to facilitate air movement around the
fish hence aid drying. The racks were flipped over to dry the lower side of the
fish during the days drying. The fish racks were removed and carried to the

59
fish laboratory at sunset (for fear of rain) and returned the next day to continue
the drying process till all the fish were thoroughly dried to a moisture content
of 12-13 % (w.b) as depicted in Figure 10. This took approximately 20 h of
drying.
(a) (b)
Figure 10: Drying on the raised concrete platform with netted drying racks (a)
and (b).
Source: Field data (2020)
Solar drying using the Hohenheim solar tunnel dryer
Approximately one (1) kg sample each of anchovies and Atlantic
bumper fish were dried in the Hohenheim Solar Tunnel dryer (Figure 11).
Samples were spread thinly on plastic meshes placed over mesh type metallic
drying trays. The trays were then arranged inside the Hohenheim Solar Tunnel
Dryer. Drying was carried out from 8:30 am to 4:30 pm daily. However, the
drying process was discontinued on the second day due to interruption of rain,

60
which was unavoidable since drying was done during the rainy season. During
such periods the fish was collected, covered with aluminium foil in a tray and
kept in the fish laboratory. Drying continued this way till all the fish were
thoroughly dried to a moisture content of 7- 8 %.
Figure 11: Drying fish in the Hohenheim Solar Tunnel Dryer.
Source: Field data (2020)
Processing of Dried Fish Samples into Flour
The dried anchovies and Atlantic bumper fish samples from all the
drying methods were de-headed, de-gutted and milled into fish powder with a
particle size of 500 μm. About 1 kg lots of powdered fish were then packaged
and sealed into polyethylene bags and stored in the refrigerator at 4 oC for
subsequent use for food formulations (Figure 12).
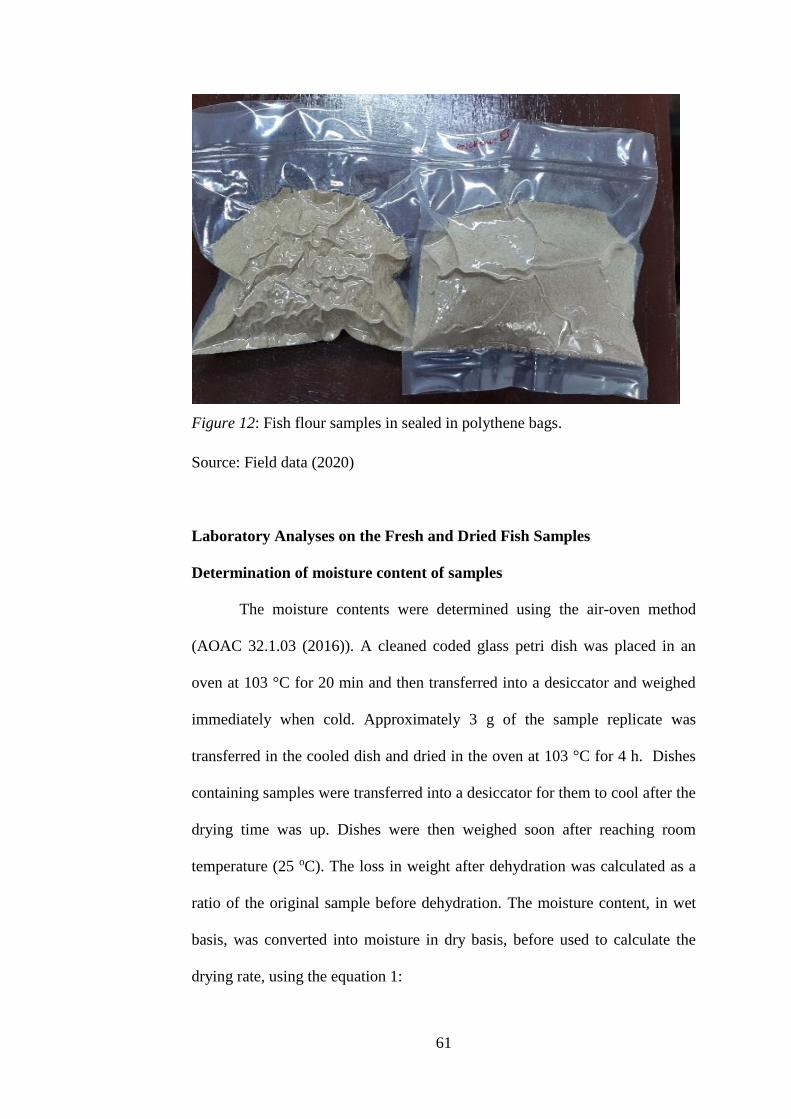
61
Figure 12: Fish flour samples in sealed in polythene bags.
Source: Field data (2020)
Laboratory Analyses on the Fresh and Dried Fish Samples
Determination of moisture content of samples
The moisture contents were determined using the air-oven method
(AOAC 32.1.03 (2016)). A cleaned coded glass petri dish was placed in an
oven at 103 °C for 20 min and then transferred into a desiccator and weighed
immediately when cold. Approximately 3 g of the sample replicate was
transferred in the cooled dish and dried in the oven at 103 °C for 4 h. Dishes
containing samples were transferred into a desiccator for them to cool after the
drying time was up. Dishes were then weighed soon after reaching room
temperature (25 oC). The loss in weight after dehydration was calculated as a
ratio of the original sample before dehydration. The moisture content, in wet
basis, was converted into moisture in dry basis, before used to calculate the
drying rate, using the equation 1:

62
…… (1)
Determination of drying curve
The drying curves of the drying samples were determined by sampling
from the bulk fish being dried every two hours for all the treatments. The
moisture content of the samples was determined as described in 3.6.1. The
drying curve was then plotted using the moisture content obtained per every
sampling time (2 h).
Chemical analysis
Proximate analysis (moisture, protein, fat and ash) as well as mineral
analysis were carried out. In addition, the level of histamine and
contamination with heavy metals (lead, cadmium and arsenic) were also
determined on the dried fishes (anchovies and Atlantic bumper) samples
obtained from the four different drying facilities employed in the study.
Preparation of samples for chemical analyses
About 1 kg of dried fish samples from the different drying methods as
well as the fresh fish samples were homogenized using a laboratory blender
(Panasonic Mx-Ac 300 Mixer Grinder). Samples from the homogenates were
used for the various analyses, which were carried out in duplicates.

63
Proximate and mineral analysis on fish
Proximate and mineral analysis (moisture, protein, fat, ash, calcium,
iron, phosphorus) were determined using standard procedures of the
Association of Official Analytical Chemists (AOAC) international.
Determination of ash content of samples.
Ash content was determined by using the muffle furnace method
(AOAC 32.1.05 (2016)). Approximately 3 g of sample was placed in a
previously weighed silica crucibles and then placed into furnace and ashed for
8 h at 550°C (±10 °C). The weight of the ash was expressed as a ration of the
initial weight of the original sample. After 8 h of ignition of samples, the
temperature of the furnace was left to drop to at least 250 °C and then
crucibles were transferred into desiccator. They were weighed soon after
reaching room temperature. The ash content of the samples was calculated
using equation 2:
………………….. 2
Crude fat content
The fat content was determined by AOAC 920.39 (2000) using the
continuous soxhlet extraction method. About 2 g of previously dried sample
was placed in an extraction thimble and stopped with grease- free cotton. The
flask was dried, cooled and weighed prior to the extraction process. The
thimble was placed in the extraction chamber and 240 mL of petroleum ether
(analytical reagent) was added to extract the fat. The extraction was done for 5
h at a condensate rate of 5- 6 drops per second. The extracted fat in the flask

64
was then dried in an oven at 103 ± 2 °C for 1 h. The dried fat was then cooled,
and weight recorded. A blank was run in the same procedure but without the
sample. The percentage fat was calculated using equation 3:
….. 3
Crude protein content
The crude protein content was determined using the Kjeldahl method
AOAC 991.20 (2000). About 0.2 g of the samples were weighed on a filter
paper and transferred into the Kjedahl flask. About 15 mL of concentrated
sulphuric acid and the catalyst (kjeltab) were added to the sample and digested
at a temperature of 400 °C for 2 h. The digestion process was stopped when
there was a colour change. The digested sample was steam distilled with
80mL of water and 80 mL of 40 % sodium hydroxide. Ammonia produced
during distillation was received into a conical flask containing 25 mL of boric
acid (4.0 %) using screened methyl red as indicator. The solution was then
titrated against 0.01 N of the HCl solution to the end point (T). A blank (B)
was run in the same condition as that of the sample. The crude protein is
determined by multiplying the percentage nitrogen by a constant factor of
6.25, (AOAC, 2000). The crude protein of the samples was calculated using
equation 4:
………………. 4

65
Calcium content
The calcium content was determined according to the method AOAC
11.2.01G (2016). Approximately 3 g of fish sample was ashed at a
temperature of 550 ± 10 °C. Exactly 10 mL of 50 % HCl was added to the
ashed sample and transferred into a 50 mL volumetric flask and made to the
mark with distilled water. An aliquot (5 mL) of the solution was transferred
into a 250 mL conical flask and 100 mL of distilled water was added, followed
by 10 mL of 50 % HCL as well as two drops of methyl red indicator. The
solution was then placed on a hot plate. Exactly 5 g of urea was added to the
solution on the hot plate when it started to boil. It was then followed by the
addition of 15 mL ammonium oxalate. After a period of 10 min, 50 % NH4OH
was added for a change in colour. The solution was left to precipitate over a
period of 4 h, filtered using a number 1 Whatman filter paper. The filter paper
was then washed with 300 – 350 mL distilled water. The filter paper was then
crushed in a beaker with 50 mL of 2 N H2SO4. This was allowed to boil on a
hot plate. Titration was then carried on against 0.02 N KMn2O4 until a light
pink colour was observed. The titre value was obtained and calcium content
was calculated using the equation 5:
Calcium content (mg/100 g) is expressed as
……………….5
66
Phosphorus content
The phosphorus content of the samples was determined according to
the AOAC 3.4.11 (2016) procedure, Ammonium molybdate blue method.
Approximately 3 g of fish sample was ashed at a temperature of 550 ± 10 °C.
Exactly 10 mL of 50 % HCl was added to the ashed sample and transferred
into a 50 mL volumetric flask and made to the mark with distilled water. An
aliquot (0.1 mL) of solution was transferred into another 50 mL volumetric
flask. A pinch of ascorbic acid was added to the solution. The walls of the
volumetric flask were washed with some amount of distilled water after which
the solution was made to stand for about 10 min. 5 mL of ammonium
molybdate (25 g/L sodium molybdate in 50 % sulphuric acid) was added to
the solution. This was then placed into a water bath at a temperature of 100 °C
until a blue colour developed. The volumetric flask was then topped up with
distilled water to the mark. Phosphorus content was then determined by the
use of spectrophotometer (Cecil CE 74000, 7000 series) at a wavelength of
655 nm. The absorbance was read and the phosphorus content determined by
calculation. A blank determination was used to zero the system. The
concentration is read by tracing the absorbance to a standard phosphorus
curve, using equation 6:
Phosphorus content (mg/100 g) = ……………6
where P is concentration of standard phosphorus

67
Iron content
Iron content of the samples was determined based on the 2, 2-
Bipyridine method (AOAC, 2016). Approximately 3 g of fish sample was
ashed at a temperature of 550 ± 10 °C. 10 mL of 50 % HCl was added to the
ashed sample and filtered into another 50 ml volumetric flack and made to the
mark with distilled water. An aliquot (5 ml) of the solution was pipetted into a
50 mL volumetric flask. A pinch of ascorbic acid was added to the solution.
The walls of the volumetric flask were washed with some amount of distilled
water after which the solution was made to stand for about 10 min. 10 mL of
20 % ammonium acetate was added to the solution. A 2 mL of 0.2 % 2, 2-
Bipyridine was immediately added to develop a light pink colour. It was then
kept in the dark for 1 h. The volumetric flask was then topped up with distilled
water to the mark. Iron content was then determined using spectrophotometer
(Cecil CE 74000, 7000 series) at a wavelength of 520 nm. The absorbance and
iron content were calculated using equations 7 and 8, respectively:
……………7
…………….
Determination of heavy metals concentrations in fish
The heavy metal concentrations in the samples were determined using
methods AOAC 9.1.09 and AOAC 9.2.03 (AOAC, 2000). Approximately 0.2
g of sample was weighed into a beaker, using an analytical balance, and
digested with 5 mL concentrated nitric acid (65 % purity) and was then placed
on a hot plate for 1 h. A 1 mL of sulphuric acid was then added and repeated

68
at an interval of 30 min until a total digestion period in 3 h. After digestion 5
mL of distilled water added and stirred thoroughly. A 1 % nitric acid was
added to the digest and then filtered into a 50 mL volumetric flask to the mark.
The heavy metals in the sample were then determined using the GTA 120
Graphite Tube Atomizer, 200 Series AA. The heavy metals determined in mg/
100g included lead, cadmium and arsenic with detection wavelengths of
283.31 nm, 228.80 nm and 193.7 nm respectively; using equation 9:
……..9
Determination of histamine in fish
The histamine levels in the samples were determined using
spectrophotometric method described by Hardin and Smith (1976). About 10 g
of the fresh and dried fish devoid of scales, skin, guts and other undesirable
parts were minced and used for the analysis. About 100 mL of freshly
prepared 2.5 % trichloroacetic acid (TCA) was added, homogenized and
filtered. The volume of the TCA sample was noted and neutralized to pH 7
with 1N KOH and 0.2N HCl, the new volume was then recorded.
Narrow chromatography column was packed with 1 g Amberlite CG-
50 resin and washed with 150 mL acetate buffer to make the surface of the
liquid align to the surface of the resin. About 75 mL of the neutralized TCA
sample solution was then added to the column and drained onto the surface of
the Amberlite CG-50. The column was then washed with 100 mL acetate
buffer to remove interfering substances. Histamine was eluted with exactly 25
mL of 0.2 N HCl and collected in a 50 mL beaker. A blank determination was

69
done using similar volume of 2.5 % TCA. About 1 mL of the HCl eluate was
added to 15 mL 5 % Na2CO3 in a stoppered test tube previously chilled in an
ice water bath. A volume of 2 mL of chilled diazo reagent was then added to
the mixture and allowed to stand at 0 oC for 10 min prior to absorbance
measurement. Absorbance of mixture was measured at 495 nm using distilled
water as a reference.
A standard curve was also prepared by using 1 mL aliquot of a
standard histamine solution (0-80 μg histamine/ml 0.2 N HC). 80 μg/mL
(2mg/25ml) in the acid eluent. Histamine is calculated using equation 10.
……... 10
Where H =Histamine (ppm/ μg/g)
F= Volume of sample after neutralization
E= Volume of extract after filtration through Amberlite CG-50 resin column.
Microbiological Analysis of Fish Samples.
The safety of fresh and processed fish (both experimental and
reference samples) was determined by microbial analysis. Enumeration and
detection of enteric and indicator pathogens such as Bacillus cereus,
Enterobacteriaceae, Enterococcus, yeast and moulds, Staphylococcus aureus,
E.coli, Aerobic mesophiles and Total coliforms were carried out.

70
Homogenization and serial dilution
For all samples, ten grams (10 g) were added to 90.0 mL sterile Salt
Peptone Solution (SPS) containing 0.1 % peptone and 0.8 % NaCl, with pH
adjusted to 7.2 and homogenized in a stomacher (Lad Blender, Model 4001,
Seward Medical, England), for 30 s at normal speed to obtain 1:10 dilution.
Further dilutions were done to obtain ten-fold dilutions after which 1 mL
aliquots of each dilution was directly inoculated into sterile Petri dish and the
appropriate media added for enumeration of microorganisms. All analyses
were done in duplicate.
Enumeration of aerobic mesophiles
Aerobic mesophiles were enumerated by the pour plate method on
Plate Count Agar medium (Oxiod CM325; Oxoid Ltd., Basingstoke,
Hampshire, UK). About 1 ml of each dilution was inoculated into sterile
Petri dishes and sterile molten Plate count agar was poured on it. The
plates were left to set at room temperature. The plates were then
incubated at 30 °C for 72 h in accordance with NMKL. No. 86, 2013. Plates
containing colonies between 25- 250 were selected and counted.
Enterobacteriaceae determination
Enterobacteriaceae was determined by the pour plate method
according to NMKL No. 114 (2004). Exactly, 1 ml of the serial dilution was
inoculated into sterile Petri dishes. Molten TSA was poured on the Petri dishes
and swirled to evenly mix the inoculum and the agar. The media in plates were
then allowed to set and pre-incubated at room temperature for 1-2 h. After the

71
incubation the TSA was overlaid with Violet Red Bile Glucose Agar
(VRBGA) (Oxoid CM107) with pH 7.4 and allowed to set again at room
temperature and then incubated at 37 oC for 24 h.
Enumeration of yeast and moulds
Yeast and moulds were enumerated by spread plate method on
Dichoran Rose Bengal Chloramphenicol (DRBC) Agar (OXIOD CM0727),
Ph 5.6, containing Chloramphenicol supplement to prevent bacteria growth
and incubated at 25 oC for 3-5 days in an upright position inn accordance with
(ISO 21527-1:2008).
Enumeration and isolation of total coliform
Coliform bacteria were counted by the pour plate method using
tryptone soya Agar medium (OXOID CM131) adjusted to pH 7.3 and overlaid
with Violet Red Bile agar (OXOID CM 107) with pH adjusted to 7.4 and
incubated at 37 °C for 24 h. Colonies were confirmed using Brilliant Green
Bile Broth (OXOID CM 31) at pH of 7.4 and incubated at 37 °C for 24 h in
accordance with NMKL no.44, (2004). Positive reaction was indicated by the
production of gas at the entire bent portion of the Durham tube.
Enumeration of Escherichia coli
E. coli were enumerated by the pour plate method using Tryptone Soya
Agar medium (OXOID CM131) adjusted to the pH 7.3 and overlaid with
Violet Red Bile agar (OXOID CM 107) with pH adjusted to 7.4 and incubated
at 44 °C for 24 h. Suspected colonies were confirmed using E.C. broth
72
(OXOID CM 853) with pH adjusted to 6.9. Colonies that produced gas that
has filled the entire concave part of the Durham tube were taken as thermos-
tolerant coliform bacteria. To determine E. coli thermo-tolerant bacteria were
confirmed for Indole production. This was done by sub-culturing into positive
tubes into tryptone broth and incubate at 44 °C for 24 hours. Indole test was
carried out by adding 0.3-0.5 ml of Kovac‘s reagent into the culture. Red ring
colouration at the surface of tryptone broth indicated Indole positive in
accordance with NMLK no.125, 2013.
Enumeration of Staphylococcus aureus
Staphylococcus aureus was determined using the spread plate method
on Baird Parker Agar (BP, CM 275 Oxiod Ltd, Hampshire, England) containg
Egg Yolk Tellurite Emulsion (SR54). Suspected colonies were confirmed for
coagulase positive on rabbit coagulase plasma (C14389) according to NMKL
Method No. 66 (2009). About 0.1 mL of each serial dilution was inocultaed
onto the surface of the already prepared Baird Parker in a petri dish. With th
use of sterile spreaders, the inoculum was uniformly spread on the surface of
the agar. The inoculum was left to dry at room temperature and incubated at
37 oC for 48 h. Suspected colonies wre confirmed on blood agar base and for
coagulase test. Colonies showing haemolysis on the blood agar and coagulates
on the rabbit coagulase plasma indicate positive Staphylococcus aureus.
Enumeration of Bacillus cereus
Bacillus cereus was enumerated by spread plate technique on Bacillus
Cereus Agar Base (CM0617) to which Polymyxin B. supplement (SR0099E)
73
was added. Suspected colonies were confirmed on Blood Agar Base ( OXIOD
CM0055), for the presence of haemolysis as described by NMKL No.
67,2010.
Enumeration of Salmonella
Salmonella spp in the samples were determined according to NMKL
No. 71, (1999). A weight of 25 g of the sample was measured into a sterile bag
and 225 mL of Buffered Peptone Water (CM0509) was added and used as pre
–enrichment broth and incubated at 37 oC for 21 h. Exactly 1ml of the
suspension was sub-cultured into Rapapport Valisialdis Soya Peptone Broth
(CM0866) broth and incubated at 37 oC for 24 h. After incubation, the
suspension was subsequently streaked on XLD Agar (CM0469 Oxoid Ltd,
Hampshire, England) and incubated at 37 oC for 24 h. Suspected
Salmonella species was confirmed by biochemical test on Tripple Sugar Iron
Agar (Vm381715 214, Merck KGaA Darmstadt,Germany) and serological test
using Salmonella Polyvalent Agglutinating Sera (30858501ZD01, UK).
Enumeration of Listeria monocytogenes
Listeria monocytogenes in the samples were determined according to
ISO 11290-1 (1996). A weight of 25 g of the sample was measured into a
sterile bag and 225 mL of primary enrichment medium (half- Fraser broth; B1)
was added and incubated at 30 oC for 24 h, after which 0.1 mL of the
suspension was sub-cultured into 10 ml of secondary enrichment medium
(Frase broth; B2) and incubated at 37 oC for 24 h. After incubation, the

74
suspension was plated on oxford agar for 24 h at 30 oC aerobically and
PALCAM agar for 24 h at 30 oC.
Food Products Preparation
The fish powder obtained from dried anchovies and Atlantic bumper
fish were used in the production of two food products:
1. Biscuits to serve as a healthy snack for both adults and children
2. Instant Cereal Mix to serve as complementary food for children and
can however serve as breakfast cereal for adults as well
Incorporating the dried fish powder into biscuit
The percentages of the flour proportions of wheat flour and fish
powder used for the biscuit preparation, as shown in Table 1, took into
considerations the work of Elbandy (2015), and Abraha et al. (2018). Elbandy
produced fortified biscuit, using 3, 6 and 9 % of crayfish protein concentrate
powder, whilst Abraha et al. incorporated sturgeon fillet protein concentrate at
5, 7 and 10 %. These research works made use of fish protein concentrates
from various fish species and not the fish powder. Also, the researchers did
not fortify the wheat flour with fish protein concentrate beyond 10 %. This
therefore explains the need to make use of under- utilized fish powder, which
is accessible and can easily be processed. Fish protein concentrate (FPC) are
specially concentrated high-quality protein (between 75 and 95 %) than the
original fish flesh, therefore increasing fish powder further to 15 % will
compensate for the protein content of fish powder fortified biscuit.
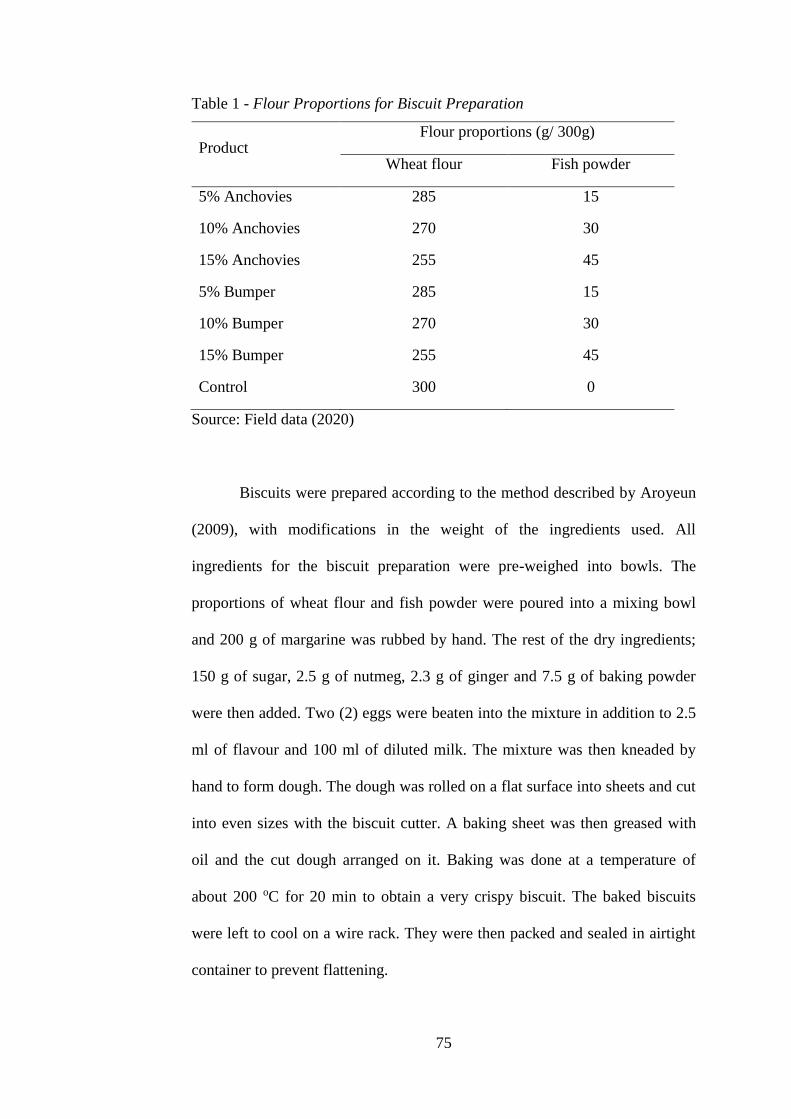
75
Table 1 - Flour Proportions for Biscuit Preparation
Product Flour proportions (g/ 300g)
Wheat flour Fish powder
5% Anchovies 285 15
10% Anchovies 270 30
15% Anchovies 255 45
5% Bumper 285 15
10% Bumper 270 30
15% Bumper 255 45
Control 300 0
Source: Field data (2020)
Biscuits were prepared according to the method described by Aroyeun
(2009), with modifications in the weight of the ingredients used. All
ingredients for the biscuit preparation were pre-weighed into bowls. The
proportions of wheat flour and fish powder were poured into a mixing bowl
and 200 g of margarine was rubbed by hand. The rest of the dry ingredients;
150 g of sugar, 2.5 g of nutmeg, 2.3 g of ginger and 7.5 g of baking powder
were then added. Two (2) eggs were beaten into the mixture in addition to 2.5
ml of flavour and 100 ml of diluted milk. The mixture was then kneaded by
hand to form dough. The dough was rolled on a flat surface into sheets and cut
into even sizes with the biscuit cutter. A baking sheet was then greased with
oil and the cut dough arranged on it. Baking was done at a temperature of
about 200 oC for 20 min to obtain a very crispy biscuit. The baked biscuits
were left to cool on a wire rack. They were then packed and sealed in airtight
container to prevent flattening.
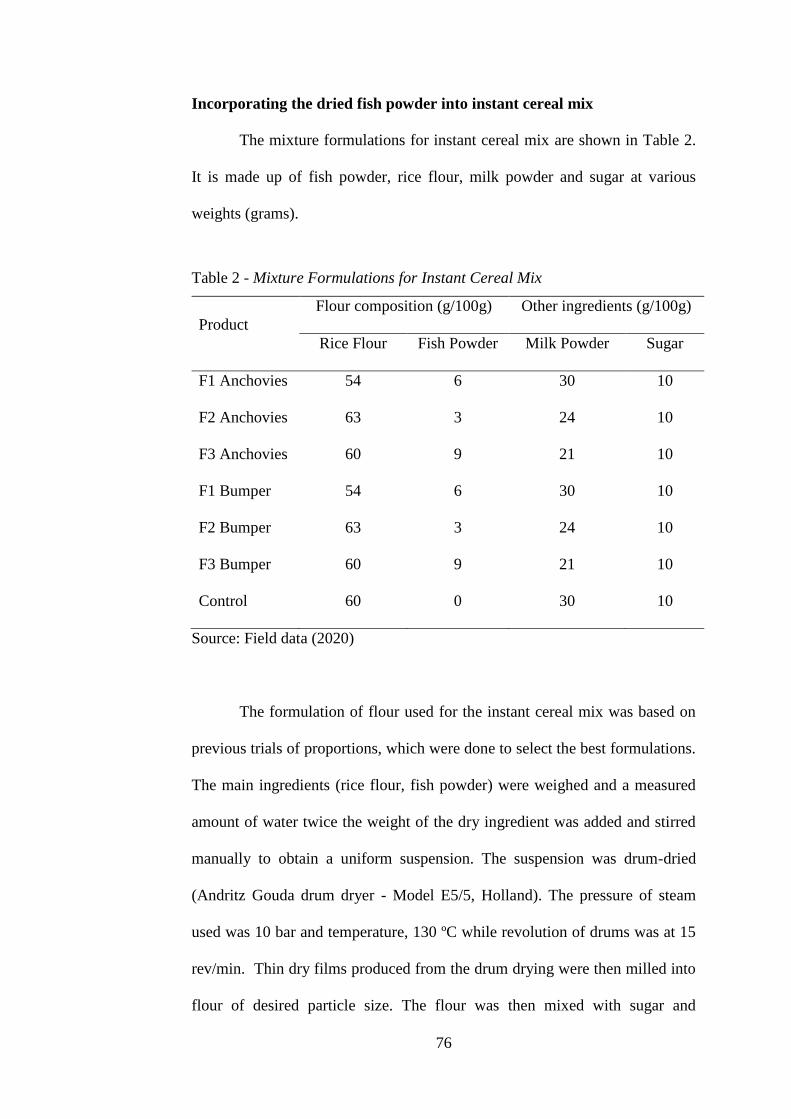
76
Incorporating the dried fish powder into instant cereal mix
The mixture formulations for instant cereal mix are shown in Table 2.
It is made up of fish powder, rice flour, milk powder and sugar at various
weights (grams).
Table 2 - Mixture Formulations for Instant Cereal Mix
Product
Flour composition (g/100g) Other ingredients (g/100g)
Rice Flour Fish Powder Milk Powder Sugar
F1 Anchovies 54 6 30 10
F2 Anchovies 63 3 24 10
F3 Anchovies 60 9 21 10
F1 Bumper 54 6 30 10
F2 Bumper 63 3 24 10
F3 Bumper 60 9 21 10
Control 60 0 30 10
Source: Field data (2020)
The formulation of flour used for the instant cereal mix was based on
previous trials of proportions, which were done to select the best formulations.
The main ingredients (rice flour, fish powder) were weighed and a measured
amount of water twice the weight of the dry ingredient was added and stirred
manually to obtain a uniform suspension. The suspension was drum-dried
(Andritz Gouda drum dryer - Model E5/5, Holland). The pressure of steam
used was 10 bar and temperature, 130 ºC while revolution of drums was at 15
rev/min. Thin dry films produced from the drum drying were then milled into
flour of desired particle size. The flour was then mixed with sugar and
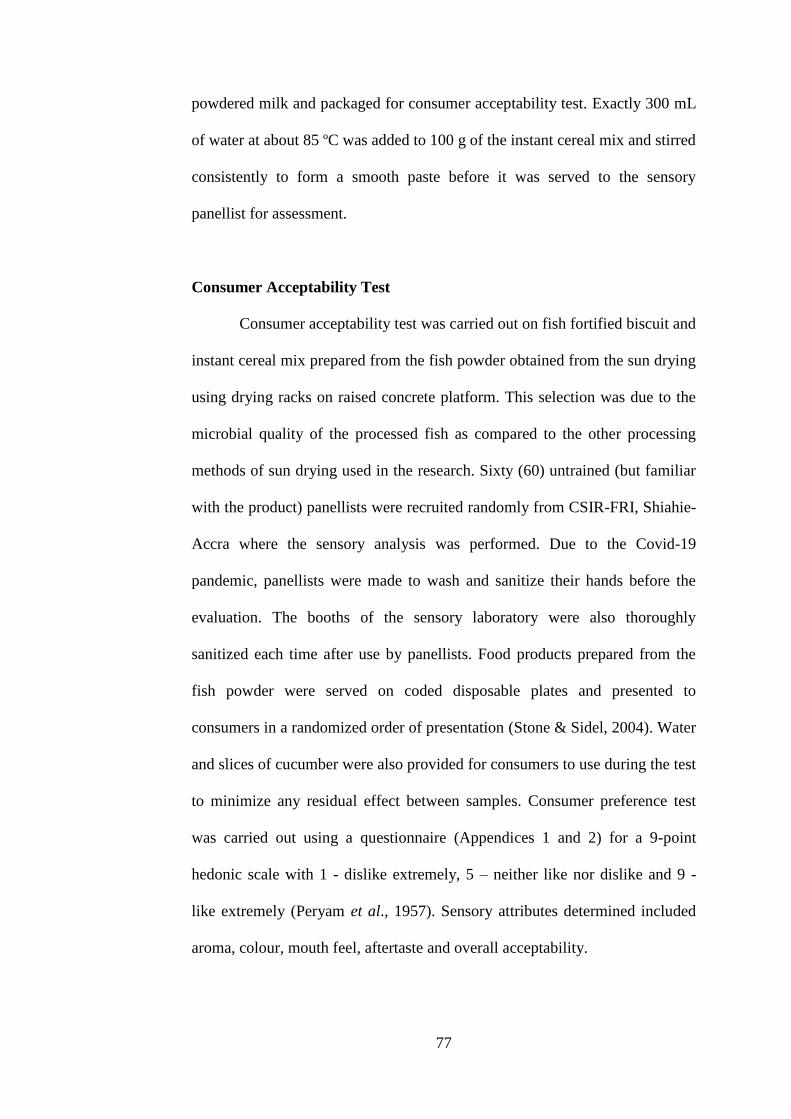
77
powdered milk and packaged for consumer acceptability test. Exactly 300 mL
of water at about 85 ºC was added to 100 g of the instant cereal mix and stirred
consistently to form a smooth paste before it was served to the sensory
panellist for assessment.
Consumer Acceptability Test
Consumer acceptability test was carried out on fish fortified biscuit and
instant cereal mix prepared from the fish powder obtained from the sun drying
using drying racks on raised concrete platform. This selection was due to the
microbial quality of the processed fish as compared to the other processing
methods of sun drying used in the research. Sixty (60) untrained (but familiar
with the product) panellists were recruited randomly from CSIR-FRI, Shiahie-
Accra where the sensory analysis was performed. Due to the Covid-19
pandemic, panellists were made to wash and sanitize their hands before the
evaluation. The booths of the sensory laboratory were also thoroughly
sanitized each time after use by panellists. Food products prepared from the
fish powder were served on coded disposable plates and presented to
consumers in a randomized order of presentation (Stone & Sidel, 2004). Water
and slices of cucumber were also provided for consumers to use during the test
to minimize any residual effect between samples. Consumer preference test
was carried out using a questionnaire (Appendices 1 and 2) for a 9-point
hedonic scale with 1 - dislike extremely, 5 – neither like nor dislike and 9 -
like extremely (Peryam et al., 1957). Sensory attributes determined included
aroma, colour, mouth feel, aftertaste and overall acceptability.

78
Statistical Analysis
All data collected in the study were subjected to analysis of variance
using Minitab Release 17 statistical software (Minitab Inc. Brandon Court,
United Kingdom). Means were separated at 95 % confidence interval to
determine statistically significant differences between them. Graphs were
generated using Microsoft Office, Excel 2017.

79
CHAPTER FOUR
RESULTS
This chapter presents all the results of the experiments carried out as
explained in Chapter 3; the Materials and Methods. There are two main sets of
results; the first set is drying data of the fish samples using the four different
drying methods, data on the chemical and microbiological analyses of dried
anchovies (Engraulis Encrasicolus) and Atlantic bumper fish
(Chloroscombrus Chrysurus). The second is for results on consumer
acceptability tests of instant cereal mix and biscuits formulated with the dried
fish powders.
Drying Curves of Anchovy Fish using Three Sun Drying and Solar
Drying Methods
Figure 13 shows the drying curves of anchovies using three sun-drying
methods with temperature (bare ground drying, raised concrete platform
(RCP) and raised concrete platform with netted drying racks (RCP+NDR)).
Generally, it was observed that there was a decrease in moisture with drying
time (Figure 13 and 14). The rate of drying of the anchovies were faster in the
solar dryer than that with the sun dryers. Moisture losses due to the drying
methods were dependent on time and temperature. The initial moisture of the
anchovy samples was 78.71 %.
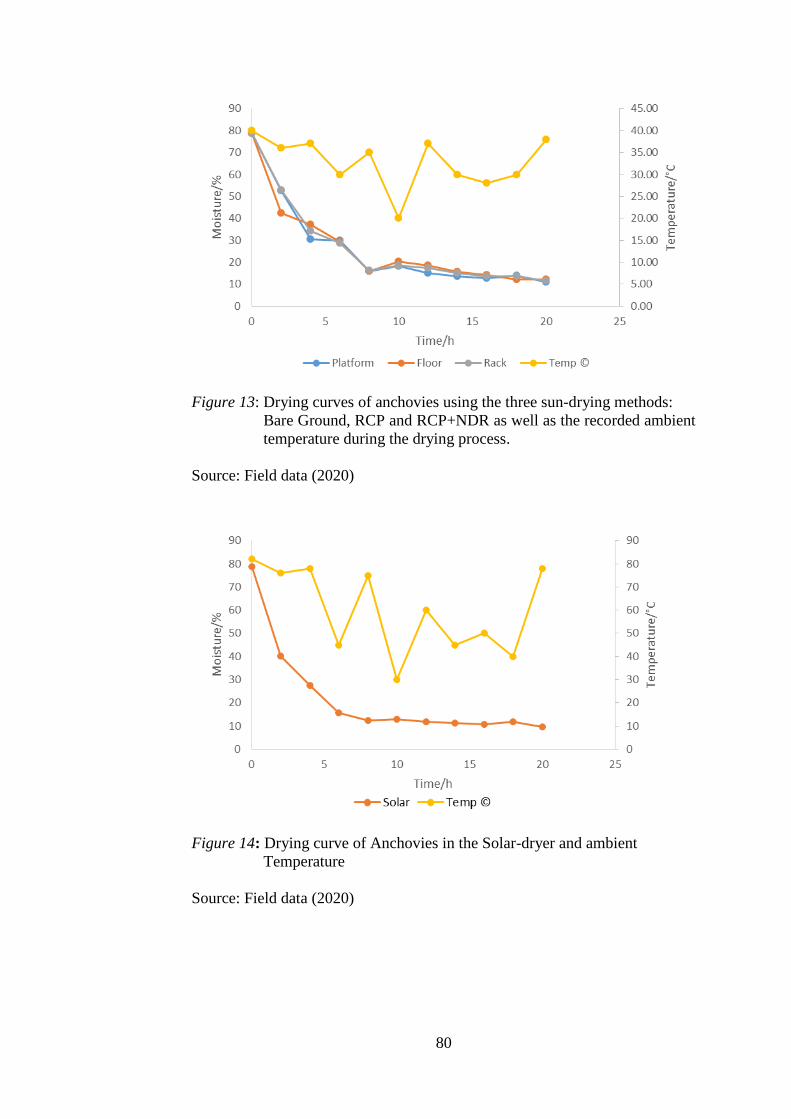
80
Figure 13: Drying curves of anchovies using the three sun-drying methods:
Bare Ground, RCP and RCP+NDR as well as the recorded ambient
temperature during the drying process.
Source: Field data (2020)
Figure 14: Drying curve of Anchovies in the Solar-dryer and ambient
Temperature
Source: Field data (2020)

81
Though there was a general decrease in moisture content over the
drying period, moisture content of the samples dried using sundrying
momentarily increased initially at10 h and then again at18 h of drying. This
can be attributed to drops in ambient temperature to 20 oC (at 10 h) and 30 o C
(at 18 h) respectively (Figure. 13 and 14). The three sun-drying methods (bare
ground drying, raised concrete platform (RCP) and raised concrete platform
with netted drying racks (RCP+NDR)) used depicted comparable patterns of
drying with fluctuations in the moisture content as temperatures reduced.
Steeper drying curves were obtained with samples that were solar dried than
those from the two improved sun-drying methods, even though there were
minimal fluctuations in moisture loss.
During the early mornings of the study, the temperature was low and
this must have caused moisture absorption by the samples. Percentage
moisture loss was higher at the beginning of the drying processing but
decreased with decreasing moisture content. Drying temperatures in the solar
dryer were higher as compared with the sun-drying method. The maximum
temperature of 82 oC was recorded in the solar dryer whiles 40 oC was
recorded during the Sun- drying processing. The critical moisture content of
15.79 % was recorded on the 6th hour in the solar dryer whiles 29.85 %, 29.39
% and 28.63 % were recorded respectively for RCP, bare ground and
RCP+NDR on the sun dried sample at the same time. Solar dried anchovies
recorded the lowest moisture content after the drying period whiles the
moisture content of the sun dried anchovies were comparable. The falling
phase was the longest phase of drying as found in Figure 13 and 14. It was
between the 8 h to 20 h of drying.

82
Drying Curve of Atlantic Bumper Fish using Solar Drying and Sun
Drying Methods
The changes in moisture content of Atlantic bumper fish against drying
time as well as drying temperature is as shown in Figures 15 and 16. As shown
in both Figures 15 and 16, there was a general reduction in moisture content of
the fish samples with time in all four drying facilities. The moisture loss was
highest during the first 4 hours, as shown by the steep nature of the drying
curves. Beyond this time, there was a slight reduction in the rate of moisture
loss till the 8th hour leading to an equilibrium moisture content though there
was a slight short term increase in the moisture content of the fish at 10 h. This
point coincided at the stage when the ambient temperatures were lowest
resulting in high atmospheric humidity. Therefore samples turn to absorb
moisture from the atmosphere.
The ambient temperature used for open sun drying was between 25- 40
oC compared with the temperature of the solar tunnel dryer, which ranged
between 30 and 82 oC during the day. The higher temperatures in the solar
dryer accounts for the faster drying and thereby lower moisture content in the
solar tunnel dryer compared with the open sun drying method (bare ground,
dried, RCP, RCP+NDR). The falling phase was the longest phase during the
drying process since it ranged between the 8 and 20 h of drying.
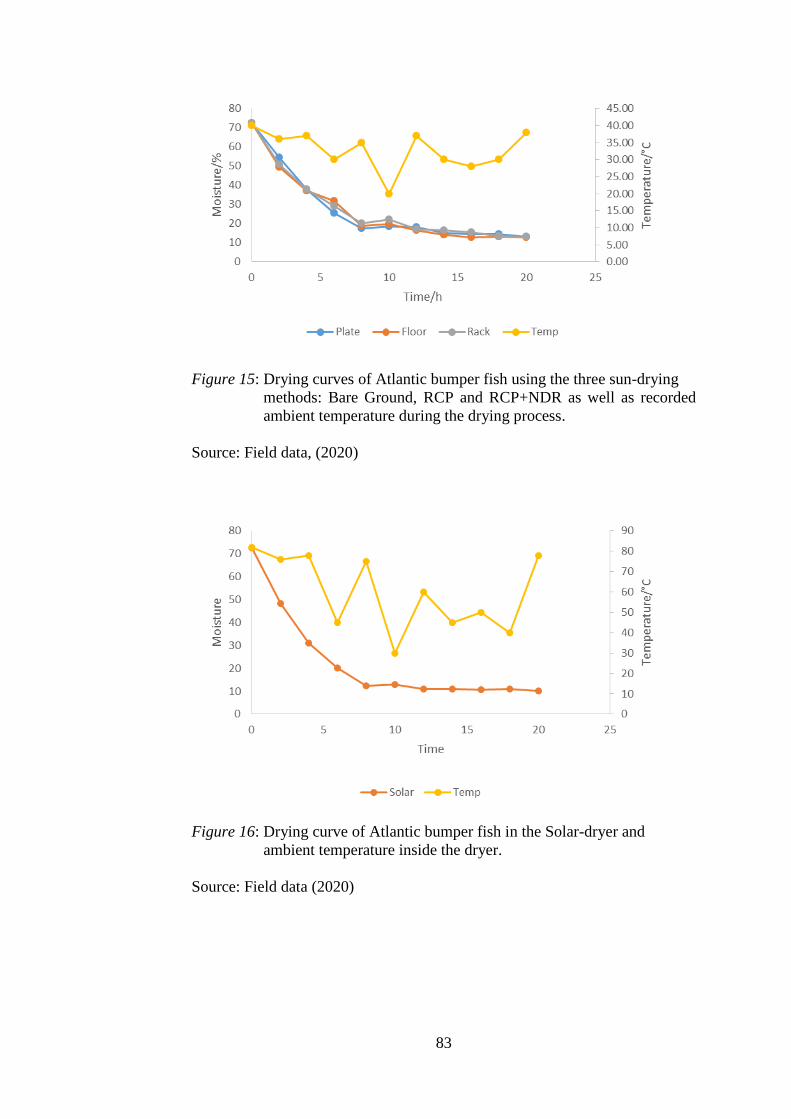
83
Figure 15: Drying curves of Atlantic bumper fish using the three sun-drying
methods: Bare Ground, RCP and RCP+NDR as well as recorded
ambient temperature during the drying process.
Source: Field data, (2020)
Figure 16: Drying curve of Atlantic bumper fish in the Solar-dryer and
ambient temperature inside the dryer.
Source: Field data (2020)
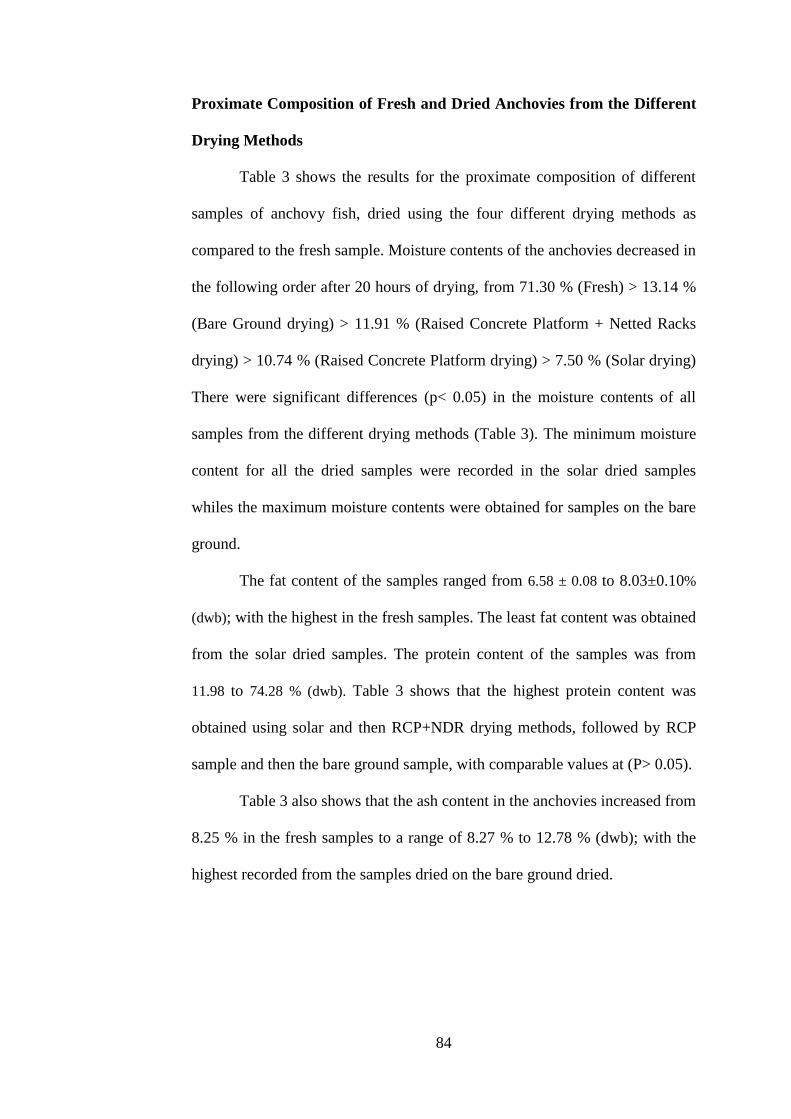
84
Proximate Composition of Fresh and Dried Anchovies from the Different
Drying Methods
Table 3 shows the results for the proximate composition of different
samples of anchovy fish, dried using the four different drying methods as
compared to the fresh sample. Moisture contents of the anchovies decreased in
the following order after 20 hours of drying, from 71.30 % (Fresh) > 13.14 %
(Bare Ground drying) > 11.91 % (Raised Concrete Platform + Netted Racks
drying) > 10.74 % (Raised Concrete Platform drying) > 7.50 % (Solar drying)
There were significant differences (p< 0.05) in the moisture contents of all
samples from the different drying methods (Table 3). The minimum moisture
content for all the dried samples were recorded in the solar dried samples
whiles the maximum moisture contents were obtained for samples on the bare
ground.
The fat content of the samples ranged from 6.58 ± 0.08 to 8.03±0.10%
(dwb); with the highest in the fresh samples. The least fat content was obtained
from the solar dried samples. The protein content of the samples was from
11.98 to 74.28 % (dwb). Table 3 shows that the highest protein content was
obtained using solar and then RCP+NDR drying methods, followed by RCP
sample and then the bare ground sample, with comparable values at (P> 0.05).
Table 3 also shows that the ash content in the anchovies increased from
8.25 % in the fresh samples to a range of 8.27 % to 12.78 % (dwb); with the
highest recorded from the samples dried on the bare ground dried.
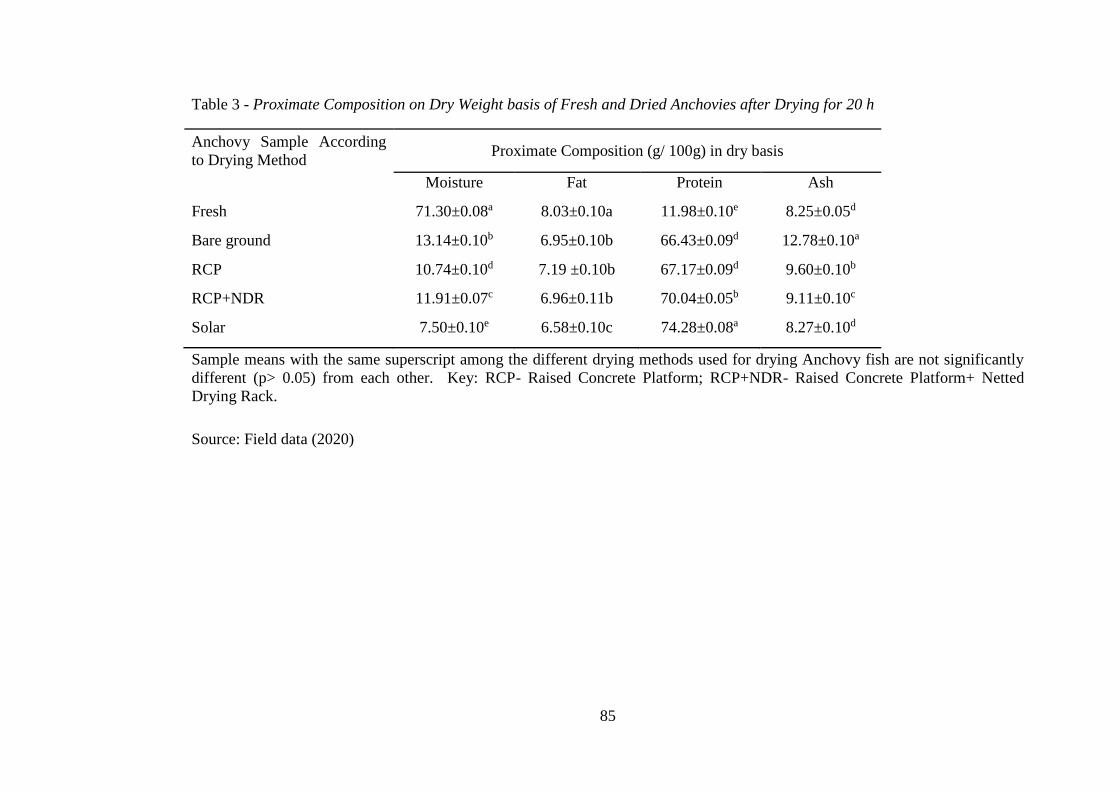
85
Table 3 - Proximate Composition on Dry Weight basis of Fresh and Dried Anchovies after Drying for 20 h
Sample means with the same superscript among the different drying methods used for drying Anchovy fish are not significantly
different (p> 0.05) from each other. Key: RCP- Raised Concrete Platform; RCP+NDR- Raised Concrete Platform+ Netted
Drying Rack.
Source: Field data (2020)
Anchovy Sample According
to Drying Method Proximate Composition (g/ 100g) in dry basis
Moisture Fat Protein Ash
Fresh 71.30±0.08a 8.03±0.10a 11.98±0.10e 8.25±0.05d
Bare ground 13.14±0.10b 6.95±0.10b 66.43±0.09d 12.78±0.10a
RCP 10.74±0.10d 7.19 ±0.10b 67.17±0.09d 9.60±0.10b
RCP+NDR 11.91±0.07c 6.96±0.11b 70.04±0.05b 9.11±0.10c
Solar 7.50±0.10e 6.58±0.10c 74.28±0.08a 8.27±0.10d

86
Mineral and Histamine Contents of Fresh and Dried Anchovies from the
Different Drying Methods
The mineral contents of Iron, phosphorus and Calcium of the
anchovies are displayed in Table 4. The maximum mineral contents (65.13 ±
2.22, 5309.5 ± 5.92 and 5155.00 ± 2.61 mg/100 g of Fe, P and Ca
respectively) were recorded in the fresh anchovy samples. Minimum values
for all the mineral components of the samples were recorded in the samples
that were dried using the raised concrete platform. Iron content decreased from
65.13 mg/100g in the fresh anchovies to a range of 31.12 to 35.31 mg/100g in
the dried anchovies. Solar dried anchovies had the highest mineral contents
(Fe, P and Ca) amongst all the drying methods. Notwithstanding, the
phosphorus and iron contents were comparable amongst the drying methods.
The heavy metal components analysed during the study were Cadmium (Cd),
Lead (Pb) and Arsenic (As). Cd and Pb were below detection limits. As
content were in the range of 0.03±0.00 and 0.68±0.08. Maximum and
minimum values were recorded in the fresh and solar dried samples
respectively. As contents of all the dried samples were not significantly
different (p>0.05) from each other, but significantly different (p<0.05) from
the fresh samples
Histamine content of the anchovies was 0.0489 ppm in the fresh
samples, but decreased significantly (p<0.05) to a range of 0.0130 and 0.0098
ppm after drying. Solar dried anchovies had the least histamine content of
0.0098 ppm, whilst those dried using the RCP, RCP+NDR and Bare ground
were 0.0118, 0.123 and 0.0098 ppm, respectively (Table 4).
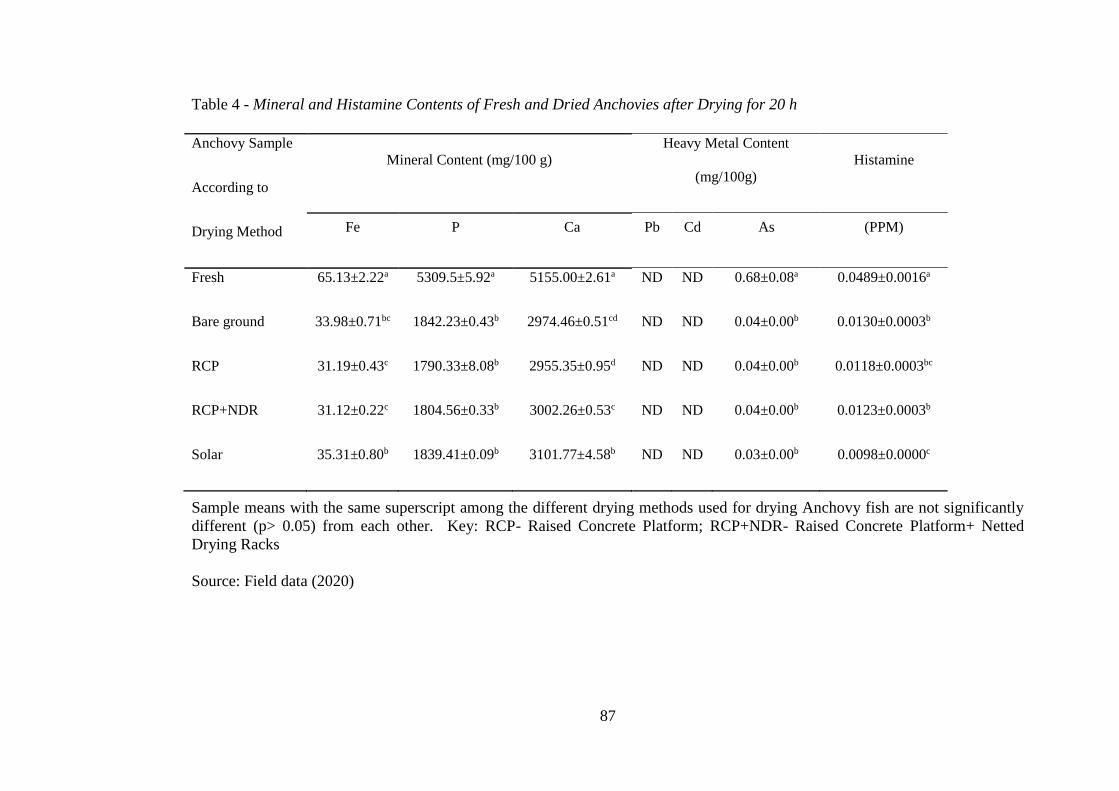
87
Table 4 - Mineral and Histamine Contents of Fresh and Dried Anchovies after Drying for 20 h
Sample means with the same superscript among the different drying methods used for drying Anchovy fish are not significantly
different (p> 0.05) from each other. Key: RCP- Raised Concrete Platform; RCP+NDR- Raised Concrete Platform+ Netted
Drying Racks
Source: Field data (2020)
Anchovy Sample
According to
Drying Method
Mineral Content (mg/100 g)
Heavy Metal Content
(mg/100g)
Histamine
Fe P Ca Pb Cd As (PPM)
Fresh 65.13±2.22a 5309.5±5.92a 5155.00±2.61a ND ND 0.68±0.08a 0.0489±0.0016a
Bare ground 33.98±0.71bc 1842.23±0.43b 2974.46±0.51cd ND ND 0.04±0.00b 0.0130±0.0003b
RCP 31.19±0.43c 1790.33±8.08b 2955.35±0.95d ND ND 0.04±0.00b 0.0118±0.0003bc
RCP+NDR 31.12±0.22c 1804.56±0.33b 3002.26±0.53c ND ND 0.04±0.00b 0.0123±0.0003b
Solar 35.31±0.80b 1839.41±0.09b 3101.77±4.58b ND ND 0.03±0.00b 0.0098±0.0000c
88
Proximate Composition of Fresh and Dried Atlantic bumper Fish from
the Different Drying Methods
The proximate composition of Atlantic bumper fish, dried using the
four different drying methods are as provided in Table 5. The initial moisture
content of the fresh Atlantic bumper fish at 67.59 % decreased during the
drying process. Comparing the drying methods, the minimum and maximum
moisture contents were recorded in the samples that were solar and bare
ground dried, respectively. There were significant differences (p<0.05) in all
the samples analysed (Appendix 3). The moisture content of the samples was
reduced in the following order during drying, from 67.59 (Fresh) > 15.34
(Bare Ground drying) > 13.98 (Raised Concrete Platform + Netted Racks
drying) > 12.96 (Raised Concrete Platform drying) > 10.53 % (Solar drying).
The fat content of the fresh Atlantic bumper fish was 9.99 %, which
decreased significantly (p<0.05) to a range of 6.88 to 8.34 % after drying. The
least fat content (6.88%) was recorded in the solar dried samples.
Values recorded for the protein content of the samples were from
13.40±0.99 in the fresh samples to 71.69±0.85 % (dwb) in the solar dried
samples (Table 5). Protein contents of all dried samples were significantly
different from the fresh samples. The ash content of the samples ranged from
6.33±1.03 % in the solar dried samples and 11.31±1.00 % in the samples that
were dried on the bare ground. There was no significant difference (p<0.05)
between the solar and Raised Concrete Platform + Netted Drying Racks dried
samples with reference to the ash content.

89
Table 5 - Proximate Compositions of Fresh and Dried Atlantic Bumper Fish after Drying for 20 h
Atlantic Bumper Fish Sample
According to Drying Method
Proximate Composition (g/ 100g) on dry weight basis
Moisture Fat Protein Ash
Fresh 67.59±0.85a 9.99±1.01a 13.40±0.99d 4.27±1.04c
Bare ground 15.34±1.07b 8.34±0.32ab 61.79±0.86c 11.31±1.00a
RCP 12.96±1.00bc 7.920±1.02ab 67.43±0.86b 7.63±1.02b
RCP+NDR 13.98±0.99b 8.32±1.01ab 67.46±0.86b 6.49±1.03bc
Solar 10.53±1.00c 6.88±1.03b 71.69±0.85a 6.33±1.03bc
Sample means with the same superscript among the different drying methods used for drying Atlantic bumper fish are not
significantly different (p> 0.05) from each other. Key: RCP- Raised Concrete Platform; RCP+NDR- Raised Concrete Platform+
Netted Drying Racks
Source: Field data (2020)

90
Mineral and Histamine Contents of Fresh and Dried Atlantic Bumper
Fish from the Four Different Drying Methods
The mineral and histamine contents of the fish samples are given in
Table 6. Generally, the mineral (Fe, P and Ca) contents of the fish reduced
from the fresh samples to the dried samples. Samples that were dried by the
solar method recorded the highest mineral contents compared to those by the
other methods. Arsenic was the only heavy metal that was detected in the fish
samples. Pb and Cd were below the detection limit. Arsenic was only detected
in the fresh and bare ground samples. The recorded values for both samples
were significantly different from each other.
Histamine content of the Atlantic bumper fish ranged from 0.0104 ±
0.0000 (in the samples that were solar dried) to 0.0294 ± 0.0027 ppm (in the
fresh samples) (Table 6). A general reduction was observed from the fresh to
the dried samples. The fresh samples were significantly different from all the
dried samples. However, there was no significant difference in all the samples
from the various drying methods. The sun-dried anchovies and Atlantic
bumper fish samples obtained from Tema New Town, James Town, Moree
and Adina processing sites were used as reference samples in comparison to
the fish samples dried using the Raised Concrete Platform+ Netted Drying
Racks (method of interest). The fresh fish samples (Anchovies and bumper)
used in the drying experiment were compared with the fresh fish obtained
from the processing sites. Also, the raised concrete platform with netted
drying racks (RCP+NDR) samples were compared with the dried fishes
obtained from the processing sites.
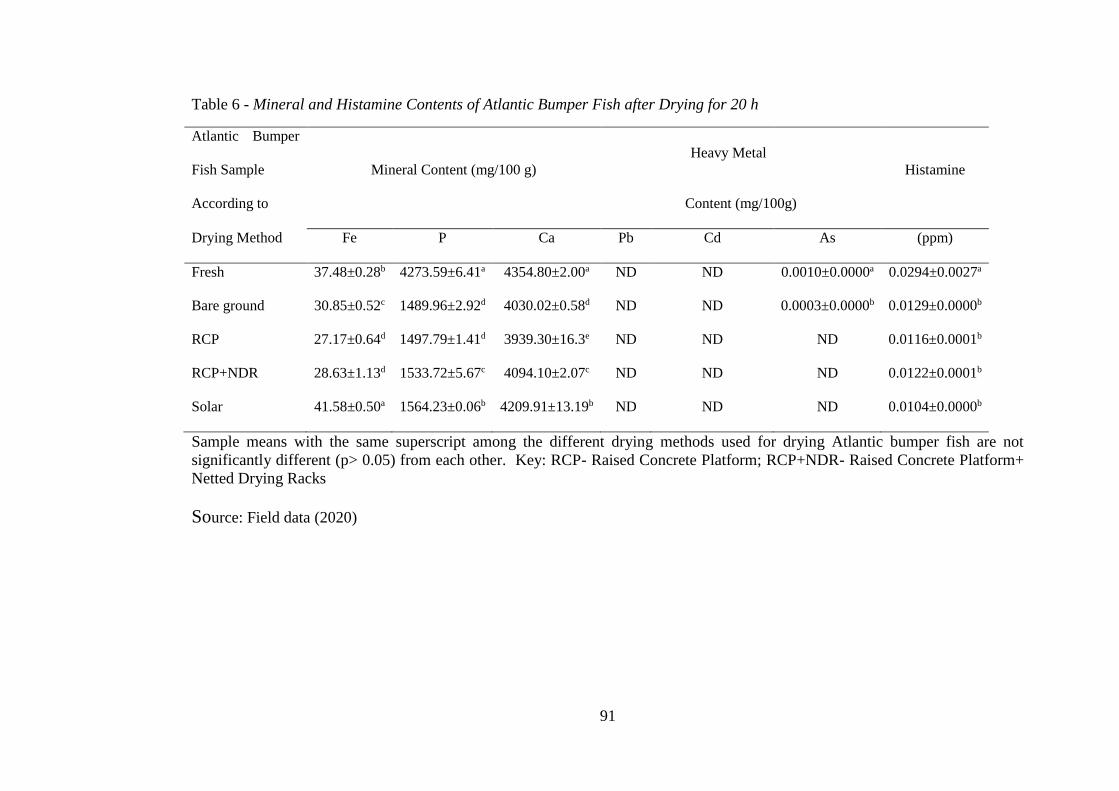
91
Table 6 - Mineral and Histamine Contents of Atlantic Bumper Fish after Drying for 20 h
Atlantic Bumper
Fish Sample Mineral Content (mg/100 g)
Heavy Metal
Histamine
According to Content (mg/100g)
Drying Method Fe P Ca Pb Cd As (ppm)
Fresh 37.48±0.28b 4273.59±6.41a 4354.80±2.00a ND ND 0.0010±0.0000a 0.0294±0.0027a
Bare ground 30.85±0.52c 1489.96±2.92d 4030.02±0.58d ND ND 0.0003±0.0000b 0.0129±0.0000b
RCP 27.17±0.64d 1497.79±1.41d 3939.30±16.3e ND ND ND 0.0116±0.0001b
RCP+NDR 28.63±1.13d 1533.72±5.67c 4094.10±2.07c ND ND ND 0.0122±0.0001b
Solar 41.58±0.50a 1564.23±0.06b 4209.91±13.19b ND ND ND 0.0104±0.0000b
Sample means with the same superscript among the different drying methods used for drying Atlantic bumper fish are not
significantly different (p> 0.05) from each other. Key: RCP- Raised Concrete Platform; RCP+NDR- Raised Concrete Platform+
Netted Drying Racks
Source: Field data (2020)
92
Proximate Composition of Fresh and Dried Anchovies from the Four
Different Processing Sites
The proximate compositions of both fresh and dried anchovy are
depicted in Table 7. The moisture content of the fresh fishes ranged from
70.30 to 72.44 %. The highest moisture content was recorded in samples from
Tema and James Town. For the dried samples, the RCP+NDR dried samples
had the least moisture content. Dried samples from Tema had the highest
moisture content as compared with the other samples from the other towns and
RCP+NDR. The moisture content of the samples that were from James Town
and Adina were not significantly different (p> 0.05).
Generally, the fat contents of the experimental fresh samples were
significantly different (p> 0.05) from the fresh samples from the various towns
except samples from James Town (Table 7). The samples from Tema had the
least fat content, but not significantly different from samples from Adina. The
fat content of the dried samples from the various towns were virtually the
same statistically (not significantly different (p> 0.05) from each other),
however, samples from Adina were not significantly different from the
experimental samples.
The protein content of the fresh anchovy from the experiment and that
of all the processing sites increased (concentrated) after moisture loss through
drying (Table 7). Dried anchovy from RCP+NDR however recorded the
highest protein content of 70.05 g/100g.
The ash content was not significantly different amongst the fresh
anchovy samples except fresh anchovy from James Town which recorded the
lowest ash content of 11.75 %. After the drying process, the ash content
93
ranged from 9.11 to 13.05 g/100g showing significant increase in the ash
content especially from the processing sites as found in Table 7. Raised
concrete platform with netted drying racks dried anchovy recorded the lowest
significant ash content of 9.11 g/100g.

94
Table 7 - Proximate Composition of Fresh and Dried Anchovies from the Four Different Processing Sites
State of Source of Sample Proximate Composition (g/ 100g)
Sample Moisture Fat Protein Ash
Fresh
Experimental 71.30±0.08b 8.03±0.10a 11.10±0.10b 8.22±0.10a
Adina 71.44±0.08b 7.16±0.10c 12.10±0.10a 7.95±0.10b
Tema 72.35±0.08a 7.05±0.10c 12.19±0.10b 7.13±0.10c
Moree 70.30±0.09c 7.49±0.11b 12.94±0.10a 7.25±0.11c
James Town 72.44±0.08a 8.16±0.10a 13.07±0.10a 5.18±0.10d
Dried
RCP+NDR 12.71±0.11c 6.96±0.10a 70.05± 0.08a 9.11±0.10d
Adina 13.95±0.10b 6.98±0.10a 64.44±0.09c 12.75±0.10b
Tema 16.09±0.10a 6.10±0.10b 63.12±0.09e 13.01±0.10a
Moree 15.94±0.10a 6.00±0.07b 64.06±0.60d 13.05±0.10a
James Town 14.01±0.10b 7.07±0.10a 65.17±0.09b 12.04±0.10c
Sample means with the same superscript among the different drying methods used for drying anchovies are not significantly
different (p> 0.05) from each other. Key: RCP+NDR- Raised Concrete Platform+ Netted Drying Rack; Experimental: fresh fish
samples used in the drying experiment.
Source: Field data (2020)
95
Minerals and Histamine Contents of Fresh and Dried Anchovies from the
Four Different Processing Sites
Table 8 shows that the contents of all the three minerals (Fe, P and Ca)
in the anchovy fish decreased as a result of the different methods of drying
used in this study. The three minerals (Fe, P and Ca) analysed in the Atlantic
bumper fish also decreased in all the fresh samples after the drying processing.
Heavy metals such as lead and cadmium were not detected in both the fresh
and the dried samples. Arsenic was however detected in all the fresh anchovy
samples ranging from 0.68 to 1.34 mg/100g. The experimental fresh sample
recorded the lowest value. There was a significant reduction to 0.03 mg/ 100g
of the arsenic content in all the dried samples with no significant differences
amongst them.
Generally, there was a reduction in the histamine content after drying
the fresh samples. The histamine contents of all the anchovy samples from the
processing sites were comparable, with an average value of 0.020 ppm. The
Raised Concrete Platform+ Netted Drying Racks dried anchovy recorded the
lowest histamine value of 0.012 ppm.

96
Table 8 - Minerals and Histamine Contents of Fresh and Dried Anchovies from the Four Different Processing Sites.
State of Source of Sample
Mineral Composition (mg/100 g) Heavy Metal Composition
(mg/100g) Histamine
Sample Fe P Ca Pb Cd As (ppm)
Fresh
Experimental 65.13±2.22a 5309.50±5.95a 5155.00±2.61a ND ND 0.68±0.08b 0.049±0.001b
Adina 49.96±1.67 b 4880.66±9.50b 4211.73±3.17e ND ND 1.28±0.04a 0.054±0.001ab
Tema 51.54±0.23b 4495.80±6.90e 4323.00±2.29d ND ND 1.22±0.23a 0.049±0.001b
Moree 49.15±0.90b 4801.08±3.66c 4974.06±6.42b ND ND 1.16±0.21ab 0.059±0.002a
James Town 51.82±0.04b 4584.84±6.90 d 4379.56±2.29c ND ND 1.34±0.34a 0.060±0.004a
Dry
RCP+NDR 31.12±0.22bc 1804.56±0.33b 3002.26±0.53b ND ND 0.03±0.00a 0.012±0.000b
Adina 33.79±0.26a 1571.46±6.50e 3031.80±15.6b ND ND 0.30±0.02a 0.021±0.000a
Tema 31.68±0.67b 1877.00±1.15a 3273.63±10.85a ND ND 0.30±0.02a 0.020±0.000a
Moree 33.75±0.08a 1620.33±11.88d 2509.78±13.8c ND ND 0.30±0.01a 0.019±0.000a
James Town 30.03±0.88c 1772.02±13.19c 2526.80±2.77c ND ND 0.30±0.01a 0.022±0.003a
Sample means with the same superscript among the different drying methods used for drying anchovies are not significantly
different (p> 0.05) from each other. Key: RCP+NDR- Raised Concrete Platform+ Netted Drying Rack; Experimental: fresh fish
samples used in the drying experiment
Source: Field data (2020)

97
Proximate Compositions of Fresh and Dried Atlantic Bumper fish from
the Four Different Processing Sites
The proximate compositions of fresh and dried Atlantic bumper fish
from the four different processing sites are shown in Table 9. With reference
to the Atlantic bumper fishes, moisture content for the fresh fishes used in the
study ranged from 67.59 to 70.09 % (d.s). The least value of moisture content
was found in the experimental fish samples, whilst the highest moisture
content was in those from James Town. The moisture content of the fresh
samples were different significantly (p<0.05) except those from Tema and
James Town. RCP+NDR dried samples recorded the lowest moisture content of
13.96 %.
As shown in Table 9, the fat content decreased slightly, from a range
of 7.69 – 9.99 to 6.07 – 8.31 %, after the drying process. Also, the protein
content of the samples increased significantly (p> 0.05) after drying. Protein
contents of fresh Atlantic bumper obtained from the processing sites were
comparable to those of the fresh samples used in the drying experiment. The
ash content was also comparable amongst the fresh Atlantic bumper fish
samples. After the drying processing however, the ash content ranged between
6.49 to 12.18 % indicating significant (p> 0.05) increase in the ash content
especially from the processing sites as found in Table 9. Raised Concrete
Platform with Netted Drying Racks (RCP+NDR) dried samples recorded the
lowest significant (p> 0.05) ash content of 6.49 %.
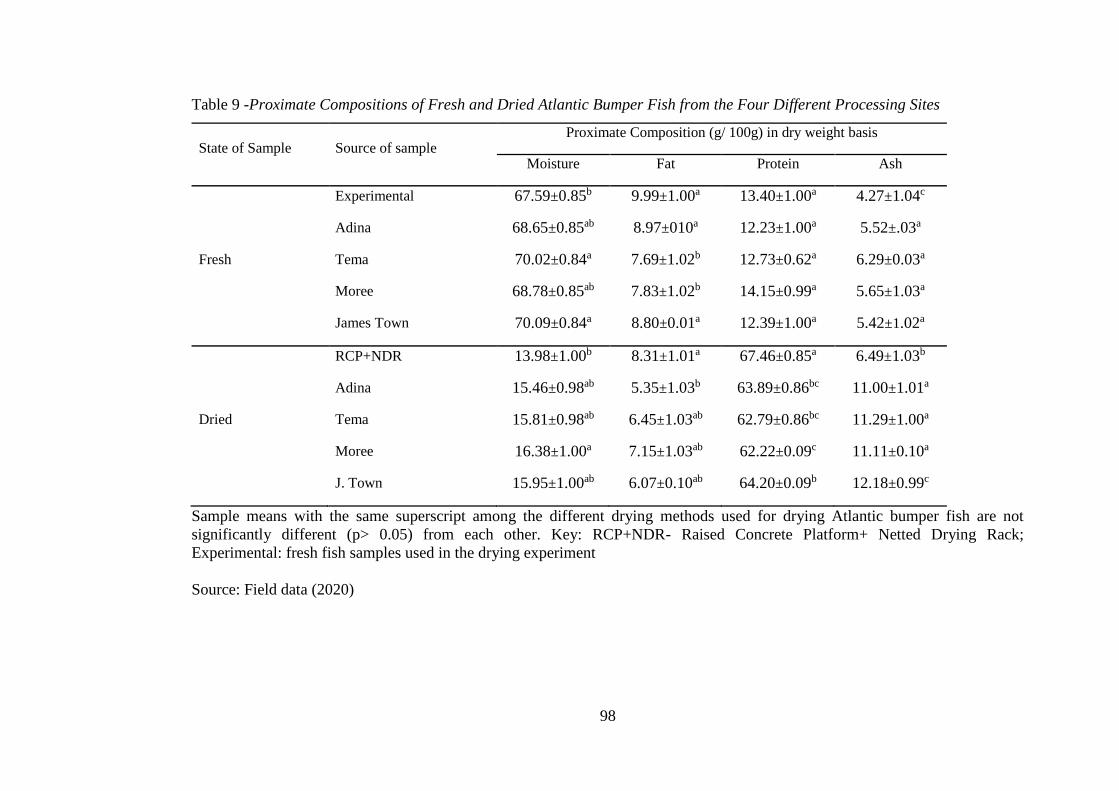
98
Table 9 -Proximate Compositions of Fresh and Dried Atlantic Bumper Fish from the Four Different Processing Sites
State of Sample Source of sample Proximate Composition (g/ 100g) in dry weight basis
Moisture Fat Protein Ash
Experimental 67.59±0.85b 9.99±1.00a 13.40±1.00a 4.27±1.04c
Adina 68.65±0.85ab 8.97±010a 12.23±1.00a 5.52±.03a
Fresh Tema 70.02±0.84a 7.69±1.02b 12.73±0.62a 6.29±0.03a
Moree 68.78±0.85ab 7.83±1.02b 14.15±0.99a 5.65±1.03a
James Town 70.09±0.84a 8.80±0.01a 12.39±1.00a 5.42±1.02a
RCP+NDR 13.98±1.00b 8.31±1.01a 67.46±0.85a 6.49±1.03b
Adina 15.46±0.98ab 5.35±1.03b 63.89±0.86bc 11.00±1.01a
Dried Tema 15.81±0.98ab 6.45±1.03ab 62.79±0.86bc 11.29±1.00a
Moree 16.38±1.00a 7.15±1.03ab 62.22±0.09c 11.11±0.10a
J. Town 15.95±1.00ab 6.07±0.10ab 64.20±0.09b 12.18±0.99c
Sample means with the same superscript among the different drying methods used for drying Atlantic bumper fish are not
significantly different (p> 0.05) from each other. Key: RCP+NDR- Raised Concrete Platform+ Netted Drying Rack;
Experimental: fresh fish samples used in the drying experiment
Source: Field data (2020)

99
Mineral and Histamine Contents of Fresh and Dried Atlantic Bumper
Fish from the Four Different Processing Sites
Table 10 gives the results of the mineral (Fe, P and Ca) and histamine
contents of the fresh and dried Atlantic bumper fish from the experiment and
fish processing sites. The three minerals decreased significantly (p> 0.05) after
the drying processing. Raised Concrete Platform with Netted Drying Rack
dried samples had higher iron and calcium content compared to those from
processing sites. Lead and cadmium contents were below the detection limits
in all the samples. Arsenic contents recorded during the study were 0.06
mg/100g, 0.10 mg/100g, 0.06 mg/100g and 0.25 mg/100g in fresh fish
samples from Adina, Tema, Moree and James Town respectively, which
decreased to a range of 0.02 to 0.08 mg/100g. However, arsenic content was
below the detection limits in fresh and dried samples from the Raised Concrete
Platform+Netted Drying Rack method.
Histamine levels in fresh Atlantic bumper fish which were initially
between 0.029 and 0.053 ppm reduced significantly to a range of 0.010 to
0.020 ppm after the drying on the Raised Concrete Platform with Netted
Drying Racks (RCP+NDR) (Table 10).
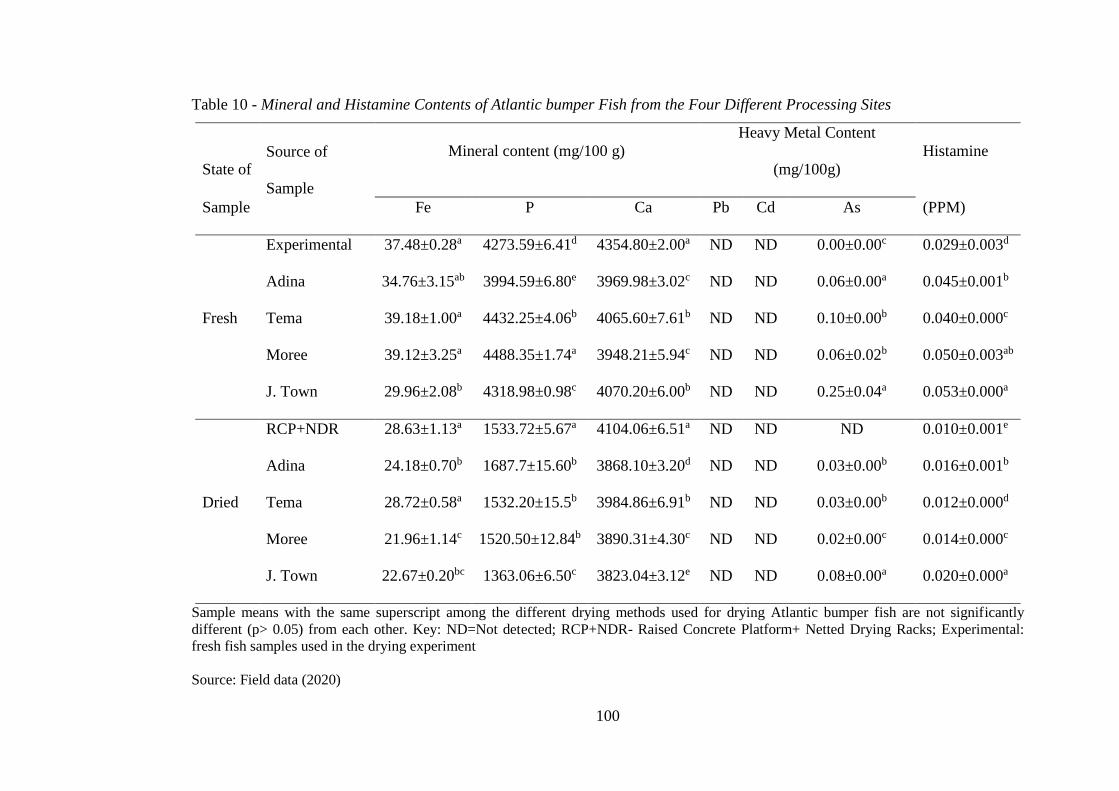
100
Table 10 - Mineral and Histamine Contents of Atlantic bumper Fish from the Four Different Processing Sites
State of Source of
Sample
Mineral content (mg/100 g)
Heavy Metal Content
(mg/100g)
Histamine
Sample Fe P Ca Pb Cd As (PPM)
Fresh
Experimental 37.48±0.28a 4273.59±6.41d 4354.80±2.00a ND ND 0.00±0.00c 0.029±0.003d
Adina 34.76±3.15ab 3994.59±6.80e 3969.98±3.02c ND ND 0.06±0.00a 0.045±0.001b
Tema 39.18±1.00a 4432.25±4.06b 4065.60±7.61b ND ND 0.10±0.00b 0.040±0.000c
Moree 39.12±3.25a 4488.35±1.74a 3948.21±5.94c ND ND 0.06±0.02b 0.050±0.003ab
J. Town 29.96±2.08b 4318.98±0.98c 4070.20±6.00b ND ND 0.25±0.04a 0.053±0.000a
Dried
RCP+NDR 28.63±1.13a 1533.72±5.67a 4104.06±6.51a ND ND ND 0.010±0.001e
Adina 24.18±0.70b 1687.7±15.60b 3868.10±3.20d ND ND 0.03±0.00b 0.016±0.001b
Tema 28.72±0.58a 1532.20±15.5b 3984.86±6.91b ND ND 0.03±0.00b 0.012±0.000d
Moree 21.96±1.14c 1520.50±12.84b 3890.31±4.30c ND ND 0.02±0.00c 0.014±0.000c
J. Town 22.67±0.20bc 1363.06±6.50c 3823.04±3.12e ND ND 0.08±0.00a 0.020±0.000a
Sample means with the same superscript among the different drying methods used for drying Atlantic bumper fish are not significantly
different (p> 0.05) from each other. Key: ND=Not detected; RCP+NDR- Raised Concrete Platform+ Netted Drying Racks; Experimental:
fresh fish samples used in the drying experiment
Source: Field data (2020)
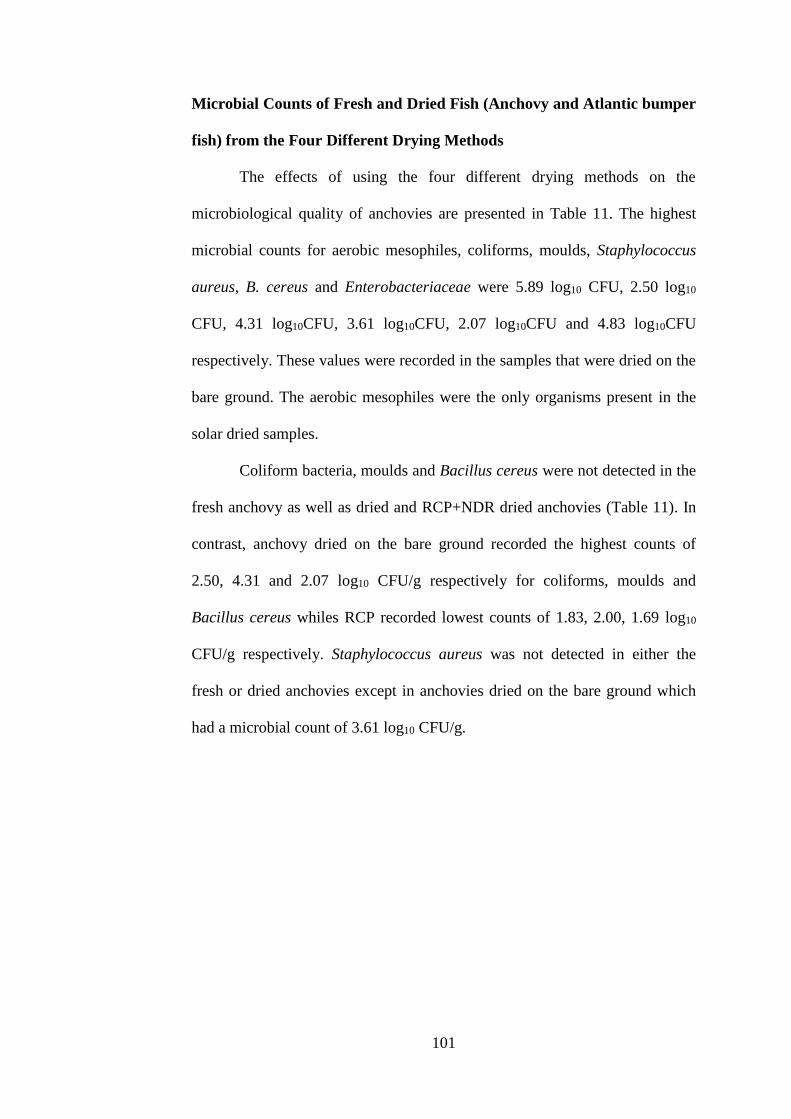
101
Microbial Counts of Fresh and Dried Fish (Anchovy and Atlantic bumper
fish) from the Four Different Drying Methods
The effects of using the four different drying methods on the
microbiological quality of anchovies are presented in Table 11. The highest
microbial counts for aerobic mesophiles, coliforms, moulds, Staphylococcus
aureus, B. cereus and Enterobacteriaceae were 5.89 log10 CFU, 2.50 log10
CFU, 4.31 log10CFU, 3.61 log10CFU, 2.07 log10CFU and 4.83 log10CFU
respectively. These values were recorded in the samples that were dried on the
bare ground. The aerobic mesophiles were the only organisms present in the
solar dried samples.
Coliform bacteria, moulds and Bacillus cereus were not detected in the
fresh anchovy as well as dried and RCP+NDR dried anchovies (Table 11). In
contrast, anchovy dried on the bare ground recorded the highest counts of
2.50, 4.31 and 2.07 log10 CFU/g respectively for coliforms, moulds and
Bacillus cereus whiles RCP recorded lowest counts of 1.83, 2.00, 1.69 log10
CFU/g respectively. Staphylococcus aureus was not detected in either the
fresh or dried anchovies except in anchovies dried on the bare ground which
had a microbial count of 3.61 log10 CFU/g.
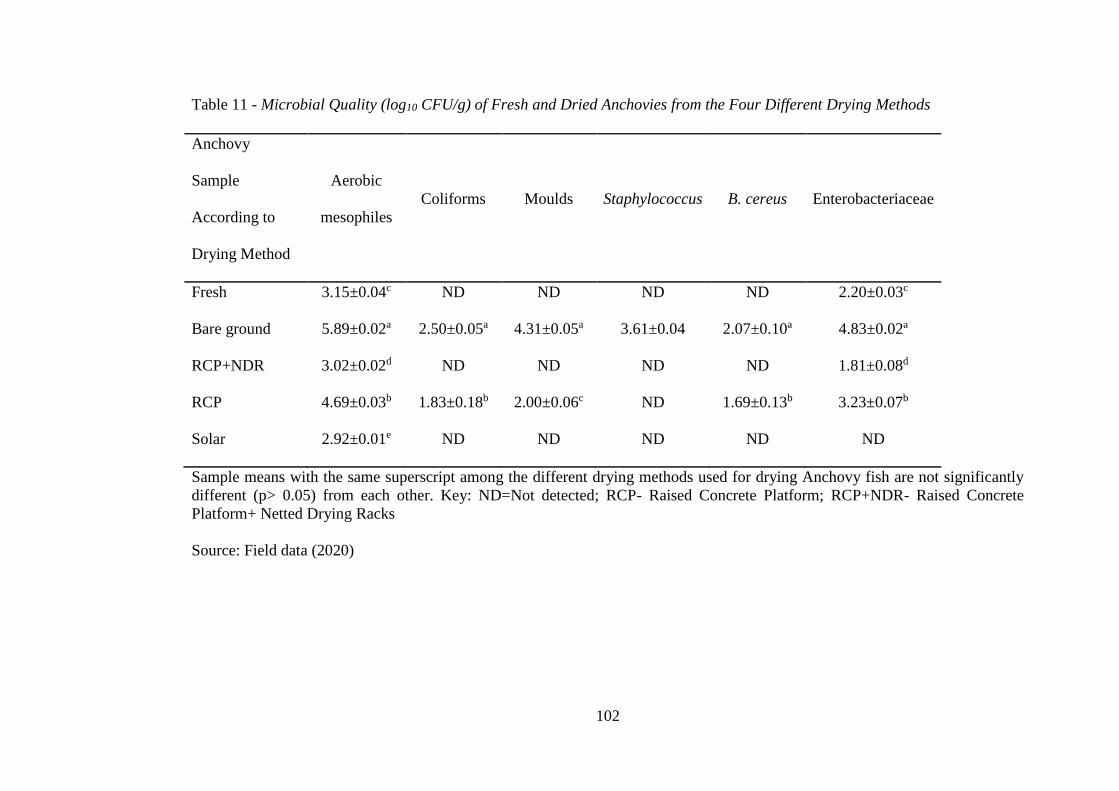
102
Table 11 - Microbial Quality (log10 CFU/g) of Fresh and Dried Anchovies from the Four Different Drying Methods
Anchovy
Sample
According to
Drying Method
Aerobic
mesophiles
Coliforms Moulds Staphylococcus B. cereus Enterobacteriaceae
Fresh 3.15±0.04c ND ND ND ND 2.20±0.03c
Bare ground 5.89±0.02a 2.50±0.05a 4.31±0.05a 3.61±0.04 2.07±0.10a 4.83±0.02a
RCP+NDR 3.02±0.02d ND ND ND ND 1.81±0.08d
RCP 4.69±0.03b 1.83±0.18b 2.00±0.06c ND 1.69±0.13b 3.23±0.07b
Solar 2.92±0.01e ND ND ND ND ND
Sample means with the same superscript among the different drying methods used for drying Anchovy fish are not significantly
different (p> 0.05) from each other. Key: ND=Not detected; RCP- Raised Concrete Platform; RCP+NDR- Raised Concrete
Platform+ Netted Drying Racks
Source: Field data (2020)
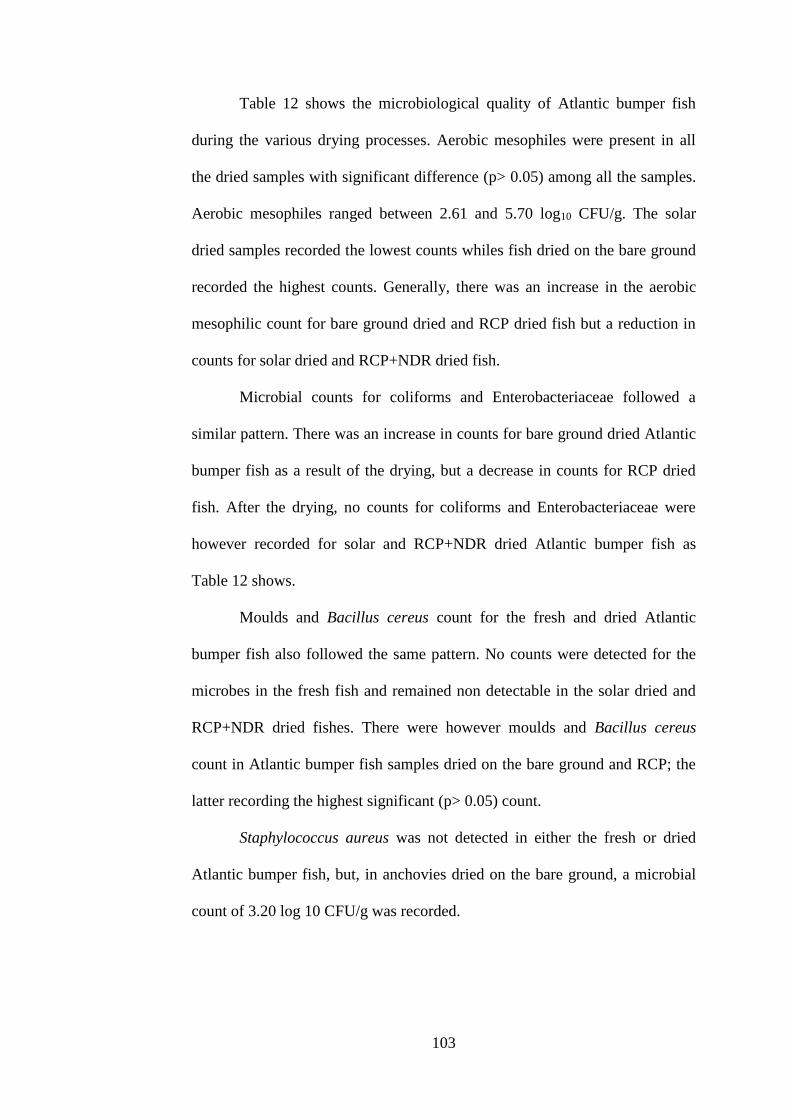
103
Table 12 shows the microbiological quality of Atlantic bumper fish
during the various drying processes. Aerobic mesophiles were present in all
the dried samples with significant difference (p> 0.05) among all the samples.
Aerobic mesophiles ranged between 2.61 and 5.70 log10 CFU/g. The solar
dried samples recorded the lowest counts whiles fish dried on the bare ground
recorded the highest counts. Generally, there was an increase in the aerobic
mesophilic count for bare ground dried and RCP dried fish but a reduction in
counts for solar dried and RCP+NDR dried fish.
Microbial counts for coliforms and Enterobacteriaceae followed a
similar pattern. There was an increase in counts for bare ground dried Atlantic
bumper fish as a result of the drying, but a decrease in counts for RCP dried
fish. After the drying, no counts for coliforms and Enterobacteriaceae were
however recorded for solar and RCP+NDR dried Atlantic bumper fish as
Table 12 shows.
Moulds and Bacillus cereus count for the fresh and dried Atlantic
bumper fish also followed the same pattern. No counts were detected for the
microbes in the fresh fish and remained non detectable in the solar dried and
RCP+NDR dried fishes. There were however moulds and Bacillus cereus
count in Atlantic bumper fish samples dried on the bare ground and RCP; the
latter recording the highest significant (p> 0.05) count.
Staphylococcus aureus was not detected in either the fresh or dried
Atlantic bumper fish, but, in anchovies dried on the bare ground, a microbial
count of 3.20 log 10 CFU/g was recorded.

104
Table 12 - Microbial Quality (log10 CFU/g) of Fresh and Dried Atlantic Bumper Fish from the Four Different Drying Methods
Bumper Sample
According to
Drying Method
Aerobic
mesophiles
Coliforms Moulds Staphylococcus B. cereus Enterobacteriaceae
Fresh 3.67±0.03c 2.64±0.04b ND ND ND 3.2±0.03b
Bare ground 5.70±0.02a 3.19±0.05a 3.23±0.07a 3.20±0.04 2.34±0.06a 4.46±0.04a
RCP+NDR 3.55±0.07c ND ND ND ND ND
RCP 4.94±0.14b 1.45±0.02c 2.08±0.05b ND 1.78±0.00b 2.1±0.03c
Solar 2.61±0.08d ND ND ND ND ND
Sample means with the same superscript among the different drying methods used for drying Atlantic bumper fish are not
significantly different (p> 0.05) from each other. Key: RCP- Raised Concrete Platform; RCP+NDR- Raised Concrete Platform+
Netted Drying Racks
Source: Field data (2020)

105
Microbial Quality of Fresh and Dried Anchovy from the Four Different
Processing Sites
The microbiological analysis of anchovy samples (fresh and dried)
from the four different processing sites are presented in Table 13. For fresh
anchovy from the four study sites, Enterobacteriaceae, yeast and moulds were
not detected in any of the samples. Coliform bacteria were not detected in the
experimental and Adina samples of fresh anchovy. Fresh anchovy samples
from James Town recorded the highest aerobic mesophilic count while
samples from Tema recorded the highest Enterobacteriaceae. For the dry
anchovy samples, Enterobacteria and yeast were not detected from all the four
study sites (Table 13). Coliform bacteria were not detected in anchovy
samples dried on the RCP + NDR. Moulds were detected in dried samples
from James Town and Tema. Dried samples from James Town recorded the
highest aerobic mesophiles, Enterobacteriaceae and Coliforms.
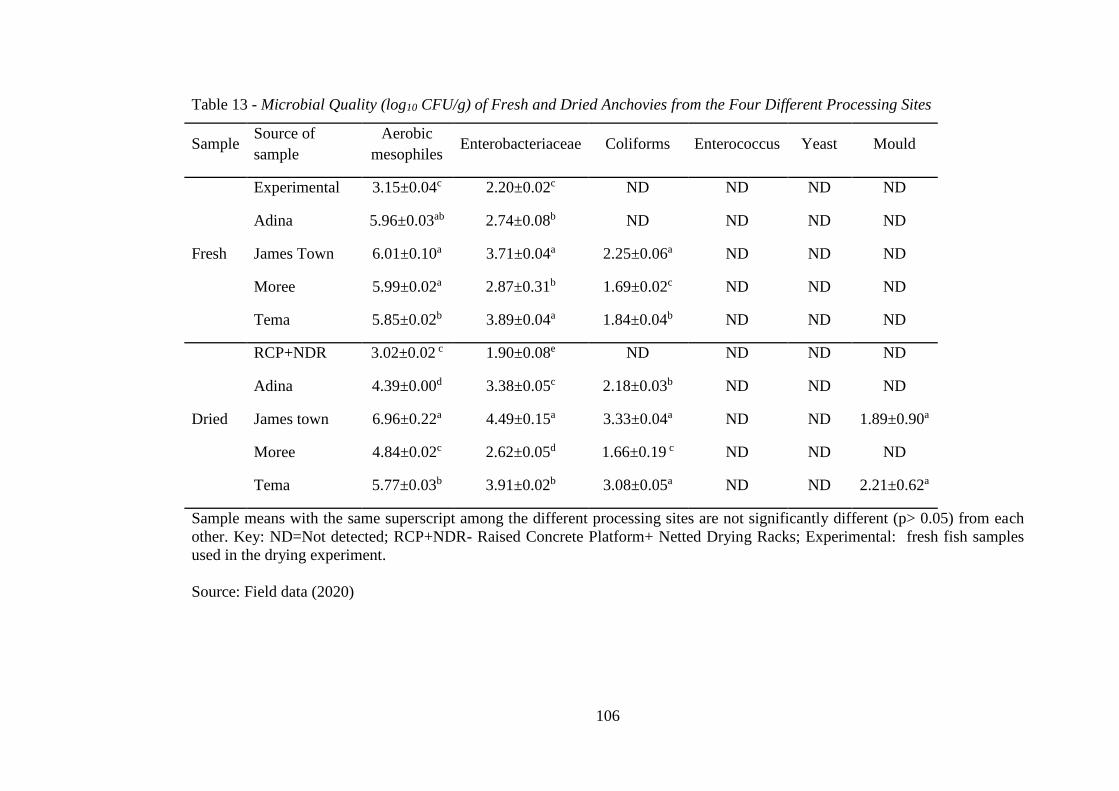
106
Table 13 - Microbial Quality (log10 CFU/g) of Fresh and Dried Anchovies from the Four Different Processing Sites
Sample Source of
sample
Aerobic
mesophiles Enterobacteriaceae Coliforms Enterococcus Yeast Mould
Fresh
Experimental 3.15±0.04c 2.20±0.02c ND ND ND ND
Adina 5.96±0.03ab 2.74±0.08b ND ND ND ND
James Town 6.01±0.10a 3.71±0.04a 2.25±0.06a ND ND ND
Moree 5.99±0.02a 2.87±0.31b 1.69±0.02c ND ND ND
Tema 5.85±0.02b 3.89±0.04a 1.84±0.04b ND ND ND
Dried
RCP+NDR 3.02±0.02 c 1.90±0.08e ND ND ND ND
Adina 4.39±0.00d 3.38±0.05c 2.18±0.03b ND ND ND
James town 6.96±0.22a 4.49±0.15a 3.33±0.04a ND ND 1.89±0.90a
Moree 4.84±0.02c 2.62±0.05d 1.66±0.19 c ND ND ND
Tema 5.77±0.03b 3.91±0.02b 3.08±0.05a ND ND 2.21±0.62a
Sample means with the same superscript among the different processing sites are not significantly different (p> 0.05) from each
other. Key: ND=Not detected; RCP+NDR- Raised Concrete Platform+ Netted Drying Racks; Experimental: fresh fish samples
used in the drying experiment.
Source: Field data (2020)
107
Table 14 provides specific microorganisms of health importance
detected and analysed. None of the organisms were detected in the
experimental fresh sample. Staphylococcus aureus was detected in all the
samples from the various sites except the experimental sample. Samples from
Moree recorded the highest Staphylococcus aureus count. For the dried
samples, none of the organisms were detected in the RCP + NDR sample. B.
cereus and S. aureus were detected in all the samples except the RCP + NDR
samples. Dried samples from Tema recorded the highest B. cereus and S.
aureus counts.

108
Table 14 - Microbial Quality (log10 CFU/g) of Fresh and Dried Anchovies from the Four Different Processing Sites
Sample Source of
sample E. Coli B. Cereus
Staphylococcus
aureus
Listeria
monocytogenes Salmonella
Fresh
Experimental ND ND ND ND ND
Adina ND ND 3.32±0.10a ND ND
James Town ND ND 2.64±0.01b ND ND
Moree ND ND 3.45±0.07a ND ND
Tema ND ND 2.28±0.00c ND ND
Dried
RCP+NDR ND ND ND ND ND
Adina ND 1.19±0.02b 1.11±0.10d ND ND
James Town ND 2.75±0.07a 1.88±0.56c ND ND
Moree ND 1.343±0.37b 2.49±0.08b ND ND
Tema ND 2.92±0.03a 2.81±0.14a ND ND
Sample means with the same superscript among the different processing sites are not significantly different (p> 0.05) from each
other. Key: ND=Not detected; RCP+NDR- Raised Concrete Platform+ Netted Drying Racks
Source: Field data (2020)
109
Microbial Quality of Fresh and Dried Atlantic Bumper Fish from the
Four Different Processing Sites
Table 15 shows the microbiological quality of fresh and dried Atlantic
bumper fish from the four different processing sites that were visited.
Enterococcus, yeast and moulds were not detected in any of the fresh samples
from the various sites. Samples from James Town recorded the highest aerobic
mesophiles, Enterobacteriaceae and coliform counts while the experimental
sample recorded the least counts of these microorganisms. For the dried
samples, only aerobic mesophilic count was recorded when RCP + NDR
drying method was used. Enterococcus and yeast were not detected in any of
the dried samples. Moulds were detected in dried samples from Moree.

110
Table 15 - Microbial Quality (log10 CFU/g) of Fresh and Dried Atlantic Bumper Fish from the Four Different Processing Sites
Atlantic
bumper
Source of
sample
Aerobic
mesophiles Enterobacteriaceae Coliforms Enterococcus Yeast Mould
Fresh
Experimental 3.67±0.03c 3.26±0.03c 2.64±0.04d ND ND ND
Adina 4.15±0.25b 3.71±0.02b 2.96±0.02bc ND ND ND
James Town 4.86±0.13a 4.10±0.14a 3.29±0.06a ND ND ND
Moree 3.82±0.01c 3.67±0.03b 2.93±0.01c ND ND ND
Tema 4.69±0.01a 3.92±0.04a 3.13±0.15a ND ND ND
Dried
RCP+NDR 3.55±0.07e ND ND ND ND ND
Adina 4.75±0.03c 3.68±0.04b 1.36±0.00c ND ND 1.11±0.00c
James Town 5.80±0.25b 4.93±0.03a 2.70±0.09a ND ND 2.80±0.00a
Moree 4.06±0.19d 3.24±0.56b 1.99±0.04b ND ND ND
Tema 6.30±0.03a 4.79±0.01a 2.67±0.03a ND ND 1.70±0.00b
Sample means with the same superscript among the different processing sites are not significantly different (p> 0.05) from each
other. Key: ND=Not detected; RCP+NDR- Raised Concrete Platform+ Netted Drying Racks; Experimental: fresh fish samples
used in the drying experiment.
Source: Field data (2020)

111
Table 16 shows the microorganisms of health importance. E. coli,
Listeria monocytogenes and Salmonella were not detected in any of the
samples. Bacillus cereus was detected in fresh samples from Moree and Tema,
but S. aureus was detected in samples from James Town, Moree and Tema.
For the dried samples, E. coli, Listeria monocytogenes and Salmonella were
not detected in any of the dried samples. B. cereus was detected in samples
from Moree and Tema and S. aureus from James Town, Moree and Tema.

112
Table 16 - Microbial Quality (log10 CFU/g) of Fresh and Dried Atlantic Bumper Fish from the four Different Processing Sites
Atlantic
bumper Source of sample E. coli B. cereus
Staphylococcus
aureus
Listeria
monocytogenes Salmonella
Fresh
Experimental ND ND ND ND ND
Adina ND ND ND ND ND
James Town ND ND 1.14±0.00b ND ND
Moree ND 1.77±0.05b 1.11±0.00b ND ND
Tema ND 3.88±0.02a 1.81±0.05a ND ND
Dried
RCP+NDR ND ND ND ND ND
Adina ND ND ND ND ND
James Town ND ND 3.81±0.02a ND ND
Moree ND 1.74±0.02b 3.66±0.02a ND ND
Tema ND 3.90±0.01a 2.06±0.35b ND ND
Sample means with the same superscript among the different processing sites are not significantly different (p> 0.05) from each
other. Key: ND=Not detected; RCP+NDR- Raised Concrete Platform+ Netted Drying Racks; Experimental: fresh fish samples
used in the drying experiment.
Source: Field data (2020)

113
Consumer Acceptability of Biscuit Prepared from Fish Powder
Fortified biscuits products prepared from fish powder are shown in
Figure 17. Scores of the various sensory parameters recorded for biscuit
prepared from fish powder ranged from 4.68 to 8.17 as presented in Table 17.
Least scores for the sensory attributes were recorded for biscuit samples that
contained 15% bumper fish powder, whiles higher scores were recorded for
samples with 5% bumper fish powder, comparable to the control product
(samples without fish powder). There was no significant difference (p>0.05)
between 5% bumper fish powder fortified biscuit and the control biscuit
product. All other biscuit samples prepared from anchovy fish powder were
significantly different (p<0.05) from the control.
Figure 17: Fortified biscuits products prepared from fish powder.
NB: A – Anchovy, B – Bumper
Source: Field data (2020)
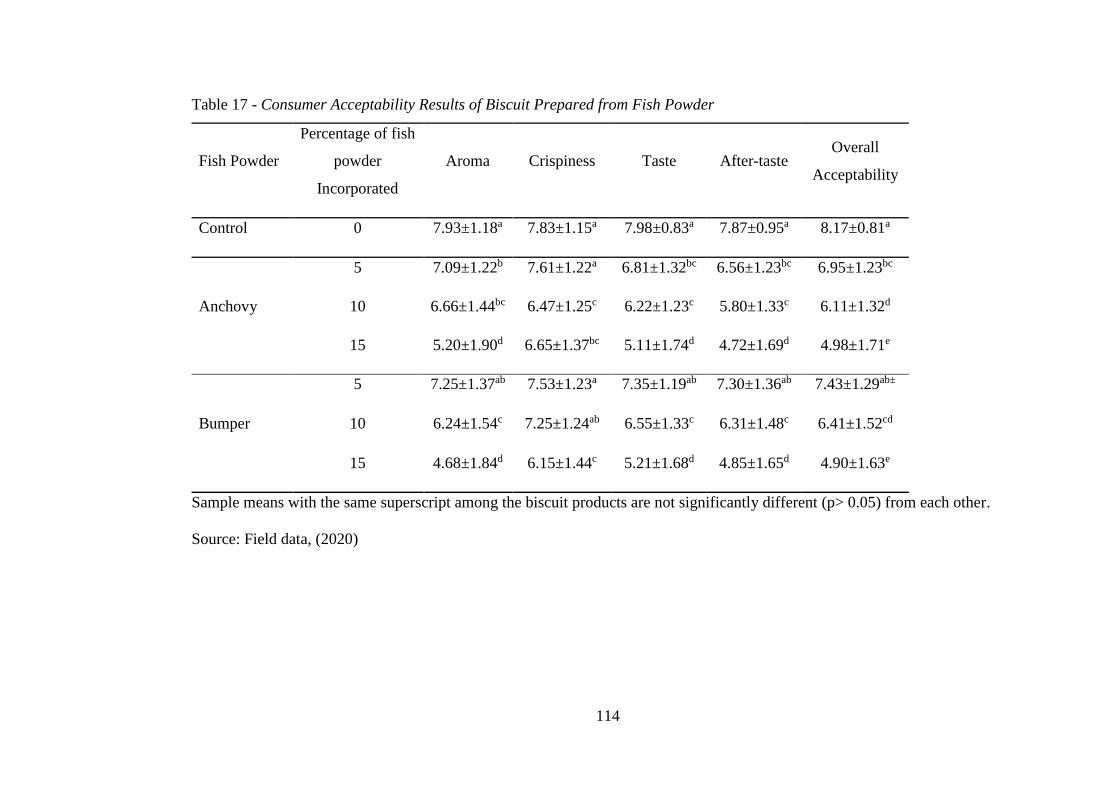
114
Table 17 - Consumer Acceptability Results of Biscuit Prepared from Fish Powder
Fish Powder
Percentage of fish
powder
Incorporated
Aroma Crispiness Taste After-taste Overall
Acceptability
Control 0 7.93±1.18a 7.83±1.15a 7.98±0.83a 7.87±0.95a 8.17±0.81a
Anchovy
5 7.09±1.22b 7.61±1.22a 6.81±1.32bc 6.56±1.23bc 6.95±1.23bc
10 6.66±1.44bc 6.47±1.25c 6.22±1.23c 5.80±1.33c 6.11±1.32d
15 5.20±1.90d 6.65±1.37bc 5.11±1.74d 4.72±1.69d 4.98±1.71e
Bumper
5 7.25±1.37ab 7.53±1.23a 7.35±1.19ab 7.30±1.36ab 7.43±1.29ab±
10 6.24±1.54c 7.25±1.24ab 6.55±1.33c 6.31±1.48c 6.41±1.52cd
15 4.68±1.84d 6.15±1.44c 5.21±1.68d 4.85±1.65d 4.90±1.63e
Sample means with the same superscript among the biscuit products are not significantly different (p> 0.05) from each other.
Source: Field data, (2020)

115
Consumer Acceptability of Instant Cereal Mix Prepared from Fish
Powder
Fortified instant cereal mix and biscuit prepared are shown in Figure
18. The sensory scores obtained for the cereal mix (rice and fish powder at
different percentages) during the sensory analysis are presented in Table 18.
Scores for the various sensory parameters ranged from 4.85 to 7.43. Least
scores for the various sensory attributes were recorded for samples that
contained 9 % bumper fish powder while appreciable scores were recorded for
samples that contained 3 % anchovies and 3 % bumper fish powder, compared
to the control (samples without fish powder).
Figure 18: Anchovy fortified instant cereal mix (A) and Bumper fish fortified
biscuit (B) prepared from fish powder.
C- Control (instant cereal mix without fish powder)
Source: Field data (2020)
C 6%A 3%B 6%B 9%B 3%A 9%A

116
Table 18 - Consumer Acceptability Results of Instant Cereal Mix Prepared from Fish Powder
Control
Percentage (%) of fish
powder incorporated
Aroma Consistency Taste After taste
Overall
Acceptability
Control 0 7.32±1.48a 7.41±1.04a 7.43±1.20a 7.25±1.31a 7.37±1.33a
Anchovy
3 6.87±1.48ab 6.55±1.74bc 6.48±1.54b 6.60±1.36ab 6.49±1.55ab
6 6.25±1.76bcd 6.55±1.48bc 6.20±1.66bc 5.85±1.84bc 6.17±1.86bc
9 5.62±1.89de 6.36±1.76bc 5.41±1.97cd 5.34±1.99c 5.25±1.94cd
Bumper
3 6.66±1.33abc 6.58±1.49abc 6.71±1.49ab 6.45±1.63ab 6.75±1.53ab
6 5.83±1.82cde 6.68±1.40ab 5.95±1.83bc 5.86±1.83bc 6.07±1.86bc
9 5.13±1.99e 5.82±1.84c 4.88±1.87d 5.14±2.01c 4.85±1.81d
Sample means with the same superscript among the instant cereal mix products are not significantly different (p> 0.05) from each
other
Source: Field data (2020)
117
CHAPTER FIVE
DISCUSSION
The chapter presents discussion on the results as presented in chapter
four in relation to the objectives of the study. The main objective was to
undertake a comparative investigation of the effect of four drying methods on
the proximate, chemical and histamine as well as the microbiological contents
of dried anchovies and Atlantic bumper. The four drying methods were
traditional sun-drying on the bare ground, improved sun-drying on concrete
platform, improved sun-drying concrete platform with netted drying racks and
solar-drying. The study also investigated the use of the fish powders from
these four drying methods in two new food formulations.
Drying Curves of Anchovy and Atlantic Bumper Fish During the Drying
Process
Drying air temperature has been found to be a major factor that
influences the drying kinetics of products ( Saeed et al., 2006; Sopian et al.,
2008). The higher the temperature, the bigger the saturated and partial
pressure difference of water vapour in the drying-air, which is the main
driving force for drying; since there is a maximum amount of water
(saturation) that air can hold at a given temperature. Abraha et al. (2017)
reported that, circulation of hot air in solar dryers result in high internal dryer
temperature reducing the drying time of fish, whiles in open sun-drying, fish
require a longer drying time because of erratic changes of temperature, with
relatively low temperature as well as an accompanying humidity of the

118
ambient air. This accounts for the fluctuations in the moisture content
especially for the open sun drying method.
The solar dried samples were left in the solar dryer overnight whiles
that of the open sun drying had to be collected each night, covered and
returned for drying the next day. It was observed that the sun-drying samples
had some moisture/ tiny quantities of water collected around them when
collected early in the morning. Compared to open sun-drying, solar-drying can
generate higher air temperature which provides larger driving force for heat
transfer and thereby increasing the evaporation rate of water significantly,
resulting in lower final moisture content of dried samples (Olabinjo, Olajide,
& Olalusi, 2014). Similar behaviour has been reported by several authors
(Akendo, Gumbe, & Gitau, 2008; Belghit, Kouhila, & Boutaleb, 2000; Falade
& Abbo, 2007; Madamba, Driscoll, & Buckle, 1996). Research by Bellagha,
Amani, Farhat and Kechaou (2002) and Mwithiga and Mwangi (2005) on
lightly salted sardines (sadinella aurita) and fish fillet respectively reported
that higher air temperature produced a higher drying rate and reduced drying
period (Omodara & Olaniyan, 2012). These observations were similar to the
results of the current study.
The time of the day as well as the weather condition highly affected
the moisture removal of samples being dried. According to Guan et al. (2013),
the higher the drying temperature, the faster the drying rate and shorter the
drying time. The relatively faster rate of drying in the improved sun-drying
methods with concrete platform compared to the traditional, bare ground sun-
drying can be explained by the fact that the slopping rack significantly
improves the drying process through easier loss of water from the fish as

119
explained by Abraha et al. (2017). The higher moisture removal at the
beginning of the drying process can be attributed to the readily available water
(unbound) at the surface of the fish (Owureku-Asare, 2018). The amount of
free water present at the start is very important, since the rate of water removal
is higher during this phase (Faustino, Barroca, & Guine, 2007). As the drying
proceeds, the free water present decreases quite rapidly, so that at the final
stages, water was hardly available and the drying became very slow (Sopian et
al., 2008). The efficiency of the drying process gradually decreases till it
reaches an equilibrium stage phase where there is no further net loss of
moisture (mass transfer) or change in weight of the food material. This is
because unbound water is no longer available for removal in the drying
process. A falling-rate phase begins when the surface of the food materials
heats up as water leaves the interior of the food at the same rate as it
evaporates from the surface (moisture concentration gradient). This means that
diffusion is the dominant physical mechanism governing moisture movement
in the material (Akpinar et al., 2003; Shanmugama & Natarajan, 2006), which
is dependent on the moisture content of the samples (Prachayawarakorn, Tia,
Plyto, & Soponronnarit, 2008; Sopian et al., 2008).
Kilic (2009) noted that an increased drying temperature decreased the
fish quality because it accelerated the biochemical and microbiological
decomposition of fish, especially salted fish. Lower ambient temperatures
during drying provides a better fish texture and sometimes colour since it
gives a more springy and not dry and brittle as found in solar dried fish (Saka,
2015).

120
Nutrient Composition of Fresh and Dried (Anchovy and Atlantic Bumper
Fish) from the Four Different Drying Methods
Generally, visual physical observations of the dried fish samples
pointed to the fact that the sun drying methods, especially using the raised
concrete platform with netted drying racks, had a brighter and whitish
appearance as well as a more acceptable texture than those from the solar-
dryer. The latter dryer gave dark-baked appearance, hard and brittle dried fish,
which had poor texture and were very susceptible to breaking. Fish dried on
the bare ground and the platform were contaminated with sand particles and
showed signs of contamination by blow flies, but those inside the solar tent
dryer were free of these contaminations. This is confirmed by previous studies
by Olokor and Ngwu (2001) and Braguy et al. (2005).
Moisture content is an important determinant of shelf stability of food
products. This is because products with higher moisture content have high
water activity, which enhances microbial activity leading to spoilage
(Ashworth & Draper, 1992). The relatively high temperature and low relative
humidity created in the solar dryer ensured more moisture evaporating from
the sample. This makes the solar dried samples more shelf stable (Chukwu &
Shaba, 2009; Sultana, Islam, & Kamal, 2009) compared to the samples from
the other drying methods that had higher moisture content. The moisture
contents for the fresh fish samples (FFS) recorded in this study were similar to
the results of that obtained by Simat and Bogdanovic (2012).
Ojutiku et al. (2009) have explained that though dried fish at 25 %
moisture content can be stable, they are easily prone to mould growth.
However at 15 % moisture content, mould growth is minimal thereby
121
extending the shelf life of the fish. From the current study, the dried anchovy
samples, with the moisture contents of between 7.50 -13.14 % will have a
longer shelf life than the fresh fish samples (Sugathapala, Suntharabarathy, &
Edirisinghe, 2012). A study by Rasul, Majumdar, Afrin, Bapary and Azad
(2018) showed that traditionally dried fish samples tend to have higher
moisture contents than fish samples dried by the improved and solar drying
methods. These findings agree with the results of the present study.
Samples from the bare ground had higher ash content (p<0.05)
compared to the other samples. The observed phenomenon may be attributed
to contamination of fish samples by sand and dirt during the drying process
(Rasul et al., 2018). The low values recorded in the solar dried samples may
be due to the complete protection of the fish from dust, wind-blown particles
and other foreign matter in the solar tent dryer as reported by Bala and
Mondols (2001) and Chavan, Basu and Kovale (2008).
The increase in protein content recorded in the present studies was due
to concentration of proteins after the removal of water molecules present
between proteins during drying as reported by Ninawe and Ratnakumar
(2008). Immaculate et al. (2012) also recorded an increase in protein content
of sardine during rack drying, solar drying and traditional drying. There was
no protein nitrogen loss observed in the solar tent dryer since the activity of
enzymes and microorganisms were halted by the high temperatures in the
dryer and low water content of dried samples. In view of these the protein
content increased with the reduced moisture content when compared with the
fish dried in open sun rack dryer as reported by Ninawe and Rathnakumar, and
Chukwu and Shaba (2009). Begum, Uddin, and Akter (2013) found that
122
drying time as well as moisture loss causes a denaturation of the proteins in
some fish samples.
Generally, an inverse relationship existed between the moisture and
fat, protein and ash content of the samples analysed during the study. The
observed pattern is similar to the studies conducted by Nurullah et al. (2006)
on small fish species which were dried by solar tunnel and traditional sun
drying methods. Chukwu and Shaba (2009) and Ninawe and Rathnakumar
(2008) also reported that a reduction in moisture content causes an aggregation
of protein, minerals, fat in dried fish samples.
The decrease in fat contents in the dried samples compared to the fresh
samples (anchovy and atlantic bumper fish) could be attributed to the
evaporation of moisture with lipids from the samples during drying. Solar
dried samples recorded the least fat content amongst the dried samples. The
decrease in fat content may also be attributed to the high temperature
treatment (82 oC) from the drying methods which have also been found to
trigger lipid oxidation (Mahmud et al., 2018).
Generally, a reduction in the nutrients may be attributed to the nutrient
concentrated waters dripping away from the samples through the rack pores
during processing similar to findings by Ochieng et al. (2015).
Histamine contamination is prevalent among pelagic fish such as
mackerel and sardine. In view of this, Abbey (1998) and Kose and Erdem
(2003) suggested that icing of fish after harvesting could minimize histamine
formation. Codex (2007) has set limits of 10 mg/ kg for histamine as indicator
of decomposition and 20 mg/kg as indicator of poor handling of fish.
According to Onal (2007), histamine levels above 40-100 mg/kg and higher

123
causes severe food poisoning that can lead to ill health and death. However,
the histamine contents of all the samples (both fresh and dried anchovies)
during this study were less than 1 mg/kg which shows that they were safe with
respect to histamine content. It also shows proper handling of the fresh
anchovies, as well as prompt processing after harvest. Similar to the present
study, Plahar et al., (1999) also did not detect histamine in either fresh or dried
anchovy. Some studies have however reported significant levels of histamine
in herrings and other species. (Pan & Orejana, 1985).
Nutrient Composition of Fish (Anchovies and Atlantic Bumper Fish) from
Improved Drying Method (RCP+NDR) Compared to the Traditional Sun
Drying Method
The results of this study has shown that the crude protein and ash
content of the fish increased after drying while moisture and crude fat
decreased in dried fish samples from all the processing sites. These results
were comparable to the findings of Abraha et al (2017). The decrease in
moisture content is due to the loss of free water present in muscle when
exposed to heat as reported by Collignan, Santchurn, and Zakhia-Rozis
(2008).
Several authors have reported that, moisture content has a tremendous
effect on the ultimate quality and storage life of dried fish. Higher moisture
content make products susceptible to microbial and enzymatic spoilage
(Kumar et al., 2017). The moisture content of the dried fish samples from the
traditional drying methods obtained from the processors had higher moisture
content compared with those from the improved drying methods. This

124
observation is consistent with what has been reported in literature (Relekar et
al., 2014). Even though the same species of fish was used in processing,
variations in the moisture content can be attributed to fluctuations of
traditional drying conditions which leads to higher moisture content in
traditionally dried fish (Bulushi, Guizani, & Dykes, 2013). Similarly, Id,
Chandra, Id and Afrin (2018) also recorded higher moisture content in
traditionally produced dried fish than in fish produced by the improved
methods (drying on racks). According to Relekar et al., dried fish procured
from the local market have lower protein content compared to fish dried by
improved methods and this may be attributed to the removal of water to a
greater extent.
Generally, differences in the nutritional or chemical composition of
fish of the same species can be attributed to seasonality, feeding habits, sex,
source variation and difference in drying methods used in processing (Oparaku
& Nwaka, 2013; Boran, Boran, & KaraCAm, 2008). Several studies have
established that open sun drying, on the bare ground, increases the level of
sand or grits in dried fish. (Relekar et al., 2014; Immaculate et al., 2012 ). The
higher ash values recorded for samples from processors are therefore
expected. Earlier studies also showed higher ash content in the sand dried
sardines compared to the fresh samples due to the sand contamination (Sablani
et al., 2002). The raised concrete platform with netted drying racks samples
recorded significantly (p<0.05) lower values for ash content which was in
agreement with the findings of Tunison et al. (1990) and Ojutiku et al. (2009).
This can be attributed to the reduction of the extent of contamination from
125
dust, insects and a host of others due to the raised platform as well as the use
of netted racks as covering.
Fat content of fish is more variable than other proximate components
and may reflect a natural variance in different or the same fish species. The
decrease in fat contents in the dried samples compared to the fresh samples
may be due to the evaporation of moisture with lipids from the samples
(Mahmud et al., 2018).
From Table 8 and 10, heavy metals such as lead and cadmium were not
detected in either the anchovies or the Atlantic bumper fish samples. The
maximum level of arsenic concentration for fish is 1.0 mg/kg according to the
Australian standard (Australia-New Zealand Food Authority, 2010). None of
the fish samples examined in this study exceeded the concentrations set by the
Australian standards. High concentrations of heavy metals are mostly recorded
in large fishes which prey on other fish especially cephalopods like squid
(Caurant & Amiard-Triquet, 1995). Durmus et al., (2018) detected these heavy
metals in red mullet fish at higher concentration contrary to the current study.
Microbial Counts of Fresh and Dried Fish (Anchovy and Atlantic Bumper
Fish) from the Four Different Drying Methods
The population of aerobic mesophiles recorded in this study were
comparable to those reported by Mansur, Rahman, Khan, Reza and
Kamrunnahar- Uga (2013). The high aerobic mesophilic contamination level
of the dried anchovies and the Atlantic bumper fishes from the bare ground are
clear indications that samples were handled under poor hygienic conditions as
suggested by Kung et al. (2015). The solar-dried samples recorded the least
126
aerobic mesophiles indicating good hygienic condition during drying as
reported by Id et al. (2018). Though aerobic mesophiles is an indication of
poor hygienic conditions during the drying process, the values were below the
maximum allowable limit of aerobic mesophiles for fish by the Ghana
Standards Authority (GSA) and the International Commission on
Microbiological Specifications for Foods (ICMSF) standard of 7 log CFU/g
(ICMSF, 1988). This can generally be attributed to the pre-washing of fresh
fish with 5 % salt solution as well as the wearing of gloves during fish
handling.
The microbial contamination of the bare ground and platform dried
fish samples is likely to be due to exposure to contamination from the
environment with coliforms, moulds and Bacillus since these organisms were
not detected in the fresh fish samples. Anchovies dried using the solar and
RCP+NDR methods were housed in protective drying chambers that ensured
reduced chances of microbial contamination.
The dusty environment, poor hygienic conditions, contaminated
contact surfaces, or poor handling practices accounted for the high levels of
microbial contaminants recorded for the bare ground and Raised Concrete
Platform dried fishes. The coliform counts of the two dried fish samples from
the bare ground far exceeded the Ghana Standards Authority (GSA) limit of
1.6 log CFU/g (GS 747: 2003). Hasselberg et al. (2020a) also recorded high
microbial counts in dried fish under similar circumstances. High incidence of
mesophiles and total coliforms were also recorded by Selmi, Bouriga, Cherif,
Toujani and Trabelsi (2010) in bare ground sun-dried fish compared to that
dried under controlled conditions.

127
Karim et al. (2017) also recorded high Enterobacteriaceae counts for
anchovies dried in open sun whiles rack dried samples recorded low counts.
Ochieng et al. (2015) reported that the mean microbial load of dried samples
dried on the raised rack was less (1.48×10² CFU/g for yeast and moulds and
1.56× 10² bacteria) than those dried using the traditional bare ground drying
method. This was attributed to the clean and safe practices followed during
processing using the raised rack method.
In a similar study by Sabo (2018), higher counts of S. aureus were
recorded for anchovies dried under traditional open sun drying than the count
for solar dried samples, which may be attributed to the hygienic drying
conditions provided by the drying tent. Plahar et al. (1999) also found the
presence of S. aureus in anchovy fish samples dried on the bare ground. The
recorded values from the present study were however below the GSA’s and
the International Commission on Microbiological Specifications for
Foods (ICMSF) standards of 4.0 log CFU/g for S. aureus (ICMSF, 1988). The
absence of Staphylococcus aureus in some of the dried samples can be
attributed to the less contact of fish with the processors during drying as well
as less contact with contaminated surface.
Salmonella spp, which is a food-borne hazard, was not detectedin any
of the dried fish samples. Hasselberg et al. (2020a) did not also detect
Salmonella in dried fish samples. E.coli was also not detected in the present
study, however Sabo (2018) recorded counts of E.coli for both fresh and
traditionally sun dried anchovies.

128
Microbial Quality of Fresh and Dried Fish (Anchovies and Atlantic
Bumper Fish) from the Four Different Processing Sites
Sugathapala et al. (2012) have explained that the moisture content of a
food product is an exact susceptibility indicator for microbial spoilage. Thus,
when the dried product moisture is high, it favours microbial growth and
infestation of the product by flies resulting in foodborne illnesses when
consumed (Huang et al., 2010). It has been reported that a well dried fish of 15
% moisture content or less, will prevent mould growth and thereby increase
the products shelf life (Ochieng et al. 2015). Low moisture content is an
indication of low water activity and vice versa. Most organism especially
bacteria species require higher water activity above 0.91 to proliferate
(Mahmud et al., 2018). Drying therefore reduces the water activity of fish
which limits the growth of many microorganisms (Bulushi et al., 2013). This
explains the low bacteria load recorded in the RCP+NDR dried fishes
compared with the bare ground samples which had higher moisture content. In
the present study, fish samples dried using raised concrete platform with
netted drying racks (RCP+NDR) recorded lower moisture levels than samples
dried on the bare ground by the traditional processors. Hence are expected to
have longer shelf life, if conditions of low moisture content are maintained.
Also fish samples dried using RCP+NDR had lower microbial load
(aerobic mesophiles, Enterobacteriaceae) compared with the other methods.
The observed phenomenon might be due to the reduced contamination levels
of RCP+NDR. This observation is similar to the studies conducted by Id et al.
(2018). They observed that fishes dried using improved racks had lower
microbial load compared with the ones that were dried using the traditional

129
bare ground method. Despite the aerobic mesophilic count of all the
traditionally dried fishes being higher than those of the RCP+NDR, the
microbial loads of all the samples were within the acceptable limit
recommended by ICMSF, (1988).
Traditional processors generally, wash fresh fish after catch with sea-
water at coastal landing sites. This step can introduce a high level of
contamination if the coastal waters are heavily polluted. Sorting to remove
foreign materials is also typically done by hand which further contributes to
add more microorganisms. A study by Karim et al. (2017) reported
Enterobacteriaceae were recorded in anchovies dried in open sun drying but
not detected on those dried using different types of drying racks. This
observation is similar to the findings of the current study.
Coliform bacteria and Escherichia coli are faecal bacteria and are
classified as indicator bacteria for faecal contamination of food that harbours
an increased risk to contain pathogenic bacteria (Akinwumi & Adegbehingbe,
2015). Coliforms were not detected in the fish dried uisng the RCP+NDR.The
dried fish samples from the traditional processors however had high coliform
counts which indicated faecal contamination. Possibly from the fish habitat,
dusty environment, contaminated contact surfaces or poor handling practices.
The drying of the fish was not sufficient to reduce the coliform counts. As
suggested by Hasselberg et al. (2020a) several points along the value chains
are possible critical points where contamination could also take place. The
guidelines set by the Ghana Standard Authority (GSA) on the limit for
coliform bacteria in hot smoked fish is 1.6 log CFU/g (GS 747 : 2003). All the
samples exceeded this limit which is stated for hot smoked fish only.

130
The presence of S. aureus in both the fresh and dried fish from the
landing sites is an indication of unhygienic handling conditions. Fresh fish
from the processors had higher S. aureus counts than the experimentally dried
samples in this study. Amegovu, Mawadri, Mandha and Yiga (2017) and
Budiati, Rusul, Alkarkhi, Ahmad and Arip (2011) also reported similar
findings. This could have been due to high moisture content of fish at the
landing sites favouring microbial growth. Plahar et al. (1999) observed the
presence of S. aureus in the bare ground dried anchovy fish samples in Ghana.
The observed values in this study were however below the acceptable limit of
4.0 log CFU/g for S. aureus set by GSA and ICMSF (1988).
A study by Antwi-Agyei and Maalekuu (2014) detected Salmonella
spp and E. coli in fish samples in the Kumasi metropolis of the Ashanti
Region, Ghana These microorganisms were however not detected in the
present study.
To prevent mould growth in fish, the moisture content must be below
15 % (Akinola & Bolaji, 2006). Due to the relatively higher moisture content
in the Tema (21.16 %) and James Town (20.58 %) dried anchovies as well as
the Atlantic bumper fish, moulds and bacteria were detected. Alam (2007) and
Ochieng et al. (2015) have reported similar findings.
The pathogenic microorganisms E. coli, Listeria monocytogenes and
Salmonella spp were not detected in any of the samples (both fresh and dried)
(as found in Tables 15 and 18). Contrary to this, some studies have reported
the presence of E. coli in some fish samples in Ghana (Antwi-Agyei &
Maalekuu, 2014; Hasselberg et al., 2020b). Tano-Debrah et al. (2011)
attributed the occurrence of Listeria monocytogenes on sun-dried tilapia from

131
James Town and in some informal fish markets in Accra mainly to post-
process contamination. Aboagye (2016) has suggested that salting and drying
methods used by processors cannot adequately control the organism..
Salmonella spp has mostly not been detected in studies on dried fish as
reported by Lu, Pace, and Plahar (1991), Hasselberg et al. (2020a) and
Ikutegbe and Sikoki (2014).
According to El Sheikah, Ray, Montet, Panda and
Worawattanamateekul (2014), poor hygienic conditions prevailing at most
processing sites, in addition to evidence from studies reporting on the poor
quality of water used for washing the catch fish and drying temperatures could
account for the high incidence of pathogenic and spoilage organisms observed
in traditionally dried fish sample. Some of the hygienic issues observed at
processing sites in the present study included the presence of livestock, drying
of fish directly on the ground near refuse dump sites, and exposure of fish to
blow flies, dust and rodents. The RCP+NDR method of drying however
protects the fish from these factors as well as reduces the contacts of
processors to the fish being dried. This accounts for the reduction in microbial
load in the fish samples dried on the RCP+NDR. Rahman et al. (2000) and
Ochieng et al. (2015) have also made similar reports.
Consumer Acceptability of Biscuit Prepared from Fish Powder
Venugopal (2006) has explained that, the nutritive value of cereal
proteins can be increased when fortified with fish protein powder. However
according to Majumdar and Singh (2014) and Shaviklo (2016), the addition of
fish powder to foods like biscuits affects their key sensory characteristics such

132
as flavour, odour and overall acceptance of the product. Therefore, appropriate
incorporation level is recommended at any circumstance to meet the desired
objective and satisfy consumers’ need. Abraha, Xia and Fang (2018), found
that snack containing 9 % fish protein powder had lower scores for odour,
texture, flavour, and overall acceptability, whereas snack fortified with 7 %
fish protein powder had higher scores and was acceptable. A similar trend was
observed in the present study where sensory scores for taste and the other
attributes reduced with increasing percentage of the fish powder (Table 18).
Biscuit prepared from the 5 % Atlantic bumper fish powder had comparable
attributes to that of the control due to less fishy flavour.
Hardness (cripsiness) is the textural property which attracts more
attention in evaluation of quality characteristic of baked products, because of
its close association with human perception of freshness (Chauhan, Kumar, &
Gupta, 2016). Khan and Nowsad (2012) reported that biscuit fortified with 7-
10 % fish proteins tends to have a crusty texture and good acceptance by
young consumer (Abraha et al., 2018). Panelists in this present study,
however, gave low scores (like slightly) for biscuits even with the
incorporation of fish powders at 10 and 15 %. Elbandy (2015) and Bharat,
Taral and Animal (2020) have reported that incorporation of up to 6 % fish
powder into wheat flour blend did not cause any significant deleterious effect
on all tested organoleptic attributes of the biscuit produced and had better
acceptability. However in this study, 9 % of fish powder caused a significant
(p<0.05) reduction in the scores for most of the organoleptic characteristics of
biscuit produced.

133
Elbandy (2015) recommended that the use of fish powder in biscuit
fortification should therefore be up to 6 % of wheat flour blend. In this study,
panelists rated the control biscuit (0 % fish powder) with higher acceptability
scores (8.17) possibly because of the absence of adverse taste and aroma.
Mohammed, Sulieman, Soliman, and Bassiuny (2014) revealed that fishy
odour naturally increases with increasing percentage of fish powder. This
confirms the sensory outcome of the current study. Fish powders, with lower
fat content, have been found to have a minimal fishy odour when used in
bakery products Abraha et al. (2018).
Consumer Acceptability of Instant Cereal Mix Prepared from Fish
Powder
One way to improve fish consumption is through diversifications of the
methods of usage and this should include the development of new fish derived
products, which have many health benefits (Kadam, & Prabhasankar, 2010).
This includes fortification of cereal products with fish protein concentrates or
fish powder, which according to Abraha et al. (2018) and Chambers and
Bowers (1993), increases their nutritional value and affect sensory attributes,
especially appearance, aroma, taste, flavour, and texture.
In this study, an instant cereal mix fortified with fish powder was
prepared from various combinations of rice flour, fish powder, milk powder
and sugar in various proportions as complimentary. There were significant
differences (p < 0.05) between the sensory attributes of the Control (0 % fish
powder) product and instant cereal mix fortified with the fish powder.
Generally, it was observed that the sensory score by panellists decreased with

134
increasing percentages of fish powder used. Elbandy (2015) had reported
similar results. Riyanti, Dwi, and Nur (2013) had also suggested that the
strong fishy aroma of the fortified products can be reduced and made more
acceptable if fortification levels are at low percentages. A study by Tangke,
Daeng, and Katiandagho (2021), showed that panellists gave higher
acceptability scores for porridge fortified with lower 1 % tuna bone meal than
those with higher percentages These findings confirm the response from
panellists to the fish fortified instant cereal mix in this study.
Consistency (a rheological property in relation to texture and flow of a
food material) is an important attribute, since it determines the amount of food
young children would consume, because they have affinity for lighter and
smooth gruel which are easier to swallow (Tiencheu et al., 2016). The
consistency ratings of the fish fortified products were within acceptable limits
as that of the control. The addition of the fish powder did not have much effect
on the consistency of products in this study. This is contrary to that of Tangke
et al. (2021) who stated that fortified tuna bone meal significantly influences
the quality of texture of porridge.
The Overall Acceptability test gave the sample with no fish
fortification (control product) the highest ratings for overall acceptability of
7.37. This was comparable to those fortified with 3 % Anchovies and 3 %
Atlantic bumper fish powder which had ratings of 6.49 and 6.75 respectively
for overall acceptability.
135
CHAPTER SIX
SUMMARY, CONCLUSIONS AND RECOMMENDATION
This chapter summarises the outcome of the study, the conclusions
drawn from the results as well as suggested recommendations after the study.
All these are consistent with the study objectives.
Summary
The objective of the study was to use improved sun-drying and solar
drying methods in the production of dried anchovies (Engraulis encrasicolus)
and Atlantic bumper fish (Chloroscombrus chrysurus) powder and incorporate
them into new food formulations.
Generally, the study used a quantitative research design with
experimental approach. The results obtained revealed that solar dryer had a
significantly faster drying rate for the two fish samples than the sun drying
methods. However, due to the high solar dryer temperature, the dried fish were
brittle in texture and less whitish in colour compared to the sun dried fish
which were springier with a brighter white colour.
The low moisture contents recorded for solar dried samples led to the
concentration of the other nutrients except for crude fat content which was
reduced due to evaporation by the high drying temperatures of the solar dryer.
Histamine and heavy metal concentrations for all the samples were within
acceptable limits.
The solar-dried samples had the least microbial load compared to the
other dried samples as well as the fresh samples. This was likely to be due to
protection of samples from the environment as well as the high temperatures

136
during the drying process. Samples dried on Raised Concrete Platform with
Netted Drying racks had a form of protection from contamination by the
environment due to the elevation of the drying surface from the ground, hence
had a minimal microbial load which were within acceptable limits compared
to samples dried on the bare ground and raised concrete platform without any
form of covering. Comparing the artisanal fish samples from processing sites
to that of the raised concrete platform with netted drying racks, it was
observed that seasonal changes as well as processing method had a significant
effect on the nutritional as well as the microbial quality of dried fish.
The consumer acceptability results of the products (biscuit and instant
cereal mix) prepared from fish powder showed that due to fishy smell and
aroma, consumers preferred products with a low fish concentration. Biscuit
and instant cereal mix prepared from 5 and 3 % fish powder, respectively, had
comparable acceptability scores as that of the control products which did not
contain fish powder.
Conclusions
This study has shown that solar drying of anchovy and Atlantic
bumper fish has a better drying rate and produces dried fish of better
microbiological and nutritional quality compared to sun drying of fish.
However, when the fish is sun dried on a raised concrete platform with netted
drying racks, it produces dried fish of comparable microbial and nutritional
quality to the solar dried fish. Fish dried on raised concrete platform with
netted drying racks also had significantly better microbial and nutritional

137
quality compared to fish obtained from traditional processorswho dry fish on
the bare ground.
In the consumer acceptance studies of biscuit and instant cereal mix
fortified with dry fish powder, only the products with low fish proportions, 5
% for biscuit and 3 % for cereal mix were found acceptable. At higher
percentages, the products were found unacceptable due to fish odour and taste.
Fish handling as well as drying methods can greatly affect the microbiological
quality, hence safety as well as the nutritional quality of fish.
Recommendations
Based on the results obtained from the current study, it is
recommended that there is the need for the adoption of the raised concrete
platform with netted drying racks by processors since it produces dried fish
which are superior in quality and safety to those dried on the bare ground
(traditional method). In addition, dry processing using the raised concrete
platform with netted drying racks method has less drudgery and losses are
reduced compared to traditional drying on the bare ground.
Further research can be carried out to minimize or eliminate the
unpleasant fishy odour associated with fish fortified products. This will help to
increase the base of fish fortified products as well as increase the acceptability
of fish product by consumers.
This research can be replicated with larger fish species so as to arrive
at a more comprehensive result concerning the drying efficiency of the raised
concrete platform with netted drying racks. Adoption of drying fish on raised

138
concrete platform with netted drying racks should be promoted and surveys
carried out to assess its adoption.

139
REFERENCES
Abbey, L. D. (1998). Seasonal and quality changes of the Ghanaian anchovy
(Engraulis encrasicolus) during storage in ice. FAO, Rapport sur les
Peches: FAO.
Abbey, L., Glover-Amengor, M., Atikpo, M. O., Atter, A., & Toppe, J. (2017).
Nutrient content of fish powder from low value fish and fish
byproducts. Food Science and Nutrition, 5(3), 374–379.
Aboagye, E. (2016). Microbial quality of fish along the tilapia, African
catfish, and sardinella artisanal value chains in Kpong and James
Town, Ghana. Unpublished masters’ thesis, University of Ghana,
Legon, Ghana.
Abraha, B., Admassu, H., Mahmud, A., Tsighe, N., Shui, X. W., & Fang, Y.
(2018a). Effect of processing methods on nutritional and physico-
chemical composition of fish: A review. MOJ Food Processing &
Technology, 6(4), 376–382.
Abraha, B., Mahmud, A., Admassu, H., Yang, F., Tsighe, N., Girmatsion, M.,
Xia, W., Magoha, P., Yu, P., Jiang, Q., & Xu, Y. (2018b). Production
and quality evaluation of biscuit incorporated with fish fillet protein
concentrate. Journal of Nutrition & Food Sciences, 8(6), 287-296.
Abraha, B., Samuel, M., Mohammud, A., Admassu, H., & Al-hajj, N. Q. M.
(2017). A comparative study on quality of dried anchovy (Stelophorus
heterolobus) using open sun rack and solar tent drying methods.
Turkish Journal of Fisheries and Aquatic Sciences, 17, 1107-1115.
Abraha, B., Xia, W., & Fang, Y. (2018). Opportunities of adopting and
significance of freshwater fish powder based biscuit: A review.

140
International Journal of Aquaculture, 8(7), 43–52.
Adak, N., Heybeli, N., & Ertekin, C. (2007). Infrared drying of strawberry,
Food Chemistry, 219, 109–116.
Adebayo-Tayo, B. C., Onilude, A. A., Bukola, C., Abiodun, A., & Ukpe, G.P.
(2006). Mycofloral of smoke-dried fishes sold in Uyo, Eastern Nigeria.
World Journal of Agricultural Sciences, 4(3), 346-350.
Adeyeye, S. A. O., & Oyewole, O. B. (2016). An overview of traditional fish
smoking in Africa. Journal of Culinary Science and Technology, 14
(3), 198–215.
Akendo, I. C. O., Gumbe, L. O., & Gitau, A. N. (2008). Dewatering and
drying characteristics of water hyacinth (Eichhornia Crassipes) Petiole.
Part II. Drying characteristics. Agricultural Engineering International:
the CIGR Ejournal Manuscript FP 07 033. vol. x.
Akinola, O. A., & Bolaji, B. O. (2006). Evaluation of traditional and solar fish
drying systems towards enhancing fish storage and preservation in
Nigeria : Abeokuta Local Governments as case study. Journal of
Fisheries International, 1(2-4), 44-49.
Akintola, S. L., & Fakoya, K. A. (2017). Small-scale fisheries in the context of
traditional post-harvest practice and the quest for food and nutritional
security in Nigeria. Agriculture and Food Security, 6(1), 1–17.
Akinwumi, F. O., & Adegbehingbe, K. T. (2015). Microbiological analysis of
three of smoked fish obtained from the Ondo State, Nigeria. Food and
Public Health, 5(4), 122–126.

141
Akpinar, E. K., Bicer, Y., & Midilli, A. (2003). Modeling and experimental
study on drying of apple slices in a convective cyclone dryer. Journal
of Food Process Engineering, 26(6), 515– 541.
Akrofi, J. D. (2002). Fish utilisation and marketing in Ghana: State of the art
and future perspective. In Jacqueline M. McGlade, (Eds.), Large
marine ecosystems: The Gulf of Guinea large marine ecosystem -
Environmental forcing and sustainable development of marine
resources, 11, 345-354.
Alam, A. K. M. N. (2007). Traditional sun-drying of fish. Participatory
training of trainers; A new approach applied in fish processing.
Bangladesh Fisheries Research Forum (BFRF). Bengal Com- Print,
Dhaka, Bangladesh, pp 151-197.
Aliaga, M. & Gunderson, B. (2000). Interactive Statistics. New Jersey:
Saddle River.
Alonzo, A. G., & Alexie, S. A. (2015). Microbial , physicochemical, and
sensory quality evaluations of salted herring ( Sardinella fimbriata )
subjected to different drying processes. Food Science and Technology
Research, 21(2), 213–221.
Amegovu, K. A., Mawadri, M., Mandha, J., & Yiga, P. (2017). Microbial
profile of sun dried fermented mud fish (Claria. anguiliaris) locally
known as Abil Alier sold in local markets in South Sudan.
International Journal of Food Science and Nutrition, 2, 32-36.
Ames, S. K., Gorham, B. M., & Abrams, S. A. (1999). Effects of high
compared with low calcium intake on calcium absorption and

142
incorporation of iron by red blood cells in small children. The
American Journal of Clinical Nutrition, 70(1), 44-48.
Anihouvi, V. B., Kindossi, J. M., & Hounhouigan, J. D. (2012). Processing
and quality characteristics of some major fermented fish products from
Africa: A critical review. International Research Journal of Biological
Sciences, 1(7), 72-84.
Anihouvi, V. B., Sakyi-Dawson, E., Ayernor, G. S., & Hounhouigan J. D.
(2007). Microbiological changes in naturally fermented cassava fish
(Pseudotolithus Sp) for lanhouin production. International Journal of
Food Microbiology, 116, 287-291.
Antwi-Agyei, P., & Maalekuu, B. (2014). Determination of microbial
contamination in meat and fish products sold in the Kumasi metropolis
(A case study of Kumasi Central Market and the Bantama Market).
Merit Research Journal of Agricultural Science and Soil Sciences,
2(3), 38 - 46.
Antwi-Asare, T. O., & Abbey, E. N. (2011). Fishery value chain analysis
Ghana. FAO report.
AOAC (2000). Official methods of analysis (17th Ed.). Washington, DC. USA:
Association of Official Analytical Chemist.
AOAC (2016). Official methods of analysis, 20850–3250 (20th Ed.).
Rockville, Maryland, USA: Association of Official Analytical
Chemist.
Arason, A., Karlsdottir, M., Valsdottir, T., Slizyte, R., Rustad, T., Falch, E.,
Eysturskard, J., & Jakobsen, G. (2009). Maximum resource utilisation-

143
value added fish by-products. Nordic Innovation Centre, Project nr:
04275, pp 35–46.
Arason, S., Shaviklo, G.R., Thorkelsson, G., Sveinsdottir, K., & Rafipour, F.
(2011b). Chemical properties and sensory quality of ice cream fortified
with fish protein. Journal of Science Food Agriculture, 7, 1199–1204.
Aroyeun, S. O. (2009). Utilization of cashew kernel meals in the nutritional
enrichment of biscuit. African Journal of Food Science, 3(10), 316–
319.
Arvanitoyannis, I., & Kotsanopoulos, k., (2012). Smoking of fish and seafood:
history, methods and effects on physical, nutritional and
microbiological properties. Food and Bioprocess Technology, 5(3),
249-261.
Ashworth, A., & Draper, A. (1992). The potential of traditional technologies
for increasing the energy density of weaning foods. A critical review of
existing knowledge with particular reference to malting and
fermentation, WHO/CBD EDP/92.4. World Health Organization,
Geneva, Switzerland.
Australia New Zealand Food Standard (2010). Presence of histamine in
anchovies. Silverwater, New South Wales, Australia: NSW Food
Authority.
Bailey, M., Quatey, S. Armah, A. K. Jacquet, J. Khan, A. Alder, J., &
Sumaila, U. R. (2010). Meeting Socio-economic objectives in Ghana’s
sardinella fishery. In D. M. Nanang, & Th. K. Nunifu (Eds.), In
Natural Resources in Ghana (pp. 20-26). Nova Science Publishers,
Inc.: Ghana.
144
Bala, B. K., & Mondols, M. R. (2001). Experimental investigation on solar
drying of fish using solar tunnel dryer. Drying Technology: An
International Journal, 19, 247-436.
Banda, J., Kamanula, J. F., Chigwechokha, P., Singini, W., Kamanula, J.,
Msiska, O., James Banda, C., & Simbeye, J. (2017). The shelf life of
solar tent dried and open sun dried Diplotaxodon limnothrissa
(Ndunduma). East Africa International Journal of Fisheries and
Aquatic Studies, 5(5), 212–218.
Begum, M., Uddin, U. S. U., & Akter, T. (2013). Studies on the effectiveness
of Tejpata (Cinnamomum tamala Nee) leaf extract on dried kachki
(Corica soborna) fish preservation in laboratory condition. Journal of
Food Science andTechnology, 1(3), 14-17.
Belghit, A., Kouhila, M., & Boutaleb, B. C. (2000). Experimental study of
drying kinetics by forced convection of aromatic plants. Energy
Conversion Management, 44(12), 1303-1321.
Belitz, H. D., Gorsch, W., & Schieberle, P. (2009). Food chemistry (4th ed.).
Springer- verlag: Berlin Heidelberg.
Bellagha, S., Amami, E., Farhat, A., & Kechaou, N. (2002). Drying kinetics
and characteristic drying curve of lightly salted sardine (Sardinella
aurita). Drying Technology, 20, 1527-1538.
Bennett, E. (2000). The challenges of managing small scale fisheries in West
Africa. Analytical appendix 2. In A. Neiland & E. Bennett (Eds.), The
management of conflict in tropical fisheries, Report Number 52, Centre
for the Economics and Management for Aquatic Resources. UK:
University of Portsmouth.

145
Bharat, C., Taral, P., & Animal, K. V. (2020). Preparation and characterization
of function oat cookies fortified with different concentration of fish
powder. Journal of Entomology and Zoology Studies, 8(2), 527–530.
Bogard, J. R., Thilsted, S. H., & Marks, G. C. (2015). Nutrient composition of
important fish species in Bangladesh and potential contribution to
recommended nutrient intakes. Journal of Food Composition and
Analysis, 42(10), 120-133.
Boran, G., Boran, M., & KaraCAm, H. (2008). Seasonal changes in proximate
composition of anchovy and storage stability of anchovy oil. Journal
of Food Quality, 31(4), 503-513.
Braguy, S. A., Olokor, S. I., Ladu, B. M. B., Kiba, S. A,. & Bagarnbollla, E.
(2005). Fish drying: an adaptable technology. Sustainable Fisheries
Livelihood Programme in West Africa. vol. 13.
Bremner, H. A. (2002). Safety and quality issues in fish processing. CRC
Press LLC. Florida. USA.
Budiati T., Rusul G., Alkarkhi, A. F. M., Ahmad, R., & Arip, Y. M. (2011).
Prevalence of Salmonella spp. from catfish (Clarias gaiepinus) by
using improvement isolation methods. International Conference on
Asia Agriculture and Animal IPCBEE vol.13, Singapore: IACSIT
Press.
Bulushi, I. M. A, Guizani, N., & Dykes, G. A. (2013). Effect of ambient
storage on the microbial characteristics of traditional dried anchovies
(Encrasicholina punctifer). African Journal of Microbiology
Research., 7(28), 3575–3581.
146
Cassens, R. G. (1994). Meat preservation: preventing losses and assuring
safety. Food and Nutrition Press. USA.
Caurant, F., & Amiard-Triquet, C. (1995). Cadmium contamination in Pilot
whales (Globicephala melas): Source and potential hazard to the
species. Marine Pollution Bulletin, 30, 207–210.
Chambers, E., I. & Bowers, J. R. (1993). Consumer perception of the sensory
qualities in muscle foods. Food Technology, 47(11),116 - 120.
Chamnan, C., Thilsted, H. S., Roitana, B., Lieng, S., Gerpacio, R., & Roos, N.
(2009). The role of fisheries resources in Rural Cambodia: Combating
micronutrient deficiencies in Women and Children. Phnom Penh,
Department of Fisheries Post-harvest Technologies and Quality
Control, Fisheries Administration. Cambodia: Ministry of Agriculture,
Forestry and Fisheries.
Chauhan, P. S., Kumar, A., & Gupta, B. (2016). A review on thermal models
for Greenhouse dryers. Renewable Sustainable Energy Review, 75,
548- 558.
Chavan, B. R, Basu S., & Kovale, S. R. (2008). Development of edible
texturized dried fish granules from low-value fish croaker (Otolithus
argenteus) and its storage characteristics. CMU Journal of Science, 1,
173–182.
Chavan, B. R., Yakupitiyage, A., & Kumar, S. (2011). Drying performance,
quality characteristics, and financial evaluation of Indian Mackerel
(Rastrilliger Kangurta) dried by a solar tunnel dryer. Thammasat Int.
Journal of Science Tech., 16(2), 11-25.
147
Chittchang, U., Jittinandana, S., Sungpuag, P., Chavasit, V., & Wasantwisut,
E. (1999). Recommending vitamin A–rich foods in southern Thailand.
Food and Nutrition Bulletin, 20(2), 238–242.
Chiwaula, L. S., Kawiya, C., & Kambewa, P. S. (2020). Evaluating Economic
Viability of Large Fish Solar Tent Dryers. Agricultural Research, 9(2),
270–276. https://doi.org/10.1007/s40003-019-00416-8.
Chukwu, O., & Shaba, I. M. (2009). Effects of Drying Methods on Proximate
Compositions of Catfish (Clarias gariepinus). World Journal of
Agricultural Sciences, 5(1), 114-116.
Codex. (2007). Codex standard for canned sardines and sardine-type
products. Codex Alimentarius Codex standard 94–1981 (revised
2007).
Collignan, A., Santchurn, S., & Zakhia-Rozis, N. (2008). Dehydration of
Muscle Foods. In Hui, Y. H., Clary, C., Farid, M. M., Faina, O. O.,
Noomhorm, A., & J. Welti-Chanes, (Eds.). Food drying science and
technology: microbiology, chemistry, applications, (pp. 721-743),
Lancaster: DEStech Publications
Coumans, W. J. (2000). Models for drying kinetics based on drying curves of
slabs. Chemical Engineering and Processing, 39, 53-68.
Creswell, J. W. (2003). Qualitative, Quantitative, and mixed methods
approaches. 2nd Edition. London: SAGE Publications.
Cruz, R., Guine, P. F., & Gonçalves, J. C. (2015). Drying kinetics and product
quality for convective drying of apples (cvs. Golden Delicious and
Granny Smith). International Journal of Fruit Science, 15(1), 54–78.
148
Darvishi, H., Farhang, A., & Hazbavi, E. (2012). Mathematical Modeling of
Thin-Layer Drying of Shrimp. Global Journal of Science Frontier.
Research, 12(3), 82–90.
Davies, R. M., & Davies, O. A. (2009). Traditional and improved fish
processing technologies in Bayelsa State, Nigeria. European Journal of
Scientific Research, 26 (4), 539-548.
Dewi, E. N. (2002). Chemical analysis during the processing of dried salted
anchovy. Journal of Coastal Development, 5(2), 55- 65.
Dhumne, L. R., Vipin Bipte, E. H., & Jibhkate, Y. M. (2016). Optimization of
Solar Tunnel Dryer Using Genetic Algorithm. International Research
Journal of Engineering and Technology, 2395–2406.
Dodds, A. (2008). Future convenience food and drinks. New opportunities in
a developed market. Business Insights Ltd., London, pp 114–124.
Dovlo, E., Amador, K., & Nkrumah, B. (2016). Report of the 2016 Ghana
marine canoe frame survey. Information report No 26. Fisheries
Survey and Statistical Division.
Doymaz, I. (2007). The Kinetics of forced convective air drying of pumpkin
slices. Journal of Food Engineering, 79(1), 243-248.
Durmus, M., Kosker, A., Ozogula, Y., Aydin, M., UCar, Y., Ayas, D., &
Ozogul, F. ( 2018). The effects of sex and season on the metal levels
and proximate composition of red mullet (Mullus barbatus L. 1758)
caught from the Middle Black Sea. Human and ecological risk
assessment: An International Journal, 24(3), 731-742.
Egbi, G., Ayi, I., Saalia, F. K., Zotor, F., Adom, T., Harrison, E., Ahorlu, C.
K., & Steiner- Asiedu, M. (2015). Impact of cowpea-based food
149
containing fish meal served with vitamin C-rich drink on iron stores
and hemoglobin concentrations in Ghanaian schoolchildren in a
malaria endemic area. Food and Nutrition Bull., 36(3), 264–275.
Ekechukwu, O. V., & Norton, B. (1997). Experimental studies of integral-type
natural-circulation solar-energy tropical crop dryers. Energy
Conversion and Management, 38(14), 1483–1500.
El Sheikha, A. F., Ray, R., Montet, D., Panda, S., & Worawattanamateekul,
W. (2014). African fermented fish products in scope of risks. IFRJ,
21(1), 425-432.
Elbandy, M. (2015). Production and Quality Evaluation of Nutritious High
Quality Biscuits and Potato Puree Tablets Supplemented With Crayfish
(ProcombarusClarkia) Protein Products. Journal of Applied Sciences
Research, 10(7), 43-53.
Emikpe, B., Adebisi, T., & Adedeji, O. (2011). Bacteria load on the skin and
stomach of Clarias gariepinus and Oreochromis niloticus from Ibadan,
South West Nigeria: Public health implications. Journal of
Microbiology and Biotechnology Research, 1, 52-59.
Environmental Justice Foundation (EJF) (2020). The “people’s” fishery on the
brink of collapse. Small pelagics in landings of Ghana’s industrial
trawl fleet, EC1R 1UL: London, United Kingdom.
Eyo, A. A. (2001). Fish Processing Technology in the Tropics. National
Institute for Freshwater. Fisheries Research, New Bussa, Nigeria.
Falade, K. O. & Abbo, E. S. (2007). Air-drying and rehydration characteristics
of date palm (Phoenix dactylifera L.) fruits. Journal of Food
Engineering 79: 724-730.

150
Farber, J. M., Ross, W. H., & Harwig, J. (1996). Health risk assessment of
Listeria monocytogenes in Canada. International Journal of Food
Microbiology, 30(1-2), 145-56.
Faustino, J. M. F., Barroca, M. J., & Guine, R. P. F. (2007). Study of the
drying kinetics of green bell pepper and chemical characterization.
Food and Bioproducts Processing, 85(3), 347-358.
Feldhusen F. (2000). The role of seafood in bacterial food-borne diseases.
Microbes and Infection, 2,1651–1660.
Food Agricultura Organisation (FAO) (2010). Nutrition country profiles-
Ghana. http://www.fao.org/ag/AGN/ nutrition/gha_en.stm Accessed
online: 2nd March, 2021. 17:09:42 GMT.
Food Agricultural Organisation (FAO) (2018). The state of World fisheries
and aquaculture 2018 - Meeting the sustainable development goals:
FAO.
Frimpong, S. K., & Adwani, A. (2015). The Challenges and Prospects of Fish
Farming in Ghana: A Project Management Perspective. International
Journal of ICT and Management, 3(2), 29-34.
Getu, A., & Misganaw, K. (2015). Post-harvesting and Major Related
Problems of Fish Production. Fisheries and Aquaculture Journal, 6(4),
142-153
Ghaly, A. E., Dave, D., Budge, S., & Brooks, M. S. (2010). Fish spoilage
mechanisms and preservation techniques: review. American Journal of
Applied Science, 7, 859-877.
Ghana Standards GS 747: 2003, Fish and Fish Products - Specification for
Canned Sardine - Type Products. Ghana: Ghana Standards Authority.
151
Ghana Statistical Service (GSS), Ghana Health Service (GHS), & ICF
International (2015). Ghana Demographic and Health Survey 2014.
Rockville, Maryland, USA: GSS, GHS, and ICF International.
Gibson, R., Yeudall, F., & Drost, N. (2003) Experiences of a community-
based dietary intervention to enhance micro- nutrient adequacy of diets
low in animal source foods and high in phytate: a case study in rural
Malawian children. Journal of Nutrition, 133, Suppl. 11, 3992S–
3999S.
Gram, L. & Dalgaard, P. (2002). Fish spoilage bacteria—Problems and
solutions. Current. Opinion in. Biotechnology,13, 262–266.
Gram, L., & Huss, H. H. (1996). Microbiological spoilage of fish and fish
products. International Journal of Food Microbiology, 33, 121–137.
Greco, L., Balungi, J., Amono, K., & Iriso, R. (2006). Effect of a low- cost
food on the recovery and death rate of malnourished children. Journal
of Pediatric Gastroenterology and Nutrition, 43, 512–517.
Guan, Z., Wang, X., Li, M., & Jiang, X. (2013). Mathematical modelling on
hot air drying of thin-layer fresh tilapia fillets. Polish Journal of Food
and Nutrition Science, 63(1), 25–34.
Guillen, M. D., Sopelana, P., & Partearroyo, M. A. (1997). Food as a source of
polycyclic aromatic carcinogens. Reviews on Environmental Health,
12, 133–146.
Guine, R. P. F. (2015). Food Drying and Dehydration: Technology and Effect
on Food Properties, Germany: LAP Lambert Academic Publishing
GmbH & Co.
Guine, R. P. F. (2018). The drying of foods and its effect on the physical-

152
chemical , sensorial and nutritional properties. International Journal of
Food Engineering, 4(2), 93–100.
Hall, R. E. (2011). The High Sensitivity of Economic Activity to Financial
Frictions.. Journal of Economics, 121(552), 351-378.
Hansen, M. I., Thilsted, S. H., Sandstrom, B., Kongsbak, K., Larsen, T.,
Jensen, M., & Sorensen, S. S. (1998). Calcium Absorption from Small
Soft-boned Fish. Journal of Trace Elements in Medicine and Biology,
12, 148-154.
Hardin, R., & Smith, J. G. M. (1976). The storage of mackerel (Scomber
scombrus). Development of histamine and rancidity. Journal of
Science of Food and Agriculture, 27,595-599.
Hasselberg, A. E., Aakre, I., Scholtens, J., Overå, R., Kolding, J., Bank, M. S.,
Atter, A., & Kjellevold, M. (2020a). Fish for food and nutrition
security in Ghana: Challenges and opportunities. Global Food
Security, 26, 100-118.
Hasselberg, A. E., Wessels, L., Aakre, I., Reich, F., Atter, A., Steiner-Asiedu,
M., Amponsah, S., Pucher, J., & Kjellevold, M. (2020b). Composition
of nutrients, heavy metals, polycyclic aromatic hydrocarbons and
microbiological quality in processed small indigenous fish species
from Ghana: Implications for food security. PLoS ONE, 15, 1–25.
Horner, W. F. A. (1997). Preservation of fish by curing (Drying, Salting and
Smoking). In: Hall GM, ed. Fish processing technology. 2nd ed. UK:
Blackie Academic and Professional publishers; pp. 32–73.
Huang, Y. R., Liu, K. J., Hsieh, H. S., Hsieh, C. H., Hwang, D. F., & Tsai, Y.
H. (2010). Histamine level and histamine-forming bacteria in dried fish
153
products sold in Penghu Island of Taiwan. Food Control, 21, 1234–
1239.
Huss, H. H. (1995). Quality and quality changes in fresh fish, FAO Fisheries
Technical Paper No. 348, Rome, Italy: Food and Agricultural
Organization.
Id, G. R., Chandra, B., Id, M., & Afrin, F. (2018). Biochemical,
microbiological, and sensory properties of dried silver carp
(Hypophthalmichthys molitrix). Fishes, 3(3), 25-41.
Idah, P. A., & Nwankwo, I. (2013). Effects of smoke‒drying temperatures and
time on physical and nutritional quality parameters of Tilapia
(Oreochromis niloticus). African Journal of Agricultural Economics
and Rural Development, 5(3), 29‒34.
Ikutegbe, V., & Sikoki, F. (2014). Microbiological and biochemical spoilage
of smoke- dried fishes sold in West African open markets. Food
chemistry, 161, 332-336.
Immaculate, J., Sinduja, P., & Jamila, P. (2012). Biochemical and microbial
qualities of Sardinella fimbriata sun dried in different methods.
International Food Research Journal, 19(4), 1699-1703.
International Commission on Microbiological Specifications for Foods
(ICMSF) (1988). Microorganisms in Foods 4. Application of the
Hazard Analysis Critical Control Point (HACCP) system to ensure
microbiological safety and quality. Oxford: Blackwell Scientific
Publications
International Organization for Standards (ISO) (2008). Horizontal method for
the enumeration of yeast and moulds. Methods no. 21527-1.
154
Interrnational Organization for Standards (ISO) (1996). 11290-1(1996),
Microbiology of food and animal feeding stuffs -Horizontal method for
the detection and enumeration of Listeria monocytogenes. Technical
Committee ISO/TC34/SC 9
Jain, D., & Pathare, P. B. (2007). Study the drying kinetics of open sun drying
of fish. Journal of Food Engineering, 78, 1315–1319.
Jensen, O. S., Frank, F. C., & Kristensen, E. F. (1999). Survey on solar dryers
for drying of food and wood in Ghana Survey on solar dryers for
drying of food and wood in Ghana. Danish Technological Institute
Energy division. Denmark.
Jon, C. K., & Kiang, C. S. (2008). Food dehydration and developing countries
Food drying science and technology. In: Food drying science and
technology, microbiological, chemistry applications, Lancester
Pensylvannia USA: DEStech Publications Inc. pp 67-82.
Jonsdotti R., Olafsdottir, G., Chanie, E., & Haugen, J. (2008). Volatile
compounds suitable for rapid detection as quality indicators of cold
smoked salmon (Salmo salar). Food Chemistry, 109, 184–195.
Kadam, S. U., & Prabhasankar, P. (2010). Marine foods as functional
ingredients in bakery and pasta products. Food Research International,
43(8), 1975-1980.
Kane, C. S. E., Ahmed, M. O. A., & Kauhila, M. (2009). Evaluation of drying
parameters and sorption isotherms of mint leaves (M. pulegium). Revue
des Energies Renouvelables, 12(3), 449–470.
Karim, N. U., Sufi, N. F. A., & Hasan, S. M. Z. S. (2017). Quality analysis of
anchovies (Stelophorus commersonii) dried in drying racks. Journal of
155
Sustainability Science and Management, 3, 111–118.
Kawarazuka, N. (2010). The contribution of fish intake, aquaculture, and
small-scale fisheries to improving food and nutrition security: A
literature review. WorldFish Working Paper No.2106.
Kawarazuka, N., & Bene, C. (2011). The potential role of small fish species in
improving micronutrient deficiencies in developing countries: building
evidence. Public Health Nutrition, 14(11), 1927-1938.
Khan. M., & Nowsad, A. (2012). Development of protein enriched shrimp
crackers from shrimp shell wastes. Journal of the Bangladesh
Agricultural University, 10, 367-374.
Kilic, A. (2009). Low temperature and high velocity (LTHV) application in
drying: Characteristics and effects on fish quality. Journal of Food
Engineering, 91, 173 -182.
Kituu, G. M., Shitanda, D., & Kanali, C. L. (2007). Influence of brining on the
drying parameters of tilapia (Oreochromis niloticus) in a glass‒covered
solar tunnel dryer. Agricultural Engineering International, 11, 1‒10.
Koletzko, B., Cetin, I., & Brenna, J. T. (2007). Dietary fat intakes for pregnant
and lactating women. British Journal of Nutrition, 98, 873–877.
Kose, S., & Erdem, M. N. (2003). An investigation of quality changes in
anchovy (Engraulis encrasicolus, L. 1758) stored at different
temperatures. Turkish Journal of Veterinary and Animal Science, 28,
575-582
Kumar, G. P., Xavier, K. A. M., Nayak, B. B., Kumar, H. S., Venkateshwarlu,
G., & Balange, A. K. (2017). Effect of different drying methods on the
quality characteristics of pangasius hypophthalmus. International
156
Journal of Current Microbiology and Applied Science., 6(10), 184-
195.
Kung, H. F., Huang, C. Y., Lin, C. M., Liaw, L. H., Lee, Y. C., & Tsai, Y. H.
(2015). The histamine content of dried flying fish products in Taiwan
and the isolation of halotolerant histamine-forming bacteria. Journal of
Food and Drug Analysis, 23, 335-342.
Larsen, T., Thilsted, S. H., & Kongsbak, K. (2000). Whole small fish as a rich
calcium source. British Journal of Nutrition, 83, 191–196.
Lartey, A., Manu, A., Brown, K. H., Peerson, J. M., & Dewey, K. G. (1999).
A randomized, community-based trial of the effects of improved,
centrally processed complementary foods on growth and micronutrient
status of Ghanaian infants from 6 to 12 months of age. American
Journal of Clinical Nutrition., 70(3), 391-404.
Lotfi, M., Mannar M., & Merx R.,(1996.). Micronutrient Fortification of
Foods. The Micronutrient Initiative (MI), do International
Development Research Centre (IDRC)/International Agriculture
Centre (IAC). ISBN: 0-660-1 6230-X
Lourdes, T. D., Fernaldo, L., & Carrenol, G. (2007). Comparison of Freezing
and Thawing Treatments on Muscle Properties of White Leg Shrimp
(Litopenaeus Vannaamei). Journal of Food Biochemistry, 31(5), 563–
576.
Lu, J. Y., Pace, R. D., & Plahar, W. D. (1991). Storage conditions and
microbial quality of smoked dry herring in Ghana. Journal of Food
Protection, 54(7), 557–559.

157
Lymer, D., Funge-Smith, S., Clausen, J., & Miao, W. (2008). Status and
potential of fisheries and aquaculture in Asia and the Pacific 2008.
RAP publication 2008/15. Bangkok: FAO
Madamba, P. S., Driscoll, R. H., & Buckle, K. A. (1996). The thin layer
drying characteristics of garlic slices. Journal of Food Engineering, 29,
75-97.
Mahmud, A., Abraha, B., Mohammedidris, H., & Mahmud, E. (2018). Fish
preservation : a multi-dimensional approach, 6(3), 303–310.
Majumdar, R. K., & Singh, R. K. R. (2014). The effect of extrusion conditions
on the physicochemical properties and sensory characteristics of fish-
based expanded snacks. Journal of Food Process and Preservation.
38(3), 864-879
Mansur, M. A., Rahman, S., Khan, M. N. A., Reza, M. S., & Kamrunnahar-
Uga, S. (2013). Study on the quality and safety aspect of three sun-
dried fish. African Jornal of Agricultural Research, 8, 5149–5155.
Medvedova, A., Valík, L., & Studenicova, A. (2009). The effect of
temperature and water activity on the growth of Staphylococcus
aureus. Czech Journal of Food Science, 27(2), S2-28–S2-35.
Michaelsen, K. F., Hoppe, C., Roos, N., Kaestel, P., Stougaard, M., Lauritzen,
L., Mølgaard, C., Girma, T., & Friis, H. (2009). Choice of foods and
ingredients for moderately malnourished children 6 months to 5 years
of age. Food and Nutrition, 30, 344–405.
Minkah, E. (2007). Drying and milling characteristics of some selected upland
and lowland rice variety (Oryza sativa) grown in Ghana. Masters’

158
Thesis, Kwame Nkrumah University of Science and Technology,
Kumasi, Ghana.
Mohammed, G., Sulieman, A., Soliman, N., & Bassiuny, S. (2014).
Fortification of biscuits with fish protein concentrate. World Journal of
Dairy Food Science, 9(2), 242–249.
Moody, M. W., Silva, L. Y. A., Prinyawiwatkul, W., & Day, D. (2002).
Microbial quality of West African-dried, smoked catfish during six-
week storage. Food Microbiology: Meat. Poultry and Seafood, 6-8.
Muliterno, M. M., Rodrigues, D., de Lima, F. S., Ida, E. I., & Kurozawa, L. E.
(2017). Conversion/degradation of isoflavones and colour alterations
during the drying of oat. LWT - Food Science and Technology, 75,
512–519.
Mustapha, M. K., Ajibola, T. B., Salako, A. F., & Ademola, S. K. (2014).
Solar drying and organoleptic characteristics of two tropical African
fish species using improved low-cost solar driers. Food Science and
Nutrition, 2(3), 244–250.
Mwithiga, G., & Mwangi, S. G. (2005). Analysis of Fish Fillet Drying Rates
under three solar Energy drying systems. Proceedings of the 15th
International Drying Symposium.
Nguyen, M. H., & Price, W. E. (2007). Air-drying of banana: Influence of
experimental parameters, slab thickness, banana maturity and
harvesting season. Journal of Food Engineering, 79, 200-207.
Ninawe, A. S., & Rathnakumar, K. (2008). Fish processing technology and
product development, impact of curing. India: Narendra Publishing
House.
159
Nketsia-Tabiri, J. (2004). Radiation decontamination and disinfestation of
salted dried tilapia fish (koobi). Ghana Journal of Agricultural
Science, 37(1), 85-90.
Nordic Committee of Food Analysis (1999). Enumeration of Salmonella,
NMKL No. 71.
Nordic Committee of Food Analysis (2004). Enumeration of
Enterobacteriaceae, NMKL No. 114.
Nordic Committee of Food Analysis (2009). Enumeration of Staphylococcus
aureus. NMKL No. 66.
Nordic Committee of Food Analysis (2010). Enumeration of Bacillus cereus.
NMKL No. 67.
Nordic committee of Food Analysis (2013). Aerobic Mesophiles in Foods.
NMKL method No. 86.
Nordic Committee of Food Analysis (2013). Enumeration of E. coli. NMKL
No. 125.
Normadic committee of Food Analysis (2013). Total Coliform count in Foods.
NMKL method No. 44
Nti, C. A. (2008). Household dietary practices and family nutritional status in
rural Ghana. Nutrition Research and Practice, 2 (1), 35–40.
Nunoo, F. K. E., Asiedu, B., & Kombat, E. O. (2015). Sardinella and other
small pelagics value and supply chain of the fishery sector, Ghana.
Food Research Journal, 8(4), 118 - 131.
Nurullah, M., Kamal, M. D., Wahab, M. D., Islam, M. D., Reza, M. D,
Thilsted, S. H., & Mazid, M. A. (2006). Quality assessments of

160
traditional and solar tunnel dried SIS (small indigenous fish species)
products. Bangladish Journal of Fish. Research, 10(1), 63-72.
Ochieng, O. B., Oduor, O. P. M., & Nyale, M. M. (2015). Biochemical and
nutritional quality of dried sardines using raised open solar rack dryers
off Kenyan coast. Journal of Food Resource Science, 4(2), 33–42.
Ojutiku, R. O., Kolo, R. J., & Mohammed, M. L. (2009). Comparative study
of sun drying and solar tent drying of Hyperopisus bebe occidentalis.
Pakistan Journal of Nutrition, 8(7), 955-957.
Olabinjo, O. O., Olajide, J. O., & Olalusi, A. P. (2014). Mathematical
modeling of sun and solar drying kinetics of fermented cocoa beans.
International Journal of Environment, Agriculture and Biotechnology,
2(5), 2456- 1878.
Olokor, J. O., & Ngwu, E. O. (2001). Study of solar dried and traditional sun-
dried fish products. In: Proceedings of the Annual Conference of the
Biotechnological Society of Nigeria. pp.221-229. 75–79.
Omodara, M. A., & Olaniyan, A. M. (2012). Effects of pre-treatments and
drying temperatures on drying rate and quality of african catfish
(Clarias gariepinus). Journal of Biology, Agriculture and Healthcare,
2(4), 2224-3208.
Onal, A. (2007). A Review: current analytical methods for the determination
of biogenic amines in foods. Food Chemistry, 103, 1475-1486.
Oparaku, N. F., & Nwaka, F. C. (2013). Effect of processing on the
nutritional qualities of three fish species (Synodontis clarias,
Trachurus trecae and Clarias gariepinus). International Journal of
Biology and Biological Sciences, 2, 143‒149.

161
Owureku-Asare, M. (2018). Dehydration characteristics, quality evaluation
and consumer assessment of solar dried tomato. Doctoral Thesis,
Kwame Nkrumah University of Science and Technology, Kumasi,
Ghana.
Pal, M. (2012). Detection of microbes in various food products. Ph.D. Lecture,
Addis Ababa University, College of Veterinary Medicine, Debre Zeit,
Ethiopia. pp.1-16.
Pan, B. S., & Orejana, F. (1985). Effect of icing conditions. In Pan, B. S. & D.
James (Eds.), (pp. 252). Histamine in marine products: production of
bacteria, measurement and prediction of formation, FAO Fish
Technical Paper: FAO
Patil, R., & Gawande, R. (2016). A review on solar tunnel greenhouse drying
system, Renewable and Sustainable Energy Reviews, 56, 196-214.
Pee, S. D., & Bloem, M. W. (2009). Current and potential role of specially
formulated foods and food supplements for preventing malnutrition
among 6 to 23 month old children and for treating moderate
malnutrition among 6 to 59 month old children. Food and Nutrition
Bulletin, 30(3), 434-463.
Perry, R. I., & Sumaila, U. R. (2007). Marine ecosystem variability and human
community responses: the example of Ghana, West Africa. Marine
Polution, 31(2), 125–134.
Peryam, D. R. & Pilgrim, F. J. (1957). Hedonic scale method of measuring
food preferences. Food Technology, 11(9), 9–14.
Plahar, W. A., Nerquaye-tetteh, G. A., & Annan, N. T. (1999). Development
of an integrated quality assurance system for the traditional Sardinella

162
sp . and anchovy fish smoking industry in Ghana. Journal of Food and
Nutrition, 10, 15–25.
Prachayawarakorn, S., Tia, W., Plyto, N., & Soponronnarit, S. (2008). Drying
kinetics and quality attributes of low-fat banana slices dried at high
temperature. Journal of Food Engineering, 85, 509-517.
Praveen, K. G., Martin, X. K. A., Nayak, B. B., Kumar, H. S.,
Venkateshwarlu, G., & Balange, K. A. (2017). Effect of Different
Drying Methods on the Quality Characteristics of Pangasius
hypophthalmus. International Journal of Current Microbiology and
Applied Sciences, 6(10), 184–195.
Quagrainie, K. K. (2019). Determinants of Catch Sales in Ghanaian Artisanal
Fisheries. 1–10. https://doi.org/10.3390/su11020298.
Rahman, M. S., Guizani, N., Al-Ruzeiki M. H., & Al Khalasi, A.S. (2000).
Microflora changes in tuna mince during convection air drying. Drying
Technology International Journal, 18, 2339-2379.
Ranhotra, G. S., & Vetter, J. L. (1991). Foods considered for nutrient addition:
snacks and confectionaries. In: Bauernfnd, J. C, &Lachance, P. A.
(eds). Nutrient addition to food. Food and Nutrition, Trumbull, pp
319–345.
Rasul, M. G., Majumdar, B. C., Afrin, F., Bapary, M. A. J., & Azad S. A .K.
M. (2018). Biochemical, microbiological, and sensory properties of
dried silver carp (Hypophthalmichthys molitrix) influenced by various
drying methods. Fishes, 3, (25), 89-102.
Relekar, S. S., Joshi, S. A., Gore, S. B., & Kulkarni, A. K. (2014). Effect of
improved drying methods on biochemical and microbiological quality

163
of dried small head ribbon fish,(Lepturacanthus savala). International
Journal of Fisheries and Aquatic Studies, 1(5), 60–66.
Reza, M. S., Azimiddin, K. M., Islam M. N., & Kamal, M. (2006). Influence
of ice storage on raw materials for the production of high quality dried
fish products. J. Biol. Sci., 6(1), 130-134.
Reza, M. S., Bapary, M. A. J., Azimuddin, K. M., Nurullah, M., & Kamal, M.
(2005). Studies on the traditional drying activities of commercial
important marine fishes of Bangladesh. Pakistan Journal of Biology
Science, 8(9), 1303-1310.
Rhee, K. S., Kim, E. S., Jung, B. M., & Rhee, K. C. (2004). Extrusion of
minced catfish with corn and defatted soy flours for snack foods.
Journal of Food Processing and Preservation, 28, 288–301.
Riaz, M. N. (2001). Selecting the right extruder. In: Guy R (ed) Extrusion
Cooking. Woodhead Publishing Ltd, Cambridge.
Riyanti, M., Dwi, I., & Nur, H. R. (2013). The effect of additional bone of
tuna (Thunnus albacores) and red bean (Phaseolus vulgaris l.) on
calcium and protein content in sweet corn (Zea mays saccharata) milk.
Journal of Food Technology, 2(1), 49-55.
Roos, N. (2001). Fish consumption and aquaculture in rural Bangladesh:
nutritional contribution and production potential of culturing small
indigenous fish species (SIS) in pond polyculture with commonly
cultured carps. Doctoral Thesis, The Royal Veterinary and
Agricultural University, Frederiksberg, Denmark.
Roos, N., Chamnan, C., & Loeung, D. (2007) Freshwater fish as a dietary
source of vitamin A in Cambodia. Food Chemistry, 103, 1104–1111.

164
Roos, N., Mohammed, I., & Thilsted, S. H. (2003). Small Indigenous Fish
Species in Bangladesh: Contribution to Vitamin A, Calcium and Iron
Intakes. Journal of Nutrition, 133(11 Suppl 2):4021S‒4026S.
Sablani, S., Rahman, M. S., Mahgoub, O., & Al-Marzouki, A. (2002). Sun and
solar drying of fish sardines. Proceedings of the International Drying
Symposium, Beijing, P.R. China, 13: 1662-1666.
Sabo, M. (2018). Quality of the European Anchovy, Engraulis Encrasicolus
(L. 1758) processed from open sun drying and solar tent drying
methods in Ghana. Masters’ thesis, University of Ghana, Legon,
Ghana.
Sacilik, K., Keskin, R., & Elicin, A. K. (2006). Mathematical modeling of
solar tunnel drying of thin layer organic tomato. Journal of Food
Engineering, 73, 231–238.
Saeed, I. E., Sopian, K., & Zainol, A. Z. (2006). Drying kinetics of Roselle
(Hibiscus sabdariffa L.): dried in constant temperature and humidity
chamber. Proc. SPS. Edited by Muchtar. Permata, Bangi, S.D.E.,
Malaysia: 143-148.
Saka, E. A. (2015). Development of improved solar fish drying process and
quality evaluation of dried anchovies (Engraulis encrasicolus).
Masters’ Thesis, University of Ghana, Legon, Ghana.
Sampels, S. (2015). The effects of processing technologies and preparation on
the final quality of fish products. In: Trends in Food Science and
Technology, 44(2),131–146.

165
Sankat, C. K., & Mujaffar, S. (2004). Sun and Solar Cabinet Drying Of Salted
Shark Fillets. Proceedings of the Ochieng, 14th International Drying
Symposium ,Sao Paulo, Brazil, pp 1584-1590.
Saritha, K., Immaculate, K., Aiyamperumal, V., & Patterson, J. (2012).
Microbial and biochemical qualities of salted and sun dried sea foods
of Cuddalore, Southeast Coast of India. International Journal of
Microbiological Research, 3 (2), 138-143.
Sarpong, D. B., Quartey, S. N. K., & Harvey, S. K. (2005). The economic and
social contribution of Fisheries to the Gross Domestic Product (G.D.P.)
and rural development in Ghana. Sustainable Fisheries Livelihoods
Progreamme Final Report.
Selmi, S., Bouriga, N., Cherif, M., Toujani, M., & Trabelsi, M. (2010). Effects
of drying process on biochemical and microbiological quality of
silverside (fish) Atherina lagunae. International Journal of Food
Science Technology, 45, 1161- 1168.
Setiabudi, F., Herawati, D., Purnomo, J., & Sehabudin, U. (2018). Coastal
Community Empowerment Management of Anchovy ( Stolephorus
Spp.) Fishery in Saramaake , North Moluccas Province , Indonesia :
Need Assessment , Program and Evaluation, 11(3): 39–55.
Shanmugama, V., & Natarajan, E. (2006). Experimental investigation of
forced convection and desiccant integrated solar dryer. Renewable
Energy, 31, 1239-1251.
Shaviklo, A. R. (2016). Development of fish protein powder as an ingredient
for food applications: a review. Food Control, 23(4), 321-329.

166
Shaviklo, A. R., Kargari, A., & Zanganeh, P. (2013). Interactions and effects
of the seasoning mixture containing fish protein powder/omega-3 fish
oil on children’s liking and stability of extruded corn snacks using a
mixture design approach. Journal of Food Process Preservation, 7(3),
124-129.
Shaviklo, G. R. (2011). Using product development approach for increasing
fish consumption in the Near East region. Infofish International, 4, 47–
52.
Shaviklo, G. R., Thorkelsson, G., Kristinsson, H. G., Arason, S., &
Sveinsdottir, K. (2010). The influence of additives and drying methods
on quality attributes of fish protein powder made from saithe
(Pollachius virens). Journal of the Science of Food and Agriculture,
90, 2133–2143.
Simat, V., & Bogdanovic, T. (2012). Seasonal changes in proximate
composition of anchovy (Engraulis encrasicolus, L.) from the central
Adriatic. Acta Adriatica, 53(1), 125 – 132.
Singh, P., Shrivastava, V. & Kumar, A. (2018). Recent developments in
greenhouse solar drying: a review. Renewable and Sustainable Energy
Reviews, 82(3), 3250–3262.
Smida, M. A. B., Bolje, A., & Ouerhani, A. (2014). Effects of drying on the
biochemical composition of Atherina boyeri from the Tunisian Coast.
Food and Nutrition Sciences, 5(14), 1399‒1407.
Smulders, F. J. M., & Collins J. D. (2002). Food safety assurance and
veterinary public health: Food safety assurance in the pre-harvest

167
phase ECVPH Food safety assurance. Netherlands: Wageningen
Academic Publishers.
Sofos, J. N., & Geornaras, I. (2010). Overview of current meat hygiene and
safety risks and summary of recent studies on biofilms, and control of
Escherichia coli O157:H7 in nonintact, and Listeria monocytogenes in
ready-to-eat, meat products. Meat Science, 86(1), 222-234.
Sopian, K., Saeed I. E., & Abidin Z. Z. (2008). Drying characteristics of
roselle: mathematical modeling and drying experiments. Agricultural
Engineering International: CIGR Journal X, 1, 1–25.
Staatz, J., & Hollinger, F. (2016). West African food systems and changing
consumer demands. West African Papers, 04, 23.
Stone, H., & Sidel, J. L. (2004). Sensory evaluation practices, 3rd ed. Food
science and technology- International series. USA: Elsevier Academic
Press.
Sugathapala, R. M. N. S., Suntharabarathy, T. V., & Edirisinghe, U. (2012).
Salt based dry fish processing and marketing by fishers of Minneriya
Reservoir in Sri Lanka. Trop. Agric. Res., 23, 357-362.
Sultana, S. S., Islam, M. N., & Kamal, M. (2009). Drying performance of
rotating and solar tunnel dryer for production of quality dried fish.
Progressive Agriculture, 20, 173-181.
Sumberg, J., Jatoe, J., Kleih, U., & Flynn, J., (2016). Ghana's evolving protein
economy. Food Security, 8(5), 909–920.
Tacon, A. G., & Metian, M. (2009). Fishing for feed or fishing for food:
increasing global competition for small pelagic forage fish. Ambio,
38(6), 294–302.

168
Tangke, U., Daeng, R. A., & Katiandagho, B. (2021). Organoleptic quality of
tuna porridge canned with fortified una bone meal. IOP Conf. Series:
Earth and Environmental Science, 75, 121-128.
Tano-Debrah, K., Saalia, F. K., Bediako A. B., Appiah, J., Dogbe, E., &
Bomfeh, K. (2011). Listeria monocytogenes: An emerging food
pathogen in Ghana? Proceedings at The increasing burden of non-
communicable diseases in Ghana, Ghana: University of Ghana.
Thilsted, S. H, Roos, N., & Hassan, N. (1997). The role of small indigenous
fish species in food and nutrition security in Bangladesh. World Fish
Centre Q, 22, 82–84.
Thilsted, S., & Roos, N. (1990). Policy issues on fisheries in relation to food
and nutrition security. In: M. Ahmed, C. Delgado, S. Sverdrup-Jensen
& R. Santos, eds. Fisheries policy research in developing countries:
issues, priorities and needs, pp. 61-69. Makati City, Philippines,
International Center for Living Aquatic Resources Management.
Thorkelsson, G., Slizyte, R., Gildberg, A., & Kristinsson, H. G. (2009). Fish
proteins and peptides. Processing methods, quality and functionality.
In: Luten JB (ed). (pp 115–133). Marine functional foods. Wageningen
University Press, Wageningen.
Tiencheu, B., Achidi, A. U., Fossi, B. T., Tenyang, N., Ngongang, F. T., &
Womeni, H. M. (2016). Formulation and nutritional evaluation of
instant weaning foods processed from maize (Zea mays), pawpaw
(Carica papaya), red beans (Phaseolus vulgaris) and mackerel fish
meal (Scomber scombrus). American Journal of Food Science and
Technology, 4(5),149–159.

169
Tunison, A.V., Philips, A. M., Mccay, C. M., Mitchell, C.L., & Rodgers, E. O.
(1990). The nutrition of trout. Research Bulletin. New York: John
Wiley and Sons Inc.
Vakily, J. M., Seto, K., & Pauly, D. (2012). Fisheries centre research reports.
Fisheries Centre, University of British Columbia, Canada.
Vega-Galvez, A., Andres, A., Gonzalez, E., Notte-Cuello, E., Chacana, M., &
Lemus- Mondaca, R. (2009). Mathematical modelling on the drying
process of yellow squat lobster (Cervimunida jhoni) fishery waste for
animal feed. Animal Feed Science and Technology, 151(3), 268-279.
Venugopal, V. (2006). Seafood processing adding value through quick
freezing, retortable packaging, and cook-chilling, Boca Raton: Taylor
& Francis Group, CRC.
Veronica, A. O., Olusola, O. M., & Adebowable, E. A. (2006). Qualities of
extruded puffed snacks from maize/soy bean mixture. Journal of Food
Process Engineering, 29,149–161.
Visciano, P., Schirone, M., Tofalo, R., & Suzzi, G. (2012). Biogenic amines in
raw and processed seafood. Frontiers in Microbiology, pp 1–10.
Wang, C., Harris, W., Chung, M., Lichtenstein, A., Balk, E. M., Kupelnick,
B., Harmon, S., Jordan, H. S., & Lau, J. (2006). n-3 Fatty acids from
fish or fish-oil supplements, but not alpha-linolenic acid, benefit
cardiovascular disease outcomes in primary and secondary prevention
studies: a systematic review. American Journal of Clinical Nutrition,
84, 5–17.

170
Wazed, M. A., Islam, M. T., & Uddin, N. (2009). Solar tunnel fish dryer for
seasonal application in the perspective of Bangladesh. Engineering e-
Transaction, 4(2), 73-80.
Weichselbaum, E., Coe, S., Buttriss, J., & Stanner, S. (2013). Fish in the diet:
a review. Nutrition Bulletin. 38(2), 128–177.
Yilbas, B. S., Hussain, M. N., & Dincer, I. (2003). Heat and moisture diffusion
in slab products to convective boundary. Heat and Mass Transfer, 39,
471-476.

171
APPENDICES
Appendix 1 - Study Questionnaire on Consumer Acceptability of Fish
Fortified Biscuit
CONSUMER ACCEPTABILITY TEST (BISCUIT)
Name:…………………………………..Date:………………Tel:......................
Background Information (Please tick the appropriate box)
Age Group
18-25 [ ] 26-35 [ ] 36-45 [ ] 46-55 [ ] 56-65 [ ] 65+ [ ]
Gender
Male [ ] Female [ ]
Educational Level
Primary [ ] Secondary [ ] Tertiary [ ]
Marital status
Single [ ] Married [ ] Widowed [ ] Divorced [
]Separated [ ]
General Information on biscuit/cookies
Frequency of consumption of biscuit/cookies
Never [ ] Once a month [ ] Once a fortnight [ ] Once a week [ ]
Once a day [ ]
Instruction: You have been served seven biscuit samples. Please examine
and give your degree of likeness using the scale below. Please remember to

172
rinse your mouth with a slice of cucumber and then water before moving on to
the next sample. Thank you.
Scale/Interpretation
9. Like Extremely
8.Like Very Much
7. Like Moderately
6. Like Slightly
5. Nether Like nor Dislike
4. Dislike Slightly
3. Dislike Moderately
2. Dislike Very much
1.Dislike Extremely

173
Whi
ch
of
thes
e
prod
ucts
would you buy if it is on the market.
Please give reasons for your choice in ‘i’ above
…………………………………………………………………………………
……………......................................................................................................
Attributes
Sample Code
Aroma
Crispiness
Taste
After-taste
Overall
Acceptability

174
Appendix 2: Study questionnaire on consumer acceptability of fish fortified
instant cereal mix
Consumer acceptability test (fish-rice instant mix)
Name:………………………………….. Date:…………………
Tel:....................................
Background Information (Please tick the appropriate box)
Age Group
18-25 [ ] 26-35 [ ] 36-45 [ ] 46-55 [ ] 56-65 [ ] 65+ [ ]
Gender
Male [ ] Female [ ]
Educational Level
Primary [ ] Secondary [ ] Tertiary [ ]
Marital status
Single [ ] Married [ ] Widowed [ ] Divorced [ ]
Separated [ ]
General Information on cereal
Frequency of consumption of cereal
Never [ ] Once a month [ ] Once a fortnight [ ] Once a week [ ]
Once a day [ ]
Instruction: You will be served seven samples (four initially and three later
on) of an instant cereal mix prepared from fish and rice. Please examine and
give your degree of likeness using the scale below. Please remember to rinse
your mouth with a slice of cucumber and then water before moving on to the
next sample. Thank you.

175
Scale/Interpretation
9. Like Extremely
8. Like Very much
7. Like Moderately
6. Like Slightly
5. Nether Like nor Dislike
4. Dislike Slightly
3. Dislike Moderately
2. Dislike Very much
1.Dislike Extremely
Which of these products would you buy if it is on the market?
Please give reasons for your choice in ‘i’ above
…………………………………………………………………………………
……………......
Attributes
Sample Code
Aroma
Consistency
Taste
After-taste
Overall
Acceptability
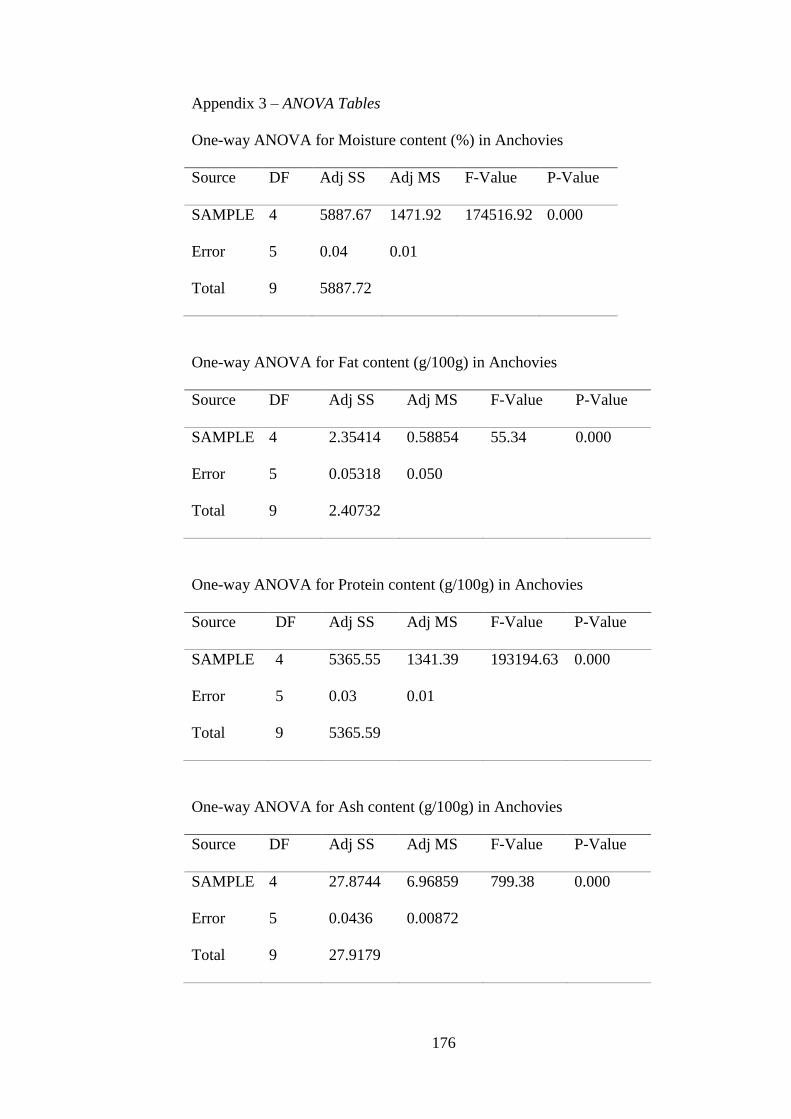
176
Appendix 3 – ANOVA Tables
One-way ANOVA for Moisture content (%) in Anchovies
Source DF Adj SS Adj MS F-Value P-Value
SAMPLE 4 5887.67 1471.92 174516.92 0.000
Error 5 0.04 0.01
Total 9 5887.72
One-way ANOVA for Fat content (g/100g) in Anchovies
Source DF Adj SS Adj MS F-Value P-Value
SAMPLE 4 2.35414 0.58854 55.34 0.000
Error 5 0.05318 0.050
Total 9 2.40732
One-way ANOVA for Protein content (g/100g) in Anchovies
Source DF Adj SS Adj MS F-Value P-Value
SAMPLE 4 5365.55 1341.39 193194.63 0.000
Error 5 0.03 0.01
Total 9 5365.59
One-way ANOVA for Ash content (g/100g) in Anchovies
Source DF Adj SS Adj MS F-Value P-Value
SAMPLE 4 27.8744 6.96859 799.38 0.000
Error 5 0.0436 0.00872
Total 9 27.9179
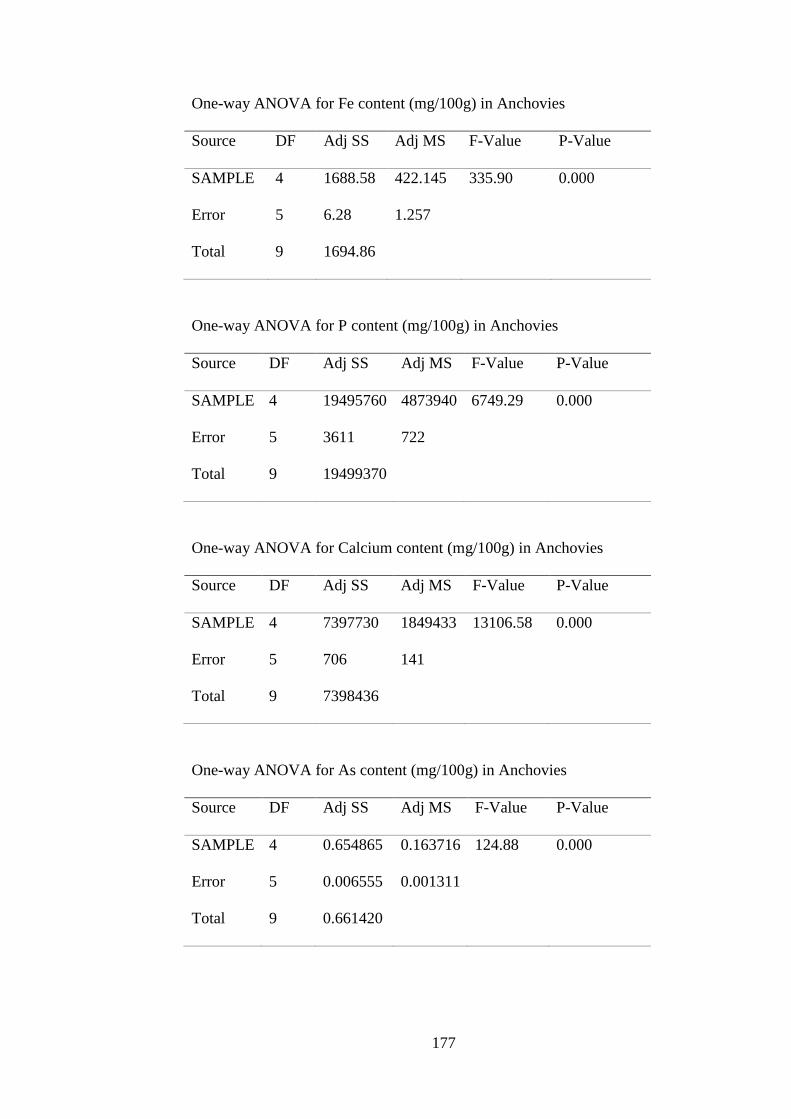
177
One-way ANOVA for Fe content (mg/100g) in Anchovies
Source DF Adj SS Adj MS F-Value P-Value
SAMPLE 4 1688.58 422.145 335.90 0.000
Error 5 6.28 1.257
Total 9 1694.86
One-way ANOVA for P content (mg/100g) in Anchovies
Source DF Adj SS Adj MS F-Value P-Value
SAMPLE 4 19495760 4873940 6749.29 0.000
Error 5 3611 722
Total 9 19499370
One-way ANOVA for Calcium content (mg/100g) in Anchovies
Source DF Adj SS Adj MS F-Value P-Value
SAMPLE 4 7397730 1849433 13106.58 0.000
Error 5 706 141
Total 9 7398436
One-way ANOVA for As content (mg/100g) in Anchovies
Source DF Adj SS Adj MS F-Value P-Value
SAMPLE 4 0.654865 0.163716 124.88 0.000
Error 5 0.006555 0.001311
Total 9 0.661420
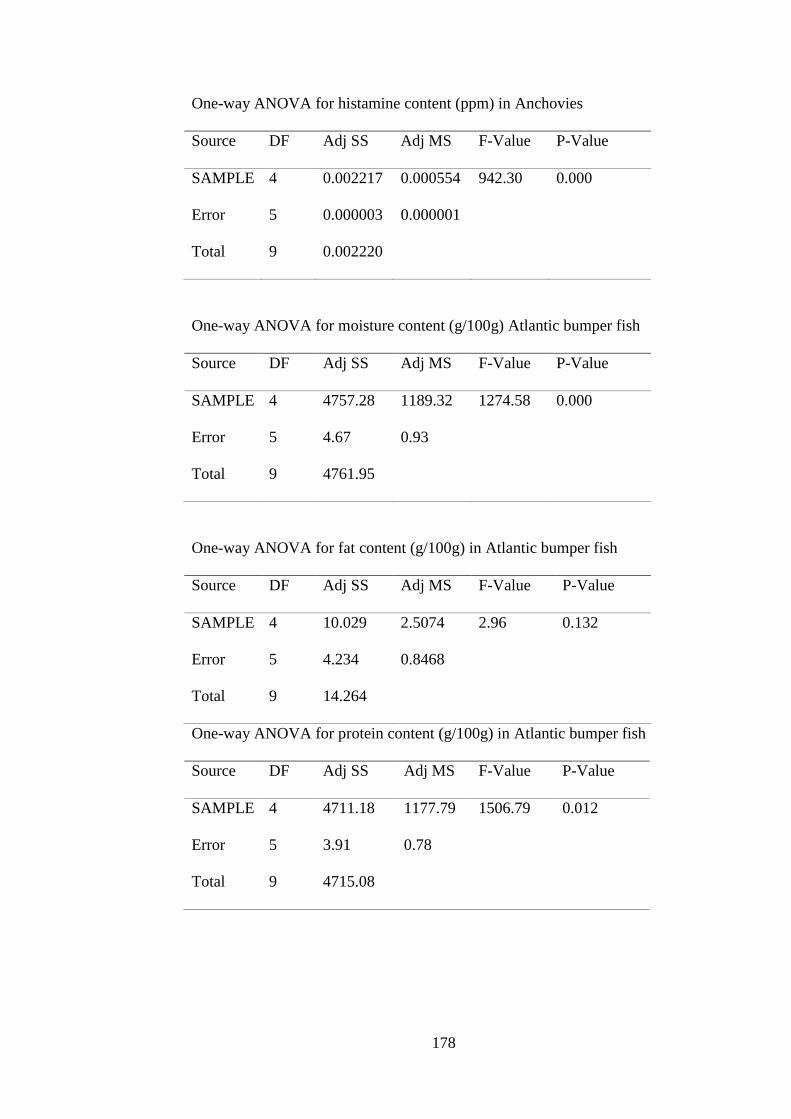
178
One-way ANOVA for histamine content (ppm) in Anchovies
Source DF Adj SS Adj MS F-Value P-Value
SAMPLE 4 0.002217 0.000554 942.30 0.000
Error 5 0.000003 0.000001
Total 9 0.002220
One-way ANOVA for moisture content (g/100g) Atlantic bumper fish
Source DF Adj SS Adj MS F-Value P-Value
SAMPLE 4 4757.28 1189.32 1274.58 0.000
Error 5 4.67 0.93
Total 9 4761.95
One-way ANOVA for fat content (g/100g) in Atlantic bumper fish
Source DF Adj SS Adj MS F-Value P-Value
SAMPLE 4 10.029 2.5074 2.96 0.132
Error 5 4.234 0.8468
Total 9 14.264
One-way ANOVA for protein content (g/100g) in Atlantic bumper fish
Source DF Adj SS Adj MS F-Value P-Value
SAMPLE 4 4711.18 1177.79 1506.79 0.012
Error 5 3.91 0.78
Total 9 4715.08

179
One-way ANOVA for ash content (g/100g) in Atlantic bumper fish
Source DF Adj SS Adj MS F-Value P-Value
SAMPLE 4 53.846 13.46 12.90 0.008
Error 5 5.217 1.043
Total 9 59.062
One-way ANOVA for Fe content (mg/100g) in Atlantic bumper fish
Source DF Adj SS Adj MS F-Value P-Value
SAMPLE 4 302.674 75.6685 165.06 0.000
Error 5 2.292 0.4584
Total 9 304.966
One-way ANOVA for P content (mg/100g) in Atlantic bumper fish
Source DF Adj SS Adj MS F-Value P-Value
SAMPLE 4 14352870 3588217 18.04 0.004
Error 5 994245 198849
Total 9 15347115
One-way ANOVA for Ca content (mg/100g) in Atlantic bumper fish
Source DF Adj SS Adj MS F-Value P-Value
SAMPLE 4 208953 52238.4 205.89 0.000
Error 5 1269 253.7
Total 9 210222
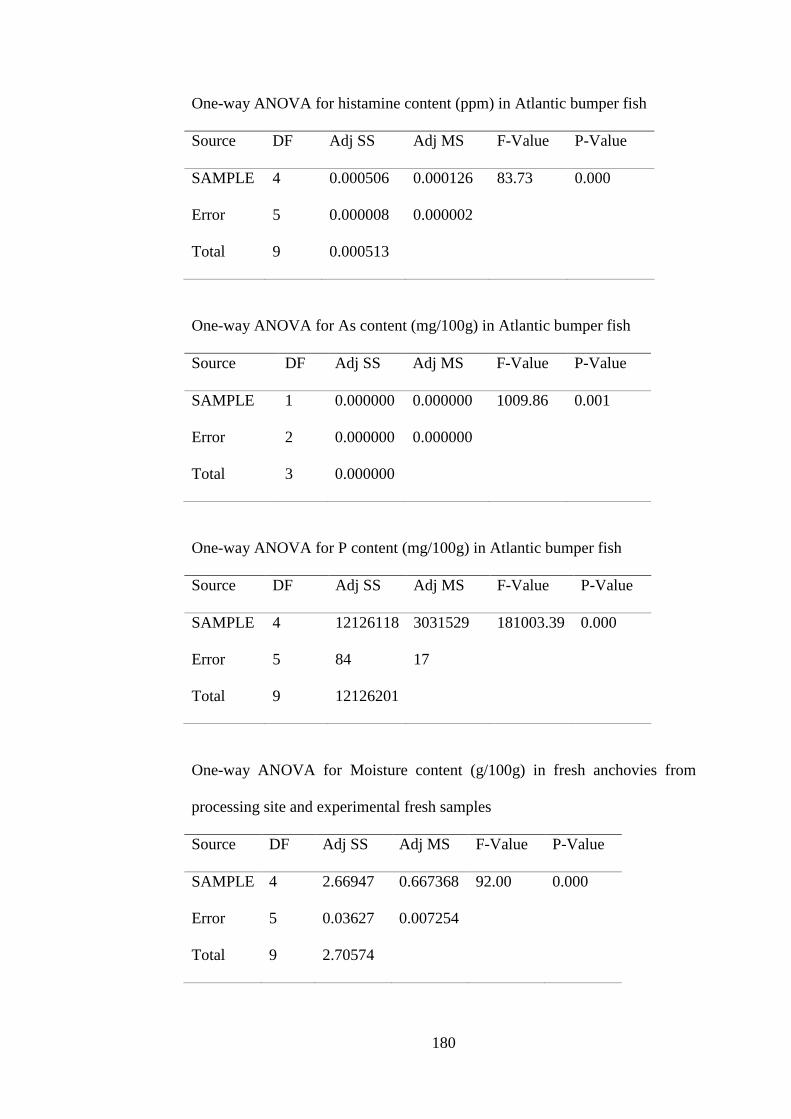
180
One-way ANOVA for histamine content (ppm) in Atlantic bumper fish
Source DF Adj SS Adj MS F-Value P-Value
SAMPLE 4 0.000506 0.000126 83.73 0.000
Error 5 0.000008 0.000002
Total 9 0.000513
One-way ANOVA for As content (mg/100g) in Atlantic bumper fish
Source DF Adj SS Adj MS F-Value P-Value
SAMPLE 1 0.000000 0.000000 1009.86 0.001
Error 2 0.000000 0.000000
Total 3 0.000000
One-way ANOVA for P content (mg/100g) in Atlantic bumper fish
Source DF Adj SS Adj MS F-Value P-Value
SAMPLE 4 12126118 3031529 181003.39 0.000
Error 5 84 17
Total 9 12126201
One-way ANOVA for Moisture content (g/100g) in fresh anchovies from
processing site and experimental fresh samples
Source DF Adj SS Adj MS F-Value P-Value
SAMPLE 4 2.66947 0.667368 92.00 0.000
Error 5 0.03627 0.007254
Total 9 2.70574
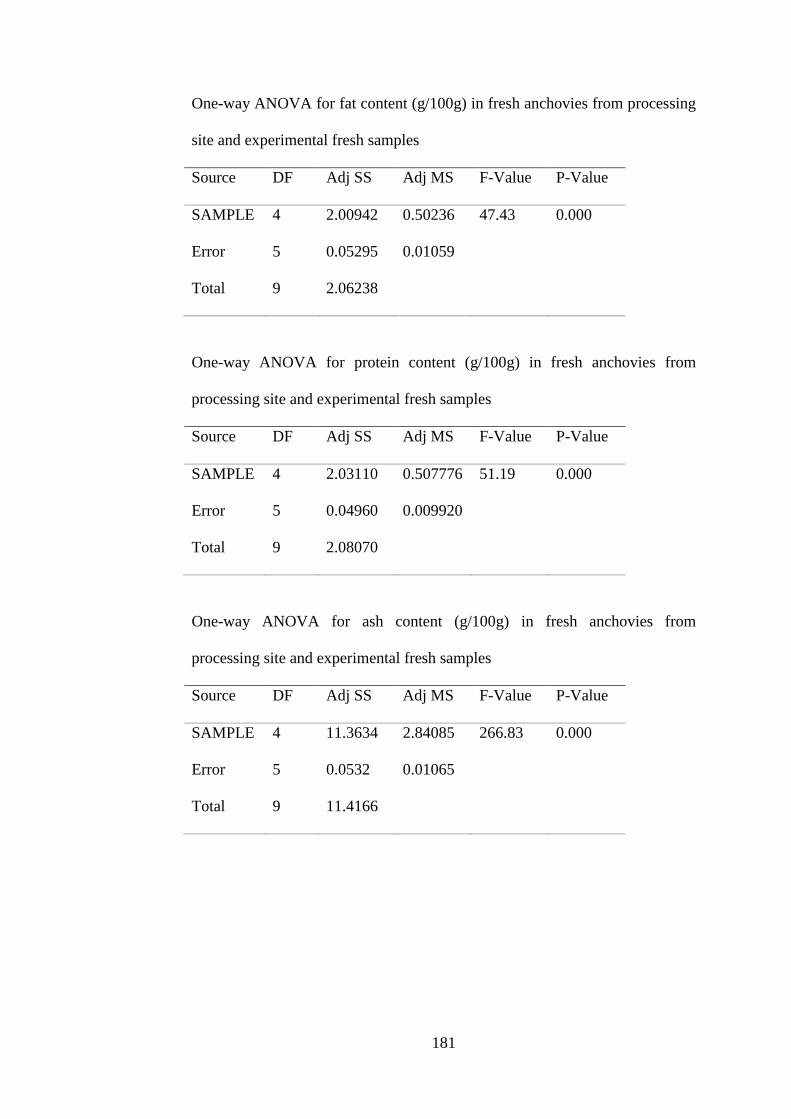
181
One-way ANOVA for fat content (g/100g) in fresh anchovies from processing
site and experimental fresh samples
Source DF Adj SS Adj MS F-Value P-Value
SAMPLE 4 2.00942 0.50236 47.43 0.000
Error 5 0.05295 0.01059
Total 9 2.06238
One-way ANOVA for protein content (g/100g) in fresh anchovies from
processing site and experimental fresh samples
Source DF Adj SS Adj MS F-Value P-Value
SAMPLE 4 2.03110 0.507776 51.19 0.000
Error 5 0.04960 0.009920
Total 9 2.08070
One-way ANOVA for ash content (g/100g) in fresh anchovies from
processing site and experimental fresh samples
Source DF Adj SS Adj MS F-Value P-Value
SAMPLE 4 11.3634 2.84085 266.83 0.000
Error 5 0.0532 0.01065
Total 9 11.4166
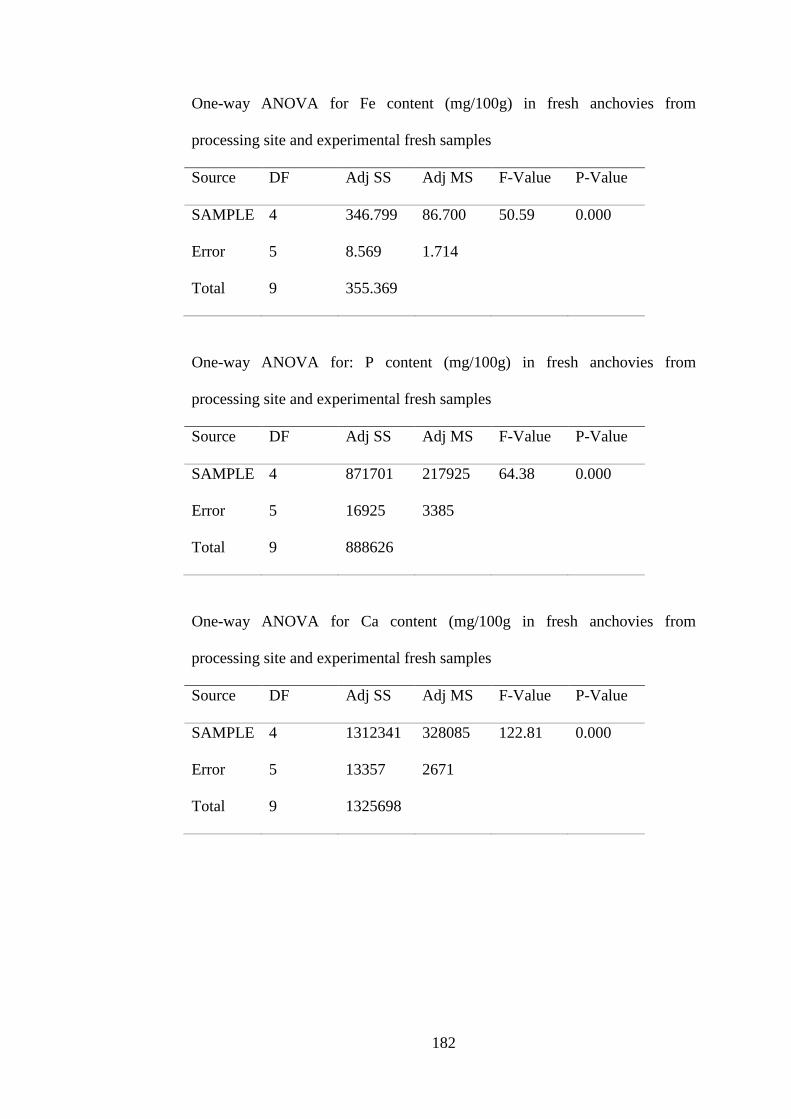
182
One-way ANOVA for Fe content (mg/100g) in fresh anchovies from
processing site and experimental fresh samples
Source DF Adj SS Adj MS F-Value P-Value
SAMPLE 4 346.799 86.700 50.59 0.000
Error 5 8.569 1.714
Total 9 355.369
One-way ANOVA for: P content (mg/100g) in fresh anchovies from
processing site and experimental fresh samples
Source DF Adj SS Adj MS F-Value P-Value
SAMPLE 4 871701 217925 64.38 0.000
Error 5 16925 3385
Total 9 888626
One-way ANOVA for Ca content (mg/100g in fresh anchovies from
processing site and experimental fresh samples
Source DF Adj SS Adj MS F-Value P-Value
SAMPLE 4 1312341 328085 122.81 0.000
Error 5 13357 2671
Total 9 1325698
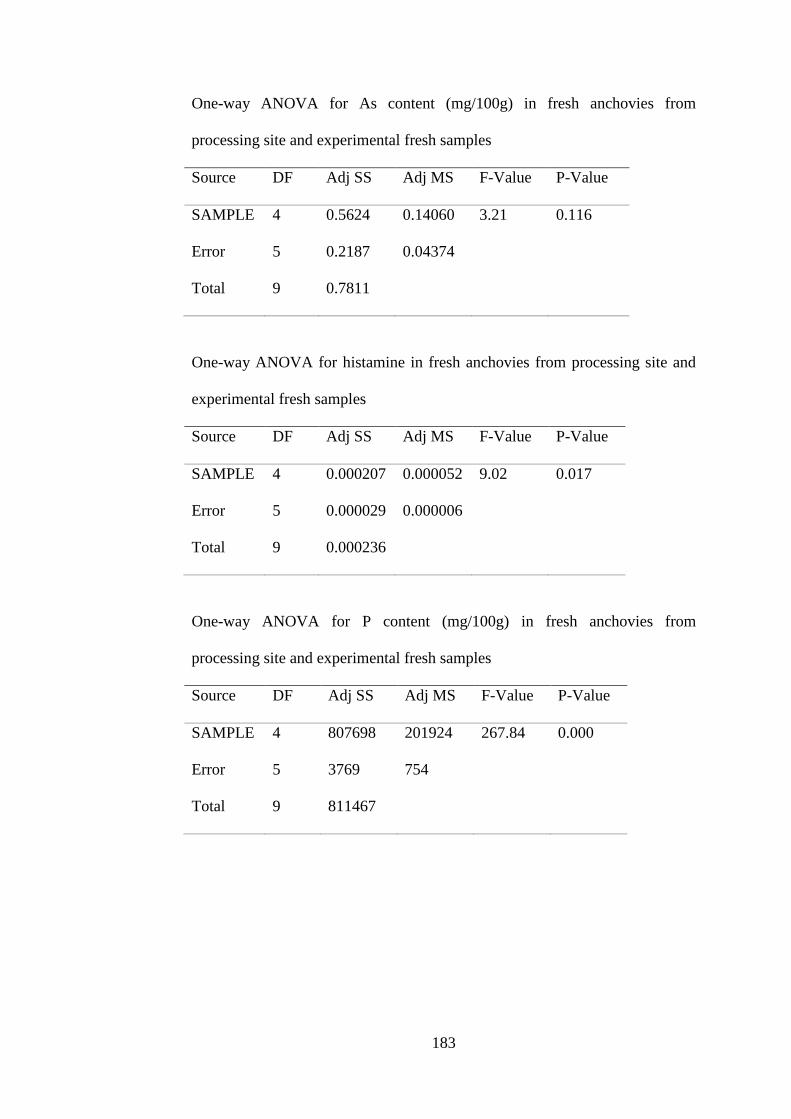
183
One-way ANOVA for As content (mg/100g) in fresh anchovies from
processing site and experimental fresh samples
Source DF Adj SS Adj MS F-Value P-Value
SAMPLE 4 0.5624 0.14060 3.21 0.116
Error 5 0.2187 0.04374
Total 9 0.7811
One-way ANOVA for histamine in fresh anchovies from processing site and
experimental fresh samples
Source DF Adj SS Adj MS F-Value P-Value
SAMPLE 4 0.000207 0.000052 9.02 0.017
Error 5 0.000029 0.000006
Total 9 0.000236
One-way ANOVA for P content (mg/100g) in fresh anchovies from
processing site and experimental fresh samples
Source DF Adj SS Adj MS F-Value P-Value
SAMPLE 4 807698 201924 267.84 0.000
Error 5 3769 754
Total 9 811467

184
One-way ANOVA for: Ca content (mg/100g) in fresh anchovies from
processing site and experimental fresh samples
Source DF Adj SS Adj MS F-Value P-Value
SAMPLE 4 1447363 361841 1358.00 0.000
Error 5 1332 266
Total 9 1448695
One-way ANOVA for moisture content (g/100g) in dried anchovies from
processing sites and RCP+NDR samples
Source DF Adj SS Adj MS F-Value P-Value
SAMPLE 4 16.6868 4.17171 429.47 0.000
Error 5 0.0486 0.00971
Total 9 16.7354
One-way ANOVA for fat content (g/100g) in dried anchovies from processing
sites and RCP+NDR samples
Source DF Adj SS Adj MS F-Value P-Value
SAMPLE 4 2.20855 0.552138 57.96 0.00
Error 5 0.04763 0.009527
Total 9 2.25618
185
One-way ANOVA for protein content (g/100g) in dried anchovies from
processing sites and RCP+NDR samples
Source DF Adj SS Adj MS F-Value P-Value
SAMPLE 4 59.1786 14.7946 2246.80 0.000
Error 5 0.0329 0.0066
Total 9 59.2115
One-way ANOVA for ash content (g/100g) in dried anchovies from
processing sites and RCP+NDR samples
Source DF Adj SS Adj MS F-Value P-Value
SAMPLE 4 22.0917 5.52292 552.34 0.000
Error 5 0.0500 0.01000
Total 9 22.1417
One-way ANOVA for Fe content (mg/100) in dried anchovies from
processing sites and RCP+NDR samples
Source DF Adj SS Adj MS F-Value P-Value
SAMPLE 4 21.951 5.4878 20.32 0.003
Error 5 1.350 0.2700
Total 9 23.301
186
One-way ANOVA for P content (mg/100g) in dried anchovies from
processing sites and RCP+NDR samples
Source DF Adj SS Adj MS F-Value P-Value
SAMPLE 4 132180 33044.9 460.52 0.000
Error 5 359 71.8
Total 9 132539
One-way ANOVA for Ca content (mg/100g) in dried anchovies from
processing sites and RCP+NDR samples
Source DF Adj SS Adj MS F-Value P-Value
SAMPLE 4 908213 227053 872.87 0.000
Error 5 1301 260
Total 9 909513
One-way ANOVA for As content (mg/100g) in dried anchovies from
processing sites and RCP+NDR samples
Source DF Adj SS Adj MS F-Value P-Value
SAMPLE 4 0.111391 0.027848 172.85 0.000
Error 5 0.000806 0.000161
Total 9 0.112197

187
One-way ANOVA for histamine content in dried anchovies from processing
sites and RCP+NDR samples
Source DF Adj SS Adj MS F-Value P-Value
SAMPLE 4 0.000126 0.000031 14.51 0.006
Error 5 0.000011 0.000002
Total 9 0.000136
One-way ANOVA for moisture content (g/100g) in fresh Atlantic bumper fish
from processing sites and experimental fresh samples
Source DF Adj SS Adj MS F-Value P-Value
SAMPLE 4 8.786 2.1964 3.03 0.000
Error 5 3.619 0.7238
Total 9 12.405
One-way ANOVA for fat content (g/100g) in fresh Atlantic bumper fish from
processing sites and experimental fresh samples
Source DF Adj SS Adj MS F-Value P-Value
SAMPLE 4 7.028 1.757 1.70 0.284
Error 5 5.153 1.031
Total 9 12.181

188
One-way ANOVA for protein content (g/100g) in fresh Atlantic bumper fish
from processing sites and experimental fresh samples
Source DF Adj SS Adj MS F-Value P-Value
SAMPLE 4 5.033 1.2582 1.45 0.341
Error 5 4.328 0.8656
Total 9 9.361
One-way ANOVA for ash content (g/100g in fresh Atlantic bumper fish from
processing sites and experimental fresh samples
Source DF Adj SS Adj MS F-Value P-Value
SAMPLE 4 4.289 1.072 1.01 0.483
Error 5 5.321 1.064
Total 9 9.610
One-way ANOVA for Fe content (mg/100g) in fresh Atlantic bumper fish
from processing sites and experimental fresh samples
Source DF Adj SS Adj MS F-Value P-Value
SAMPLE 4 346.799 86.700 50.59 0.000
Error 5 8.569 1.714
Total 9 355.369
189
One-way ANOVA for P content (mg/100g in fresh Atlantic bumper fish from
processing sites and experimental fresh samples
Source DF Adj SS Adj MS F-Value P-Value
SAMPLE 4 871701 217925 64.38 0.000
Error 5 16925 3385
Total 9 888626
One-way ANOVA for Ca content (mg/100g in fresh Atlantic bumper fish
from processing sites and experimental fresh samples
Source DF Adj SS Adj MS F-Value P-Value
SAMPLE 4 1312341 328085 122.81 0.000
Error 5 13357 2671
Total 9 1325698
One-way ANOVA for As content (mg/100g in fresh Atlantic bumper fish
from processing sites and experimental fresh samples
Source DF Adj SS Adj MS F-Value P-Value
SAMPLE 4 0.5624 0.14060 3.21 0.116
Error 5 0.2187 0.04374
Total 9 0.7811

190
One-way ANOVA for histamine in fresh Atlantic bumper fish from processing
sites and experimental fresh samples
Source DF Adj SS Adj MS F-Value P-Value
SAMPLE 4 0.00021 5.2E-05 9.02 0.017
Error 5 2.9E-05 6E-06
Total 9 0.00024
One-way ANOVA for P content (mg/100g) in fresh Atlantic bumper fish from
processing sites and experimental fresh samples
Source DF Adj SS Adj MS F-Value P-Value
SAMPLE 4 807698 201924 267.84 0.000
Error 5 3769 754
Total 9 811467
One-way ANOVA for Ca content (mg/100g) in fresh Atlantic bumper fish
from processing sites and experimental fresh samples
Source DF Adj SS Adj MS F-Value P-Value
SAMPLE 4 1447363 361841 1358.00 0.000
Error 5 1332 266
Total 9 1448695

191
One-way ANOVA for moisture (g/100g) in dried Atlantic bumper fish from
processing sites and RCP+NDR samples
Source DF Adj SS Adj MS F-Value P-Value
SAMPLE 4 6.761 1.6902 2.18 0.207
Error 5 3.870 0.7740
Total 9 10.631
One-way ANOVA for fat content (g/100g) in dried Atlantic bumper fish from
processing sites and RCP+NDR samples
Source DF Adj SS Adj MS F-Value P-Value
SAMPLE 4 10.161 2.5401 3.02 0.128
Error 5 4.205 0.8409
Total 9 14.365
One-way ANOVA for protein content (g/100g) in dried Atlantic bumper fish
from processing sites and RCP+NDR samples
Source DF Adj SS Adj MS F-Value P-Value
SAMPLE 4 33.146 8.2864 18.65 0.003
Error 5 2.222 0.4443
Total 9 35.367

192
One-way ANOVA: Ash content (g/100g) in dried Atlantic bumper fish from
processing sites and RCP+NDR samples
Source DF Adj SS Adj MS F-Value P-Value
SAMPLE 4 40.309 10.0772 16.37 0.004
Error 5 3.079 0.6157
Total 9 43.388
One-way ANOVA for Fe content (mg/100g) in dried Atlantic bumper fish
from processing sites and RCP+NDR samples
Source DF Adj SS Adj MS F-Value P-Value
SAMPLE 4 346.799 86.700 50.59 0.000
Error 5 8.569 1.714
Total 9 355.369
One-way ANOVA for P content (mg/100g) in dried Atlantic bumper fish from
processing sites and RCP+NDR samples
Source DF Adj SS Adj MS F-Value P-Value
SAMPLE 4 871701 217925 64.38 0.000
Error 5 16925 3385
Total 9 888626
193
One-way ANOVA for Ca (Mg/100g) in dried Atlantic bumper fish from
processing sites and RCP+NDR samples
Source DF Adj SS Adj MS F-Value P-Value
SAMPLE 4 1312341 328085 122.81 0.000
Error 5 13357 2671
Total 9 1325698
One-way ANOVA for As (Mg/100g) in dried Atlantic bumper fish from
processing sites and RCP+NDR samples
Source DF Adj SS Adj MS F-Value P-Value
SAMPLE 4 0.5624 0.14060 3.21 0.116
Error 5 0.2187 0.04374
Total 9 0.7811
One-way ANOVA for histamine content (ppm) in dried Atlantic bumper fish
from processing sites and RCP+NDR samples
Source DF Adj SS Adj MS F-Value P-Value
SAMPLE 4 0.000207 0.000052 9.02 0.017
Error 5 0.000029 0.000006
Total 9 0.000236

194
One-way ANOVA for P content (mg/100g) in dried Atlantic bumper fish from
processing sites and RCP+NDR samples
Source DF Adj SS Adj MS F-Value P-Value
SAMPLE 4 807698 201924 267.84 0.000
Error 5 3769 754
Total 9 811467
One-way ANOVA for Ca content (mg/100g) in dried Atlantic bumper fish
from processing sites and RCP+NDR samples
Source DF Adj SS Adj MS F-Value P-Value
SAMPLE 4 1447363 361841 1358.00 0.000
Error 5 1332 266
Total 9 1448695
One-way ANOVA for AEROBIC MESOPHILES count in dried anchovies
Source DF Adj SS Adj MS F-Value P-Value
SAMPLE 4 9.99101 2.49775 2364.97 0.000
Error 5 0.00528 0.00106
Total 9 9.99629

195
One-way ANOVA for TC count in dried anchovies
Source DF Adj SS Adj MS F-Value P-Value
SAMPLE 1 0.44935 0.44935 25.70 0.037
Error 2 0.03497 0.01748
Total 3 0.48431
One-way ANOVA for Mold count in dried anchovies
Source DF Adj SS Adj MS F-Value P-Value
SAMPLE_ 1 5.34891 5.34891 1836.71 0.001
Error 2 0.00582 0.00291
Total 3 5.35473
One-way ANOVA for Entobacteriaceae count in dried anchovies
Source DF Adj SS Adj MS F-Value P-Value
SAMPLE 3 10.4690 3.48965 1147.29 0.000
Error 4 0.0122 0.00304
Total 7 10.4811
One-way ANOVA for B. cereus count in dried anchovies
Source DF Adj SS Adj MS F-Value P-Value
SAMPLE 1 0.14666 0.14666 11.20 0.079
Error 2 0.02618 0.01309
Total 3 0.17284
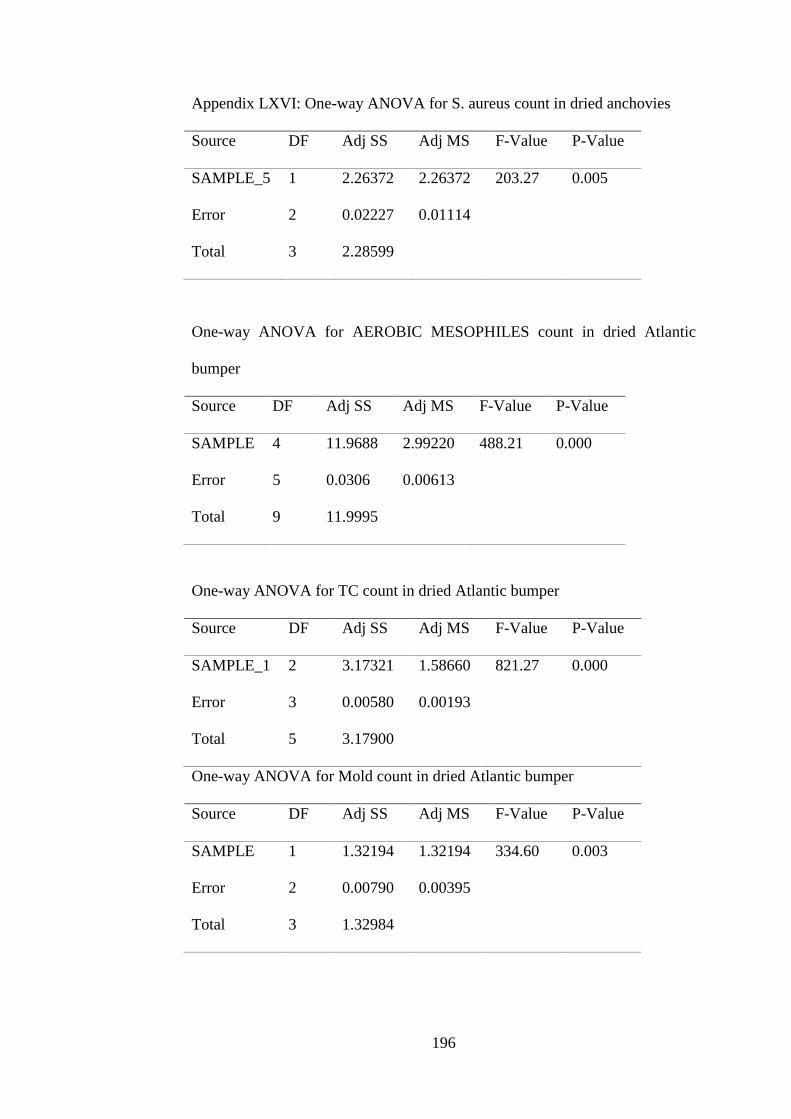
196
Appendix LXVI: One-way ANOVA for S. aureus count in dried anchovies
Source DF Adj SS Adj MS F-Value P-Value
SAMPLE_5 1 2.26372 2.26372 203.27 0.005
Error 2 0.02227 0.01114
Total 3 2.28599
One-way ANOVA for AEROBIC MESOPHILES count in dried Atlantic
bumper
Source DF Adj SS Adj MS F-Value P-Value
SAMPLE 4 11.9688 2.99220 488.21 0.000
Error 5 0.0306 0.00613
Total 9 11.9995
One-way ANOVA for TC count in dried Atlantic bumper
Source DF Adj SS Adj MS F-Value P-Value
SAMPLE_1 2 3.17321 1.58660 821.27 0.000
Error 3 0.00580 0.00193
Total 5 3.17900
One-way ANOVA for Mold count in dried Atlantic bumper
Source DF Adj SS Adj MS F-Value P-Value
SAMPLE 1 1.32194 1.32194 334.60 0.003
Error 2 0.00790 0.00395
Total 3 1.32984
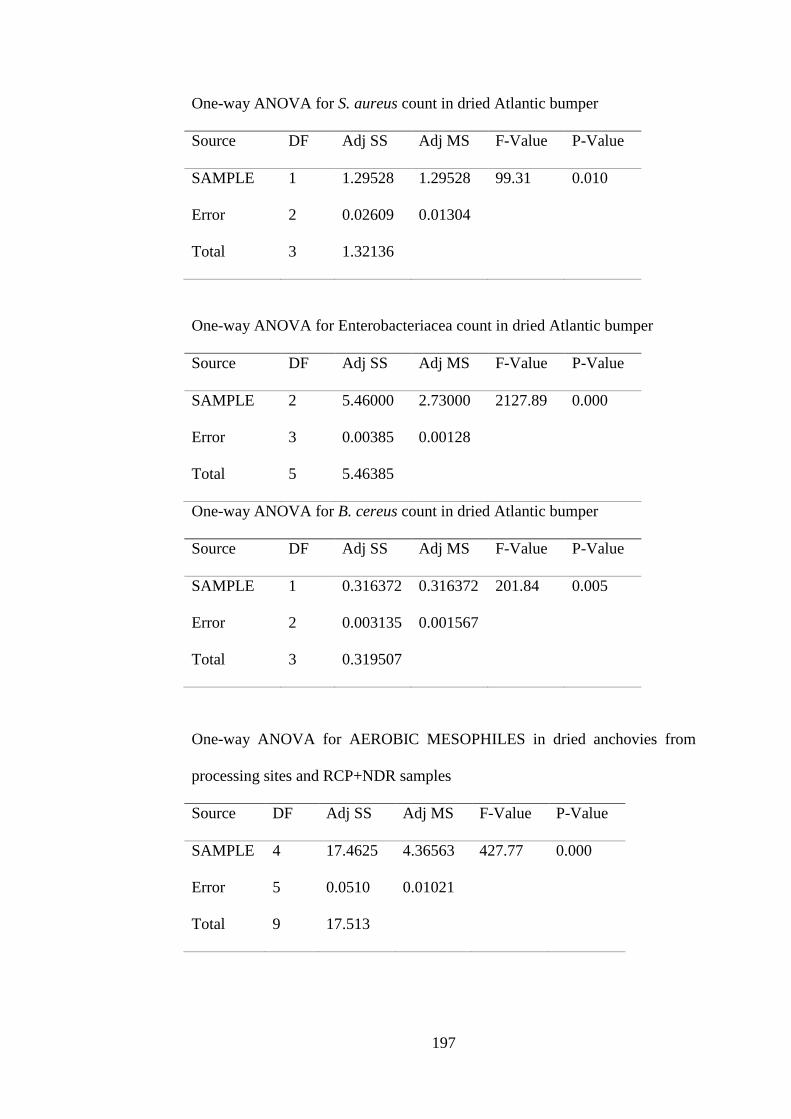
197
One-way ANOVA for S. aureus count in dried Atlantic bumper
Source DF Adj SS Adj MS F-Value P-Value
SAMPLE 1 1.29528 1.29528 99.31 0.010
Error 2 0.02609 0.01304
Total 3 1.32136
One-way ANOVA for Enterobacteriacea count in dried Atlantic bumper
Source DF Adj SS Adj MS F-Value P-Value
SAMPLE 2 5.46000 2.73000 2127.89 0.000
Error 3 0.00385 0.00128
Total 5 5.46385
One-way ANOVA for B. cereus count in dried Atlantic bumper
Source DF Adj SS Adj MS F-Value P-Value
SAMPLE 1 0.316372 0.316372 201.84 0.005
Error 2 0.003135 0.001567
Total 3 0.319507
One-way ANOVA for AEROBIC MESOPHILES in dried anchovies from
processing sites and RCP+NDR samples
Source DF Adj SS Adj MS F-Value P-Value
SAMPLE 4 17.4625 4.36563 427.77 0.000
Error 5 0.0510 0.01021
Total 9 17.513

198
One-way ANOVA for TC count in dried anchovies from processing sites and
RCP+NDR samples
Source DF Adj SS Adj MS F-Value P-Value
SAMPLE 3 3.65206 1.21735 113.91 0.000
Error 4 0.04275 0.01069
Total 7 3.69481
One-way ANOVA for mold count in dried anchovies from processing sites
and RCP+NDR samples
Source DF Adj SS Adj MS F-Value P-Value
SAMPLE 1 0.09846 0.09846 0.16 0.724
Error 2 1.19507 0.59753
Total 3 1.29352
One-way ANOVA for B. cereus in dried anchovies from processing sites and
RCP+NDR samples
Source DF Adj SS Adj MS F-Value P-Value
SAMPLE 3 4.9895 1.66316 46.66 0.001
Error 4 0.1426 0.03565
Total 7 5.1320
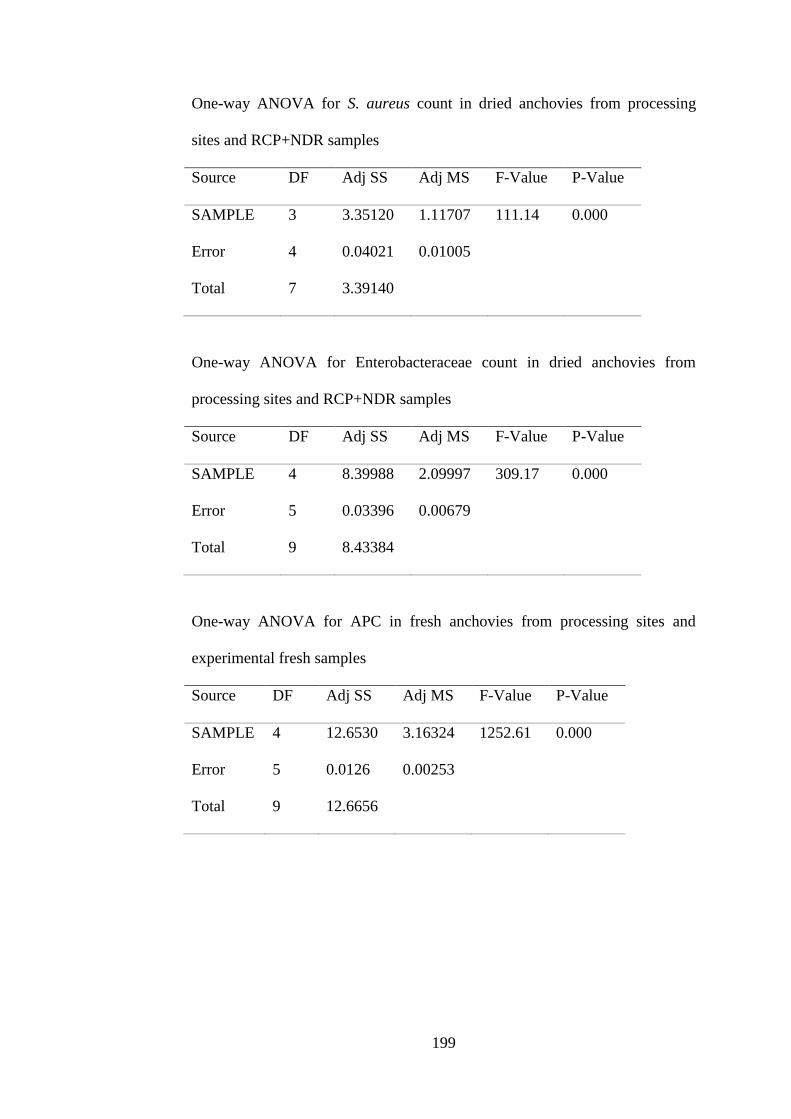
199
One-way ANOVA for S. aureus count in dried anchovies from processing
sites and RCP+NDR samples
Source DF Adj SS Adj MS F-Value P-Value
SAMPLE 3 3.35120 1.11707 111.14 0.000
Error 4 0.04021 0.01005
Total 7 3.39140
One-way ANOVA for Enterobacteraceae count in dried anchovies from
processing sites and RCP+NDR samples
Source DF Adj SS Adj MS F-Value P-Value
SAMPLE 4 8.39988 2.09997 309.17 0.000
Error 5 0.03396 0.00679
Total 9 8.43384
One-way ANOVA for APC in fresh anchovies from processing sites and
experimental fresh samples
Source DF Adj SS Adj MS F-Value P-Value
SAMPLE 4 12.6530 3.16324 1252.61 0.000
Error 5 0.0126 0.00253
Total 9 12.6656
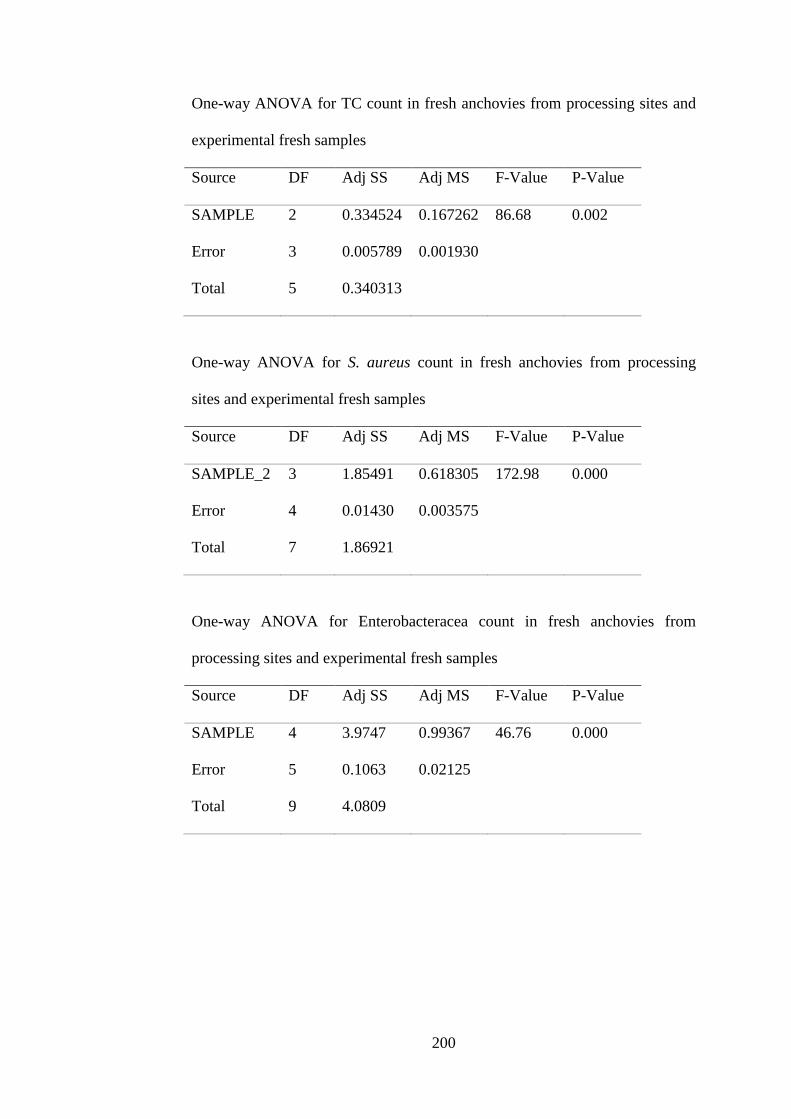
200
One-way ANOVA for TC count in fresh anchovies from processing sites and
experimental fresh samples
Source DF Adj SS Adj MS F-Value P-Value
SAMPLE 2 0.334524 0.167262 86.68 0.002
Error 3 0.005789 0.001930
Total 5 0.340313
One-way ANOVA for S. aureus count in fresh anchovies from processing
sites and experimental fresh samples
Source DF Adj SS Adj MS F-Value P-Value
SAMPLE_2 3 1.85491 0.618305 172.98 0.000
Error 4 0.01430 0.003575
Total 7 1.86921
One-way ANOVA for Enterobacteracea count in fresh anchovies from
processing sites and experimental fresh samples
Source DF Adj SS Adj MS F-Value P-Value
SAMPLE 4 3.9747 0.99367 46.76 0.000
Error 5 0.1063 0.02125
Total 9 4.0809

201
One-way ANOVA for APC in dried Atlantic bumper from processing sites
and RCP+NDR samples
Source DF Adj SS Adj MS F-Value P-Value
SAMPLE 4 10.6311 2.65778 125.75 0.000
Error 5 0.1057 0.02114
Total 9 10.7368
One-way ANOVA for TC count in dried Atlantic bumper from processing
sites and RCP+NDR samples
Source DF Adj SS Adj MS F-Value P-Value
SAMPLE 3 2.43506 0.811687 319.38 0.000
Error 4 0.01017 0.002541
Total 7 2.44523
One-way ANOVA for mold count in dried Atlantic bumper from processing
sites and RCP+NDR samples
Source DF Adj SS Adj MS F-Value P-Value
SAMPLE 2 2.92550 1.46275 83943.47 0.000
Error 3 0.00005 0.00002
Total 5 2.92556
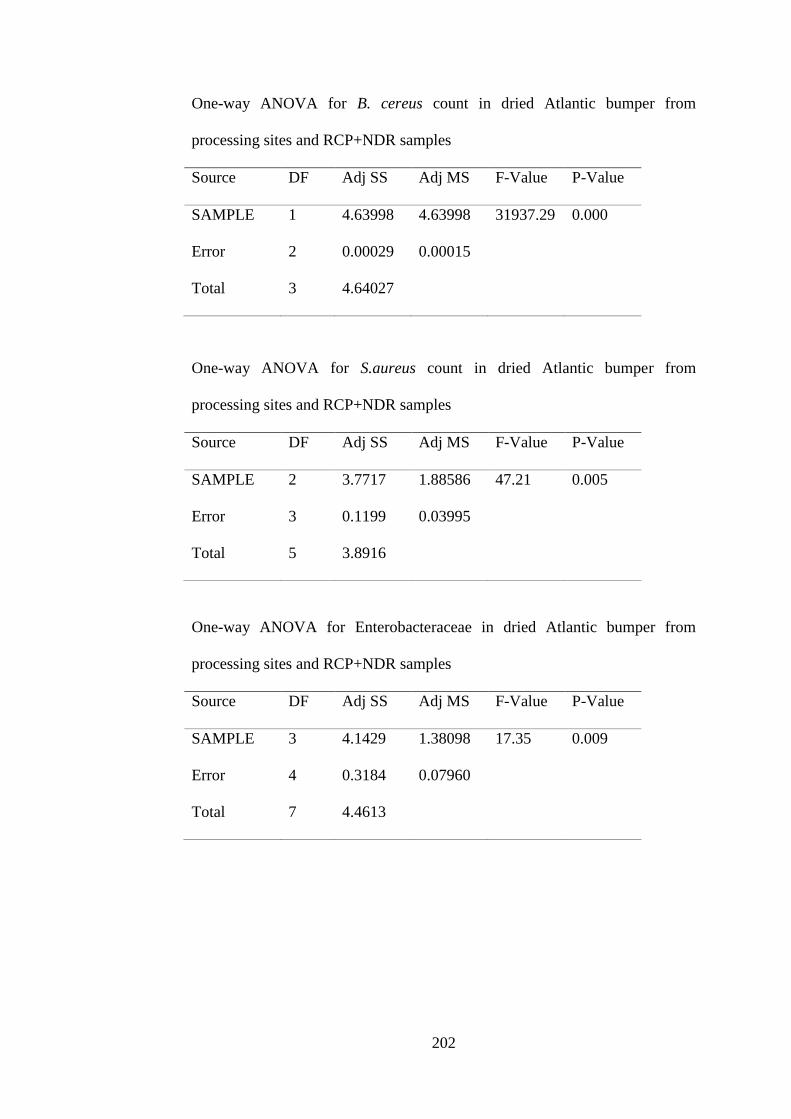
202
One-way ANOVA for B. cereus count in dried Atlantic bumper from
processing sites and RCP+NDR samples
Source DF Adj SS Adj MS F-Value P-Value
SAMPLE 1 4.63998 4.63998 31937.29 0.000
Error 2 0.00029 0.00015
Total 3 4.64027
One-way ANOVA for S.aureus count in dried Atlantic bumper from
processing sites and RCP+NDR samples
Source DF Adj SS Adj MS F-Value P-Value
SAMPLE 2 3.7717 1.88586 47.21 0.005
Error 3 0.1199 0.03995
Total 5 3.8916
One-way ANOVA for Enterobacteraceae in dried Atlantic bumper from
processing sites and RCP+NDR samples
Source DF Adj SS Adj MS F-Value P-Value
SAMPLE 3 4.1429 1.38098 17.35 0.009
Error 4 0.3184 0.07960
Total 7 4.4613

203
One-way ANOVA for APC in fresh Atlantic bumper from processing sites
and experimental fresh samples
Source DF Adj SS Adj MS F-Value P-Value
SAMPLE 4 2.18205 0.54551 34.12 0.001
Error 5 0.07995 0.01599
Total 9 2.26200
One-way ANOVA for TC count in fresh Atlantic bumper from processing
sites and experimental fresh samples
Source DF Adj SS Adj MS F-Value P-Value
SAMPLE 4 0.46266 0.115664 21.65 0.002
Error 5 0.02671 0.005343
Total 9 0.48937
One-way ANOVA for B. cereus count in fresh Atlantic bumper from
processing sites and experimental fresh samples
Source DF Adj SS Adj MS F-Value P-Value
SAMPLE 1 4.45252 4.45252 2934.68 0.000
Error 2 0.00303 0.00152
Total 3 4.45556
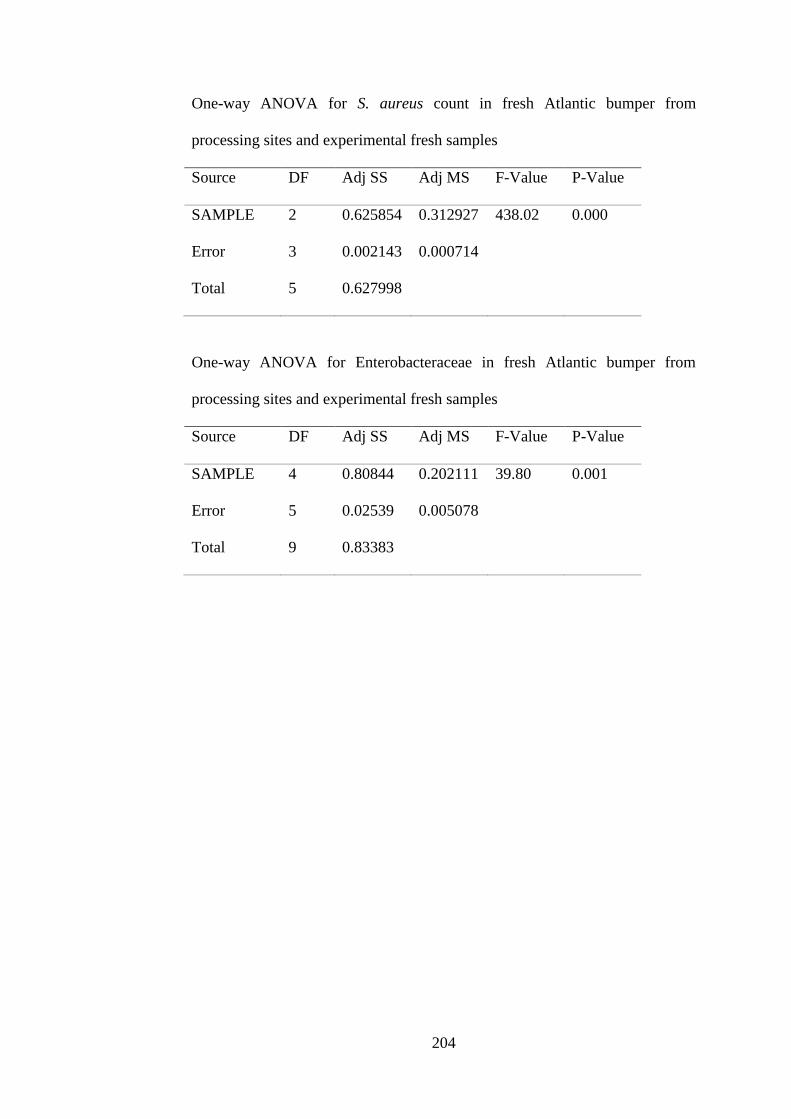
204
One-way ANOVA for S. aureus count in fresh Atlantic bumper from
processing sites and experimental fresh samples
Source DF Adj SS Adj MS F-Value P-Value
SAMPLE 2 0.625854 0.312927 438.02 0.000
Error 3 0.002143 0.000714
Total 5 0.627998
One-way ANOVA for Enterobacteraceae in fresh Atlantic bumper from
processing sites and experimental fresh samples
Source DF Adj SS Adj MS F-Value P-Value
SAMPLE 4 0.80844 0.202111 39.80 0.001
Error 5 0.02539 0.005078
Total 9 0.83383

205
Appendix 4 - 3D Impression of Raised Concrete Platform with Netted Drying
Racks
Related Documents