1 An Evolving Rural Healthcare Environment - Crossing the Shaky Bridge South Carolina’s 19 th Annual Rural Health Conference November 17-19, 2015 Hyatt Regency Greenville, SC Eric K. Shell, CPA, MBA

Welcome message from author
This document is posted to help you gain knowledge. Please leave a comment to let me know what you think about it! Share it to your friends and learn new things together.
Transcript

An Evolving Rural Healthcare Environment - Crossing the Shaky Bridge
South Carolina’s 19th Annual Rural Health Conference
November 17-19, 2015
Hyatt Regency
Greenville, SC
Eric K. Shell, CPA, MBA

2
• In the past 36 months, the healthcare field has experienced considerable changes with an increased number of rural-urban affiliations, physicians transitioning to hospital employment models, flattening volumes, CEO turnover, etc.
• Federal healthcare reform passed in March 2010 with sweeping changes to healthcare systems, payment models, and insurance benefits/programs
• Many of the more substantive changes will be implemented over the next two years
• State Medicaid programs are moving toward managed care models or reduced fee for service payments to balance State budgets
• Commercial insurers are steering patients to lower cost options
• Thus, providers face new financial uncertainty and challenges and will be required to adapt to the changing market
The Healthcare Environment Has Changed!
INTRODUCTION

3
• High Deductible Health Plans• Non Healthcare CEO quote:
• “We just renewed our High Deductible Plan going into our third year, and guess what.....5% reduction in premium!!! Needless to say everyone is thrilled. Not sure what the average HSA balance is, but I think it is high. Doing what it is supposed to do, turning health care patients into consumers.”
• Underinsurance• State Budget Deficits• Recovery Audit Contractors (RAC)• Reduced Re-admissions• Accelerating shift to outpatient care•SGR Fix•Comprehensive Pay Model•340B attacks•New payment models
Market Overview
MARKET OVERVIEW TRANSITION FRAMEWORK STRATEGIES
4
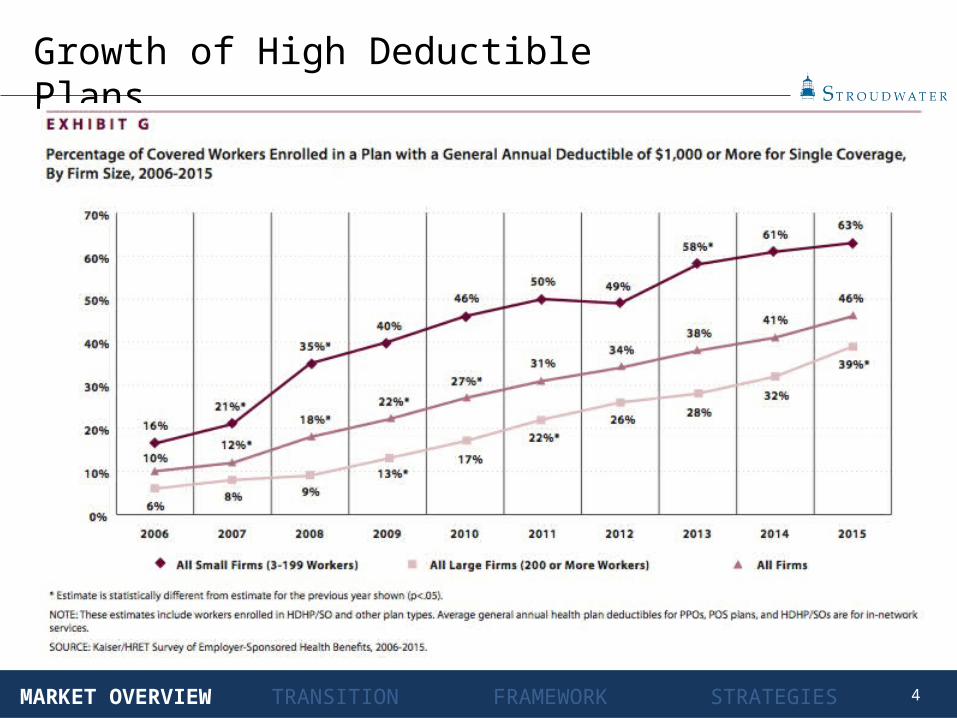
Growth of High Deductible Plans
MARKET OVERVIEW TRANSITION FRAMEWORK STRATEGIES

5
Underinsurance Rates Among Adults Who Were Insured All Year by Source of Coverage at the Time of Survey
Source: http://www.commonwealthfund.org/publications/issue-briefs/2015/may/problem-of-underinsurance
MARKET OVERVIEW TRANSITION FRAMEWORK STRATEGIES
6
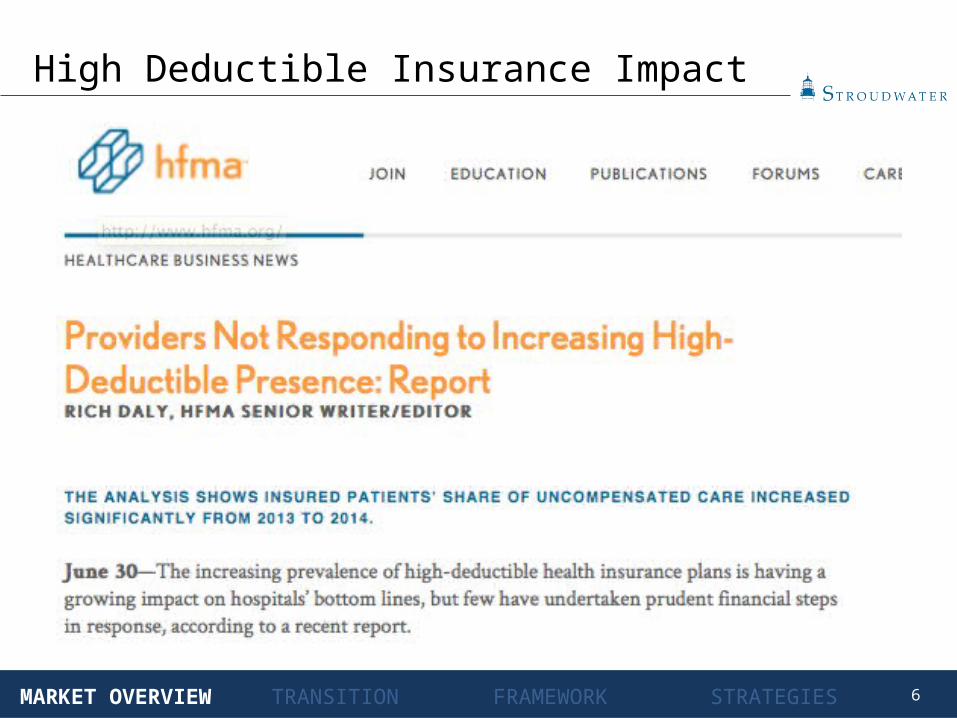
High Deductible Insurance Impact
MARKET OVERVIEW TRANSITION FRAMEWORK STRATEGIES

7
Reduced Readmission Rates
MARKET OVERVIEW TRANSITION FRAMEWORK STRATEGIES
CMS: 2,610 PPS hospitals to receive penalties in 2015Source: Centers for Medicare and Medicaid Services, Offices of Enterprise Management
8
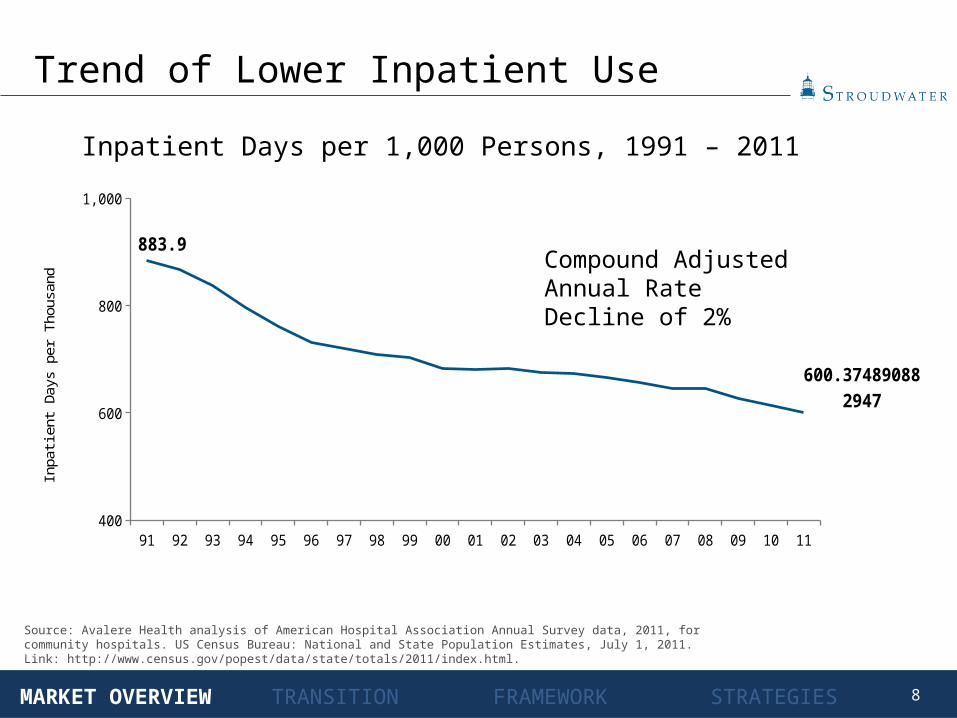
Trend of Lower Inpatient UseInpatient Days per 1,000 Persons, 1991 – 2011
91 92 93 94 95 96 97 98 99 00 01 02 03 04 05 06 07 08 09 10 11400
600
800
1,000
883.9
600.374890882947
Inpa
tient
Day
s pe
r Tho
usan
d
Source: Avalere Health analysis of American Hospital Association Annual Survey data, 2011, for community hospitals. US Census Bureau: National and State Population Estimates, July 1, 2011. Link: http://www.census.gov/popest/data/state/totals/2011/index.html.
Compound Adjusted Annual Rate Decline of 2%
MARKET OVERVIEW TRANSITION FRAMEWORK STRATEGIES
9
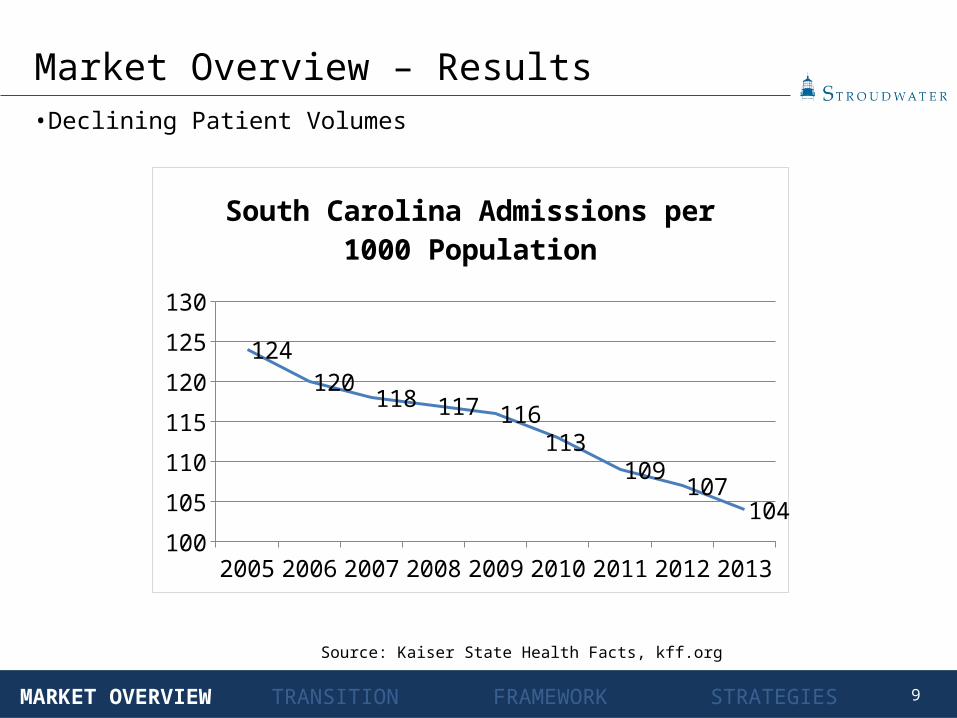
• Declining Patient Volumes
Market Overview – Results
MARKET OVERVIEW TRANSITION FRAMEWORK STRATEGIES
Source: Kaiser State Health Facts, kff.org
2005 2006 2007 2008 2009 2010 2011 2012 2013100
105
110
115
120
125
130
124120
118 117 116113
109107
104
South Carolina Admissions per 1000 Population
10
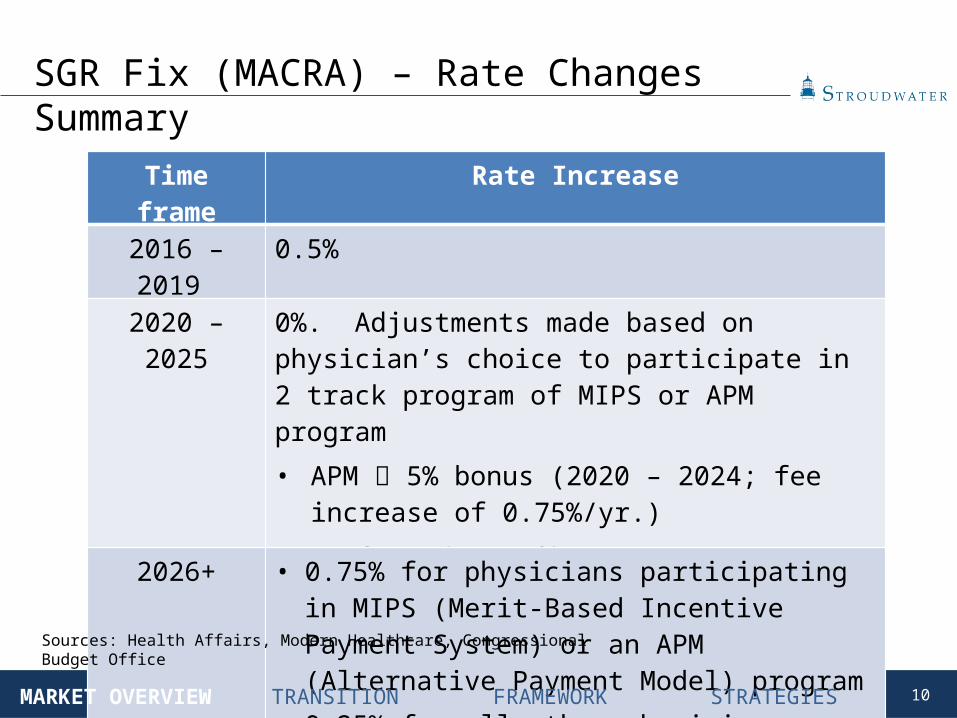
SGR Fix (MACRA) – Rate Changes Summary
Time frame Rate Increase2016 – 2019 0.5%2020 – 2025 0%. Adjustments made based on physician’s choice to
participate in 2 track program of MIPS or APM program• APM 5% bonus (2020 – 2024; fee increase of
0.75%/yr.)• MIPS -4 to +9%
2026+ • 0.75% for physicians participating in MIPS (Merit-Based Incentive Payment System) or an APM (Alternative Payment Model) program
• 0.25% for all other physicians
Sources: Health Affairs, Modern Healthcare, Congressional Budget Office
MARKET OVERVIEW TRANSITION FRAMEWORK STRATEGIES
11
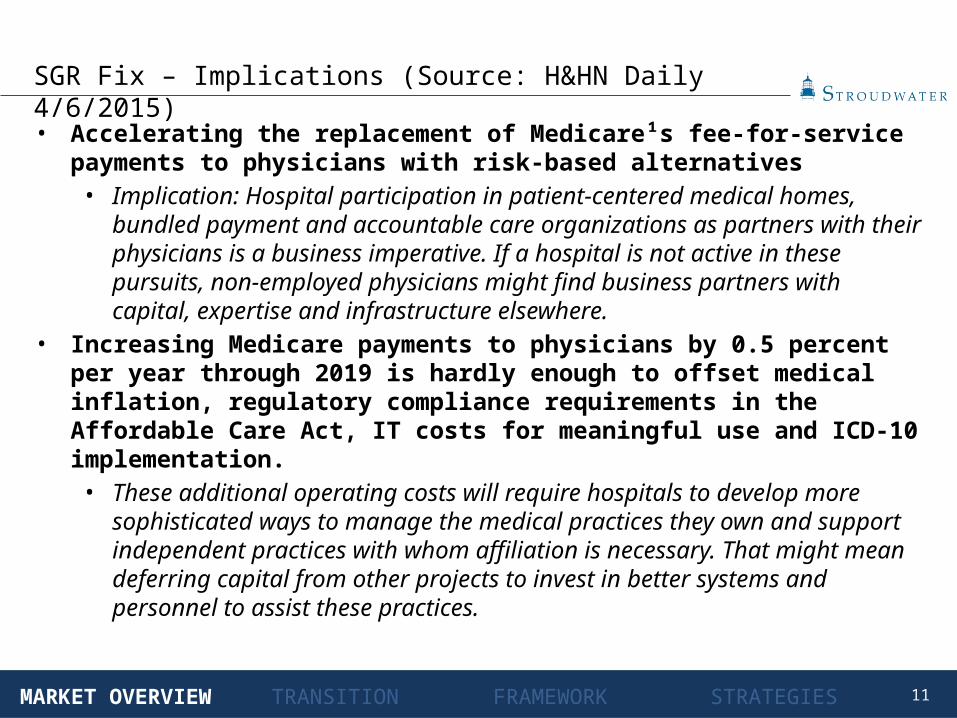
SGR Fix – Implications (Source: H&HN Daily 4/6/2015) • Accelerating the replacement of Medicare¹s fee-for-service payments to physicians
with risk-based alternatives• Implication: Hospital participation in patient-centered medical homes, bundled
payment and accountable care organizations as partners with their physicians is a business imperative. If a hospital is not active in these pursuits, non-employed physicians might find business partners with capital, expertise and infrastructure elsewhere.
• Increasing Medicare payments to physicians by 0.5 percent per year through 2019 is hardly enough to offset medical inflation, regulatory compliance requirements in the Affordable Care Act, IT costs for meaningful use and ICD-10 implementation.• These additional operating costs will require hospitals to develop more
sophisticated ways to manage the medical practices they own and support independent practices with whom affiliation is necessary. That might mean deferring capital from other projects to invest in better systems and personnel to assist these practices.
MARKET OVERVIEW TRANSITION FRAMEWORK STRATEGIES
12
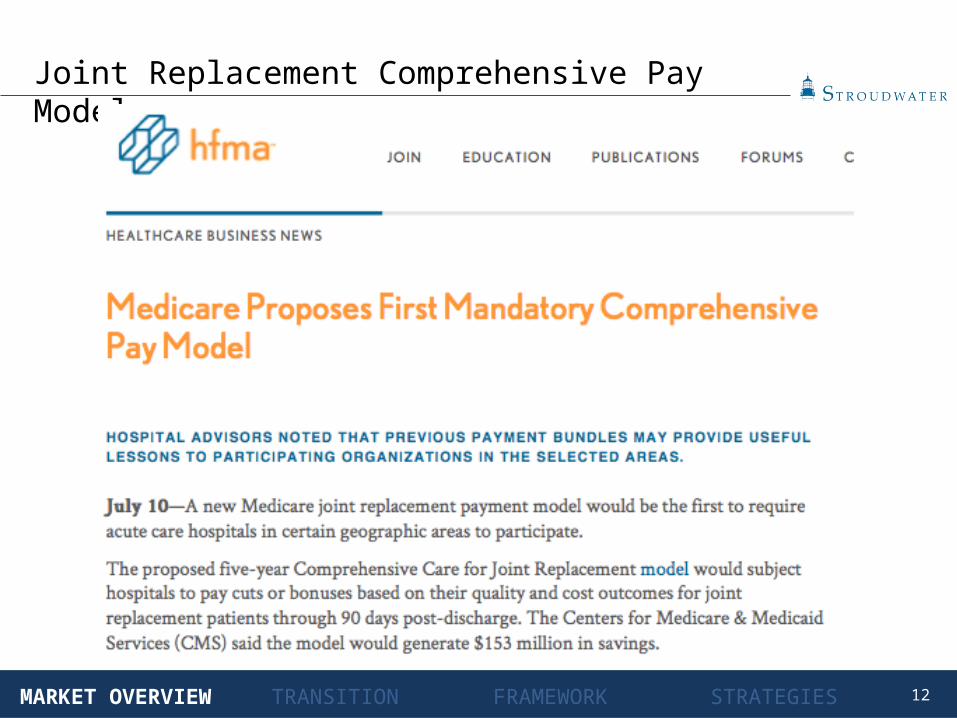
Joint Replacement Comprehensive Pay Model
MARKET OVERVIEW TRANSITION FRAMEWORK STRATEGIES
13
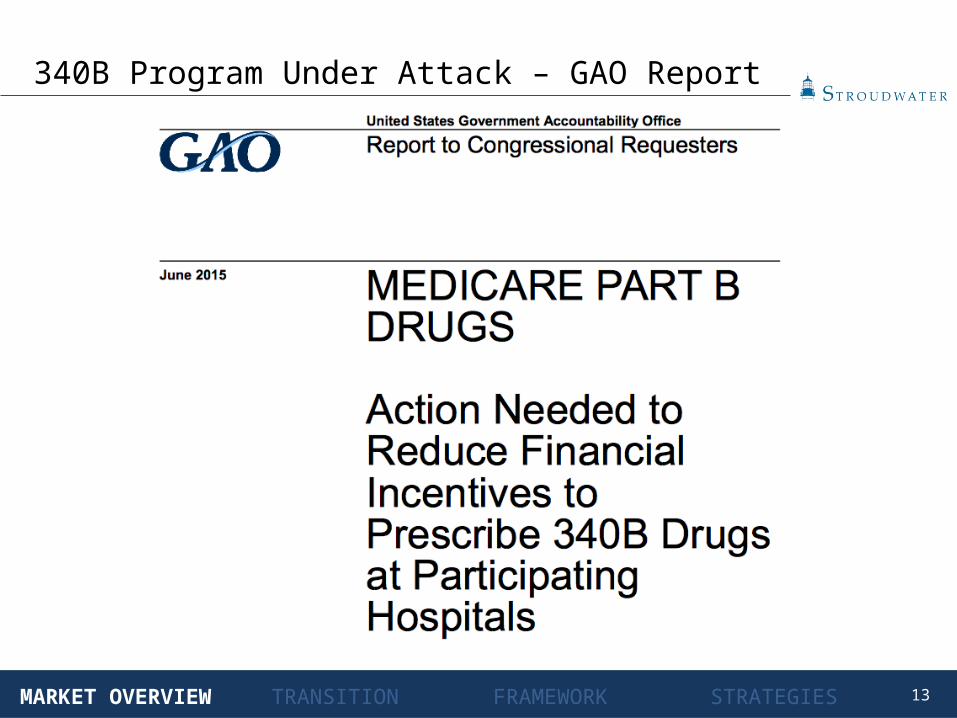
340B Program Under Attack – GAO Report
MARKET OVERVIEW TRANSITION FRAMEWORK STRATEGIES
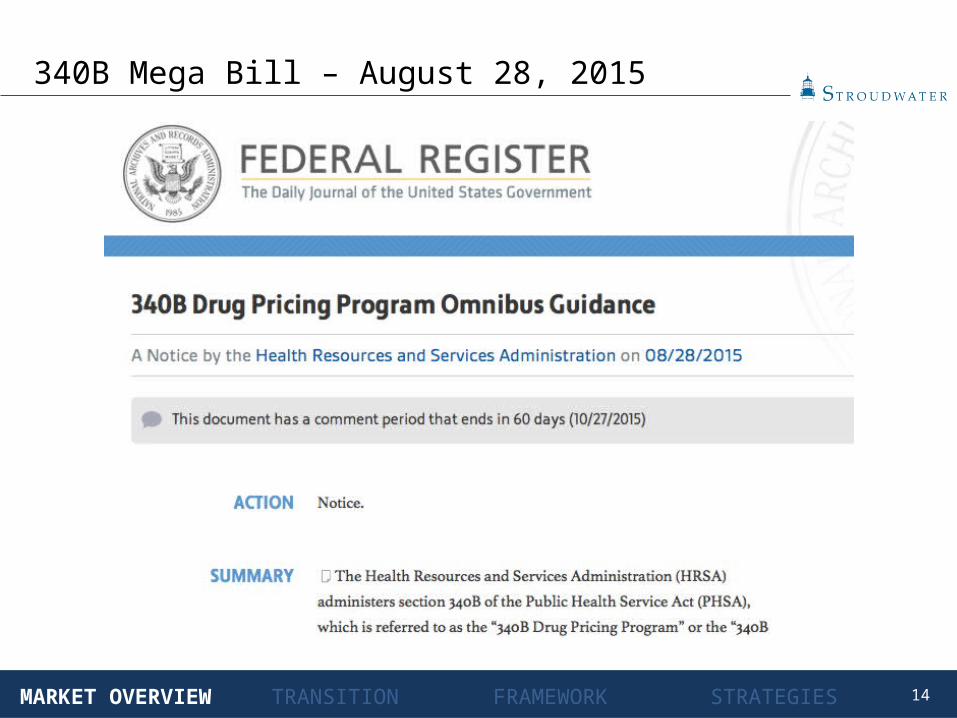
14
340B Mega Bill – August 28, 2015
MARKET OVERVIEW TRANSITION FRAMEWORK STRATEGIES
15
Service Area
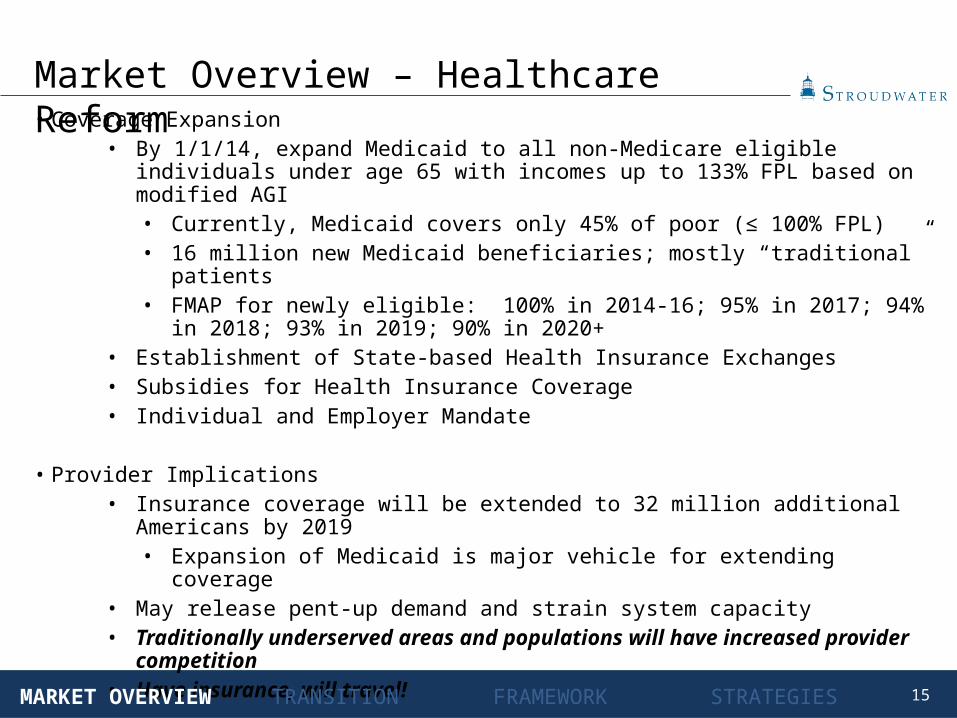
• Coverage Expansion• By 1/1/14, expand Medicaid to all non-Medicare eligible individuals under age 65 with
incomes up to 133% FPL based on modified AGI • Currently, Medicaid covers only 45% of poor (≤ 100% FPL)• 16 million new Medicaid beneficiaries; mostly “traditional” patients• FMAP for newly eligible: 100% in 2014-16; 95% in 2017; 94% in 2018; 93% in 2019; 90%
in 2020+ • Establishment of State-based Health Insurance Exchanges• Subsidies for Health Insurance Coverage• Individual and Employer Mandate
• Provider Implications• Insurance coverage will be extended to 32 million additional Americans by 2019
• Expansion of Medicaid is major vehicle for extending coverage• May release pent-up demand and strain system capacity• Traditionally underserved areas and populations will have increased provider competition • Have insurance, will travel!
Market Overview – Healthcare Reform
MARKET OVERVIEW TRANSITION FRAMEWORK STRATEGIES

16
Service Area
• Results (Source: Gallup August 10, 2015 Survey)
Market Overview – Healthcare Reform
MARKET OVERVIEW TRANSITION FRAMEWORK STRATEGIES
SC – 18.7% to 12.6%

17
Service Area
• Medicare and Medicaid Payment Policies• Medicare Update Factor Reductions
• Annual updates will be reduced to reflect projected gains in productivity • Medicare and Medicaid Disproportionate Share Hospital (DSH) Payment Reductions • Medicare Hospital Wage Index• Independent Payment Advisory Board (IPAB)
• Charged with figuring out how to reduce Medicare spending to targets with goal of $13B savings between 2014 and 2020
• Summary Impact
Market Overview – Healthcare Reform
MARKET OVERVIEW TRANSITION FRAMEWORK STRATEGIES

18
Service Area
Market Overview – Healthcare Reform
MARKET OVERVIEW TRANSITION FRAMEWORK STRATEGIES

19
Service Area
• Medicare and Medicaid Payment Policies (continued)
• Provider Implications• Payment changes will increase pressure on hospital margins and increase competition
for patient volume• “Do more with less and then less with less”• Medicaid pays less than other insurers and will be forced to cut payments further
Market Overview – Healthcare Reform
MARKET OVERVIEW TRANSITION FRAMEWORK STRATEGIES
20
Service Area
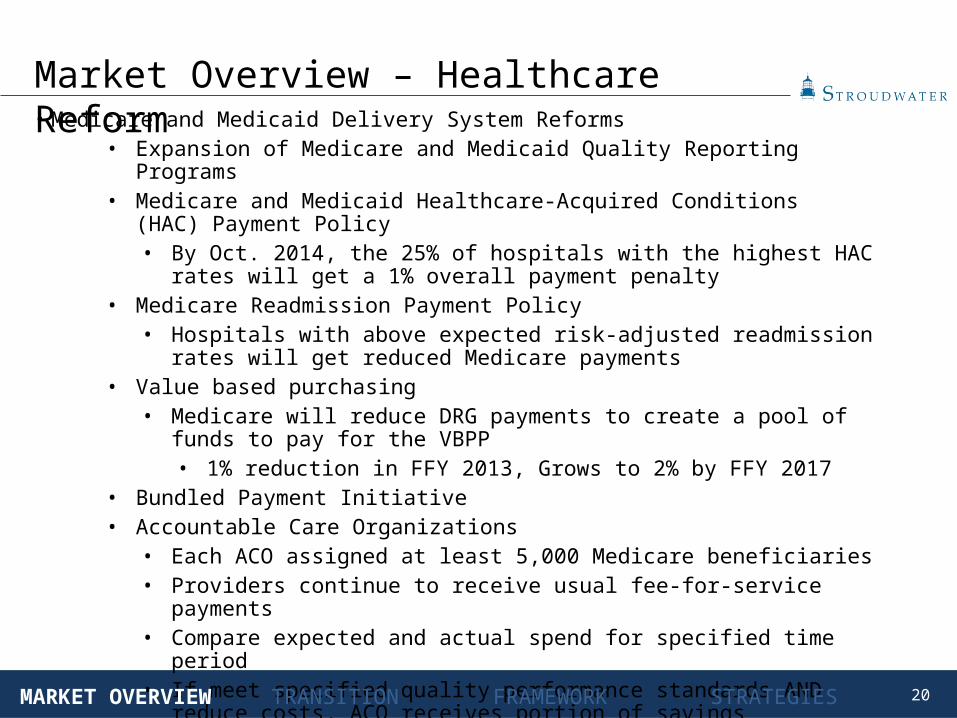
• Medicare and Medicaid Delivery System Reforms• Expansion of Medicare and Medicaid Quality Reporting Programs • Medicare and Medicaid Healthcare-Acquired Conditions (HAC) Payment Policy
• By Oct. 2014, the 25% of hospitals with the highest HAC rates will get a 1% overall payment penalty
• Medicare Readmission Payment Policy• Hospitals with above expected risk-adjusted readmission rates will get reduced
Medicare payments • Value based purchasing
• Medicare will reduce DRG payments to create a pool of funds to pay for the VBPP• 1% reduction in FFY 2013, Grows to 2% by FFY 2017
• Bundled Payment Initiative• Accountable Care Organizations
• Each ACO assigned at least 5,000 Medicare beneficiaries• Providers continue to receive usual fee-for-service payments• Compare expected and actual spend for specified time period• If meet specified quality performance standards AND reduce costs, ACO receives
portion of savings
Market Overview – Healthcare Reform
MARKET OVERVIEW TRANSITION FRAMEWORK STRATEGIES
21
Service Area
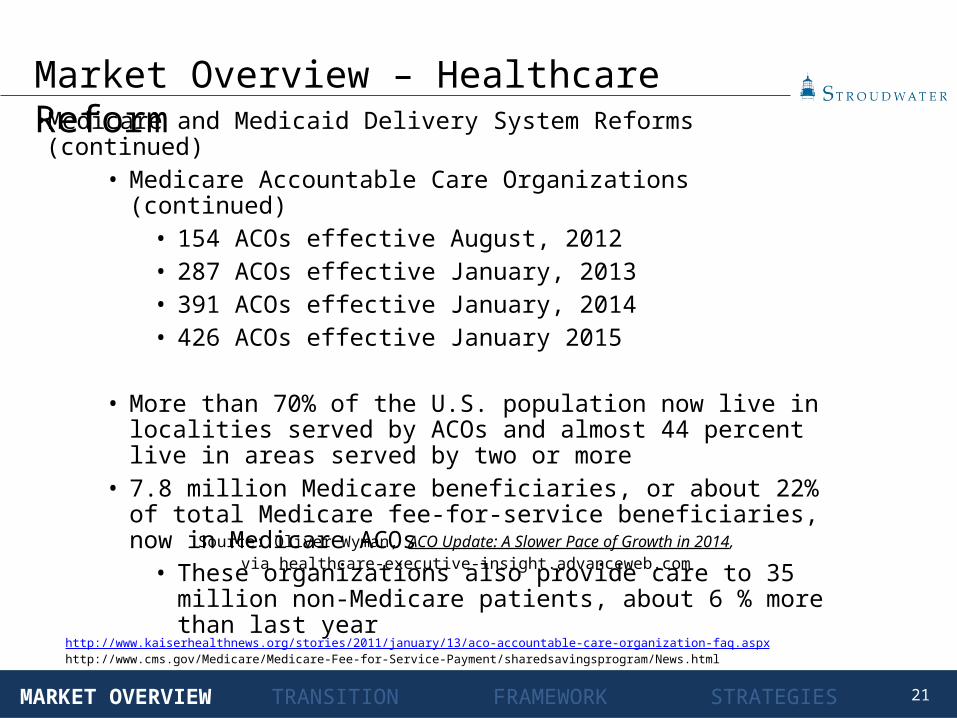
• Medicare and Medicaid Delivery System Reforms (continued)• Medicare Accountable Care Organizations (continued)
• 154 ACOs effective August, 2012• 287 ACOs effective January, 2013• 391 ACOs effective January, 2014• 426 ACOs effective January 2015
• More than 70% of the U.S. population now live in localities served by ACOs and almost 44 percent live in areas served by two or more
• 7.8 million Medicare beneficiaries, or about 22% of total Medicare fee-for-service beneficiaries, now in Medicare ACOs
• These organizations also provide care to 35 million non-Medicare patients, about 6 % more than last year
Market Overview – Healthcare Reform
http://www.kaiserhealthnews.org/stories/2011/january/13/aco-accountable-care-organization-faq.aspxhttp://www.cms.gov/Medicare/Medicare-Fee-for-Service-Payment/sharedsavingsprogram/News.html
MARKET OVERVIEW TRANSITION FRAMEWORK STRATEGIES
Source: Oliver Wyman, ACO Update: A Slower Pace of Growth in 2014, via healthcare-executive-insight.advanceweb.com

22
Where Are Medicare ACOs Forming?
MARKET OVERVIEW TRANSITION FRAMEWORK STRATEGIES
Source: CMS 1/20/15- Mapped from address of parent ACO
ACOs per State1-5
6-10
11-20
21-30
31-40
41+
Type Existing New 2015 Grand TotalMedicare Shared Savings Program
Advance Payment ACO Model
Pioneer ACO
Grand Total 480
19
35
426
89
89
391
19
35
337
23
ACOs in South Carolina
MARKET OVERVIEW TRANSITION FRAMEWORK STRATEGIES
Sources: OliverWyman.com; http://gojunto.com/aco-database/location/south-carolina/; https://myhfn.org/medicare/
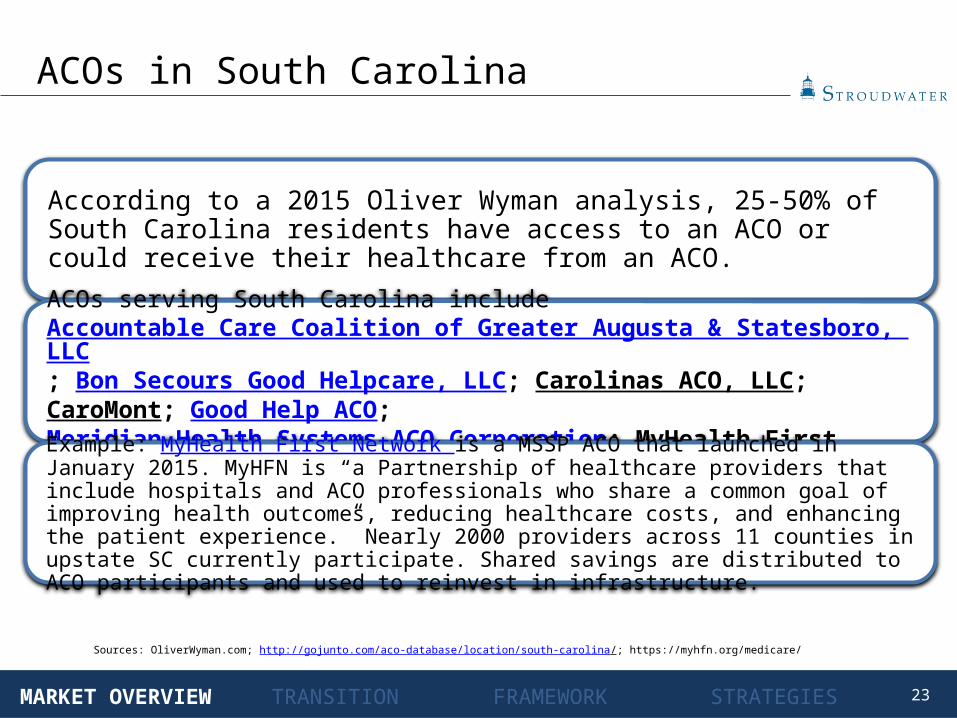
According to a 2015 Oliver Wyman analysis, 25-50% of South Carolina residents have access to an ACO or could receive their healthcare from an ACO.
ACOs serving South Carolina include Accountable Care Coalition of Greater Augusta & Statesboro, LLC; Bon Secours Good Helpcare, LLC; Carolinas ACO, LLC; CaroMont; Good Help ACO; Meridian Health Systems ACO Corporation; MyHealth First Network; and Carolinas HealthCare System.
Example: MyHealth First Network is a MSSP ACO that launched in January 2015. MyHFN is “a Partnership of healthcare providers that include hospitals and ACO professionals who share a common goal of improving health outcomes, reducing healthcare costs, and enhancing the patient experience.” Nearly 2000 providers across 11 counties in upstate SC currently participate. Shared savings are distributed to ACO participants and used to reinvest in infrastructure.

24MARKET OVERVIEW TRANSITION FRAMEWORK STRATEGIES
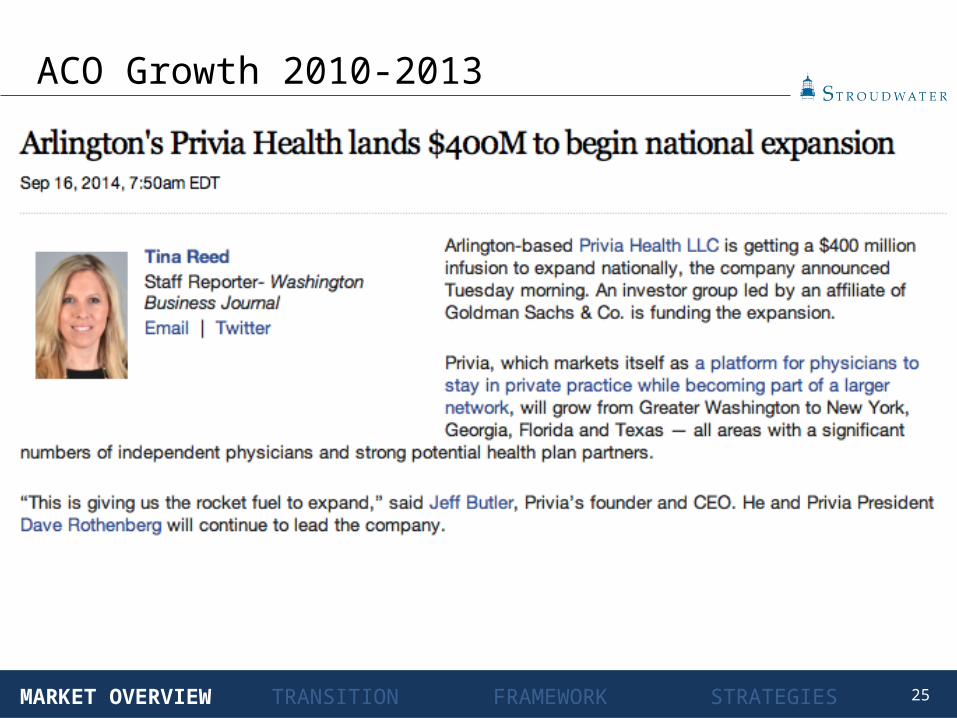
ACO Growth 2010-2013
25MARKET OVERVIEW TRANSITION FRAMEWORK STRATEGIES
ACO Growth 2010-2013
26MARKET OVERVIEW TRANSITION FRAMEWORK STRATEGIES
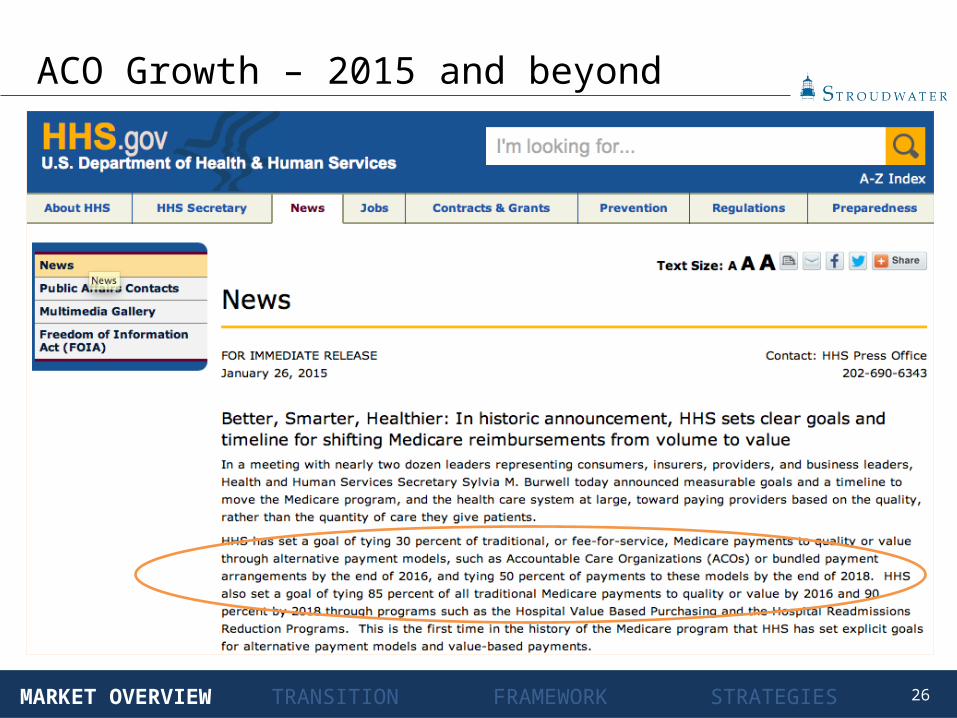
ACO Growth – 2015 and beyond
27
ACOs – New Regulations
MARKET OVERVIEW TRANSITION FRAMEWORK STRATEGIES
• ACO Investment Model (AIM) – October 15, 2014• Goal: help rural providers offset the cost of operating a MSSP ACO• Benefits:
• New MSSP candidates receive upfront fixed payment ($250K) and variable payment based on attributed beneficiary ($36/beneficiary), and monthly variable payment based on attributed beneficiary ($8)
• Upfront payments will be recovered out of shared savings• Pre-payments act as forgivable loan if applicant remains in MSSP for 3 years
and meets eligibility and performance requirements• Eligibility
• Accepted into MSSP• Less than 10K lives• No hospital unless CAH or rural hospital > 100 beds• Competitive grant with positive points for providers willing to take downside
risk
28
ACOs – New Regulations
MARKET OVERVIEW TRANSITION FRAMEWORK STRATEGIES
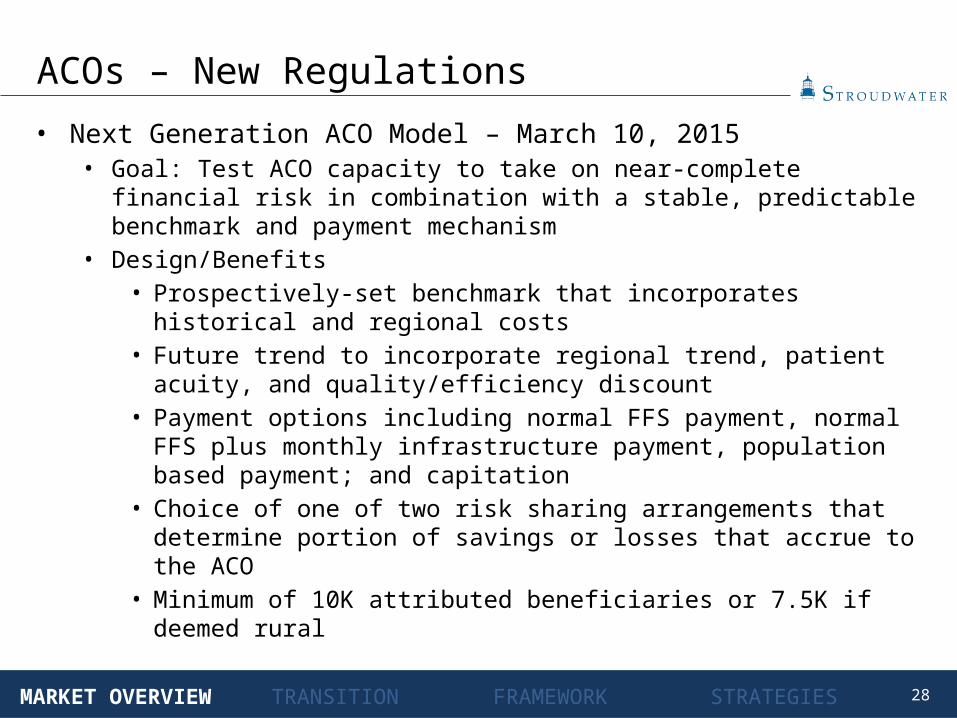
• Next Generation ACO Model – March 10, 2015• Goal: Test ACO capacity to take on near-complete financial risk in combination with
a stable, predictable benchmark and payment mechanism• Design/Benefits
• Prospectively-set benchmark that incorporates historical and regional costs• Future trend to incorporate regional trend, patient acuity, and
quality/efficiency discount• Payment options including normal FFS payment, normal FFS plus monthly
infrastructure payment, population based payment; and capitation• Choice of one of two risk sharing arrangements that determine portion of
savings or losses that accrue to the ACO• Minimum of 10K attributed beneficiaries or 7.5K if deemed rural
29
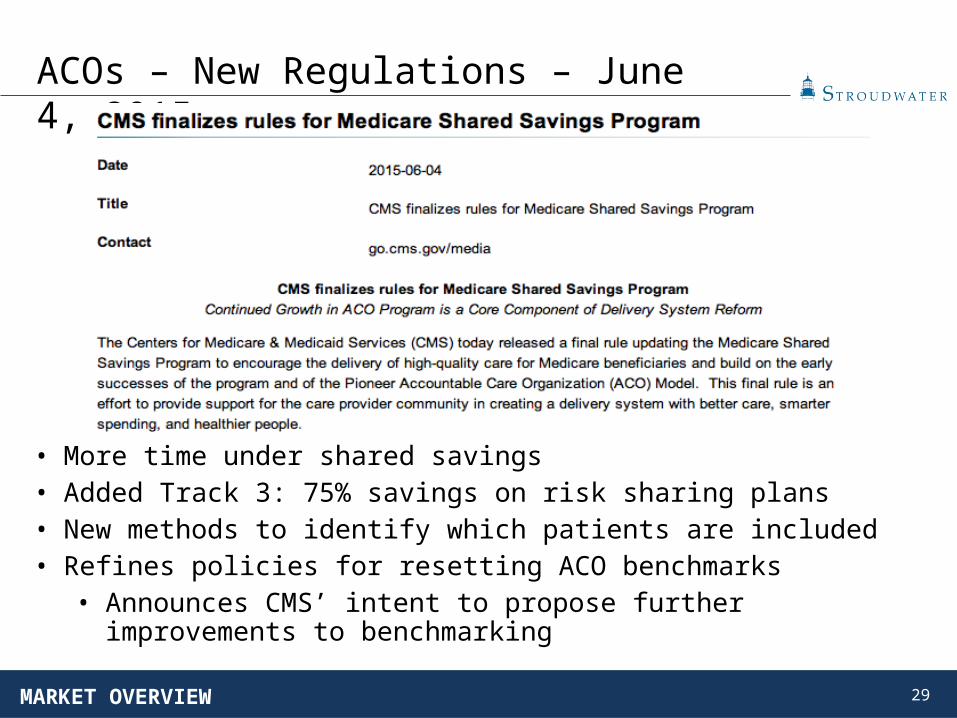
ACOs – New Regulations – June 4, 2015
• More time under shared savings• Added Track 3: 75% savings on risk sharing plans• New methods to identify which patients are included• Refines policies for resetting ACO benchmarks
• Announces CMS’ intent to propose further improvements to benchmarking
MARKET OVERVIEW

30
Medicare ACO 2014 Results
MARKET OVERVIEW
• In August 2015, CMS issued 2014 quality and financial performance results showing that Medicare Accountable Care Organizations (ACOs) continue to improve the quality of care for Medicare beneficiaries, while generating financial savings, suggesting that ACOs are delivering higher quality care to more and more Medicare beneficiaries each year.
• According to the results During the third performance year, Pioneer ACOs generated total model savings of $120
million, an increase of 24% from Performance Year 2 ($96 million). Total model savings per ACO increased from $2.7 million per ACO in Performance Year 1 to
$4.2 million per ACO in Performance Year 2 to $6.0 million per ACO in Performance Year 3. The mean quality score among Pioneer ACOs increased to 87.2 percent in Performance
Year 3 from 85.2 percent in Performance Year 2, which was itself an improvement from 71.8 percent in Performance Year 1.
The organizations showed improvements in 28 of 33 quality measures and experienced average improvements of 3.6% across all quality measures compared to Performance Year 2.
Ninety-two Shared Savings Program ACOs held spending $806 million below their targets and earned performance payments of more than $341 million as their share of program savings.
Shared Savings Program ACOs that reported in both 2013 and 2014 improved on 27 of 33 quality measures.
Source: CMS.gov 2015 Fact Sheets
TRANSITION FRAMEWORK STRATEGIES
31
Fee-For-Service Financial ModelAssumptions
• Utilization• Inpatient and Outpatient
• Impact of ACA• Impact of Blue Cross steerage initiatives
• Revenue• Third party price increases• Cost based Medicare revenue• DSH payments (Zeroed out in 2014)• Bad debt % of patient service revenue (75% reduction in 2014)
• Impact of ACA• Meaningful use incentive payments• Other operating revenue• Non-operating gains and
• Expenses• Salaries, wages and benefits• Productivity• Supplies and other
MARKET OVERVIEW TRANSITION FRAMEWORK STRATEGIES

32
Age Normalized Use Rate Comparisons – Discharges/1,000
MARKET OVERVIEW TRANSITION FRAMEWORK STRATEGIES
Hilton Head Islan..Beaufort SCWest Columbia ..Mount Pleasant ..Greer SCColumbia SCRock Hill SCSeneca SCUS TotalCharleston SCGreenville SCConway SCNewberry SCAiken SCSC TotalMyrtle Beach SCLoris SCLancaster SCRidgeland SCEasley SCEdgefield SCGreenwood SCManning SCBamberg SCAbbeville SCCamden SCWinnsboro SCPickens SCOrangeburg SCVarnville SCAnderson SCFairfax SCClinton SCSpartanburg SCSumter SCWoodruff SCGeorgetown SCBishopville SCHartsville SCCheraw SCBarnwell SCChester SCWalterboro SCKingstree SCFlorence SCGaffney SCDillon SCMarion SCUnion SCBennettsville SCMullins SC
0
20
40
60
80
100
120
140
160
180
Normalized Discharges/1,000
121.1128.7
118
96
70
42
93
61
Current use rates based on Truven Healthcare Analytics population and discharge estimates by Dartmouth Hospital Service Area (HSA).2021 use rates based on Milliman Governance Institute Presentation (2/2012).

33
Fee-For-Service Financial Model – Results
When operating income becomes negative in 2016, cash reserves start to decline
$(18)
$(16)
$(14)
$(12)
$(10)
$(8)
$(6)
$(4)
$(2)
$-
$2
$4
2012 2013 2014 2015 2016 2017 2018 2019 2020 2021 2022
Mill
ions
Operating income (Consolidated)
• Operational improvement and shared service economies of scale are insufficient to combat
declining utilization
• Can’t cut your way to sustainability
MARKET OVERVIEW TRANSITION FRAMEWORK STRATEGIES

34
Service Area
• Medicare and Medicaid Delivery System Reforms (continued)
• Provider Implications• Hospitals are taking the lead in forming Accountable Care Organizations with
physician groups that will share in Medicare savings• Value based purchasing program will shift payments from low performing
hospitals to high performing hospitals• Acute care hospitals with higher than expected risk-adjusted readmission
rates and HAC will receive reduced Medicare payments for every discharge• Physician payments will be modified based on performance against quality
and cost indicators• There are significant opportunities for demonstration project funding
Market Overview – Healthcare Reform
MARKET OVERVIEW TRANSITION FRAMEWORK STRATEGIES

35
Sources: Kaiser Commission on Medicaid and the Uninsured (Medicaid Expansion)The North Carolina Rural Health Research Program (Closures)
Closed Rural Hospitals Since the Beginning of 2010
MARKET OVERVIEW TRANSITION FRAMEWORK STRATEGIES
Closure Year CAH PPS MDH SCH
Re-based SCH DSH
Grand Total
2010 2 1 32011 2 2 1 52012 2 5 2 92013 6 5 3 1 152014 7 2 5 1 1 162015 3 4 1 1 9Grand Total 20 20 11 3 2 1 57
Medicare Payment Type

36
How Do Real and Projected Spending Compare?
Chart source: The New York TimesData source: CBO
MARKET OVERVIEW TRANSITION FRAMEWORK STRATEGIES

37
• Factors that will have a significant impact on rural hospitals over the next 5-10 years • Difficulty with recruitment of providers and aging of current medical staff
• Struggle to pay market rates• Increasing competition from other hospitals and physician providers for limited
revenue opportunities• Small hospital governance members without sophisticated understanding of
small hospital strategies, finances, and operations• Consumer perception that “bigger is better”• Severe limitations on access to capital for necessary investments in infrastructure
and provider recruitment• Facilities historically built around IP model of care
• Increased burden of remaining current on onslaught of regulatory changes• Regulatory Friction / Overload
• Payment systems transitioning from volume based to value based• Increased emphasis of quality as payment and market differentiator• Reduced payments that are “Real this time”
• 3rd party steerage (surgery, lab, and Imaging), RAC audits
Challenges Affecting Rural Hospitals
MARKET OVERVIEW TRANSITION FRAMEWORK STRATEGIES
38
• Subset of most recent challenges
• Payment systems transitioning from volume based to value based• Increased emphasis as quality as payment and market differentiator• Reduced payments that are “Real this time”
•New environmental challenges are the TRIPLE AIM!!!•Market Competition on economic driver of healthcare: PATIENT VALUE
We Have Moved into a New Environment!
MARKET OVERVIEW TRANSITION FRAMEWORK STRATEGIES
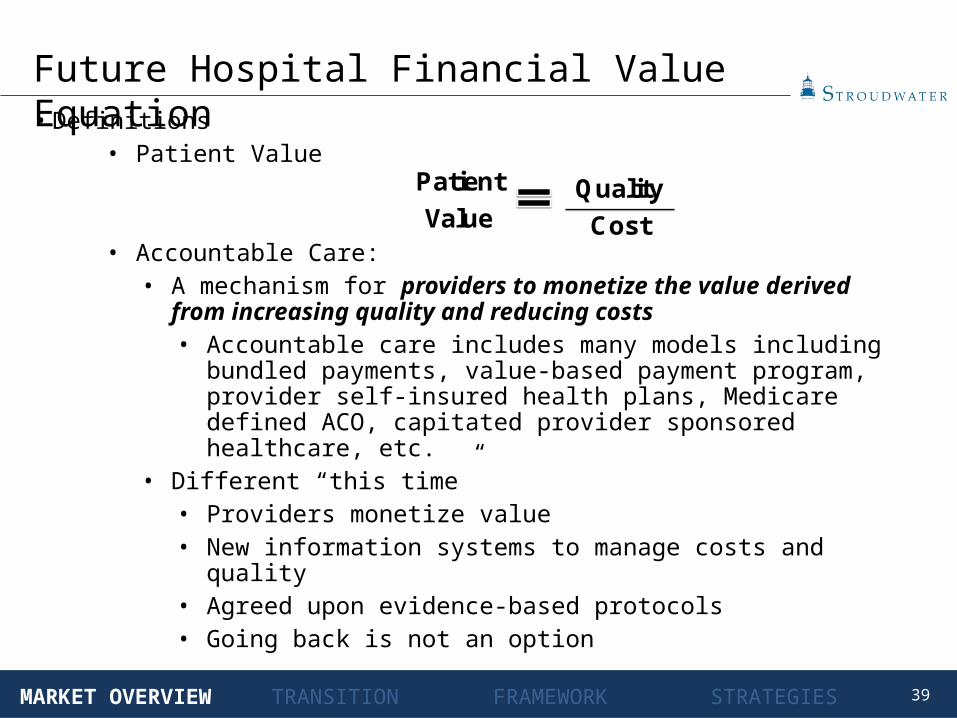
39
• Definitions• Patient Value
• Accountable Care:• A mechanism for providers to monetize the value derived from increasing
quality and reducing costs• Accountable care includes many models including bundled payments,
value-based payment program, provider self-insured health plans, Medicare defined ACO, capitated provider sponsored healthcare, etc.
• Different “this time”• Providers monetize value• New information systems to manage costs and quality• Agreed upon evidence-based protocols • Going back is not an option
QualityCost
PatientValue
Future Hospital Financial Value Equation
MARKET OVERVIEW TRANSITION FRAMEWORK STRATEGIES
40
• ACO Relationship to Small and Rural Hospitals
• Revenue stream of future tied to Primary Care Physicians (PCP) and their patients
• Small and rural hospitals bring value / negotiating power to affiliation relationships as generally PCP based• Smaller community hospitals and rural hospitals have value through
alignment with revenue drivers (PCPs) rather than cost drivers but must position themselves for new market:• Alignment with PCPs in local service area• Develop a position of strength by becoming highly efficient• Demonstrate high quality through monitoring and actively pursuing
quality goals
Future Hospital Financial Value Equation
MARKET OVERVIEW TRANSITION FRAMEWORK STRATEGIES

41
• Economics
• As payment systems transition away from volume based payment, the current economic model of increasing volume to reduce unit costs and generate profit is no longer relevant • New economic models based on patient value must be developed by
hospitals but not before the payment systems have converted• Economic Model: FFS Rev and Exp VS. Budget Based Payment Rev and Exp
Loss Zone
Service Volumes
Dollars
Cost
Revenue
Profit Zone
Future Hospital Financial Value Equation
MARKET OVERVIEW TRANSITION FRAMEWORK STRATEGIES

42
• Value in Rural Hospitals
• Lower Per Beneficiary Costs
• Revenue centers of the future
• PCP based delivery system
• CAH cost-based reimbursement
• Incremental volume drives down unit costs
• Once commitment to community Emergency Room, system incentives to drive low acuity volume to CAH
• MedPAC Confusion – Limited Incentives to manage costs???
MARKET OVERVIEW TRANSITION FRAMEWORK STRATEGIES
Future Hospital Financial Value Equation
43
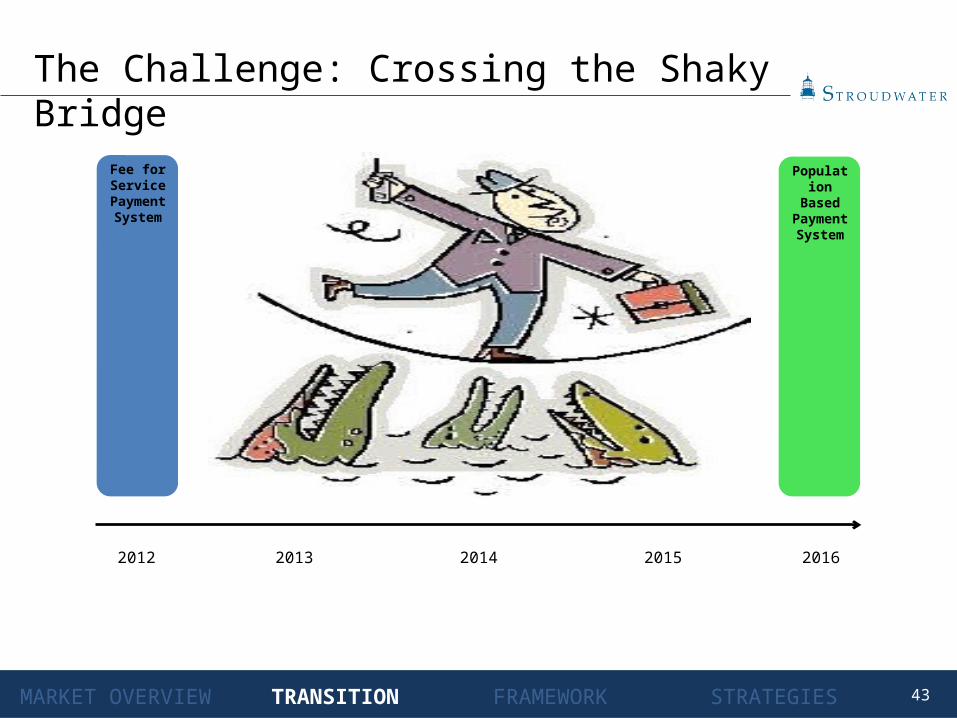
The Challenge: Crossing the Shaky Bridge
2012 201520142013 2016
Fee for Service
Payment System
Population Based
Payment System
MARKET OVERVIEW TRANSITION FRAMEWORK STRATEGIES

44
• Shaky Bridge• Concern of task force members is that transitioning of the delivery system
functions must coincide with transitioning payment system of rural hospitals, without adequate reserves, will be a financial risk• “Stepping onto the shaky bridge” analogy
• Necessary for hospitals to survive the gap between pay-for-volume and pay-for-performance• Delivery system has to remain aligned with current payment system while
seeking to implement programs / processes that will allow flexibility to new payment system• Delivery system must be ready to jump when new payment systems roll
out
The Challenge
MARKET OVERVIEW TRANSITION FRAMEWORK STRATEGIES
45
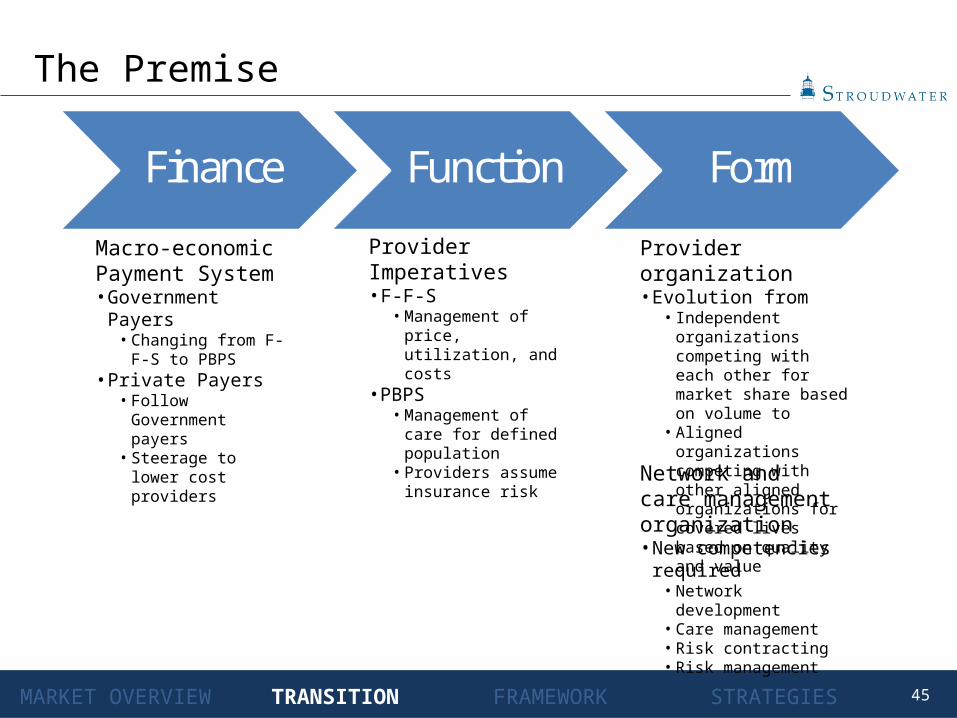
Finance Function Form
Macro-economic Payment System• Government Payers
• Changing from F-F-S to PBPS
• Private Payers• Follow Government
payers• Steerage to lower cost
providers
Provider Imperatives• F-F-S
• Management of price, utilization, and costs
• PBPS• Management of care
for defined population • Providers assume
insurance risk
Provider organization• Evolution from
• Independent organizations competing with each other for market share based on volume to
• Aligned organizations competing with other aligned organizations for covered lives based on quality and value
The Premise
Network and care management organization• New competencies
required• Network development• Care management• Risk contracting• Risk management
MARKET OVERVIEW TRANSITION FRAMEWORK STRATEGIES

46
Implementation Framework – What Is It?
MARKET OVERVIEW TRANSITION FRAMEWORK STRATEGIES

47
Delivery System Strategy
• Delivery system must respond to at a similar pace to changing payment models in order
to maintain financial viability
• Getting too far ahead or lagging behind will be hazardous to their health
MARKET OVERVIEW TRANSITION FRAMEWORK STRATEGIES
48
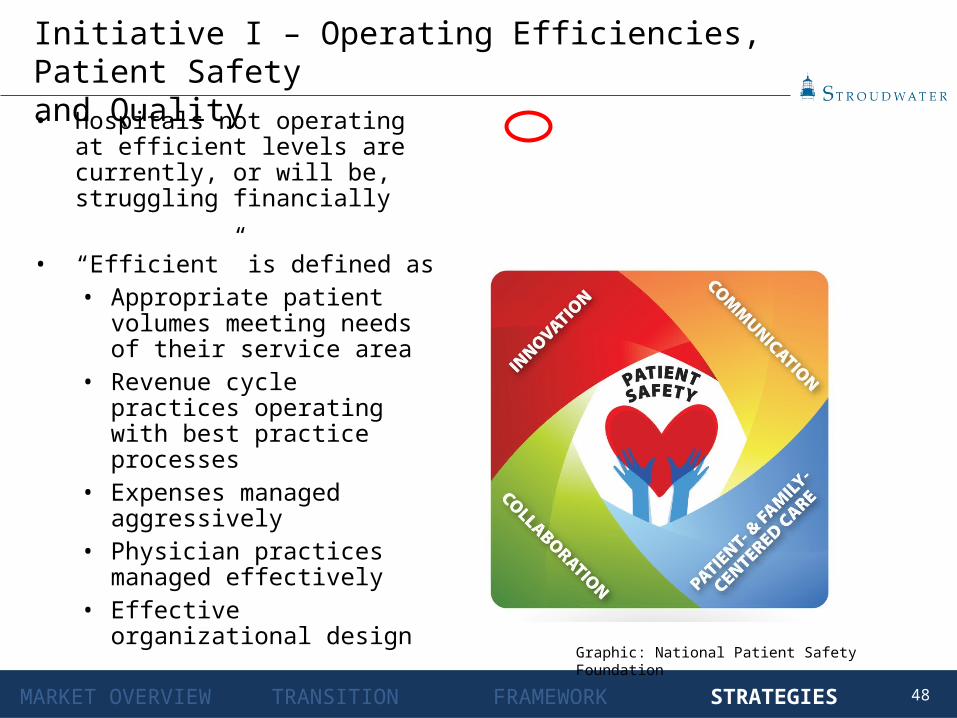
• Hospitals not operating at efficient levels are currently, or will be, struggling financially
• “Efficient” is defined as• Appropriate patient volumes
meeting needs of their service area
• Revenue cycle practices operating with best practice processes
• Expenses managed aggressively• Physician practices managed
effectively• Effective organizational design
Initiative I – Operating Efficiencies, Patient Safetyand Quality
MARKET OVERVIEW TRANSITION FRAMEWORK STRATEGIES
Graphic: National Patient Safety Foundation
49
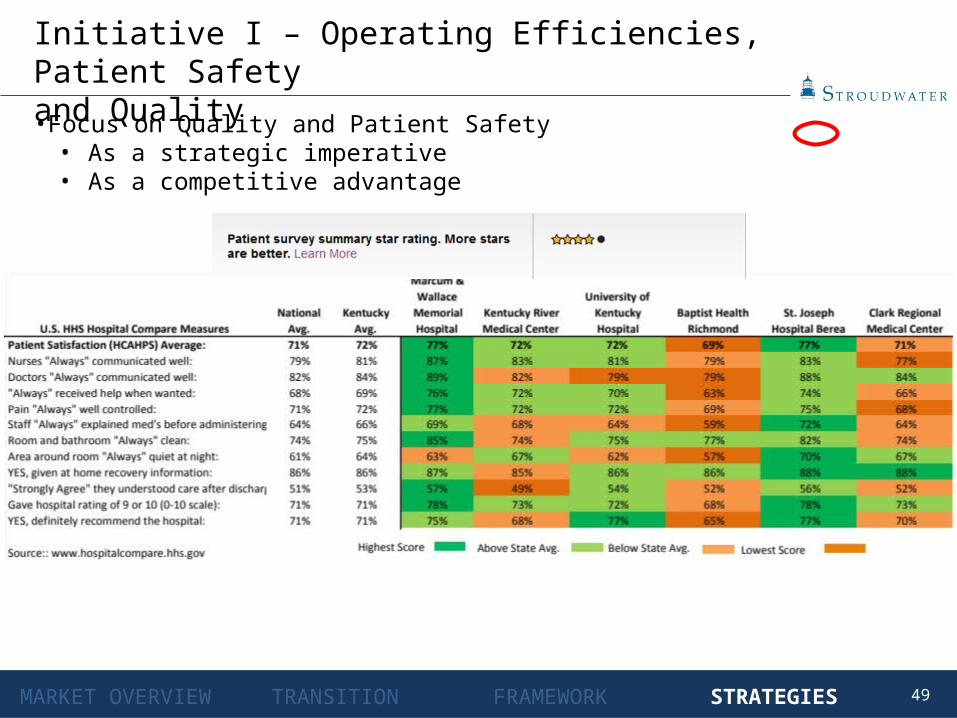
•Focus on Quality and Patient Safety• As a strategic imperative• As a competitive advantage
MARKET OVERVIEW TRANSITION FRAMEWORK STRATEGIES
Initiative I – Operating Efficiencies, Patient Safety and Quality

50
• Understand that revenue streams of the future will be tied to primary care physicians, which often comprise a majority of the rural and small hospital healthcare delivery network
• Thus small and rural hospitals, through alignment with PCPs, will have extraordinary value relative to costs
•Physician Relationships• Hospital align with employed and independent providers to
enable interdependence with medical staff and support clinical integration efforts• Contract (e.g., employ, management agreements)• Functional (share medical records, joint development of
evidence based protocols)• Governance (Board, executive leadership, planning
committees, etc.)• Potential Model for Rural:
• New PHO
Initiative II – Primary Care Alignment
MARKET OVERVIEW TRANSITION FRAMEWORK STRATEGIES

51
Payment System Strategy
• Providers have opportunities to “shorten” and “stabilize” the shaky bridge by:
• Working with payers to create transitional payment models
• Initiating development with payers of full-capitation payment models
MARKET OVERVIEW TRANSITION STRATEGIESFRAMEWORK

52
• Develop system integration strategy
• Evaluate wide range of affiliation options ranging from network relationships, to interdependence models, to full asset ownership models• Interdependence models through alignment on contractual,
functional, and governance levels, may be option for rural hospitals that want to remain “independent”
• Explore / Seek to establish interdependent relationships among small and rural hospitals understanding their unique value relative to future revenue streams
• Identify the number of providers needed in the service area based on population and the impact of an integrated regional healthcare system
• Conduct focused analysis of procedures leaving the market
• Understand real value to hospitals• Under F-F-S• Under PBPS (Cost of out of network claims)
Initiative III – Rationalize Service Network
MARKET OVERVIEW TRANSITION FRAMEWORK STRATEGIES
53
Payment System Strategy – Initiative I
MARKET OVERVIEW TRANSITION FRAMEWORK STRATEGIES
• Develop self-funded employer health plan• Hospital is already 100% at risk for medical claims thus no risk for improving
health of employee “population”• Change benefits to encourage greater “consumerism”
• Differential premium for elective “risky” behavior• “Enroll” employee population in health programs – health coaches, chronic
disease programs, etc.
• FFS Quality and Utilization Incentives• Maximize FFS incentives for improving quality or reducing inappropriate
utilization (e.g., inappropriate ER visits, re-admissions, etc.)

54
Payment System Strategy – Initiatives II and III
MARKET OVERVIEW TRANSITION FRAMEWORK STRATEGIES
Initiative II: Implementation planning for transitional payment models• Transitional payment models include:
• FFS against capitation benchmark w/ shared savings
• Shared savings model Medicare ACOs
• Shared savings models with other governmental and commercial insurers
• Partial capitation and sub-capitation options with shared savings
• Prioritize insurance market opportunities
• Take the initiative with insurers to gauge interest and opportunities for collaborating on transitional payment models
• Explore direct contracting opportunities with self-funded employers
Initiative III: Develop strategy for full risk capitated plans
55
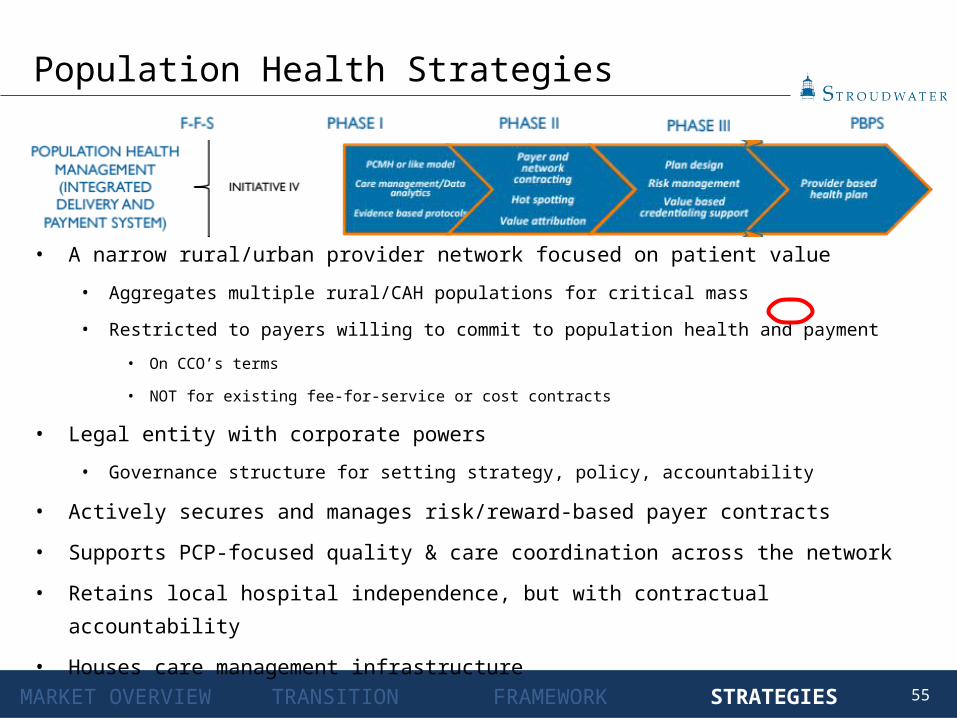
Population Health Strategies
MARKET OVERVIEW TRANSITION FRAMEWORK STRATEGIES
• A narrow rural/urban provider network focused on patient value
• Aggregates multiple rural/CAH populations for critical mass
• Restricted to payers willing to commit to population health and payment
• On CCO’s terms
• NOT for existing fee-for-service or cost contracts
• Legal entity with corporate powers
• Governance structure for setting strategy, policy, accountability
• Actively secures and manages risk/reward-based payer contracts
• Supports PCP-focused quality & care coordination across the network
• Retains local hospital independence, but with contractual accountability
• Houses care management infrastructure

56MARKET OVERVIEW TRANSITION FRAMEWORK STRATEGIES
Phase I: Develop Population Health building blocks• Goal: Infrastructure to manage self insured lives and maximize FFS
Utilization and quality incentives• Initiatives:
• PCMH or like structure• Care management
• Discharge planning across the continuum • Transportation, PCP, meds, home support, etc.
• Transitions of care (checking in on treatment plan)• Medication reconciliation • Post discharge follow-up calls (instructions, teach back,
medication check-in)• Identifying community resources• Maintain patient contact for 30 days
• Develop claims analysis capabilities/infrastructure• Develop evidenced based protocols
Population Health Strategies – Phase I
57
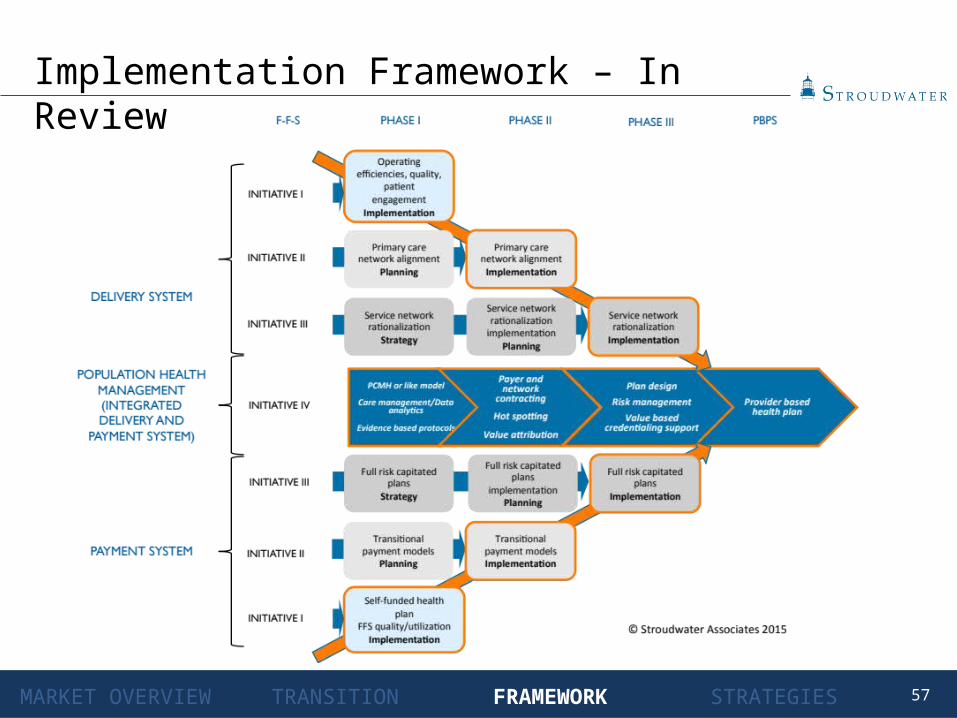
Implementation Framework – In Review
MARKET OVERVIEW TRANSITION FRAMEWORK STRATEGIES

58
• For decades, rural hospitals have dealt with many challenges including low volumes, declining populations, difficulties with provider recruitment, limited capital constraining necessary investments, etc. • The current environment driven by healthcare reform and market realities now offers
a new set of challenges. Many rural healthcare providers have not yet considered either the magnitude of the changes or the required strategies to appropriately address the changes
• Core set of new challenges represents the Triple Aim being played on in the market• Locally delivered healthcare (including rural and small community hospitals) has high
value in the emerging delivery system• “Shaky Bridge” crossing will required planned, proactive approach
• Finance will lead function and form• Maintain alignment between delivery system models and payment systems building
flexibility into the delivery system model for the changing payment system
Conclusions/Recommendations
CONCLUSIONS / RECOMMENDATIONS

59
• Important strategies for providers to consider include:• Increase leadership awareness of new environment realities• Improve operational efficiency of provider organizations• Adapt effective quality measurement and improvement systems as a strategic
priority• Align/partner with medical staff members contractually, functionally, and through
governance where appropriate• Seek interdependent relationships with developing regional systems
Conclusions/Recommendations (continued)
CONCLUSIONS / RECOMMENDATIONS

Eric K. Shell, CPA, [email protected]
50 Sewall Street, Suite 102Portland, Maine 04102
(207) 221-8252
www.stroudwater.com
Related Documents