ERIC Seminars 2013 London 25 th February Leeds 5 th March Birmingham 12 th March

Welcome message from author
This document is posted to help you gain knowledge. Please leave a comment to let me know what you think about it! Share it to your friends and learn new things together.
Transcript

ERIC Seminars 2013London 25th February
Leeds 5th MarchBirmingham 12th March

ERIC - BECAUSE IT’S THERE?
Chris Norman, Head of Estates Operations and Development
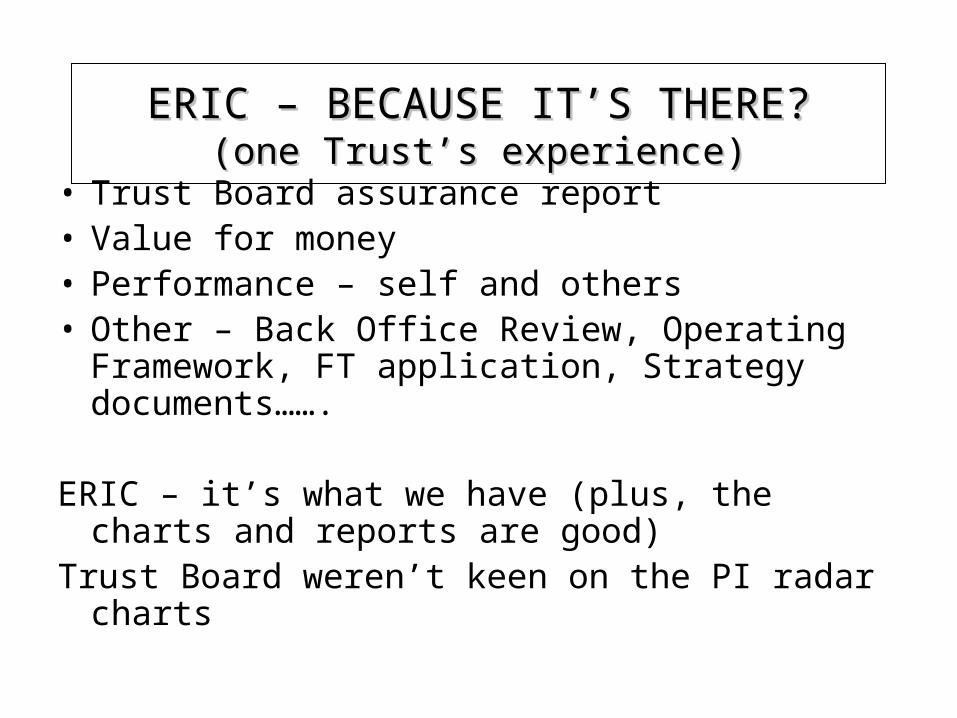
ERIC – BECAUSE IT’S THERE?ERIC – BECAUSE IT’S THERE?(one Trust’s experience)(one Trust’s experience)
• Trust Board assurance report• Value for money• Performance – self and others• Other – Back Office Review, Operating
Framework, FT application, Strategy documents…….
ERIC – it’s what we have (plus, the charts and reports are good)
Trust Board weren’t keen on the PI radar charts
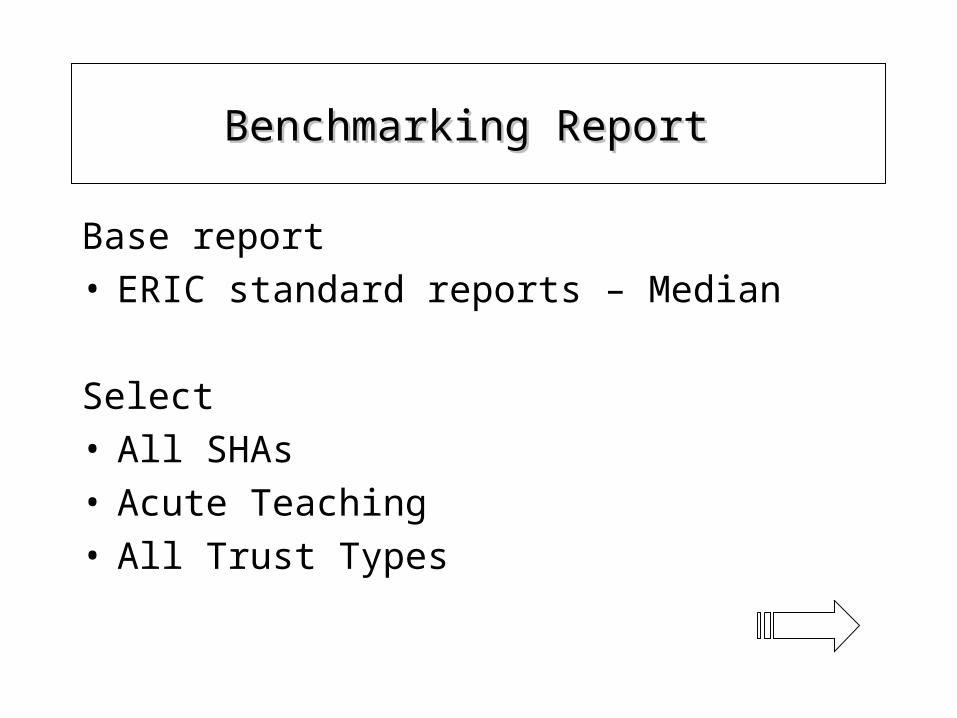
Benchmarking ReportBenchmarking Report
Base report• ERIC standard reports – Median
Select• All SHAs• Acute Teaching• All Trust Types
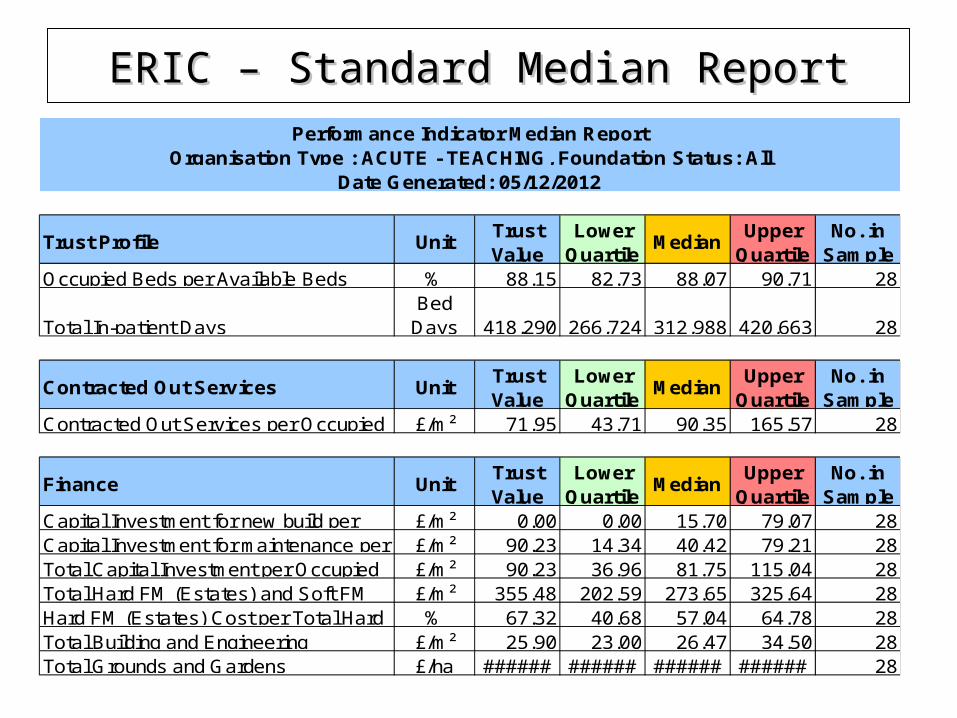
ERIC – Standard Median ReportERIC – Standard Median Report
UnitTrust Value
Lower Quartile
MedianUpper
QuartileNo. in
Sample% 88.15 82.73 88.07 90.71 28
Bed Days 418,290 266,724 312,988 420,663 28
UnitTrust Value
Lower Quartile
MedianUpper
QuartileNo. in
Sample£/m² 71.95 43.71 90.35 165.57 28
UnitTrust Value
Lower Quartile
MedianUpper
QuartileNo. in
Sample£/m² 0.00 0.00 15.70 79.07 28£/m² 90.23 14.34 40.42 79.21 28£/m² 90.23 36.96 81.75 115.04 28£/m² 355.48 202.59 273.65 325.64 28% 67.32 40.68 57.04 64.78 28
£/m² 25.90 23.00 26.47 34.50 28£/ha ###### ###### ###### ###### 28Total Grounds and Gardens
Total Capital Investment per Occupied Total Hard FM (Estates) and Soft FM Hard FM (Estates) Cost per Total Hard Total Building and Engineering
Contracted Out Services per Occupied
Finance
Capital Investment for new build per Capital Investment for maintenance per
Trust Profile
Occupied Beds per Available Beds
Total In-patient Days
Contracted Out Services
Performance Indicator Median ReportOrganisation Type : ACUTE - TEACHING, Foundation Status: All
Date Generated: 05/12/2012
HEY Benchmarking Report 1HEY Benchmarking Report 1
• Run Median report for ‘Large Acute’• Cut and paste ‘median’ column into previous ‘Acute
Teaching’ report• Delete selected rows e.g. healthcare travel scheme• Insert additional rows e.g. food waste, NSC % (requires
bit of work using SHA data report ‘data dump report’)• Insert HEY previous year column• Insert 3 columns to show HEY % +/- performance
against– Acute Teaching (current peer group)– Large Teaching (previous peer group)– HEY previous year
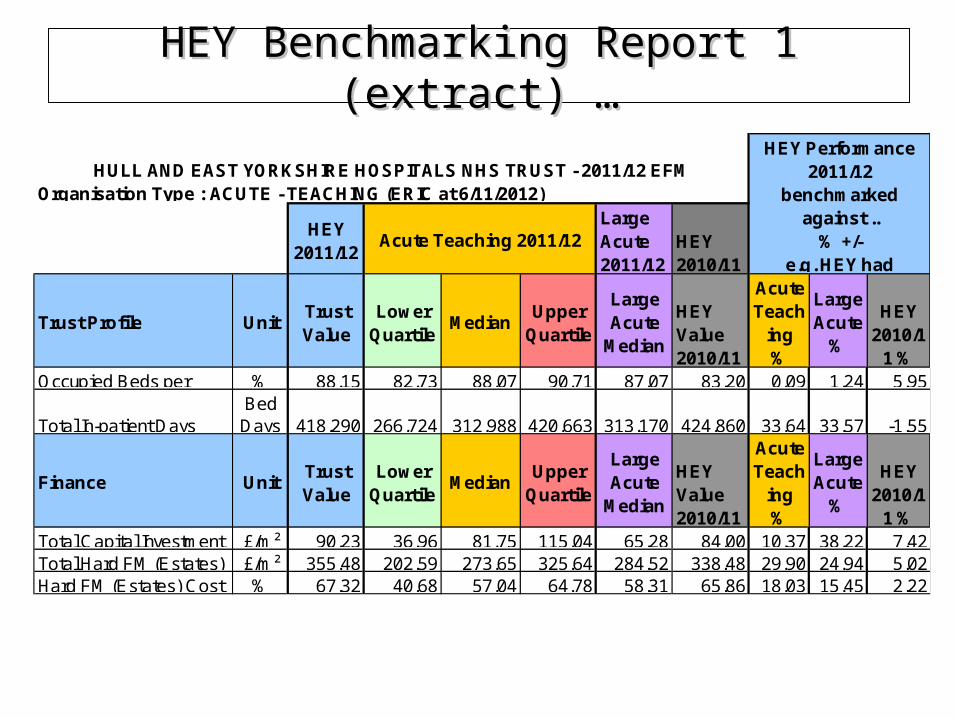
HEY Benchmarking Report 1 (extract) …HEY Benchmarking Report 1 (extract) …
HEY 2011/12
Large Acute 2011/12
HEY 2010/11
UnitTrust Value
Lower Quartile
MedianUpper
Quartile
Large Acute
Median
HEY Value 2010/11
Acute Teach
ing %
Large Acute
%
HEY 2010/1
1 %% 88.15 82.73 88.07 90.71 87.07 83.20 0.09 1.24 5.95
Bed Days 418,290 266,724 312,988 420,663 313,170 424,860 33.64 33.57 -1.55
UnitTrust Value
Lower Quartile
MedianUpper
Quartile
Large Acute
Median
HEY Value 2010/11
Acute Teach
ing %
Large Acute
%
HEY 2010/1
1 %£/m² 90.23 36.96 81.75 115.04 65.28 84.00 10.37 38.22 7.42£/m² 355.48 202.59 273.65 325.64 284.52 338.48 29.90 24.94 5.02% 67.32 40.68 57.04 64.78 58.31 65.86 18.03 15.45 2.22Hard FM (Estates) Cost
Finance
Trust Profile
Occupied Beds per
Total In-patient Days
HULL AND EAST YORKSHIRE HOSPITALS NHS TRUST - 2011/12 EFM HEY Performance
2011/12 benchmarked
against ..% +/-
e.g. HEY had Acute Teaching 2011/12
Total Capital Investment Total Hard FM (Estates)
Organisation Type : ACUTE - TEACHING (ERIC at 6/11/2012)
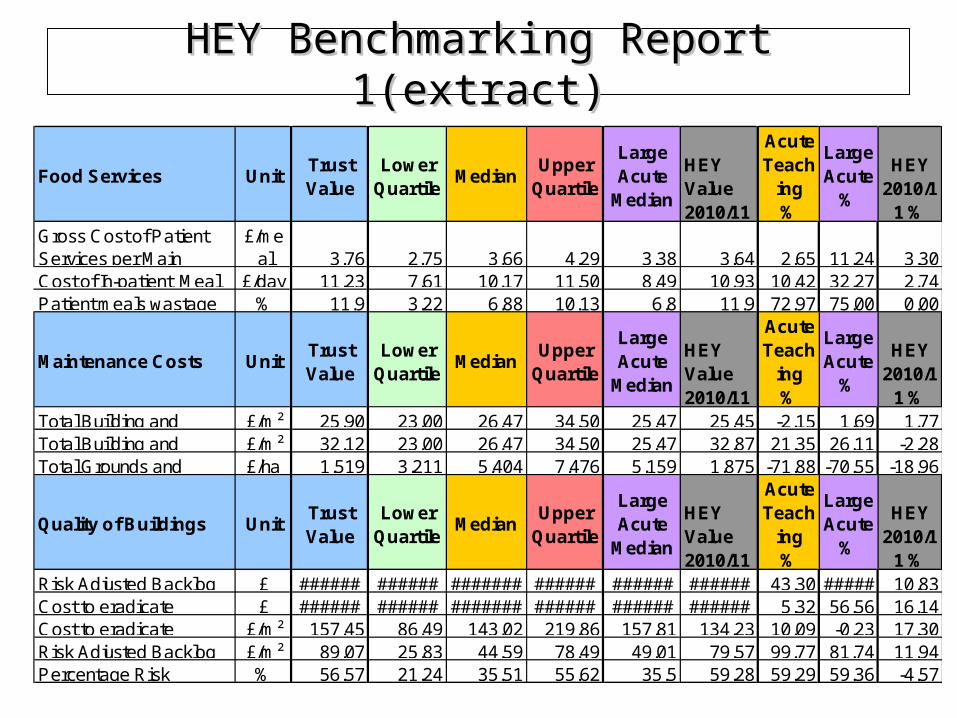
HEY Benchmarking Report 1(extract)HEY Benchmarking Report 1(extract)
UnitTrust Value
Lower Quartile
MedianUpper
Quartile
Large Acute
Median
HEY Value 2010/11
Acute Teach
ing %
Large Acute
%
HEY 2010/1
1 %£/me
al 3.76 2.75 3.66 4.29 3.38 3.64 2.65 11.24 3.30£/day 11.23 7.61 10.17 11.50 8.49 10.93 10.42 32.27 2.74
% 11.9 3.22 6.88 10.13 6.8 11.9 72.97 75.00 0.00
UnitTrust Value
Lower Quartile
MedianUpper
Quartile
Large Acute
Median
HEY Value 2010/11
Acute Teach
ing %
Large Acute
%
HEY 2010/1
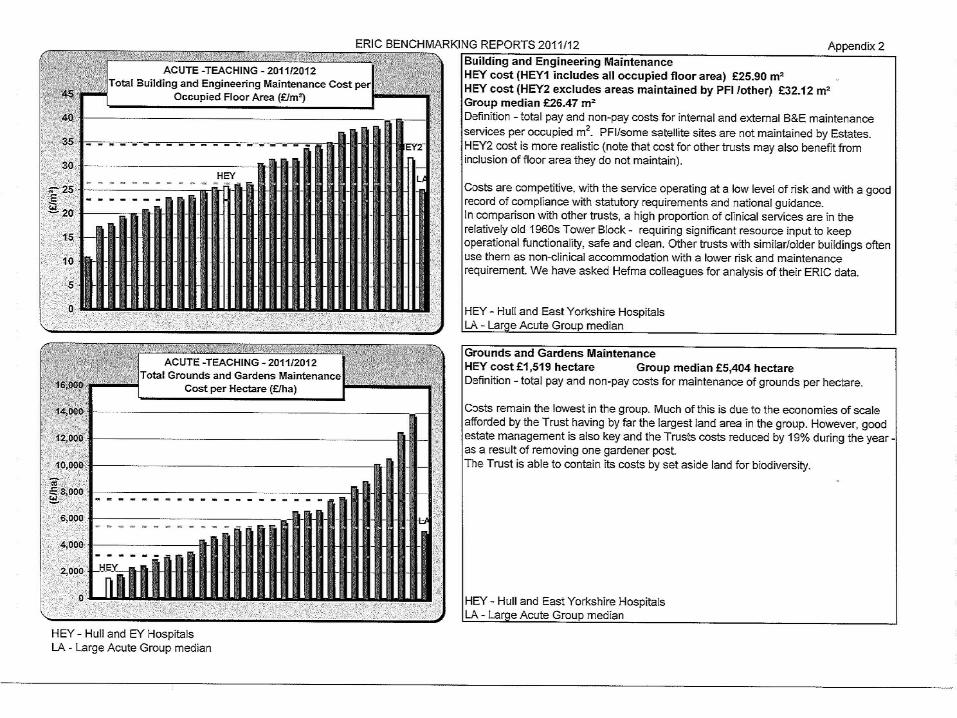
1 %£/m² 25.90 23.00 26.47 34.50 25.47 25.45 -2.15 1.69 1.77£/m² 32.12 23.00 26.47 34.50 25.47 32.87 21.35 26.11 -2.28£/ha 1,519 3,211 5,404 7,476 5,159 1,875 -71.88 -70.55 -18.96
UnitTrust Value
Lower Quartile
MedianUpper
Quartile
Large Acute
Median
HEY Value 2010/11
Acute Teach
ing %
Large Acute
%
HEY 2010/1
1 %£ ###### ###### ####### ###### ###### ###### 43.30 ##### 10.83£ ###### ###### ####### ###### ###### ###### 5.32 56.56 16.14
£/m² 157.45 86.49 143.02 219.86 157.81 134.23 10.09 -0.23 17.30£/m² 89.07 25.83 44.59 78.49 49.01 79.57 99.77 81.74 11.94% 56.57 21.24 35.51 55.62 35.5 59.28 59.29 59.36 -4.57
Patient meals wastageCost of In-patient Meal
Total Building and
Food Services
Gross Cost of Patient Services per Main
Quality of Buildings
Maintenance Costs
Total Building and Total Grounds and
Percentage Risk
Risk Adjusted Backlog Cost to eradicate Cost to eradicate Risk Adjusted Backlog
HEY Benchmarking Report 2HEY Benchmarking Report 2
• Selection of ERIC Trust/Site Information Trust Wide benchmarking charts
• Outliers removed
• Add ‘Large Acute’ group median to ‘x’ axis
• Supplement with commentary on performance for each selected indicator
HEY Benchmarking Reports PaperHEY Benchmarking Reports Paper
Supporting paper gives –
• Background on ERIC collection and reporting
• Explanation of the HEY benchmarking reports
• Main points to note
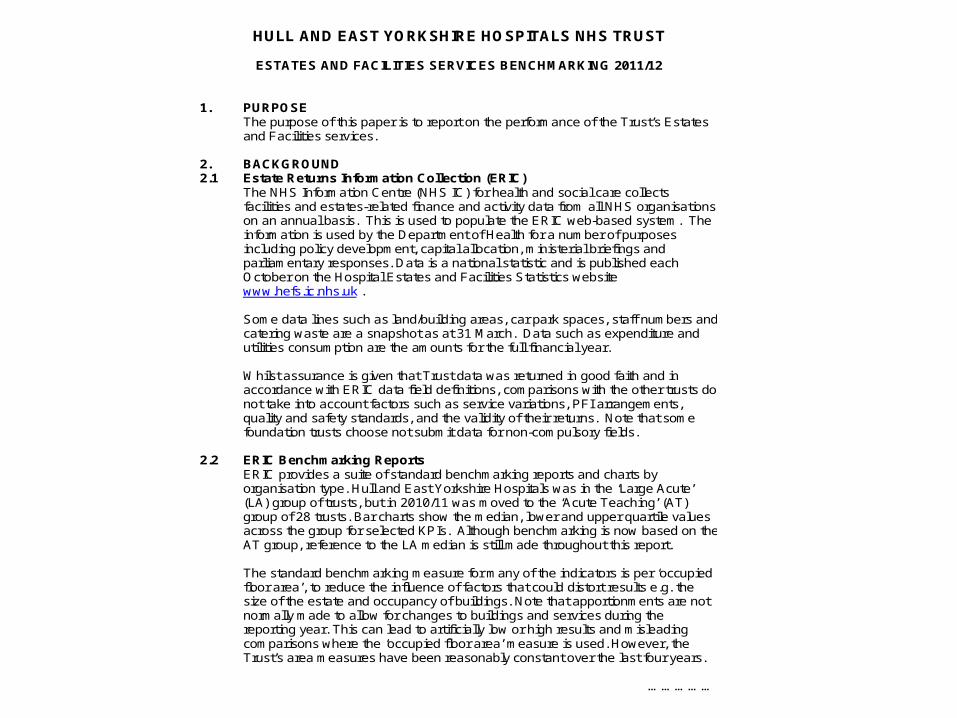
HULL AND EAST YORKSHIRE HOSPITALS NHS TRUST
ESTATES AND FACILITIES SERVICES BENCHMARKING 2011/12 1. PURPOSE
The purpose of this paper is to report on the performance of the Trust’s Estates and Facilities services.
2. BACKGROUND 2.1 Estate Returns Information Collection (ERIC)
The NHS Information Centre (NHS IC) for health and social care collects facilities and estates-related finance and activity data from all NHS organisations on an annual basis. This is used to populate the ERIC web-based system. The information is used by the Department of Health for a number of purposes including policy development, capital allocation, ministerial briefings and parliamentary responses. Data is a national statistic and is published each October on the Hospital Estates and Facilities Statistics website www.hefs.ic.nhs.uk . Some data lines such as land/building areas, car park spaces, staff numbers and catering waste are a snapshot as at 31 March. Data such as expenditure and utilities consumption are the amounts for the full financial year. Whilst assurance is given that Trust data was returned in good faith and in accordance with ERIC data field definitions, comparisons with the other trusts do not take into account factors such as service variations, PFI arrangements, quality and safety standards, and the validity of their returns. Note that some foundation trusts choose not submit data for non-compulsory fields.
2.2 ERIC Benchmarking Reports ERIC provides a suite of standard benchmarking reports and charts by organisation type. Hull and East Yorkshire Hospitals was in the ‘Large Acute’ (LA) group of trusts, but in 2010/11 was moved to the ‘Acute Teaching’ (AT) group of 28 trusts. Bar charts show the median, lower and upper quartile values across the group for selected KPIs. Although benchmarking is now based on the AT group, reference to the LA median is still made throughout this report. The standard benchmarking measure for many of the indicators is per ‘occupied floor area’, to reduce the influence of factors that could distort results e.g. the size of the estate and occupancy of buildings. Note that apportionments are not normally made to allow for changes to buildings and services during the reporting year. This can lead to artificially low or high results and misleading comparisons where the ‘occupied floor area’ measure is used. However, the Trust’s area measures have been reasonably constant over the last four years.
…………….
• We have (some) answers
- varying methods of service delivery
- PFIs
- risk appetite
- input is definitely validated
- our figures are correct (it’s the others?)
Explaining our differencesExplaining our differences

REFLECT, LEARN, IMPROVE
REFLECT, LEARN, IMPROVE
• Are we being honest with ourselves?• Are comparisons enlightening or confusing?• Do we have the skills and knowledge (and time)
to develop performance management locally?• Could we/should we all be more proactive in
sharing background information?• Will PAM and/or the current benchmarking work
provide a comprehensive standard approach?
NHS Estates & Facilities Informatics for the new NHS landscape
Michael BellasSenior Estates Analysis Manager
Department of Health
Policy MandateThe NHS Constitution commits the NHS to strive to
“….ensure services are provided in a clean and safe environment that is fit for purpose, based on national best practice.”
Statutory healthcare regulations require that
“…service users are protected against the risks associated with unsafe and unsuitable premises”
Proposed change to the NHS Constitution:
- In the recent Consultation document: Q12. Do you agree with the suggestion of including a new pledge for same sex accommodation?
Context of the System
Secretary of State’s duties to improve quality of services and continuous improvement in;
• the prevention, diagnosis or treatment of illness, or• the protection or improvement of public health.
securing continuous improvement in outcomes
• the effectiveness of the services,• the safety of the services, and • the quality of the experience undergone by patients.
Source: Health and Social Care Bill, Part I, clause 2, 1A(1) & (2)
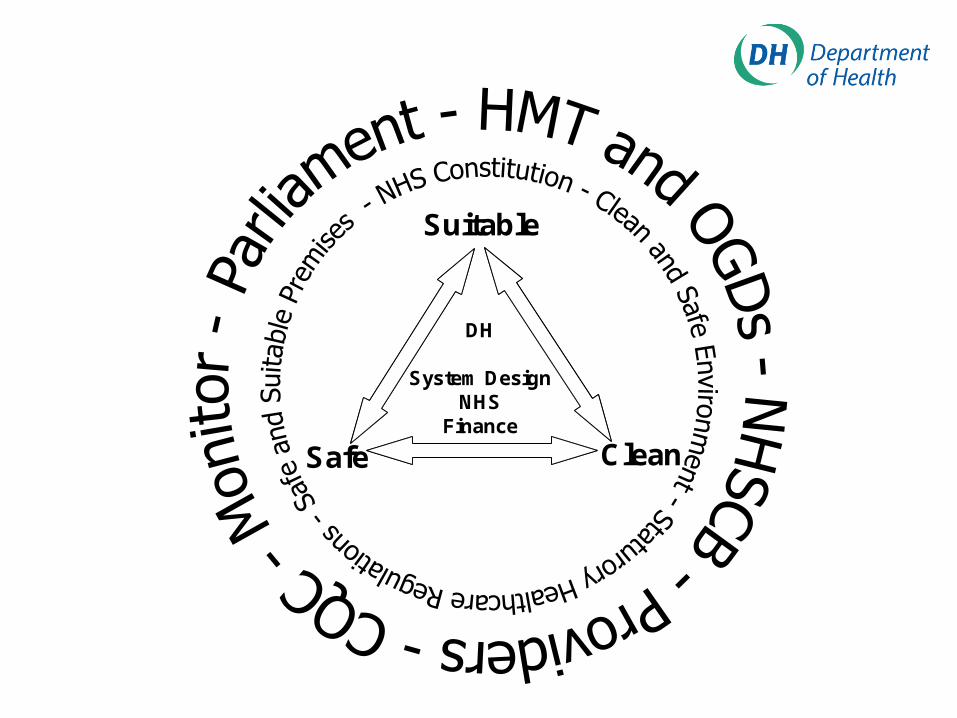
DH
System DesignNHS
Finance
Suitable
CleanSafe
DH
System DesignNHS
Finance
Suitable
CleanSafe
Estates and Facilities Division in the new Department of Health
Responsible for Policy in relation to environments and premises which are Clean, Safe and Suitable
Clean Environments
Provide and maintain a clean and appropriate environment in managed premises that facilitate the prevention and control of infections
Safe Environments and Premises
The NHS operates out of a physical environment that is unique in the risks it presents to the safety of patients, visitors and staff
Suitable Premises
Service users are protected against the risks associated with unsafe andunsuitable premises

2011-12 % Changesince 2010-11
• Annual Cost to Maintain NHS Estate £ 7.1 billion No change
• Cost to eradicate Critical £ 1.2 billion -9%Infrastructure Risk
• Total floor area of NHS Estate 28.4 million m2 -9%
• Total land area of NHS Estate 6,879 hectares -7%
• Amount of occupied floor area declared as un-utilised 5.5% -12.7%
• Average cost of feeding one patient per day £ 8.77 +2.2%
ERIC’s added value – headline figures
• NHS Estates & Facilities Policy Division now part of the Government, Operations and Assurance Directorate;
• NHS Property Services Ltd;
• NHS Commissioning Board
• Care Quality Commission (CQC)
• NHS Trust Development Authority (NHS TDA)
Future structure of the NHS landscape in relation to Estates & Facilities
NHS Estates & Facilities Policy Division – Overview
• Support PS(H)’s portfolio responsibility for `NHS Estates & Facilities’;
• Champion the NHS Constitution’s commitment in relation to Estates & Facilities;
• Underpin the Care Quality Commission’s statutory healthcare regulatory requirement for E&F
• Assure HM Treasury accountabilities for the system’s NHS spend of over £7bn a year on E&F and over £3bn of capital investment;
• Fulfil Department of State responsibilities, negotiating with HM Treasury, Cabinet Office and a wide range of other government departments whose policies impact on and are expected to be delivered by the NHS;
• Lead and influence the NHS Estates & Facilities community in common purpose to deliver an efficient and effective Estates & Facilities Management service for a clean, safe and suitable environment that meets patient’s needs and preferences.
2013-14 and Beyond - Changes
• Publication of the Mid Staffs Public Inquiry Report.
• Future economic situation;
• Changes to the NHS Landscape:• NHS Property Services Ltd;• NHS Commissioning Board;• Care Quality Commission (CQC);• NHS Trust Development Authority (NHS TDA);• Clinical Commissioning Groups (CCGs).
• New responsibilities/powers of the Health & Social Care Information Centre (HSCIC).
2013-14 and Beyond – What do we need to do?
• Who needs the information on the NHS Estate & Facilities?
• How do we engage with organisations who have an interest in NHS Estate & Facilities?
• How should NHS Estate & Facilities information be presented?
• What data from NHS Providers is needed to produce the information that is needed?
A fundamental review is needed to determine the best way forward in the new NHS landscape.

Thank you for listening………………
Any Questions ?
SHAPEhttp://shape.dh.gov.uk
SHAPE is a web-enabled, evidence based toolkit, designed to inform and support the strategic planning of services and assets across a whole health economy.
SHAPE currently includes:
• Clinical Activity
• Public Health & Health Inequalities
• Demographics
• ERIC Indicators
• Outputs linked to GIS mapping
• Primary Care
• Integration with other applications
• Policy Context
• Geo-coded NHS sites and facilities
• Travel time analyses
SHAPE is configured to numerous boundaries including: SHA; Commissioning Board Authorities and Local Area Teams; PCTs and PCT clusters; CCGs, GP practices and Local Authorities
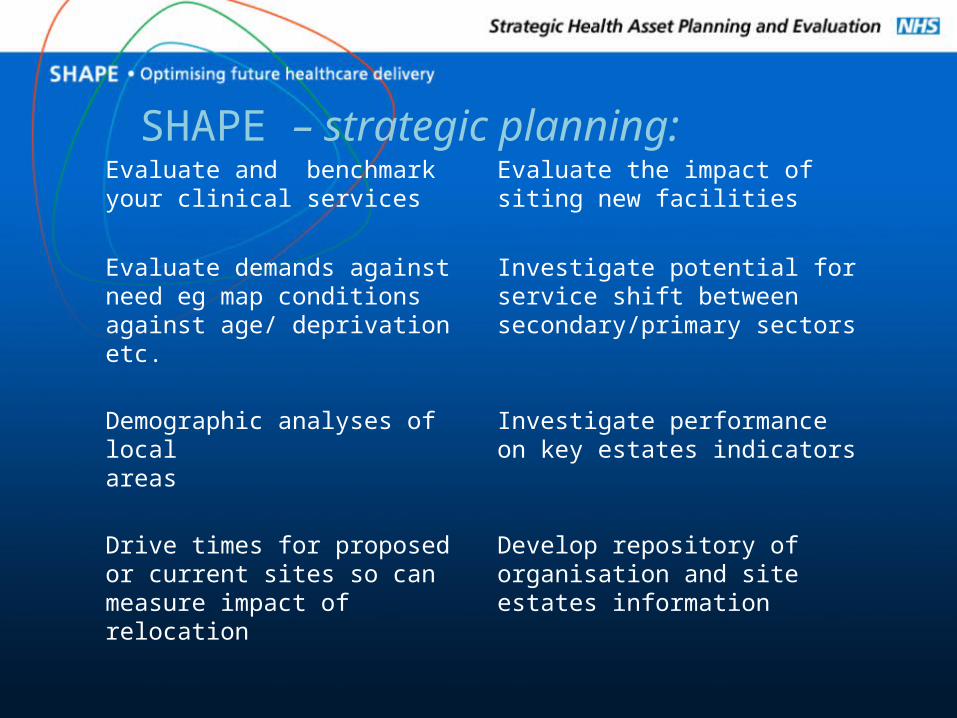
SHAPE – strategic planning:Evaluate and benchmark your clinical services
Evaluate the impact of siting new facilities
Evaluate demands against need eg map conditions against age/ deprivation etc.
Investigate potential for service shift between secondary/primary sectors
Demographic analyses of local areas
Investigate performance on key estates indicators
Drive times for proposed or current sites so can measure impact of relocation
Develop repository of organisation and site estates information
SHAPE is multi-disciplinary:• Designed for users from different professional groups• Designed to encourage communication and knowledge sharing
Training and familiarisation is important:• User guide, Training webinars and backup• User groups
Requirements• Internet Explorer v8 or higher, Chrome, Safari, Firefox
SHAPE is free to eligible, registered users
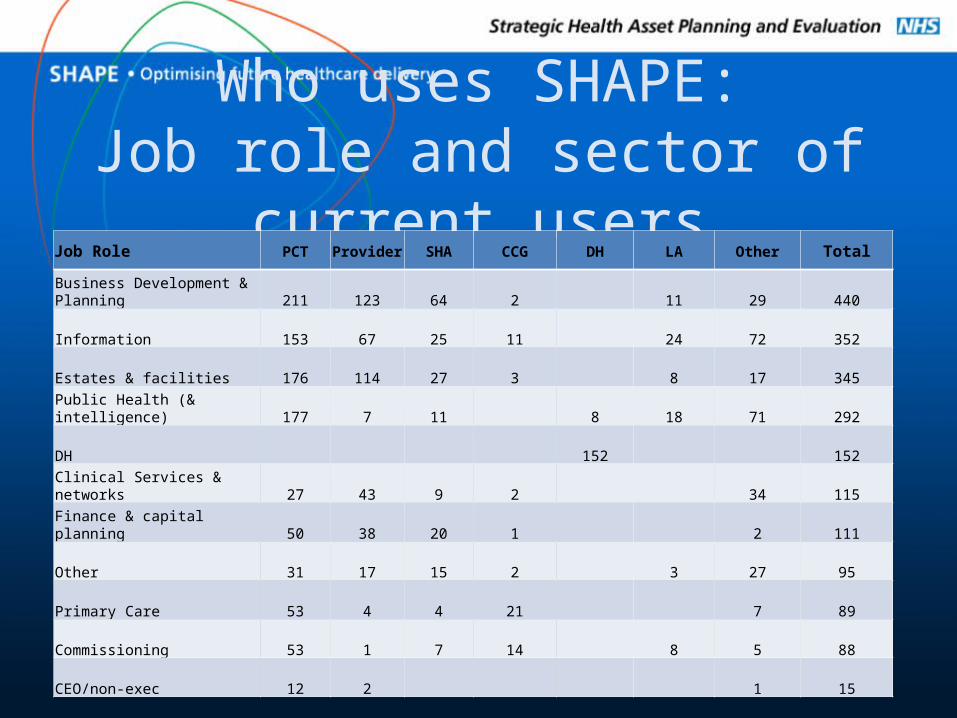
Who uses SHAPE:Job role and sector of current users
Job Role PCT Provider SHA CCG DH LA Other Total
Business Development & Planning 211 123 64 2 11 29 440
Information 153 67 25 11 24 72 352
Estates & facilities 176 114 27 3 8 17 345
Public Health (& intelligence) 177 7 11 8 18 71 292
DH 152 152
Clinical Services & networks 27 43 9 2 34 115
Finance & capital planning 50 38 20 1 2 111
Other 31 17 15 2 3 27 95
Primary Care 53 4 4 21 7 89
Commissioning 53 1 7 14 8 5 88
CEO/non-exec 12 2 1 15
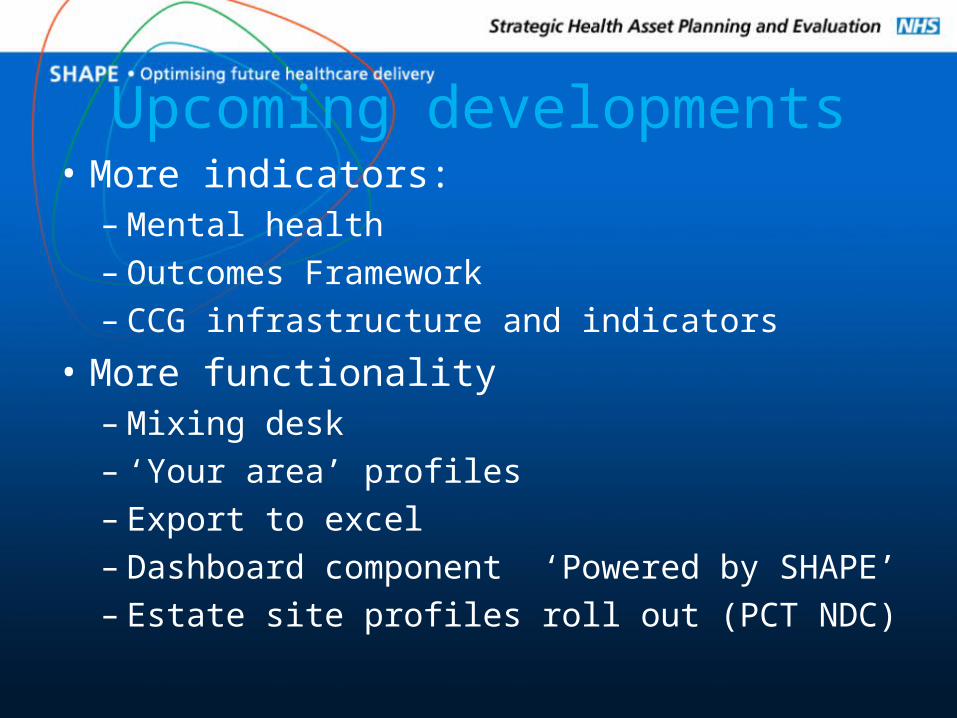
Upcoming developments• More indicators:
– Mental health– Outcomes Framework– CCG infrastructure and indicators
• More functionality– Mixing desk– ‘Your area’ profiles– Export to excel– Dashboard component ‘Powered by SHAPE’– Estate site profiles roll out (PCT NDC)
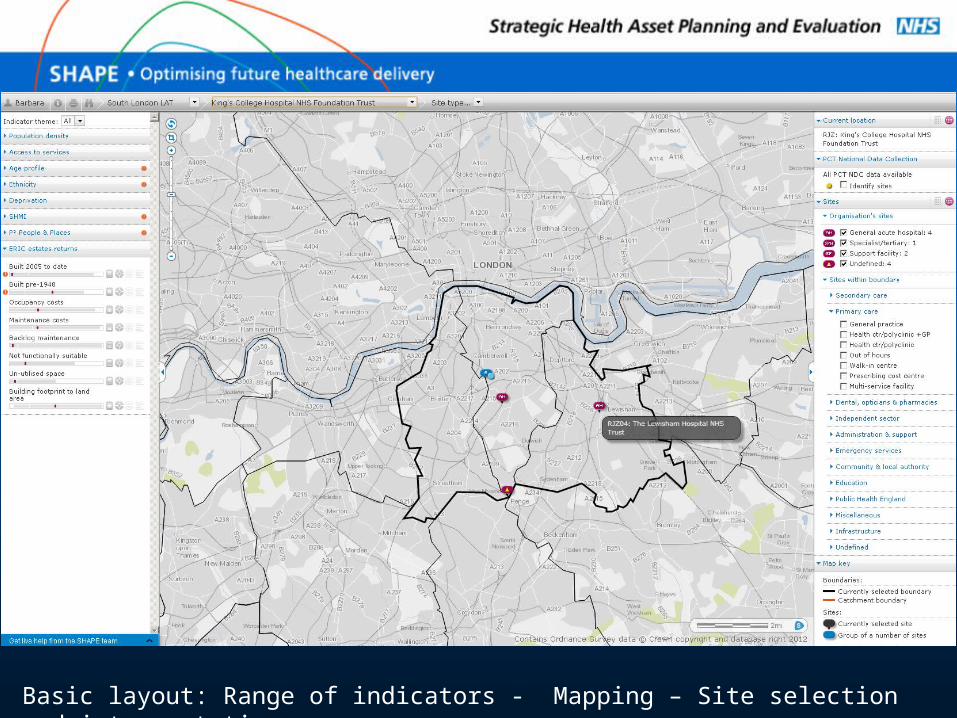
Basic layout: Range of indicators - Mapping – Site selection and interpretation
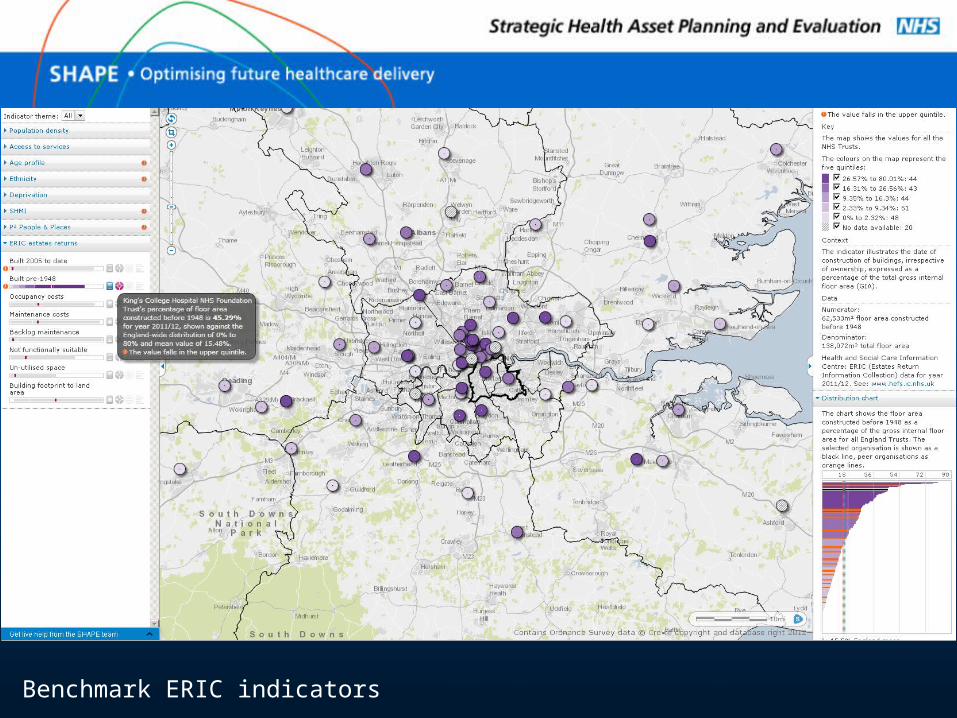
Benchmark ERIC indicators
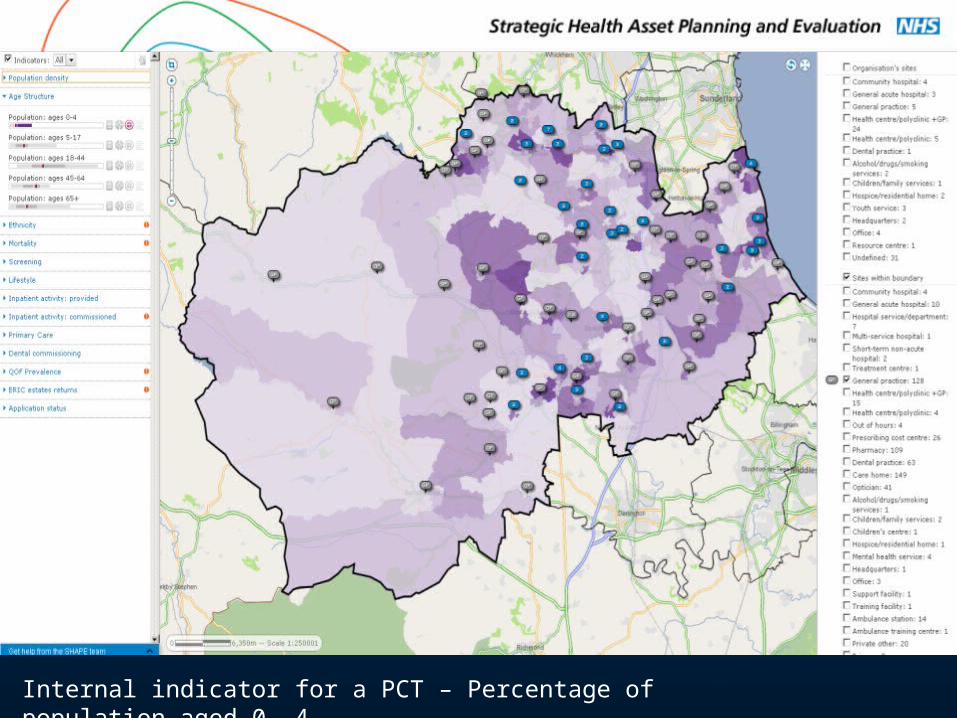
Internal indicator for a PCT – Percentage of population aged 0 -4
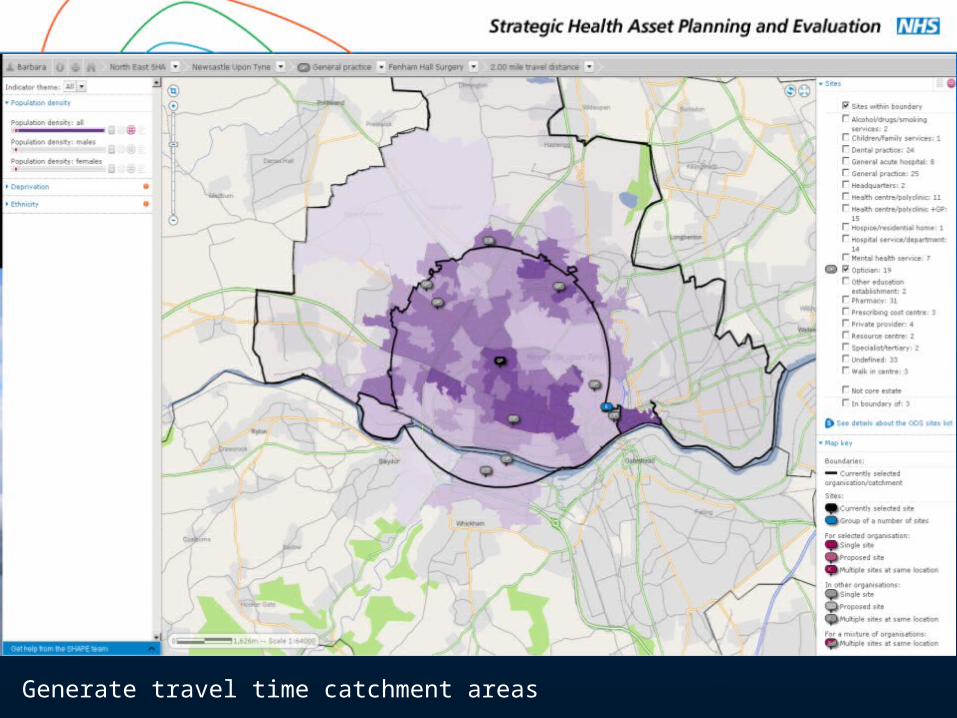
Generate travel time catchment areas
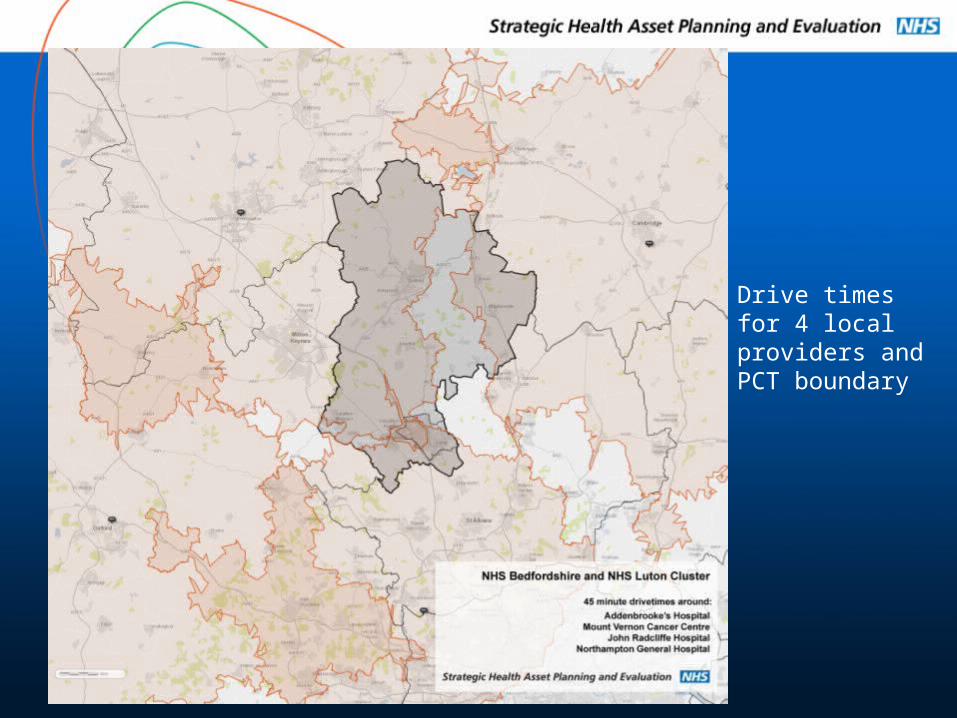
Drive times for 4 local providers and PCT boundary
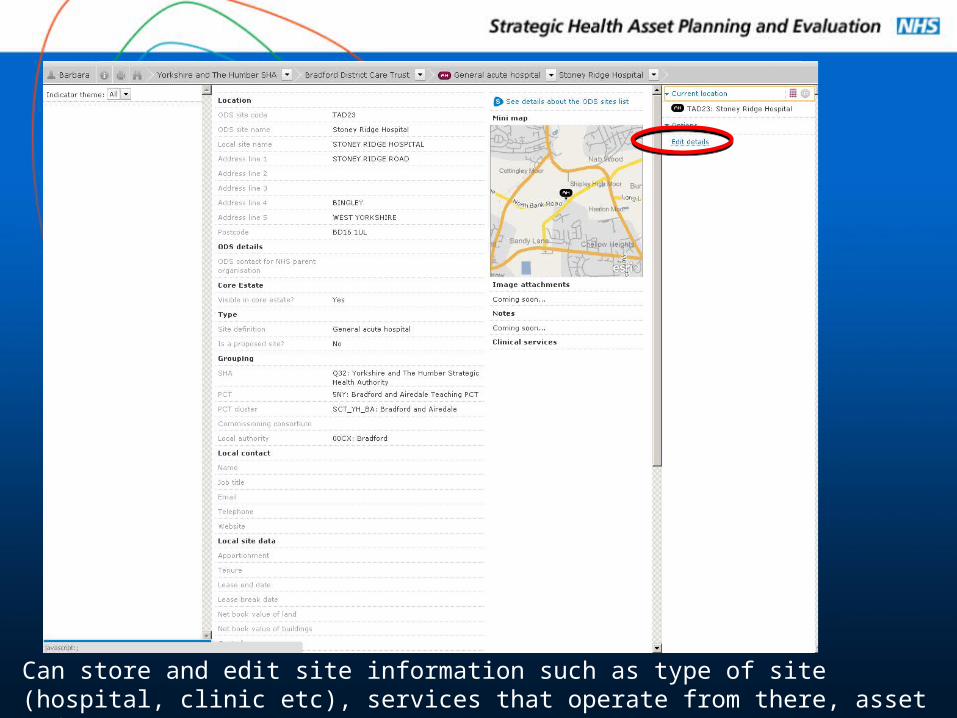
Can store and edit site information such as type of site (hospital, clinic etc), services that operate from there, asset information etc.
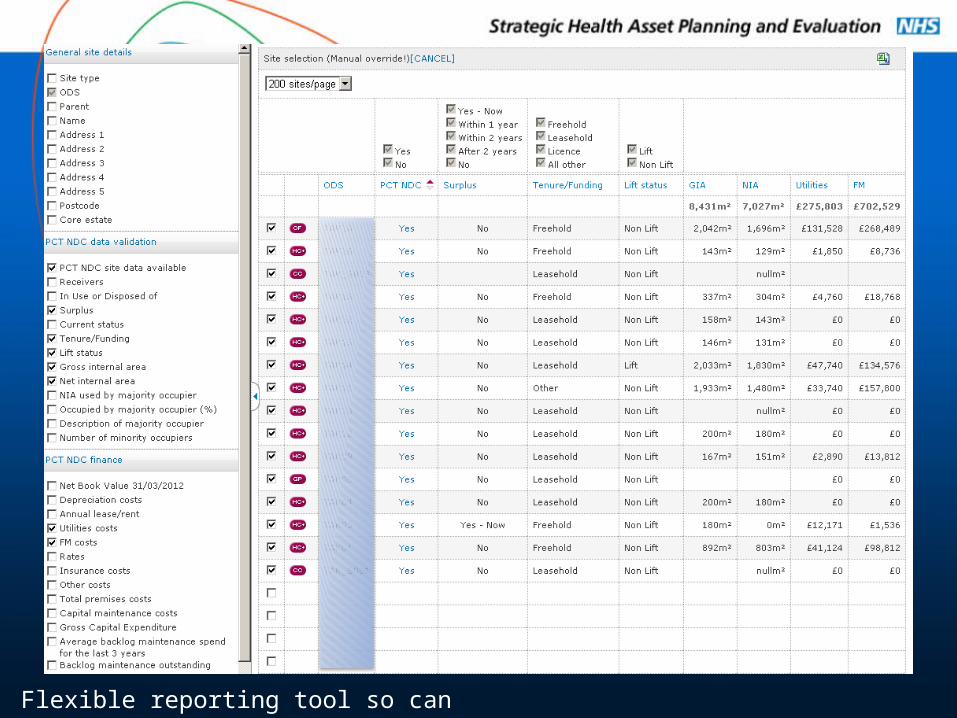
Flexible reporting tool so can easily compare sites
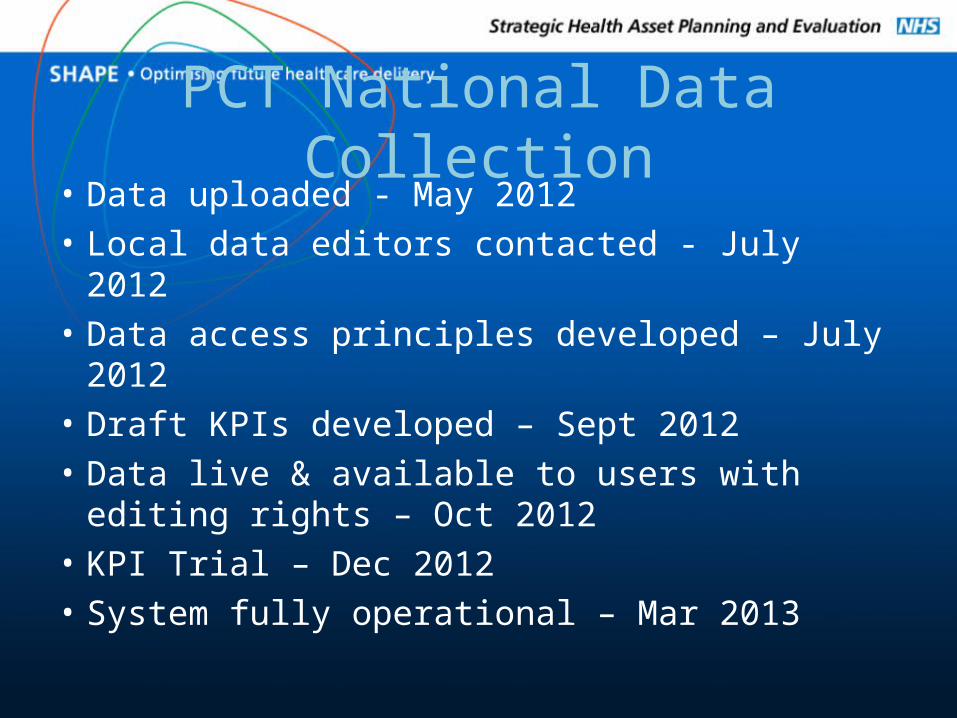
PCT National Data Collection• Data uploaded - May 2012• Local data editors contacted - July 2012• Data access principles developed – July 2012• Draft KPIs developed – Sept 2012• Data live & available to users with editing
rights – Oct 2012• KPI Trial – Dec 2012• System fully operational – Mar 2013

Robert Grogan
ERIC Supporting Performance
Management
ERICSupporting Performance
Management
1. 2011-12 Collection Review
2. 2012-13 Collection
3. System Enhancements
4. Data Quality
5. Data Definitions
6. Media Coverage
7. Training
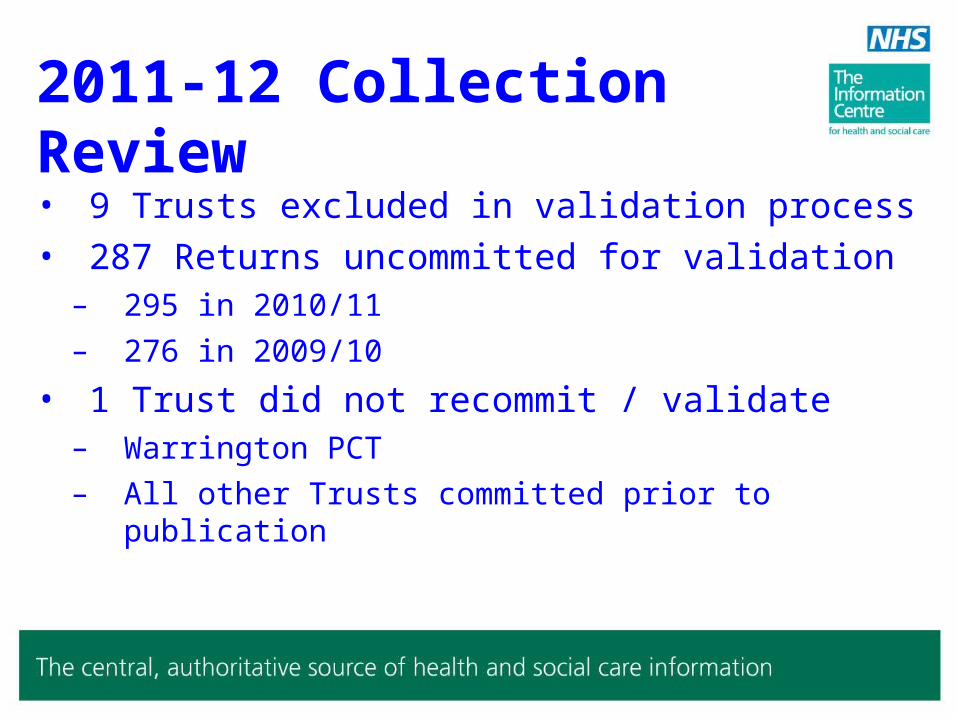
2011-12 Collection Review
• 9 Trusts excluded in validation process
• 287 Returns uncommitted for validation– 295 in 2010/11
– 276 in 2009/10
• 1 Trust did not recommit / validate– Warrington PCT
– All other Trusts committed prior to publication
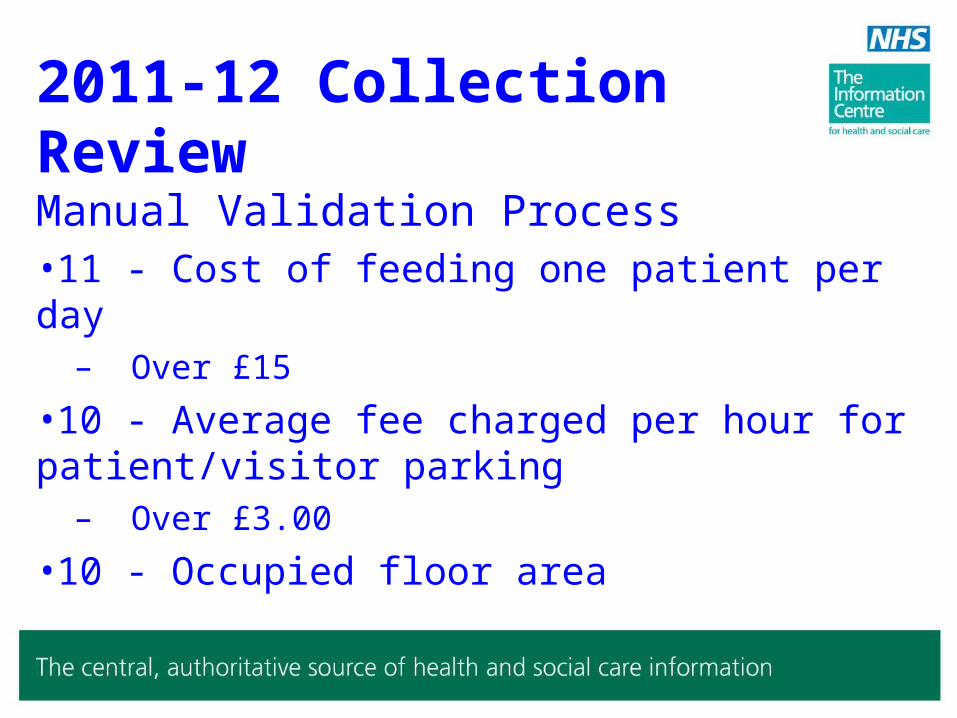
2011-12 Collection Review
Manual Validation Process•11 - Cost of feeding one patient per day
– Over £15
•10 - Average fee charged per hour for patient/visitor parking
– Over £3.00
•10 - Occupied floor area
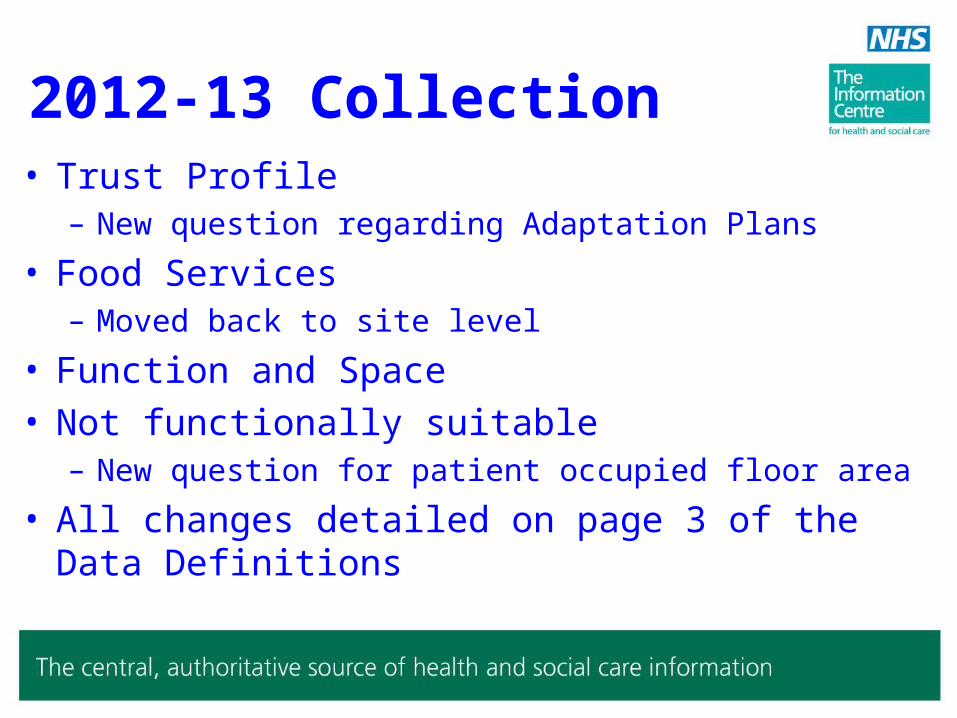
2012-13 Collection• Trust Profile
– New question regarding Adaptation Plans
• Food Services– Moved back to site level
• Function and Space• Not functionally suitable
– New question for patient occupied floor area
• All changes detailed on page 3 of the Data Definitions
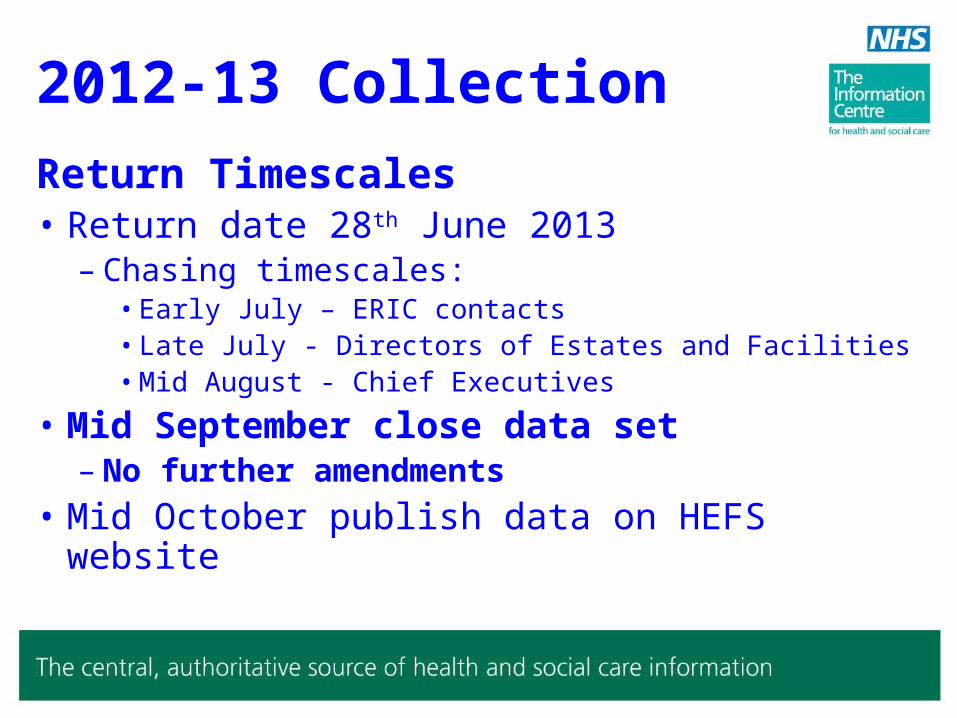
2012-13 Collection
Return Timescales• Return date 28th June 2013
– Chasing timescales:• Early July – ERIC contacts• Late July - Directors of Estates and Facilities• Mid August - Chief Executives
• Mid September close data set – No further amendments
• Mid October publish data on HEFS website
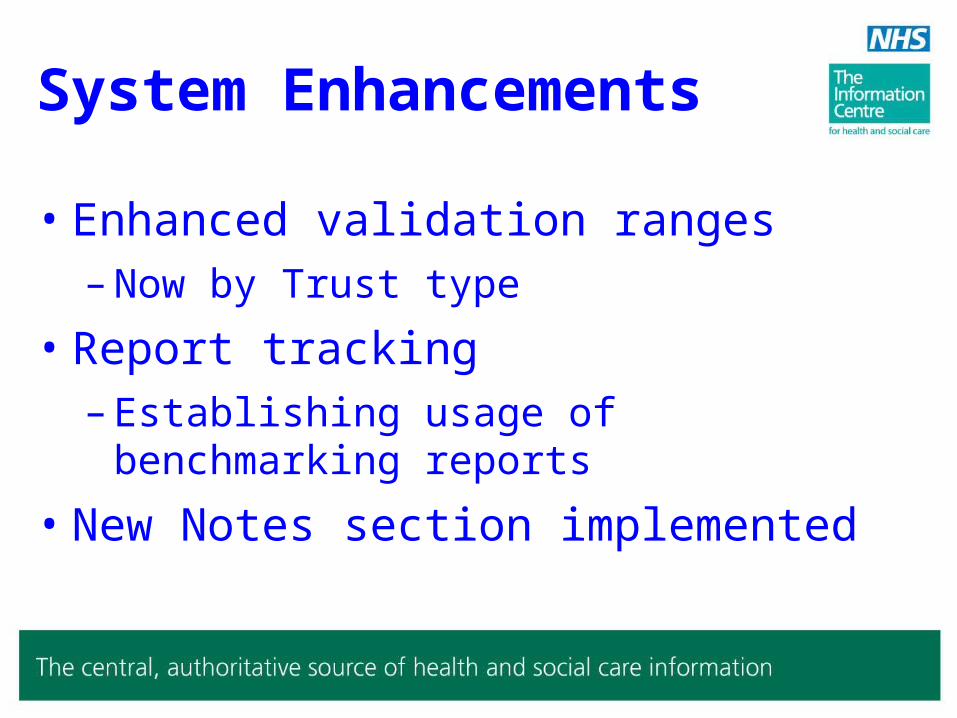
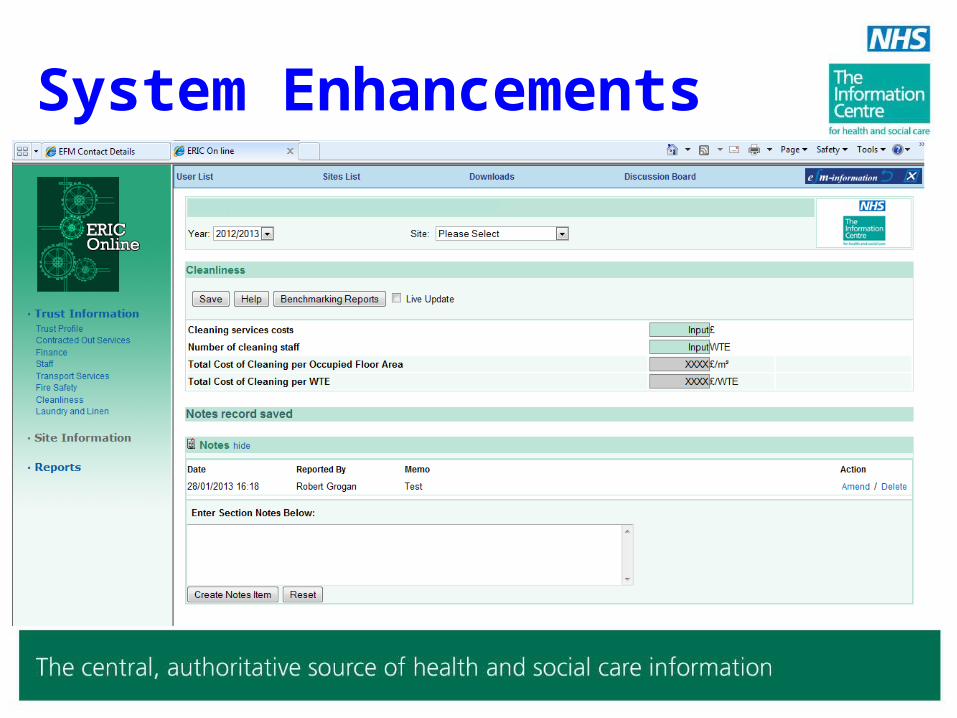
System Enhancements
• Enhanced validation ranges– Now by Trust type
• Report tracking– Establishing usage of benchmarking reports
• New Notes section implemented
System Enhancements
Data Quality
• Quality issues remain
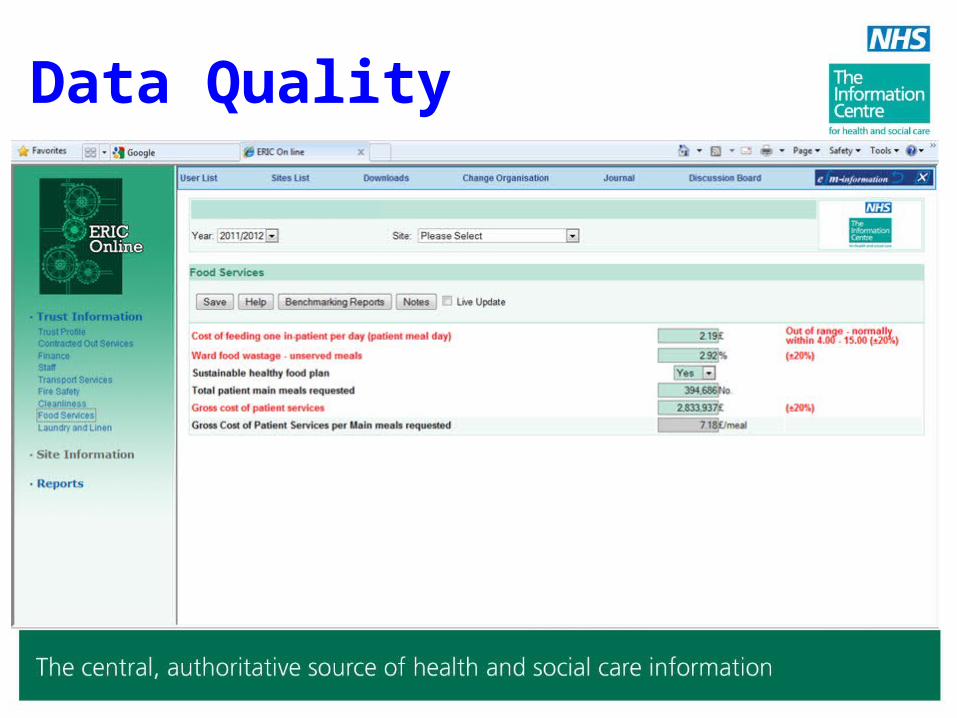
• Identify and reduce data input errors by:– On screen PI’s
– Using reports
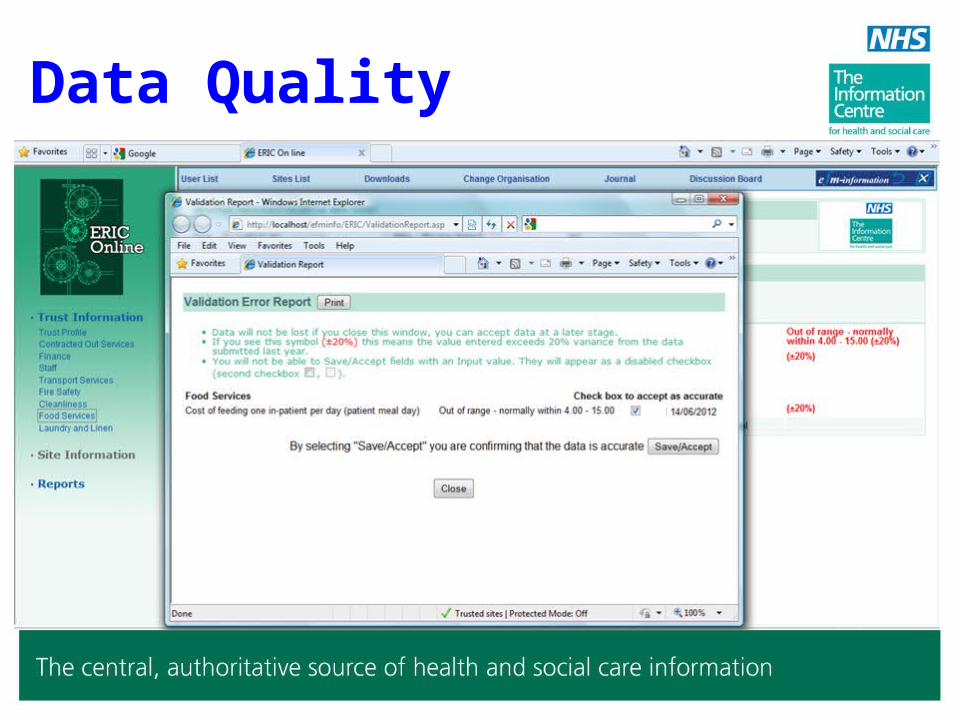
– Validate results
• Errors will distort reports
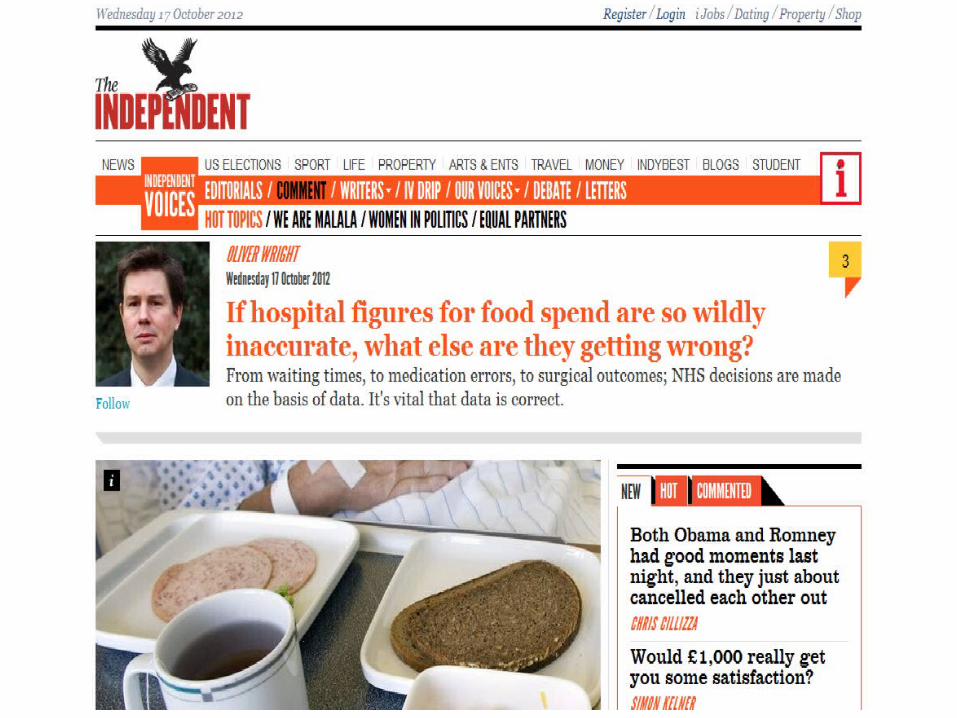
• Figures DO appear in the press
Data Quality
Data Quality

Data Quality
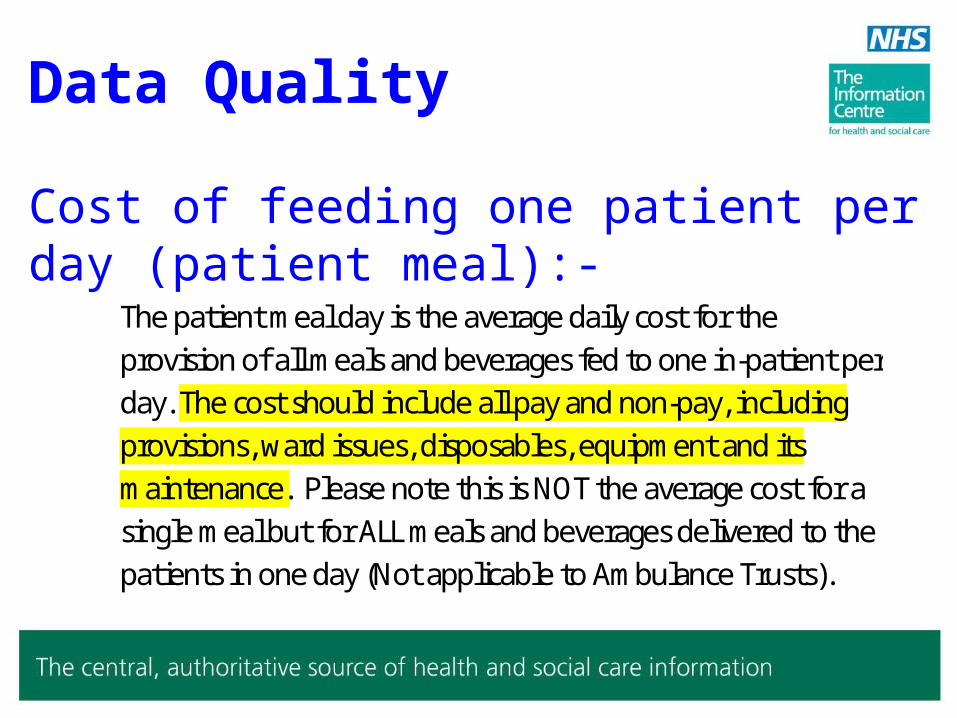
Cost of feeding one patient per day (patient meal):-
The patient meal day is the average daily cost for the provision of all meals and beverages fed to one in-patient per day. The cost should include all pay and non-pay, including provisions, ward issues, disposables, equipment and its maintenance. Please note this is NOT the average cost for a single meal but for ALL meals and beverages delivered to the patients in one day (Not applicable to Ambulance Trusts).
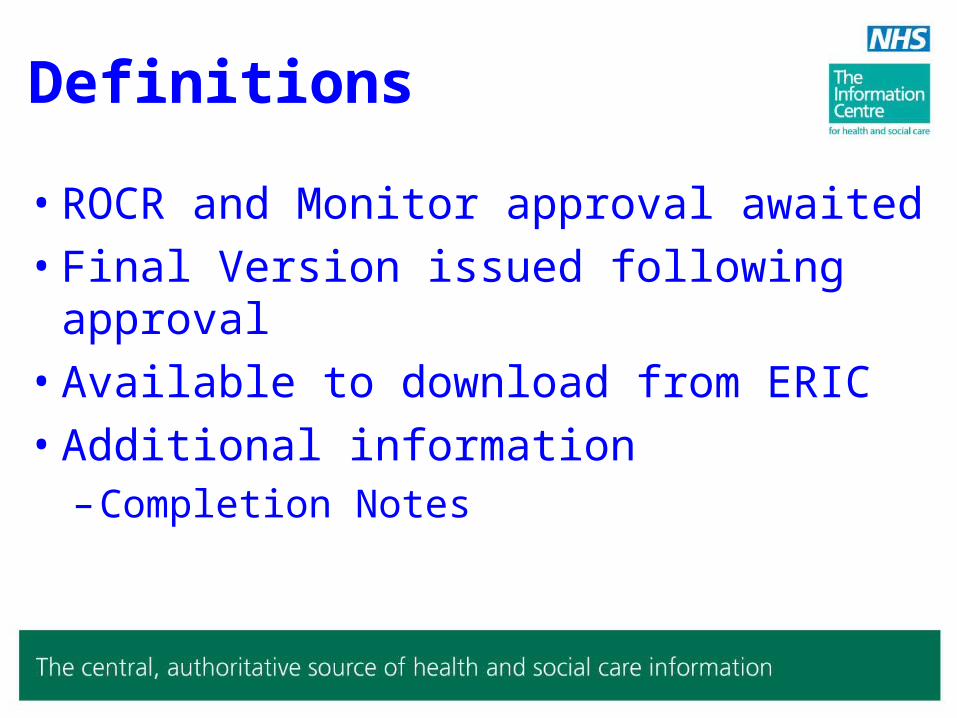
Definitions
• ROCR and Monitor approval awaited
• Final Version issued following approval
• Available to download from ERIC
• Additional information– Completion Notes
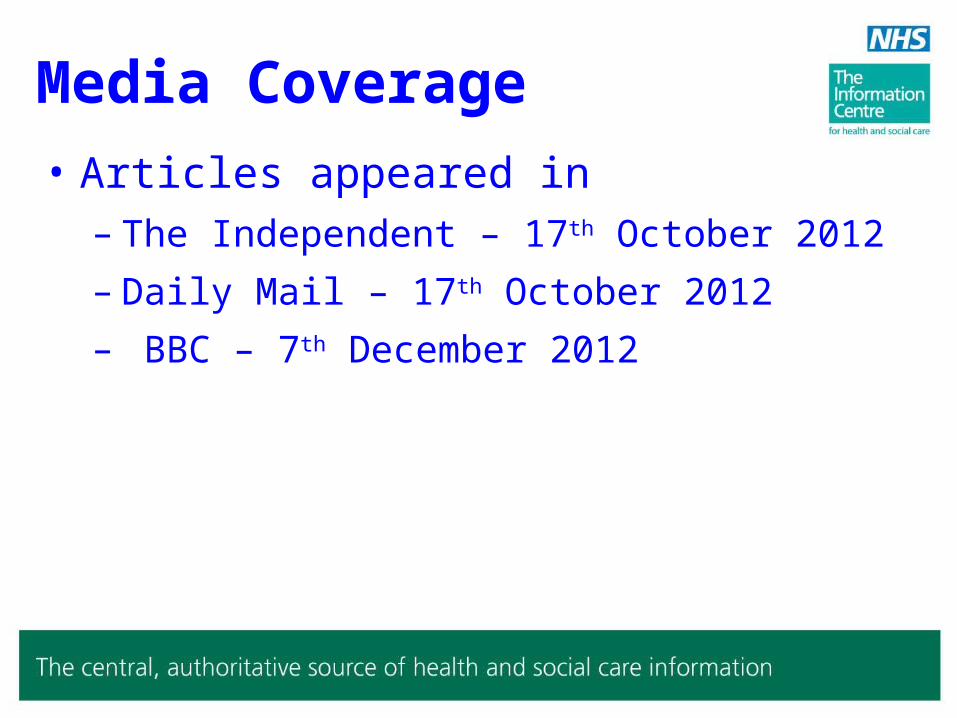
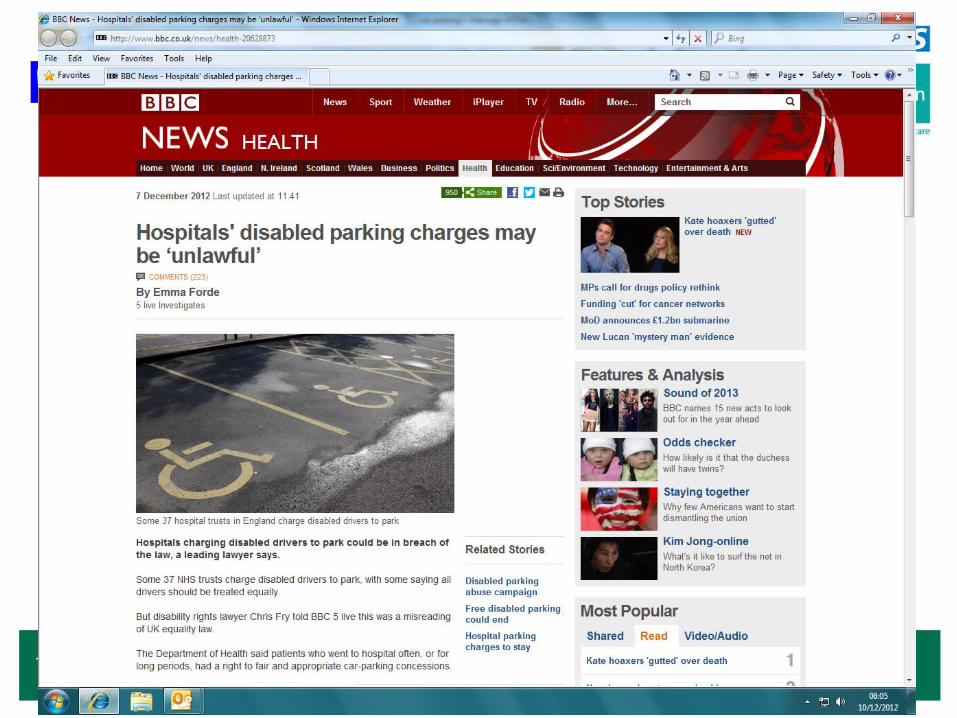
Media Coverage
• Articles appeared in– The Independent – 17th October 2012
– Daily Mail – 17th October 2012
– BBC – 7th December 2012

Media Coverage
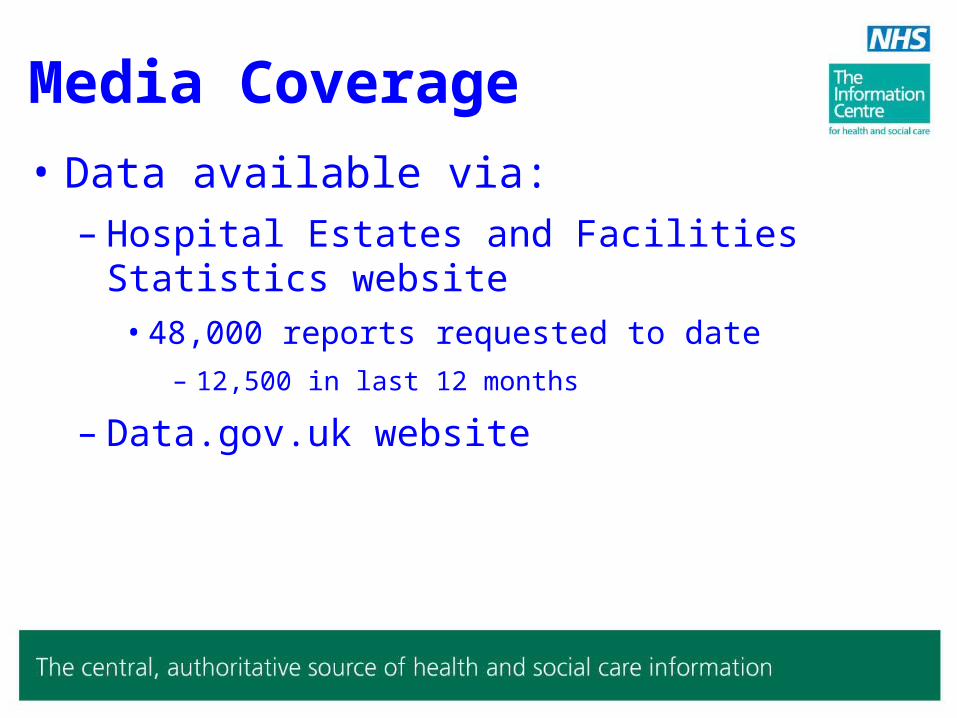
Media Coverage
• Data available via:– Hospital Estates and Facilities Statistics website
• 48,000 reports requested to date
– 12,500 in last 12 months
– Data.gov.uk website
ERIC
Supporting Performance Management
Related Documents


