ERI REPORT NO. CON 110 BUILDING ENERGY AUDIT REPORT NATIONAL ELECTRICITY REGULATOR 526 VERMEULEN STREET, PRETORIA Prepared by D VAN ES S ABRAHAMS of Energy Research Institute Department of Mechanical Engineering University of Cape Town Private Bag RONDEBOSCH 7701 South Africa for The Department Of Minerals And Energy DME-DANCED Capacity Building In Energy Efficiency And Renewable Energy Programme Funded by DANCED and managed by COWI A/S (Project Number : P-54126) OCTOBER 2002

Welcome message from author
This document is posted to help you gain knowledge. Please leave a comment to let me know what you think about it! Share it to your friends and learn new things together.
Transcript

ERI REPORT NO. CON 110
BUILDING ENERGY AUDIT REPORT
NATIONAL ELECTRICITY REGULATOR
526 VERMEULEN STREET, PRETORIA
Prepared by
D VAN ES
S ABRAHAMS
of
Energy Research Institute
Department of Mechanical Engineering
University of Cape Town
Private Bag
RONDEBOSCH 7701
South Africa
for
The Department Of Minerals And Energy
DME-DANCED Capacity Building In Energy Efficiency And Renewable Energy
Programme
Funded by DANCED and managed by COWI A/S
(Project Number : P-54126)
OCTOBER 2002

- I -
EXECUTIVE SUMMARY
The Department of Minerals and Energy (DME) is proactively investing in energy efficiency.
Energy efficiency in buildings is one of many projects investigated by the DME. The National
Electricity Regulatory (NER) building in Pretoria is a specific case study contracted to the
Energy Research Institute (ERI).
This project is managed by COWI A/S as part of the DANCED funded programme: DME-
DANCED Capacity Building In Energy Efficiency And Renewable Energy
It was found that the NER building in Pretoria incorporated both energy and cost efficiency in its
original building design, including:
Overhangs surrounding the building that reduce solar heat gain
Tinted window glass
Additional angled tinted windows on the northern overhangs
Variable volume Heating, Ventilation & Air Conditioning (HVAC) system.
The HVAC equipment in the plant room is in a poor condition and the system cannot operate
any where near to its design intent. The chillers and pumps do not operate at all.
Consequently, energy consumption levels could not be measured. Similarly, figures shown in
the electricity bills would not be indicative for the period that the plant has been out of proper
operation. In addition, the NER has recently refurbished and changed the use of the building,
which would mean that historical data from the previous tenants could not be used for energy
comparison. The bulk of the audit, therefore, concentrates on the lighting system.
The building holds the potential to be one of the most energy efficient buildings if
attention is given to upgrading and maintaining the HVAC system, management of the
building and its services, and upgrading the control system.
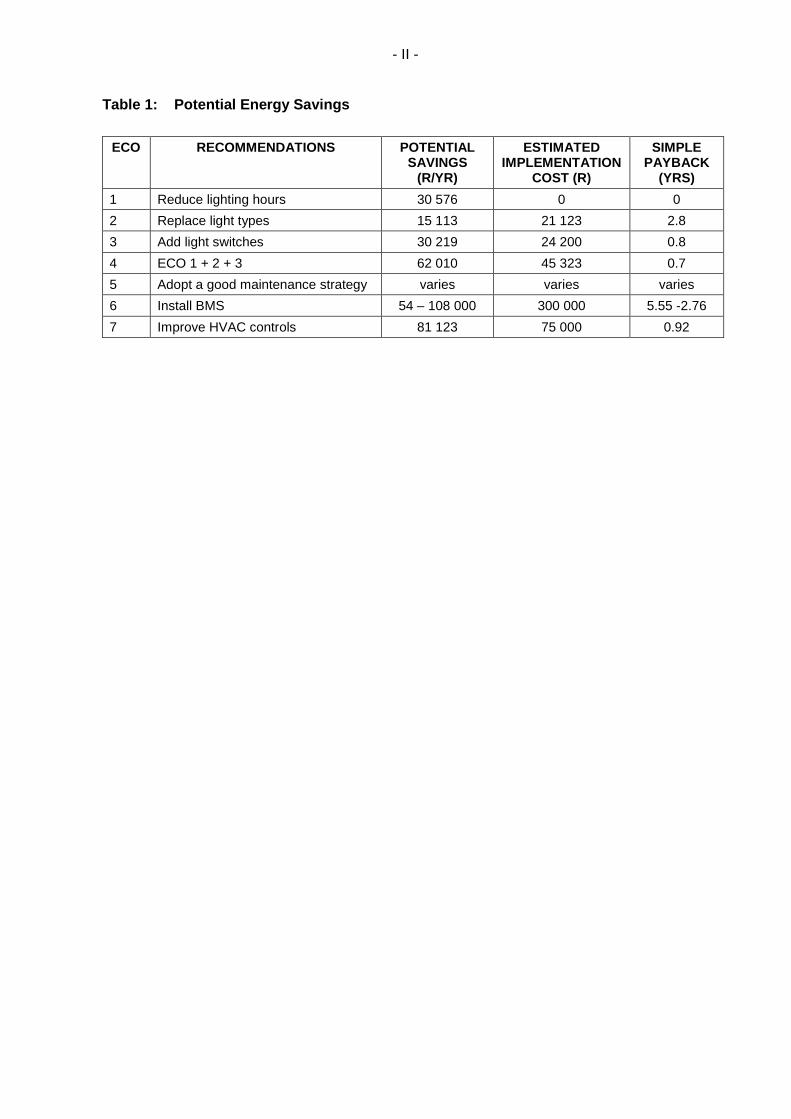
The energy conservation opportunities (ECOs) recommended and described in this report are
summarized in Table 1.
Economic savings presented address only energy and demand cost avoidance and reduction of
present and future costs associated with energy usage. The savings given for each opportunity
reflect the savings achievable when implementing each opportunity independently. Some of the
recommended measures may interact. Therefore, actual cost savings may be less than
indicated.
Note also that the estimates given for savings with respect to the air conditioning system are on
the basis that the original system is restored to working order, as designed.
A strong recommendation is that an experienced consulting engineer be commissioned to
evaluate the HVAC system, design (energy efficient) repairs and improvements, and call for firm
tenders for implementation.
- II -
Table 1: Potential Energy Savings
ECO RECOMMENDATIONS POTENTIAL SAVINGS
(R/YR)
ESTIMATED IMPLEMENTATION
COST (R)
SIMPLE PAYBACK
(YRS)
1 Reduce lighting hours 30 576 0 0
2 Replace light types 15 113 21 123 2.8
3 Add light switches 30 219 24 200 0.8
4 ECO 1 + 2 + 3 62 010 45 323 0.7
5 Adopt a good maintenance strategy varies varies varies
6 Install BMS 54 – 108 000 300 000 5.55 -2.76
7 Improve HVAC controls 81 123 75 000 0.92

- III -
TABLE OF CONTENTS
EXECUTIVE SUMMARY ............................................................................................................. I
TABLE OF CONTENTS ............................................................................................................ III
LIST OF ABBREVIATIONS ....................................................................................................... V
LIST OF TABLES ..................................................................................................................... VI
LIST OF FIGURES .................................................................................................................... VI
1. INTRODUCTION ................................................................................................................. 1
2. BUILDING DESCRIPTION .................................................................................................. 2
3. BUILDING SERVICES ........................................................................................................ 4
3.1 LIGHTING ....................................................................................................................... 4
3.2 HEATING, VENTILATION AND AIR CONDITIONING (HVAC) .................................................. 5
3.2.1 Description of System ................................................................................................... 5
3.2.2 Room Conditions .......................................................................................................... 6
3.3 DOMESTIC HOT WATER HEATING .................................................................................... 7
3.4 OFFICE EQUIPMENT ........................................................................................................ 7
4. ENERGY ACCOUNTING .................................................................................................... 8
4.1 ENERGY MANAGEMENT ................................................................................................... 8
4.2 ELECTRICITY BILL ........................................................................................................... 8
4.3 ENERGY USAGE AND COST ............................................................................................. 9
4.4 AVOIDED COST OF ELECTRICAL ENERGY ......................................................................... 9
4.5 AVOIDED COST OF ELECTRICAL DEMAND ......................................................................... 9
5. ENERGY CONSERVATION OPPORTUNITIES ................................................................ 10
5.1 INSTALL HIGH EFFICIENCY LIGHTING .............................................................................. 10
5.1.1 Recommended Action ................................................................................................. 11
5.1.2 Background................................................................................................................. 11
5.1.3 Anticipated Savings .................................................................................................... 12
5.1.4 Implementation Costs ................................................................................................. 16
5.2 ADOPT A GOOD BUILDING MAINTENANCE STRATEGY ...................................................... 16
5.3 IMPLEMENT A BUILDING MANAGEMENT SYSTEM .............................................................. 17
5.4 UPGRADING AND TUNING HVAC CONTROLS .................................................................. 18
5.4.1 Background................................................................................................................. 18
5.5 AIR CONDITIONING SYSTEM .......................................................................................... 18
5.6 DOMESTIC HOT WATER HEATING .................................................................................. 19
5.7 VARIABLE SPEED DRIVERS ............................................................................................ 19

- IV -
6. COMFORT AUDIT ............................................................................................................ 19
6.1 RESULTS ...................................................................................................................... 20
6.1.1 Indoor Temperatures .................................................................................................. 20
6.1.2 Relative Humidity ........................................................................................................ 21
6.1.3 Light Intensity Levels .................................................................................................. 21
6.1.4 Air Movement .............................................................................................................. 22
7. DISCUSSION, RECOMMENDATIONS AND FURTHER ACTIONS .................................. 23
8. REFERENCES .................................................................................................................. 24
9. BIBLIOGRAPHY ............................................................................................................... 24
10. APPENDICES ................................................................................................................... 25
10.1 METHODOLOGY ............................................................................................................ 25
10.1.1 Principles of Energy Efficiency .................................................................................... 25
10.1.2 Managing the Building ................................................................................................ 25
10.1.3 Retrofitting Energy Saving Measures .......................................................................... 25
10.1.4 Specific Energy Saving Measures ............................................................................... 26
10.1.5 Monitoring and Targeting ............................................................................................ 28
10.1.6 Maintaining the Savings .............................................................................................. 28
10.1.7 Environmental Impact ................................................................................................. 28
10.2 TSHWANE METROPOLITAN MUNICIPALITY ELECTRICITY TARIFFS ...................................... 29
10.3 COMPARATIVE EVALUATION: INCANDESCENT AND COMPACT FLUORESCENT LAMPS ......... 29
10.4 COMFORT AUDIT QUESTIONNAIRE ................................................................................. 30

- V -
LIST OF ABBREVIATIONS
oC Degree Celsius
CF Coincidence Factor
CFL Compact Fluorescent Light
DCS Demand Cost Reduction
DME Department of Minerals and Energy
DR Demand Reduction
DB/WB Dry Bulb/Wet Bulb (temperature)
EC Estimated Energy Conservation
ECO Energy Conservation Opportunity
ECS Energy Cost Saving
ERI Energy Research Institute
HVAC Heating, Ventilation and Air Conditioning System
NER National Electricity Regulator
VAT Value Added Tax
VAV Variable Air Volume

- VI -
LIST OF TABLES
Table 1: Potential Energy Savings .......................................................................................... II
Table 2: Lighting Distribution .................................................................................................. 4
Table 3: Inventory of HVAC equipment................................................................................... 5
Table 4: List of Office Equipment and Staff count per level ..................................................... 7
Table 5: Benchmark Energy Values (kWh/m2-yr) .................................................................... 8
Table 6: Electric Usage, Demand and Cost Summary ............................................................ 9
Table 7: Lighting Fixture Codes and Specifications .............................................................. 12
Table 8: Annual Energy Usage ............................................................................................. 14
Table 9: Cost Reduction ....................................................................................................... 15
Table 10: Comfort Audit - Temperature .................................................................................. 20
Table 11: Measured Temperatures ......................................................................................... 21
Table 12: Comfort Audit - Humidity ......................................................................................... 21
Table 13: Comfort Audit - Lighting .......................................................................................... 22
Table 14: Light Intensity Measurements ................................................................................. 22
Table 15: Comfort Audit - Air Movement ................................................................................. 22
Table 16: Comfort Audit - Lack of Fresh Air ............................................................................ 22
Table 17: Derived and Calculated Energy Key Figures ........................................................... 24
LIST OF FIGURES
Figure 1: Pictorial Diagram of Building Shape .......................................................................... 2
Figure 2: The Building Viewed from Vermeulen Street ............................................................. 3

- 1 -
1. INTRODUCTION
This project is part of the DANCED funded programme for Capacity Building in the DME in
Energy Efficiency and Renewable Energy. The project is managed by COWI A/S.
The project contributes to the overall goal of establishing a more sustainable energy sector in
South Africa through an increased use of renewable energy and greater energy efficiency on
the demand side. A more immediate goal is this specific building energy audit with
recommendations for energy reductions in government buildings.
Cost savings normally drive investment in energy efficiency, although environmental reasons
can be strong. The focus of this study is to realise cost effective efficiency measures. The
recommended energy efficient measures can be grouped into three categories, namely, no cost
or low cost measures requiring little or no investment, medium cost measures requiring only a
simple payback calculation, and high capital cost measures requiring detailed design and a full
investment appraisal.
The assessment takes into account the wider benefits such as improvements in comfort and the
environment.
The ERI surveyed the building and its services during the period 22-26 August 2002.
South African, British and American literature was researched to determine whether there were
any benchmark data for this sort of building. Only the British reference[1] gave useful details.
The figures are quoted below.
GOOD PRACTICE TYPICAL
Overall 225 kWh/m2 400 kWh/m
2
Office equipment 23 31
Hot water + HVAC 149 287
Lighting 27 54
Energy Cybernetics surveyed a similar building in Vermeulen Street about 6 years ago. The
only specific energy consumption is the overall value at approximately 258 kWh/m2 per year.
This gives a context to the British figures and is the region of anecdotal values of around
300 kWh/m2.
It should be noted that these figures are for a geographic location of 51.5o north latitude with
design conditions of 27.2/18.9oC DB/WB in summer and -3.6/-6.1oC DB/WB in winter, whereas
the building in question is situated at 25.7o south latitude with design conditions of 31.7/17.8oC
DB/WB in summer and 3.9/0.1oC DB/WB in winter. Pretoria is also at least 1300 m above sea
level.
The NER owns and occupies the building. It is responsible for the cost of operating the
building. It has recently occupied the building on floors 4 to 8, following refurbishment of these
floors. Floors 2 and 3 are rented to others while floors 0 and 1 are unoccupied, save for a
security person. There are 2 levels basement car parks.

- 2 -
All bought energy is electric; there is no fossil fuel use on site.
2. BUILDING DESCRIPTION
The National Electricity Regulator (NER) building in Pretoria is approximately 20 years old.
During the survey it was difficult to accurately determine the type of insulation or the wall
construction of the building. (The NER was unable to provide architectural and services
drawings as requested; we made educated judgments on what we were able to see)
It appears that the building has been designed to mitigate the effects of the sun. The building
forms a C shape as indicated in Figure 1 below with tinted windows right around except along
CD. Little or no direct sunlight reaches the inner part of the C due to the architectural design.
The mitigation of solar gain in terms of building design is clearly evidenced here, especially in
the morning when direct sunlight reaches this side of the building. As a result, heat transfers
from the sun’s radiation, into the building, is limited and controlled.
This single office block consists of 9 levels of office space and 3 underground parking bay levels
with an office area of approximately 760 m2 per floor (treated area, excluding kitchens and
toilets). Overhangs of approximately 1,5 m exists along the outside of the building on each of
the office levels (see Figure 2). Furthermore, along face EF of the building, additional tinted
windows angled to filter the sun’s radiation are fitted on the overhang of each level.
Figure 1: Pictorial Diagram of Building Shape
The building is used for administrative purposes only and is occupied Mondays to Fridays,
usually between 8.00 am and 5.00 pm. Currently levels 2 to 8 are occupied. The two lower
levels 2 and 3 are a good indicator of the previous usage of the building. Various companies
occupy these levels. For this part of the building a central drop down ceiling is used to house
the HVAC ducts that distribute air to offices on either side of the corridor. Many localized air
conditioning systems were also used, probably as a result of the central system falling into
disrepair.
E
C D
North
F

- 3 -
Figure 2: The Building Viewed from Vermeulen Street

- 4 -
The layout is mainly open-plan for levels 4 to 6. Level 7 is divided into a number of private
offices and level 8 has mainly conference rooms. Dropped ceilings have been added to the full
width of the floors.
3. BUILDING SERVICES
3.1 Lighting
The following description applies to the NER offices. Floors 2 and 3 have mainly the older type
of fluorescent lamp fittings. Table 2 shows the type and number of light fittings.
Three types of light fittings are used in the building. These include the following:
Halogen stream lights are installed along the longitudinal centreline of each of floors 4 to
8. Each of these fittings has its own 50 Watt, 12 Volt transformer. There is an average of
60 installations per floor.
Fluorescent lights with three T8, 40 Watt tubes per fitting. Magnetic ballasts are used.
There are approximately 50 of these fittings on each level. In the basement each fitting
has two T12, 40 Watt tubes with a total of 82 fittings.
Incandescent light fittings are mainly used on the outside of the building. Under the
outside overhangs a total of 88 such fittings were counted. A further 17 of these fittings
were counted in the centre garden and other outside areas.
Other light fittings include the energy efficiency compact fluorescent lamps (CFL) with two
13 Watt bulbs in each fitting. Approximately 20 of these are installed per floor level
Two switches control the lights on each floor, one switch per wing on each level. These lights
were found to be on day, night and over the weekend. The building is not used at night or at
weekends.
Table 2: Lighting Distribution
TYPE OF
FIXTURE
NUMBER OF
LAMPS PER
FIXTURE
WATTS
PER
LAMP
BALLAST
TYPE
TOTAL NUMBER
OF FIXTURES
PER FLOOR
NUMBER
OF
FLOORS
TOTAL
Fluorescent Lights (T8)
3 40 W Magnetic 50 7 1050
Fluorescent Lights (T12)
2 40 W Magnetic 88
Incandescent 1 100 W 105
Halogen Stream Lights
1 50 W, 12 V 60 5 300
Compact Fluorescents
2 13 W 20 5 200
The total energy consumed by the above mentioned fittings is 418 114.8 kWh/yr, or 110 kWh/m2
per yr. This compares with reference[1] 27-54 kWh/m2 per yr for which the lights are only on
during working hours.

- 5 -
3.2 Heating, Ventilation and Air Conditioning (HVAC)
The major components of the HVAC system are shown in Table 3.
Table 3: Inventory of HVAC equipment
DESCRIPTION NO. OF
COMPONENTS
MOTOR
RATING
REMARKS
Chillers (UW80EGSYE) 3 60 kW Rated capacity ~235kW ea.
Primary chilled water pump 3 3 kW
Secondary chilled water pump 2 15 kW
Condenser water pump 2 18.5 kW
Return Air Fans 2 17 A
Air Handling Unit 1 1 30 kW Inlet guide vanes fully open
Air Handling Unit 2 1 11 kW Inlet guide vanes fully open
Air Handling Unit 3 1 18.5 kW Inlet guide vanes fully open
Air Handling Unit 4 1 15 kW Inlet guide vanes fully open
Exhaust air fan 3 1.5 kW
Exhaust air fan 1 3 kW
Exhaust air fan 1 1.1 kW
Cooling Tower 1 2 kW Estimated
Roof Extract 1 3 kW
Roof Extract 1 0.37 kW
(It should be noted that heaters are indicated on the control panel but they could not be located
in the air handling units or the plant room ducting)
It must also be noted that system drawings and manuals could not be made available to us.
Comments are, therefore, based on experience and judgment of what could be seen.
We calculated the cooling requirements of the building based on our observations and the
information the hand. The required cooling capacity is approximately 500 kW, or approximately
90W/m2, taken over seven floors. We examined the monthly load profile and concluded that
that the equivalent hours of operation of the chillers at full load would be approximately 2200
per year. This results in a compressor energy consumption of about 50W/m2 on the assumption
that the coefficient of performance is 4. The installed chiller capacity is approximately 40%
greater than the design cooling requirement.
3.2.1 Description of System
The office space (floors 2 to 8) is served by a variable volume (VAV) air conditioning system,
supplied by a central plant located in the lower basement.
Toilets are located on each landing of the stairs. The doors to the stairwell are louvered but
there is no air extraction from the toilets, although there appears to be an extract fan at roof
level drawing from the masonry shaft immediately adjacent to the toilets.

- 6 -
There are also disabled-person toilets on the recently refurbished floors which have no apparent
extraction, neither are the doors louvered for inlet air.
There is a small fan at roof level at the top of the stairwell that was possibly intended for smoke
extraction.
Some fume extraction fans remain at roof level. They are not operational and originally served
the fume cupboards on level 2 used by previous occupants.
The cooking areas on the lower floors have extraction systems but these no longer function.
The original system air outlets are both of the ceiling diffuser and sidewall outlet type. There
are no identifying labels, however, they appear to be of the type manufactured by Ventline.
These units are still in place on levels 2 and 3 in general office areas that were not refurbished.
Only a handful of people occupy levels 2 and 3 while the NER occupies levels 4 to 8. The
refurbished (NER) offices have been fitted with Rickard VAV diffusers that are similar in
principle to the original units manufactured by Ventline.
The air conditioning system that serves levels 2 and 3 is in poor condition. This would
adversely affect the operation in the rest of the building.
The controls in the plant room have been mechanically disabled to the extent that the system
can no longer function in its designed VAV mode. It is likely that the electrical side of the control
system does not function, given the general state of decline in the plant room.
It is not possible to tell (there was no operational evidence and neither could drawings and
manuals be made available to us) whether an “economy cycle” was designed into the original
control philosophy. This is an aid to energy efficiency that removes the need for mechanical
(refrigerated) cooling during times when the external air temperature is low enough to satisfy the
building needs.
At present, the return air dampers are fixed in a position that allows only a little outdoor air into
the building (see also section on occupant survey). It seems as if the dampers were set to
minimize the cost of heating during the winter period.
The chillers never ran while we were present, yet there was clearly a demand in the building for
cooling. However, the fans ran day, night and over the weekend.
The boardroom on level 8 had some air outlets directed vertically downwards. These are not
conventional air outlets and would result in cold drafts once the chillers operate.
3.2.2 Room Conditions
We measured a typical space temperature on the sixth level to find a variation between 25oC
before lunch to about 27oC in the afternoon. The lower temperature is a little above the usual
summer set point of 24oC while the higher one is reaching the limit of comfort, particularly in
view of the low relative humidity which we estimated at below 25%.

- 7 -
At the time of testing, the external temperature remained constant at about 22oC. The supply
air temperature from the diffusers was 24oC while the design temperature would have been
about 13oC for a system without an economy cycle. Conditions on levels 2 and 3 were not
measured, given that the system was visibly not in a good state.
The total connected power for these major items amounts to approximately 326 kW. The daily
energy consumption would vary from about 3200 kWh in the height of summer to about
1400 kWh in mid winter (12 hour day).
3.3 Domestic Hot Water Heating
A D350 model geyser with an estimated capacity of over 1000 litres provides hot water for the
whole building. This is an 18 kW, 40 A, three-phase geyser. The geyser and piping are
insulated. However, the piping in the riser to the floors would benefit from re-insulation
3.4 Office Equipment
Table 4 shows the items on each floor. The Annual Hours of Usage column is an estimate of
the use of each item.
Table 4: List of Office Equipment and Staff count per level
LEVEL 4 5 6 7 8 TOTAL ANNUAL
HOURS
OF
USAGE
ANNUAL
kWH
Number of staff 28 20 19 18 3 88
Printers (1 300 Watt) 0 5 0 2 0 7 2000 18 200
Photocopier (1000 Watt) 2 2 2 1 1 8 2000 16 000
Fax (655 Watt) 2 2 2 7 1 14 2000 18 340
Telephone 28 20 19 18 8 93
PC (500 Watt) 28 20 27 18 5 98 2000 98 000
Scanner (250 Watt) 0 0 1 0 0 1 2000 500
Television (500 Watt) 0 0 1 0 0 1 100 50
Coffee Maker (1000 Watt) 1 1 1 1 1 5 2000 10 000
Microwave oven (900 Watt) 1 1 1 1 1 5 250 1 125
Fridge (250 Watt) 1 1 1 1 1 5 2000 2 500
Kettle (1000 Watt) 1 1 1 1 1 5 1000 5 000
Stove (3000 Watt) 0 0 0 1 1 2 100 600
Oven (3000 Watt) 0 0 0 1 1 2 100 600
TOTAL 170 915
The specific energy consumption for the above table is approximately 45 kWh/m2per yr and
compares with the range 28–37 kWh/m2 per yr[1].

- 8 -
4. ENERGY ACCOUNTING
4.1 Energy Management
An essential component of any energy management program is a continuing account of energy
use and its cost. Keeping up-to-date records of monthly energy consumption and associated
costs can develop this. When utility bills are received, the energy use and costs should be
recorded as soon as possible.
There was no maintenance or energy monitoring plan in place at the time of this audit.
However, we know that the NER is moving in this direction.
Benchmark data for buildings in South is not in the public domain. Reference to (appropriate)
foreign and local anecdotal data yield the following key figures as shown in Table 5 below.
Table 5: Benchmark Energy Values (kWh/m2-yr)
TYPICAL GOOD PRACTICE
Overall 258 Unknown
Lighting 54 27
Small power 31 23
Hot water 10 4
Note that the overall figure of 258 kWh/m2 per year was obtained from a very similar building in
the same street.
4.2 Electricity Bill
The NER building is currently billed monthly using the rate schedule presented below:
R 296.47 Monthly customer charge
R 49.22 Capacity charge for each kW of billing demand
10.68 c Energy charge per kWh
The electricity tariffs on the actual electricity account of the NER building are different to those
specified on the Tshwane Metropolitan Municipality website (see Appendix 10.2). The reason
for the discrepancy between published rates and actual account rates could not be established,
despite the conversation described below. Our experience is that staff at the municipality are
not able to explain their own tariff.
To get clarity on the matter, ERI contacted the Tshwane Metropolitan municipality[2] at
(012) 308 8550. The person spoken to is Mr Rider Moyeni who was very helpful and patient
throughout the conversation. The questions involved the account dated for July 2002. On his
screen the following details are reflected:

- 9 -
Energy consumption has two readings which amounts to 124 558 and 73 812 and adds to
198 370. The previous reading on the account is 174 528 and the current reading is
194 365 which amounts to a total consumption of 19 837.
Basic fixed charges are R 114.38 and R 182.09, which amounts to R296.47 in total.
No demand or electricity unit charge reflects on the system. As this was the limit to which he
could assist me in understanding the electricity consumption bill, he referred me to Ms Annetjie
Engelbrecht at (012) 308 8240. This number just rings and since Ms Engelbrecht could not be
reached, clarity on the outstanding issues cannot be deduced.
The following is an example of the determination of the electric charges at the building for the
month of July 2002:
Billed Demand = 441 kVA
Energy Consumed = 198 370 kWh
Customer Charge: R 296.47
Demand Charge: 441 kVA @ R 49.22/kVA R 21 707.05
Energy Charge: 198370 kWh @ R 10.68c/kWh R 21 194.68
14% VAT: R 6 047.75
Total Electricity Charge: Customer Charge + Demand Charges + Energy Charges + VAT R 49 245.95
4.3 Energy Usage and Cost
Electric energy usage, demand, and costs for April, May and July 2002 are presented in Table 6
below. These were the only accounts given to us.
Table 6: Electric Usage, Demand and Cost Summary
ENERGY BILLED POWER ENERGY DEMAND VAT TOTAL
MONTH CONSUMED DEMAND FACTOR CHARGE CHARGE CHARGES CHARGES
(kWh) (kVA) (%) (R) (R) (R) (R)
April 2002 298,320 493 88.4 31,174.44 24,176.72 7,789.76 63,430.92
May 2002 137,440 438 87.1 14,362.48 21,479.52 5,058.48 41,198.49
July 2002 198,370 441 86.3 21,194.68 21,707.05 6,047.75 49,245.95
TOTALS 634,130 1,372 66,731.60 67,363.29 18,895.99 153,875.36
AVERAGE 211,376 457 87.0 22,243.87 22,454.43 6,298.66 51,291.79
4.4 Avoided Cost of Electrical Energy
The avoided cost of electrical energy for this plant is: = 10.68c/kWh
4.5 Avoided Cost of Electrical Demand
The avoided cost of electrical demand for this plant is: = R 49.22/kVA

- 10 -
5. ENERGY CONSERVATION OPPORTUNITIES
5.1 Install High Efficiency Lighting
The methodology developed by the Industrial Assessment Centre is used here[3].
ECO 2: Case 1: Reduce operating hours of lights to 12 hours per day.
Note that to implement this recommendation does not cost a cent. The lights can be switched
off by the security personnel after hours and switched on by staff as they return to the office the
following morning.
Estimated Electric Energy Conservation = 286 277 kWh/yr
Estimated Electric Energy Cost Savings = R 30 576/yr
Estimated Electric Demand Reduction = 0 kW
Estimated Electric Demand Cost Savings = R 0.00/yr
Estimated Total Cost Savings = R 30 576/yr
Estimated Implementation Cost = R 0.00
Simple Payback Period = 0 years
ECO 2: Case 2: Replace T-12 fluorescent lamps and incandescent lamps with T-8
fluorescent lamps and compact fluorescent lamps respectively.
Note that this is a stand alone option which assumes that the lights remain on 24 hours per day.
Estimated Electric Energy Conservation = 86 741 kWh/yr
Estimated Electric Energy Cost Savings = R 9 264/yr
Estimated Electric Demand Reduction = 9.9 kW
Estimated Electric Demand Cost Savings = R 5 848/yr
Estimated Total Cost Savings = R 15 113/yr
Estimated Implementation Cost = R 21 123
Simple Payback Period = 1.4 years
ECO 3: Case 3: Switch off halogen stream lights.
Note that this is a stand alone option which assumes that the lights remain on 24 hours per day.
Estimated Electric Energy Conservation = 173 448 kWh/yr
Estimated Electric Energy Cost Savings = R 18 524/yr
Estimated Electric Demand Reduction = 19.8 kW
Estimated Electric Demand Cost Savings = R 11695/yr
Estimated Total Cost Savings = R 30 219/yr
Estimated Implementation Cost = R 24 200
Simple Payback Period = 0.8 years

- 11 -
ECO 4: Case 4: Case 1 + Case 2 + Case 3
Note that the energy savings for Cases 2 and 3 must now be halved as they were based on
24 hour operation.
Estimated Electric Energy Conservation = 416 372 kWh/yr
Estimated Electric Energy Cost Savings = R 44 468/yr
Estimated Electric Demand Reduction = 29.7 kW
Estimated Electric Demand Cost Savings = R 17 542/yr
Estimated Total Cost Savings = R 62 010/yr
Estimated Implementation Cost = R 45 323
Simple Payback Period = 0.7 years
5.1.1 Recommended Action
(i) Replace the existing four-foot T-12 lamps and magnetic ballasts with high-efficiency
(lower wattage) lamps and electronic ballasts. High efficiency lamps use less energy than
standard lamps with comparable light output.
(ii) Replace the existing incandescent lamps with high-efficiency compact fluorescent lamps.
(iii) Switch off office lighting after hours and over weekends.
(iv) Install more switches per floor per wing.
A switch for each side of the building on each floor for the stream lights, which amounts to
two additional switches per floor. The luminance on floor levels 4 to 7 is significantly
above the specified requirements. These stream lights can be switched off during the day
and can be utilized as passage lights after hours.
A switch for the fluorescent fixtures on each side of the passage per wing per floor, which
amounts to four additional switches per floor. This allows control of the floor lighting as
required.
A switch for the lights in each conference room. Additional switches can be added if
different types of light fixtures exist in a unit.
A switch for each set of compact fluorescent lights.
5.1.2 Background
(i) Electronic ballasts are currently available which when used with the proper 32W T-8
fluorescent lamps (the T rating refers to lamp tube diameter in 1/8ths of an inch) provide a
very high quality light while using significantly less energy than the existing magnetic
ballasts and 40W T-12 fluorescent lamps. The T-8 lamps provide a high quality light that
renders colour significantly better than the existing T-12 lamps thus providing excellent
lighting for offices. All of the four-foot fluorescent lamps and ballasts in the office space
could be replaced with T-8 lamps and electronic ballasts. An added benefit of electronic
ballasts is the high frequency at which they operate, eliminating the flicker often
associated with standard fluorescent lighting. In addition, electronic ballasts are available
that operate four lamps; therefore, a four lamp fixture that previously required two
magnetic ballasts operating two T-12 lamps each can utilize a single electronic ballast
operating all four T-8 lamps.

- 12 -
(ii) Incandescent lamps are thermal radiators. In an enclosed bulb filled with gas, an electric
current is passed through a filament of tungsten wire to make it glow. Approximately 5%
of the energy consumed is converted into light; the rest is lost to heat. Incandescent lights
can last up to 1000 hours on average. Fluorescent lights consume approximately a fifth
of the electricity that an incandescent lamp uses. Furthermore, compact fluorescent
lamps have a life span of almost 12 000 hours.
5.1.3 Anticipated Savings
Lighting fixture identification codes and corresponding fixture specifications are given in Table 7.
The power ratings used in the following equations are found in the "Fixture Power" column. The
fixture power is the combined ballast and lamp power draw. Table 8 provides the existing
lighting characteristics as determined from the lighting survey conducted during the audit visit.
The values in Table 9 are projections based on the replacement of these lamp/ballast
combinations with suitable high efficiency lamp/ballast combinations.
Table 7: Lighting Fixture Codes and Specifications
BALLAST/ LAMPS LAMP BALLASTS FIXTURE LAMP TOTAL
LAMP PER POWER LAMP PER BALLAST POWER LIFE LAMP
CODE FIXTURE (W) WIDTH FIXTURE TYPE (W) (HOURS) COST
1 2 40 T12 1 Magnetic 87 12000 R 35.00
2 3 40 T8 2 Magnetic 120 12000 R 40.00
3 2 13 CFL N/A 26 12000 R 30.00
4 2 32 T8 1 Electronic 61 12000 R 40.00
The estimated energy conservation, EC, and energy cost savings, ECS, for replacement of the
lamp/ballasts in a specific area are given by the following relations:
EC = N x (CFW - PFW) x H
1C
ECS = EC x effective energy rate
where,
N = number of fixtures in area
CFW = power rating of current fixtures in area, W
PFW = power rating of proposed fixtures in area, W
H = operating hours of lamp in area, h/yr
C1 = conversion constant, 1,000 W/kW

- 13 -
As an example, the estimated energy savings and energy cost savings for replacing all the 40W
T-12 lamps and magnetic ballasts in the parking area with 32W T-8 lamps and electronic
ballasts are calculated as follows:
994.63/yr R1 = .68c/kWh)kWh/yr)(10 (18,676.32 = ECS
kWh/yr 18,676.32 = 1,000
61)(8760) - (82)(87 = EC
The energy conservation for reducing the operating hours of the T12-lamp is as follows:
337.17/yr R3 = .68c/kWh)kWh/yr)(10 (31,246 = ECS
kWh/yr 31,246 = 1,000
4380)-)(8760 (82)(87 = EC
Suppose the T12-lamps are replaced and the operating hours are reduced simultaneously then
the total energy conservation amounts to 40,584.16 kWh/yr and energy cost savings of
R 4 334.39 in total.
The following relations give the demand reduction, DR, and demand cost savings, DCS,
associated with replacement of the lamp/ballasts in a specific area:
rate demand effectivex 2
Cx DR = DCS
C1
CFx PFW) - (CFWx N = DR
where,
CF = coincidence factor - probability that the equipment contributes to the facility
peak demand, per month
C2 = conversion constant, 12 months/yr
Continuing the example above, the lights will likely be operating at their rated power when the
peak demand is set each month, so CF = 1.0/month. Thus, the demand reduction and demand
cost savings for the receiving area are calculated as follows:
yrR1,259.24/ = .22/kW)mo/yr)(R49 kW/yr)(12 (2.13 = DCS
kW/mo 2.13 = 1,000
61)(1.0) - (82)(87 = DR

- 14 -
Energy conservation and demand reduction for lamp/ballast combinations in the other plant
areas are given in Table 8. Energy cost savings, demand cost savings and total cost savings
are given in Table 9.
Table 8: Annual Energy Usage
Level Type of
Lighting
Replacement light
Power Number
Of
Fixtures
Power Current
Usage
time
12-hour
Usage
time
Potential
Demand
Reduction
Current
Energy
usage
12-hour
Energy usage
(W) (kW) (h/yr) (h/yr) kW/mo (kWh/yr) (kWh/yr)
8 Fluorescent (T8)
120 35 4.2 8760 4380 36792 18,396
Halogen Stream Lights
50 140 7 8760 4380 7 61320 30,660
Compact Fluorescent
26 18 0.47 8760 4380 4099.68 2,050
7 Fluorescent (T8)
120 32 3.84 8760 4380 33638.4 16,819
Halogen Stream Lights
50 65 3.25 8760 4380 3.25 28470 14,235
Compact Fluorescent
26 28 0.73 8760 4380 6377.28 3,189
6 Fluorescent (T8)
120 50 6 8760 4380 52560 26,280
Halogen Stream Lights
50 61 3.05 8760 4380 3.05 26718 13,359
Compact Fluorescent
26 17 0.44 8760 4380 3871.92 1,936
5 Fluorescent (T8)
120 42 5.04 8760 4380 44150.4 22,075
Halogen Stream Lights
50 62 3.1 8760 4380 37.2 27156 13,578
Compact Fluorescent
26 20 0.52 8760 4380 4555.2 2,278
4 Fluorescent (T8)
120 54 6.48 8760 4380 56764.8 28,382
Halogen
Stream Lights
50 68 3.4 8760 4380 3.4 29784 14,892
Compact
Fluorescent
26 8 0.21 8760 4380 1822.08 911
Parking Fluorescent (T12)
Fluorescent (T8) with Electronic Ballast
87 82 7.134 8760 4380 2.13 62493.84 31,247
Outside Incandescent CFL 100 105 10.5 8760 4,380 7.7 91 980 45,990
TOTALS 65.36 572 553 286 277

- 15 -
Table 9: Cost Reduction
Level Type of Lighting
Replacement
Light
1Case 1
2Case 2
3Case 3
Energy Cost
Reduction (ZAR)
Energy Cost
Reduction (ZAR)
Demand Cost
Saving (ZAR)
Total Cost
Savings (ZAR)
Energy Cost
Reduction (ZAR)
Demand Cost
Saving (ZAR)
Total Cost
Saving (ZAR)
8 Fluorescent (T8)
1964.69
Halogen Stream Lights
3274.49
6548.98 4134.48 10683.46
Compact Fluorescent
219.86
7 Fluorescent (T8)
1796.29
Halogen Stream Lights
1520.30
3040.60 1919.58 4960.18
Compact Fluorescent
341.48
6 Fluorescent (T8)
2806.70
Halogen Stream Lights
1426.74
2853.48 1801.45 4654.93
Compact Fluorescent
205.82
5 Fluorescent (T8)
2357.63
Halogen Stream Lights
1450.13
2900.26 1830.98 4731.24
Compact Fluorescent
243.25
4 Fluorescent (T8)
3031.24
Halogen Stream Lights
1590.47
3180.93 2008.18 5189.11
Compact Fluorescent
98.23
Parking Fluorescent (T12)
Fluorescent (T8) with
Electronic Ballast
3337.18 1994.63 1259.24 3253.87
Outside Incandescent CFL 4911.73 7269.36 4589.27 11858.63
TOTALS 30576.23 9263.99 5 848.51 15112.50 18524.25 11694.67 30218.92
1 Case 1: From the energy audit it was found that the lights are on 24 hours a day including weekends.
Case 1 proposes that lights should be switch off after hours. The calculations are based on a 12-hour period for lights to be on.
2 Case 2: Replace incandescent light fixtures and T-12 fluorescent lights with compact fluorescent
lights and T-8 fluorescent lights respectively. 3 Case 3: Switch off halogen lamps.

- 16 -
5.1.4 Implementation Costs
Case 2:
The implementation cost for this recommendation includes the equipment and labour costs
required for the new lamps. Labour costs for replacing the T-12s with T-8s are estimated at
6 minutes per lamp at a rate of R140/hour. The cost of the lamp is estimated at R40 each.
Resulting Implementation Cost:
= 164 lamps x R40 + 6/60 hour x 164 x R140/hour
= R 6 560 + R 2 296
= R 8 856
Labour costs for replacing the 105 incandescent fixtures with 2 times 13 W compact fluorescent
lamps per fixture are estimated at 6 minutes per lamp and 30 min per fixture at a rate of
R140/hour. The cost of the lamp is estimated at R30 each and fixture R160.
Resulting Implementation Cost:
=105 x 2 x R30 + 6/60 x 210 x R140 +105 x R160 + 0.5 x 10⁵ x R140
= R 6 300 + R 2 940 + R 16 800 + R 7 350
= R 33 390
It is reasonable to assume that lamps would be replaced as a matter of course in a
maintenance programme and that all the replacement cost should not be borne by the energy
efficiency exercise. An equal split between these two costs centres gives a
Total Implementation Cost = 0.5 x (R 8 856 + R 33 390) = R 21 123
Case 3:
A labour cost for installing light switches is estimated at 11/2 hour per switch at a rate of
R140 /hour. It is estimated that approximately 110 switches are required. The cost of the
switch is estimated at R10.
Resulting Implementation Cost
=110 x R10 + 110 x 1.5 x R140
= R 1 100 + R 23 100
= R 24 200
5.2 Adopt a Good Building Maintenance Strategy
Effective maintenance contributes to the realization of an energy efficient building by ensuring
the efficient operation of systems and equipment. In addition it improves the useful life of the
plant. The maintenance of the NER building requires a great deal of attention. The following is
recommended to improve the maintenance of the building.
Develop a maintenance policy. This should be co-ordinated with the support of top
management.

- 17 -
Consider good practice measures for reactive and planned preventative maintenance.
If building maintenance is contracted out then the maintenance contract should include
clear explanations of operational responsibilities and standards.
The performance specification should include budgets, levels of service, responsibilities,
reporting procedures and policies such as energy, health and safety.
Monitoring maintenance is important to ensure value for money and to identify any
changes in the policy that need to be made.
A maintenance strategy is not an additional cost item. It is a discipline that ensures that
sufficient correct procedures are carried out timeously to protect an expensive asset.
5.3 Implement a Building Management System
Estimated Electric Energy Conservation = 250 – 500 000 kWh/yr
Estimated Electric Energy Cost Savings = R 27 – 54 000/yr
Estimated Electric Demand Reduction = 548.4 kW/yr
Estimated Electric Demand Cost Savings = R 26 992.25/yr
Estimated Total Cost Savings = R 54 – 108 000/yr
Estimated Implementation Cost = R 300 000
Simple Payback = 5.55 – 2.78 years
A building management system (BMS) can significantly improve the overall management and
performance of the building, promoting a holistic approach to controls and providing operational
feedback. Energy savings of 10–20%[4] can be achieved by installing a BMS compared with
independent controllers for each system.
The monitoring facilities of a BMS allow building status, environmental conditions and energy to
be monitored, providing the building operator with a real-time understanding of how the building
is operating. This can often lead to the identification of problems that may have gone
unnoticed, for example, high energy usage. Energy meters connected to the BMS system allow
real-time energy consumption to be monitored and tracked. This provides a historical record of
the building’s energy performance that can be logged and analysed as required both
numerically and graphically.
The BMS can improve management information by trend logging performance, benefiting
forward planning and costing. This can also encourage greater awareness of energy efficiency
among staff.
Alarms are also monitored providing instantaneous indications and records that the plant
(HVAC) has shut down, maintenance is required, or environmental conditions are outside
specified limits.
BMS that integrate security, access control and lighting control are now available. These can,
where appropriate, reduce the total cost of incorporating a range of services and hence assist to
justify additional cost.

- 18 -
A building management system can cost between R 50 000 and R 100 000, depending on the
functionality required.
5.4 Upgrading and Tuning HVAC Controls
Estimated Electric Energy Conservation = 380 476.80 kWh/yr
Estimated Electric Energy Cost Savings = R 40 634.92/yr
Estimated Electric Demand Reduction = 822.6 kW/yr
Estimated Electric Demand Cost Savings = R 40 488.37/yr
Estimated Total Cost Savings = R 81 123.29/yr
Estimated Implementation Cost = R 75 000
Simple Payback = 0.92 years
Important control functions are listed below.
Time Controls:
Set time switches in relation to occupancy and use of the service.
Introduce time switches on energy using equipment as required.
Plant capacity controls:
Introduce sequence controls where appropriate and check that the sequence
selection of the heaters and chillers provides a minimum output matched to the load.
Introduce standard controls to reduce excessive plant cycling.
Introduce variable speed drives where appropriate for central plant fans and pumps.
5.4.1 Background
The choice of controls has a direct effect on the operation and energy consumption of a
building. Pneumatic controls were used widely in large buildings until the early 1980s. At that
time they could provide relatively complex control strategies at low cost. They are still common,
however with recent applications they are likely to have been replaced.
In the case of the NER building little or no controls exist. The potential energy savings of
between 15–25%[4] can be obtained if proper controls are installed within the building.
5.5 Air Conditioning System
The condition of the system is such that an energy audit is not possible. The control philosophy
is not known and can only be assumed. In addition, lack of operation of the chillers and other
elements in the plant room mean that the building has, in all probability, been operating below
its expected energy consumption, despite a control system that is clearly not providing energy
efficient operation.
However, we must point out that the VAV system is potentially a very energy efficient central
system and would readily lend itself to fine-tuning to bring about still more efficiency if this has
not been built in from the start.

- 19 -
The CSIR and Richard Pearce & Partners have indicated that a standard building in the
Gauteng region would have a design cooling load of around 100W/m2 while an energy efficient
one would be approximately 80W/m2. Preliminary calculations for the Vermeulen Street building
result in a cooling load of close to 90W/m2, indicating the inherent good qualities of the building
and its system. A good control system would translate this power requirement into economical
energy operation.
It is recommended that an experienced consulting engineer be appointed to evaluate the HVAC
system, including the controls. The engineer should be asked to provide a design and costs for
repair and upgrade, with due regard for energy efficient operation.
5.6 Domestic Hot Water Heating
The hot water to the taps is currently supplied from an electrically heated storage vessel in the
basement. The electrical energy appears to be available at all times, i.e. there is no
arrangement to heat the water with a cheap night tariff.
The capacity of the vessels appears to be in excess of 1000 litres, which is much more than that
needed by 100 office staff. The latest tariff option for night operation is 6.36 cents per kilowatt-
hour, or 60% of the day rate. In addition, the Tshwane tariff rules give them the option to
impose a conversion charge, should their study confirm a financial gain to the customer, and
there is an increase of tariff to 24.38 cents per kilowatt-hour during the hours 07.00 to 10.00.
The fans and pumps operating during this time require more than 100 kW.
British Gas research shows that office workers require approximately 10 litres of hot water each
per day, excluding catering. One hundred people drawing this volume for 250 working days per
year would require 250 000 litres per annum. This costs approximately R1500 per year and is
not worth considering further since much more would be lost on operating fans and pumps
during the high rate period.
5.7 Variable Speed Drivers
The major fans are of the variable speed type while the compressors load and unload according
to the capacity requirements induced by the weather. Exhaust and extract air fans are required
to run at a constant speed which leaves only the secondary chilled water pump (15 kW) and the
condenser water pump (18.5 kW) as possible opportunities for variable speed drives. Taken
together these motors would absorb less than 400 kWh per day, or less than 80 000 kWh per
year. A 20% reduction in energy would amount to about R 1 700 saving per year, an insufficient
amount to consider changing motors before they fail.
6. COMFORT AUDIT
Personnel comfort plays an integral role in the productivity levels of any company. Comfort in
itself is described as the state in which the average person expresses satisfaction with the
working environment. The field of ergonomics focuses a great deal on personnel comfort. In

- 20 -
particular, poor indoor conditions are one of the main contributors of Sick Building Syndrome
(SBS). The World Health Organisation (WHO) defines this as “ailments that are suffered while
people are inside a particular building and which eases as they leave”.
A building is the cause of SBS if many of the occupants experience one or more of the following
symptoms: headache, runny nose, fatigue, eye irritation, difficult breathing, sinus problems,
congestion, sneezing, nausea, sore throat and stuffy smells.
These symptoms are the result of one or a combination of factors such as inadequate indoor air
temperatures, inadequate relative humidity levels, poor indoor air quality, and insufficient
lighting. Other factor such as work stress and personal problems can also contribute to these
symptoms. It is therefore necessary to take measurement in order to assess indoor comfort
levels.
Personnel comfort is an ancillary of an energy audit and for the above reasons it is seen fit to
include it as part of this building energy audit. A quantitative approach was adopted to asses
comfort levels within the building. This included the distribution of a questionnaire and other
appropriate measurement of the indoor light intensity levels and temperatures.
6.1 Results
Questionnaires (see Appendix 10.4) were distributed to all staff members with a total head
count of 88. A total of 35 questionnaires were returned which amounts to approximately 40%.
Of these 60% were returned by female staff members and 40% by male staff members.
6.1.1 Indoor Temperatures
The results from the questionnaire with respect to indoor temperatures experienced by staff
members are reflected in Table 10 below. Relative to the day the questionnaire was distributed
it is found that 51% found the indoor temperature to be hot, 31% found it to be acceptable 11%
indicated that it is hot and cold, and 7% found it to be cold. The 11% that indicated that it was
both hot and cold, said that it was hot in summer and cold in winter. This is in line with the
expected outcome if the study were to be conducted for each season.
The actual measured temperatures (Table 11) ranged from 25oC at noon to 27oC at
approximately 15h00. This is above the generally accepted comfortable indoor temperature
range of between 22oC and 24oC.
Table 10: Comfort Audit - Temperature
COLD HOT BOTH ACCEPTABLE
Female 0 13 1 7
Male 2 5 3 4
Total 2 18 4 11
Percentage 7% 51% 11% 31%

- 21 -
Table 11: Measured Temperatures
TEMPERATURE
(OC)
TIME
External Shade Air Temperature 22oC 12:15
External Shade Air Temperature 22oC 15:10
6th Floor Room 25
oC 12:25
6th Floor Supply Air 24
oC 12:25
6th Floor Supply Air 26
oC 13:00
8th Floor Room 25
oC 13:10
8th Floor Room 27
oC 14:55
6.1.2 Relative Humidity
Humidity gives an indication of the moisture level of the air. It is found that humidity levels
below 40% are associated with bacteria growth, respiratory infections and increased allergic
reactions. Humidity levels above 60% cause an increase in mould, dust mites, allergic
reactions and chemical interactions. The humidity comfort zone is set between 40% and 60%.
From Table 12 below it can be seen that 46% experience the air to be dry and 40% found the
humidity acceptable.
Table 12: Comfort Audit - Humidity
DRY ACCEPTABLE HUMID
Female 11 8 4
Male 5 6 1
Total 16 14 5
Percentage 46% 40% 14%
6.1.3 Light Intensity Levels
Almost 80% of our sensory information at work is through our eyes. It is therefore necessary to
have good lighting. The lighting intensity must be around 300 to 500 Lux. From Table 13 below
it can be seen that 89% of the building occupants find the lighting level acceptable.
From the measurements it can be seen that the light intensity within the building is above that
normally recommended. This is also true for the case where all the blinds are closed and all
lights are switched off. Table 14 gives the measured values under different conditions.

- 22 -
Table 13: Comfort Audit - Lighting
DIM ACCEPTABLE BRIGHT
Female 0 18 3
Male 1 13 0
Total 1 31 3
Percentage 2% 89% 9%
Table 14: Light Intensity Measurements
DISTANCE
FROM
WINDOW
(M)
LIGHT INTENSITY
(LUX)
UNDER LIGHT
FIXTURE
BLINDS CLOSED
LIGHT INTENSITY
(LUX)
UNDER LIGHT
FIXTURE
BLINDS OPEN
LIGHT INTENSITY
(LUX)
BETWEEN LIGHT
FIXTURES
BLINDS CLOSED
LIGHT INTENSITY
(LUX)
BETWEEN LIGHT
FIXTURES
BLINDS OPEN
LIGHT INTENSITY
(LUX)
BLINDS OPEN
LIGHTS OFF
LIGHT INTENSITY
(LUX)
BLINDS CLOSED
LIGHTS OFF
1 780 >1000 500 >1000 >1000 >1000
1.8 720 >1000 420 >1000 >1000 >1000
4.5 400 760 500 640 640 380
6.1.4 Air Movement
The air movement within the building plays an important role in maintaining thermal comfort as it
influences the rate of evaporation on the skin of occupants. Air movement that is too high
causes unpleasant draughts. Acceptable airflow rates for office buildings are between 4 to
6 l/s/m2. Table 15 below shows 80% of the building occupants found the airflow to be low. This
is in line with the results with regard to lack of fresh air where 77% of the occupants found that
there is a lack of fresh air, as detailed in Table 16.
Table 15: Comfort Audit - Air Movement
LOW ACCEPTABLE HIGH
Female 19 2 0
Male 9 4 1
Total 28 6 1
Percentage 80% 17% 3%
Table 16: Comfort Audit - Lack of Fresh Air
YES NO
Female 16 5
Male 11 3
Total 27 8
Percentage 77% 23%

- 23 -
7. DISCUSSION, RECOMMENDATIONS AND FURTHER ACTIONS
The calculations in this report are based on estimated costs from know reputable suppliers.
They do not reflect amounts tendered in competition against detailed specifications and it is
therefore recommended that, before any of these energy conservation opportunities are
implemented, actual quotations from different relevant companies be obtained to establish
actual implementation cost.
In particular for the maintenance and upgrading of the HVAC, controls and building
management system it is recommended that a suitably experienced consulting engineer be
appointed to cost and design improvements with due regard to energy efficiency.
For the replacement of lights, light fixtures and additional switches it is further recommended to
get quotations from an electrical company or to renegotiate contract with the current company
responsible for the renovations.
Budgets might already exist for the implementation for some or all of the ECO’s via the
renovation budget. Thus before requesting funding for the implementation phase, make sure
that possible available funds do not exist.
Clearly the current building renovation plan plays a vital role in the future building upgrade plan.
It is therefore important to communicate the current energy efficiency opportunity findings with
the renovators.
Our research has shown a significant lack in useful data for rapidly benchmarking building
energy use. It is recommended that the DME extend this study to develop a comprehensive
database of buildings throughout the country, which can be used to quantify energy
consumption. The findings can be evaluated to produce a set of “best practice” notes for
building professionals.
Unfortunately the NER building is not yet in a state where it can be used as a model. However,
as has been mentioned, the basic building and system are reasonably sound and would be
suitable for repairs that would demonstrate energy efficient techniques.
Levels 2 and 3 need immediate attention to the HVAC system to prevent wasteful discharge of
conditioned air to the unoccupied offices, as well as via broken horizontal ducts and vertical
risers.
We recommended, as a first and early step, that an appropriately experienced consulting
engineer be engaged to evaluate the HVAC system and detail proposals for repair with due
regard for energy efficiency.
Section 5 details the energy conservation opportunities that should be investigated. The
savings and costs are summarized in Table 1 in the Executive Summary. Derived and
calculated energy key figures are shown below in Table 17.

- 24 -
Table 17: Derived and Calculated Energy Key Figures
SERVICE kWh/person-yr kWh/m2-yr
HVAC 5710 134
Lighting 4688 110 [27 – 54]
Small power 1918 45 [23 – 31]
Hot water 639 15 [4 – 10]
OVERALL 12 955 304 [258]
The figures in square brackets [….] are from Section 1. It can be seen that, if the lights were
switched off for half the day, then the overall figure would be very close to the monitored figure
for the similar nearby building. The estimate for small power is admittedly high in an attempt to
be conservative. We believe that, with well controlled lighting and HVAC, the building and
services as designed would achieve better than average energy consumption, thereby bearing
out our early assessment of the building.
Finally, if energy consumption does not have a responsible person (“champion”), then it will
soon be disregarded. We recommend the appointment of an Energy Management Officer
whose function would be the active promotion and maintenance of energy efficient practices.
8. REFERENCES
[1] Energy Consumption Guide 19, Energy Use in Offices, Energy Efficiency Office, Best
Practice Programme, UK, 2000.
[2] http://www.tshwane.gov.za/muninfo/electricity/tariffs.pdf
[3] Industrial Assessment Centre programme, University City Science Centre, Philadelphia,
USA.
[4] CIBSE Guide F, Energy Efficiency in Buildings, September 1998.
[5] Department of Minerals and Energy, Report No. ED9501, September 1996.
9. BIBLIOGRAPHY
(a) North American Measurement And Verification Protocol, US Department Of Energy, 1996
(b) Energy Savings Potential and Guidelines for Effective Energy Use in Office Buildings,
Report Number ED9309, Department Of Minerals and Energy, 1997.
(c) Good Practice Guide 287, The Design Team’s Guide to Environmentally Smart Buildings,
Energy Efficiency Office, Best Practice Programme, UK, 2000.
(d) http://www.energy-efficiency.gov.uk/

- 25 -
10. APPENDICES
10.1 Methodology
A consistent systematic approach was adopted and implemented by using the guidelines as set
out by the CIBSE and DME studies.[4,5]
10.1.1 Principles of Energy Efficiency
An energy efficient building provides the required internal environment and services with
minimum energy use in a cost effective and environmentally sensitive manner.
10.1.2 Managing the Building
The energy used by a building is determined by three factors, namely, the building fabric,
building services and, most importantly, the management of the building. Management of the
building is normally underrated. The reason for its importance is that it has a direct impact on
the day-to-day energy consumption. The key to energy efficient management is to:
Gain a sound understanding of how the building is meant to work, both at a strategic and
at a detailed level.
Set out a clear energy management policy alongside a clear maintenance policy for the
building and its services.
Involve both management and occupants in the process. That is, arrange organizational
structures to ensure that responsibilities are clear, regular reporting or feedback as
appropriate, and necessary resources are made available.
Encourage and reward occupants to use the building correctly and motivate them to
reduce energy consumption.
Set energy targets and continually monitor performance in order to keep consumption
under control.
10.1.3 Retrofitting Energy Saving Measures
Planning:
First, a fully costed plan of action should be produced. Thereafter agreement should be
obtained to proceed with the entire programme or in stages. The action plan should include
Preparation of a more detailed energy audit and building survey.
Identification of measures where energy savings could be made.
The effects of energy saving measures on the internal environment and activities within
the building.
Cost-benefit assessment of proposed measures.
A list of priorities for the proposal.
Identifying or surveying:
An energy audit is an attempt to allocate a value to each item of energy consumption over a
given period, and to balance these against overall energy use. The survey should cover the
main items affecting energy use, including the following
The building: levels of insulation, ventilation, air infiltration etc.

- 26 -
The pattern of use: periods of occupancy, the types of control, the temperature and
humidity maintained, the use of electric lighting, the activities and processes being
undertaken, including their operating temperatures, insulation etc.
The main building service: primary heating, cooling and air handling plant.
Electric lighting: quality, luminance, luminaire efficiency, extent to which daylight could
reduce energy use, flexibility of control etc.
The transport of energy within the building: fans and pumps, insulation of hot water and
steam pipes and air ducts, evidence of leakage etc.
The plant room: state and condition, insulation of boilers, tanks, pipe work, recovery of
condensate, plant efficiency checks etc.
Measurement and calculation:
Good instrumentation and measurement is an essential part of investigating and implementing
retrofit measures. Portable instrumentation is the best option.
Assessing Measures and savings:
It is important to consider all the possible available options before making a change to an
existing system. This is particularly important where major investments are involved, such as
replacing of chillers. A full option appraisal will ensure that the most cost-effective and efficient
plant is chosen. The option appraisal can provide a number of benefits such as:
Correct sizing of the plant to meet real demands of the building may lead to lower capital
cost.
Lower running costs through increased levels of control taking account of the needs of
staff.
Improved comfort levels through increased levels of control taking account of the needs of
staff.
Higher environmental standards by considering the environmental benefits of each option.
A formal justification for the recommendation made, including a well researched fallback
option in case management rejects the recommendation.
10.1.4 Specific Energy Saving Measures
Controls:
Upgrading of the controls is often the single biggest improvement that can be made to enhance
the energy efficiency of existing buildings. It should be noted that well-designed building
services would perform badly if controls are inadequate, incorrectly installed or misunderstood
by the building operators. Many problems with building services can be traced back to poor
control of the systems.
HVAC:
Ventilation is often responsible for the largest energy loss in well-insulated buildings. Therefore
it offers significant scope for retrofit energy saving measures.

- 27 -
Refrigeration:
Cooling of buildings is generally required for only parts of the year. It is often found that the
plant is operating unnecessarily or inefficiently to supply small loads. Thus significant energy
saving potential exists in upgrading the refrigeration system and controls, or installing smaller
plant to serve such loads.
Lighting:
In most buildings, lighting is a significant component of the electrical consumption. In the case
of offices it is normally the biggest energy cost, after the air conditioning. Upgrading lamps,
luminaires, ballasts and lighting controls, can reduce the energy consumption of the lighting.
Motors and Transportation Systems:
Significant energy savings can be realized by upgrading motors and motor controls. Particular
options for motors are as follows
Higher efficiency motors should always be considered as they often have no additional
capital cost and offer efficiency and economic benefit in virtually all situations.
Motors should be sized correctly to avoid the increased losses resulting from part-load
operation.
Use direct drives rather than belt drives where practicable.
Where belt drives are used, consider modern flat, synchronous, or ribbed-belt drives
rather than traditional V-belts, to reduce drive losses.
Systems should be carefully designed to minimize pressure loss and hence reduce
energy consumption.
Efficient system regulation, achieved by matching fan and pump characteristics to the
system, normally by means of speed change, can provide significant energy savings
compared with increased system resistance. Energy savings are typically 20% for 10%
flow regulation and 40% for 20% regulation.
Variable flow control can provide significant opportunities for energy saving. Building
services are designed for peak loads and, for most of their working life, operate well
below their full output. Typically 20% of full volume energy is required to move air and
water at 50% of maximum volume.
The use of variable speed drives should always be considered for efficient system
regulation and variable flow.
General electrical power measures:
Small power loads are an increasingly significant component of the total energy use in
buildings. In particular, they have an important effect on the energy consumed in air
conditioning and can influence the need to upgrade air conditioning due to increased internal
heat gains. General electrical power measures can be achieved by:
Reducing energy consumption of small power loads
Reducing cooling loads
Information technology measures

- 28 -
10.1.5 Monitoring and Targeting
Good monitoring and targeting should aim to:
(i) Establish current consumption.
(ii) Compare current consumption with historical data and benchmarks
(iii) Set future targets.
(iv) Compare current consumption with targets
(v) Identify trends in consumption
Quick action is required where consumption is abnormal or excessive.
10.1.6 Maintaining the Savings
Following the implementation of energy saving measures, post project evaluation is desirable to
establish that measures have been correctly installed and are achieving the predicted savings.
Note that small measures may require only a cursory check but larger projects, for example
those involving combined heat and power, require a thorough assessment.
Evaluations should establish:
(i) Actual savings
(ii) Final capital cost
(iii) Impact on occupants
(iv) Management implications
(v) Maintenance issues
(vi) Other benefits achieved
(vii) Practical pitfalls
It may be possible to compare actual savings with the savings achieved in published case study
material.
10.1.7 Environmental Impact
Man-made greenhouse gasses, released into the atmosphere, are disturbing the natural
balance resulting in rising global temperatures. Unless action is taken now, the emission of
greenhouse gases through man’s activities will increase and accelerate the rise of global
temperatures. The following steps are recommended to reduce global warming:
(i) Consider the relative merits of alternative energy sources in the light of their greenhouse
gas emissions.
(ii) Advise clients and the professional team on the selection of the best design solution for
energy efficient structures, plant and systems using environmentally friendly resources.
(iii) Advise clients on modifications to existing plant to incorporate developments with
improved performance.
(iv) Review operating and maintenance procedures to limit progressive deterioration of plant
performance and building conditions.
(v) Examine standard specification and remove features now recognised as hazards.
(vi) Remain vigilant to the possibilities of eliminating chlorofluorocarbons.
(vii) Promote the use of air conditioning only where necessary.

- 29 -
(viii) Optimise building orientation, form, façade design, thermal insulation and passive energy
utilisation to conserve energy.
(ix) Consider all the available alternative energy sources.
(x) Specify efficient plant, accurately sized for the optimum duty.
(xi) Design buildings for good access to plant for maintenance.
(xii) Recognize opportunities for using combined heat and power generation plant.
10.2 Tshwane Metropolitan Municipality Electricity Tariffs
The electricity tariffs for an 11 kV supply scale as of 1st of July 2002 is as follows:
(i) A fixed charge whether or not electricity is consumed, per metering point R 307,40.
(ii) A demand charge per kVA of half-hourly maximum demand provided that the amount
payable in respect of the maximum demand in any month will not be less than the
prevailing tariff multiplied by 70% of the highest demand recorded during the preceding
twelve months. R 49,53
(iii) An energy charge for all kWh consumed since the previous meter reading, per kWh of
11.08 c,
(iv) Provided that in the case of a consumer who is not supplied with electricity under the Off-
peak Supply Scale, the said energy charge will be reduced if the average daily
consumption in any month is equal to or greater than 13 kWh per kVA of the maximum
demand in that month, to 10.28 c
(v) Maximum energy charge if the sum of the demand charge and the energy charge, divided
by the total kWh consumed during the month, is more than 59.36c/kWh, the consumer will
pay a constant energy rate only, for all kWh consumed since the previous meter reading,
per kWh 59.36 c.
10.3 Comparative Evaluation: Incandescent and Compact Fluorescent Lamps
12 WATT COMPACT
FLUORESCENT LAMP
60 WATT INCANDESCENT
LAMP
Basic Information:
Unit Cost R 56.50 /lamp R 2.20 /lamp
Expected Life 10 000 1 000
Energy Rating 12 Watts 60 Watts
Consumption:
Energy Consumption (Life) 120 kW hours 60 kW hours
Energy Tariff (R/kW hour inclusive VAT) R 0.25 / kW hr R 0.25 / kW hr
Cost:
Energy Cost (Total over expected life) R 30.10 R 15.05
Total Cost (Total over expected life) R 86.60 R 17.25
Total Cost per 1000 hours R 8.66 R 17.25
Emissions:
Greenhouse Gas Equivalent, kg per 1000 hours (CO2 kg) 21.53 kg 107.63 kg
Acidification Equivalent, kg per 1000 hours (SO2 kg) 0.09 kg 0.46 kg
Carbon particulate, grams per 1000 hours 8.20 g 41.01 g
[Source: Green Buildings for Africa]

- 30 -
10.4 Comfort Audit Questionnaire
Questionnaire
INTRODUCTION
The aim of this questionnaire project is to evaluate your working environment. Will you please
be so kind as to complete this questionnaire and indicate how you experience your current
environment by ticking the appropriate block?
This information will be kept confidential
PERSONAL INFORMATION
On which floor is your office _________________________
Gender Male Female
Age 20 – 29 30-39 40 – 49 50+
INDOOR COMFORT
Temperature: Cold Acceptable Hot
Humidity levels Dry Acceptable Humid
A lack of humidity leads to dry eyes, nose throat as well as increased static electricity.
Air Movement Low Acceptable High
Fresh Air Yes No
A lack of fresh air leads to drowsiness, headaches and stuffy smells. Do you experience a lack of fresh air?
Odours Smoking Dust Other
Which of the following is a problem in your area?
Lighting Dim Acceptable Bright
COMMENTS: _______________________________________________
Please return the completed questionnaire, before_________ to ________________.
Related Documents