ERCOT Public November 17, 2014 ERCOT Analysis of the Impacts of the Clean Power Plan

Welcome message from author
This document is posted to help you gain knowledge. Please leave a comment to let me know what you think about it! Share it to your friends and learn new things together.
Transcript

ERCOT Public November 17, 2014
ERCOT Analysis of the Impacts of the Clean Power Plan

© 2014 Electric Reliability Council of Texas, Inc. All rights reserved. 1
ERCOT Analysis of the
Impacts of the Clean Power Plan The Electric Reliability Council of Texas (ERCOT) is the independent system operator (ISO) for the Texas Interconnection, encompassing approximately 90% of electric load in Texas. ERCOT is the independent organization established by the Texas Legislature to be responsible for the reliable planning and operation of the electric grid for the ERCOT interconnection. Under the North American Electric Reliability Corporation (NERC) reliability construct, ERCOT is designated as the Reliability Coordinator, the Balancing Authority, and as a Transmission Operator for the ERCOT region. ERCOT is also registered for several other functions, including the Planning Authority function.
In June 2014, the U.S. Environmental Protection Agency (EPA) proposed the Clean Power Plan, which calls for reductions in the carbon intensity of the electric sector. The Clean Power Plan would set limits on the carbon dioxide (CO2) emissions from existing fossil fuel-fired power plants, calculated as state emissions rate goals. For Texas, EPA has proposed an interim goal of 853 lb CO2/MWh to be met on average during 2020-2029, and a final goal of 791 lb CO2/MWh to be met from 2030 onward. EPA calculated the state-specific goals using a set of assumptions about coal plant efficiency improvements, increased production from natural gas combined cycle units, growth in renewables generation, preservation of existing nuclear generation, and growth in energy efficiency.
ERCOT has evaluated the potential implications of the proposed Clean Power Plan for grid reliability and conducted a modeling analysis of the impacts to generation resources and electricity costs in the ERCOT region. Based on this analysis, ERCOT anticipates that implementation of the proposed Clean Power Plan will have a significant impact on the planning and operation of the ERCOT grid. ERCOT estimates that the proposed CO2 emissions limitations will result in the retirement of between 3,300 MW and 8,700 MW of coal generation capacity, could result in transmission reliability issues due to the loss of generation resources in and around major urban centers, and will strain ERCOT’s ability to integrate new intermittent renewable generation resources. The Clean Power Plan will also result in increased energy costs for consumers in the ERCOT region by up to 20% in 2020, without accounting for the costs of transmission upgrades, procurement of additional ancillary services, energy efficiency investments, capital costs of new capacity, and other costs associated with the retirement or decreased operation of coal-fired capacity in ERCOT. This summary report describes the results of ERCOT’s analyses.
1. Summary of ERCOT Concerns with the Clean Power Plan
ERCOT approaches this analysis from the perspective of an independent grid operator in a competitive market which has achieved significant success in using competition to drive efficient outcomes. Existing market policies and investments in transmission in ERCOT have incentivized market participants to maximize the efficiency of the generating fleet and develop new technologies including renewable generation. With recent investments in transmission, more than 11 GW of wind capacity have been successfully integrated into the ERCOT grid. The ERCOT region maintains a forward-looking open market and provides affordable and reliable electricity to consumers in Texas.
ERCOT’s primary concern with the Clean Power Plan is that, given the ERCOT region’s market design and existing transmission infrastructure, the timing and scale of the expected changes needed to reach the CO2 emission goals could have a harmful impact on reliability. Specifically, implementation of the Clean Power Plan in the ERCOT region, particularly to meet the Plan’s interim goal, is likely to lead to reduced grid reliability for certain periods and an increase in localized grid challenges. There is a natural pace of change in grid resources due to advancing cost effective technologies and changing market conditions.

© 2014 Electric Reliability Council of Texas, Inc. All rights reserved. 2
This pace can be accelerated, but there is a limit to how fast this change can occur within acceptable reliability constraints. It is unknown based on the information currently available whether compliance with the proposed rule can be achieved within applicable reliability criteria and with the current market design. Nevertheless, there are certain grid reliability and management challenges that ERCOT will face as a result of the resource mix changes that the proposed rule will induce:
• The anticipated retirement of up to half of the existing coal capacity in the ERCOT region will pose challenges to reliable operation of the grid in replacing the dispatchable generation capacity and reliability services provided by these resources.
• Integrating new wind and solar resources will increase the challenges of reliably operating all resources, and pose costs to procure additional regulating services, improve forecast accuracy, and address system inertia issues.
• Accelerated resource mix changes will require major improvements to ERCOT’s transmission system, posing significant costs not considered in EPA’s Regulatory Impact Analysis.
These issues highlight the need for the final rule to include a process to effectively manage electric system reliability issues that may arise due to implementation of the Clean Power Plan, as well as include more implementation timeline flexibility to address each state’s or region’s unique market characteristics. With respect to the need to manage reliability issues, ERCOT supports the ISO/RTO Council (IRC) proposal for the inclusion of a reliability safety valve process in the context of the CO2 rule, as well the need for states to consult with ISOs/RTOs during the development of State Plans.
2. Results of ERCOT Modeling
This summary report draws on results from an ongoing analysis of the expected impacts of several recently finalized and proposed environmental regulations on grid reliability in the ERCOT region. The study uses stakeholder-vetted planning processes and methodologies consistent with the regional Long-Term System Assessment studies conducted by ERCOT. A full report on this environmental regulatory impact study will be released in mid-December 2014.
The sections that follow describe the modeling methodology and summarize the results from the modeling analysis. Next, the modeling results are compared to those obtained by EPA in its analysis of the Clean Power Plan. This is followed by a discussion of the impacts of these results for grid reliability and transmission infrastructure. The report concludes with a discussion of cost impacts.
2.1. Modeling Methodology
ERCOT evaluated the proposed Clean Power Plan using two methodologies. First, ERCOT considered a scenario with the Clean Power Plan limits applied as a constraint, to allow the long-term simulation model to select the most cost-effective way to achieve the proposed carbon intensity from electric generating resources. Second, a carbon emission fee was used to cause the system to achieve the proposed standard over the allotted compliance period. The benefit of the first approach is that it would be expected to minimize the overall cost to the system, and should lead to results that are comparable to the methodology utilized by the EPA in its analysis of the rule impacts. However, it may not be a change that is achievable within the current electricity market design in ERCOT. For this reason, ERCOT also modeled emissions fee scenarios. Though a carbon price is not an explicit component of EPA’s proposal, it is one option that Texas could use to comply with the limits, and is included here in order to
© 2014 Electric Reliability Council of Texas, Inc. All rights reserved. 3
assess the system impacts of a potential approach to compliance. In both cases, ERCOT evaluated the limits in the Clean Power Plan by applying the proposed emissions rate limits for Texas (in lb/MWh) to the ERCOT system.
ERCOT modeled four distinct scenarios over the timeframe 2015-2029 to evaluate the implications of the Clean Power Plan on reliability in the region:
1. Baseline – This scenario estimates a baseline of the ERCOT system under current market trends against which anticipated Clean Power Plan changes will be compared.
2. CO2 Limit – This scenario applied the limits in the Clean Power Plan to the ERCOT system to determine the most cost-effective way to comply with the limits. This scenario did not place a price on CO2 emissions.
3. $20/ton CO2 – This scenario applied a $20/ton price on carbon dioxide emissions to the ERCOT system. With a $20/ton CO2 price, the ERCOT system attains an emission intensity of 904 lb CO2/MWh in 2020 and 877 lb CO2/MWh in 2029 – above both the interim and final goals.
4. $25/ton CO2 – This scenario applied a $25/ton price on carbon dioxide emissions to the ERCOT system. With a $25/ton CO2 price, the ERCOT system attains an emission intensity of 840 lb CO2/MWh in 2020 and 792 lb CO2/MWh in 2029 – below the interim goal and approximately meeting the final goal.1
It should be noted that ERCOT did not require the system to maintain a specific reserve margin in the modeled scenarios. The target reserve margin criterion in ERCOT is not binding and it is possible that market conditions will result in a lower reserve margin than the recommended level. By contrast, EPA’s modeling, described later, required that ERCOT maintain a 13.75% reserve margin. This difference in assumptions results in different amounts of capacity additions, and has implications for grid reliability.
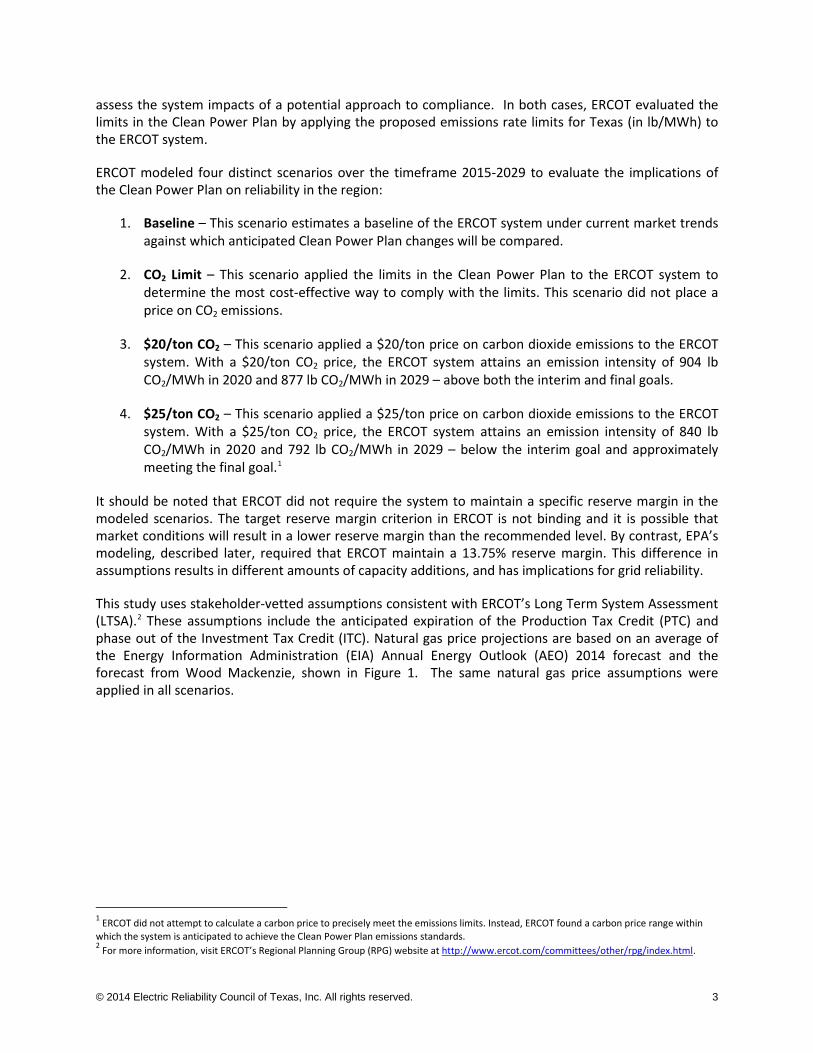
This study uses stakeholder-vetted assumptions consistent with ERCOT’s Long Term System Assessment (LTSA).2 These assumptions include the anticipated expiration of the Production Tax Credit (PTC) and phase out of the Investment Tax Credit (ITC). Natural gas price projections are based on an average of the Energy Information Administration (EIA) Annual Energy Outlook (AEO) 2014 forecast and the forecast from Wood Mackenzie, shown in Figure 1. The same natural gas price assumptions were applied in all scenarios.
1 ERCOT did not attempt to calculate a carbon price to precisely meet the emissions limits. Instead, ERCOT found a carbon price range within which the system is anticipated to achieve the Clean Power Plan emissions standards. 2 For more information, visit ERCOT’s Regional Planning Group (RPG) website at http://www.ercot.com/committees/other/rpg/index.html.
© 2014 Electric Reliability Council of Texas, Inc. All rights reserved. 4
Figure 1: Natural Gas Price Assumptions
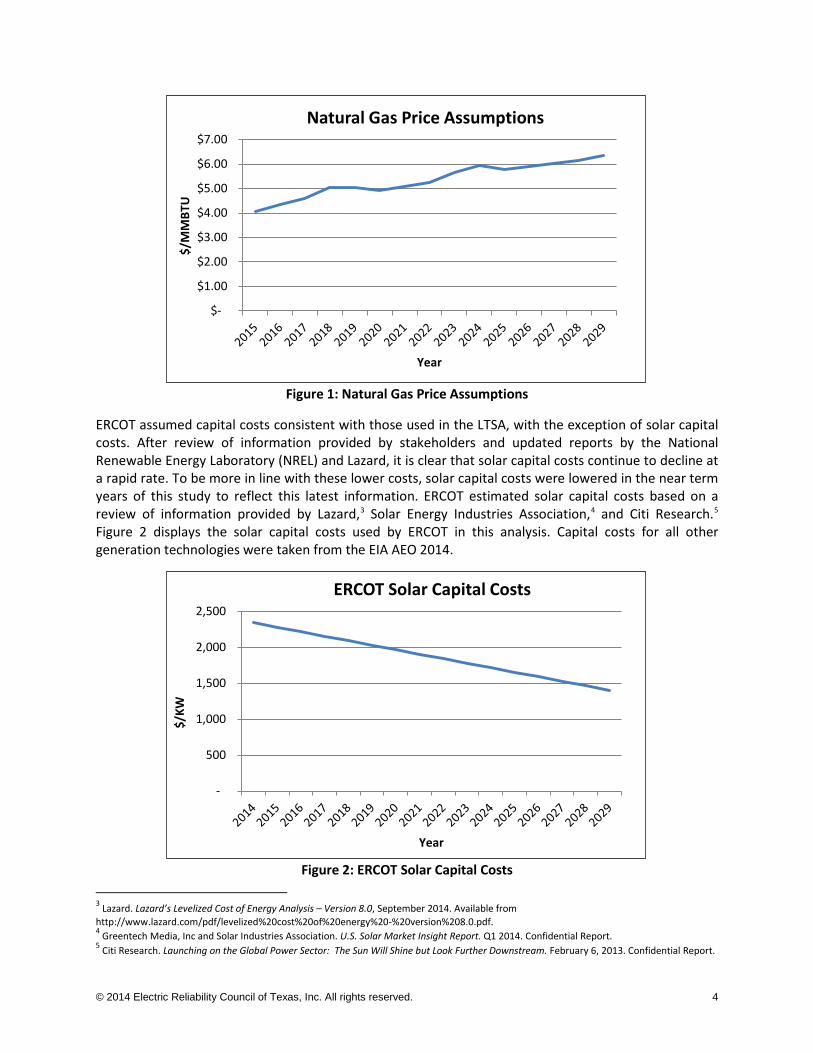
ERCOT assumed capital costs consistent with those used in the LTSA, with the exception of solar capital costs. After review of information provided by stakeholders and updated reports by the National Renewable Energy Laboratory (NREL) and Lazard, it is clear that solar capital costs continue to decline at a rapid rate. To be more in line with these lower costs, solar capital costs were lowered in the near term years of this study to reflect this latest information. ERCOT estimated solar capital costs based on a review of information provided by Lazard,3 Solar Energy Industries Association,4 and Citi Research.5 Figure 2 displays the solar capital costs used by ERCOT in this analysis. Capital costs for all other generation technologies were taken from the EIA AEO 2014.
Figure 2: ERCOT Solar Capital Costs
3 Lazard. Lazard’s Levelized Cost of Energy Analysis – Version 8.0, September 2014. Available from http://www.lazard.com/pdf/levelized%20cost%20of%20energy%20-%20version%208.0.pdf. 4 Greentech Media, Inc and Solar Industries Association. U.S. Solar Market Insight Report. Q1 2014. Confidential Report. 5 Citi Research. Launching on the Global Power Sector: The Sun Will Shine but Look Further Downstream. February 6, 2013. Confidential Report.
$-
$1.00
$2.00
$3.00
$4.00
$5.00
$6.00
$7.00
$/M
MBT
U
Year
Natural Gas Price Assumptions
-
500
1,000
1,500
2,000
2,500
$/KW
Year
ERCOT Solar Capital Costs
© 2014 Electric Reliability Council of Texas, Inc. All rights reserved. 5
Table 1: Baseline Capacity Assumptions
Fuel Type Capacity (MW)
Nuclear 5,200
Coal 19,900
Natural Gas 58,900
Wind 16,700
Solar 250
Hydro 500
Other 1,000
Total 102,450
With regard to the generation fleet, ERCOT modeled the capacity listed in ERCOT’s May 2014 Capacity, Demand, and Reserves (CDR) report,6 with the addition of planned generation resources that had started construction by Summer 2014, as well as the full capacity of Private Use Networks (PUNs).7 Table 1 shows the baseline capacity assumptions used in the modeling. Generation from wind and solar resources was modeled based on wind and solar production profiles that estimate the amount of wind and solar resources available for every hour of the year, based on the 2010 weather year. For wind, ERCOT used county-specific wind production profiles provided by AWS Truepower. The solar production profiles were provided by URS and are based on data from weather stations in West Texas.
Within the scenarios, ERCOT varied some assumptions pertaining to implementation of the Clean Power Plan and compliance with other environmental regulations. First, scenarios 2-4 required compliance with the Cross-State Air Pollution Rule (CSAPR) limits, imposed as a limit in Scenario 2 and as an emission fee in scenarios 3 and 4.8 Second, due to data availability limitations, ERCOT was only able to model through 2029. In scenario 2, to approximate compliance with the final goal in the Clean Power Plan, ERCOT applied the final CO2 limit as a constraint over 2028-2029, and the interim CO2
limit over 2020-2027. In this scenario, the ERCOT interconnection was required to meet the applicable emission rate goal in each year; the other scenarios did not include this requirement.
Finally, in the baseline scenario ERCOT assumed energy efficiency savings at 1% of load for all modeled years, consistent with current
levels of energy efficiency as measured by the Electric Utility Marketing Managers of Texas (EUMMOT).9 For scenarios 2-4, ERCOT assumed growth in energy efficiency savings to a level of 5% by 2029. EPA’s building blocks assumed Texas could achieve a cumulative 9.91% savings from energy efficiency by 2029. ERCOT did not elect to use the energy efficiency savings level estimated by EPA because this level of energy efficiency is not consistent with current trends in energy efficiency in Texas.10 ERCOT’s more moderate assumption is consistent with the approach taken by the Mid-Continent Independent System Operator (MISO) in its analysis of the impacts of the Clean Power Plan.11 MISO modeled three energy efficiency assumptions: base energy efficiency trends, EPA’s Building Block 4, and 50% of EPA’s Building Block 4. ERCOT’s approach of using 5% is consistent with the third assumption modeled by MISO, and represents a moderate, and more realistic, energy efficiency growth assumption, between the current level of savings and EPA’s goal.
6 ERCOT’s Report on the Capacity, Demand, and Reserves in the ERCOT Region is available at http://www.ercot.com/gridinfo/resource/index.html. 7 In addition to PUN capacity, ERCOT also separately modeled PUN load. 8 ERCOT assumed an SO2 emission price of $800/ton, an ozone season NOx emission price of $1,600/ton, and an annual NOx emission price of $1,000/ton. ERCOT estimated these prices based on a series of model iterations as part of this study. 9 EUMMOT’s Energy Efficiency Accomplishments Report is available at http://www.texasefficiency.com/index.php/publications/reports. 10 For information about energy efficiency trends in Texas, visit the EUMMOT website at http://www.texasefficiency.com/. 11 MISO. GHG Regulation Impact Analysis, July 30, 2014. Available from https://www.misoenergy.org/Library/Repository/Meeting%20Material/Stakeholder/PAC/2014/20140730/20140730%20PAC%20Item%2012a%20GHG%20Regulation%20Impact%20Analysis.pdf.

© 2014 Electric Reliability Council of Texas, Inc. All rights reserved. 6
Table 2: Unit Retirements by 2029
Generation Technology Type Baseline CO2 Limit
CO2 $20/ton
CO2 $25/ton
Retired Gas Steam (MW) 2,000 1,600 1,600 1,300
Retired Coal (MW) 800 4,100 4,100 6,500
Total Retirements (MW) 2,800 5,700 5,700 7,800
Table 3: Capacity Additions by 2029
Generation Technology Type Baseline CO2 Limit
CO2 $20/ton
CO2 $25/ton
Wind (MW) 0 3,400 2,800 3,500
Solar (MW) 9,900 12,500 12,600 13,500
Combined Cycle (MW) 0 0 0 1,300
Combustion Turbine (MW) 4,600 1,000 1,000 1,000
Total (MW) 14,500 16,900 16,400 19,300
2.2. Summary of Modeling Results
The modeling results for the four scenarios indicate incremental unit retirements and incremental renewable capacity additions in the CO2 limit and carbon price scenarios compared to the baseline. In the CO2 limit and carbon price scenarios, the model retired 2,900 MW to 5,000 MW of capacity incremental to retirements in the baseline, as shown in Table 2. Most of the incremental retirements were coal units, with between 3,300 MW and 5,700 MW of incremental coal unit retirements compared to the baseline. The amount of incremental coal retirements in the carbon scenarios is higher than the total amount of incremental retirements because of natural gas steam retirements that occur in the baseline but not in the carbon scenarios. The fewer retirements of natural gas steam units in the carbon scenarios reflects the impact of both the CSAPR and carbon dioxide limits on production from coal units, improving the economics of natural gas steam units during this period. Note that in the baseline, 800 MW of coal capacity retires, corresponding to the announced retirement of CPS Energy’s J. T. Deely units 1 and 2 in 2018.
The CO2 limit and carbon price scenarios also resulted in between 5,500 and 7,100 MW incremental renewable capacity additions compared to the baseline, which itself saw 9,900 MW of new solar capacity.12 As noted previously, ERCOT assumed the expiration of the PTC as per current law, which is the reason there are no wind capacity additions in the baseline scenario. All three scenarios built less natural gas-fired capacity compared to the baseline. Table 3 summarizes the capacity additions for each scenario.
As shown in Figure 3, the retiring coal and gas steam capacity would be replaced by solar, wind, and natural gas-fired capacity by 2029, taking into account the contribution of energy efficiency measures. However, within the modeled timeframe there are some years for which the ERCOT capacity reserve margin may be
considerably less than historically targeted for reliability, as capacity retires before new resources come online and energy savings from energy efficiency measures begin to materialize. In the model results, these shortages occur towards the beginning of the compliance timeframe, between 2020 and 2022.
During this timeframe, the modeled retirements and capacity additions result in a reserve margin 2 to 3% below the reserve margin in the baseline scenario for these years, in the CO2 limit and $20/ton CO2
12 The solar capacity additions modeled in this study are consistent with the results of ERCOT’s 2013 Long-Term Transmission Analysis, which indicated that large amounts of solar would be economic in ERCOT after 2020. For more information, visit ERCOT’s Long-Term Study Task Force website at http://www.ercot.com/committees/other/lts/index.html.

© 2014 Electric Reliability Council of Texas, Inc. All rights reserved. 7
Table 4: Generation Mix in 2020 (% of MWh)
Fuel Type Baseline CO2 Limit CO2
$20/ton CO2
$25/ton Natural Gas (%) 44 60 60 63
Coal (%) 32 14 14 11
Wind (%) 12 15 15 16
Solar (%) < 1 < 1 < 1 < 1
Nuclear (%) 10 10 10 10
Other (%) 1 < 1 < 1 < 1
Table 5: Generation Mix in 2029 (% of MWh)
Fuel Type Baseline CO2 Limit CO2
$20/ton CO2
$25/ton Natural Gas (%) 45 53 53 55
Coal (%) 29 16 16 13
Wind (%) 11 14 14 14
Solar (%) 6 7 7 8
Nuclear (%) 9 9 9 9
Other (%) < 1 < 1 < 1 < 1
scenarios.13 By 2029, the reserve margin in these scenarios is comparable to the baseline scenario. The reserve margins are generally higher in the $25/ton CO2 scenario, because the increased price on CO2 results in increased capacity additions. As previously described, ERCOT did not require the simulation model to maintain a specific reserve margin in the four scenarios.
Figure 3: Capacity Additions and Retirements by 2029
With the modeled retirements and capacity additions, the generation mix in the modeling results shifts towards increased generation from natural gas and renewable generation resources, and decreased generation from coal generation resources. Table 4 and Table 5 show the generation mix in 2020 and 2029, respectively, across the four scenarios. In 2020, natural gas-fired units contribute 60% or more of total energy in the carbon scenarios, up from 44% in the baseline. Coal generation correspondingly decreases to 11 to 14%, from a baseline of 32% of total generation. By 2029, renewable generation accounts for 21 to 22% of total generation in the three CO2 scenarios, up from 17% of total 2029 generation in the baseline scenario.
13 The ERCOT reserve margin is calculated using wind capacity contribution values of 12% for non-coastal resources and 56% for coastal resources, consistent with the ERCOT Board approved methodology outlined in Nodal Protocol Revision Request (NPRR) 611. The data used to calculate the wind capacity contribution is available on the ERCOT website at http://www.ercot.com/gridinfo/resource/index.html. For solar capacity, ERCOT assumes a 70% capacity contribution based on the modeled solar output during peak hours (16:00 to 18:00) as a percentage of total installed capacity.
-10
-5
0
5
10
15
20
25
Baseline CO2 Limit CO2 $20/ton CO2 $25/ton
Capa
city
(GW
)
Scenario
Capacity Additions and Retirements by 2029
Retired Coal
Retired Gas Steam
Wind
Combustion Turbine
Combined Cycle
Solar

© 2014 Electric Reliability Council of Texas, Inc. All rights reserved. 8
Table 6: Carbon Dioxide Emissions Intensity
CO2 Intensity Baseline CO2
Limit CO2
$20/ton CO2
$25/ton 2020 CO2 Intensity (lb/MWh) 1,175 853 905 840
2029 CO2 Intensity (lb/MWh) 1,089 791 877 792
The modeling results indicate significantly higher generation from natural gas-fired resources under the Clean Power Plan. This trend is most distinct early in the compliance period, before the bulk of solar capacity additions and energy efficiency savings materialize. In 2020, natural gas consumption by the power sector is 35 to 50% higher annually in the carbon scenarios compared to the baseline, as shown in Figure 4. By 2029, natural gas consumption is 15 to 20% above the amount consumed annually in the baseline.
Figure 4: Natural Gas Consumption in 2020
The four scenarios resulted in different levels of carbon intensity. As noted previously, the $20/ton CO2 scenario resulted in a carbon intensity above both the interim and final emissions limits in the Clean Power Plan, while the $25/ton CO2 scenario resulted in a carbon intensity below the interim goal and approximately meeting the final goal (see Table 6 and Figure 5). In the baseline scenario, ERCOT’s carbon intensity is at 1,175 lb/MWh in 2020 and 1,089 lb/MWh in 2029. The projected emissions intensity for ERCOT in the baseline is below the Clean Power Plan emissions rate goals for 19 other states, an indication of the impact that existing market policies and investments in transmission in Texas have had on maximizing the efficiency of the generating fleet and integrating new technologies including renewable generation.
0
50,000
100,000
150,000
200,000
250,000
Jan Feb Mar Apr May Jun Jul Aug Sep Oct Nov Dec
Nat
ural
Gas
Con
sum
ptio
n (G
BTU
)
Month
Natural Gas Consumption in 2020
Baseline CO2 Limit $20/ton CO2 $25/ton CO2

© 2014 Electric Reliability Council of Texas, Inc. All rights reserved. 9
Figure 5: CO2 Emissions Intensity
2.3. Comparison to EPA’s Modeling Results
EPA conducted an analysis of the Clean Power Plan by applying the carbon limits to the U.S. electric system, and allowing their simulation model to solve for the most cost-effective solution. The results referenced here are for EPA’s “Option 1 State Compliance” scenario, as compared to the base case.14
EPA’s modeling results predict that there may be 9 GW of coal unit retirements in ERCOT due to the Clean Power Plan – most occurring before the initial 2020 compliance date. ERCOT’s modeling predicted up to 6 GW of coal unit retirements, but ERCOT believes that there could be up to 9 GW of coal unit retirements resulting from the Clean Power Plan due to additional factors not considered in the model (discussed in Section 3.1). Similarly, both EPA’s and ERCOT’s modeling saw a major shift in the generation mix in 2020 to comply with the interim goal, with substantially increased production from natural gas generation resources and substantially decreased production from coal generation resources. However, EPA’s modeling resulted in much fewer renewable capacity additions compared to ERCOT’s results and significantly more new natural gas generating capacity. The lower amount of renewable capacity additions is due to EPA’s use of higher capital cost assumptions for new solar capacity. The larger amount of natural gas capacity additions is due in part to EPA’s modeling requirement that ERCOT maintain a 13.75% reserve margin, as discussed previously. EPA’s modeling predicts more than 10 GW of new natural gas capacity by 2030 in the state compliance scenario, whereas ERCOT’s carbon scenarios added 1 to 2 GW of new natural gas capacity.
3. Impact on Reliability
The modeling results raise two reliability concerns associated with implementation of the Clean Power Plan in ERCOT. These concerns are associated with the impacts of unit retirements and increased levels of renewable generation on the ERCOT grid.
3.1. Impact of Unit Retirements
As previously described, the model retired between 3,300 and 5,700 MW of coal-fired capacity in the carbon scenarios, relative to the baseline. However, these results represent a lower bound on the 14 EPA’s modeling run files are available from http://www.epa.gov/airmarkets/powersectormodeling/cleanpowerplan.html.
0
200
400
600
800
1,000
1,200
1,400
Baseline CO2 Limit $20/ton CO2 $25/ton CO2CO2 E
mis
sion
s In
tens
ity (l
b/M
Wh)
Scenario
Carbon Dioxide Emissions Intensity
2020 2029
853 lb/MWh
791 lb/MWh

© 2014 Electric Reliability Council of Texas, Inc. All rights reserved. 10
number of potential coal unit retirements due to the logic used to retire units in the model, generic unit cost information, and the impacts of other factors not considered by the model. ERCOT directed the model to retire capacity at the point when generic operating and fixed costs exceed revenues. However, in the modeling results for the carbon scenarios, there are several units operating at low revenues and/or low capacity factors that would likely be retired, especially when other non-modeled factors are taken into account. One important factor not considered in the modeling is the capital and operating cost impacts of other pending environmental regulations including the Mercury and Air Toxics Standard, the Regional Haze program, the 316(b) Cooling Water Intake Structures Rule, and the coal ash rules.
Based on a review of capacity factors and operating revenues for the remaining coal units ERCOT anticipates the retirement of an additional 2,000 MW of coal capacity and the seasonal mothball of 1,000 MW of coal capacity beyond what is specified in the model output, compared to the $25/ton CO2 modeled scenario. These results indicate the overall impact to the current coal fleet will be the retirement or seasonal mothballing of between 3,300 MW and 8,700 MW.
The accelerated retirement or suspended operations of coal resources would pose challenges to maintaining the reliability of the ERCOT grid. Coal resources provide essential reliability services, including reactive power and voltage support, inertial support, frequency response, and ramping capability. The retirement of coal resources will require reliability studies to determine if there are any voltage/reactive power control issues that can only be mitigated by those resources; how to replace frequency response, inertial support, and ramping capability provided by retiring units; and the necessity of potential transmission upgrades, which will be discussed later in this document.
The model also predicted the retirement of 1,300 to 1,600 MW of natural gas steam capacity in the carbon scenarios, which is less than the 2,000 MW retired in the baseline scenario. The fewer retirements of natural gas steam units in the carbon scenarios reflects the impact of both the CSAPR and carbon dioxide limits on production from coal units, which improves the economics of natural gas steam units during this period. However, as with coal resources, there are a number of factors that may result in additional natural gas steam unit retirements compared to those found by the model. ERCOT estimates that an additional 1,500 to 4,500 MW of natural gas steam capacity may be at risk of retirement based on low net revenues in the model results combined with the need to comply with the 316(b) rule, CSAPR, and other environmental regulations.
The modeling results indicate that generation from retiring coal capacity will in large part be replaced by increased production from existing natural gas capacity. Though ERCOT is not currently affected by natural gas supply issues, the increased use of natural gas nationally could lead to increased market dislocations, such as seen in the winter of 2013-2014. Depending on the magnitude of these issues, there could be implications for maintaining reliable natural gas supply in ERCOT for electric generation in the future.
It should also be noted that prospective compliance with the Clean Power Plan in 2020 will impact decisions generation resources make now about investments to comply with other pending environmental regulations. With the implementation of the Clean Power Plan to consider, owners of generation resources in Texas may choose to retire units early rather than install control technology retrofits for compliance with the Mercury and Air Toxics Standard (MATS), the Regional Haze Program, or the 316(b) Cooling Water Intake Structures rule. For example, the compliance date for the MATS rule is April 2015, but several coal-fired units in Texas have received a one-year compliance extension from the Texas Commission on Environmental Quality (TCEQ). The pending market impacts due to the Clean Power Plan could result in resource owners deciding to retire these units rather than invest in the retrofit technology required to achieve compliance with MATS. Similarly, it is anticipated that EPA will

© 2014 Electric Reliability Council of Texas, Inc. All rights reserved. 11
issue a Federal Implementation Plan (FIP) for Texas for the Regional Haze program in the coming weeks. Depending on the FIP requirements, generators may need to make similar decisions about whether to make significant investments in control technology retrofits or instead retire their units, in light of eventual compliance with the Clean Power Plan. With earlier retirements of fossil fuel-fired capacity, ERCOT could experience the aforementioned grid reliability challenges well before the Clean Power Plan’s first compliance date in 2020.
3.2. Impact of Renewables Integration
Integrating new wind and solar resources will increase the challenges of reliably operating the ERCOT grid. In 2013, almost 10% of the ERCOT region’s annual generation came from wind resources. In order to accommodate this level of intermittent generation, ERCOT has needed to evaluate impacts on operational reliability and improve wind output forecasting capabilities. The increased penetration of intermittent renewable generation, as projected by these modeling results, will increase the challenges of reliably operating all generation resources. If there is not sufficient ramping capability and operational reserves during periods of high renewable penetration, the need to maintain operational reliability could require the curtailment of renewable generation resources. This would limit and/or delay the integration of renewable resources, leading to possible non-compliance with the proposed rule deadlines.
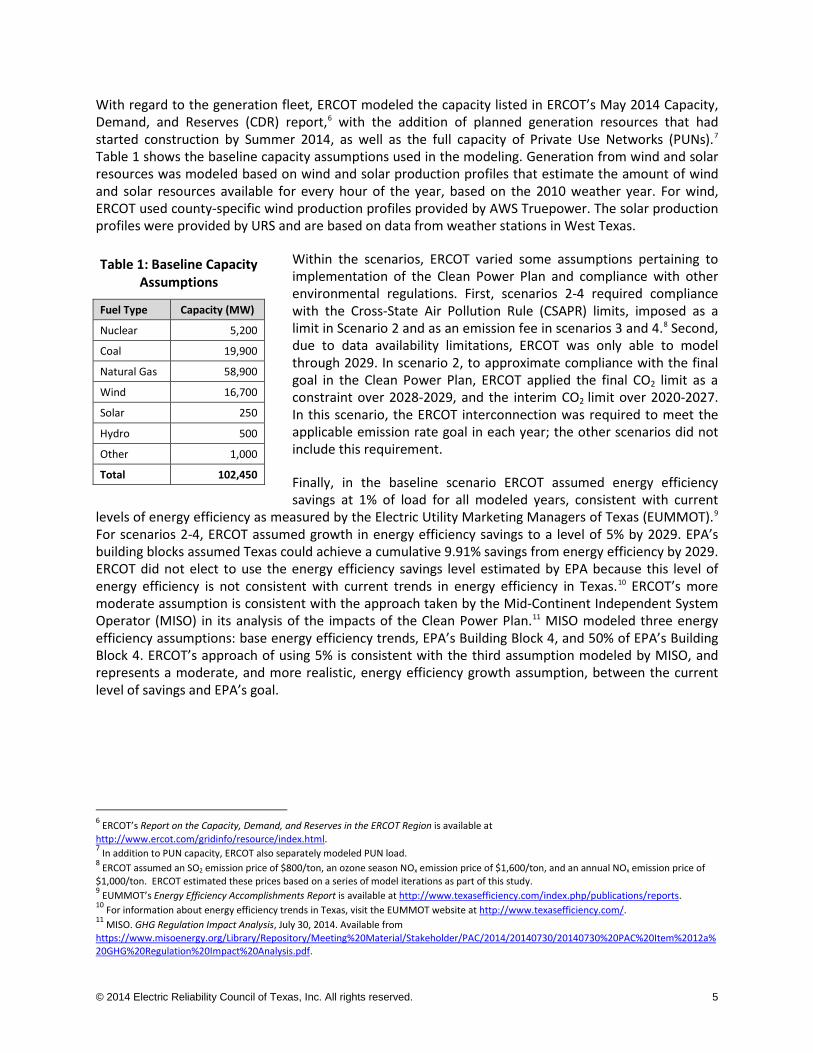
Based on the $25/ton CO2 scenario, intermittent renewable generation sources will contribute 22% of energy on an annual basis in 2029. However, during 628 hours of the year intermittent generation will serve more than 40%15 of system load. During 128 hours instantaneous renewable penetration will be higher than 50%, and the peak instantaneous renewable penetration from the model results is 61%. The significant change from present experience is that the highest renewable penetration hours will be driven by maximum solar production during relatively high wind periods. These periods occur during the day (8 a.m. to 5 p.m.), as opposed to early morning hours (usually 2 to 4 a.m.), as currently experienced in ERCOT. The high instantaneous renewable penetration hours in 2029 occur year round except for the July-September period. Figure 6 shows generation output by fuel type for the days with the highest instantaneous penetration of renewables in 2029 in the $25/ton CO2 scenario.
15 The record in the ERCOT region for wind penetration occurred on March 31, 2014 at 2:00 a.m., when wind resources met 39.44% of load.
© 2014 Electric Reliability Council of Texas, Inc. All rights reserved. 12
Table 7: Maximum Ramp-up and Ramp-Down
Net Load
Maximum 60-min Ramp-up (MW/60Mins)
Maximum 60-min Ramp-
down (MW/60Mins)
Maximum 180-min Ramp-up
(MW/180Mins)
Maximum 180-min Ramp-
down (MW/180Mins)
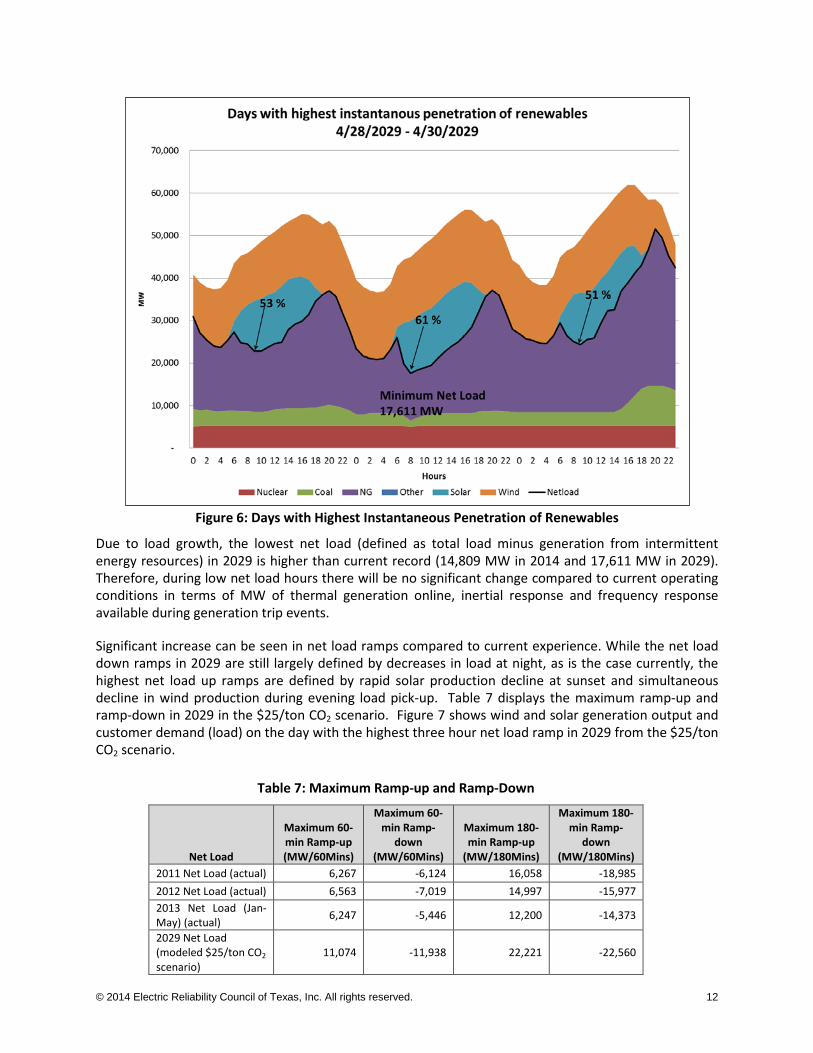
2011 Net Load (actual) 6,267 -6,124 16,058 -18,985 2012 Net Load (actual) 6,563 -7,019 14,997 -15,977 2013 Net Load (Jan-May) (actual) 6,247 -5,446 12,200 -14,373
2029 Net Load (modeled $25/ton CO2 scenario)
11,074 -11,938 22,221 -22,560
Figure 6: Days with Highest Instantaneous Penetration of Renewables
Due to load growth, the lowest net load (defined as total load minus generation from intermittent energy resources) in 2029 is higher than current record (14,809 MW in 2014 and 17,611 MW in 2029). Therefore, during low net load hours there will be no significant change compared to current operating conditions in terms of MW of thermal generation online, inertial response and frequency response available during generation trip events.
Significant increase can be seen in net load ramps compared to current experience. While the net load down ramps in 2029 are still largely defined by decreases in load at night, as is the case currently, the highest net load up ramps are defined by rapid solar production decline at sunset and simultaneous decline in wind production during evening load pick-up. Table 7 displays the maximum ramp-up and ramp-down in 2029 in the $25/ton CO2 scenario. Figure 7 shows wind and solar generation output and customer demand (load) on the day with the highest three hour net load ramp in 2029 from the $25/ton CO2 scenario.

© 2014 Electric Reliability Council of Texas, Inc. All rights reserved. 13
Figure 7: Highest Three Hour Net Load Ramping Day
The simulation model assumes perfect foresight and ensures that there is sufficient amount of thermal generation with sufficient ramping capability committed to follow such rapid net load ramps. In real time operation, however, accommodating the maximum ramps resulting from simultaneous solar and wind generation decline would be more challenging. At times, the existing and planned generation fleet will likely need to operate for more hours at lower minimum operating levels and provide more frequent starts, stops, and cycling over the operating day. It is important that market mechanisms are adopted so that the need for flexible generation (with short start-up times and high ramping capability) is reflected in real-time energy prices. Market mechanisms to include dispatchable load resources could also help to address flexibility needs. Enhancing wind and solar forecasting systems to provide more accurate wind and solar generation projections will become increasingly important. Regulation and Non-Spinning reserves will need to be increased to address increased intra-hour variability and uncertainty of power production from wind and solar. Tools available to system operators must be enhanced to include short-term (10-min, 30-min, 60-min, 180-min) net-load ramp forecasts and simultaneous assessment of real-time ramping capability of the committed thermal generation to assist operators in maintaining grid reliability.16
Though all solar capacity additions predicted by the model were utility-scale, it is likely that a significant portion of future solar generation capacity will be embedded in the distribution grid (e.g., rooftop solar and small scale utility solar connected at lower voltage levels). ERCOT does not currently have visibility of these resources. To produce accurate solar production forecasts, ERCOT would need to have information regarding the size and location of distributed solar installations. Additionally, to ensure grid
16 These findings are consistent with an assessment conducted by the North American Electric Reliability Corporation (NERC) and California ISO (CAISO), Maintaining Bulk Power System Reliability While Integrating Variable Energy Resources, November 2013. Available from http://www.nerc.com/pa/RAPA/ra/Reliability%20Assessments%20DL/NERC-CAISO_VG_Assessment_Final.pdf.
-
10,000
20,000
30,000
40,000
50,000
60,000
0 2 4 6 8 10 12 14 16 18 20 22 24
MW
Hours
Highest Three Hour Net Load Ramping Day3/28/2029 between 17:00 and 20:00
Load Wind Solar Net Load

© 2014 Electric Reliability Council of Texas, Inc. All rights reserved. 14
reliability, there would need to be increased consideration of operational activities on the distribution and transmission systems.17
Based on ERCOT’s modeling, the majority of new renewable generation resource additions are anticipated to be solar. However, if instead ERCOT sees a large amount of wind resource capacity additions, then the reliability impacts may be more severe. Wind production in West Texas results in high renewable penetration during early morning hours, when load is lowest. An expansion in wind production, rather than solar, may result in lower net loads and significant reliability issues. If ERCOT cannot reliably operate the grid with these high renewable penetration levels, then production from these resources will be curtailed to maintain operational reliability. Should this occur, it would reduce production from renewable resources, leading to possible non-compliance with the proposed rule deadlines.
4. Impact on Transmission Infrastructure
As previously noted, ERCOT’s analysis indicates that imposition of the constraints proposed in the Clean Power Plan will result in retirement of legacy base-load generation and development of new renewable generation resources. These changes to the ERCOT generation mix will likely require significant upgrades to the transmission infrastructure of the ERCOT system.
The retirement of a large amount of coal-fired and/or gas steam resource capacity in the ERCOT region would have a significant impact on the reliability of the transmission system. The transmission system is currently designed to reliably deliver power from existing generating resources to customer loads, with the existing legacy resources that are located near major load centers serving to relieve constraints and maintain grid reliability. Retirement of these resources would result in a loss of real and reactive power, potentially exceeding thermal transmission limitations and the ability to maintain stable transmission voltages while reliably moving power from distant resources to major load centers. A significant amount of transmission system improvements would likely be required to ensure transmission system reliability criteria are met even if a moderate amount of coal-fired and gas steam resources were to be displaced. If new natural gas combined cycle resources were to locate at or near retiring coal-fired and gas steam resources, the impact would be lessened.
In the ERCOT region, it takes at least five years for a new major transmission project to be planned, routed, approved and constructed. As such, in order for major transmission constraints to be addressed in a timely fashion, the need must be seen at least five years in advance. Given the competitiveness of the current ERCOT market, unit retirement decisions will likely be made with only the minimum required notification (currently 90 days). Reliability-must-run contracts may provide an avenue to maintain generation resources necessary to support grid reliability, but these make-whole contracts could incur significant market uplift costs, especially if they are needed for several years or if the contracted units require capital investments in order to maintain compliance with other environmental regulations.
The growing loads in the ERCOT urban centers are causing continued growth in customer demand and a resulting need for new transmission infrastructure. As the units that are at risk of retirement from the proposed rule are located near these load centers, future transmission needs would be increased or accelerated by the likely retirements. A new 345-kV transmission line is currently planned to be in place by 2018 to serve customers in the Houston region, at an estimated cost of more than $590 million. Long- 17 These findings are consistent with an assessment conducted by the North American Electric Reliability Corporation (NERC) and California ISO (CAISO), Maintaining Bulk Power System Reliability While Integrating Variable Energy Resources, November 2013. Available from http://www.nerc.com/pa/RAPA/ra/Reliability%20Assessments%20DL/NERC-CAISO_VG_Assessment_Final.pdf.

© 2014 Electric Reliability Council of Texas, Inc. All rights reserved. 15
Table 8: Locational Marginal Prices*
Locational Marginal Price Baseline CO2
$20/ton CO2
$25/ton 2020 LMP ($/MWh) $49.46 $66.17 $73.58
2029 LMP ($/MWh) $72.02 $81.13 $84.28
2020 LMP % change from baseline n/a 34 49
2029 LMP % change from baseline n/a 13 17
2020 retail energy bill % change n/a 14 20
2029 retail energy bill % change n/a 5 7 *LMPs for the CO2 limit scenario were not available at the time of completion of this report. They will be provided in the full report published in mid-December.
term studies indicate a potential need for further upgrades in the mid-2020s.18 The retirement of generation resources within the Houston area prior to 2018 would likely result in grid reliability issues prior to completion of the proposed project. Retirement of generation after 2018 would accelerate the need for additional transmission from the long-term horizon (6-15 years) into the near-term horizon (1-6 years).
Similarly in the San Antonio and the Dallas-Fort Worth regions there are multiple new transmission projects that are being planned to serve existing load growth. At costs of hundreds of millions of dollars, the need for these and similar projects would be accelerated by retirement of legacy units in these regions.
Growth in renewable generation would also likely have a significant impact on transmission requirements. Although ERCOT did not estimate the costs of these transmission infrastructure improvements in this study, recent projects can be illustrative of the potential costs. In early 2014, the transmission upgrades needed to integrate the Texas Competitive Renewable Energy Zones (CREZ) were completed: more than 3,600 miles of new transmission lines constructed at a cost of $6.9 billion dollars. The project took nearly a decade to complete. The CREZ project has contributed to Texas’ status as the largest wind power producer in the U.S.
While the CREZ transmission upgrades provide transmission capacity beyond current generation development, these new circuits will not provide sufficient capacity to reliably integrate the amount of renewables necessary to achieve the requirements of the proposed rule. Also, if the locations of new renewable generation do not coincide with CREZ infrastructure, further significant transmission improvements will be required. Given the need to increase the amount of renewable resources in order to achieve the proposed compliance requirements in the Clean Power Plan, it is likely that significant new transmission infrastructure would be required to connect new renewable resources.
5. Impact on Energy Costs
The model output included detailed cost information that can be used to characterize the impact of the Clean Power Plan on energy prices in ERCOT. This section discusses the cost impacts for the baseline, $20/ton CO2, and $25/ton CO2 scenarios. All cost figures are reported in nominal dollars, except capital
costs, which are in real 2015 dollars.
The inclusion of carbon prices resulted in higher average locational marginal prices (LMPs) compared to the baseline scenario, as shown in Table 8.19 In the $20/ton carbon price scenario, the average LMP in ERCOT was $66.17 in 2020 and $81.13 in 2029 – 34% and 13% above the baseline scenario LMPs for those years, respectively. In the $25/ton carbon price scenario, the average LMP was $73.58 in 2020 and $84.28 in 2030
18 See ERCOT’s 2013 Report on Existing and Potential Electrical System Constraints and Needs, available from http://www.ercot.com/content/news/presentations/2014/2013%20Constraints%20and%20Needs%20Report.pdf. 19 LMPs for the CO2 limit scenario were not available at the time of completion of this report. They will be provided in the full report published in mid-December.

© 2014 Electric Reliability Council of Texas, Inc. All rights reserved. 16
Table 9: Fuel and Emissions Allowance Costs in 2020
Variable Costs Baseline CO2
Limit CO2
$20/ton CO2
$25/ton Total Fuel and Emissions Allowance Costs (billions of dollars)
12.9 12.9 16.4 17.0
Total Fuel and Emissions Allowance Costs change from Baseline (%)
n/a 0 28 32
Average Fuel and Emissions Allowance Cost ($/MWh) 30.54 31.82 40.80 41.65
Emissions Allowance Costs Only (billions of dollars) 0 0 3.5 4.1
Emissions Allowance Costs as percent of Total Fuel and Emissions Allowance Costs (%)
0 0 21 24
Table 10: Fuel and Emissions Allowance Costs in 2029
Variable Costs Baseline CO2
Limit CO2
$20/ton CO2
$25/ton Total Fuel and Emissions Allowance Costs (billions of dollars)
17.7 16.8 20.4 20.9
Total Fuel and Emissions Allowance Costs change from Baseline (%)
n/a -5 15 18
Average Fuel and Emissions Allowance Cost ($/MWh) 37.07 36.60 44.28 45.49
Emissions Allowance Costs Only (billions of dollars) 0 0 3.8 4.4
Emissions Allowance Costs as percent of Total Fuel and Emissions Allowance Costs (%)
0 0 19 21
– 49% and 17% above the baseline scenario estimates. As a general estimate, if wholesale power is 40% of the consumer bill, these increases in average LMPs would result in a retail energy price increase of 14 to 20% in 2020, and 5 to 7% in 2029. The increase in wholesale and consumer energy costs compared to the baseline decreases by 2029 due to the addition of new solar capacity, which has virtually no variable costs, and the accrual of energy efficiency savings. The costs of investments in energy efficiency are not estimated in this study. In their comments to the Public Utility Commission of Texas, EUMMOT estimated the cost of achieving the level of energy efficiency savings estimated by EPA at $1.6 to $2.9 billion per year in Texas.20
The LMP reflects the variable cost associated with the generation resource on the margin. Though this measure provides an estimate of wholesale energy prices for consumers, the increase in production costs for generators would differ. The model results indicate that generators’ variable costs (which include fuel and emissions allowance costs) in 2020 will increase by 28 to 32% in the $20/ton CO2 $25/ton CO2 scenarios, respectively, compared to the baseline, as shown in Table 9. The variable costs of the carbon scenarios reflect the increased cost of natural gas generation, and the effects of energy efficiency and additional renewable generation. By 2029, these costs are 15 to 18% above the baseline for the two respective scenarios, as shown in Table 10. This increase is due in large part to the CO2 emissions price, which in 2029 posed a cost of $3.8 billion in the $20/ton CO2 scenario and $4.4 billion in the $25/ton CO2 scenario, comprising 19% and 21% of total variable costs for the two respective scenarios.
Note that the information in Table 8, Table 9 and Table 10 do not include the associated costs of building or upgrading transmission infrastructure, natural gas infrastructure upgrades, ancillary services procurement, energy efficiency investments, and potential Reliability-must-run contracts.
20 Presentation by Jarrett E. Simon, Director Energy Efficiency, CenterPoint Energy. PUCT Workshop Project 42636: Comments on Proposed EPA Rule Regarding Greenhouse Gas Emissions for Existing Generating Units, August 15, 2014. Available from the Public Utility Commission of Texas, Docket 42636, Item 21.
© 2014 Electric Reliability Council of Texas, Inc. All rights reserved. 17
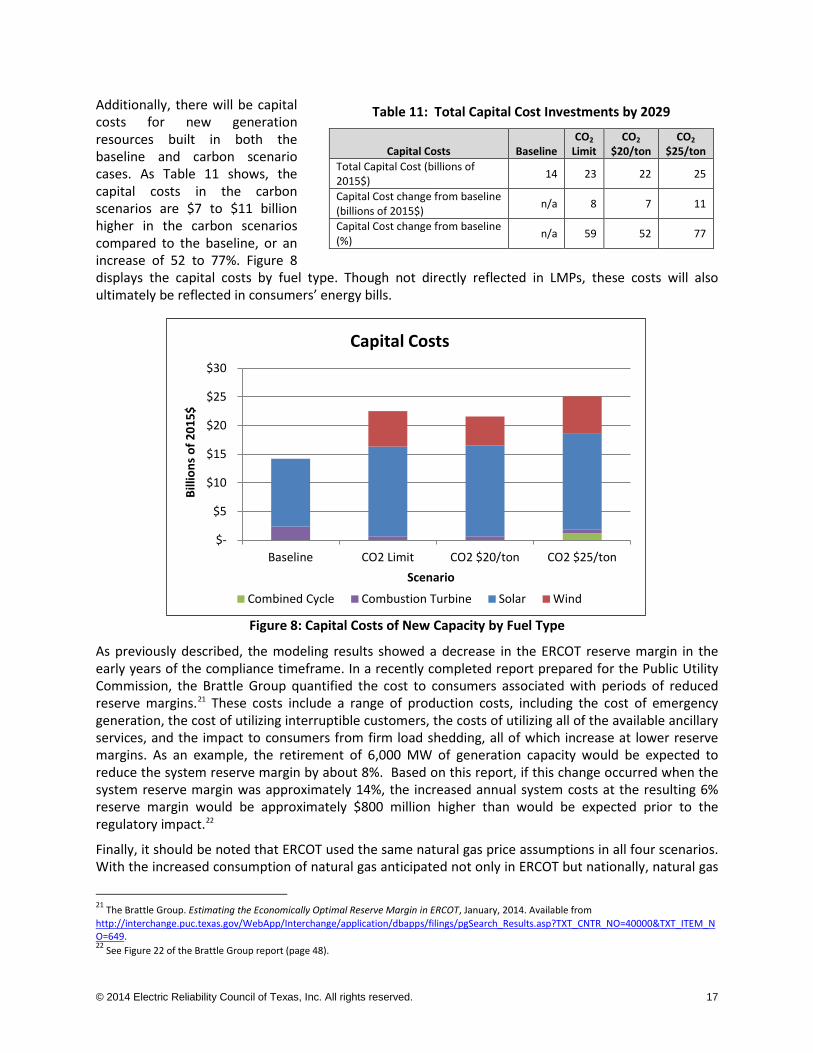
Table 11: Total Capital Cost Investments by 2029
Capital Costs Baseline CO2
Limit CO2
$20/ton CO2
$25/ton Total Capital Cost (billions of 2015$) 14 23 22 25
Capital Cost change from baseline (billions of 2015$) n/a 8 7 11
Capital Cost change from baseline (%) n/a 59 52 77
Additionally, there will be capital costs for new generation resources built in both the baseline and carbon scenario cases. As Table 11 shows, the capital costs in the carbon scenarios are $7 to $11 billion higher in the carbon scenarios compared to the baseline, or an increase of 52 to 77%. Figure 8 displays the capital costs by fuel type. Though not directly reflected in LMPs, these costs will also ultimately be reflected in consumers’ energy bills.
Figure 8: Capital Costs of New Capacity by Fuel Type
As previously described, the modeling results showed a decrease in the ERCOT reserve margin in the early years of the compliance timeframe. In a recently completed report prepared for the Public Utility Commission, the Brattle Group quantified the cost to consumers associated with periods of reduced reserve margins.21 These costs include a range of production costs, including the cost of emergency generation, the cost of utilizing interruptible customers, the costs of utilizing all of the available ancillary services, and the impact to consumers from firm load shedding, all of which increase at lower reserve margins. As an example, the retirement of 6,000 MW of generation capacity would be expected to reduce the system reserve margin by about 8%. Based on this report, if this change occurred when the system reserve margin was approximately 14%, the increased annual system costs at the resulting 6% reserve margin would be approximately $800 million higher than would be expected prior to the regulatory impact.22
Finally, it should be noted that ERCOT used the same natural gas price assumptions in all four scenarios. With the increased consumption of natural gas anticipated not only in ERCOT but nationally, natural gas
21 The Brattle Group. Estimating the Economically Optimal Reserve Margin in ERCOT, January, 2014. Available from http://interchange.puc.texas.gov/WebApp/Interchange/application/dbapps/filings/pgSearch_Results.asp?TXT_CNTR_NO=40000&TXT_ITEM_NO=649. 22 See Figure 22 of the Brattle Group report (page 48).
$-
$5
$10
$15
$20
$25
$30
Baseline CO2 Limit CO2 $20/ton CO2 $25/ton
Billi
ons
of 2
015$
Scenario
Capital Costs
Combined Cycle Combustion Turbine Solar Wind
© 2014 Electric Reliability Council of Texas, Inc. All rights reserved. 18
prices could increase beyond the levels anticipated in this modeling analysis. This would pose additional costs to consumers, which are not captured in this study.
6. Summary
Based on this analysis, it is evident that implementation of the proposed Clean Power Plan will have a significant impact on the planning and operation of the ERCOT grid. The proposed CO2 emissions limitations will result in significant retirement of coal generation capacity, could result in transmission reliability issues due to the loss of fossil fuel-fired generation resources in and around major urban centers, and will strain ERCOT’s ability to integrate new intermittent renewable generation resources. If the expected retirement of coal resources were to occur over a short period of time, reserve margins in the ERCOT region could reduce considerably, leading to increased risk of rotating outages as a last resort to maintain operating balance between customer demand and available generation. The need to maintain operational reliability (i.e., insufficient ramping capability) could require the curtailment of renewable generation resources. This would limit and/or delay the integration of renewable resources, leading to possible non-compliance with the proposed rule deadlines.
As noted previously, ERCOT supports the IRC proposal for inclusion of a reliability safety valve process in the context of the CO2 rule, as well as the consideration of electric grid reliability during the development of State Implementation Plans. These proposals could help mitigate the potential reliability impacts of the Clean Power Plan.
The Clean Power Plan will also result in increased energy costs for consumers in the ERCOT region. Based on ERCOT’s analysis, energy costs for consumers may increase by up to 20% in 2020, without accounting for the associated costs of transmission upgrades, natural gas supply infrastructure upgrades, procurement of additional ancillary services, energy efficiency investments, capital costs of new capacity, and other costs associated with the retirement or decreased operation of coal-fired capacity in ERCOT. Consideration of these factors would result in even higher energy costs for consumers.
ERCOT will issue the full report of this environmental regulatory impact study in mid-December 2014. The full report will include information about the impacts to ERCOT of several proposed or recently finalized environmental regulations, including MATS, CSAPR, the Regional Haze program, the 316(b) Cooling Water Intake Structures rule, and the coal ash rules. The report will also provide more details about the modeling analysis of the Clean Power Plan. As new information becomes available, ERCOT will continue to analyze the impacts of the Clean Power Plan, as well as other regulatory developments that may impact the ability to provide reliable electricity to consumers in Texas.
Related Documents