BEN-GURION UNIVERSITY OF THE NEGEV FACULTY OF ENGINEERING SCIENCES DEPARTMENT OF ELECTRICAL AND COMPUTER ENGINEERING Demand-Side Management in Smart Grid Using Game Theory THESIS SUBMITTED IN PARTIAL FULFILMENT OF THE REQUIREMENTS FOR THE M.Sc DEGREE By: Eran Salfati 02/2014

Welcome message from author
This document is posted to help you gain knowledge. Please leave a comment to let me know what you think about it! Share it to your friends and learn new things together.
Transcript

BEN-GURION UNIVERSITY OF THE NEGEV
FACULTY OF ENGINEERING SCIENCES
DEPARTMENT OF ELECTRICAL AND COMPUTER ENGINEERING
Demand-Side Management in Smart Grid Using Game Theory
THESIS SUBMITTED IN PARTIAL FULFILMENT OF THE REQUIREMENTS
FOR THE M.Sc DEGREE
By: Eran Salfati
02/2014

ii
BEN-GURION UNIVERSITY OF THE NEGEV
FACULTY OF ENGINEERING SCIENCES
DEPARTMENT OF ELECTRICAL AND COMPUTER ENGINEERING
Demand-Side Management in Smart Grid Using Game Theory
THESIS SUBMITTED IN PARTIAL FULFILMENT OF THE REQUIREMENTS
FOR THE M.Sc DEGREE
By: Eran Salfati
Supervised by: Prof. Raul Rabinovici
Author: Date:
Supervisor: Date:
Chairman of Graduate Studies Committee: Date:
02/2014

iii
Abstract
Smart grid describes an electrical power system which characterized by the use of
communication and information technology. By utilizing modern information technologies,
the Smart Grid is capable of delivering power in more efficient ways and responding to
wide ranging conditions and events. One of the main issues in the Smart Grid research is
to encourage the consumer to use energy efficiently. For example, the electric utility can
use real-time pricing to convince some users to reduce their power demand, so that the
total demand profile full of peaks can be shaped to a smoothed demand profile. The
mechanism to control the electric power consumption is called Demand-Side Management
(DSM).
On this work we propose a novel model for DSM which we call Asynchronous
Consumption Mode (ACM). The model principles are borrowed from networks
communication method and using Game Theory algorithm to characterize the consumers
and make a fair energy allocation between them.
The motivation to use game theory in our model is based on three reasons. First, Game
Theory is a strategic analysis of situations involving a number of factors (Players) aspires
for different purposes. Through game theory, we can find an optimal solution to situations
of conflict and cooperation, under the assumption that the involved players act in their
best interest. Even though all players are selfish, by seeking to optimize their individual
objective they end up optimizing a global objective. Second, recently, distributed
approaches, where the decisions are made locally and directly by the end consumer, have
taken more relevance. In this scenario, Game Theory provides a framework to evaluate and
design active side management policies, since it naturally models interactions in
distributed decision making processes. Finally, such model cannot be implemented unless
intelligent pricing schemes are used to provide incentives for the subscribers to follow
them. Game theory provides a natural framework for developing pricing mechanisms to
solve various problems in networks, such as fair allocation of resources among users.

iv
Acknowledgements
First and Foremost, I would like to convey my sincere thanks and gratitude to my
advisor Prof. Raul Rabinovici for his patience, guidance and critical input throughout the
entire thesis. For his believe and support along the way, without him this work would not
have reached the end.
I would like to thank my sister Liat Nakar for her assistance on issues related to the
application of computer science and game theory algorithms.
I also would like to thank to my friends Guy Zaidner and Shahar Levy for many hours
of shared thinking, professional assistance and support.
I would like to thank Dr. Ahuva Mu’alem for her professional advice regarding fair
division methods.
Last but not least, I would like to extend my thanks to my wife Bat-El and my lovely
sons Arbel and Eliya for their support that made this thesis possible.

v
Acronyms
ABR Available Bit Rate
ACM Asynchronous Consumption Mode
ACR Available Consumption Rate
AMI Advanced Metering Infrastructure
ATM Asynchronous Transfer Mode
BR Best Response
CBR Constant Bit Rate
CBR Constant Bit Rate
CCR Constant Consumption Rate
CPP Critical Peak Pricing
DLC Direct Load Control
DR Demand Response
DSM Demand-Side Management
ECS Energy Consumption Scheduling
ED Equitable Division
EMS Energy Management Systems
ICT Information and Communication Technology

vi
ILP Integer Linear Programming
IT Information Technology
LAN Local Area Network
NE Nash Equilibrium
NIST National Institute of Standards and Technology
PAR Peak to Average Ratio
PD Proportional Division
QOS Quality Of Service
RTP Real Time Pricing
SCADA Supervisory Control And Data Acquisition
STM Synchronous Transfer Mode
TOU Time Of Use
UBR Unspecified Bit Rate
UCR Unspecified Consumption Rate
UD Utilitarian Division
VBR Variable Bit Rate
VCG Vickrey-Clarke-Groves

vii
Contents
1111 IntroductionIntroductionIntroductionIntroduction .................................................................................................................................................................................................................................................................................................................................................................................................... 1111
1.1 The Fundamental Problem................................................................................. 1
1.2 Introduction to Smart Grid ................................................................................ 2
1.3 Research Topics on Smart Grid ......................................................................... 7
1.4 Demand-Side Management (DSM) ..................................................................... 9
1.5 The Motivation of Using Game Theory ........................................................... 14
1.6 Thesis Objectives .............................................................................................. 15
1.7 Thesis Organization .......................................................................................... 15
1.8 Conclusions ....................................................................................................... 15
2222 Game Theory as a Tool for DemandGame Theory as a Tool for DemandGame Theory as a Tool for DemandGame Theory as a Tool for Demand----Side ManagementSide ManagementSide ManagementSide Management ........................................................................................................................ 16161616
2.1 Introduction ...................................................................................................... 16
2.2 A Problem Representation Using Game Theory .............................................. 17
2.3 Nash Equilibrium ............................................................................................. 18
2.4 Mechanism Design ............................................................................................ 19
2.5 Fair Division ..................................................................................................... 21
2.6 Conclusions ....................................................................................................... 25
3333 Related WorksRelated WorksRelated WorksRelated Works ............................................................................................................................................................................................................................................................................................................................................................................ 26262626
3.1 Introduction ...................................................................................................... 26
3.2 Demand-Side Management Based on Scheduling ............................................. 26
3.3 Real Time Demand-Side Management ............................................................. 30
3.4 Open Issues on Related Works ......................................................................... 32
3.5 Conclusions ....................................................................................................... 34
4444 Demand Side Management Control System ModelDemand Side Management Control System ModelDemand Side Management Control System ModelDemand Side Management Control System Model .................................................................................................................................................... 35353535
4.1 Introduction ...................................................................................................... 35
4.2 System Goals .................................................................................................... 36
4.3 System Model ................................................................................................... 37
4.4 Control Loop Description ................................................................................. 38
4.5 Asynchronous Consumption Mode (ACM) ....................................................... 39
4.6 Consumer Characterization .............................................................................. 40
4.7 Fair Division Algorithm ................................................................................... 42

viii
4.8 Price Profile ...................................................................................................... 46
4.9 Energy Consumption Controller (ECC) ........................................................... 47
4.10 Conclusions ....................................................................................................... 48
5555 Performance DemonstrationPerformance DemonstrationPerformance DemonstrationPerformance Demonstration ............................................................................................................................................................................................................................................................................................ 49494949
5.1 Introduction ...................................................................................................... 49
5.2 Experimental Setup .......................................................................................... 50
5.3 Simulation Results ............................................................................................ 51
5.4 Interpretation of the results.............................................................................. 62
5.5 Conclusions ....................................................................................................... 63
6666 SummarySummarySummarySummary ............................................................................................................................................................................................................................................................................................................................................................................................................ 64646464
6.1 Conclusions ....................................................................................................... 64
6.2 Thesis Presentations ......................................................................................... 64
6.3 Thesis Contributions ........................................................................................ 65
6.4 Future Directions ............................................................................................. 66
7777 BibliographyBibliographyBibliographyBibliography ........................................................................................................................................................................................................................................................................................................................................................................................ 67676767

1
1 Introduction
1.1 The Fundamental Problem
The initial research question of this thesis describes a system with several consumers
connected to a single limited energy source as describes in Figure 1. All consumers need a
certain amount of energy from the total capacity of the source, but the total demand of all
consumers together, exceeds the supply capacity of the shared source. The basic questions
are how to manage the shared resource fairly and how to do it using tools borrowed from
game theory.
Practical example of such case can be factory operates several facilities through local
generator. The goal of the factory owner would be to maximize the utilization of the
expensive generator.
Figure Figure Figure Figure 1111 – The Fundamental Problem DescriptionThe Fundamental Problem DescriptionThe Fundamental Problem DescriptionThe Fundamental Problem Description

2
1.2 Introduction to Smart Grid
1.2.1 Definition
The ”Smart grid” phrase does not have an absolute definition yet. There are several
basic articles [1] [2] [3] [4] and entities [5] [6] which explain the meaning of the phrase, the
motivation, the goals and the challenges. Generally, Smart grid is a phrase that describes
an electrical power system which characterized by the use of communication and
information technology in the generation, delivery and consumption of electrical energy.
Smart Grid uses two-way flows of electricity and information to create an automated and
distributed advanced energy delivery network.
By utilizing modern information technologies, the Smart Grid is capable of delivering
power in more efficient ways and responding to wide ranging conditions and events. For
example, the electric utility can use real-time pricing to convince some users to reduce
their power demand, so that the total demand profile full of peaks can be shaped to a
smoothed demand profile.
Secure Communication Interface
Electrical Interface
Figure Figure Figure Figure 2222 – NIST Smart Grid FrameworkNIST Smart Grid FrameworkNIST Smart Grid FrameworkNIST Smart Grid Framework

3
The conceptual model of smart grid according to the National Institute of Standards
and Technology (NIST) consists of seven domains [7] namely, Bulk Generation,
Transmission, Distribution, Customers, Operations, Markets and Service Providers. From
the pictorial illustration in Figure 2, it is clear that information flow is vital for the
operation of Smart Gird, connecting the various domains and forming the lifeline of the
grid. It is this 2-way communication that enables the smart grid to be ”SMART” and
dynamic compared to the traditional grid. The traditional electricity grid had information
flow in only one direction from generation to the customer.
1) Bulk GenerationBulk GenerationBulk GenerationBulk Generation – The generation of electricity from a variety of sources both
renewable and non-renewable in bulk quantities used to supply the customers.
2) TransmissionTransmissionTransmissionTransmission – The transmission of the electricity from distributed bulk generation
sources to substations. It takes care of the operational stability of the grid by
balancing the supply and demand.
3) DistributionDistributionDistributionDistribution – A bridge between the transmission and customer domains. The
distribution network connects all the customers to the grid using the smart meter
which forms the information network of the grid.
4) CustomersCustomersCustomersCustomers – The customers has the capability for communication to the utility
company through secure interface for interactions. This can be used to provide
advanced Energy Management Systems (EMS) at the customer end.
5) Service ProviderService ProviderService ProviderService Provider – Support the business process of energy generation, distribution
and customers through billing, customer account management, to providing
assistance in home energy generation.
6) OperationsOperationsOperationsOperations – Responsible for smooth operation of the grid by monitor, analyze and
optimize the grid operations, fault management and grid statistics.
7) MarketsMarketsMarketsMarkets – The financial end of the smart grid. It is responsible for market
management and operations, retailing, trading, ancillary operations etc.

4
1.2.2 The Current Electric Grid Limitations
The key characteristics of the conventional electric energy system includes [8]:
Centralized sources of power generation, Unidirectional flow of energy from the sources to
the customers, Passive participation by the customers, Customer knowledge of electrical
energy usage is limited to a monthly bill, Real-time monitoring and control is mainly
limited to generation and transmission and Lack of flexibility in integrating alternative
sources and efficiently manage new services desired by the users. These conventional
attributes have adequately served the needs of electric utilities and their customers in the
past.
In most cases today, there are no sensors in distribution grids that communicate the
actual voltages delivered to customers, so systems must be operated based on estimates of
losses along the line. Another source of inefficiency arises from the peaked nature of
electricity demand. Generation and transmission capacity is provided to meet peak
demand that occurs infrequently, for example on hot summer afternoons in areas where air
conditioning represents a significant load. Residential consumers generally pay little
attention to how they use electricity because they do not receive any timely or actionable
information about their consumption.
The conventional forms of electricity generation cause about 40 percent of the human
emission of CO2. The need to reduce carbon emissions has become an urgent global
priority to mitigate climate change.
Smart sensors can allow the utilities to receive more information about the power
system to get more control in form of reliability. However, with most utilities, the
integration of all the information available has not become a reality yet. This approach,
which operates solely from cause and effect, while useful, only provides the utility the
ability to fix the problem after it occurs while some faults can be avoided by planning and
maintenance. The current practices of most utilities can be defined as a reactive approach
to power system operation rather than proactive approach.

5
1.2.3 The Smart Grid Goals
Although a precise and comprehensive definition of Smart Grid has not been proposed
yet, according to the report from NIST1 [7], the anticipated benefits and requirements of
Smart Grid are the following:
1) Improving power reliability and quality.
2) Optimizing facility utilization and averting construction of back-up (peak load)
power plants.
3) Enhancing capacity and efficiency of existing electric power networks.
4) Improving resilience to disruption.
5) Enabling predictive maintenance and self-healing responses to system disturbances.
6) Facilitating expanded deployment of renewable energy sources.
7) Accommodating distributed power sources.
8) Automating maintenance and operation.
9) Reducing greenhouse gas emissions by enabling electric vehicles and new power
sources.
10) Reducing oil consumption by reducing the need for inefficient generation during
peak usage periods
11) Presenting opportunities to improve grid security.
12) Enabling transition to plug-in electric vehicles and new energy storage options.
13) Increasing consumer choice.
14) Enabling new products, services, and markets.
1 NISTNISTNISTNIST – The National Institute of Standards and Technology – A nonregulatory science agency within the U.S. Department of Commerce, which is responsible to coordinate the development of interoperability standards for the U.S. Smart Grid.

6
1.2.4 Professional Literature
1) Smart Grid: Fundamentals of Design and AnalysisSmart Grid: Fundamentals of Design and AnalysisSmart Grid: Fundamentals of Design and AnalysisSmart Grid: Fundamentals of Design and Analysis [9] – A primer handbook which
addressing the fundamentals of Smart Grid. The book provides a fundamental
discussion on the motivation for the Smart Grid development, the working
definition and the tools for analysis and development of the Smart Grid.
2) Smart Power: Climate Change, the Smart Grid, and the Future of Electric Smart Power: Climate Change, the Smart Grid, and the Future of Electric Smart Power: Climate Change, the Smart Grid, and the Future of Electric Smart Power: Climate Change, the Smart Grid, and the Future of Electric UtilitiesUtilitiesUtilitiesUtilities
[10] – This book starts with the deregulatory efforts of the 1990s and their gradual
replacement by concerns over climate change, promoting new technologies, and
developing stable prices and supplies. Later on, it explains the revolutionary
changes that the Smart Grid is bringing to utility operations.
3) Smart Grid: Integrating Renewable, Distributed and Efficient EnergySmart Grid: Integrating Renewable, Distributed and Efficient EnergySmart Grid: Integrating Renewable, Distributed and Efficient EnergySmart Grid: Integrating Renewable, Distributed and Efficient Energy [11] – This
book explain the most recent innovations supporting Smart Grid development. It
includes topics like smart metering, renewable energy resources, plug-in hybrids,
flexible demand response, micro-grids, and specific in-depth coverage of wind and
solar power integration.
4) Smart Grid: Technology and ApplicationsSmart Grid: Technology and ApplicationsSmart Grid: Technology and ApplicationsSmart Grid: Technology and Applications [12] – This book provides a basic
discussion of the Smart Grid concept and describes the technologies that are
required for its realization. The content of the book is grouped into three main
technologies: Information and communication systems; Sensing, measurement,
control and automation and Power electronics and energy storage.
5) Control and Optimization Methods for Electric Smart GridsControl and Optimization Methods for Electric Smart GridsControl and Optimization Methods for Electric Smart GridsControl and Optimization Methods for Electric Smart Grids [13] – This book
consolidate some of the most promising and transformative recent research in Smart
Grid control. The book contains eighteen chapters written by leading researchers in
power, control, and communication systems. The essays are organized into three
broad sections, namely Architectures and Integration, Modeling and Analysis, and
Communication and Control.

7
1.3 Research Topics on Smart Grid
The new needs of more energy knowledgeable, computer savvy, and environmentally
conscious customers, combined with regulatory changes, availability of more intelligent
technologies, and ever greater demands for enough energy to drive the global economy,
arises few challenges for the future grid [14]:
1) AAAAutomated utomated utomated utomated SSSSensors and ensors and ensors and ensors and CCCControlsontrolsontrolsontrols – Dynamic optimization of voltage levels and
reactive power may permit reduction of voltage levels by a few percent and reduce
power consumption.
2) Advanced Advanced Advanced Advanced MMMMetering etering etering etering IIIInfrastructure (AMI)nfrastructure (AMI)nfrastructure (AMI)nfrastructure (AMI) – Smart meters that electronically record
interval data provides near real-time information about electricity usage and cost to
an in-home display or software application, allows consumers to make informed
choices about energy use and control their cost.
3) DemandDemandDemandDemand----Side ManagementSide ManagementSide ManagementSide Management (DSM)(DSM)(DSM)(DSM) – Enable signaling between the grid and the
consumer in order to reduce consumption during peak hours and shift demand to
off-peak periods. That can be achieved for example using dynamic pricing scheme or
direct control.
4) Clean Energy Sources Clean Energy Sources Clean Energy Sources Clean Energy Sources – Reducing the production of carbon dioxide in electricity
generation will require a variety of clean or cleaner energy sources, including coal
with carbon capture and sequestration, natural gas, nuclear, hydro, geothermal,
biomass, and increased use of wind and solar. Utilities will need to have real-time
information about these systems to maintain reliable grid operation.
5) Energy Storage Energy Storage Energy Storage Energy Storage – Since the grid must always maintain a real-time balance of load
and generation, a significant increase in the use of wind and solar will require
increasing use of storage and a greater ability to modulate demand in order to keep
the grid in balance. The operation of the system, which today is generally
controllable and deterministic, will become much more dynamic and stochastic in
nature.

8
6) Grid Reliability Grid Reliability Grid Reliability Grid Reliability – The reliability of the grid can be enhanced through the
deployment of sensors that provide real-time situational awareness. Sensors will
allow earlier detection of and response to anomalies and make widespread cascading
failures less likely.
7) CommunicationCommunicationCommunicationCommunication System System System System – Communications and information technology (IT) play a
critical role in the smart grid. The smart grid will ultimately involve networking
large numbers of sensors in transmission and distribution facilities, smart meters,
SCADA systems, back-office systems, and devices in the home which will interact
with the grid. Large amounts of data will be generated by meters, sensors and
synchrophasors. Techniques for managing, analyzing and acting on this data will
need to be developed.
8) Cyber Cyber Cyber Cyber SecuritySecuritySecuritySecurity – Ensuring cyber security of the Smart Grid is a critical priority
[15]. Security must be designed in at the architectural level, not added on later.
Ongoing research is needed to help ensure security of the grid. New threats will
continually surface, and ongoing development of new technologies and
methodologies to detect and mitigate threats and vulnerabilities will continue to be
a top priority for smart grid efforts.
9) Standards Standards Standards Standards – Development of standards for the Smart Grid requires efforts at
national, regional and international levels. Many of the suppliers of equipment and
systems used in the smart grid are global companies that seek to address markets
around the world. Unnecessary variations in equipment and systems add cost, which
eventually gets passed on to consumers. International standards promote supplier
competition and expand the range of options available to utilities, resulting
ultimately in lower costs for consumers.

9
1.4 Demand-Side Management (DSM)
1.4.1 Definition
DSM is the planning, implementation, and monitoring of those utility activities
designed to influence customer use of electricity in ways that will produce desired changes
in the utility’s load shape, like changes in the time pattern and magnitude of a utility’s
load [16].
1.4.2 Benefits
DSM programs provide a number of benefits. From the utility perspective, it can reduce
electricity consumption and defer the construction of new power plants and transmission
lines. DSM can also bring economic benefits in the form of reduced capital expenditure,
reduced operating costs, fuel savings, improved system efficiencies, and reduced losses.
From the customer perspective, DSM can reduce energy bills and improve the service and
comfort levels achieved.
1.4.3 Demand-Side Management in Smart Grid
DSM programs have existed across the globe since the 1970s. The initial generations of
DSM programs were limited by the technology available [17]. Lack of ICT infrastructure,
lack of understanding of the benefits of DSM solutions, not competitive compared with
traditional approaches, operational complexity, inappropriate market structure and lack of
incentives resulted in a lack of efficiency DSM programs.
Smart grid provides the framework to make DSM programs cost-effective and
convenient [18]. The increasing penetration of smart meters, the widespread networks and
the intelligent grid the gives utilities visibility into real-time supply and demand balancing
gives crucial advantages over those of the past.

10
1.4.4 Classification
Figure Figure Figure Figure 3333 – DSM Programs ClassificationDSM Programs ClassificationDSM Programs ClassificationDSM Programs Classification
1) Energy ReductionEnergy ReductionEnergy ReductionEnergy Reduction ProgramsProgramsProgramsPrograms – Reducing demand through more efficient processes,
buildings or equipment. This category covers a large number of measures in all
sectors include examples of typical energy reduction measures and a series of
”energy saving tips”.
2) Load Load Load Load ManagementManagementManagementManagement ProgramsProgramsProgramsPrograms ((((Load ShapeLoad ShapeLoad ShapeLoad Shape / Demand Response/ Demand Response/ Demand Response/ Demand Response)))) – These programs
offer payments to participants to reduce their electricity usage when called upon by
the system operator either for reliability or economic reasons.
a. Direct Load Control (DLC) Direct Load Control (DLC) Direct Load Control (DLC) Direct Load Control (DLC) – In this way, loads (e.g. heating, cooling,
ventilation and lighting) can be switched on or off, often remotely, by the
utility. In this case, the customers may have back-up generators or energy
storage capability and generally have an interruptible agreement with the
utility in return for a special rate. Utilities may even call on on-site
generators to meet peak demand on the grid. The energy distribution
industry may use rolling blackouts to reduce demand when the demand
surpasses the capacity. Rolling blackouts are the systematic switching off of
supply to areas within a supplied region such that each area takes turns to
DSMDSMDSMDSM
Load growth and conservation
programs
Strategic load growth
Strategic load conservation
Load Management
Programs
Tariff incentives and penalties
Real Time Pricing (RTP)
Clitical Peak Pricing (CPP)
Time Of Use (TOU)
Load Leveling
Load ShiftingValley FillingPeak Clipping
Direct Load Control (DLC)
Energy Reduction Programs

11
”lose” supply. Utilities or municipalities in these cases would try to publish
or announce a schedule so that businesses and homes can plan their use of
energy for that period.
b. Load Leveling Load Leveling Load Leveling Load Leveling – Optimize the current generating base-load without the need
for reserve capacity to meet the periods of high demand. A common term to
describe these approaches called PAR (Peak to Average Ratio), where the
target is to minimize it in the system consumption profile.
i. Peak Clipping Peak Clipping Peak Clipping Peak Clipping – Reduction of load by using utility direct load
control (DLC) of customer’s appliances during peak times.
ii. Valley Filling Valley Filling Valley Filling Valley Filling – Load construction during off-peak period by using
techniques like electric-based thermal energy storage (water and / or
space heating or cooling).
iii. Load ShiftingLoad ShiftingLoad ShiftingLoad Shifting – Shifting load from on-peak to off-peak periods by
using of energy storage and customer load shifts. This can be
regarded as a combination of peak clipping and valley filling.
Figure Figure Figure Figure 4444 – Load LevelingLoad LevelingLoad LevelingLoad Leveling

12
c. Tariff incentives and penaltiesTariff incentives and penaltiesTariff incentives and penaltiesTariff incentives and penalties – Utilities encourage a certain pattern of use
by tariff incentives where customers use energy at certain times to achieve a
better-priced rate for their energy use.
i. Time Of Use (TOU) Time Of Use (TOU) Time Of Use (TOU) Time Of Use (TOU) – The electricity prices differ in different blocks
of time. Generally, the rate during peak periods is higher than the
one during off-peak periods. The simplest TOU rate has two time
blocks: the peak and the off-peak.
ii. Critical Peak Pricing (CPP)Critical Peak Pricing (CPP)Critical Peak Pricing (CPP)Critical Peak Pricing (CPP) – Typical goal of CPP is to more
dramatically reduce load during the relatively few, very expensive
hours. Very high ”critical peak” prices are assessed for certain hours
on event days (often limited to 10-15 per year). Prices can be 3-10
times as much during these few hours.
iii. Real Time Pricing Real Time Pricing Real Time Pricing Real Time Pricing (RTP) (RTP) (RTP) (RTP) – An hourly fluctuating prices reflecting
the real cost of electricity in the wholesale market. Customers are
informed about the prices on a day-ahead or hour-ahead basis based
on the utility’s load, power market and power producers who
participate in satisfying the demand. Implementing a RTP program
requires significant technology investment, including automated
interval metering, along with more complex price forecasting,
communications and billing systems. Many economists are convinced
that RTP is the most direct and efficient load management method
suitable for competitive electricity markets and should be the focus
of policymakers. At the moment, there are some obstacles to
implement this program in terms of the aspects of technologies,
incentive to consumers and utility companies, supportive policies and
regulations, and pricing schemes.

13
3) Load growth and Load growth and Load growth and Load growth and CCCConservationonservationonservationonservation – Load growth programs are implemented with the
intention of improving customer productivity and environmental compliance while
increasing the sale of kW for the utilities. This increases the market share of the
utility and enables an ability to fill valleys and increase peaks.
a. Strategic Strategic Strategic Strategic Load Load Load Load ConservationConservationConservationConservation – Load shape changes occur as a response to
utility programs like appliance efficiency improvement. ’Strategic’ is
intended to distinguish between naturally occurring and utility-stimulated.
b. StrategicStrategicStrategicStrategic Load GrowthLoad GrowthLoad GrowthLoad Growth – Utility encouragements for customers aim to adopt
electro-technologies (electrification), either to replace inefficient fossil fuel
equipment or to improve customer productivity and quality of life. This
results in the increase of electric energy intensity and lowering the average
cost of service by spreading the fixed cost over a larger base of energy sales,
and thus benefiting both the utility companies and the customers.
Figure Figure Figure Figure 5555 – Load Growth and ConservationLoad Growth and ConservationLoad Growth and ConservationLoad Growth and Conservation

14
1.5 The Motivation of Using Game Theory
Game Theory is a strategic analysis of situations involving a number of factors
(Players) aspires for different purposes. More formally, it is the study of mathematical
models of conflict and cooperation between intelligent rational decision-makers. On the one
hand, Game Theory attempts to predict the players moves, on the other hand, is trying to
offer players the best move for them [19] [20].
The smart grid is expected to be influenced by many deciding factors. In order to make
independent and inter-dependent decisions, game theory has been adopted by a number of
researchers. Through game theory, researchers aim at finding optimal solutions to
situations of conflict and cooperation, under the assumption that the involved players act
in their best interest. The most commonly used solution concepts are equilibrium concepts,
most famously Nash Equilibrium. In this case, even though all players are selfish, by
seeking to optimize their individual objective they end up optimizing a global objective.
Some initiatives have considered centralized demand management approaches where the
electrical companies might control the domestic appliances. The disadvantage of these
approaches includes social and legal barriers, large flow of information and scalability.
Recently, distributed approaches, where the decisions are made locally and directly by the
end consumer, have taken more relevance. In this scenario, game theory provides a
framework to evaluate and design active side management policies, since it naturally
models interactions in distributed decision making processes.
Finally, despite the importance of an efficient energy consumption system, such large-
scale plans cannot be implemented unless intelligent pricing schemes are used to provide
incentives for the subscribers to follow them. The incentives can be in form of lower utility
charges. Game theory provides a natural framework for developing pricing mechanisms to
solve various problems in networks, such as fair allocation of resources among users. A well
pricing mechanism can provide the subscribers with the incentives to cooperate in order to
not only improve the system overall performance, but also to pay less individually.

15
1.6 Thesis Objectives
1) Study how to implement relevant Game Theory tools for Demand-Side Management
in Smart Grid.
2) Propose a Control System Model for Demand-Side Management in Smart Grid
Using Game Theory to solve the fundamental problem.
The Model should include:
a. Practical Consumer Characterization Method.
b. An Algorithm for Fair Consumption Allocation.
c. An Energy Consumption Controller.
1.7 Thesis Organization
The rest of this thesis is structured as follows. In chapter 2 we review some
preliminaries from game theory and the relevant tools which can be used for DSM. In
chapter 3 we outline related works and point at open issues that we identify. In chapter 4
we describe our DSM control system model based on game theory tools. In chapter 5 we
present some simulation results and conclude in chapter 6.
1.8 Conclusions
In this chapter we introduced the fundamental problem of this thesis, we presented the
main terms and research topics of smart grid, we made a detail survey on demand-side
management and we explained the motivation of using game theory in the context of this
subject.

16
2 Game Theory as a Tool for Demand-Side Management
2.1 Introduction
Game theory is a wide discipline in mathematics which applies to a wide range of
behavioral relations, both human and non-human, as a logical method of decision science.
It is used in economics, political, psychology, biology, and today also in computer science.
Game theory defines a very wide range of topics include different kind of games, strategies,
information types, solution concepts, incentives, etc.
The first goal of this thesis is to research relevant tools in game theory which can be
practically applied in order to solve DSM problems. In this chapter we will introduce the
theoretical aspect of these tools in a dedicated form for DSM.
The main question that game theory tries to deal with in the context of DSM is how to
cause the consumer to act in a way that serves the utility interests without hurt the
consumer’s benefit. For this, we should choose game theoretic tools which allow us to
design a fair algorithm includes appropriate incentives that motivate the consumer to
cooperate with the DSM program.
In this chapter we will focus especially in Mechanism Design and Fair Division topics as
a theoretical basis for the proposed control system. Mechanism Design serves us in the
part of consumer characterization and the game formulation, Fair Division serve us in the
part of energy allocation of the shared source.

17
2.2 A Problem Representation Using Game Theory
We define a normal form (strategic form) game as follows [21]:
• A finite set of players � = �1,2, …� • Each player ∈ � chooses actions from a strategy set � • Outcomes are defined by strategy profiles which consist of all the strategies
chosen by individual players. Mathematically, the set of strategy profiles are
defined as � = �� × �� × …× �� • Players have preferences over the outcomes (note, NOT preferences over their
actions), denoted as ≼ .Usually these preferences are defined by a utility
function, � ∶ � → � that maps each outcome to a real number (sometimes called
a payoff function).
An instance of a game might be represented by the tuple (�, (� �, (≼ ��, containing the
players, strategy sets, and preferences.
For any outcomes � and ��, � ≼� �� if ��(� � ≤ ��(���. That is, a player � prefers one
outcome, ��, over another, � , if and only if that player’s utility function is higher for that
outcome. The best response function for a player ∈ � is defined as:
�� (� � = �� ∈ � ∶ � (� �, � � ≤ � (� , � �∀� � ∈ � (2.1)
where � represent the set of strategy choices of all players except . The best response function gives the strategy � for player from his possibly strategy
set � , given that he knows all the other players’ strategies in � , that maximizes player
′� utility function.

18
2.3 Nash Equilibrium
Now that we showed how to define games, we will explain the meaning of ”solving”
them. In game theory, a solution concept is a formal rule for predicting how a game will be
played. These predictions are called ”solutions”, and describe which strategies will be
adopted by players and, therefore, the result of the game. The most commonly used
solution concepts are equilibrium concepts, most famously Nash Equilibrium (NE).
The NE is conceptually the state of the game where if each player was given the chance
to change strategies given all of the other players’ strategies, the player would not be able
to profitably deviate from its current strategy.
DefinitionDefinitionDefinitionDefinition:::: [22] in the n-player normal-form game # = (��, … , ��; ��, … , ��, the
strategies (��∗, … , ��∗� are a Nash Equilibrium if, for each player , � ∗ is player i’s best
response to the strategies specified for the � − 1 other players, (��∗, … , � �∗ , � (�∗ , … , ��∗�: � (��∗, … , � �∗ , � ∗, � (�∗ , … , ��∗� ≥ � (��∗, … , � �∗ , � , � (�∗ , … , ��∗� (2.2)
for every feasible strategy � in � ; that is, � ∗ solves
max-.∈/. � (��∗, … , � �∗ , � , � (�∗ , … , ��∗�. (2.3)
Such a notion of equilibrium presents three issues [23]. The first one is efficiency. In
many situations of practical interest, Nash equilibria tend to be rather inefficient in terms
of social welfare. The second issue relates to the assumption that players are rational, i.e.,
that a player would always choose a best response to the system state, in terms of
maximizing his own utility. When agents are humans, they may behave in an irrational
way or may not be aware of the complete structure of the game, thereby taking non-
optimal decisions. The third issue relates the reachability of equilibrium: under which
conditions the system’s dynamics is actually able to drive the system to a certain
configuration and how much it would take for the system to stabilize there.

19
2.4 Mechanism Design
2.4.1 Preface
Mechanism Design, sometimes called reverse game theory, can be consider as the
”engineering” part of game theory. In classic game theory models, we usually try to figure
out or predict the outcomes of a given conflict. In mechanism design we do exactly the
opposite. That is, we start with the outcome (the goal we want to achieve) and we ask
what kind of procedure could be designed to achieve those goals.
It is best to view the goals of the designed mechanisms in the very abstract terms of
social choice [24]. A social choice is simply an aggregation of the preferences of the
different participants towards a single joint decision. Mechanism Design attempts
implementing desired social choices in a strategic setting, assuming that the different
members of society each act rationally in a game theoretic sense. Such strategic design is
necessary since usually the preferences of the participants are private.
In order to describe the player preference, it is not enough to say that one alternative is
preferred compered to another, the model should took into account also ”how much” it
preferred. Money is a common yardstick that allows measuring this. In a world with
money our mechanisms will not only choose a social alternative but will also determine
monetary payments to be made by the different players. The complete social choice is then
composed of the alternative chosen as well as of the transfer of money.
A well designed mechanism should cause players to be true in relation to their
preferences. Such mechanism usually called incentive compatibility or truthfulness.
Intuitively this means that player whose valuation is � would prefer ”telling the truth”
� to the mechanism rather than any possible ”lie” � �, since this gives him higher utility.

20
2.4.2 Mechanism design as a tool for Demand-Side Management
Mechanism design helps us to build a DSM model in the part of characterize the
consumer preferences and write the game formulation. Each individual subscriber in a
power system is an entity which can behave independently. The energy demand of each
subscriber may vary based on different parameters like the time of day, climate conditions,
and also the price of electricity. The different response of different users to various price
scenarios can be modeled analytically by adopting the concept of utility function from
microeconomics [25]. We can model the behavior of different users through their different
choices of utility function � . The utility function represents the level of satisfaction
obtained by the user as a function of its power consumption. The utility function � (1�, where 1 represent the consumption level, should fulfill the following properties:
Property 1Property 1Property 1Property 1:::: Utility functions � (1� are non-decreasing. Users are always interested to
consume more power if possible until they reach their maximum consumption level.
2� (1�21 ≥ 0 (2.4)
DefinitionDefinitionDefinitionDefinition 1111:::: We define 4 (1� ≜ � �(1� as the marginal benefit of the user.
Property 2: Property 2: Property 2: Property 2: The marginal benefit 4 (1� of customers is a non-increasing function.
24 (1�21 ≤ 0 (2.5)
In other words, the utility functions are concave and the level of satisfaction for users
can gradually get saturated.
Property 3: Property 3: Property 3: Property 3: We assume the expectation that no power consumption brings no benefit.
� (0� = 0 (2.6)

21
2.5 Fair Division
2.5.1 Preface
Fair division is the problem of dividing a set of goods between several people [26] [27].
This problem arises in various real-world settings: auctions, divorce settlements, frequency
allocation and territory. This is an active research area in Mathematics, Economics and
Game theory. The problem of fair division goes back at least to the Hebrew Bible.
Abraham and Lot had to decide who would get Canaan and who Jordan; Solomon had to
decide which of two women, was the mother of a disputed baby.
There are many different kinds of fair division problems, depending on the nature of
goods to divide, the criteria for fairness, the nature of the players and their preferences,
and other criteria for evaluating the quality of the division.
2.5.2 What is divided?
We define 6 as a set of items which should be divided between a group of � players
7�, 7�, 78…7�. The set of 6 can be of several types:
Invisible Invisible Invisible Invisible andandandand DivisibleDivisibleDivisibleDivisible::::
• Indivisible itemsIndivisible itemsIndivisible itemsIndivisible items – A finite set of items such that each item should be given
entirely to a single person. For example: computer, car and apartment.
• Divisible itemsDivisible itemsDivisible itemsDivisible items – An infinite set of resources, usually modeled as a subset of a
real space like [0, 1] section. For example: money, cake and water.
Homogeneous and HeterogeneousHomogeneous and HeterogeneousHomogeneous and HeterogeneousHomogeneous and Heterogeneous::::
• Homogeneous itemsHomogeneous itemsHomogeneous itemsHomogeneous items – Uniform in composition or characters like money.
• Heterogeneous itemsHeterogeneous itemsHeterogeneous itemsHeterogeneous items – Nonuniform in characters like cake.

22
Desirable and UndesirableDesirable and UndesirableDesirable and UndesirableDesirable and Undesirable::::
• Desirable itemsDesirable itemsDesirable itemsDesirable items – Items that is considered a favorable outcome like car or cake.
• Undesirable itemsUndesirable itemsUndesirable itemsUndesirable items – Such as house chores (which can also be indivisible, such as
dumping the trash, or divisible, like mowing the lawn).
2.5.3 Common Fair Division Problems
• Fair Fair Fair Fair AAAAllocation or Fair Allocation or Fair Allocation or Fair Allocation or Fair Assignmentssignmentssignmentssignment – Dividing a set of indivisible and
heterogeneous items.
• Cake Cutting Cake Cutting Cake Cutting Cake Cutting – Dividing a set of divisible, heterogeneous and desirable resource.
• Chore Division Chore Division Chore Division Chore Division – Dividing a set of heterogeneous and undesirable items.
• Housemate Problem Housemate Problem Housemate Problem Housemate Problem – Dividing the rooms in the apartment (a set of indivisible,
heterogeneous, desirable goods), and divide the rent to pay (divisible,
homogeneous, undesirable good).
• Inheritance Problem Inheritance Problem Inheritance Problem Inheritance Problem – Dividing desirable indivisible heterogeneous items,
desirable divisible heterogeneous property such as land, and desirable divisible
homogeneous property such as money.
2.5.4 Fairness Criteria
According to the Subjective theory of value, there cannot be an objective measure of
the value of each item. Therefore, objective fairness is not possible, as different people may
assign different values to each item. Therefore, most current research on fairness focuses on
concepts of subjective fairness. Each of the � Players is assumed to have a personal,
subjective utility function or value function � which assigns a numerical value to each
subset of 6. Usually the functions are assumed to be normalized for the interval [0, 1],
where � (∅� = 0 and � (6� = 1.

23
According to this, we will define several concepts of subjective fairness:
• Proportional Proportional Proportional Proportional DivisionDivisionDivisionDivision – Every person gets at least his due share, according to
his own value function. That means each of the � players gets a subset of 6
which he values as at least 1/�:
� (1 � ≥ 1/�∀ (2.7)
For example if three people divide up a cake, each one gets at least a third by
their own valuation.
• EnvyEnvyEnvyEnvy----free Divisionfree Divisionfree Divisionfree Division – Every person gets a share that he values at least as much
as all other shares:
� (1 � ≥ � ;1�<∀, = (2.8)
An Envy-Free guarantees no one will want somebody else’s share more than his
own. This kind of criteria is relevant only for heterogeneous goods.
• Equitable DivisionEquitable DivisionEquitable DivisionEquitable Division – Every person feels exactly the same happiness, i.e., got
exactly the same value:
� (1 � = ��;1�<∀, = (2.9)
This is the more social criteria.
• UtilitarianUtilitarianUtilitarianUtilitarian DivisionDivisionDivisionDivision – A solution that maximizes the sum of the individual
utilities:
max> � (1 � (2.10)

24
2.5.5 Main challenges in Fair Division problems
• The The The The DDDDividersividersividersividers – The real life problem is the one of dividing goods or resources
fairly between players, who has an entitlement to them. The central assumption
of fair division is that such a division should be performed by the players
themselves. The players may be use a mediator but certainly not an arbiter as
only the players really know how they value the goods. In computerized
systems, the division performed by agents which represent the player’s utility.
• The PreferencesThe PreferencesThe PreferencesThe Preferences – In the real world people sometimes have a good idea of how
the other players value the goods and they may care very much about it. The
case where they have complete knowledge of each other’s valuations can be
modeled by game theory. In many cases, the preferences of the participants are
private. In these cases, partial knowledge is very hard to model. A major part of
the practical side of fair division is the devising and study of procedures that
work well despite such partial knowledge or small mistakes.
• TTTThe Procedure he Procedure he Procedure he Procedure – The main goal of fair division theory is to provide a procedure
or algorithm to achieve a fair division, or prove their impossibility. In practice,
the suggested algorithm should be applicable and converge by finite number of
steps. In order to demonstrate the complexity of this challenge we can indicate
for example that a bounded envy-free algorithm for the five-players case was
just recently proposed by Saberi and Wang in 2009 [28]. Actually, up to now,
the bounded n-player envy-free algorithm is still an open question.
• The TThe TThe TThe Truth ruth ruth ruth – Fair division cases might cause the players to lie about their
preferences in order to increase their part of the shared resource. When people
buy bread for example, he uses social resources like wheat, fuel and human
resources that invested in making the bread. What prevents overuse of these
resources is the bread price. This is the penalty should be paid to compensate
the society on resource utilization. The model must include mechanism to
motivate the consumer to be true about his needs.

25
2.5.6 Fair Division as a tool for Demand-Side Management
Fair Division helps us to build a DSM model in the part of fairly allocate the shared
energy source capacity. Our research shown that the problem of fairly divide electrical
capacity between consumers who should pay money for the service, can describe as follows:
The The The The DDDDivided ivided ivided ivided IIIItemstemstemstems::::
• ElectricityElectricityElectricityElectricity – Divisible, Homogeneous and Desirable.
• MoneyMoneyMoneyMoney – Divisible, Homogeneous, Undesirable.
The Fairness CriteriaThe Fairness CriteriaThe Fairness CriteriaThe Fairness Criteria::::
• For different fair division cases, different fairness criteria are suitable.
The The The The MMMMain Challengesain Challengesain Challengesain Challenges::::
• The DThe DThe DThe Dividersividersividersividers – Our automatic system should be based on computerized agents
integrated in the smart meters. In order to design a distributed DSM system,
the system can use a mediator for the allocation as mentioned before.
• The Preferences The Preferences The Preferences The Preferences – The model should fit for private preferences.
• The ProcedureThe ProcedureThe ProcedureThe Procedure – The top challenge of this section is to propose an algorithm
that can be practically integrated in the local energy consumption controller.
• The TrueThe TrueThe TrueThe True – The model should include price profile that encourages the
consumers to be true about their needs.
2.6 Conclusions
In this chapter we introduced the most relevant tools in game theory that can be used
for design an algorithm for demand-side management. The most useful tools were
Mechanism Design for the consumer characterization and Fair Division for the resource
allocation.

26
3 Related Works
3.1 Introduction
In this chapter, we present related works that used game theory as a tool for demand-
side management in smart grid. Most of these works can be divided into two main topics:
Consumption Scheduling and Real Time Management. At the end of this chapter, we note
a number of open issues identified in these works, during our research. These open issues
helped us to refine the objectives of this thesis and to define our system goals.
3.2 Demand-Side Management Based on Scheduling
Mohsenian-Rad et al. [29] presented an autonomous incentive based algorithm for
scheduling power consumption. In this scheme, loads are classified into Schedulable
consumption and Non-schedulable consumption. Schedulable consumption represents
usages that do not have strict time constraints, and Non-schedulable consumption
represents usages that have strict time constraints. The authors proposed the use of
Energy Consumption Scheduling devices (ECS) as a component of the smart meters. In
this model, an ECS communicates with other ECSs in its neighborhood sharing its
scheduling information. Running their proposed distributed algorithm, each ECS computes
and broadcasts its optimal schedule. The algorithm repeats until no ECS announces any
change of schedule. Simulation results confirm that the proposed algorithm significantly
reduces the PAR as well as the total energy cost in the system.
Mohsenian-Rad et al. [30] presented an autonomous and distributed demand-side
energy management system among users based on game theory. An energy consumption
scheduling game is formulated in which the users act as the players and a daily household
appliance schedules as their strategies. This work assumes that the utility company can
have appropriate pricing tariffs in order to differentiate the energy usage levels and

27
durations. The work demonstrates that for a common scenario comprising a single utility
company serving a number of customers, the global optimal performance in terms of
minimizing the energy costs is achieved at the Nash equilibrium of the game. Furthermore,
the users receive incentives to take part in this service. The experimental results reveal
that this approach is able to reduce the peak-to-average ratio of the total energy demand,
the total energy costs, and also each player’s individual daily electricity bills.
Ibars et al. [31] proposed distributed load management scheme based on the capacity of
the consumers to manage their own demands in order to minimize a cost function or price.
The system is modeled as a non-cooperative network congestion game by modeling both
demand and smart grid load using a directed graph, in which the cost of a unit load over
an edge depends on the total load over that edge. In other words, in the defined non-
cooperative congestion game amongst the users or players, the price levels are set for the
demand vector of each player. The work demonstrates that the game formulated as such
converges to a stable equilibrium point in a distributed manner. Different user demand
profiles reveal that it is possible to obtain a smoother generation curve while meeting the
user demands.
Caron and Kesidis [32] proposed a dynamic pricing scheme that encourages consumers
to adjust their power use with the objective of getting a flat overall consumption. The
authors showed that finding an optimum schedule is NP-hard, and then presented
methodologies to study how close one can get to the ideal case. This was done based on
the amount of information the consumers are willing to share with their utility company.
Furthermore, the authors studied the outcomes based on several scheduling policies,
namely, uniform, ALOHA I, ALOHA II, and Time/Slackness. In their work, the authors
have also compared the performance of these scheduling policies.
Chen et al. [33] proposed the use of a real-time pricing rate, and formed a Stackelberg
game between the utility company and energy management controllers that are to be
deployed at each home. The game was setup such that the controllers play the role of the
follower and the utility company plays the role of the leader. The authors simulated their
28
proposed methodology and concluded that their approach saves money for the consumers
and ensures that rebound peaks do not appear.
Gatsis and Giannakis [34] presented a cooperative scheduling approach between the
utility company and the consumers. In this approach, loads are classified into loads that
must run, loads that must consume a given amount of power (e.g., a rechargeable battery),
and loads that are adjustable in power consumption but the adjustment could cause
consumer dissatisfaction (e.g., climate control). This was modeled into a convex
optimization problem that was solved using the distributed subgradient method. The
authors also presented simulation results that show that it is possible to meet the
constraints above in an optimum way.
Samadi et al. [35] provided an interesting VCG-based mechanism (based on algorithmic
mechanisms design) for the utility company to effectively price users employing DSM.
They investigated some of the main properties of the proposed mechanism such as
truthfulness and efficiency. It is shown that the pricing scheme can be designed in such a
way that, by acting selfishly, users end up reaching the optimal system-level operating
point. Simulation results confirmed that by using the proposed method, along with
maximizing the social welfare, the energy provider will also benefit in terms of energy cost
and PAR.
Wang and de Groot [36] presented a mechanism to further exploit the awareness of end
users in a three-tier energy market. Their method proposes to use the middle tier, the
Energy Service Company level, to aggregate the flexible electricity consumption patterns
from individual users and reduce the peak energy consumption through load-balancing.
They also gave a method for multiple Energy Service Companies to improve their
schedules iteratively via Demand Response events. They proved that the method produces
a schedule that is a Nash Equilibrium. Extensive experiments showed the effectiveness of
their method.
Zhu et al. [37] proposed an Integer Linear Programming (ILP) and game theory based
optimization mechanism for the home demand-side management in a smart grid. The

29
proposed mechanism is able to schedule both the optimal power and the optimal operation
time for power-shiftable appliances and time-shiftable appliances respectively according to
user preference and the power consumption patterns of individual appliances. The
mechanism can be applied to both centralized control and distributed coordinative
management schemes. Simulation results demonstrate the convergence of the game
theoretical algorithm.
Nguyen et al. [38] presented a game-theoretic framework to model independent decision-
making of users’ energy consumption scheduling. They designed a new pricing model and
proposed a distributed algorithm to achieve the Nash equilibrium of the NECS (Non-
Cooperative Energy Consumption and Storage) game in which each user tries to minimize
its energy payment to an energy provider. Unlike other DSM algorithms which require the
message exchanges between users, their distributed algorithm requires only the interaction
between the energy provider and users via pricing information. Simulations showed that
the distributed algorithm can reduce the energy cost and PAR of the system compared
with the centralized design.
Chen et al. [39] proposed a novel load scheduling scheme to shift and shave the peak
load to stabilize the power demand and avoid overload. First, the smart appliances are
classified into two categories, i.e., the time-shiftable and the temperature-shiftable. Then
they constructed the Operation-Comfort Level (OCL) models which incentive consumers
to use the algorithm to cut the electricity cost with minimum uncomforting brought by the
change of energy consumption scheduling. Simulations confirm that the algorithm
significantly reduces the peak load, the PAR and the total energy cost with acceptable.
Shinwari et al. [40] used a water-filling based scheduling algorithm to obtain a flat
demand curve. The proposed algorithm does not require any communication between
scheduling nodes. The authors also study the possible errors in demand forecast and
incentives for customer participations. Their results confirm the efficiency and fairness of
the proposed scheduling algorithm.
30
3.3 Real Time Demand-Side Management
Samadi et al. [41] proposed a real-time pricing algorithm for DSM programs to
encourage desired energy consumption behaviors among users and to keep the total
consumption level below the power generation capacity. In the system model, the
subscribers and the energy provider automatically interact with each other through a
limited number of message exchanges and by running a distributed algorithm to find the
optimal energy consumption level for each subscriber, the optimal price values to be
advertised by the energy provider, and also the optimal generating capacity for the energy
provider. They formulate the real-time pricing as an optimization problem to maximize the
aggregate utility functions of all subscribers in the system while minimizing the imposed
energy cost to the energy provider. They proved the existence and the uniqueness of the
optimal solution for the formulated optimization problem. Simulation results confirmed
that both subscribers and the energy provider have benefit from the proposed algorithm.
Tarasak [42] extend the approach in [41] to consider the effect of load uncertainty. The
paper considers three uncertainty models: bounded uncertainty model, Gaussian model and
unknown distribution model. He showed that load uncertainty increases the optimal price
and that load uncertainty with unknown distribution has a higher optimal price than the
Gaussian model. Simulation results provide some insights on how different models of load
uncertainty affect the generating capacities and the aggregate power consumption.
Samadi et al. [43] proposed a VCG mechanism for DSM in smart grid. The proposed
mechanism aims to maximize the aggregate utility of all users while minimizing the total
cost of power generation. They investigated some of the main properties of the proposed
mechanism such as truthfulness, efficiency, and nonnegative transfer. Through simulation,
they showed that the proposed VCG mechanism improves the performance of the system
by encouraging users to reduce their power consumption and shift their loads to off-peak
hours. They also analyzed the impact of some key parameters on our model through
simulations. The simulations confirmed that by using our proposed VCG mechanism, in
addition to maximizing the social welfare, the energy provider will benefit as well.

31
Agarwal and Cui [44] presented a solution through variable-rate metering, which
indicates the real-time cost of power generation in order to influence the customers to
lower power consumption during the peak times. This work points out that the main
challenge to implementing real-time pricing consists in the lack of cost-effective two-way
smart metering for communicating the real-time prices to the customers and their
consumption levels back to the utility provider. Then, this work proposes formulation of
noncooperative games among the customers with two real-time pricing schemes under
more general load profiles and revenue models. The results indicate that both the pricing
schemes contribute to similar electricity loading patterns when the customers are
interested in the minimization of electricity costs alone.
Conejo et al. [45] presented a model for optimally adjusting the hourly load level of a
given consumer in response to hourly electricity prices is presented. The objective is to
maximize the utility of the consumer subject to a number of constraints on load levels and
aggregated consumptions. The interaction takes place on an hourly basis using a rolling
window algorithm to consider the energy consumption throughout the twenty four hours of
the day. A case study demonstrates the usefulness of the proposed algorithm to maximize
the utility, or to reduce the electricity bill, of a consumer that integrates the proposed
procedure in its EMS.
Ramchurn et al. [46] study a decentralized demand-side management scheme in which
agents coordinate to smooth load peaks. It is shown that through such schemes significant
reduction in peak demand can be achieved. In the paper, the authors also introduce an
evolutionary game model; they show that under their scheme the usage of demand-side
management mechanisms is always convenient. In such conditions the dynamics of the
game is straightforwardly converging to the single Nash equilibrium.

32
3.4 Open Issues on Related Works
In order to refine our goals for this thesis, we specially focused on the great work made
by Samadi and Mohsenian-Rad [41], because of the similarity to our research. The open
issues we will present here had confirmed by some correspondence with these authors. It
should be noted that these issues also identified in additional works.
1) Is RealIs RealIs RealIs Real----TiTiTiTime Pricing really works?me Pricing really works?me Pricing really works?me Pricing really works? – In [41] authors presented a Real-Time Pricing
algorithm for Demand-Side Management as describe in Figure 6.
Figure Figure Figure Figure 6666 – Illustration of Illustration of Illustration of Illustration of [41][41][41][41] algorithmalgorithmalgorithmalgorithm
However, in a different work of Mohsenian-Rad [47] he wrote: ”Although real-time
pricing has several potential advantages, its benefits are currently limited due to
lack of efficient building automation systems as well as user’s difficulty in manually
responding to time-varying prices”. As believers on a real-time approach which
minimally reduce the consumer comfort, we do want to propose a real-time based
system model instead of Scheduling model which significantly influence the
subscriber’s consumption habits.

33
2) What’s the connection between the calculated values to the real ones?What’s the connection between the calculated values to the real ones?What’s the connection between the calculated values to the real ones?What’s the connection between the calculated values to the real ones? – Many
algorithms, like [41], calculate few values like: optimal consumption level 1 �?@A, optimal generating capacity B�?@A and optimal price C?@A� . However, in most cases,
there is no connection between the calculated values and the real ones. This is
because the system works on open-loop manner, so, in practice, the subscriber can
consume any amount of energy he wants, and there is no way to confirm that he
consumes the theoretical optimal value that calculated for him. Our goal to offer a
system model that would work in a closed-loop manner and keep the subscriber
interests.
3) Is utility function intuitively characterizing the consumer preferences?Is utility function intuitively characterizing the consumer preferences?Is utility function intuitively characterizing the consumer preferences?Is utility function intuitively characterizing the consumer preferences? – The
algorithm proposed in many cases uses pure mathematical utility functions to
represent the consumer’s preferences like describe in Figure 7.
Marginal Benefit Function Utility Function
Figure Figure Figure Figure 7777 – Marginal and Utility Functions inMarginal and Utility Functions inMarginal and Utility Functions inMarginal and Utility Functions in [41][41][41][41]
In most cases, these functions do not give an intuitive characterization that can be
introduce to the consumer in order to draw up a contract for him. Moreover, in
many cases, there is much need for the subscriber’s involvement in performing the
required settings for the algorithm. This can lead to a lack of cooperation by the
subscriber. Our goal in this thesis is to propose a simple and intuitive
characterization method to represent the consumer preferences.

34
4) Is the algorithm can implement practical?Is the algorithm can implement practical?Is the algorithm can implement practical?Is the algorithm can implement practical? – The algorithm proposed in [41] uses
functions with many parameters to represent the subscriber and the provider
preferences like describe below:
D(1,E� = FE1 − G2 1�,H0 ≤ 1 ≤ EGE�2G ,H1 ≥ EG I�(B�� = G�B�� + K�B� + L� Consumer Utility Function Provider Cost Function
When we tried to implement this algorithm ourselves, we discovered that the
simulation actually behaves as expected but the parameters cannot be practically
calibrated. This means that this algorithm cannot be implementing in a real DSM
system at the subscriber’s houses. Our target in this thesis to propose a practical
and simple algorithm that would be applicable.
5) Is coupling between subscribers is fair?Is coupling between subscribers is fair?Is coupling between subscribers is fair?Is coupling between subscribers is fair? – In the algorithm proposed in [41], there
can be a situation that one subscriber consumes energy in his optimal consumption
value, and suddenly his neighbor decide to increase his consumption level. This
event will affect the first subscriber directly, and the total price will increase, or his
optimal consumption value will decrease. Real subscriber will not accept that as a
fair system. Our target to propose a fair system model without such coupling
between subscribers.
3.5 Conclusions
In this chapter we introduced related work that uses game theory as a tool for demand-
side management in smart grid. As can be see, the two main approaches for demand-side
management are: Consumption Scheduling and Real-Time management. It is not yet clear,
which approach will finally be in common in the future smart grid. In this thesis we try to
propose a system that combine these two approaches and will have the advantages of each.

35
4 Demand Side Management Control System Model
4.1 Introduction
In this chapter we will introduce our proposed demand-side management control system
model framework. We first declare the system goals which defined according to the thesis
objectives and the open issues we discovered on the related works.
Then we present the model and its basic principle which we called: Asynchronous
Consumption Mode (ACM). We will explain the inspiration for this method.
Finally, we detail the three main components of the model: Consumer Characterization
method, Fair Division Algorithm for energy allocation and Energy Consumption Controller
that helps to close the loop of the system.
Each of these three components can be separately expand by additional future research
and development.

36
4.2 System Goals
1) Practical Consumer Characterization MethodPractical Consumer Characterization MethodPractical Consumer Characterization MethodPractical Consumer Characterization Method – The consumer preferences
characterization method should be:
a. Can be practically calibrated.
b. Require minimum involvement by the subscriber.
c. Simple and intuitive to propose to the subscriber.
2) An Algorithm for Fair Consumption AllocationAn Algorithm for Fair Consumption AllocationAn Algorithm for Fair Consumption AllocationAn Algorithm for Fair Consumption Allocation – This section should be designed
according game theory principles as followed:
a. The system should find a fair energy allocation for each subscriber according
to the equitable fair division criteria.
b. Give the subscriber an incentive to use the system and be truthful.
c. Minimum coupling between subscribers.
3) An Energy Consumption ControllerAn Energy Consumption ControllerAn Energy Consumption ControllerAn Energy Consumption Controller – The ECC should fulfills the following goals:
a. Enable a closed-loop system that keep the subscriber interests and manage
the consumption level according to the optimal calculated value.
b. Combine the advantage of two DSM approaches: Consumption Scheduling
and Real-Time Management. Our approach is somewhere between both.

37
4.3 System Model
The general system model includes several load subscribers and shared source of energy
connected to the electrical grid as describes in Figure 8. We assume that each subscriber is
equipped with an ECC device in its smart meter for managing the household energy
consumption. The subscribers are all connected to the power line coming from the energy
source. The ECC devices are also connected to each other and also to the energy source
through a Local Area Network (LAN).
Figure Figure Figure Figure 8888 – General System ModelGeneral System ModelGeneral System ModelGeneral System Model
Let M denote the set of subscribers, where� ≜ |M|. For each subscriber� ∈ M, let O�
denote the set of appliances. For each appliance P ∈ O� we define the Consumption Level
DemandQ�RS�TU, the Operational DemandV�
R and the Quality of Service WX� which will
be explaining later on. According to these parameters the system will fairly allocate
consumption level 1�?@A
for each subscriber.
ECC1 ECC2 ECCn
Limited
Energy
Source
LAN
Power Line

38
4.4 Control Loop Description
After we presented the general system model, we can describe the closed control loop
that represents the core of our proposed model. As seen in Figure 9, the control loop
contains the two main part of the proposed system: The Fair Division allocation section
and the Energy Consumption Controller. The controller connected to the household
appliances in order to manage their operation, but it also measure their truth real-time
consumption level through measurement device in order to close the loop. The controller
calculates the error between the optimal allocated consumption level and the actually real-
time consumption level, and manages the appliances operation in a way that minimizes
this error. Each of the system components will detail explained later.
Figure Figure Figure Figure 9999 – Control Loop Control Loop Control Loop Control Loop DescriptionDescriptionDescriptionDescription
ECC
Household Consumption
Σ Fair Division Allocation
Consumption Measurement
1�?@A Computed
Consumption Level
Error
++++ ----
1�Z[ Real-Time
Consumption Level
1�Z[ Measured
Consumption Level

39
4.5 Asynchronous Consumption Mode (ACM)
Source of inspiration to our model is the revolution occurred in communication systems
at the beginning of the century. The first communication system was based on
synchronous bandwidth allocation, means each subscriber got a fixed amount of bandwidth
whether he used it or not. This method got the name STM – Synchronous Transfer Mode.
With technology development, communication vendors wanted to maximize to utilization
of the channels. That led to develop an asynchronous bandwidth allocation method called
ATM – Asynchronous Transfer Mode [48]. The basic principles of this method were
allocated bandwidth according to the type of the service, and use free channel bandwidth
when some subscribers don’t use it temporally. These principles implement mainly by
define Quality of Service (QOS) levels and queue management.
CBR – Constant Bit Rate
STMSTMSTMSTM
UBR – Unspecified Bit Rate
ABR – Available Bit Rate
VBR – Variable Bit Rate
CBR – Constant Bit Rate
ATMATMATMATM
Figure Figure Figure Figure 10101010 – Synchronous Transfer Mode vs. Asynchronous Transfer ModeSynchronous Transfer Mode vs. Asynchronous Transfer ModeSynchronous Transfer Mode vs. Asynchronous Transfer ModeSynchronous Transfer Mode vs. Asynchronous Transfer Mode
Very similarly, traditional electricity networks have the same features like STM
networks. Each subscriber gets a fixed energy allocation, irrespective of the level of
consumption of other subscriber and the level of importance of his appliances.
In order to propose an asynchronous model similarly to ATM, we define a novel term
we call: ACM ACM ACM ACM – Asynchronous Consumption ModeAsynchronous Consumption ModeAsynchronous Consumption ModeAsynchronous Consumption Mode. This method will affect the way we
characterize the consumer preferences and on the operating principle of the Energy
Consumption Controller (ECC).

40
4.6 Consumer Characterization
This section would be the first part of our ACM (Asynchronous Consumption Mode)ACM (Asynchronous Consumption Mode)ACM (Asynchronous Consumption Mode)ACM (Asynchronous Consumption Mode)
method. At this section we present new approach to characterize the consumer preferences
by defining three QOS (Quality of Service) levels for the consumer appliances. Moreover,
our method will fulfill the principles of mechanism design introduced in section 2.4.
In order to be more intuitive, we decided to characterize the consumer preferences
starting with the marginal utility function4 (1� instead of the utility function. According
to Property 2, this function should be a non-increasing function.
As it is said, we define three QOS levels to describe the priority of the appliance
operation:
1) CCR CCR CCR CCR – Constant Consumption RateConstant Consumption RateConstant Consumption RateConstant Consumption Rate – This level includes appliances that must
work when they demand for energy. For example: refrigerator and indoor light.
2) AAAACRCRCRCR – AvaiAvaiAvaiAvailablelablelablelable Consumption RateConsumption RateConsumption RateConsumption Rate – This level includes appliances at secondary
priority that can operate according to available energy capacity and can tolerate
delay in operation time. For example: electric kettle and boiler.
3) UCR UCR UCR UCR – Unspecified Consumption RateUnspecified Consumption RateUnspecified Consumption RateUnspecified Consumption Rate – This level includes appliances at third
priority that can operate according to surplus energy capacity and are sensitive for
breaking off operation. For example: under-floor heating and outdoor lighting.
Table Table Table Table 1111 – Typical QOS level featuresTypical QOS level featuresTypical QOS level featuresTypical QOS level features
QOSQOSQOSQOS PriorityPriorityPriorityPriority Operation timeOperation timeOperation timeOperation time Sensitive to Sensitive to Sensitive to Sensitive to delay before delay before delay before delay before
actionactionactionaction
Can disconnect Can disconnect Can disconnect Can disconnect during during during during
operationoperationoperationoperation
Energy Energy Energy Energy consumption consumption consumption consumption
levellevellevellevel
CCRCCRCCRCCR 1 Short / Long Yes No Low
ACRACRACRACR 2 Short No Yes Low / High
UCRUCRUCRUCR 3 Short No Yes Low

41
These definitions would give us a piecewise constant marginal utility function.
According to definition 1, the relationship between the marginal utility function and the
utility function itself can be describes as:
� (1� = \4 (1�]1 (4.1)
For example:
\ →
Marginal Utility Function 4(1� Utility Function �(1� Figure Figure Figure Figure 11111111 – Consumer Characterization exampleConsumer Characterization exampleConsumer Characterization exampleConsumer Characterization example
In this way we do not need to calibrate values of the utility function parameters that
cannot be calibrating. It can easily show that the received utility function does fulfill all
the properties it should satisfy.
It is clearly, that this method is very simple and intuitive to propose to the subscriber.
All he needs to do is to map all the appliances in his home and define their consumption
level and priority. If we want to make a simplest system and minimize the involvement of
the subscriber, we can predefine a table of appliances with typical consumption level and
priority, and all would remain to the subscriber is to select the appliances he has. In a real
system we should allow the subscriber to change his priorities each time interval of the
system. That because one appliance can be very important at evening but less important
at morning when nobody home.
The incentive to the consumer to use such of service can be by giving a different price
for each QOS level. Where CCR service would be the most expensive service and UCR
would be the cheapest. That should motivate the subscriber truly declare his preferences.
0
0.5
1
0 0.5 1
QO
SQ
OS
QO
SQ
OS
Consumption DemandConsumption DemandConsumption DemandConsumption Demand
0
0.5
1
0 0.5 1
Uti
lity
Uti
lity
Uti
lity
Uti
lity
Consumption DemandConsumption DemandConsumption DemandConsumption Demand
CCRCCRCCRCCR
AAAACRCRCRCR
UUUUCRCRCRCR

42
4.7 Fair Division Algorithm
4.7.1 Preface
In this section we explain the fair division algorithms for the component that makes the
allocation of the shared source between all the consumers. That would be the second tool
of game theory that we implement in our model as described in section 2.5. Our research
showed that there are almost non works that used fair division as a tool in their model.
As described above, our shared resource is electricity, means it Divisible, Homogeneous
and Desirable. We will present three algorithms for the use of three relevant fairness
criteria called: Proportional Division, Equitable Division and Utilitarian Division. In the
next chapter we’ll show some simulation results to demonstrate the difference between
these criteria.
Generally, the proportional division method will allocate each QOS level relative to
consumer demand, the equitable division method will allocate the resource in order to
equalized the consumer utility and the utilitarian division method will allocate the resource
in a way that maximize the social utility and the provider profit.
For convenience, we denote each method with the following acronyms:
• PDPDPDPD – Proportional Division.
• EDEDEDED – Equitable Division.
• UDUDUDUD – Utilitarian Division.

43
4.7.2 Proportional Allocation
Algorithm 1Algorithm 1Algorithm 1Algorithm 1 Fair Division Allocation – Proportional Division
Require:Require:Require:Require: Set of marginal utility functions 4 (1� Ensure:Ensure:Ensure:Ensure: Allocation (1�̂ _ , 1�̂ _ , … , 1�̂_� ForForForFor = = 1,… ,3 (represents three QOS levels) dodododo
IfIfIfIf ;∑ Q�, R� b� < P4PdPKdeLPfPLgh< 1�, ̂_ = Q�, R (4.2)
ElseElseElseElse
1�, ̂_ = Q�, R∑ Q�, R� b� × P4PdPKdeLPfPLgh (4.3)
End forEnd forEnd forEnd for
ReturnReturnReturnReturn (1�̂ _ , 1�̂_ , … , 1�̂_� which, for all ∈ M, gives a relative allocation.
Above is an algorithm for a simple proportional division allocation. The algorithm
allocates each QOS level separately. In each level, it checks if the is enough capacity in
order to satisfy all subscribers, if there is; it allocates according to the demand (4.2). Else,
it allocates the availably capacity relatively to the demand (4.3).

44
4.7.3 Equitable Allocation
Algorithm 2Algorithm 2Algorithm 2Algorithm 2 Fair Division Allocation – Equitable Division
Require:Require:Require:Require: Set of marginal utility functions 4 (1� Ensure:Ensure:Ensure:Ensure: Allocation (1�i_ , 1�i_ , … , 1�i_� ForForForFor = 1,… , � dodododo
� (1� = j4 (1�]1 End forEnd forEnd forEnd for
Solve the following Fair Division problem using Bisection Method:
max (��(1�, ��(1�, … , ��(1�� (4.4)
s.t. � (1 � = ��;1�<∀, = (4.5)
>1 i_� b� = 1 (4.6)
1 i_ ≥ 0∀ ∈ M (4.7)
ReturnReturnReturnReturn (1�i_ , 1�i_ , … , 1�i_� which, for all ∈ M, gives a maximum utility.
Above is an algorithm for equitable division allocation. First, the algorithm calculates
the utility functions set of all subscribers. Then it solves the fair division problem (4.4) by
using bisection numerical method according to the given constrains.
(4.6) and (4.7) ensure that the allocation produced is both feasible and complete.
Furthermore, (4.5) guarantees that the allocation will fulfill the equitable division criteria,
means each subscriber gets the same benefit.
It should be noted, that there can be edge cases where some subscribers demand a very
low amount of capacity from the shared source. In this cases, constrain (4.5) will cause
that not all the source capacity will be allocated between the subscribers. In such cases, we
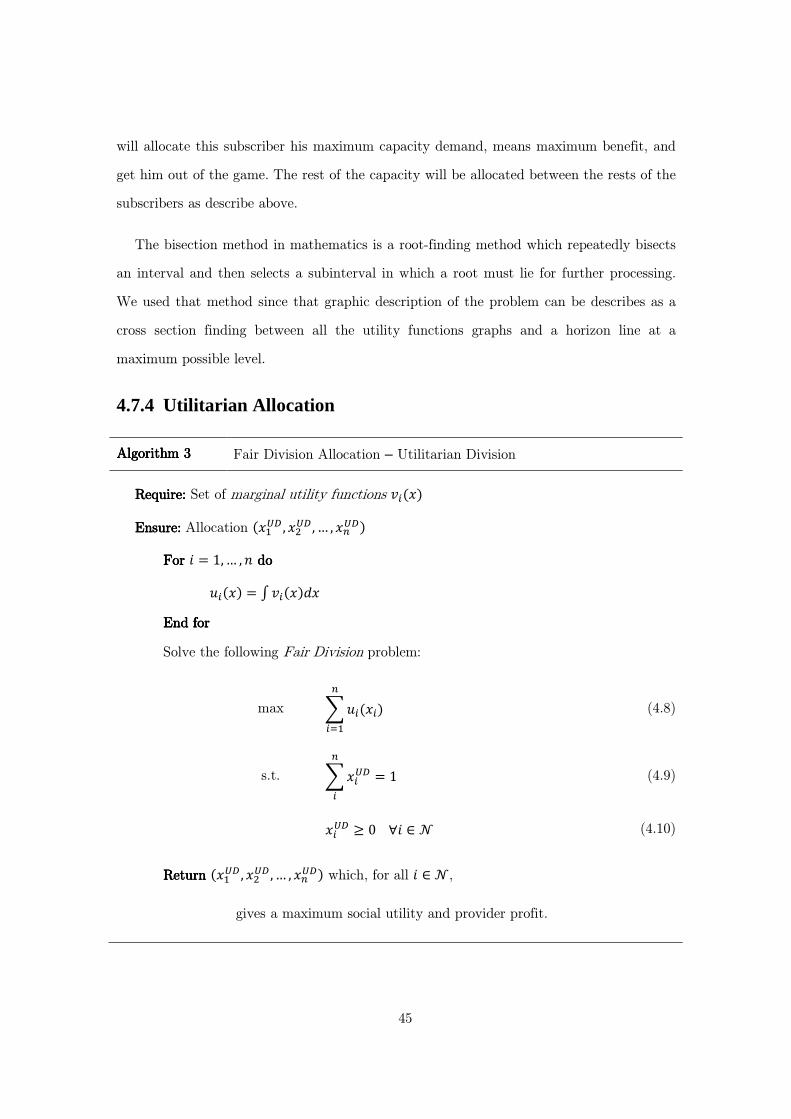
45
will allocate this subscriber his maximum capacity demand, means maximum benefit, and
get him out of the game. The rest of the capacity will be allocated between the rests of the
subscribers as describe above.
The bisection method in mathematics is a root-finding method which repeatedly bisects
an interval and then selects a subinterval in which a root must lie for further processing.
We used that method since that graphic description of the problem can be describes as a
cross section finding between all the utility functions graphs and a horizon line at a
maximum possible level.
4.7.4 Utilitarian Allocation
Algorithm 3Algorithm 3Algorithm 3Algorithm 3 Fair Division Allocation – Utilitarian Division
Require:Require:Require:Require: Set of marginal utility functions 4 (1� Ensure:Ensure:Ensure:Ensure: Allocation (1�k_ , 1�k_, … , 1�k_� ForForForFor = 1,… , � dodododo
� (1� = j4 (1�]1 End forEnd forEnd forEnd for
Solve the following Fair Division problem:
max >� (1 �� b� (4.8)
s.t. >1 k_� = 1 (4.9)
1 k_ ≥ 0∀ ∈ M (4.10)
ReturnReturnReturnReturn (1�k_ , 1�k_ , … , 1�k_� which, for all ∈ M,
gives a maximum social utility and provider profit.

46
Above is an algorithm for utilitarian division allocation. First, the algorithm calculates
the utility functions set of all subscribers and then it solves the fair division problem (4.8).
(4.9) and (4.10) ensure that the allocation produced is both feasible and complete.
Since it can be more than one solution for this problem, the algorithm will return an
allocation vector that both maximize the social utility and the provider profit.
4.8 Price Profile
A main question should be asked is how to cause the subscribers to be honest about
their needs in order to truly allocate the resource fairly. As mentioned before, the only way
to balance the market is by using a price profile that encourages the subscriber to present
real needs. In other words, the mechanism should be such that it would be inexpedient for
the subscriber to lie about his preferences.
There are many methods in the literature of game theory to formulate a price profile of
the system, and actually this can be a whole subject for Master thesis. Famous methods
family for designing price profiles called Clarkes Groves Mechanisms. These models are
subject of auction theory. The special property of these auctions is that the dominant
strategy of each player is to honestly declare his demand value. In other words, these
models are ’truth inducing’. This branch of game theory also belongs to the field of
mechanism design mentioned before.
In this thesis we define a simple price profile that gives the most expensive price for the
CCR QOS level, a medium price for the ACR QOS level, and the cheapest price for the
UCR QOS level. This method should encourage the subscriber to well define his appliances
needs in order to save money.
It should be noted here, that one of the basic assumptions of game theory is that the
player is rational. It means that the player make actions in a way that serves his targets
and his benefit. Therefore it can be conclude, this simple price profile should be an
incentive for the subscriber to define his needs truly.

47
4.9 Energy Consumption Controller (ECC)
All the subscriber’s appliances are connected to the ECC as describes in Figure 12. The
ECC manage the appliances operation on the one hand, and measure their truth real-time
consumption on the other hand.
Figure Figure Figure Figure 12121212 – Appliances connected to ECCAppliances connected to ECCAppliances connected to ECCAppliances connected to ECC
The real time consumption measurement functions as the feedback branch of the
system control loop. Moreover, the controller receive a measurement of the total
consumption from the shared source, in order to identify moments of low consumption by
other subscriber that can by use temporarily.
The main principle of operation of the controller includes the application of the three
QOS levels defined per each appliance. Appliances which classify as CCR will receive
service on demand. Appliances which classify as ACR will receive service immediately if
the consumer have available capacity or will be delayed if not. Appliances which classified
as UCR will receive service according to surplus capacity of the shared resource. The
controller will shut down these appliances instantaneously if there will be demand for
applying more important appliance. The overall goal of the control loop is to stick as much
as possible to the energy amount allocated to the consumer.
Consumption Control
Consumer Parameters
Supply
A1
Mea
sure
An
Supply
Mea
sure
Supply
Mea
sure
ECC
A2
Source Measurement

48
4.10 Conclusions
In this chapter we introduced the theoretic aspects of our proposed model. Our starting
point was the system goals which we define according to the thesis objectives and the open
issues we identify at related works. Later we present the system model and the basic
notations. At the core of this chapter we introduced our Asynchronous Consumption Mode
concept and the closed control loop designed according to it.
The three main parts of the model was the Consumer Characterization approach based
on the mechanism design principles, the Fair Division algorithm that allocates the share
source energy and the Energy Consumption Controller the manage the appliances
operation. Next we show some simulation examples to demonstrate the model concept.

49
5 Performance Demonstration
5.1 Introduction
In this chapter we will demonstrate the system operation. We will describe the
experimental setup and present some simulation results. As described above, the system
consists of two main independent parts: the fair division allocation section and the real-
time closed loop section. The output allocation of the first part is the input set point of the
second. Therefore, we divide the simulation demonstration into these two parts.
Our example would be for two typical subscribers that shared the same source while
each of them demands almost all the capacity with different level of priorities. That
means, the total demand for capacity from the subscribers exceeded the ability of the
shared source.
First we map the subscriber’s appliances and their characterization, after that we
describe the characterization of each subscriber preferences, later we demonstrate the
allocation method and eventually we show an example for consumption graph for each
subscriber. Finally we explain the simulation results and conclude.

50
5.2 Experimental Setup
Figure Figure Figure Figure 13131313 – Experimental SetupExperimental SetupExperimental SetupExperimental Setup
Table Table Table Table 2222 – Subscriber’s DemandsSubscriber’s DemandsSubscriber’s DemandsSubscriber’s Demands
SubscriberSubscriberSubscriberSubscriber1111 SubscriberSubscriberSubscriberSubscriber2222
lm no poqSrsU tuvo lm nw pwqSrsU tuvw 1 Lighting 0.2 CCR 1 Lighting 0.15 CCR
2 Refrigerator 0.3 CCR 2 Refrigerator 0.35 CCR
3 Washing Machine 1.2 CCR 3 Microwave 0.8 CCR
4 Dishwasher 0.8 CCR 4 Boiler 0.8 ACR
5 Boiler 0.8 ACR 5 Electric Kettle
0.9 ACR
6 Electric Kettle 1.5 ACR 6 Radiator 0.4 UCR
7 Under-floor
Heating 0.4 UCR
8 Mini Bar 0.1 UCR
9 Toaster 0.8 UCR
LAN
Power Line
ECC1 ECC2
Limited Energy Source
4.5kW
Subscriber1 Subscriber2

51
5.3 Simulation Results
5.3.1 Consumer Characterization
According to our method, the characterization of the consumer’s preferences will be by
marginal utility function 4 (1� and utility function � (1� as described in section 4.6.
As shown in Figure 14, subscriber1 needs more energy that subscriber2, and especially
for the first QOS level, CCR.
Subscriber1’s Marginal Utility Function Subscriber2’s Marginal Utility Function
Subscriber1’s Utility Function Subscriber2’s Utility Function
Figure Figure Figure Figure 14141414 – Customer CharacterizationCustomer CharacterizationCustomer CharacterizationCustomer Characterization
0 0.2 0.4 0.6 0.8 1 1.20
0.2
0.4
0.6
0.8
1
Marginal Utility Function
x
v(x)
0 0.2 0.4 0.6 0.8 1 1.20
0.2
0.4
0.6
0.8
1
Marginal Utility Function
x
v(x)
0 0.2 0.4 0.6 0.8 1 1.20
0.2
0.4
0.6
0.8
1
Utility Function
x
u(x)
0 0.2 0.4 0.6 0.8 1 1.20
0.2
0.4
0.6
0.8
1
Utility Function
x
u(x)
CCRCCRCCRCCR
AAAACRCRCRCR
UUUUCRCRCRCR
CCRCCRCCRCCR
AAAACRCRCRCR
UUUUCRCRCRCR

52
5.3.2 Fair Division Allocation
At the next step of the simulation, we operate the three different algorithms for fair
division that mentioned in section 4.7. In Table 3 we collect the results of each allocation
method. As describe in section 2.5.4, the relevant criteria for homogeneous resource
allocation are: Proportional Division, Equitable Division and Utilitarian Division. In this
simulation we use three of them in order to demonstrate the differences.
Table Table Table Table 3333 – Allocation ResultsAllocation ResultsAllocation ResultsAllocation Results
CriterionCriterionCriterionCriterion SubscriberSubscriberSubscriberSubscriber1111 SubscriberSubscriberSubscriberSubscriber2222 TotalTotalTotalTotal
AllocationAllocationAllocationAllocation UtilityUtilityUtilityUtility AllocationAllocationAllocationAllocation UtilityUtilityUtilityUtility AllocationAllocationAllocationAllocation UtilityUtilityUtilityUtility
ProportionalProportionalProportionalProportional 0.657
(2957W) 0.634
0.343
(1543W) 0.322
1
(4500W) 0.956
EquitableEquitableEquitableEquitable 0.4469
(2011W) 0.4469
0.5531
(2489W) 0.4469
1
(4500W) 0.8938
UtilitarianUtilitarianUtilitarianUtilitarian 0.71
(3195W) 0.67
0.29
(1305W) 0.29
1
(4500W) 0.956
As appear from the table, in this case, the proportional criterion and the utilitarian
criterion give similar results. Both criteria allocated more energy to subscriber1 rather than
subscriber2. On the other hand, the use of the equitable criterion, allocates more energy
actually to subscriber2 counterintuitive. The reason for that is that the Equitable criterion
in a social criterion which its goal to equalize utilities. This means that the least significant
subscriber will get more energy allocation than the other. This result indicates that this
criterion is not suitable for most applications described in this work.

53
5.3.3 Energy Consumption Control Loop
General 5.3.3.1
In this section we describe the control loop operation for each of the three allocation
result presented in Table 3. In order to do that, we assumed a consumption profile for each
of the appliances mentioned above. At section 5.3.3.2 we use the proportional allocation
results, at section 5.3.3.3 we use the equitable allocation results and at section 5.3.3.4 we
use the utilitarian allocation results.
In each example we first show the total consumption graph of each subscriber with and
without the algorithm. It can clearly see that the expected theoretical consumption graph
exceeds the ability of the source to provide power. Of course, in the case of standard
system, the circuit protection breaker was operating and disconnects the feed. Later we
show graphs for each appliance which describe the consumption demand and the actually
consumption.
In the total consumption graphs, the blue color represent the CCR appliances, the
green color represent the ACR appliances and the light blue represent the UCR appliances.
Also, the red line represents the allocation level of the subscriber according to the results
of the previous section. The magenta line represents the available capacity in the system
form to point of view of each subscriber.
In the appliances consumption graphs, the red color represent the energy demand
profile and the green color the actually operation profile.
We now explain the behavior of the system on some important points. The goal of this
simulation is to describe the asynchronous principle of the real-time control loop.

54
Example 1 – Consumption Graphs for the Proportional Division case 5.3.3.2
Figure Figure Figure Figure 15151515 – Consumption GraphConsumption GraphConsumption GraphConsumption Graph for the for the for the for the Proportional DivisionProportional DivisionProportional DivisionProportional Division casecasecasecase withwithwithwith algorithmalgorithmalgorithmalgorithm
Figure Figure Figure Figure 16161616 – Consumption GraphConsumption GraphConsumption GraphConsumption Graph for the for the for the for the Proportional DivisionProportional DivisionProportional DivisionProportional Division casecasecasecase withoutwithoutwithoutwithout algorithmalgorithmalgorithmalgorithm
CCR
ACR
UCR
Allocation
Available
2957W
1543W
4500W
2957W
1543W
4500W
1111 2222
3333
4444

55
Figure Figure Figure Figure 17171717 – SubscriberSubscriberSubscriberSubscriber1111’s Appliances’s Appliances’s Appliances’s Appliances
Figure Figure Figure Figure 18181818 – SubscriberSubscriberSubscriberSubscriber2222’s Appliances’s Appliances’s Appliances’s Appliances
Demand
Operation
CC
RC
CR
CC
RC
CR
A
CR
AC
RA
CR
AC
R
UU UUCC CC
RR RR
Lighting
Refrigerator
Washing machine
Dishwasher
Boiler
Kettle
Floor Heating
Mini Bar
Toaster
CC
RC
CR
CC
RC
CR
A
CR
AC
RA
CR
AC
R
UU UUCC CC
RR RR
Lighting
Refrigerator
Microwave
Boiler
Kettle
Radiator

56
In this example, subscriber 1 gets more energy allocation than subscriber 2 according to
their needs. As seen in the graphs, the controller manages the appliances operation in a
way that maximizes the utilization of the energy allocation of the subscriber. Moreover,
the controller enables to operate UCR appliances on account of free energy of the other
subscriber. The total overall consumption is obtained in the limits of the shared resource.
As seen in Figure 15, at and there are two gaps in the CCR consumption
profile. These gaps were used to operate two appliances of the ACR level. As seen in
Figure 17, the first time interval was used to operate the kettle after small delay, and the
second interval was used to operate the boiler without delay.
The marked points and demonstrate a situation where each subscriber use free
capacity of the other subscriber. This is another way to maximize the utilization of the
shared resource.
The marked point represents a moment that the total demand exceeds the ability of
the source to provide energy while the system operates without the control loop algorithm.
Figure 17 and Figure 18 demonstrate the operation of each appliance. As seen in the
figures, CCR devices are working on demand. ACR devices are working immediately on
demand or after delay to a moment with available energy. UCR devices are working
according to surplus energy and they can be shut down any time. Nevertheless, only the
UCR devices allow operating according to free energy capacity of the other subscriber.
These results are very similar to the results of the third example and therefore we won’t
explain the third example separately.
1111 2222
2222 3333
4444
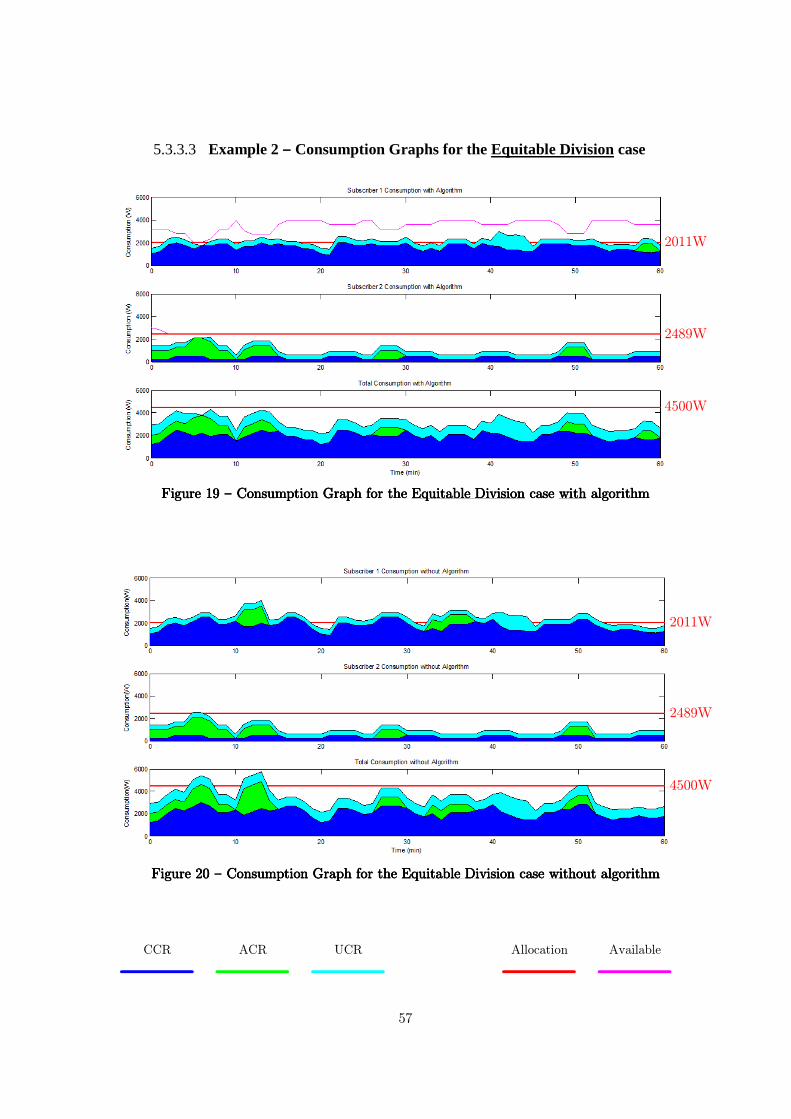
57
Example 2 – Consumption Graphs for the Equitable Division case 5.3.3.3
Figure Figure Figure Figure 19191919 – Consumption GraphConsumption GraphConsumption GraphConsumption Graph for the for the for the for the Equitable DivisionEquitable DivisionEquitable DivisionEquitable Division casecasecasecase withwithwithwith algorithmalgorithmalgorithmalgorithm
Figure Figure Figure Figure 20202020 – Consumption GraphConsumption GraphConsumption GraphConsumption Graph for the for the for the for the Equitable DivisionEquitable DivisionEquitable DivisionEquitable Division casecasecasecase withoutwithoutwithoutwithout algorithmalgorithmalgorithmalgorithm
CCR
ACR
UCR
Allocation
Available
2011W
2489W
4500W
2011W
2489W
4500W

58
Figure Figure Figure Figure 21212121 – SubscriberSubscriberSubscriberSubscriber1111’s Appliances’s Appliances’s Appliances’s Appliances
Figure Figure Figure Figure 22222222 – SubscriberSubscriberSubscriberSubscriber2222’s Appliances’s Appliances’s Appliances’s Appliances
Demand
Operation
CC
RC
CR
CC
RC
CR
A
CR
AC
RA
CR
AC
R
UU UUCC CC
RR RR
Lighting
Refrigerator
Washing machine
Dishwasher
Boiler
Kettle
Floor Heating
Mini Bar
Toaster
CC
RC
CR
CC
RC
CR
A
CR
AC
RA
CR
AC
R
UU UUCC CC
RR RR
Lighting
Refrigerator
Microwave
Boiler
Kettle
Radiator

59
In this case, subscriber 1 didn’t get enough energy because of the equitable division
principle. As seen in the graphs, the subscriber utilized almost all his allocation and still
couldn’t apply the first QOS level. Actually, subscriber 1 operates his devices mainly with
free capacity of the other subscriber.
As seen in Figure 21, the dishwasher, which is a CCR device, was temporary shout
down. Of course this is unacceptable situation which emphasize that the equitable criterion
doesn’t fit our needs.
On the other hand, the second subscriber, which got extra capacity allocation, could
operate all his devices without any problems.

60
Example 3 – Consumption Graphs for the Utilitarian Division case 5.3.3.4
Figure Figure Figure Figure 23232323 – Consumption GraphConsumption GraphConsumption GraphConsumption Graph for the for the for the for the Utilitarian DivisionUtilitarian DivisionUtilitarian DivisionUtilitarian Division casecasecasecase withwithwithwith algorithmalgorithmalgorithmalgorithm
Figure Figure Figure Figure 24242424 – Consumption GraphConsumption GraphConsumption GraphConsumption Graph for the for the for the for the Utilitarian DivisionUtilitarian DivisionUtilitarian DivisionUtilitarian Division casecasecasecase withoutwithoutwithoutwithout algorithmalgorithmalgorithmalgorithm
CCR
ACR
UCR
Allocation
Available
3195W
1305W
4500W
3195W
1305W
4500W

61
Figure Figure Figure Figure 25252525 – SubscriberSubscriberSubscriberSubscriber1111’s Appliances’s Appliances’s Appliances’s Appliances
Figure Figure Figure Figure 26262626 – SubscriberSubscriberSubscriberSubscriber2222’s Appliances’s Appliances’s Appliances’s Appliances
Demand
Operation
CC
RC
CR
CC
RC
CR
A
CR
AC
RA
CR
AC
R
UU UUCC CC
RR RR
Lighting
Refrigerator
Washing machine
Dishwasher
Boiler
Kettle
Floor Heating
Mini Bar
Toaster
CC
RC
CR
CC
RC
CR
A
CR
AC
RA
CR
AC
R
UU UUCC CC
RR RR
Lighting
Refrigerator
Microwave
Boiler
Kettle
Radiator

62
5.4 Interpretation of the results
5.4.1 Consumer Characterization
In this example we show the simplicity of the consumer characterization according to
our method. This process includes appliances mapping and feature description for each.
Next we construct the marginal utility function 4 (1� and the utility function � (1� of the
subscriber. Recall that, this method relies on the assumption that the subscriber truly
describes his needs due to the pricing profile of the service. As we have seen, we didn’t
need to calibrate complex function’s parameter in the characterization process.
5.4.2 Fair division
Simulation results show that the most relevant criteria for fair energy allocation in
electrical system are the proportional criterion and the utilitarian criterion. The
proportional criterion can be good for cases which the characterization of each subscriber is
heterogeneous and there are few subscribers.
On the other hand, in cases where there are many subscribers with similar utility
function, that criterion would not fit. That because each subscriber will get very little
amount of energy allocation which he could do anything with it. In this case, utilitarian
criterion will be more suitable. That because the algorithm will allocate as much energy as
it can for each QOS level for each subscriber. Of course, there can be situations that some
subscriber will get no allocation at all.
The conclusion is that we should select to most appropriate criterion for each case and
not rely on the same one all the time.

63
5.4.3 Energy Consumption Control Loop
Simulation results demonstrate the principles of our method called Asynchronous
Consumption Mode. According to this method we allocate energy for each subscriber in
asynchronous way. That means the allocation is made according to the needs of each
appliances and its QOS level. The main goal of the control loop is to maximize the
utilization of each allocation by manage the operation time of the appliances. For example,
instead of preventing service for appliance because there is not available capacity
temporally, we remember the demand in the controller memory and operate the appliance
when it’s possible. Moreover, we are using available capacity of the other subscriber to
operate low level QOS appliances.
5.5 Conclusions
In this chapter we demonstrate the performances of our system model framework. We
show the use of the consumer characterization method, the fair division allocation and the
real time control loop. We show a dynamic simulation to demonstrate three different cases
and we focused on few interesting points on the graphs.

64
6 Summary
6.1 Conclusions
In this thesis we study the field of smart grid and the application of game theory in
demand-side management problems. According to the fundamental problem we tried to
solve, we define the main thesis objectives: Study how to implement relevant game theory
tools for demand-side management and propose a control system model that uses these
principles to solve the fundamental problem. The thesis objectives were redefined after the
literature survey which leads to define the control system goals.
According to these goals, we proposed a system model framework contain three main
components: consumer characterization method, fair division allocation and an energy
consumption controller. The model framework was based on a new method that we
present, called Asynchronous Consumption Mode.
Simulation results demonstrate how our model framework satisfies the fundamental
problem and the thesis objectives. This study showed that the general smart grid and
demand management sector in particular, present complex problems that require
considerable investment in research and development. Game theory in this case can be a
powerful tool to design mechanisms that maximize consumer’s and provider’s benefit.
6.2 Thesis Presentations
This work was presented several times. Once during a seminar held in the Department
of Electrical and Computer Engineering at Ben-Gurion University [49]. Once more, in front
of the IEC smart grid leaders headed by Mr. Emil Koifman [50]. And last time at the
Annual Convention of the Society of Electrical and Electronics Engineers in Israel [51].
65
6.3 Thesis Contributions
• This thesis was the basis for the first research that combines smart grid issues
with game theory principles in the Electrical and Computer Engineering
department in Ben-Gurion University. During this research we open a window
for understanding the ability to use game theory tools to solve electrical
engineer problems.
• We proposed a novel method that we called Asynchronous Consumption Mode
(ACM) as a framework for management an electrical network.
• We proposed a method for characterize the consumer preferences in a practical,
simple and intuitive fashion. One of the innovations in this method is that we
characterize each appliance separately and not just the total demand.
• We first use the fair division method in order to make a fair allocation of the
shared resource. We showed that it is possible to use several criteria which give
some interesting results.
• We emphasize the need for well-designed price profile in order to motivate the
subscriber to use the service and to be true about his needs.
• We proposed a closed loop system model that manages the user appliances
operation in order to maximize the utilization of his allocation.

66
6.4 Future Directions
• Demand-side management is a very wide field of research. There are still many
open issues that need to be solved in order to make smart grid come true. One
future direction can be to deal with different fundamental problems. This
research showed that every tiny change in the problem definition can cause a
huge change in the solution direction especially when it comes to game theory.
• Those interested in game theory can continue to explore additional tools and
criteria for demand-side management in smart grid. The amount of abilities that
game theory makes available to the researcher is almost limitless.
• Each of the main components in our system model framework can be extended
by additional research and development. For example, by providing response to
changes in requirements over the hours of the day and days of the year.
• A major future direction can be by research method for designing smart price
profiles as a core mechanism in the system. This price profile can be managed in
real time fashion. An interesting case to explore can be by using a progressive
price which means that subscriber that demand more electricity will absorb
more the price changes.
67
7 Bibliography
[1] X. Fang, S. Misra, G. Xue and D. Yang, ”Smart Grid – the new and improved power
grid: A Survey,” IEEE Communications Surveys and Tutorials, vol. 14, no. 4, pp. 1-37,
2012.
[2] Department of Energy and National Energy Technology Laboratory, ”A Vision for the
Smart Grid,” 2009.
[3] Department of Energy and Litos Strategic Communication, ”The Smart Grid: An
Introduction,” 2010.
[4] A. Ipakchi and F. Albuyeh, ”Grid of the Future,” IEEE Power and Energy Magazine,
vol. 7, no. 2, pp. 52-62, 2009.
[5] G. F. Reed, P. A. Philip, A. Barchowsky, C. J. Lippert and A. R. Sparacino, ”Sample
survey of smart grid approaches and technology gap analysis,” Innovative Smart Grid
Technologies Conference Europe (ISGT Europe), 2010 IEEE PES, pp. 1-10, 2010.
[6] M. Hashmi, S. Hanninen and K. Maki, ”Survey of smart grid concepts, architectures,
and technological demonstrations worldwide,” Innovative Smart Grid Technologies
(ISGT Latin America), 2011 IEEE PES Conference on, pp. 1-7, 2011.
[7] National Institute of Standards and Technology, ”NIST framework and roadmap for
smart grid interoperability standards,” release 1.0, 2010.

68
[8] H. Gharavi and R. Ghafurian, ”Smart grid: The electric energy system of the future,”
Proceedings of the IEEE , vol. 99, no. 6, pp. 917-921, 2011.
[9] J. Momoh, Smart Grid: Fundamentals of Design and Analysis, John Wiley & Sons,
2012.
[10] P. Fox-Penner, Smart Power: Climate Change, the Smart Grid, and the Future of
Electric Utilities, Island Press, 2010.
[11] F. P. Sioshansi, Smart Grid: Integrating Renewable, Distributed and Efficient Energy,
Academic Press, 2011.
[12] A. Yokoyama, J. Wu, K. Liyanage, N. Jenkins and J. Ekanayake, Smart Grid:
Technology and Applications, John Wiley & Sons, 2012.
[13] M. D. Ilic and A. Chakrabortty, Control and Optimization Methods for Electric Smart
Grids, Springer, 2012.
[14] G. W. Arnold, ”Challenges and Opportunities in Smart Grid: A Position Article,”
Proceedings of the IEEE, vol. 99, no. 6, pp. 922-927, 2011.
[15] National Institute of Standards and Technology, ”Introduction to NISTIR 7628
Guidelines for Smart Grid Cyber Security,” 2010.
[16] C. W. Gellings, ”The Concept of Demand-Side Management for Electric Utilities,”
Proceedings of the IEEE, vol. 73, no. 10, pp. 1468-1470, 1985.
[17] G. Strbac, ”Demand Side Management: Benefits and Challenges,” Energy Policy, vol.
36, no. 12, pp. 4419-4426, 2008.
[18] B. Davito, H. Tai and R. Uhlaner, ”The Smart Grid and the promise of Demand-Side
Management,” McKinsey & Company, 2010.

69
[19] Z. M. Fadlullah, Y. Nozaki, A. Takeuchi and N. Kato, ”A Survey of Game Theoretic
approaches in Smart Grid,” Wireless Communications and Signal Processing (WCSP),
2011 International Conference on, pp. 1-4, 2011.
[20] W. Saad, Z. Han, V. H. Poor and T. Basar, ”Game-Theoretic Methods for the Smart
Grid: An Overview of Microgrid Systems, Demand-Side Management, and Smart Grid
Communications,” Signal Processing Magazine, IEEE, vol. 29, no. 5, pp. 86-105, 2012.
[21] K. G. Binmore, Fun and Games, A text on Game Theory, D. C. Heath Canada,
Limited, 1992.
[22] R. Gibbons, Game Theory for Applied Economists, Princeton University Press, 1992.
[23] D. Miorandi and F. De Pellegrini, ”Demand-Side Management in Smart Grids: an
Evolutionary Games Perspective,” Performance Evaluation Methodologies and Tools
(VALUETOOLS), 2012 6th International Conference on, pp. 178-187, 2012.
[24] N. Nisan, T. Roughgarden, E. Tardos and V. V. Vazirani, Algorithmic Game Theory,
Cambridge University Press, 2007.
[25] M. Fahrioglu and F. L. Alvarado, ”Designing Incentive Compatible Contracts for
Effective Demand Management,” Power Systems, IEEE Transactions on , vol. 15, no.
4, pp. 1255-1260, 2000.
[26] A. D. Taylor and S. J. Brams, Fair Division: From Cake-Cutting to Dispute
Resolution, Cambridge University Press, 1996.
[27] H. Moulin, Fair Division and Collective Welfare, MIT Press, 2004.
[28] A. Saberi and Y. Wang, Cutting a cake for five people. In Proceedings of the Fifth
International Conference on Algorithmic Aspects in Information and Management,
Springer, 2009.

70
[29] A. H. Mohsenian-Rad, V. W. Wong, J. Jatskevich and R. Schober, ”Optimal and
Autonomous Incentive-based Energy Consumption Scheduling Algorithm for Smart
Grid,” Innovative Smart Grid Technologies (ISGT), pp. 1-6, 2010.
[30] A. H. Mohsenian-Rad, V. W. Wong, J. Jatskevich, R. Schober and A. Leon-Garcia,
”Autonomous Demand Side Management Based on Game Theoretic Energy
Consumption Scheduling for the Future Smart Grid,” Smart Grid, IEEE Transactions
on , vol. 1, no. 3, pp. 320-331, 2010.
[31] C. Ibars, M. Navarro and L. Giupponi, ”Distributed Demand Management in Smart
Grid with a Congestion Game,” Smart Grid Communications (SmartGridComm), 2010
First IEEE International Conference on, pp. 495-500, 2010.
[32] S. Caron and G. Kesidis, ”Incentive-based Energy Consumption Scheduling
Algorithms for the Smart Grid,” Smart Grid Communications (SmartGridComm),
First IEEE International Conference on, p. 391–396, 2010.
[33] C. Chen, S. Kishore and L. V. Snyder, ”An innovative RTP-based residential power
scheduling scheme for smart grids,” Proc. ICASSP, 2011.
[34] N. Gatsis and G. B. Giannakis, ”Cooperative Multi-Residence Demand Response
Scheduling,” Information Sciences and Systems (CISS), 45th Annual Conference on ,
pp. 1-6, 2011.
[35] P. Samadi, R. Schober and V. W. Wong, ”Optimal Energy Consumption Scheduling
Using Mechanism Design for the Future Smart Grid,” Smart Grid Communications
(SmartGridComm), IEEE International Conference on, pp. 369-374, 2011.
[36] C. Wang and M. de Groot, ”Managing End-User Preferences in the Smart Grid,”
Proceedings of the 1st International Conference on Energy-Efficient Computing and
Networking, pp. 105-114, 2010.

71
[37] Z. Zhu, J. Tang, S. Lambotharan, W. H. Chin and Z. Fan, ”An Integer Linear
Programming and Game Theory Based Optimization for Demand-side Management in
Smart Grid,” GLOBECOM Workshops (GC Wkshps), IEEE, pp. 1205-1210, 2011.
[38] H. K. Nguyen, J. B. Song and Z. Han, ”Demand Side Management to Reduce Peak-to-
Average Ratio using Game Theory in Smart Grid,” Computer Communications
Workshops (INFOCOM WKSHPS), IEEE Conference on, pp. 91-96, 2012.
[39] Y. Chen, R. P. Liu, C. Wang, M. de Groot and Z. Zeng, ”Consumer Operational
Comfort Level Based Power Demand Management in the Smart Grid,” Innovative
Smart Grid Technologies (ISGT Europe), 3rd IEEE PES International Conference and
Exhibition on, pp. 1-6, 2012.
[40] M. Shinwari, A. Youssef and W. Hamouda, ”A Water-Filling Based Scheduling
Algorithm for the Smart Grid,” Smart Grid, IEEE Transactions on , vol. 3, no. 2, pp.
710-719, 2012.
[41] P. Samadi, A. H. Mohsenian-Rad, R. Schober, V. W. Wong and J. Jatskevich,
”Optimal Real-Time Pricing Algorithm Based on Utility Maximization for Smart
Grid,” Smart Grid Communications (SmartGridComm), First IEEE International
Conference on , pp. 415-420, 2010.
[42] P. Tarasak, ”Optimal Real Time Pricing under Load Uncertainty based on Utility
Maximization for Smart Grid,” Smart Grid Communications (SmartGridComm), IEEE
International Conference on, pp. 321-326, 2011.
[43] P. Samadi, A. H. Mohsenian-Rad, R. Schober and V. W. Wong, ”Advanced Demand
Side Management for the Future Smart Grid Using Mechanism Design,” Smart Grid,
IEEE Transactions on, vol. 3, no. 3, pp. 1170-1180, 2012.

72
[44] T. Agarwal and S. Cui, ”Noncooperative Games for Autonomous Consumer Load
Balancing over Smart Grid,” [Online]. Available: http://arxiv.org/abs/1104.3802.
[45] A. J. Conejo, J. M. Morales and L. Baringo, ”Real-Time Demand Response Model,”
Smart Grid, IEEE Transactions on , vol. 1, no. 3, pp. 236-242, 2010.
[46] S. D. Ramchurn, P. Vytelingum, A. Rogers and N. Jennings, ”Agent-Based Control
for Decentralised Demand Side Management in the Smart Grid,” In Proc. of AAMAS,
pp. 5-12, 2011.
[47] A. H. Mohsenian-Rad and A. Leon-Garcia, ”Optimal Residential Load Control with
Price Prediction in Real Time Electricity Pricing Environments,” Smart Grid, IEEE
Transactions on , vol. 1, no. 2, pp. 120-133, 2010.
[48] D. L. Spohn and D. E. McDysan, ATM theory and application, McGraw-Hill, 1999.
[49] E. Salfati and R. Rabinovici, ”Demand-Side Management in Smart Grid Using Game
Theory,” in Department of Electrical and Computer Engineering Seminar, Ben-Gurion
University, Beer-Sheva, 2013.
[50] E. Salfati and R. Rabinovici, ”Demand-Side Management in Smart Grid Using Game
Theory,” in IEC smart grid leaders meeting, Bene-Beraq, 2013.
[51] E. Salfati and R. Rabinovici, ”Demand-Side Management in Smart Grid Using Game
Theory,” in The Annual Convention of the Society of Electrical and Electronics
Engineers in Israel, Jerusalem, 2013.
Related Documents