Hurvitz and Andrea L. Hevener Aldons J. Lusis, Dennis J. Slamon, Sara A. Hewitt, Kenneth S. Korach, Peter Tontonoz, Daraei, Heather R. Christofk, Sylvia C. Nareg Y. Kalajian, Jennifer Phun, Pedram C. Calkin, Brian W. Parks, Vicent Ribas, Claudio J. Villanueva, Susan A. Krum, Anna Brian G. Drew, Habib Hamidi, Zhenqi Zhou, Cancer Progression Adipose Tissue Links Obesity with Breast -regulated Lipocalin 2 Expression in α ER Molecular Bases of Disease: published online December 2, 2014 J. Biol. Chem. 10.1074/jbc.M114.606459 Access the most updated version of this article at doi: . JBC Affinity Sites Find articles, minireviews, Reflections and Classics on similar topics on the Alerts: When a correction for this article is posted • When this article is cited • to choose from all of JBC's e-mail alerts Click here http://www.jbc.org/content/early/2014/12/02/jbc.M114.606459.full.html#ref-list-1 This article cites 0 references, 0 of which can be accessed free at at UCLA-Louise Darling Biomed. Lib. on December 10, 2014 http://www.jbc.org/ Downloaded from at UCLA-Louise Darling Biomed. Lib. on December 10, 2014 http://www.jbc.org/ Downloaded from

Welcome message from author
This document is posted to help you gain knowledge. Please leave a comment to let me know what you think about it! Share it to your friends and learn new things together.
Transcript

Hurvitz and Andrea L. HevenerAldons J. Lusis, Dennis J. Slamon, Sara A.Hewitt, Kenneth S. Korach, Peter Tontonoz, Daraei, Heather R. Christofk, Sylvia C.Nareg Y. Kalajian, Jennifer Phun, Pedram C. Calkin, Brian W. Parks, Vicent Ribas,Claudio J. Villanueva, Susan A. Krum, Anna Brian G. Drew, Habib Hamidi, Zhenqi Zhou, Cancer ProgressionAdipose Tissue Links Obesity with Breast
-regulated Lipocalin 2 Expression inαERMolecular Bases of Disease:
published online December 2, 2014J. Biol. Chem.
10.1074/jbc.M114.606459Access the most updated version of this article at doi:
.JBC Affinity SitesFind articles, minireviews, Reflections and Classics on similar topics on the
Alerts:
When a correction for this article is posted•
When this article is cited•
to choose from all of JBC's e-mail alertsClick here
http://www.jbc.org/content/early/2014/12/02/jbc.M114.606459.full.html#ref-list-1
This article cites 0 references, 0 of which can be accessed free at
at UC
LA
-Louise D
arling Biom
ed. Lib. on D
ecember 10, 2014
http://ww
w.jbc.org/
Dow
nloaded from
at UC
LA
-Louise D
arling Biom
ed. Lib. on D
ecember 10, 2014
http://ww
w.jbc.org/
Dow
nloaded from
1
ERα-regulated Lipocalin 2 Expression in Adipose Tissue Links Obesity with Breast Cancer Progression
Brian G. Drew1a, Habib Hamidi2, 3, Zhenqi Zhou1, Claudio J. Villanueva4b, Susan A. Krum5c, Anna C. Calkin4d , Brian W. Parks6, Vicent Ribas1, Nareg Y. Kalajian1, Jennifer Phun1, Pedram Daraei1, Heather R. Christofk3,7, Sylvia C. Hewitt8, Kenneth S. Korach8, Peter Tontonoz4, Aldons J. Lusis6, Dennis J. Slamon2,3,9, Sara A. Hurvitz2,3,9 and Andrea L. Hevener1,3,10
David Geffen School of Medicine, Department of Medicine, 1Division of Endocrinology, Diabetes and Hypertension, 2Division of Hematology-Oncology and 3Jonsson Comprehensive Cancer Center, UCLA, Los Angeles, CA, USA 90095 4Department of Pathology and Laboratory Medicine, Howard Hughes Medical Institute, UCLA, Los Angeles, CA, USA 90095 5Orthopaedic Hospital Department of Orthopaedic Surgery and the Orthopaedic Hospital Research Center, UCLA, Los Angeles, CA, USA 90095 6Department of Human Genetics, UCLA, Los Angeles, CA, USA 90095 7Molecular and Medical Pharmacology, UCLA, Los Angeles, CA, USA 90095 8Receptor Biology Section, Reproductive and Developmental Biology Laboratory, NIEHS-NIH, Research Triangle Park, NC, USA 27709 9Translational Research in Oncology-US 10Iris Cantor – UCLA Women’s Health Center, Los Angeles, CA, USA 90095 Running title: Adipose tissue ERα expression, obesity, and breast cancer progression To whom correspondence should be addressed: Andrea L. Hevener, Ph.D. University of California, Los Angeles David Geffen School of Medicine, Division of Endocrinology, Diabetes, and Hypertension 900 Veteran Avenue, Warren Hall Suite 24-130 Los Angeles, CA 90095-7073 Phone: (310) 794-7555 Fax: (310) 794-7654 e-mail: [email protected] aPresent address: Baker IDI Heart & Diabetes Institute and the Central Clinical School, Monash University, Melbourne, VIC, Australia, 3004 bPresent address: Department of Biological Chemistry, University of Utah, Salt Lake City, Utah, USA, 84112 c Present address: Department of Orthopaedic Surgery and Biomedical Engineering, University of Tennessee Health Science Center, Memphis, Tennessee, USA, 38163 dPresent address: Baker IDI Heart & Diabetes Institute, Melbourne, VIC, Australia, 3004
Keywords: estrogen receptor α; lipocalin 2; obesity; breast cancer
http://www.jbc.org/cgi/doi/10.1074/jbc.M114.606459The latest version is at JBC Papers in Press. Published on December 2, 2014 as Manuscript M114.606459
Copyright 2014 by The American Society for Biochemistry and Molecular Biology, Inc.
at UC
LA
-Louise D
arling Biom
ed. Lib. on D
ecember 10, 2014
http://ww
w.jbc.org/
Dow
nloaded from

2
Background: Mechanisms underlying obesity-associated breast cancer incidence are incompletely understood. Results: Adipose tissue ERα expression is inversely associated with adiposity and the expression and release of Lcn2, an adipokine promoting breast cancer cell proliferation and migration. Conclusion: ERα is critical for restraining adiposity and Lcn2 production. Significance: Modulation of adipose tissue ERα action is a potential approach to prevent obesity and reduce breast cancer risk. ABSTRACT
Obesity is associated with increased breast cancer (BrCA) incidence. Considering that inactivation of the estrogen receptor (ER)α promotes obesity and metabolic dysfunction in women and female mice, understanding the mechanisms and tissue-specific sites of ERα action to combat metabolic-related disease, including BrCA, is of clinical importance. To study the role of ERα in adipose tissue we generated fat-specific ERα knockout (FERKO) mice. Herein we show that ERα deletion increased adipocyte size, fat pad weight, and tissue expression and circulating levels of the secreted glycoprotein, lipocalin 2 (Lcn2), an adipokine previously associated with BrCA development. Chromatin immunoprecipitation and luciferase reporter studies showed that ERα binds the Lcn2 promoter to repress its expression. Since adipocytes constitute an important cell type of the breast microenvironment, we examined the impact of adipocyte ERα deletion on cancer cell behavior. Conditioned media (CM) from ERα-null adipocytes and media containing pure Lcn2 increased proliferation and migration of a sub-set of BrCA cells in culture. The proliferative and pro-migratory effects of ERα-deficient adipocyte CM on BrCA cells was reversed by Lcn2 deletion. BrCA cell responsiveness to exogenous Lcn2 was heightened in cell types where endogenous Lcn2 expression was minimal, but components of the Lcn2 signaling pathway were enriched, i.e. Lcn2-R (slc22a17) and 3-hydroxy butyrate dehydrogenase (BDH2). In breast tumor biopsies from women diagnosed with BrCA we found that BDH2 expression was positively associated with adiposity and circulating Lcn2 levels. Collectively these data suggest that reduction of ERα expression in adipose tissue promotes adiposity and is linked with the progression and severity of BrCA via increased adipocyte-specific Lcn2 production and enhanced tumor cell Lcn2 sensitivity.
The alarming rise in obesity over recent decades is strongly associated with a concomitant increase in chronic disease incidence (1). It is generally appreciated that obesity promotes low-grade systemic inflammation via metabolic dysfunction and immune cell activation (2-3), and these factors, common underpinnings of type 2 diabetes and atherosclerosis, are also associated with increased prevalence of breast cancer (BrCA) in women (4-7).
Breast cancer is a leading cause of mortality in women, and the inability to predict, prevent, and treat metastatic breast cancer currently limits patient care. Obesity is linked with more aggressive forms of cancer with less favorable outcomes as obese women in the highest quintile of body mass index (BMI) have double the death rate from BrCA compared to lean counterparts (4). Although the mechanisms by which obesity and metabolic dysfunction increase BrCA risk remain unclear, recent studies have correlated altered levels of circulating factors including metabolites, hormones, adipokines, and cytokines/chemokines with increased BrCA cell proliferation and migration. In addition to visceral adipose previously linked with higher BrCA incidence, adipocytes are also the most abundant cell type of the mammary tumor stroma, and thus paracrine action on malignant epithelium is thought to impact early stages of carcinogenesis as well as responsiveness of established tumors to adjuvant therapies (8-11).
Although many factors contribute to the development of metabolic dysfunction and obesity in human subjects, rare inactivating mutations in the estrogen receptor alpha gene, ESR1, and common polymorphisms at this locus, are associated with adiposity, type 2 diabetes, atherosclerosis and BrCA risk, independent of circulating hormone status (12-15). Moreover, Dahlman-Wright and colleagues showed that ESR1 expression is reduced in adipose tissue from obese women (16). Consistent with observations in human subjects, mice harboring a homozygous Esr1-null mutation manifest marked obesity, insulin resistance, and heightened tissue inflammation (17-18). Although a role for ERα in regulating metabolic homeostasis, adiposity, and insulin sensitivity is well established, the molecular targets of ERα action within glucoregulatory cell types remain incompletely understood.
Considering that ERα is markedly reduced in adipose from obese individuals and obesity elevates metastatic breast cancer risk in women, we investigated whether targeted loss of adipose tissue ERα could promote increased adiposity, metabolic dysfunction, and a secretory profile promoting BrCA tumorigenesis.
at UC
LA
-Louise D
arling Biom
ed. Lib. on D
ecember 10, 2014
http://ww
w.jbc.org/
Dow
nloaded from
3
Herein we show that adipose tissue deletion of ERα increased adiposity and inflammation in female mice, driven in part by a marked elevation in the adipocyte-derived factor, lipocalin 2 (Lcn2). Conditioned media (CM) containing secreted factors from ERα-deficient adipocytes or pure Lcn2 markedly increased proliferation and motility of a specific set of BrCA cell lines in culture. We found that BrCA responsiveness to exogenous Lcn2 was marked by differential expression of intrinsic Lcn2 signaling components. We identified that expression of 3-hydroxy butyrate dehydrogenase (BDH2), an enzyme responsible for the production of the mammalian siderophore 2,5-DHBA and critical for mitochondrial heme synthesis, as a critical component in determining cellular responsiveness to Lcn2. Importantly, we showed that expression of BDH2 in breast tumor biopsies was positively associated with obesity and circulating Lcn2 levels in women with BrCA. Our findings suggest that adipose tissue ERα expression is an important unifying link between obesity and breast cancer risk in women. EXPERIMENTAL PROCEDURES Animals. Male and female flox/flox (f/f) and adipose-specific ERα KO (FERKO) mice on a C57Bl6 background were generated by crossing ERα floxed mice (19) with transgenic lines in which Cre recombinase was driven by the aP2 (FABP4) promoter (20). LepOb mice were from Jackson Laboratories and maintained as previously described (18). The EAAE-ERα DNA-binding domain mutant mice were generated by the Korach laboratory as previously described and adipose tissue was harvested for subsequent qPCR analyses (21-22). Control or 17β-estradiol pellets (0.05 mg; 21d, Innovative Research) were surgically inserted under the skin of LepOb mice and tissues were harvested after 21d following a 6h fast. Female mice from the UCLA Hybrid Mouse Diversity Panel (HMDP; Supplemental Table 1), including 102 strains of inbred animals (23), were maintained on a high fat (HF) high sucrose (HS) western diet (Research Diets-D12266B) with the following composition, 16.8 % kcal protein, 51.4 % kcal carbohydrate, 31.8 % kcal fat. Following fasting, animals were anesthetized with 4% isoflurane and exsanguinated prior to tissue harvest. Blood was collected into tubes containing EDTA and plasma was separated by centrifugation. All procedures were performed in accordance with the Guide for Care and Use of Laboratory Animals of the National Institutes of Health, and were approved by the Animal Research Committee of the University of California, Los Angeles.
Human subjects. Pre-treatment tumor gene expression data was mined from breast cancer patients participating in the UCLA Translational Oncology Research International (TORI-B02) trial (24). Circulating factors. Plasma was analyzed for insulin, leptin, PAI-1 (Millipore), adiponectin (RIA; Millipore) and estradiol (Siemens Diagnostics) as previously described (18). Lipocalin 2 ELISA was performed on plasma from women and female mice as per the manufacturer’s instructions (R&D Systems). Body composition. Female mice from the HMDP were measured for total body fat mass and lean mass by magnetic resonance imaging (MRI) using Bruker Minispec with software from Eco Medical Systems. RNA isolation and expression profiling in adipose from HMDP mice and BrCA cell lines. Total RNA was isolated from tissues using Trizol (Invitrogen) according to the manufacturer’s instructions. Total RNA was isolated from cell cultures using the Qiagen RNeasy columns according to the manufacturer’s instructions. For micro-arrays, adipose tissue and BrCA cell (Supplemental Table 2) RNA was hybridized to Affymetrix HT_MG-430A arrays and scanned using standard Affymetrix protocols. To reduce the risk of spurious association results, RNA normalization was performed after removing all individual probes with SNPs and all probesets containing 8 or more SNP-containing probes, which resulted in 22416 remaining probesets. Cell isolations and culture. HEK293 cells (ATCC) were maintained and passaged in DMEM containing 10% FBS. ERα-stably expressing 3T3-L1 cells were generated by infecting 3T3-L1 pre-adipocytes with fresh retrovirus particles generated in PhoenixE cells transfected with pBABE containing the Esr1-ORF, or empty pBABE for control cells (pB). Stable transformants were selected for 1 week in puromycin (5ug/mL). For differentiation of 3T3-L1, cells were grown to confluence (Day 0) before incubation in the standard DMI differentiation cocktail with the addition of rosiglitazone maleate (500nM, Alexis Biochemicals) where indicated, for 3 days (Day 3), then encouraged to lipid load for 4 days in the presence of 10nM insulin (Day 7). Primary white adipocytes were generated from stromal vascular fractions isolated from epididymal adipose tissue beds from both f/f Control and FERKO female mice as previously described (25-26). After isolation, cells were allowed to proliferate to confluence, then immediately differentiated as stated above for 3T3-L1 cells. Breast cancer cell lines were maintained as previously described (27). MCF7, T47D, ZR75-1 and EFM19 were all grown and maintained in RPMI with 10% FBS. Experiments with CM or Lcn2
at UC
LA
-Louise D
arling Biom
ed. Lib. on D
ecember 10, 2014
http://ww
w.jbc.org/
Dow
nloaded from
4
were carried out in growth media for 72 h or HBSS with 1% albumin for 24 h, respectively. Conditioned media and Lcn2 incubation. HEK293 cells were cultured as above until ~70% confluent before transfection with the indicated amounts of HA-Lcn2 or GFP plasmid with Lipofectamine 2000, as per the manufacturer’s instructions (Invitrogen). Cells were allowed to recover in growth medium for 24 h after which media was removed and replaced with serum-free media containing 0.1% fatty-acid free BSA for 6-8 h to generate the conditioned media (CM). Pure Lcn2 (R&D Systems) was reconstituted and bound to iron prior to addition to culture medium as described previously (28). Breast cancer cell proliferation and migration. Proliferation and migration experiments were performed in growth media, unless otherwise specified. For proliferation studies, cells were plated into 24 well culture plates at a density of 20,000 cells per well and allowed to attach overnight before media was replaced with the addition of either Lcn2 or GFP CM from HEK293A cells or media from Esr1-KD/D and Esr1-KD/Lcn2-KD cells at a ratio of 1:5 (CM:media). After 48 h cells were washed twice with PBS and stained for 15 min in Hoechst nuclear dye (Invitrogen). Cell number was estimated by plotting Hoechst fluorescence measured in each well, against a pre-determined standard curve. Results were confirmed in separate experiments using a Coulter Particle Counter. For migration studies, cells were plated in 6-well plates at sub-confluency and allowed to proliferate in the presence of the specified CM until ~95% confluent. Two standardized scratches were made through each well and images were acquired in at least three wells for each condition as previously described (29-30). Additional images were acquired 18 and 36h later. Quantitative RT-PCR (qPCR). cDNA synthesis was performed on 1µg total RNA using iScript cDNA synthesis kit (Biorad) and qPCR reactions were performed using iQ SYBR Green Supermix (Biorad). Primer sequences for the specific target genes analyzed can be found in Supplemental Table 3. Plasmids and constructs. Esr1-knockdown (KD) by short-hairpin RNAs (shRNAs) cloned into the lentivirus vector pLKO.1-puro were purchased as lentiviral transduction particles from Sigma-Aldrich (MISSION®; Esr1-B). Scrambled shRNAs (non-target shRNA vector, catalog no. SHC002V; Sigma), used for control experiments, contain a hairpin insert that generates siRNAs but contains five base pair mismatches to all known human and mouse genes. Particles were subsequently used to transduce 3T3-L1 pre-adipocytes (multiplicity of infection – 10). Stably expressing cells were selected with puromycin (3μg/ml)
for 1 week. Knockdown efficiency was assessed by qPCR and Western blotting.
ERα Expression Plasmid: A mouse Esr1-ORF cloning vector (OpenBiosystems) was used to sub-clone esr1 into pcDNA3.1 and delivered to cells using Lipofectamine 2000 as per manufacturer’s instructions (Invitrogen). pBABE-esr1 retrovirus plasmid: The Esr1-ORF was cloned into pBABE using gateway technology (Invitrogen) as described below for Lcn2. Lcn2 HA-tagged expression plasmid: Lcn2 cDNA was PCR amplified with the addition of attB/P gateway sites from the pMSCV-Lcn2 plasmid ((20) a kind gift from Evan Rosen). The subsequent PCR fragment was gel purified and cloned into a customized N-terminal Hemagglutinin (HA) pcDNA backbone vector (kind gift from Thomas Vallim, UCLA) using gateway technology (Invitrogen), before use in transfection assays as described above. C/EBP plasmids were a kind gift from Stephen Farmer (Boston University). PPARg2 plasmid was obtained from Peter Tontonoz (UCLA). All primers used for cloning are presented in Supplemental Table 4. Promoter luciferase contructs and assays. The Lcn2 5’-upstream promoter (2.7kb) was cloned by PCR from BAC-clone RP24-290P20 (CHORI) with primers outlined in Supplemental Table 4, designed to add extensions for gateway BP-cloning and SacI and KpnI sites. PCR fragments were amplified by cloning into pDONR221 using gateway technology (Invitrogen), transformed, expanded and isolated by mini-prep. Promoter containing plasmids and the luciferase expression plasmid (pGL4-basic, Promega) were separately double digested with SacI and KpnI for 1 hour then precipitated and washed by phenol-chloroform extraction. Digested DNA was resuspended in water and used in ligation reactions with T4 ligase at a ratio of 6:1 (insert:plasmid) according the manufacturer’s instructions (New England Biolabs) and transformed into competent bacteria. Positive clones were sequenced for confirmation. For luciferase assays, 3T3-L1 cells were transfected with promoter plasmids or empty plasmid (500ng) and renilla (1ng) together with other expression plasmids as indicated (100ng each) using PLUS-reagent and Lipofectamine 2000 (Invitrogen) according to manufacturer’s instructions. Cells were then placed in phenol-red free DMEM containing 10% charcoal-dextran stripped FBS for 12 h to recover before treatment with either DMSO or PPT (100nM) for 12hrs. Luciferase assays were performed according to manufacturer’s instructions (Promega, Dual-Glo Stop & Glo). Data is expressed as a ratio of luciferase to renilla RLUs and converted to fold change from basal.
at UC
LA
-Louise D
arling Biom
ed. Lib. on D
ecember 10, 2014
http://ww
w.jbc.org/
Dow
nloaded from
5
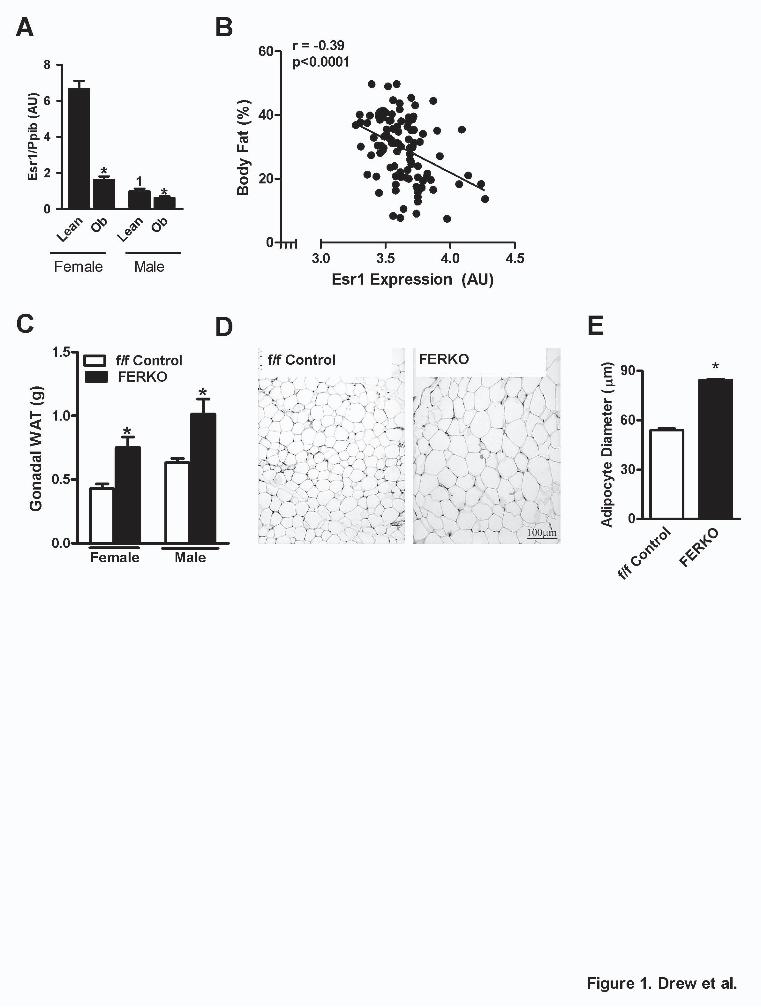
Chromatin immunoprecipitation (ChIP). Stable ERα-expressing 3T3-L1 cells (described above) were used for ChIP experiments. Cells were grown to confluence and at day 3 of differentiation were harvested and subjected to ChIP analysis as previously described (31) using antibodies against ERα (Santa Cruz Biotech). Primers for detection of the presence of the Lcn2 promoter by qPCR are outlined in Supplemental Table 4. Immunoblot analysis. Animal tissues and cultured cells were homogenized in RIPA lysis buffer containing protease and phosphatase inhibitors. Samples were separated by SDS-PAGE, transferred to PVDF membrane and probed with the following antibodies for protein detection: pan-actin (Cell Signaling Technologies), ERα (Santa Cruz Biotechnology), and Lcn2 (Goat anti-mouse, R&D Systems). Densitometric analysis was performed using BioRad Chemidoc image software, Quantity One (Version 4.6). Adipose tissue histology. Periovarian adipose tissue immunohistochemistry was performed on paraformaldehyde (8%) fixed samples by the University of California, San Diego, Moores Cancer Center, Histology and Immunohistochemistry Shared Resource Facility as previously described (32). Adipocyte size was estimated from H&E stained sections of adipose tissue by analyzing 10 different sections per genotype, counting 100 adipocytes per section using a Nikon Eclipse 80i Upright microscope and Image-Pro Plus Software (Media Cybernetics). Statistical analyses. Associations between biomarkers in human subjects were analyzed using Spearman's rho correlation. Relationships between expression levels and % body fat for mice were determined by Pearson’s correlation coefficient. Differences between subgroups (normal, underweight, overweight and obese) were compared using the Student's t test. Multiple group by treatment mean comparisons were performed using ANOVA with Tukey’s LSD posthoc test analyses. Significance was established a priori P < 0.05 RESULTS Adipose-specific deletion of ERα promotes obesity. Previous studies have shown that the expression of the ERα is significantly reduced in adipose tissue from obese women (16). Indeed, we observed reductions in ERα expression in adipose tissue from genetically obese LepOb male and female mice (Fig. 1A). We also found that adipose tissue Esr1 expression is inversely correlated with the degree of HFD-induced adiposity in more than 100 genetically diverse strains of inbred female mice, termed the UCLA Hybrid Mouse Diversity Panel (HMDP (23)) (Fig. 1B).
To determine whether impaired ERα action promotes adiposity even during normal chow (NC) feeding, we generated fat-specific ERα knockout mice (FERKO) by mating floxed ERα (f/f) animals (33) with transgenic mice expressing Cre recombinase driven by the aP2 promoter (20). As expected, ERα expression levels were significantly reduced in both white adipose tissue (WAT) and brown adipose tissue (BAT) of female (Supplemental Fig. S1A) and male (Supplemental Fig. S1B) FERKO mice, compared to f/f Control littermates. Deletion was selective for adipose tissue as ERα mRNA levels were maintained in skeletal muscle and liver of FERKO mice (Supplemental Fig. S1A-B). Phenotypic analyses revealed that the body mass of female FERKO mice was increased compared to that of f/f Control animals (26.3±0.14 vs. 23.0±0.13 g, p<0.001), a finding also observed in male mice, although the difference did not reach statistical significance (p=0.116) (Supplemental Fig. S1C). Consistent with findings for body weight, FERKO female mice had significantly larger gonadal fat pads (0.43±0.01 vs. 0.63±0.01 g, p=0.001; Fig. 1C) and BAT depots (0.046±0.001 vs. 0.067±0.001 g, p=0.029, Supplemental Fig. S1D) compared with f/f Control, and a similar finding for WAT (p=0.03) but not BAT (p=0.1) was observed for FERKO vs. f/f Control male mice. Adipocytes from gonadal fat pads of female FERKO mice were larger in diameter than those from f/f Control mice (Fig. 1D-E). Consistent with increased body weight of FERKO females, we also found increased liver weights in female FERKO mice compared with f/f Control (1.32±0.02 vs. 1.01±0.01 g, p=0.002; Supplemental Fig. S1E). However, liver weights were similar between genotypes for male animals.
Analyses of circulating factors were consistent with the observed obesity phenotype in female FERKO mice as plasma levels of leptin (2.4±0.1 vs. 1.2±0.1 ng/ml, p=0.04) and the inflammatory marker PAI-1 (1.0±0.01 vs. 0.5±0.04 ng/ml, p=0.05) were elevated over that of f/f Control animals (Table 1). In contrast, no differences in plasma concentrations of insulin, adiponectin, or estradiol were detected between the genotypes (Table 1).
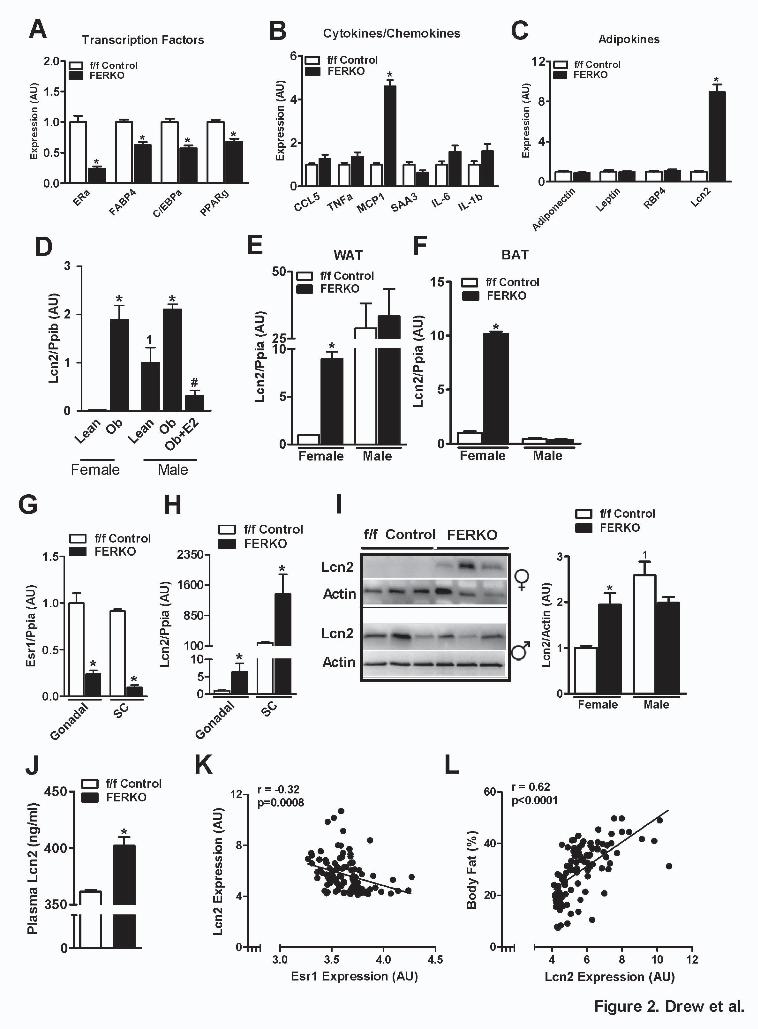
Adipose tissue ERα deletion alters adipocyte function and lipocalin 2 expression in female mice. Considering that the phenotype of female FERKO mice was more prominent than that observed for males, we focused subsequent screening studies on adipose tissue from female animals. Expression of the adipogenic transcription factors C/EBPα and PPARγ were reduced in FERKO fat (Fig. 2A). With the exception of the inflammatory chemokine MCP1, which was elevated in
at UC
LA
-Louise D
arling Biom
ed. Lib. on D
ecember 10, 2014
http://ww
w.jbc.org/
Dow
nloaded from
6
FERKO ~5-fold above f/f Control (p=0.001; Fig. 2B), the expression levels of pro-inflammatory cytokines were similar between the genotypes of female mice. Analysis of adipokine expression from FERKO fat showed no change in adiponectin, leptin or RBP4 transcript levels. In contrast, a significant 9-fold elevation in the expression of lipocalin 2 (Lcn2) was observed in adipose tissue from FERKO compared with f/f Control (Fig. 2C). Increased Lcn2 expression was also detected in WAT from Lepob mice of both genders compared with respective lean controls (Fig. 2D). Of note, a gender dimorphism in adipose tissue Lcn2 expression was also observed as transcript levels were markedly elevated in adipose tissue of lean WT and f/f Control male mice compared with similar genotype female animals (Fig. 2D-E). Our data suggest that this gender dimorphism was a possible result of higher basal ERα expression levels in WAT of female vs. male mice (Fig. 1A). Consistent with this observed gender dimorphism, in male Lepob mice an experimental increase in circulating estradiol concentration to levels observed in normally cycling females reduced expression of Lcn2 in epididymal fat below that observed for lean male animals (Fig. 2D).
In gonadal white and subscapular brown adipose tissue, the loss of ERα promoted increased expression of Lcn2 (5-10 fold) in FERKO compared with f/f Control for female but not male animals (Fig. 2E-F). Similar to periovarian adipose, reduced ERα expression in subcutaneous (SC) fat from FERKO female mice (Fig. 2G) was paralleled by a marked increase in Lcn2 expression over f/f Control (Fig. 2H). However, we detected increased Lcn2 expression levels in SC over gonadal fat from all female animals studied. Immunoblot analyses confirmed that Lcn2 protein was significantly elevated in periovarian WAT from female FERKO mice vs. f/f Control (Fig. 2I). Similar to findings for transcript abundance, Lcn2 protein levels in WAT from male mice were significantly elevated above levels for females. Moreover, no difference in WAT Lcn2 protein was detected between the genotypes in male animals (Fig. 2I). In line with reports that circulating Lcn2 levels are elevated in the plasma of obese, insulin resistant mice and humans (34-37), we found that plasma Lcn2 levels were also elevated in female FERKO compared to f/f Control mice (402±7.5 vs. 361±1.4 pg/ml respectively, p=0.02; Fig. 2J). In addition to showing that ERα deletion increased Lcn2 expression in adipose tissue of female mice, we confirmed a strong inverse relationship between Esr1 and Lcn2 expression in WAT obtained from 102 unique strains of HFD-fed female mice of the UCLA HMDP (Fig. 2K). Lcn2 expression was highly correlated with
body fat percentage (Fig. 2L) and similar to the relationship between adiposity and the adipokine leptin. These data confirm that natural genetic variation of ERα expression in adipose tissue among diverse mouse strains is inversely associated with Lcn2 expression, an adipokine we found tightly correlated with adiposity in female mice.
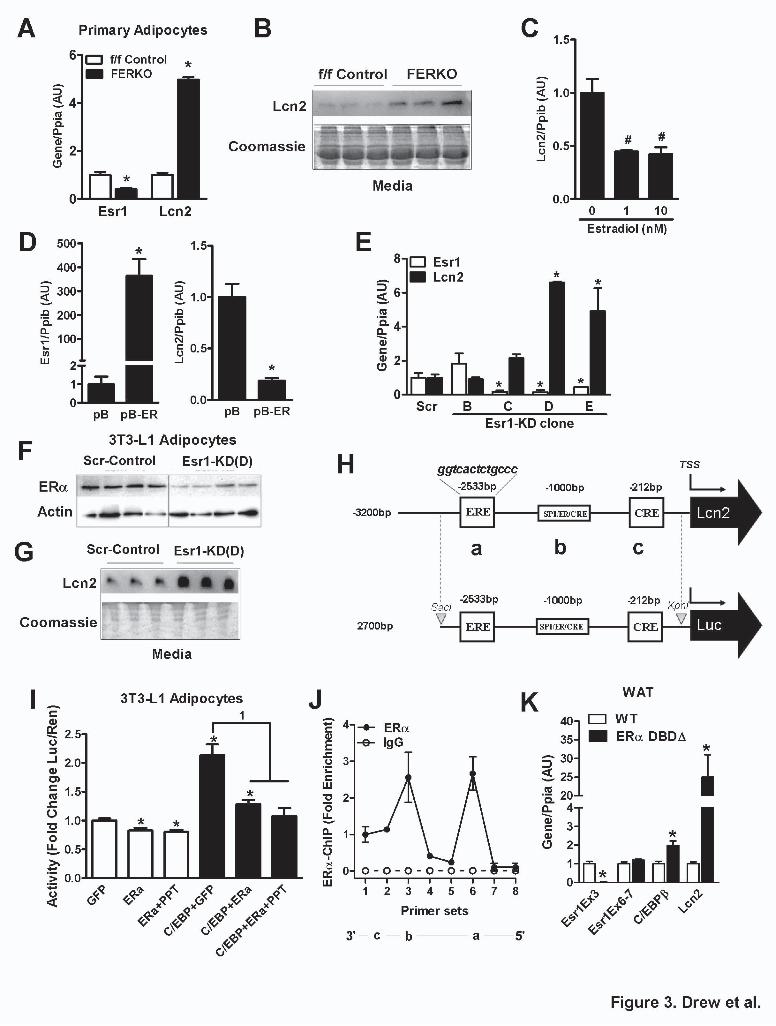
ERα deletion impairs adipocyte function and increases Lcn2 expression in culture. Prior studies have identified a functional estrogen response element (ERE) within the Lcn2 gene promoter that controls its expression in normal breast tissue (38). We investigated the potential for ERα to directly modulate Lcn2 expression in adipocytes. Our own computational analysis confirmed the existence of a complete palindromic ERE at -2533bp upstream from the transcriptional start site of the mouse Lcn2 gene(38). To demonstrate direct action of ERα on Lcn2 expression independent of secondary in vivo cues including insulin resistance or obesity, we showed that Lcn2 expression was elevated in cultured primary adipocytes from FERKO WAT compared to primary cells isolated from WAT of f/f Control animals (Fig. 3A). Primary adipocytes lacking ERα (FERKO) released elevated amounts of Lcn2 into the medium (Day 3 of differentiation) compared to control ERα replete adipocytes (Fig. 3B).
Next we studied the effects of 17 β-estradiol (E2) on Lcn2 expression in 3T3-L1 adipocytes. Maximal suppression of Lcn2 expression was achieved with 1 nM E2 treatment (Fig. 3C). To further support a role for ERα in the regulation of Lcn2, we stably overexpressed ERα using retrovirus. Lcn2 expression was reduced by ~80% in cells overexpressing ERα compared to vector controls (Fig. 3D). To investigate the effects of ERα loss-of-function on Lcn2 expression, we generated four 3T3-L1 ERα knockdown (Esr1-KD) cell lines (Esr1-KD -B, -C, -D and –E) by stably expressing Esr1 shRNAs (Fig. 3E). Three of the cell lines (C, D, E) showed significantly reduced Esr1 expression, with a concomitant increase in expression of the Lcn2 transcript (Fig. 3E). Of note, the KD cell line that showed no reduction in Esr1 (Esr1-KD B), also showed no change in Lcn2 expression (Fig. 3E). Because of its robust action, Esr1-KD D was selected for subsequent analyses.
Similar to our observations for primary adipocytes from FERKO mice, Esr1-KD 3T3-L1 adipocytes showed significantly reduced ERα protein expression (Fig. 3F) and increased secretion of Lcn2 into the culture media (Fig. 3G). No morphological defects were observed in Esr1-KD 3T3-L1 adipocytes, as confluent, non-differentiated pre-adipocytes (Day 0,
at UC
LA
-Louise D
arling Biom
ed. Lib. on D
ecember 10, 2014
http://ww
w.jbc.org/
Dow
nloaded from

7
Supplemental Fig. S2) or as non-lipid loaded differentiating cells (Day 3, Supplemental Fig. S2). However, after 4 days of lipid loading in the presence of insulin (Day 7, Supplemental Fig. S2), Esr1-KD cells displayed a reduction in lipid accumulation compared to Scr-Control cells. Furthermore, differentiated Esr1-KD adipocytes were larger in size and possessed substantially larger intracellular lipid droplets than WT cells (Supplemental Fig. S2; arrows – bottom panel). These data are consistent with the observation of larger adipocytes and reduced expression of adipocyte transcription factors in FERKO adipose tissue.
ERα binds the Lcn2 promoter and competes with C/EBP for regulation of Lcn2 expression. Considering that previous studies have shown Lcn2 expression is induced by the C/EBP family of transcription factors (34), and that ERα forms complexes with members of this family to control their action on specific target genes (39-40), we hypothesized that interaction of ERα with C/EBP transcription factors may be critical in the regulation of Lcn2 expression specifically in adipocytes. The observation that a C/EBP binding site (ccaat) overlaps with the ERE in the Lcn2 promoter (-2536bp, http://www.cbil.upenn.edu/cgi-bin/tess/tess), supported our hypothesis and led us to investigate the role of ERα in modulating the function of C/EBP factors in the control of Lcn2 expression. To test our hypothesis further, we generated a luciferase reporter construct (pGL4) containing the proximal promoter of mouse Lcn2 (2.7 kb) including the ERE (Fig. 3H). Transient transfection of this luciferase reporter construct into 3T3-L1 adipocytes alone or together with ERα and C/EBP factor expression vectors showed that ERα suppressed C/EBP-induced luciferase activity (Fig. 3I). Chromatin immunoprecipitation (ChIP) studies conducted in 3T3-L1 adipocytes confirmed ERα binding to the Lcn2 proximal promoter construct at two sites (Fig. 3J). To confirm the requirement of DNA binding for the repression of Lcn2 by ERα in vivo, we assessed Lcn2 expression in gonadal WAT from the ER α DNA binding incompetent mouse in which ERα protein tethering activity is maintained (21). In gonadal adipose tissue from these DNA binding domain mutant mice (ERα-DBDΔ) we observed a marked increase in C/EBPβ and Lcn2 expression levels over WT control (Fig. 3K). These data confirm the insufficiency of ERα protein tethering, but confirm the requirement of ERα DNA binding in the repression of Lcn2.
Lcn2 promotes proliferation and migration of BrCA cells. Considering that the phenotype of malignant cells can be influenced by surrounding
stromal micro-environment, and that adipocytes constitute the largest cellular compartment of breast tissue (41), we tested whether Lcn2, an adipocyte-secreted factor, could influence the behavior of BrCA cell lines. We treated SUM159PT BrCA cells with conditioned media (CM) from adipocytes where Lcn2 was elevated in response to ERα knockdown, or CM from HEK293A cells transfected with an Lcn2 expression plasmid. Conditioned media from Esr1-KD adipocytes increased the proliferation of the breast carcinoma cell line SUM159PT compared to CM from Scr-Control adipocytes (Fig. 4A). Similarly, CM containing Lcn2 expressed from transfected HEK293A cells promoted increased SUM159PT cell proliferation compared with CM from cells transfected with a GFP expression plasmid (Fig. 4B), suggesting a direct effect of Lcn2 on the proliferation of SUM159PT BrCA cells. Additionally, both Lcn2-CM and Esr1-KD CM increased the migration of SUM159PT cells over scratched monolayers, but had no effect on immortalized, non-transformed breast epithelial, MCF10A cells (Fig. 4C).
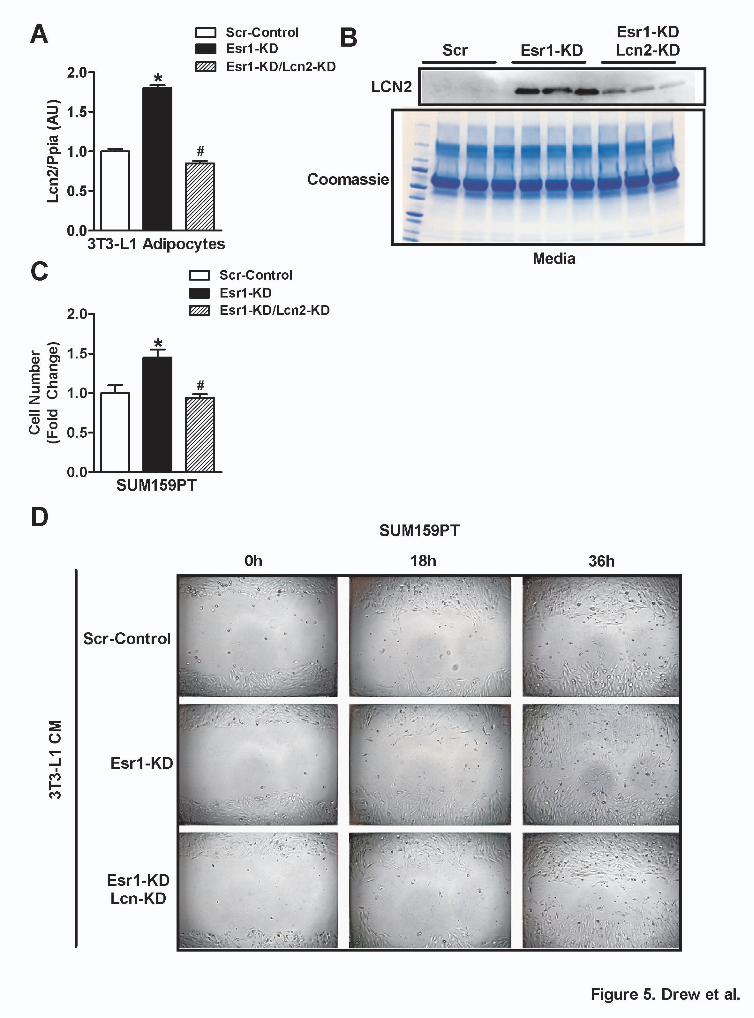
To test the role of Lcn2 in mediating the proliferative and pro-migratory effects of CM from ERα-deficient adipocytes on breast cancer cells, we deleted Lcn2 from ERα-deficient adipocytes (Fig. 5A-B). Findings for proliferation and migration of SUM159PT BrCA cells treated with CM from adipocytes with a dual KD of Esr1 and Lcn2 mirrored findings for cells treated with CM from Scr-Control ERα replete adipocytes (Fig. 5C-D). These data indicate that increased Lcn2 released from ERα -deficient adipocytes is a critical mediator of BrCA cell proliferation and migration.
Expression of Lcn2 signaling components in BrCA cells confer Lcn2 responsiveness. In an effort to more rigorously interrogate the effect of Lcn2 on BrCA cells in vitro, we studied the Lcn2 responsiveness of additional BrCA cell lines (Fig. 6). We observed a wide variability in the proliferation response to Lcn2 in the different BrCA cell lines (ZR75-1, MCF7, T47D and EFM19), as well as between lines arising from similar cellular origins. The advantage of studying these specific cell lines is that each is cultured using the same media and environment thus eliminating confounding factors arising from varying culture conditions (27). Lcn2-stimulated proliferation was highest in MCF7 and EFM19 and negligible in ZR75-1 cells (data not shown). Interestingly, cellular proliferation correlated well with the expression of BDH2, the intracellular rate limiting enzyme that catalyzes the production of the mammalian
at UC
LA
-Louise D
arling Biom
ed. Lib. on D
ecember 10, 2014
http://ww
w.jbc.org/
Dow
nloaded from

8
siderophore 2,5-DHBA necessary for iron homeostasis and overall Lcn2 responsiveness (42) (Fig. 6A).
In contrast to findings showing that Lcn2 was expressed in a number of human cancers and associated with ER/PR status (43), we screened 55 tumor samples as well as 53 cancer cell lines and found no correlation between ERα and Lcn2 expression or Lcn2 expression and tumor type (Supplemental Table 2; cell lines as reviewed in (27)). Lcn2 expression levels were ~100-fold higher in ZR75-1 cells than MCF7 cells, and ~1000-fold higher than EFM19 cells (Fig. 6B). These findings raise an important question for future study regarding the relative roles of intracellular versus extracellular Lcn2 in driving neoplastic development and metastatic potential.
Differences in components of the Lcn2 signaling pathway were also apparent between lines, with elevated expression of the Lcn2 receptor, Slc22a17 (variant 1), found in the most responsive cell types (MCF7 and EFM19) (Fig. 6C). Exogenous Lcn2 was found to only modulate its receptor expression in MCF7 cells while all other BrCA cell types were unresponsive (Fig. 6D). Expression levels of ferritin light-chain (FLT), BNIP3, SNAIL, SLUG, and Vimentin, markers of EMT and apoptosis susceptibility, were elevated in cell lines where ectopic Lcn2 promoted increased proliferation (Fig. 6E-I). Collectively, these data suggest that intrinsic differences in expression of components of the Lcn2 signaling pathway may underlie the differential responses of BrCA cells to the paracrine actions of Lcn2.
BDH2 expression in human BC tumors correlates with BMI and Lcn2, but not leptin or adiponectin. To investigate a potential role for components of the Lcn2 signaling pathway in the differential response of primary BrCA tumors to obesity, we analyzed data from microarray studies performed on biopsied tumor samples from women of varying BMI participating in the TORI B02 study (24). Plasma was collected at the time of diagnosis, prior to therapeutic intervention. As expected, plasma adipokines, leptin and adiponectin were significantly correlated with BMI (Supplemental Fig. S3A-B). Similar to published findings showing increased plasma Lcn2 levels in obese subjects (34,36-37), mean plasma Lcn2 concentration was elevated 23% in patients with a BMI >30 (Fig. 7). Additionally, we identified a significant positive association between tumor expression of BDH2 and BMI, as well as tumor BDH2 expression and plasma Lcn2 concentration (Fig. 7B-C). Unfortunately, probes for the Lcn2 receptor Slc22a17 were not present in the microarray platform so we were unable to assess the relationship between obesity and tumor Lcn2 receptor expression. In
contrast to our findings for Lcn2, we found no significant association between tumor BDH2 expression and circulating levels of leptin or adiponectin (Fig. 7D-E), indicating that tumor BDH2 expression is unlikely influenced by these circulating factors previously associated with BrCA progression (as reviewed in (44-46)). Moreover, no significant association between plasma levels of Lcn2 and adiponectin or leptin were detected (Supplemental Fig. S2C-D). Thus, when considered in aggregate, these data suggest that adipocyte expression of ERα, and not simply adiposity per se, may play a greater role in controlling Lcn2 production and breast cancer risk. DISCUSSION Obesity is an established risk factor for chronic diseases including atherosclerosis, type 2 diabetes, and cancers of the liver, colon and breast. Normally cycling females are partially protected against these diseases, but much of this protection is lost following menopause when increased adipose tissue weight gain, tissue inflammation, and metabolic dysfunction manifests (47). Unfortunately, the mechanistic underpinnings linking obesity and metabolic dysfunction to cancer pathobiology remain incompletely understood. Studies by Nilsson et al. implicated a relationship between reduced expression of ERα in adipose tissue and obesity in women (16). However, whether reduced adipose tissue ERα expression is causal for obesity and a disease-promoting secretory profile was unknown.
Herein, we reveal a mechanism whereby genetic ablation of ERα in adipose tissue of female mice promotes increased adiposity, tissue inflammation, and increased expression and secretion of the adipokine Lcn2. Considering that the phenotype of malignant cells can be influenced by surrounding stromal cells comprising the tumor micro-environment, and that adipocytes constitute the largest cellular compartment of breast tissue (41), we tested whether adipocyte-secreted factors could influence the behavior of BrCA cells. We showed that adipocytes lacking ERα secrete factors that exert marked effects on BrCA cell proliferation and migration. Since Lcn2 was highly expressed and secreted from ERα-deficient adipocytes, we next determined whether Lcn2 was a critical factor driving the proliferative and migratory response of BrCA cells. Consistent with our hypothesis, deletion of Lcn2 from ERα-deficient adipocytes reversed the proliferative and pro-migratory effects of CM on SUM159PT BrCA cells. These findings suggest that Lcn2 is an important potential mediator promoting tumorigenesis in the context of obesity. Extending this link clinically in BrCA patients, we found a significant
at UC
LA
-Louise D
arling Biom
ed. Lib. on D
ecember 10, 2014
http://ww
w.jbc.org/
Dow
nloaded from
9
correlation between obesity and tumor expression of BDH2, an enzyme critical for cellular responsiveness to Lcn2 (48). These studies describe a previously unrecognized mechanism that connects obesity and breast cancer through ERα regulation of Lcn2 in adipocytes.
Although prior studies have demonstrated a role for Lcn2 in the proliferation and migration of cancer cells in culture (35,49-50) and have shown that Lcn2 is strongly associated with breast cancer stage in microarray and expression profiling studies, the exact cellular source or sources of Lcn2 have not yet been determined (35,43,51). Additionally, although effects of Lcn2 on tumor burden in mouse models of breast cancer have been observed (52-54), these studies in murine models have failed to identify the mechanisms by which Lcn2 promotes tumorigenesis in vivo. Since Lcn2 is now considered a clinical predictor of disease prognosis in human primary breast cancer patients (43,55), resolution of the mechanisms regulating Lcn2 expression, the identification of the cell types involved in its paracrine and endocrine actions, as well as determination of the cell and tissue-specific effects of Lcn2 signal transduction, require greater attention. Our data strongly support a link between ERα-mediated regulation of Lcn2 in adipose tissue and breast cancer progression; however, our studies are limited to the direct impact of Lcn2 on breast cancer cell behavior and do not extend to the potential effects of Lcn2 on the tumor microenvironment which is likely of equal or greater importance for disease prognosis.
Previous work has shown that Lcn2 expression is upregulated in differentiating adipocytes in culture, and that circulating levels of Lcn2 are associated with obesity and metabolic dysfunction in wild type male mice (34). Our findings presented herein for female mice now reproduce those initial studies conducted in males. Additionally we have identified ERα as a critical transcriptional regulator of Lcn2 production and adiposity.
In line with the notion that obesity and alteration in adipocyte behavior underlie tumor progression, it is shown that mature breast adipocytes, but not pre-adipocytes, promote breast cancer cell motility (56). Thus it follows that the secretion of soluble factors from differentiated adipocytes may provide critical cellular crosstalk necessary for disease progression (9). Interestingly, cancer-associated adipocytes located at the tumor invasive front appear delipidated and resemble a de-differentiated phenotype compared with more distal adipocytes. These front-line adipocytes are characterized by a fibroblast-like morphology and downregulation of key adipogenic markers including
PPARγ, C/EBPα, and aP2 (9), a finding reproduced in ERα-deficient adipocytes. These observations suggest that cancer cells may engage in reciprocal talk altering adipocyte phenotype to promote mobilization of substrate, extracellular matrix remodelling, and angiogenesis (41). Scherer and colleagues previously showed that adipocyte-secreted factors have an unparalleled ability to promote increased cell motility, migration, and tumor angiogenesis compared to secreted factors of other stromal cell types (57). In aggregate, our studies suggest these cancer-promoting effects of adipocytes are accentuated by ERα deficiency.
Although the physiological role of Lcn2 has remained incompletely understood since its initial discovery, it has been primarily associated with iron metabolism and metalloproteinase (MMP9 specifically) activity (58). More recently, Green and colleagues have identified and characterized both the receptor for Lcn2 (slc22a17) and enzymes involved in intracellular signalling including BDH2 (28,48). We found that BDH2, an enzyme that catalyzes the formation of the siderophore that binds Lcn2 to control cellular iron metabolism (48), was highly correlated with BrCA cell proliferation. Considering that circulating concentrations of Lcn2 and breast tumor BDH2 expression levels were elevated in obese subjects and that RNAi-induced BDH2 deficiency promotes BrCA cell apoptosis susceptibility (48), suggests that targeting this pathway to restrain or reverse breast tumor development in the context of obesity may be of therapeutic benefit.
Additionally, given that adjuvant breast cancer therapies aimed at reducing estrogen production and antagonizing ERα action in mammary tumors also exert whole body effects, the long-term impact of these therapeutic strategies on metabolic function should be monitored, especially in women susceptible for obesity and type 2 diabetes. Moreover, since obesity and type 2 diabetes reduce overall breast cancer survival rates in part by diminishing effectiveness of conventional anti-tumor therapeutics (59-60), novel approaches to restrain breast cancer progression and reduce mortality in obese populations should be pursued.
In summary, the current investigation provides evidence that loss of ERα signalling in adipose tissue promotes obesity and induces the expression of Lcn2, a glycoprotein implicated in metabolic dysfunction and breast tumorigenesis and metastasis. Our findings suggest that reduced ERα action in adipose tissue, such as that associated with natural genetic variation, menopause, or obesity may be mechanistically linked to the increased prevalence of breast cancer observed
at UC
LA
-Louise D
arling Biom
ed. Lib. on D
ecember 10, 2014
http://ww
w.jbc.org/
Dow
nloaded from
10
under these conditions. Considering that obesity accounts for ~20% of all cancer deaths in women over age 50 (61), and based upon our findings that ERα
deletion in adipose is causal of obesity, strategies to maintain ERα action in metabolic tissues including adipose tissue may be of benefit for cancer prevention.
Acknowledgments
We are grateful for the continued support of our research from the UCLA Jonsson Comprehensive Cancer Center, the UCLA Iris Cantor Women’s Health Foundation, and the UCSD-UCLA Diabetes Research Center. Intellectual contributions by Richard Finn, Jerrold Olefsky, Ronald Evans, Hassy Cohen, and Chris Glass were also helpful in advancing this research. We are thankful for the technical support from Rima Boyadjian (UCLA Inflammation Core), the UCLA Tissue Procurement and Histology Core, and the UCSD Moores Cancer Center Histology and Immunohistochemistry Shared Resource directed by Nissi Varki. This work was supported in part by the UCLA Department of Medicine, The UCLA Iris Cantor Women’s Health Foundation and Executive Advisory Board, the UCLA Jonsson Cancer Center, and the National Institutes of Health (DK060484, DK073227, P30DK063491 to ALH; HL284481 and D094311 to AJL; HL123021 to BWP; NIEHS DIR support to KSK Z01ES70065). The TORI-B02 trial was funded in part by Genentech. VR was supported by the Spanish Ministry of Health and BGD is supported by the Australian NHMRC (526693) and the UCLA Jonsson Comprehensive Cancer Center.
REFERENCES
1. Wellen, K. E., and Hotamisligil, G. S. (2005) Inflammation, stress, and diabetes. J Clin Invest 115, 1111-1119
2. Romeo, G. R., Lee, J., and Shoelson, S. E. (2012) Metabolic syndrome, insulin resistance, and roles of inflammation--mechanisms and therapeutic targets. Arterioscler Thromb Vasc Biol 32, 1771-1776
3. Ouchi, N., Parker, J. L., Lugus, J. J., and Walsh, K. (2011) Adipokines in inflammation and metabolic disease. Nat Rev Immunol 11, 85-97
4. Calle, E. E., and Kaaks, R. (2004) Overweight, obesity and cancer: epidemiological evidence and proposed mechanisms. Nat Rev Cancer 4, 579-591
5. Renehan, A. G., Tyson, M., Egger, M., Heller, R. F., and Zwahlen, M. (2008) Body-mass index and incidence of cancer: a systematic review and meta-analysis of prospective observational studies. Lancet 371, 569-578
6. Turati, F., Talamini, R., Pelucchi, C., Polesel, J., Franceschi, S., Crispo, A., Izzo, F., La Vecchia, C., Boffetta, P., and Montella, M. (2012) Metabolic syndrome and hepatocellular carcinoma risk. Br J Cancer
7. Harima, S., Hashimoto, S., Shibata, H., Matsunaga, T., Tanabe, R., Terai, S., and Sakaida, I. (2012) Correlations between Obesity/Metabolic Syndrome-Related Factors and Risk of Developing Colorectal Tumors. Hepatogastroenterology 60
8. Wang, Y. Y., Lehuede, C., Laurent, V., Dirat, B., Dauvillier, S., Bochet, L., Le Gonidec, S., Escourrou, G., Valet, P., and Muller, C. (2012) Adipose tissue and breast epithelial cells: a dangerous dynamic duo in breast cancer. Cancer Lett 324, 142-151
9. Dirat, B., Bochet, L., Dabek, M., Daviaud, D., Dauvillier, S., Majed, B., Wang, Y. Y., Meulle, A., Salles, B., Le Gonidec, S., Garrido, I., Escourrou, G., Valet, P., and Muller, C. (2011) Cancer-associated adipocytes exhibit an activated phenotype and contribute to breast cancer invasion. Cancer Res 71, 2455-2465
10. Vona-Davis, L., and Rose, D. P. (2007) Adipokines as endocrine, paracrine, and autocrine factors in breast cancer risk and progression. Endocr Relat Cancer 14, 189-206
11. Park, J., and Scherer, P. E. (2012) Adipocyte-derived endotrophin promotes malignant tumor progression. J Clin Invest 122, 4243-4256
12. Reimann, M., Vafeiadou, K., Hall, W. L., Dierkes, J., Nilsson, M., Dahlman-Wright, K., Ferrari, M., Huebner, U., Hallund, J., Bugel, S., Branca, F., Williams, C. M., and Koebnick, C. (2006) Evidence for associations between common polymorphisms of estrogen receptor beta gene with homocysteine and nitric oxide. Climacteric 9, 215-223
at UC
LA
-Louise D
arling Biom
ed. Lib. on D
ecember 10, 2014
http://ww
w.jbc.org/
Dow
nloaded from

11
13. Smith, E. P., Boyd, J., Frank, G. R., Takahashi, H., Cohen, R. M., Specker, B., Williams, T. C., Lubahn, D. B., and Korach, K. S. (1994) Estrogen resistance caused by a mutation in the estrogen-receptor gene in a man. N Engl J Med 331, 1056-1061
14. Okura, T., Koda, M., Ando, F., Niino, N., Ohta, S., and Shimokata, H. (2003) Association of polymorphisms in the estrogen receptor alpha gene with body fat distribution. Int J Obes Relat Metab Disord 27, 1020-1027
15. Dahlman, I., Vaxillaire, M., Nilsson, M., Lecoeur, C., Gu, H. F., Cavalcanti-Proenca, C., Efendic, S., Ostenson, C. G., Brismar, K., Charpentier, G., Gustafsson, J. A., Froguel, P., Dahlman-Wright, K., and Steffensen, K. R. (2008) Estrogen receptor alpha gene variants associate with type 2 diabetes and fasting plasma glucose. Pharmacogenet Genomics 18, 967-975
16. Nilsson, M., Dahlman, I., Ryden, M., Nordstrom, E. A., Gustafsson, J. A., Arner, P., and Dahlman-Wright, K. (2007) Oestrogen receptor alpha gene expression levels are reduced in obese compared to normal weight females. Int J Obes (Lond) 31, 900-907
17. Bryzgalova, G., Gao, H., Ahren, B., Zierath, J. R., Galuska, D., Steiler, T. L., Dahlman-Wright, K., Nilsson, S., Gustafsson, J. A., Efendic, S., and Khan, A. (2006) Evidence that oestrogen receptor-alpha plays an important role in the regulation of glucose homeostasis in mice: insulin sensitivity in the liver. Diabetologia 49, 588-597
18. Ribas, V., Nguyen, M. T., Henstridge, D. C., Nguyen, A. K., Beaven, S. W., Watt, M. J., and Hevener, A. L. (2010) Impaired oxidative metabolism and inflammation are associated with insulin resistance in ERalpha-deficient mice. Am J Physiol Endocrinol Metab 298, E304-319
19. Hewitt, S. C., Kissling, G. E., Fieselman, K. E., Jayes, F. L., Gerrish, K. E., and Korach, K. S. (2010) Biological and biochemical consequences of global deletion of exon 3 from the ER{alpha} gene. FASEB J., fj.10-163428
20. He, W., Barak, Y., Hevener, A., Olson, P., Liao, D., Le, J., Nelson, M., Ong, E., Olefsky, J. M., and Evans, R. M. (2003) Adipose-specific peroxisome proliferator-activated receptor γ knockout causes insulin resistance in fat and liver but not in muscle. Proceedings of the National Academy of Sciences of the United States of America 100, 15712-15717
21. Hewitt, S. C., Li, L., Grimm, S. A., Winuthayanon, W., Hamilton, K. J., Pockette, B., Rubel, C. A., Pedersen, L. C., Fargo, D., Lanz, R. B., DeMayo, F. J., Schutz, G., and Korach, K. S. (2014) Novel DNA motif binding activity observed in vivo with an estrogen receptor alpha mutant mouse. Molecular endocrinology (Baltimore, Md 28, 899-911
22. Ahlbory-Dieker, D. L., Stride, B. D., Leder, G., Schkoldow, J., Trolenberg, S., Seidel, H., Otto, C., Sommer, A., Parker, M. G., Schutz, G., and Wintermantel, T. M. (2009) DNA binding by estrogen receptor-alpha is essential for the transcriptional response to estrogen in the liver and the uterus. Molecular endocrinology (Baltimore, Md 23, 1544-1555
23. Parks, B. W., Nam, E., Org, E., Kostem, E., Norheim, F., Hui, S. T., Pan, C., Civelek, M., Rau, C. D., Bennett, B. J., Mehrabian, M., Ursell, L. K., He, A., Castellani, L. W., Zinker, B., Kirby, M., Drake, T. A., Drevon, C. A., Knight, R., Gargalovic, P., Kirchgessner, T., Eskin, E., and Lusis, A. J. (2013) Genetic control of obesity and gut microbiota composition in response to high-fat, high-sucrose diet in mice. Cell Metab 17, 141-152
24. Hurvitz, S. A., Allen, H. J., Moroose, R. L., Chan, D., Hagenstad, C., Applebaum, S. H., Patel, G., Hu, E. H., Ryba, N., Lin, L. S., Wang, H., Glaspy, J., Slamon, D. J., and Kabbinavar, F. (2010) A phase II trial of docetaxel with bevacizumab as first-line therapy for HER2-negative metastatic breast cancer (TORI B01). Clin Breast Cancer 10, 307-312
25. Nechad, M. (1983) Development of brown fat cells in monolayer culture. II. Ultrastructural characterization of precursors, differentiating adipocytes and their mitochondria. Exp Cell Res 149, 119-127
26. Rodriguez-Cuenca, S., Monjo, M., Frontera, M., Gianotti, M., Proenza, A. M., and Roca, P. (2007) Sex steroid receptor expression profile in brown adipose tissue. Effects of hormonal status. Cell Physiol Biochem 20, 877-886
27. Neve, R. M., Chin, K., Fridlyand, J., Yeh, J., Baehner, F. L., Fevr, T., Clark, L., Bayani, N., Coppe, J. P., Tong, F., Speed, T., Spellman, P. T., DeVries, S., Lapuk, A., Wang, N. J., Kuo, W. L., Stilwell, J. L., Pinkel, D., Albertson, D. G., Waldman, F. M., McCormick, F., Dickson, R. B., Johnson, M. D., Lippman, M., Ethier, S., Gazdar, A., and Gray, J. W. (2006) A collection of breast cancer cell lines for the study of functionally distinct cancer subtypes. Cancer Cell 10, 515-527
at UC
LA
-Louise D
arling Biom
ed. Lib. on D
ecember 10, 2014
http://ww
w.jbc.org/
Dow
nloaded from

12
28. Devireddy, L. R., Gazin, C., Zhu, X., and Green, M. R. (2005) A cell-surface receptor for lipocalin 24p3 selectively mediates apoptosis and iron uptake. Cell 123, 1293-1305
29. Zhang, S., Ma, Y., Jiang, J., Dai, Z., Gao, X., Yin, X., Xi, W., and Min, W. (2014) Inhibition of urokinase-type plasminogen activator expression by dihydroartemisinin in breast cancer cells. Oncol Lett 7, 1375-1380
30. Murray, D., Horgan, G., Macmathuna, P., and Doran, P. (2008) NET1-mediated RhoA activation facilitates lysophosphatidic acid-induced cell migration and invasion in gastric cancer. Br J Cancer 99, 1322-1329
31. Villanueva, C. J., Waki, H., Godio, C., Nielsen, R., Chou, W. L., Vargas, L., Wroblewski, K., Schmedt, C., Chao, L. C., Boyadjian, R., Mandrup, S., Hevener, A., Saez, E., and Tontonoz, P. (2011) TLE3 is a dual-function transcriptional coregulator of adipogenesis. Cell Metab 13, 413-427
32. Ribas, V., Drew, B. G., Le, J. A., Soleymani, T., Daraei, P., Sitz, D., Mohammad, L., Henstridge, D. C., Febbraio, M. A., Hewitt, S. C., Korach, K. S., Bensinger, S. J., and Hevener, A. L. (2011) Myeloid-specific estrogen receptor alpha deficiency impairs metabolic homeostasis and accelerates atherosclerotic lesion development. Proc Natl Acad Sci U S A 108, 16457-16462
33. Hewitt, S. C., Li, Y., Li, L., and Korach, K. S. (2010) Estrogen-mediated regulation of Igf1 transcription and uterine growth involves direct binding of estrogen receptor alpha to estrogen-responsive elements. J Biol Chem 285, 2676-2685
34. Yan, Q. W., Yang, Q., Mody, N., Graham, T. E., Hsu, C. H., Xu, Z., Houstis, N. E., Kahn, B. B., and Rosen, E. D. (2007) The adipokine lipocalin 2 is regulated by obesity and promotes insulin resistance. Diabetes 56, 2533-2540
35. Yang, J., Bielenberg, D. R., Rodig, S. J., Doiron, R., Clifton, M. C., Kung, A. L., Strong, R. K., Zurakowski, D., and Moses, M. A. (2009) Lipocalin 2 promotes breast cancer progression. Proc Natl Acad Sci U S A 106, 3913-3918
36. Panidis, D., Tziomalos, K., Koiou, E., Kandaraki, E. A., Tsourdi, E., Delkos, D., Kalaitzakis, E., and Katsikis, I. (2010) The effects of obesity and polycystic ovary syndrome on serum lipocalin-2 levels: a cross-sectional study. Reprod Biol Endocrinol 8, 151
37. Lee, Y. H., Lee, S. H., Jung, E. S., Kim, J. S., Shim, C. Y., Ko, Y. G., Choi, D., Jang, Y., Chung, N., and Ha, J. W. (2010) Visceral adiposity and the severity of coronary artery disease in middle-aged subjects with normal waist circumference and its relation with lipocalin-2 and MCP-1. Atherosclerosis 213, 592-597
38. Seth, P., Porter, D., Lahti-Domenici, J., Geng, Y., Richardson, A., and Polyak, K. (2002) Cellular and molecular targets of estrogen in normal human breast tissue. Cancer Res 62, 4540-4544
39. Boruk, M., Savory, J. G., and Hache, R. J. (1998) AF-2-dependent potentiation of CCAAT enhancer binding protein beta-mediated transcriptional activation by glucocorticoid receptor. Molecular endocrinology (Baltimore, Md 12, 1749-1763
40. Stein, B., and Yang, M. X. (1995) Repression of the interleukin-6 promoter by estrogen receptor is mediated by NF-kappa B and C/EBP beta. Molecular and cellular biology 15, 4971-4979
41. Tan, J., Buache, E., Chenard, M. P., Dali-Youcef, N., and Rio, M. C. (2011) Adipocyte is a non-trivial, dynamic partner of breast cancer cells. Int J Dev Biol 55, 851-859
42. Chakraborty, S., Kaur, S., Guha, S., and Batra, S. K. (2012) The multifaceted roles of neutrophil gelatinase associated lipocalin (NGAL) in inflammation and cancer. Biochim Biophys Acta 1826, 129-169
43. Bauer, M., Eickhoff, J. C., Gould, M. N., Mundhenke, C., Maass, N., and Friedl, A. (2008) Neutrophil gelatinase-associated lipocalin (NGAL) is a predictor of poor prognosis in human primary breast cancer. Breast Cancer Res Treat 108, 389-397
44. Maccio, A., Madeddu, C., and Mantovani, G. (2009) Adipose tissue as target organ in the treatment of hormone-dependent breast cancer: new therapeutic perspectives. Obes Rev 10, 660-670
45. Park, J., Euhus, D. M., and Scherer, P. E. (2011) Paracrine and endocrine effects of adipose tissue on cancer development and progression. Endocr Rev 32, 550-570
46. Park, J., and Scherer, P. E. (2011) Leptin and cancer: from cancer stem cells to metastasis. Endocr Relat Cancer 18, C25-29
47. Carr, M. C. (2003) The emergence of the metabolic syndrome with menopause. J Clin Endocrinol Metab 88, 2404-2411
48. Devireddy, L. R., Hart, D. O., Goetz, D. H., and Green, M. R. (2010) A mammalian siderophore synthesized by an enzyme with a bacterial homolog involved in enterobactin production. Cell 141, 1006-1017
at UC
LA
-Louise D
arling Biom
ed. Lib. on D
ecember 10, 2014
http://ww
w.jbc.org/
Dow
nloaded from
13
49. Yang, J., and Moses, M. A. (2009) Lipocalin 2: a multifaceted modulator of human cancer. Cell Cycle 8, 2347-2352
50. Shi, H., Gu, Y., Yang, J., Xu, L., Mi, W., and Yu, W. (2008) Lipocalin 2 promotes lung metastasis of murine breast cancer cells. J Exp Clin Cancer Res 27, 83
51. Stoesz, S. P., and Gould, M. N. (1995) Overexpression of neu-related lipocalin (NRL) in neu-initiated but not ras or chemically initiated rat mammary carcinomas. Oncogene 11, 2233-2241
52. Leng, X., Wu, Y., and Arlinghaus, R. B. (2011) Relationships of lipocalin 2 with breast tumorigenesis and metastasis. J Cell Physiol 226, 309-314
53. Berger, T., Cheung, C. C., Elia, A. J., and Mak, T. W. (2010) Disruption of the Lcn2 gene in mice suppresses primary mammary tumor formation but does not decrease lung metastasis. Proc Natl Acad Sci U S A 107, 2995-3000
54. Leng, X., Ding, T., Lin, H., Wang, Y., Hu, L., Hu, J., Feig, B., Zhang, W., Pusztai, L., Symmans, W. F., Wu, Y., and Arlinghaus, R. B. (2009) Inhibition of lipocalin 2 impairs breast tumorigenesis and metastasis. Cancer Res 69, 8579-8584
55. Fernandez, C. A., Yan, L., Louis, G., Yang, J., Kutok, J. L., and Moses, M. A. (2005) The matrix metalloproteinase-9/neutrophil gelatinase-associated lipocalin complex plays a role in breast tumor growth and is present in the urine of breast cancer patients. Clin Cancer Res 11, 5390-5395
56. Carter, J. C., and Church, F. C. (2012) Mature breast adipocytes promote breast cancer cell motility. Exp Mol Pathol 92, 312-317
57. Iyengar, P., Combs, T. P., Shah, S. J., Gouon-Evans, V., Pollard, J. W., Albanese, C., Flanagan, L., Tenniswood, M. P., Guha, C., Lisanti, M. P., Pestell, R. G., and Scherer, P. E. (2003) Adipocyte-secreted factors synergistically promote mammary tumorigenesis through induction of anti-apoptotic transcriptional programs and proto-oncogene stabilization. Oncogene 22, 6408-6423
58. Yan, L., Borregaard, N., Kjeldsen, L., and Moses, M. A. (2001) The high molecular weight urinary matrix metalloproteinase (MMP) activity is a complex of gelatinase B/MMP-9 and neutrophil gelatinase-associated lipocalin (NGAL). Modulation of MMP-9 activity by NGAL. J Biol Chem 276, 37258-37265
59. Jiralerspong, S., Kim, E. S., Dong, W., Feng, L., Hortobagyi, G. N., and Giordano, S. H. (2013) Obesity, diabetes, and survival outcomes in a large cohort of early-stage breast cancer patients. Ann Oncol 24, 2506-2514
60. Sparano, J. A., Wang, M., Zhao, F., Stearns, V., Martino, S., Ligibel, J. A., Perez, E. A., Saphner, T., Wolff, A. C., Sledge, G. W., Jr., Wood, W. C., Fetting, J., and Davidson, N. E. (2012) Obesity at diagnosis is associated with inferior outcomes in hormone receptor-positive operable breast cancer. Cancer 118, 5937-5946
61. Calle, E. E., Rodriguez, C., Walker-Thurmond, K., and Thun, M. J. (2003) Overweight, obesity, and mortality from cancer in a prospectively studied cohort of U.S. adults. N Engl J Med 348, 1625-1638
Figure and Table Legends. Table 1. Circulating factors for male and female mice. Blood glucose and plasma insulin, adiponectin, leptin, PAI-1 and estradiol concentrations were detected at basal following a 6h fast. Values are expressed as means ± SEM and p values are indicated. NA, not analyzed. Figure 1. Inverse relationship between adipose tissue ERα expression and adiposity. (A) Esr1 expression is reduced in adipose tissue from obese LepOb male and female mice compared with lean animals (2.5 months, n=6/group). (B) Inverse relationship between gonadal adipose Esr1 expression and % body fat of HF/HS-fed female mice from the UCLA HMDP (n=102 strains, 3-6 mice per strain). (C) Esr1 expression in gonadal adipose tissue from female and male f/f Control and FERKO mice (n=6-8/group). (D-E) H&E sections and quantification of adipocyte size (μm) of gonadal WAT from female f/f Control and FERKO mice (n=4 mice/genotype). Values are expressed as means ± SEM and differences were detected by Student’s t-test and ANOVA where appropriate. * p < 0.05 between genotypes, 1 p < 0.05 between genders. Correlations were determined by Pearson's correlation analysis and p values are provided.
at UC
LA
-Louise D
arling Biom
ed. Lib. on D
ecember 10, 2014
http://ww
w.jbc.org/
Dow
nloaded from

14
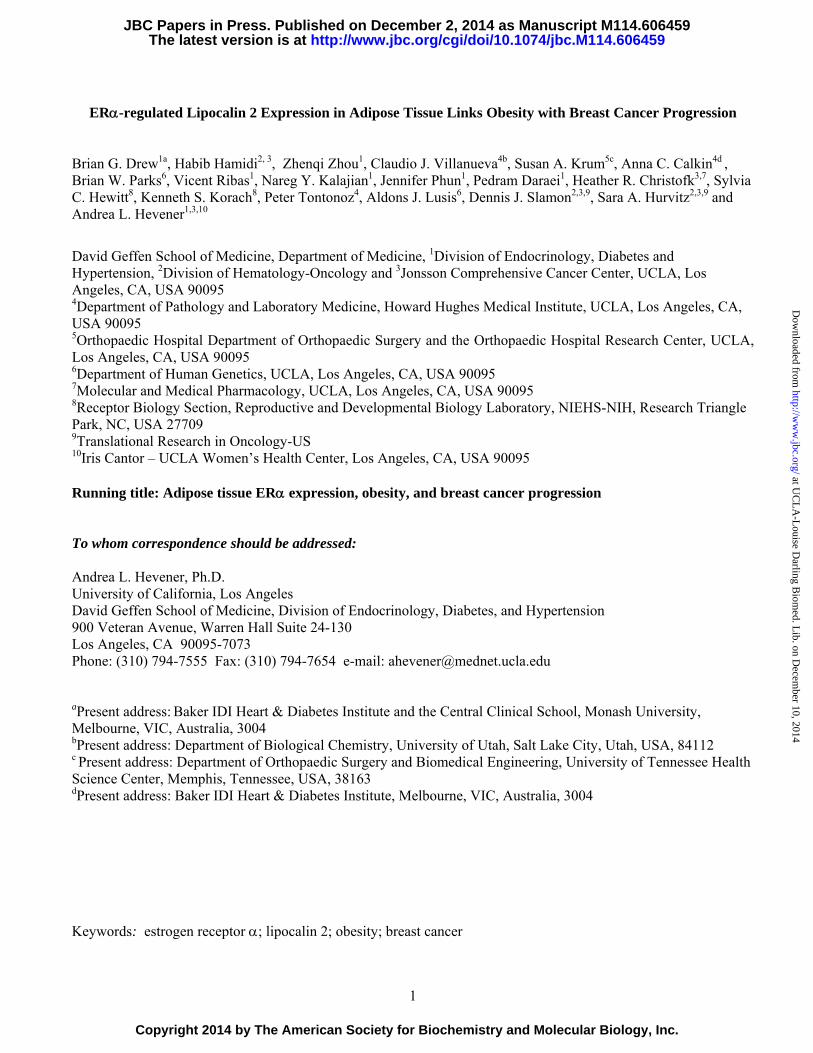
Figure 2. Lcn2 is upregulated in ERα deficient adipose tissue. Quantitative PCR analyses performed on gonadal adipose tissue from 6 month old female mice fed a normal chow diet show significant alteration in expression of (A) transcription factors, (B) cytokines/chemokines (C) and the adipokine Lcn2 (n=8/genotype). (D) Lcn2 expression was also elevated in adipose tissue from obese LepOb male and female mice compared with lean and estradiol (E2)-treated male animals (n=6/group). Lcn2 expression in (E) gonadal WAT and (F) extrascapular BAT from female and male f/f Control (open bars) vs. FERKO (closed bars) (n=6-8/group). (G-H) Similar to gonadal adipose, Esr1 expression is reduced and Lcn2 expression is elevated in subcutaneous (SC) adipose depots from FERKO vs. f/f Controls. (I) Immunoblotting and densitometric analyses on gonadal WAT show increased Lcn2 protein levels in female FERKO mice vs. f/f Control, but no change in Lcn2 protein between genotypes of male mice (n=6/group). (J) Plasma Lcn2 levels in FERKO vs. f/f Control animals (n=6/genotype). (K-L) Adipose tissue Esr1 expression is inversely correlated with Lcn2 expression, and Lcn2 is positively correlated with % body fat in 102 strains of female HMDP animals (n=3-6/strain). Values are expressed as means ± SEM and differences were detected by Student’s t-test and ANOVA where appropriate. * p < 0.05 between genotypes, 1 p < 0.05 between genders, # p < 0.05 E2-treated vs. untreated. Correlations were determined by Pearson's correlation analysis. Figure 3. Adipocyte Lcn2 expression is repressed by ERα DNA binding. Primary adipocytes isolated from periovarian WAT of female FERKO mice show (A) reduced Esr1 and increased Lcn2 expression as measured by qPCR, and (B) release increased amounts of Lcn2 protein into culture medium compared to adipocytes from f/f Control. (C) Lcn2 expression is reduced in 3T3-L1 adipocytes treated with estradiol (E2 - 1 and 10 nM) for 1h. 3T3-L1 adipocytes treated with retrovirus expressing ERα (pB-ER) show (D) elevated Esr1 expression levels and a compensatory reduction in Lcn2 expression compared with control adipocytes expressing empty virus (pB). (E) Short hairpin-induced knockdown of ERα (observed in three of four stable 3T3-L1 Esr1-KD cell lines; open bars for clones C, D, E), increased Lcn2 expression (closed bars)(n=3 observations/clone). (F) Immunoblotting for ERα in lysates from Esr1-KD(D) vs. Scr-Control 3T3-L1 adipocytes and for (G) Lcn2 in adipocyte culture medium. (H) Diagram of 2.7kb 5’ proximal promoter of Lcn2 cloned into pGL4-luciferase (ERE = estrogen response element) and (I) activation of the promoter indicated by luciferase activity assessment in 3T3-L1 adipocytes transfected with ERα and or C/EBP and treated with the ERα-specific agonist PPT. (J) ChIP analyses show direct binding of ERα to the consensus ERE in the Lcn2 promoter (a, b, c indicate response elements shown above in H). (K) White adipose tissue expression levels of Esr1 (Exon 3 and 6-7), C/EBPβ, and Lcn2 assessed by qPCR in WT (open bars) versus ERα DNA binding domain mutant (ERα DBDΔ) mice (n=6/genotype). Values are expressed as means ± SEM and mean differences were detected by Student’s t-test and ANOVA where appropriate. * p < 0.05 between genotypes or from GFP expressing 3T3-L1 adipocytes in panel I, # p < 0.05 E2 dose response, 1 p < 0.05 C/EBP vs. C/EBP + ERα ± PPT for panel I. Figure 4. Lcn2 and conditioned media from ERα-KD 3T3-L1 adipocytes stimulate breast cancer cell proliferation and migration. (A) Cellular proliferation in SUM159PT and MCF10A after exposure to conditioned media (CM) from Control Scr and Esr1-KD 3T3L1 adipocytes and (B) CM from HEK-293A cells expressing Lcn2. (C) Migration of SUM159PT and MCF10A cell lines in culture over a standardized scratch site after 18 h of exposure to Lcn2- or GFP-CM (upper half of panel) and CM from 3T3-L1 adipocytes, Scr-Control vs. Esr1-KD (lower half of panel). Values are expressed as means ± SEM, and mean differences were detected by Student’s t-test and ANOVA where appropriate. For each analysis, three independent studies were performed in triplicate. * p < 0.05 between cell type difference for a given treatment, # < 0.05 between treatment difference for a given cell type. Figure 5. Lcn2 deletion reverses the proliferative and pro-migratory effects of conditioned media from ERα-KD 3T3-L1 adipocytes on SUM159PT breast cancer cells. (A) Lcn2 expression levels in Scr-Control (open bars), Esr1-KD (closed bars), and Esr1-KD/Lcn2-KD (hatched bars) 3T3L1 adipocytes assessed by qPCR. (B) Lcn2 protein levels in conditioned media from Scr-Control, Esr1-KD, and Esr1-KD/Lcn2-KD 3T3L1 adipocytes detected by immunoblotting. (C) Cellular proliferation in SUM159PT cells after 4d exposure to CM from Scr-Control, Esr1-KD, and Esr1-KD/Lcn2-KD 3T3L1 adipocytes. (D) Migration of SUM159PT cells in culture over a standardized scratch site after 18 and 36 h of exposure to CM from Scr-Control, Esr1-KD, and Esr1-KD/Lcn2-KD 3T3L1 adipocytes. Values are expressed as means ± SEM in arbitrary units (AU), and mean differences were detected by Student’s t-test and ANOVA where appropriate. For each analysis, three independent experiments were performed
at UC
LA
-Louise D
arling Biom
ed. Lib. on D
ecember 10, 2014
http://ww
w.jbc.org/
Dow
nloaded from

15
in triplicate. * p < 0.05 between Scr-Control and Esr1-KD CM, # < 0.05 between Esr1-KD and Esr1-KD/Lcn2-KD CM. Figure 6. BrCA cell proliferation is associated with BDH2 expression and Lcn2 responsiveness. (A) Cellular proliferation of breast cancer cell lines (ZR75-1, T47D, MCF7, and EFM19) was significantly correlated with cellular BDH2 expression. Three experiments were performed in triplicate, • = average of each experiment for four respective cell lines. (B) Lcn2 expression, assessed by qPCR, is variable in the four ER+ breast cancer cell lines analyzed (MCF10A provided as a comparison). (C) The Lcn2 receptor (Slc22a17, variant 1) is highly expressed in the four representative breast cancer cell lines but minimally expressed in non-transformed breast epithelial MCF10A cells. The impact of Lcn2 on expression of genes associated with cancer progression and metastasis was determined by qPCR analysis. (D) slc22a17 (V1), (E) Ferritin-L, (F) BNIP3, (G) SNAIL, (H) SLUG, (I) Vimentin. Values are expressed as means ± SEM in arbitrary units (AU), and mean differences were detected by ANOVA.* p < 0.05 vs. MCF10A, 1 p < 0.05 vehicle vs. Lcn2-treated. Significant correlation was detected by Peason's r and the p value for the relationship is provided. Figure 7. Obesity is associated with increased BDH2 expression in primary tumors from breast cancer patients. (A) Plasma Lcn2 is elevated in obese (BMI > 30; n=26) compared with lean (BMI < 25; n=31) women diagnosed with BrCA. BDH2 expression is significantly associated with (B) BMI and (C) plasma Lcn2 concentration in female breast cancer patients from the TORI trial. No significant relationships between BDH2 expression and circulating levels of (D) leptin or (E) the anti-inflammatory adipokine adiponectin were detected. Values are expressed as means ± SEM, and mean differences were detected by Student's t-test. * p < 0.05 between groups. Correlation coefficients were determined by Pearson’s r, and p values are provided for each correlation. Table 1.
Circulating Factor Female Male
f/f Control FERKO p-value f/f Control FERKO p-value
Glucose (mg/dl) 117 ± 2.6 138 ± 3.5 0.07 163±3.7 167±5.7 0.80
Insulin (ng/ml) 0.28 ± 0.01 0.23 ± 0.01 0.27 0.78±0.02 1.1±0.8 0.07
Adiponectin (μg/ml) 15.3 ± 0.4 13 ± 0.3 0.15 8.7±0.3 8.7±0.2 0.95
Leptin (ng/ml) 1.2 ± 0.1 2.4 ± 0.1 0.04 2.2±0.2 2.8±0.1 0.45
PAI-1 (ng/ml) 0.50 ± 0.04 1.0 ± 0.01 0.05 0.50±0.05 0.53±0.01 0.86
Estradiol (pg/ml) 71 ± 12 94 ± 15 0.27 NA NA
at UC
LA
-Louise D
arling Biom
ed. Lib. on D
ecember 10, 2014
http://ww
w.jbc.org/
Dow
nloaded from
at UC
LA
-Louise D
arling Biom
ed. Lib. on D
ecember 10, 2014
http://ww
w.jbc.org/
Dow
nloaded from
at UC
LA
-Louise D
arling Biom
ed. Lib. on D
ecember 10, 2014
http://ww
w.jbc.org/
Dow
nloaded from
at UC
LA
-Louise D
arling Biom
ed. Lib. on D
ecember 10, 2014
http://ww
w.jbc.org/
Dow
nloaded from

at UC
LA
-Louise D
arling Biom
ed. Lib. on D
ecember 10, 2014
http://ww
w.jbc.org/
Dow
nloaded from
at UC
LA
-Louise D
arling Biom
ed. Lib. on D
ecember 10, 2014
http://ww
w.jbc.org/
Dow
nloaded from

at UC
LA
-Louise D
arling Biom
ed. Lib. on D
ecember 10, 2014
http://ww
w.jbc.org/
Dow
nloaded from

at UC
LA
-Louise D
arling Biom
ed. Lib. on D
ecember 10, 2014
http://ww
w.jbc.org/
Dow
nloaded from
Related Documents