Singapore Exchange Research and Products Team Information Technology January 2018

Welcome message from author
This document is posted to help you gain knowledge. Please leave a comment to let me know what you think about it! Share it to your friends and learn new things together.
Transcript
Singapore Exchange
Research and Products Team
Information Technology
January 2018

Key points and highlight of Singapore’s IT sector
Strong comparative returns versus FTSE STI• SGX’s IT Sector was the best-performing in 2017, with
overall sector market capitalisation growing by 60% YoY
Technology hardware cash cows• Traditional technology hardware manufacturing companies
are cash cows (generating strong cashflow)• These companies pay out consistent dividends
IT sector is evolving• Disruptive technologies blurring the lines between sectors• Companies at risk forced to adapt and innovate• Singapore Technology Hardware companies forms a firm
foundation for disruptive technologies
Singapore well-positioned shift to digital• Singapore has a supportive eco-system to support
upcoming key growth areas for the IT sector domestically as the secular shift to digital continues
2

6%
94%
FTSE ST Catalist IndexIT Sector Others
Information Technology (IT) Sector The Information Technology sector is very broad and generally referred to as
the category of stocks relating to R&D and/or distribution of technologically-based goods and services.
Companies in this sector are mainly engaged in the manufacturing of electronics, software creation, PCs, smartphones, tablets and/or other products and services relating to IT.
Hardware and IT services are mature sub-segments while higher growth is seen in internet software and services.
Traditional Technology powerhouses are mostly listed in U.S. and Japan but increasing trend of new listings in other parts of Asia.
Source: Bloomberg. As of 29 December 2018 Source: MSCI
3
100
150
200
250
300
350
Dec-12 Dec-13 Dec-14 Dec-15 Dec-16 Dec-17
MSCI AC Asia IT Index vs. MSCI AC APAC Index
MSCI AC Asia IT Index MSCI AC APAC Index
21%
Others
79%
MSCI AC APAC IndexIT Others
32%
68%
MSCI AC Asia x Japan IndexIT Sector Others
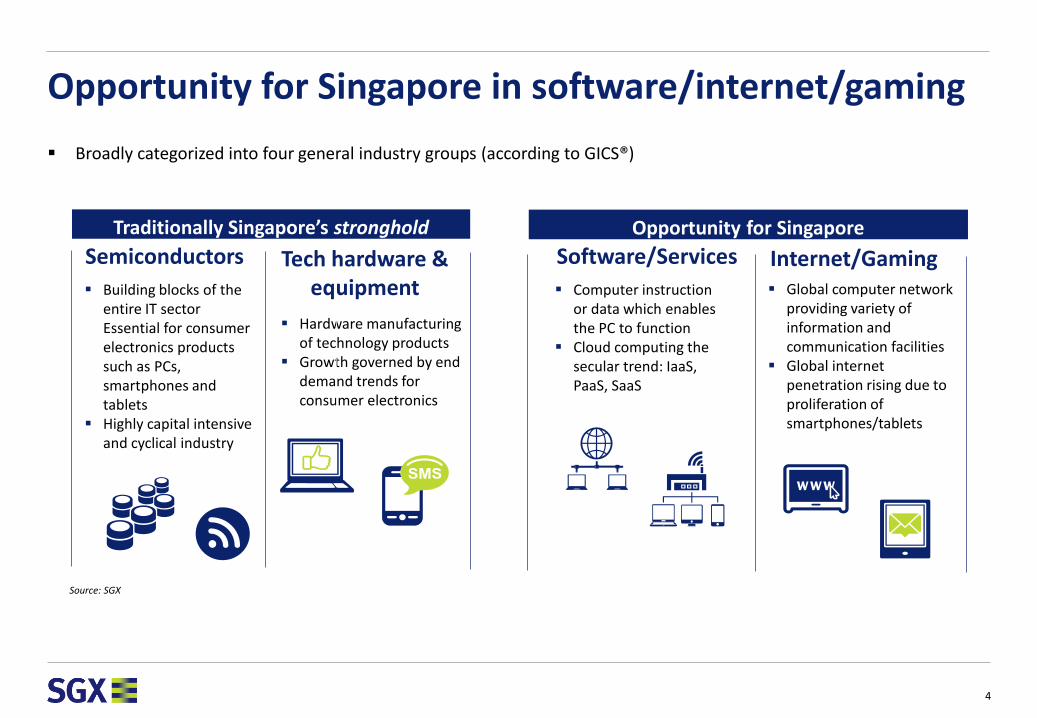
Broadly categorized into four general industry groups (according to GICS®)
Opportunity for Singapore in software/internet/gaming
Tech hardware & equipment
Software/ServicesSemiconductors
Hardware manufacturing of technology products
Growth governed by end demand trends for consumer electronics
Building blocks of the entire IT sector Essential for consumer electronics products such as PCs, smartphones and tablets
Highly capital intensive and cyclical industry
Computer instruction or data which enables the PC to function
Cloud computing the secular trend: IaaS, PaaS, SaaS
Internet/Gaming Global computer network
providing variety of information and communication facilities
Global internet penetration rising due to proliferation of smartphones/tablets
Source: SGX
Traditionally Singapore’s stronghold Opportunity for Singapore
4

Over six billion units of technology products sold annually across the globe Smartphones, PCs , LCD TVs and tablets dominate Technology end device spending 3.58bn Internet users globally
Global technology hardware industry slowing
Source: GfK/CTA Digital World Source: GfK/CTA Digital World
Segment 2017 Market Size (US$bn)
Semiconductors 409
Software & IT Services 1,285
Technology hardware 1,000
Gaming 109
Source: Gartner, newzoo, SIA
Major Tech products 2016e unit shipment (m)
Smartphones 1,882
Notebook PCs 263
Tablets 170
LCD TVs 214
Source: Gartner, IDC newzoo, SIA
5
-6%
-5%
-4%
-3%
-2%
-1%
0%
1%
1.0
2.0
3.0
4.0
5.0
6.0
7.0
8.0
2012 2013 2014 2015 2016F 2017F
Global Tech unit sales (bn units)
Global Technology unit sales y-o-y (RHS)
-9%
-7%
-5%
-3%
-1%
1%
3%
5%
0
200
400
600
800
1,000
1,200
2012 2013 2014 2015 2016F 2017F
Global Tech devices spending (US$bn)
Global Technology devices spending y-o-y (RHS)

Key macro-economic drivers to monitor the IT sector
Global semiconductor sales numbers and book-to-bill ratio for semiconductor equipment suppliers Global smartphones, PCs and tablet unit shipment numbers Consumer/corporate spending on electronics Electrical equipment manufacturing output Domestic exports of non oil (NODX) of electronic products Currency trends (particularly USD as it is most commonly used for transactions in the Technology sector)
Source: Singstat. As of January 2018 Source: Bloomberg. As of January 2018
6
75
80
85
90
95
100
105
Dec-12 Dec-13 Dec-14 Dec-15 Dec-16 Dec-17
US$ spot index
-20%-10%0%10%20%30%40%
$0.0
$5.0
$10.0
$15.0
$20.0
Jan
-99
Feb
-00
Mar
-01
Ap
r-0
2
May
-03
Jun
-04
Jul-
05
Au
g-0
6
Sep
-07
Oct
-08
No
v-0
9
De
c-1
0
Jan
-12
Feb
-13
Mar
-14
Ap
r-1
5
May
-16
Jun
-17
Singapore's electronics NODX
Electronics NODX (S$bn) y-o-y (RHS)
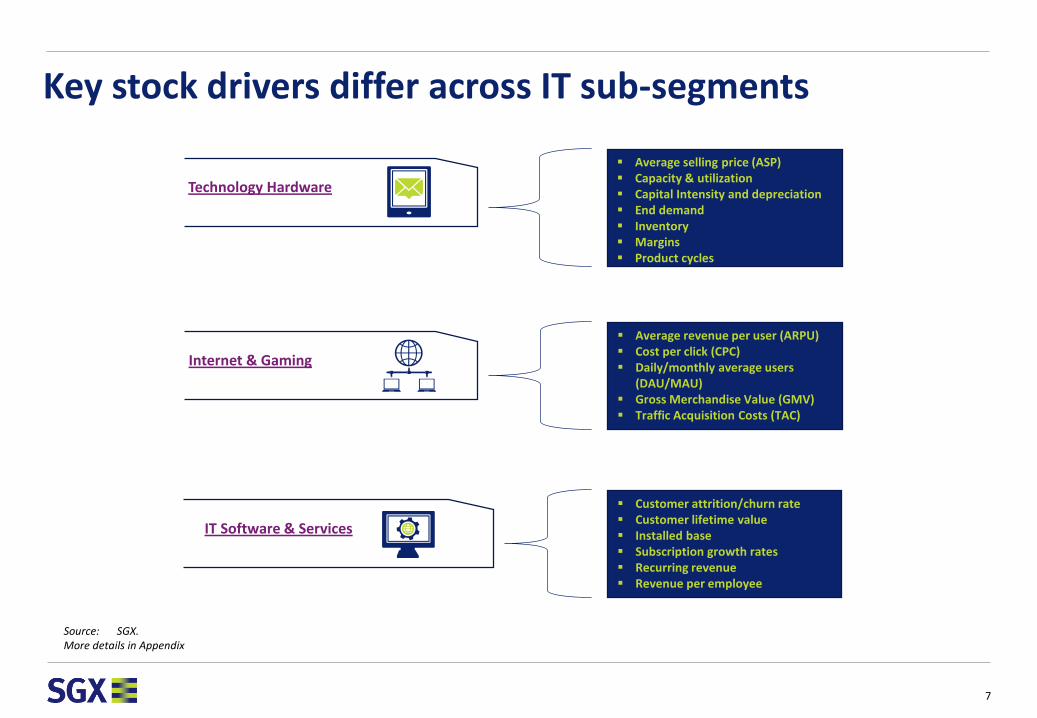
Key stock drivers differ across IT sub-segments
Technology Hardware
Average selling price (ASP) Capacity & utilization Capital Intensity and depreciation End demand Inventory Margins Product cycles
Internet & Gaming
Average revenue per user (ARPU) Cost per click (CPC) Daily/monthly average users
(DAU/MAU) Gross Merchandise Value (GMV) Traffic Acquisition Costs (TAC)
IT Software & Services
Customer attrition/churn rate Customer lifetime value Installed base Subscription growth rates Recurring revenue Revenue per employee
Source: SGX. More details in Appendix
7
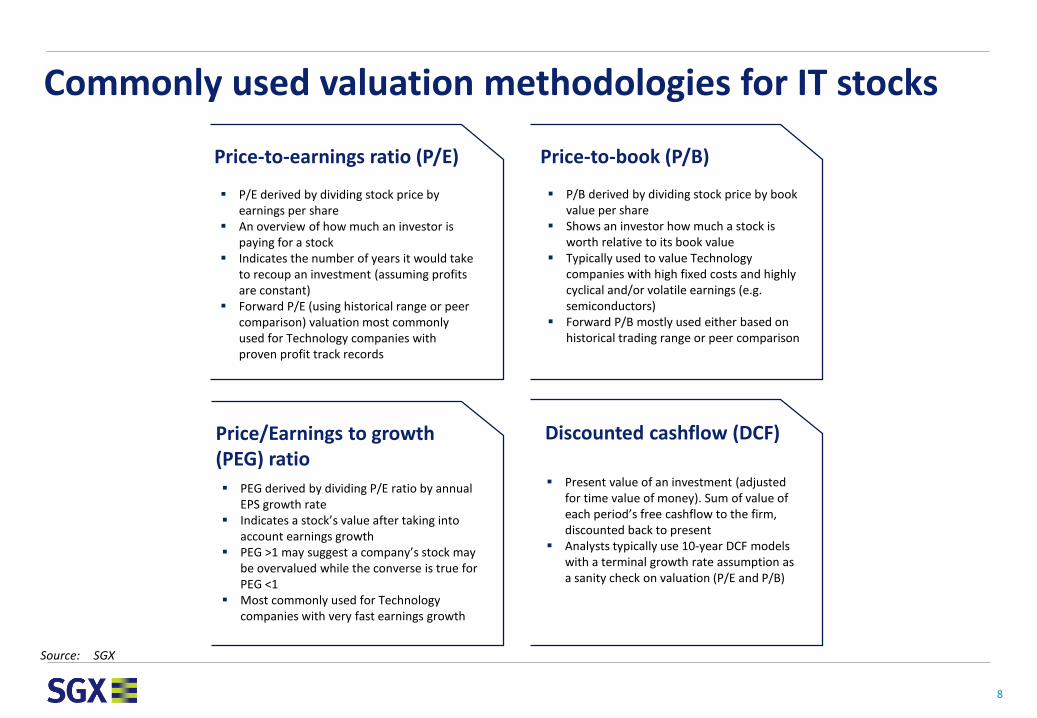
Commonly used valuation methodologies for IT stocks
Price-to-book (P/B)
Price/Earnings to growth (PEG) ratio
P/E derived by dividing stock price by earnings per share
An overview of how much an investor is paying for a stock
Indicates the number of years it would take to recoup an investment (assuming profits are constant)
Forward P/E (using historical range or peer comparison) valuation most commonly used for Technology companies with proven profit track records
Price-to-earnings ratio (P/E)
Discounted cashflow (DCF)
Source: SGX
P/B derived by dividing stock price by book value per share
Shows an investor how much a stock is worth relative to its book value
Typically used to value Technology companies with high fixed costs and highly cyclical and/or volatile earnings (e.g. semiconductors)
Forward P/B mostly used either based on historical trading range or peer comparison
PEG derived by dividing P/E ratio by annual EPS growth rate
Indicates a stock’s value after taking into account earnings growth
PEG >1 may suggest a company’s stock may be overvalued while the converse is true for PEG <1
Most commonly used for Technology companies with very fast earnings growth
Present value of an investment (adjusted for time value of money). Sum of value of each period’s free cashflow to the firm, discounted back to present
Analysts typically use 10-year DCF models with a terminal growth rate assumption as a sanity check on valuation (P/E and P/B)
8
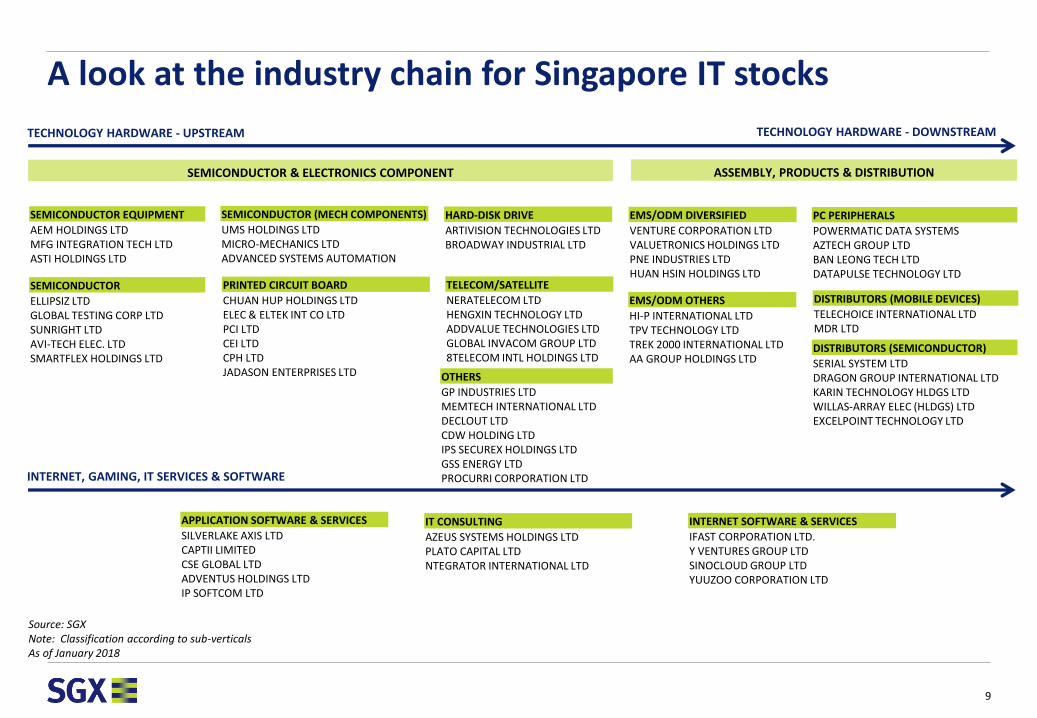
A look at the industry chain for Singapore IT stocks
TECHNOLOGY HARDWARE - UPSTREAM
SEMICONDUCTOR EQUIPMENT
AEM HOLDINGS LTDMFG INTEGRATION TECH LTDASTI HOLDINGS LTD
SEMICONDUCTOR
ELLIPSIZ LTDGLOBAL TESTING CORP LTDSUNRIGHT LTDAVI-TECH ELEC. LTDSMARTFLEX HOLDINGS LTD
SEMICONDUCTOR (MECH COMPONENTS)
UMS HOLDINGS LTDMICRO-MECHANICS LTDADVANCED SYSTEMS AUTOMATION
PRINTED CIRCUIT BOARD
CHUAN HUP HOLDINGS LTDELEC & ELTEK INT CO LTDPCI LTDCEI LTDCPH LTDJADASON ENTERPRISES LTD
EMS/ODM DIVERSIFIED
VENTURE CORPORATION LTDVALUETRONICS HOLDINGS LTDPNE INDUSTRIES LTDHUAN HSIN HOLDINGS LTD
EMS/ODM OTHERS
HI-P INTERNATIONAL LTDTPV TECHNOLOGY LTDTREK 2000 INTERNATIONAL LTDAA GROUP HOLDINGS LTD
TELECOM/SATELLITE
NERATELECOM LTDHENGXIN TECHNOLOGY LTDADDVALUE TECHNOLOGIES LTDGLOBAL INVACOM GROUP LTD8TELECOM INTL HOLDINGS LTD
HARD-DISK DRIVE
ARTIVISION TECHNOLOGIES LTDBROADWAY INDUSTRIAL LTD
PC PERIPHERALS
POWERMATIC DATA SYSTEMSAZTECH GROUP LTDBAN LEONG TECH LTDDATAPULSE TECHNOLOGY LTD
TECHNOLOGY HARDWARE - DOWNSTREAM
DISTRIBUTORS (MOBILE DEVICES)
TELECHOICE INTERNATIONAL LTDMDR LTD
DISTRIBUTORS (SEMICONDUCTOR)
SERIAL SYSTEM LTDDRAGON GROUP INTERNATIONAL LTDKARIN TECHNOLOGY HLDGS LTDWILLAS-ARRAY ELEC (HLDGS) LTDEXCELPOINT TECHNOLOGY LTD
INTERNET, GAMING, IT SERVICES & SOFTWARE
APPLICATION SOFTWARE & SERVICES
SILVERLAKE AXIS LTDCAPTII LIMITEDCSE GLOBAL LTDADVENTUS HOLDINGS LTDIP SOFTCOM LTD
IT CONSULTING
AZEUS SYSTEMS HOLDINGS LTDPLATO CAPITAL LTDNTEGRATOR INTERNATIONAL LTD
INTERNET SOFTWARE & SERVICES
IFAST CORPORATION LTD.Y VENTURES GROUP LTDSINOCLOUD GROUP LTDYUUZOO CORPORATION LTD
OTHERS
GP INDUSTRIES LTDMEMTECH INTERNATIONAL LTDDECLOUT LTDCDW HOLDING LTDIPS SECUREX HOLDINGS LTDGSS ENERGY LTDPROCURRI CORPORATION LTD
Source: SGXNote: Classification according to sub-verticalsAs of January 2018
SEMICONDUCTOR & ELECTRONICS COMPONENT ASSEMBLY, PRODUCTS & DISTRIBUTION
9
Singapore traditionally strong in hardware manufacturing Singapore’s electronics manufacturing industry
− >4% of Singapore’s GDP for the past 30 years
− 29% of Singapore’s total manufacturing value-add in 2013
One of the largest semiconductor industry in the Asia Pacific region
− #2 city worldwide (behind Hsinchu, Taiwan) in terms of semiconductor fab capacity
− Home to 15 silicon IC wafer fabs, 4 compound semiconductor wafer fabs, and 3 MEMS wafer fabs
− Fabricates about one in 10 of the world’s integrated circuits (IC) companies
World’s largest manufacturer of hard disk media
− Over 40% global market share
Major hub for regional data centre operations in Infocomms & Consumer Electronics
− Hewlett-Packard (HP) manufactures high-end servers, storage and networking equipment in Singapore
− IBM uses Singapore as a hub to build its high-end servers and mainframes
− Regional base for many Electronics Manufacturing Services (EMS) companies (e.g. Jabil, Venture)
Choice location for batteries and power electronics system
− Energizer and Sony manufacture latest-generation lithium batteries in Singapore
Source: Singapore Economic Development Board, IE Singapore
10

Information Technology was the Strongest of the Sectors in 2017
11
With higher worldwide semiconductor sales in 2017, in addition to higher end demand for consumer electronics, both upstream and downstream technology companies benefitted from the global swing.
Upstream Examples Downstream ExamplesHigh precision & semiconductor EMS/ODMcomponent manufacturers
UMS Hldgs (+122%) Venture Corp (+115%)Micro-Mechanics Hldgs (+158%) Valuetronics Hldgs (103%)
SG IT Sector Market Cap (S$B) Grew 3/5ths in 2017Market Capitalisation Weighted Total Return of 107% in 2017
10 Largest Capitalised Primary-Listed Stocks of the GICS® IT Sector
Largest Revenue Segment 2017 Total
Return
NPAT Growth as of 30 Sep
2017
Period ROE %
5Yr Avg ROE %
P/B P/B 5Yr Avg
P/E P/E 5Yr Avg
VENTURE CORP Electronic Manufacturing, Engineering &Services 115% 82% 9MFY17 15 11 2.9 1.7 20 16
SILVERLAKE AXIS Maintenance and Enhancement Services 19% -81%** 1QFY18 77 78 4.3 4.8 7 8
HI-P INTERNATIONAL Precision Plastic Injection Molding (PPIM) 327% 138% 9MFY17 18 10 3.1 1.2 17 NM
UMS HLDNGS Semiconductor 122% 118% 9MFY17 21 16 2.6 1.8 13 11
ELEC & ELTEK INT CO Printed Circuit Boards 83% 265% 9MFY17 8 0.8 10 13
VALUETRONICS HLDGS Industrial & Commercial Electronics 103% 47% 1HFY17-18 20 17 2.3 1.7 12 10
GP INDUSTRIES Batteries 33% 12% 1HFY17-18 6 5 1.0 0.9 19 17
MICRO-MECHANICS HLDGS Custom Machining and Assembly 158% 53% 1QFY18 29 26 4.9 2.9 18 11
CHUAN HUP HLDGS Electronics Manufacturing Services 37% 99% 1QFY18 7 5 0.7 0.6 11 13
IFAST CORP Internet-based investment products distribution 8% 52% 9MFY17 10 9 2.9 2.9 30 34
Average: 101% 78% 21% 20% 2.6x 2.0x 16x 15x
Median: 93% 67%**Note FY17 NPAT was up 309%
P/B is typically used to value Technology companies with high fixed costs and highly cyclical and/or volatile earnings (e.g. semiconductorsSource: SGX StockFacts & Bloomberg
Comparative Performances:Sector Leaders:
9.7
15.5
2016 2017
Expanded+60%
28%
45%
107%
MSCI WorldIT Index
MSCI Asia ITIndex
Mkt CapWeighted
Returns of SGIT Sector
2017 Total Return [SGD]
(P/B 4.8x) (P/B 2.4x)
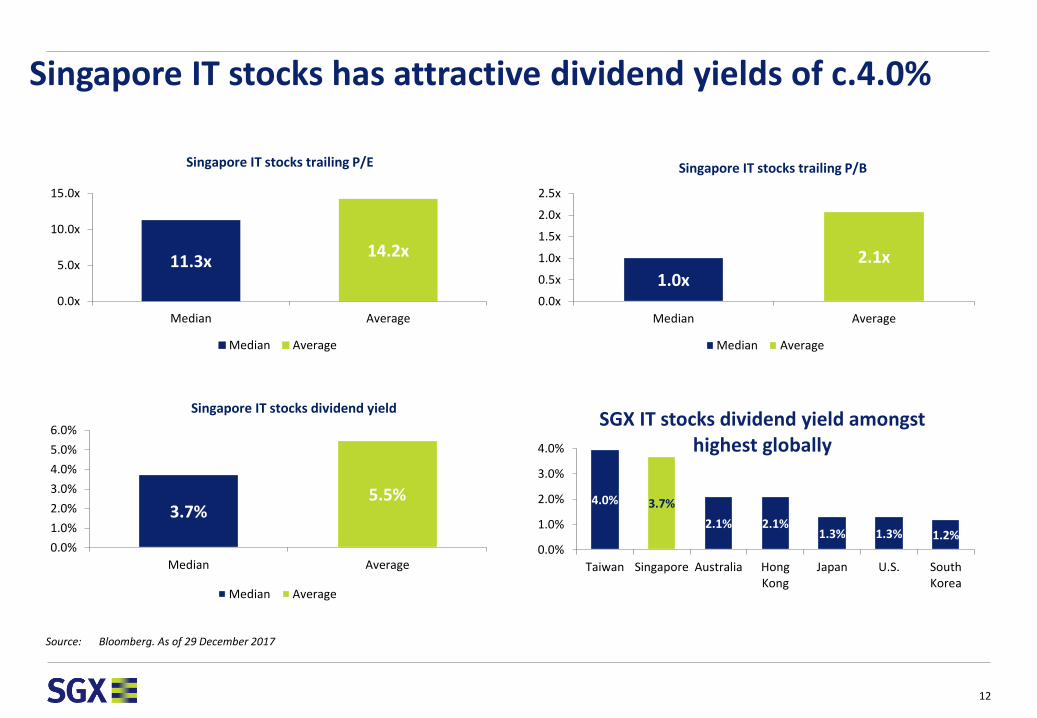
Singapore IT stocks has attractive dividend yields of c.4.0%
Source: Bloomberg. As of 29 December 2017
12
11.3x14.2x
0.0x
5.0x
10.0x
15.0x
Median Average
Median Average
Singapore IT stocks trailing P/E
1.0x2.1x
0.0x
0.5x
1.0x
1.5x
2.0x
2.5x
Median Average
Median Average
Singapore IT stocks trailing P/B
3.7%5.5%
0.0%
1.0%
2.0%
3.0%
4.0%
5.0%
6.0%
Median Average
Median Average
Singapore IT stocks dividend yield
4.0% 3.7%
2.1% 2.1%1.3% 1.3% 1.2%
0.0%
1.0%
2.0%
3.0%
4.0%
Taiwan Singapore Australia HongKong
Japan U.S. SouthKorea
SGX IT stocks dividend yield amongst highest globally
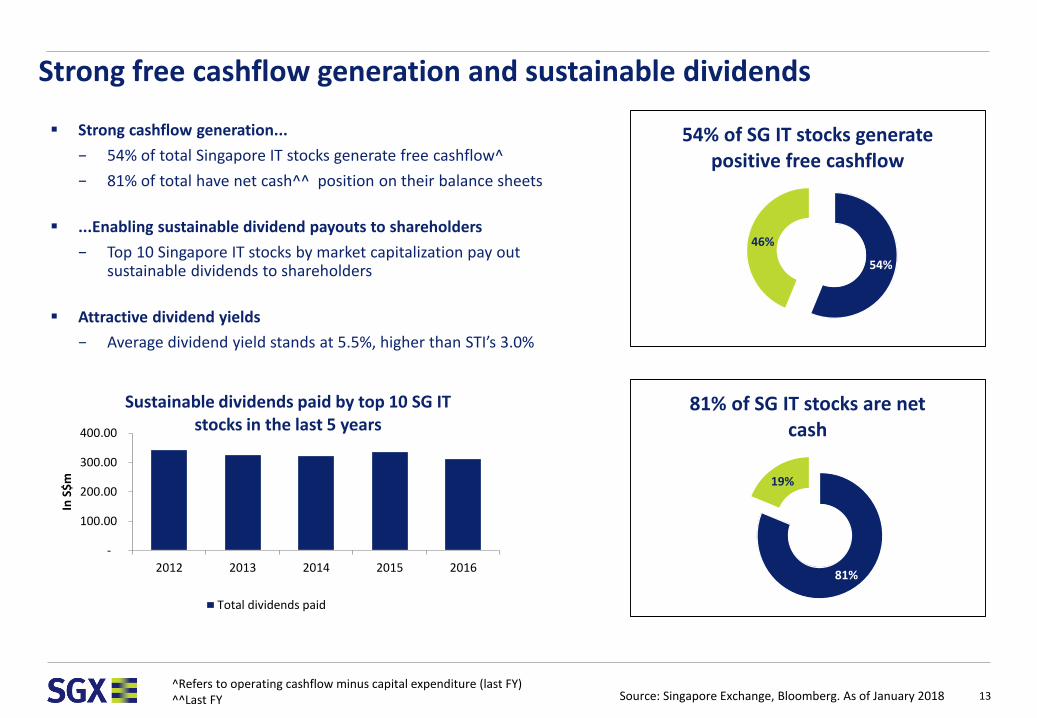
Strong free cashflow generation and sustainable dividends
13Source: Singapore Exchange, Bloomberg. As of January 2018
54%
46%
54% of SG IT stocks generate positive free cashflow
81%
19%
81% of SG IT stocks are net cash
Strong cashflow generation...
− 54% of total Singapore IT stocks generate free cashflow^
− 81% of total have net cash^^ position on their balance sheets
...Enabling sustainable dividend payouts to shareholders
− Top 10 Singapore IT stocks by market capitalization pay out sustainable dividends to shareholders
Attractive dividend yields
− Average dividend yield stands at 5.5%, higher than STI’s 3.0%
^Refers to operating cashflow minus capital expenditure (last FY)^^Last FY
-
100.00
200.00
300.00
400.00
2012 2013 2014 2015 2016
In S
$m
Sustainable dividends paid by top 10 SG IT stocks in the last 5 years
Total dividends paid

Paradigm shift into digital age presents an opportunity for Singapore
14

Disruptive technologies driving future growth in IT
• Internet of Everything (IoE): 50bn connected devices by 2020, creating USD14.4 trillion of value at stake for companies and industries (according to Cisco). Big data growing rapidly thanks to high speed analytics
• Virtual Reality (VR) and Augmented Reality (AR): Products such as Oculus Rift, PlayStation VR, Samsung Gear VR, and HTC Vive becoming mainstream as eco-system develops and content ramps
• 3D printing (additive manufacturing): Market size projected to grow 5x from USD2.2bn in 2012 to USD10.8bn in 2021 (source: A*STAR) driven by lower costs and demand from aerospace, defense, auto and medical industries
• Robotics and Artificial Intelligence (AI): Robots and AI solutions market likely to grow to USD153bn by 2020 (BAML) driven by accelerating adoption of robotics across sectors within manufacturing
• Fintech emerging: Digital disruption of the global banking sector. Availability of cloud computing and data analytics enabling non-FI companies to develop fintech solutions
• Mobile payment: Increasing adoption rate of mobile payment users as smartphones become ubiquitous. Apple and Google leading the pack
15

Key growth areas for Singapore IT sector Regional hubs for many “new economy” companies
− Asia-Pacific HQ located in Singapore: Facebook, Google, Netflix, Twitter
Smart Nation initiative
− IDA launching SGD2.82bn of Information & Communications Technology (ICT) tenders across FY16
− >50% of projected expenditure on infrastructure-related projects (e.g. data centres, data storage, PCs, routers, WiFi)
− Key focus areas: Infrastructure, IoT security and government agency systems
Medical-Technology (Med-Tech)
− >100 Med-Tech SMEs in Singapore and was SGD5.5bn in manufacturing output in 2014 (versus SGD1.5bn in 2000)
− Biotech output already accounted for 65% of overall manufacturing output growth in 2015
FinTech
− MAS commits SGD225m (for next five years) to grow Fintech segment of startup ecosystem in Singapore
Increasing collaboration between large Singapore corporates and National Research Foundation (NRF)
− CapitaLand, DeClout, Wilmar, and YCH partnering NRF to jointly invest up to SGD85m in SG-based Tech startups
− DBS investing SGD10m over next five years to support startup ecosystem in Singapore
Source: http://www.channelnewsasia.com/news/business/government-to-call-for-s/2808162.html
16
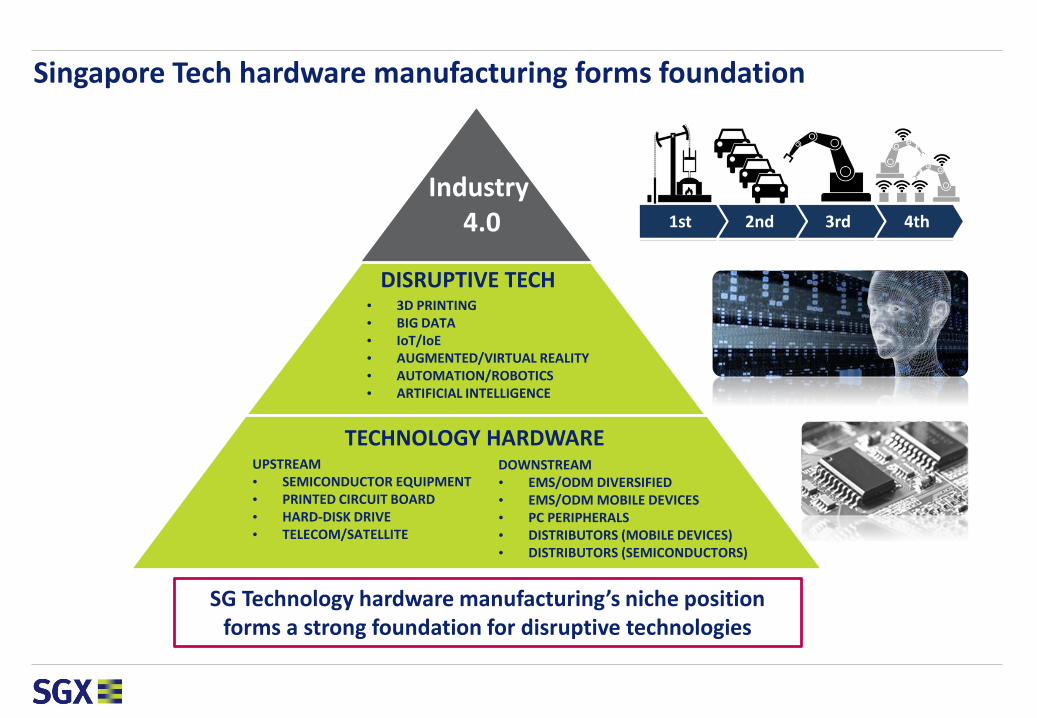
Singapore Tech hardware manufacturing forms foundation
SG Technology hardware manufacturing’s niche position forms a strong foundation for disruptive technologies
UPSTREAM• SEMICONDUCTOR EQUIPMENT• PRINTED CIRCUIT BOARD• HARD-DISK DRIVE• TELECOM/SATELLITE
DOWNSTREAM• EMS/ODM DIVERSIFIED• EMS/ODM MOBILE DEVICES• PC PERIPHERALS• DISTRIBUTORS (MOBILE DEVICES)• DISTRIBUTORS (SEMICONDUCTORS)
• 3D PRINTING• BIG DATA• IoT/IoE• AUGMENTED/VIRTUAL REALITY• AUTOMATION/ROBOTICS• ARTIFICIAL INTELLIGENCE
TECHNOLOGY HARDWARE
DISRUPTIVE TECH
Industry 4.0

Supportive eco-system to position for disruptive technologies
Government-aided equityfinancing schemes
Cash grants Business incubator schemes Debt financing schemes Tax incentive schemes
- SPRING Startup Enterprise - ACE Start-ups Scheme - NRF Technology Incubation - Micro-Loan Program - Tax Exemption for Start-ups
Development Scheme (SPRING - Technology Enterprise Scheme - Loan Insurance Scheme (LIS) - Development & Expansion
SEEDS) Commercialization Scheme (TECS) - Incubator Development Program - Local Enterprise Finance Scheme Incentive (DEI)
- Business Angels Scheme (BAS) - iSTART-ACE Scheme - Incubator for Disruptive Enterprise (LEFS) - Investment allowance
- Early-Stage Venture Funding - iSPRINT & Start-ups (IDEAS) fund - Pioneer Incentive Scheme
- ComCare Enterprise Fund (CEF) - Fast-Track Environmental & Water - Productivity & Innovation
Technologies Incubator Scheme Credit (PIC) Scheme
(Fast-Tech) - Industry-specific tax incentives
Quick snapshot of some of the funding initiatives for startups in Singapore offered by various government agencies
BLK71: Singapore’s startup hub set up in 2011
SGX’s Market Initiatives & PartnershipsSupportive government agencies
-
50
100
150
200
250
2010 2011 2012 2013 2014 2015
Startup funding deals in Singapore rising
Startup funding deals in Singapore
Source: Techinasia.com
18
SGX-Nasdaq established collaborative listings agreement
Signed MOUs with A*STAR, Crowdo, PwC’s Venture Hub
Signed MOI with IMDA
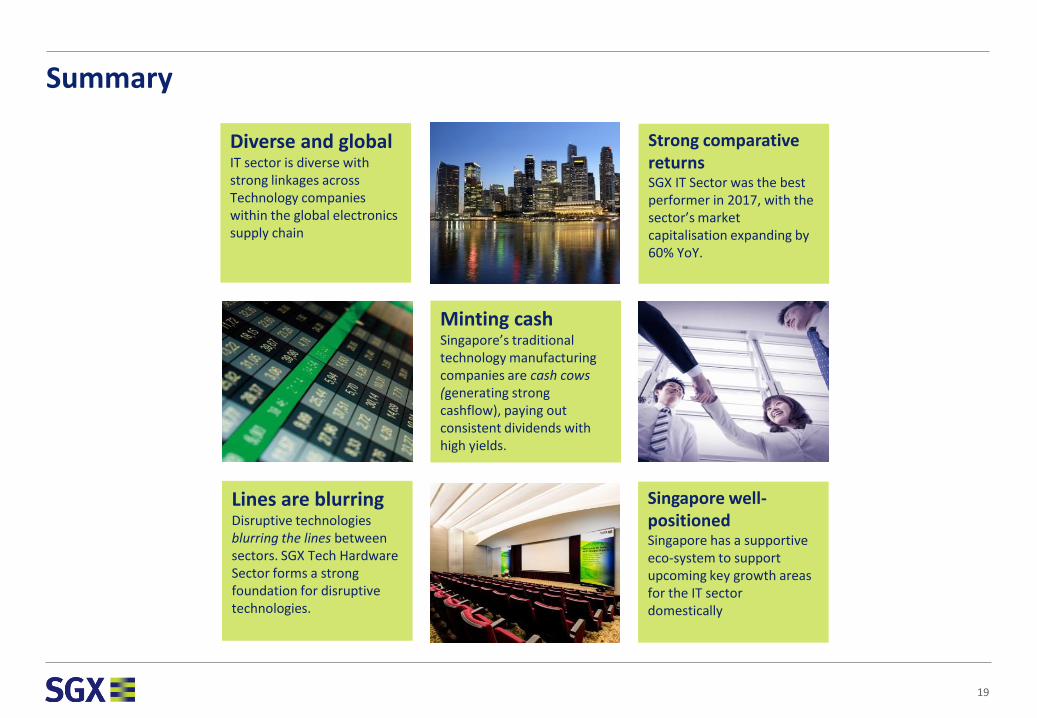
Summary
Diverse and globalIT sector is diverse with strong linkages across Technology companies within the global electronics supply chain
Strong comparativereturnsSGX IT Sector was the best performer in 2017, with the sector’s market capitalisation expanding by 60% YoY.
Minting cash Singapore’s traditional technology manufacturing companies are cash cows (generating strong cashflow), paying out consistent dividends with high yields.
Lines are blurringDisruptive technologies blurring the lines between sectors. SGX Tech Hardware Sector forms a strong foundation for disruptive technologies.
Singapore well-positionedSingapore has a supportive eco-system to support upcoming key growth areas for the IT sector domestically
19
Appendix
20

IT sector is very broad as shown by GICS® and index
18.4%
16.9%
13.2%11.7%
11.0%
7.1%
7.1%
5.5%2.5%
2.2%4.4%
Internet Software & Services Tech Hardware, Storage & PeripheralsSystems Software SemiconductorsData Processing & Outsourced Services IT Consulting & Other ServicesApplication Software Conmmuncations EquipmentElectronic Components Semiconductor Equipment
Source: MSCI
Industry Group
451. Software & Services
452. Technology Hardware & Equipment
453. Semiconductors & Semiconductor Equipment
Industry Name
451010. Internet Software & Services
451020. IT Services
451030. Software
452010. Communications Equipment
452020. Technology Hardware, Storage & Peripherals
452030. Electronic Equipment, Instruments & Components
453010. Semiconductors & Semiconductor Equipment
Sub-industry Name
45101010. Internet Software & Services
45102010. IT Consulting & Other Services
45102020. Data Processing & Outsourced Services
45103010. Application Software
45103020. Systems Software
45103030. Home Entertainment Software
45201020. Communications Equipment
45202030. Technology Hardware, Storage & Peripherals
45203010. Electronic Equipment & Instruments
45203015. Electronic Components
45203020. Electronic Manufacturing Services
45203030. Technology Distributors
45301010. Semiconductor Equipment
45301020. Semiconductors
MSCI IT Index weight
21
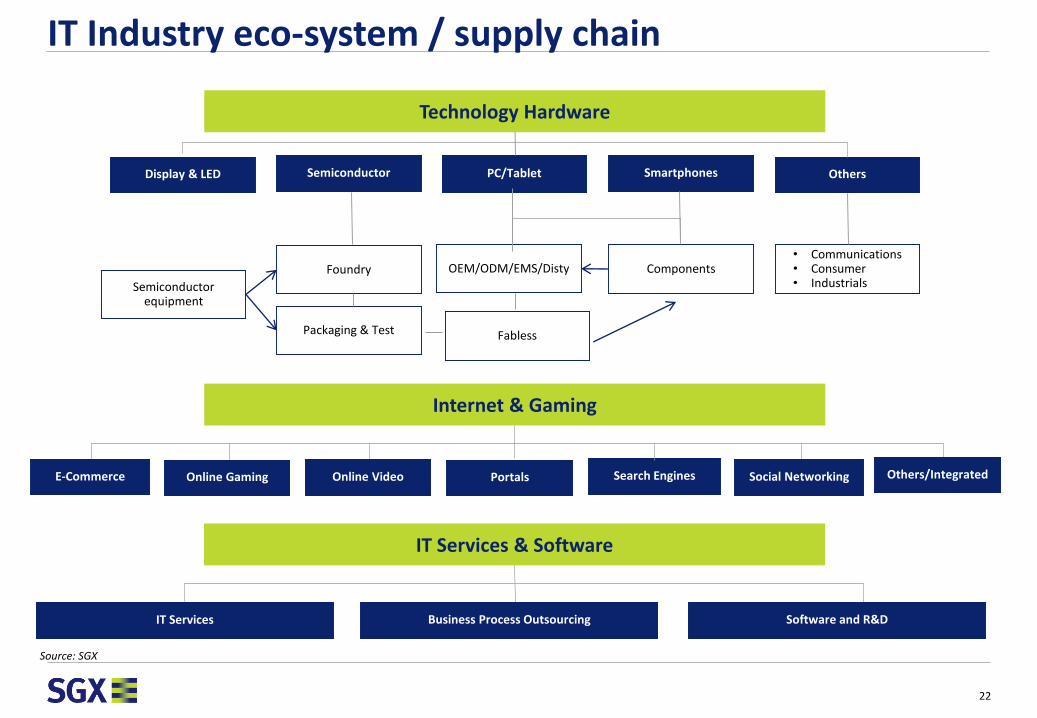
Semiconductor SmartphonesDisplay & LED OthersPC/Tablet
Technology Hardware
• Communications• Consumer• Industrials
ComponentsOEM/ODM/EMS/Disty
Packaging & Test
Foundry
Semiconductor equipment
Fabless
Internet & Gaming
Social NetworkingPortals Search EnginesOnline Video Others/IntegratedE-Commerce Online Gaming
IT Services & Software
IT Services Software and R&DBusiness Process Outsourcing
Source: SGX
IT Industry eco-system / supply chain
22
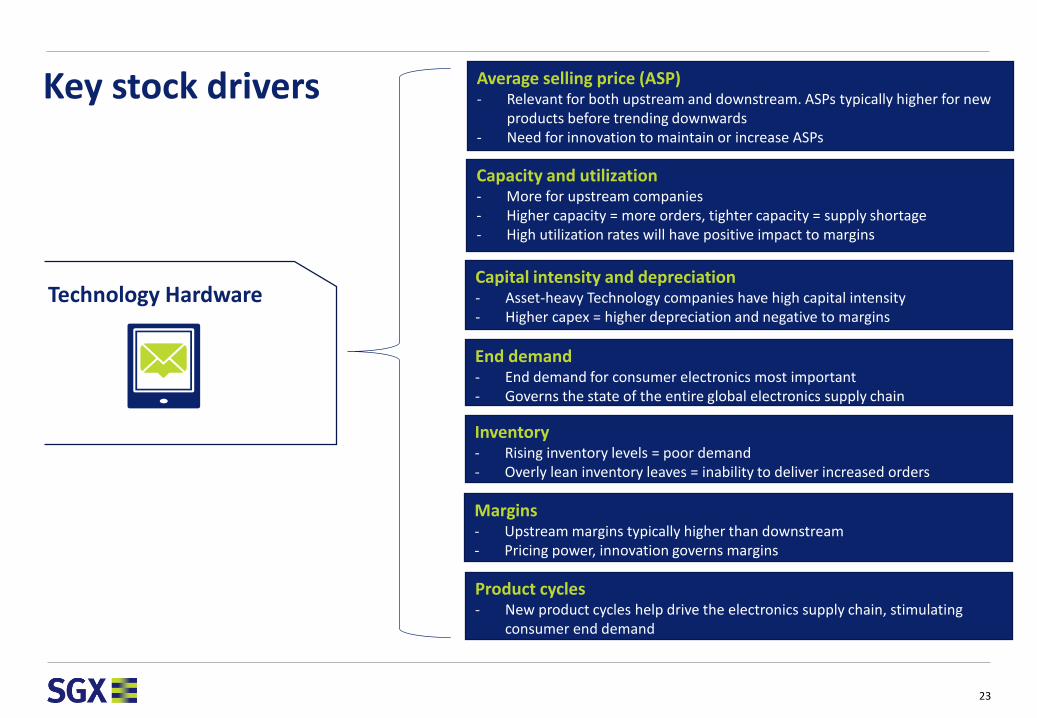
Key stock drivers
Technology Hardware
Average selling price (ASP)- Relevant for both upstream and downstream. ASPs typically higher for new
products before trending downwards- Need for innovation to maintain or increase ASPs
Capacity and utilization- More for upstream companies- Higher capacity = more orders, tighter capacity = supply shortage- High utilization rates will have positive impact to margins
Capital intensity and depreciation- Asset-heavy Technology companies have high capital intensity- Higher capex = higher depreciation and negative to margins
End demand- End demand for consumer electronics most important- Governs the state of the entire global electronics supply chain
Inventory- Rising inventory levels = poor demand- Overly lean inventory leaves = inability to deliver increased orders
Margins- Upstream margins typically higher than downstream- Pricing power, innovation governs margins
Product cycles- New product cycles help drive the electronics supply chain, stimulating
consumer end demand
23
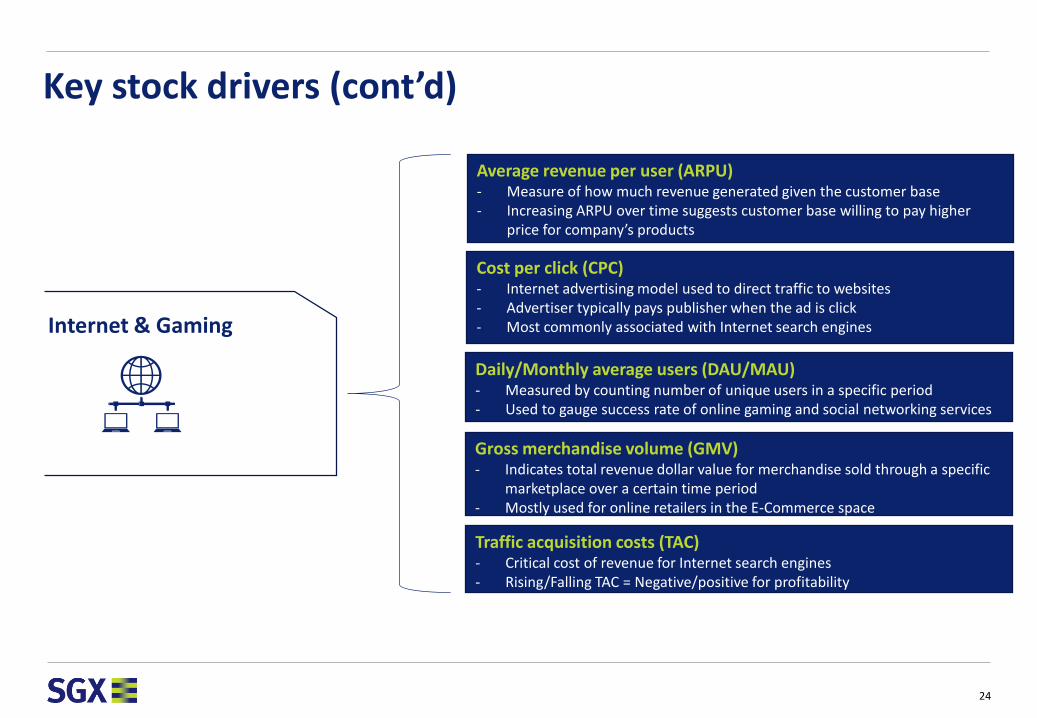
Key stock drivers (cont’d)
Internet & Gaming
Average revenue per user (ARPU)- Measure of how much revenue generated given the customer base- Increasing ARPU over time suggests customer base willing to pay higher
price for company’s products
Cost per click (CPC)- Internet advertising model used to direct traffic to websites- Advertiser typically pays publisher when the ad is click- Most commonly associated with Internet search engines
Daily/Monthly average users (DAU/MAU)- Measured by counting number of unique users in a specific period- Used to gauge success rate of online gaming and social networking services
Gross merchandise volume (GMV)- Indicates total revenue dollar value for merchandise sold through a specific
marketplace over a certain time period- Mostly used for online retailers in the E-Commerce space
Traffic acquisition costs (TAC)- Critical cost of revenue for Internet search engines- Rising/Falling TAC = Negative/positive for profitability
24
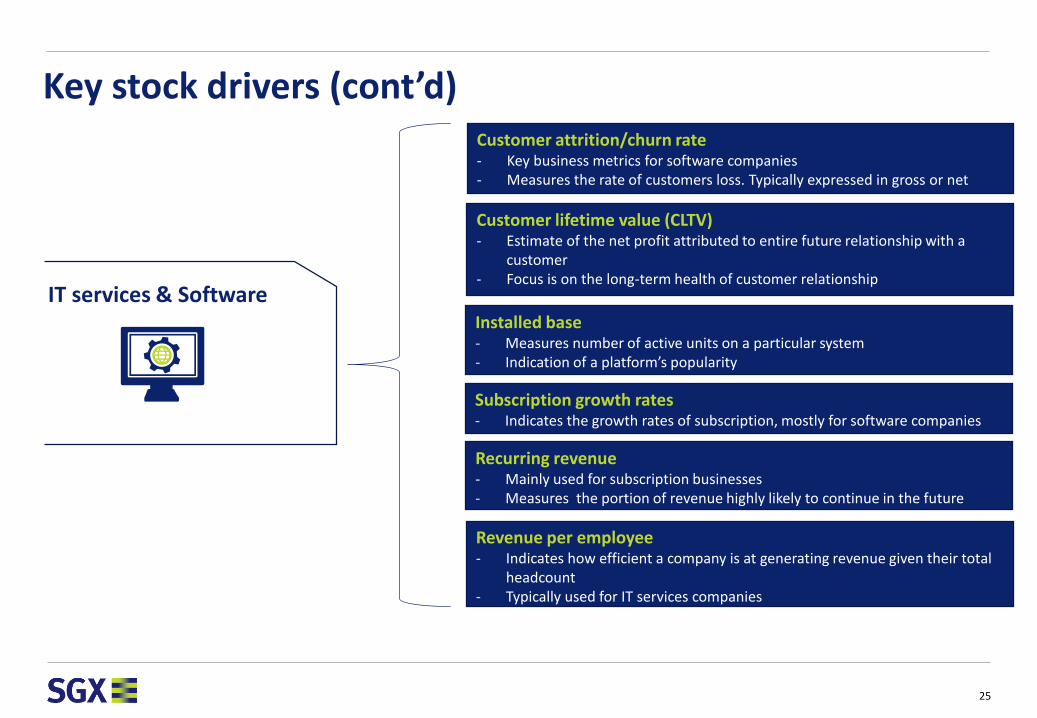
Key stock drivers (cont’d)
IT services & Software
Customer attrition/churn rate- Key business metrics for software companies- Measures the rate of customers loss. Typically expressed in gross or net
Customer lifetime value (CLTV)- Estimate of the net profit attributed to entire future relationship with a
customer- Focus is on the long-term health of customer relationship
Installed base- Measures number of active units on a particular system - Indication of a platform’s popularity
Subscription growth rates- Indicates the growth rates of subscription, mostly for software companies
Recurring revenue - Mainly used for subscription businesses- Measures the portion of revenue highly likely to continue in the future
Revenue per employee- Indicates how efficient a company is at generating revenue given their total
headcount- Typically used for IT services companies
25
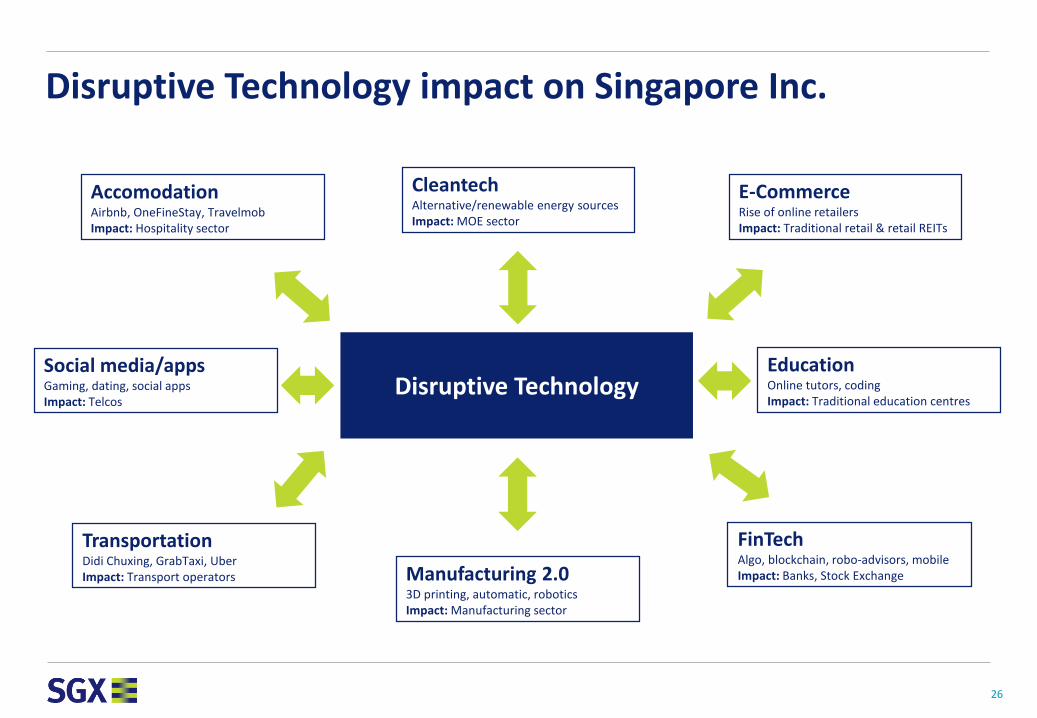
Disruptive Technology impact on Singapore Inc.
CleantechAlternative/renewable energy sourcesImpact: MOE sector
Disruptive Technology
E-CommerceRise of online retailersImpact: Traditional retail & retail REITs
FinTechAlgo, blockchain, robo-advisors, mobileImpact: Banks, Stock Exchange
Social media/appsGaming, dating, social appsImpact: Telcos
EducationOnline tutors, codingImpact: Traditional education centres
Manufacturing 2.03D printing, automatic, roboticsImpact: Manufacturing sector
TransportationDidi Chuxing, GrabTaxi, UberImpact: Transport operators
AccomodationAirbnb, OneFineStay, TravelmobImpact: Hospitality sector
26
Singapore ExchangeBeijing Hong Kong London Mumbai Tokyo
sgx.com
Thank you
This document/material is not intended for distribution to, or for use by or to be acted on by any person or entity located in any jurisdiction where such distribution, use or action would be contrary to applicable laws or regulations or would subject Singapore Exchange Limited ("SGX") and/or its affiliates (collectively with SGX, the "SGX Group Companies") to any registration or licensing requirement. This document/material is not an offer or solicitation to buy or sell, nor financial advice or recommendation for any investment product. This document/material has been published for general circulation only. It does not address the specific investment objectives, financial situation or particular needs of any person. Advice should be sought from a financial adviser regarding the suitability of any investment product before investing or adopting any investment strategies. Use of and/or reliance on this document/material is entirely at the reader's own risk. Investment products are subject to significant investment risks, including the possible loss of the principal amount invested. Past performance of investment products is not indicative of their future performance. Any forecast, prediction or projection in this document/material is not necessarily indicative of the future or likely performance of the product. Examples (if any) provided are for illustrative purposes only. While each of the SGX Group Companies have taken reasonable care to ensure the accuracy and completeness of the information provided, each of the SGX Group Companies disclaims any and all guarantees, representations and warranties, expressed or implied, in relation to this document/material and shall not be responsible or liable (whether under contract, tort (including negligence) or otherwise) for any loss or damage of any kind (whether direct, indirect or consequential losses or other economic loss of any kind, including without limitation loss of profit, loss of reputation and loss of opportunity) suffered or incurred by any person due to any omission, error, inaccuracy, incompleteness, or otherwise, any reliance on such information, or arising from and/or in connection with this document/material. The information in this document/material may have been obtained via third party sources and which have not been independently verified by any SGX Group Company. No SGX Group Company endorses or shall be liable for the content of information provided by third parties (if any). The SGX Group Companies may deal in investment products in the usual course of their business, and may be on the opposite side of any trades. Each of SGX, Singapore Exchange Securities Trading Limited and Singapore Exchange Bond Trading Pte. Ltd. is an exempt financial adviser under the Financial Advisers Act (Cap. 110) of Singapore. The information in this document/material is subject to change without notice. This document/material shall not be reproduced, republished, uploaded, linked, posted, transmitted, adapted, copied, translated, modified, edited or otherwise displayed or distributed in any manner without SGX's prior written consent. Please note that the general disclaimers and jurisdiction specific disclaimers found on SGX's website at http://www.sgx.com/wps/portal/sgxweb/footerLinks/tos#panelhead21 are also incorporated into and applicable to this document/material.
Related Documents