Equity Instruments & Markets B40.3331 Valuation Project Date due: December 13, 2004 Summary Recommendations Company Price DCF Valuation Relative Valuation Option EVA in R ecommendation Model Used Value Multiple Used Value Valuation last year Pixar 83.98 $ FCFF2 78.11 $ PEG 91.35 $ N/A $204,600 Hold Citigroup 45.91 $ DDM3 59.90 $ PBV 75.92 $ N/A $12,169,000,000 Buy Sycamore 3.88 $ FCFFGen 3.62 $ VBV 11.06 $ N/A -$207,061,474 Sell R io Tinto 40.08 $ FCFF2 39.08 $ PE 45.20 $ N/A $1,316,000,000 Buy Swatch (bearer) SFr. 163.00 FCFE2 SFr. 177.90 VS SFr. 102.10 N/A $63,800,000 Buy Swatch (reg.) SFr. 33.20 FCFE2 SFr. 35.60 VS SFr. 20.40 N/A $63,800,000 Buy Group Members: Stefan Fischer (suf200) Espen Stokke (es1446) Ronny Fluegge (rf829) David Gowans (djg291) Adam Qaiser (aaq207)

Welcome message from author
This document is posted to help you gain knowledge. Please leave a comment to let me know what you think about it! Share it to your friends and learn new things together.
Transcript

Equity Instruments & Markets B40.3331
Valuation Project
Date due: December 13, 2004
Summary Recommendations
Company Price DCF Valuation Relative Valuation Option EVA in RecommendationModel Used Value Multiple Used Value Valuation last year
Pixar 83.98$ FCFF2 78.11$ PEG 91.35$ N/A $204,600 HoldCitigroup 45.91$ DDM3 59.90$ PBV 75.92$ N/A $12,169,000,000 BuySycamore 3.88$ FCFFGen 3.62$ VBV 11.06$ N/A -$207,061,474 SellR io Tinto 40.08$ FCFF2 39.08$ PE 45.20$ N/A $1,316,000,000 Buy
Swatch (bearer) SFr. 163.00 FCFE2 SFr. 177.90 VS SFr. 102.10 N/A $63,800,000 BuySwatch (reg.) SFr. 33.20 FCFE2 SFr. 35.60 VS SFr. 20.40 N/A $63,800,000 Buy
Group Members:
Stefan Fischer (suf200) Espen Stokke (es1446) Ronny Fluegge (rf829)
David Gowans (djg291) Adam Qaiser (aaq207)

Background Information The Swatch Group is a Swiss company that, together with its subsidiaries, is engaged in the
manufacture of watches, movements and components and other products. The company offers
watches in all price and market categories. It manufactures mechanical and quartz movements
and a range of components, including ruby, sapphire and other components. In addition, the
company produces and markets jewelry under the DYB brand name, as well as manufactures
microchips, quartz resonators and other electronic systems, and operates boutiques and shops.
1. Discounted Cash Flow Valuation
NOTE: ANY VALUES STATED ARE ALWAYS IN MILLION CHF (Swiss francs),
UNLESS IT IS A PER SHARE VALUE

Model 2-stage FCFE Model
Rationale Dividends≠FCFE, relative stable D/E ratio, currently high g
- Market value of D/E relatively stable during last five years around 6% with
long term goal of management to increase it to 7% (interview in Swiss
newspaper article)
- Currently high growth in emerging markets (especially Asia)
FCFE Taking 12-month trailing data to calculate normalized FCFE
2003 2004H 2003H Trailing 12-month data
Total Revenue 3'873.0 2'111.0 1'906.0 4'078.0
Cost of Revenue 739.0 n/a n/a n/a
Gross Profit 3'134.0 n/a n/a n/a
Selling/General/Admin. Expenses 1'262.0 n/a n/a n/a
Depreciation/Amortization 216.0 110.0 105.0 221.0
Other Operating Expenses 1'062.0 n/a n/a n/a
Total Operating Expense 3'279.0 1'763.0 1'682.0 3'360.0
Operating Income 594.0 348.0 224.0 718.0
Interest Expense 1.0 0.0 0.0 1.0
Income Before Tax 593.0 348.0 224.0 717.0
Income Tax 96.0 48.0 38.0 106.0
Income After Tax 497.0 300.0 186.0 611.0
Minority Interest 5.0 3.0 2.0 6.0
Net Income 492.0 297.0 184.0 605.0
Income Statement
- Assuming Debt/Equity ratio of 7% translating into 6.5% Debt ratio (DR)
- Capex of 113% of Depreciation
Growth Assuming a further high growth period over next 10 years
- Payout ratio has been an average of 14% over last three years; steadily
increasing – assuming further increase to 20%
- Average ROE over last three years 14.4% - quite stable
- (1-Payout ratio) x ROE = Retention ratio x ROE = growth rate
- Assuming stable growth after 10 years assuming market growth, therefore
using risk free rate
- Further assuming no change in FCF, but sharp increase in payout ratio
Beta Swatch is officially in Retail-Jewelry Sector
- however Swatch also produces electronics, therefore taking 50% of each
unlevered average sector beta from Europe
- Marginal tax rate depends on cantons (state) in Switzerland – average in
West Switzerland (headquarters of Swatch) accumulates to 16%
- Debt/Equity ratio of 7%

Risk Premium Sales all around the world
- Taking geographic sales data as a proxy for country risk premium
- Adjusting weights for future shifts in sales – expecting more sales in Asia
Valuation Valuing shares as of today
- Calculating value as of beginning 2005 and then discounting another
month
Shares Swatch has bearer and registered shares outstanding
- Calculating percentage using book issuance values
Conclusion I find both Swatch stocks as being undervalued and would recommend
to buy shares
2. Value relative to the comparables
Comparables Swatch is in Retail Jewelry and Electronics sector
- I tried to find as many companies with similar product lines as swatch
excluding companies from the Retail Jewelry sector and adding from
Electronics sector
Multiple EV / Sales
- Comparables have all very different financial leverage – some using no
debt at all
- Comparables are all retailers
- Multiple lets adjust for brand name
Simple Average EV / Sales = 1.2
Swatch Group has multiple = 2.3
Looking at those facts Swatch seems to be far overvalued. However, this
multiple those not account for any margin differences due to strong brand
names. Swatch’s product (including the brand name Swatch itself) have a high
name recognition among customers and most products are well-known for
their quality. Therefore, it will be very easy for Swatch to charge a premium for
their name. Most of the comparables do not possess such an asset. Further,
Swatch does not bear the full risk of being a luxury retailer. Swatch is less
exposed to this cyclical market and therefore receives a higher Enterprise
Value compared to some of the comparables.
Regression EV/Sales explained with After-tax Margin and Debt-ratio
EV/Sales (Regression) still lower than actual multiple translating into a share
price of Sfr. 20.40 / 102.10. This can be interpreted that Swatch might be
overvalued compared to the sector. However, it shows that partly a higher
after-tax margin keeps the multiple higher than for the comparables what
probably is attributed to the strong brand name. Further, the risk for the
different companies have not been fully included in the regression, because
financial risk is only a part risk and does not reflect operating risks.
3. Value relative to the market
Swiss Market Swiss Market has many special characteristics (e.g. low interest rates)
- I decided to run a market regression with the 60 largest market cap stocks
in the Swiss market (SWX respectively Virt-X)
- Bloomberg tickers: Regression:
EV/Sales = 0.25 + 0.47(After-tax Margin) + 10.52 (DR) Regression Last price
(0.22) (0.76) (1.59) Reg. share 20.4 33.20
R2 = 0.75 Bear. share 102.1 163.00
EV/Sales (Regression) 1.64
EV/Sales (Actual) 2.30

Regression shows that Swatch is undervalued compared to the overall Swiss
market.
4. Value Enhancement Strategies / EVA
EVA Calculation was done for the same comparable firms as the relative valuation was done. Spread Cost of Debt Riskfree Rate Beta RP Cost of Equity DR WACC ROI CI EVA EVA-Spread
0.85% 6% 4.8% 0.37 6.4% 7.2% 22.8% 7% 6.3% 77.5 -0.4 -0.56%
0.35% 5% 4.8% 2.17 6.4% 18.8% 0.5% 19% 63.0% 623.9 276.3 44.29%
0.50% 5% 4.8% 1.19 6.4% 12.5% 3.9% 12% 15.8% 60.9 2.2 3.67%
0.35% 9% 8.4% 0.67 6.4% 12.7% 2.3% 13% 4.1% 1591.4 -136.0 -8.55%
0.35% 5% 4.8% 0.88 6.4% 10.5% 8.0% 10% 15.3% 156074.0 8170.7 5.24%
0.35% 9% 8.4% 0.67 6.4% 12.7% 7.6% 12% 7.1% 705.0 -37.3 -5.29%
4.00% 12% 8.4% 0.75 6.4% 13.2% 37.2% 13% 4.4% 2111.4 -180.5 -8.55%
0.35% 5% 4.8% 0.58 6.4% 8.6% 5.5% 8% 0.0% 9859.0 -827.7 -8.40%
0.70% 6% 4.8% 0.49 6.4% 8.0% 18.0% 8% 13.7% 90.2 5.6 6.15%
0.35% 9% 8.4% 0.66 6.4% 12.7% 5.2% 12% 12.6% 529.1 0.6 0.11%
0.35% 5% 4.8% 0.93 6.4% 10.8% 0.0% 11% 7.7% 24265.0 -754.4 -3.11%
0.35% 5% 4.8% 0.58 6.4% 8.5% 0.0% 9% 1.2% 18591.0 -1365.2 -7.34%
0.85% 6% 4.8% 0.88 6.4% 10.5% 58.6% 8% 8.4% 140218.0 955.1 0.68%
0.35% 5% 4.8% 1.36 6.4% 13.6% 10.1% 13% 17.8% 3310.0 168.2 5.08%
0.35% 9% 8.4% 0.73 6.4% 13.1% 18.6% 12% 22.6% 73.2 7.5 10.30%
0.35% 5% 4.8% 1.36 6.4% 13.6% 5.9% 13% 15.0% 3310.0 63.8 1.93%
1.00% 9% 8.4% 0.00 6.4% 8.4% 0.0% 8% 15.9% 148.0 11.1 7.53%
8.00% 16% 8.4% 1.17 6.4% 15.9% 47.8% 16% 6.7% 5272.1 -495.9 -9.41%
Avg 7.31% 6.21% 0.86 0.06 11.7% 14.0% 11.3% 13.2% 20383.87 325.76 1.88%
Median 5.60% 4.82% 0.74 6.4% 12.6% 6.7% 12.2% 10.5% 1851.41 1.42 0.40%
Calculations Following assumptions and calculations were made (marked stock=Swatch):
- in order to be able to compare Swatch values where not taken from DCF
valuation since no adjustments have made for the other comparables
either
- the cost of debt was calculated by using synthetical rating for coverage
ratios and using the risk-free rate appropriate to the company
EV/Sales = 0.25 + 22.472 (After-tax Margin) + 5.449 (DR) + 0.019 (RR)
(0.634) (2.613) (1.405) (0.093)
R2 = 0.62
EV/Sales (Regression) 3.22
EV/Sales (Actual) 2.30
Regression Last price
Reg. share 40.1 33.2
Bear. share 200.5 163.0
ABBN VX Equity EMSN VX Equity MC SW Equity SGKN SW Equity
ADEN VX Equity GALN SW Equity NAAN SW Equity SGSN VX Equity
AT/N SW Equity GEBN SW Equity NESN VX Equity SIGN SW Equity
ATLN SW Equity GIVN VX Equity NOBE SW Equity SIK SW Equity
BAER VX Equity HEPN SW Equity NOVN VX Equity SLHN VX Equity
BALN VX Equity HOLN VX Equity PARG SW Equity STMN SW Equity
BARN SW Equity KNIN SW Equity PHBN SW Equity SUN VX Equity
BCVN SW Equity KUD VX Equity PSPN SW Equity SYNN VX Equity
BEKN SW Equity KUNN SW Equity RIEN SW Equity SYST SW Equity
BKWN SW Equity LISN SW Equity ROG VX Equity UBSN VX Equity
CHRN SW Equity LLB SW Equity RUKN VX Equity UHR VX Equity
CIBN VX Equity LOGN SW Equity SCHN SW Equity UNAX VX Equity
CLN VX Equity LONN VX Equity SCI SW Equity VATN SW Equity
CSGN VX Equity LUKN SW Equity SCMN VX Equity VONN SW Equity
EGL SW Equity MASN SW Equity SEO VX Equity ZURN VX Equity
- the cost of equity was calculated assuming all businesses have same risk
premium since most operate world wide (therefore using risk premium
from DCF valuation of Swatch) and using provided Beta
- DR=Debt ratio, shows how different those companies are leveraged
Conclusion In absolute terms Swatch has been below the average, but above the median.
Relative comparision of the EVA-spread shows that Swatch has been very
well performing comparing to comparables (ignoring the outliner which has a
huge ROI for some reason).
Enhancements Swatch should surely use more leverage financing since it is still very
conservative with its debt ratio. Debt seems to be very cheap, provides tax
shelters, and the beta will in reality not go up as fast to compensate additional
risk. Therefore, WACC will come down and the EVA-spread can be increased.
5. Final Recommendation The DCF valuation and the regression with the Swiss market came to the conclusion that Swatch
is undervalued while the valuation relative to comparables has shown that Swatch is overvalued.
How can that be?
In my opinion, this seems to be very logical. The business of Swatch is cyclical. The last
recession is still not entirely over. Companies that sell luxury goods are therefore in general
undervalued, because not all investors are convinced that the economy will pick up again. Swatch
is in comparison with its peer less undervalued. However, looking at the overall market or at the
fundamental value (DCF) of Swatch, it is clearly undervalued. With the economy swinging back
and its growth rate, Swatch is worth more.
The stock is a BUY.
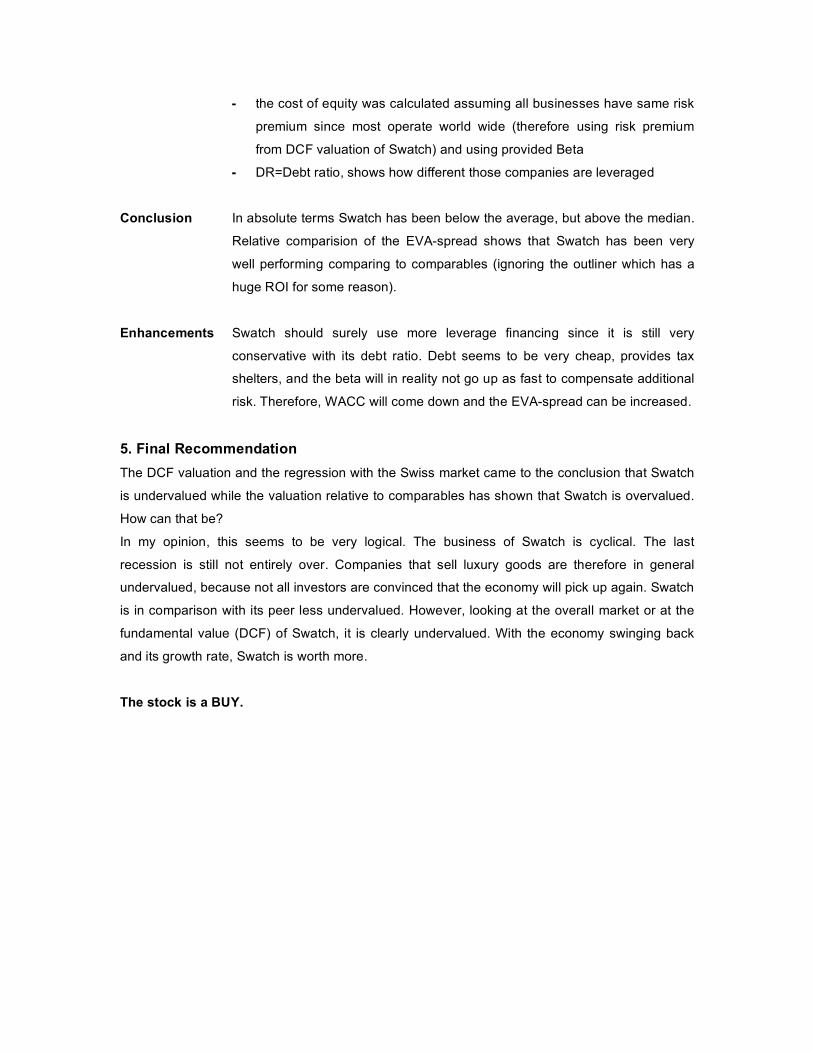
Sycamore Networks Valuation
Company Sycamore Networks, Inc. Symbol SCMR Sector Telecommunications Equipment Type negative earnings company DCF Valuation ModelFCFF, projections based on revenue Relative Valuation Value to Book Capital Special features Firm has no debt but $1bn in cash/ equivalents from the IPO
in boom times, therefore there is no risk of distress DCF Valuation Sycamore Networks manufactures switches for telecom carriers and is a young company, founded during the Hi-Tech boom at the end of the 90’s. The valuation model is based on revenue growth projections at a compounded rate of 15% for the next 10 years, which is around the expected growth of the telecommunications equipment sector. The firm’s revenues grew by 16% last year after suffering from large losses due to the earlier market crash. The management has taken heavy restructuring measures, cutting costs through lay offs and abandoning unprofitable product lines, leaving the firm very focused with a mature and competitive product line. Together with the rebounding market that translates into better operating margins and potential for initially better Sales/Capital ratios (please refer to the summary sheet in Appendix I). Within the sector analysts rank Sycamore Networks at number 7 and it seems optimistic but reasonable to expect it to grow with the industry. Sycamore has no debt and operating leases are not substantial, hence WACC equals the Cost of Equity with 16.34%. The Risk Premium is a weighted average according to the revenues in different countries. The calculated share price of $3.62 from the DCF valuation is close to the actual current price of $3.88. Sycamore appears slightly overvalued but one could argue that the difference is within the range of acceptable variation. More importantly, the market and the results of the DCF valuation agree that Sycamore’s value is dominated by its cash and marketable securities assets. The pure cash assets divided by number of shares yield a price of $3.54. The reason for this is that if the current market projections for telecommunications equipment are realistic then Sycamore cannot create much value itself relative to the amount of capital it holds. Hence it is not expected to produce a good Return on Capital any time soon. A great upside potential for the telecommunication market is not expected by us and the downside risk is that Sycamore keeps on burning cash which it could maintain for a long time. Based on that conclusion and the calculation results the recommendation tends to ‘sell’.

Relative Valuation Multiple: Value to Book Capital Sector: Telecommunications Equipment Number of comparable firms: 127 (source: compfirm.xls) Sycamore has negative earnings, even a negative EBITDA. Therefore, many multiples do not apply. Moreover, the whole sector is in trouble with most other firms losing money as well, yielding regressions with questionable explanatory power. The multiple that gave the best results is Value to Book Value of Capital. However, Sycamore appears undervalued by the factor of 4 (with an actual V/BV ratio of 1.05), which is unrealistic. The regression results are shown in Appendix II, showing a qualitative contradiction with a ROC that has a negative impact (other multiples and regressions were even worse). Interestingly, if one biases the sample by restricting it to the 45 positive earnings firms only, Sycamore should trade at 65% of its book value (Appendix II A). Given the analyst’s forecast of -8% revenues for the next five years that actually seems more realistic. But again revenues have a negative impact in the regression with is contradictory and does not yield a meaningful result if expected revenues are increased. The market regression (US) giving a V/BV ratio of 3 still translates into a share price of $11.06 as opposed to the current $3.88. A subjective valuation compared to the sector average of 6.9 also does not provide any justifiable basis for some story. The recommendation is therefore to ignore relative valuation results. EVA calculation The numbers used in the calculation are in million US$: Return On Capital
After Tax Op Income
EBIT(1-t) -59.2827
Depreciation 9.618
-49.6647
Book Value of Capital 962.989
ROC -5.16%
Cost of Capital 16.34%
EVA -207.061
Telecom Equipment Sector
ROC - WACC 4.88%
comparative EVA 46.994
The EVA for Sycamore in the most recent year is a negative $200 million compared with a positive EVA of $47 million that it should have produced with a sector average for Return on Capital and Cost of Capital. These results are consistent with Sycamore’s negative earnings. Summary Sycamore has a lot of Capital but the market does not present enough opportunities to invest it. Due to the current negative earnings Sycamore is reluctant to give cash back to shareholders and even thinks about using it for acquisitions. However, it is unclear whether a reasonable opportunity might come up. Since there is no debt Sycamore will definitely survive the negative earnings period but we do not expect it to produce a good Return on Capital in the future. It was not appropriate to carry out an option valuation on this firm since the firm has no debt and therefore does not have a default option to put the assets of the firm to debt-holders. Based on the DCF valuation the recommendation remains ‘sell’.
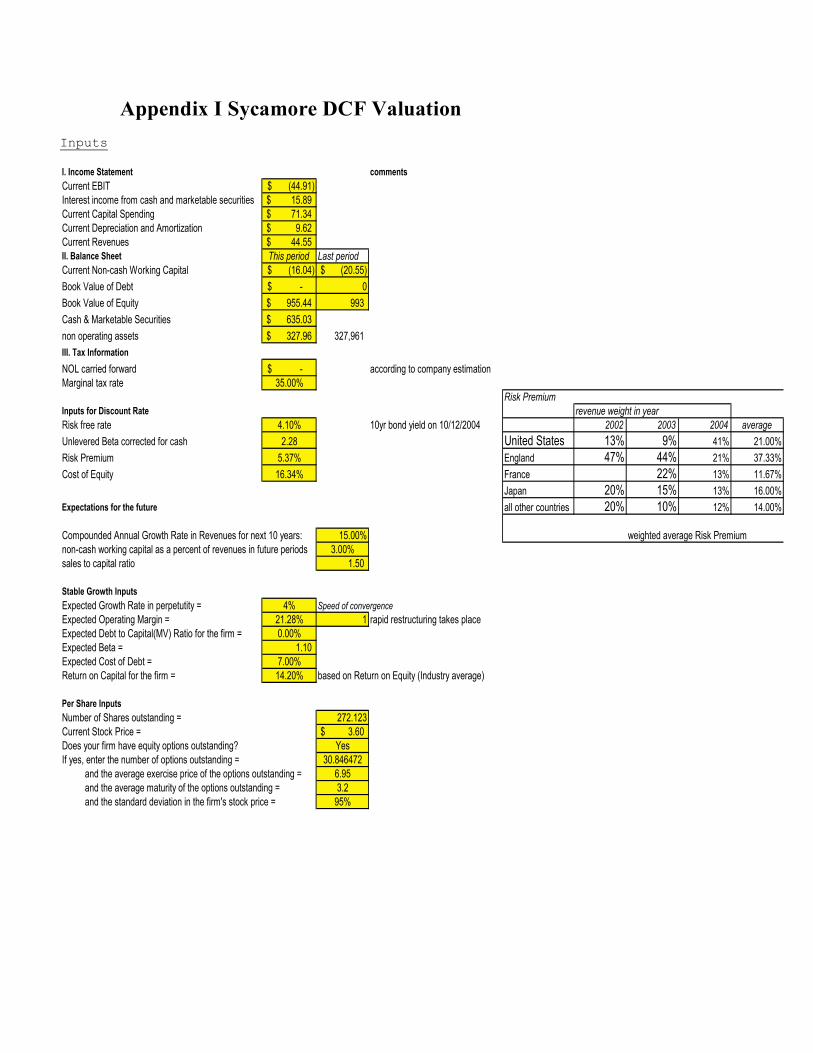
Appendix I Sycamore DCF Valuation Inputs
I. Income Statement comments
Current EBIT (44.91)$ Interest income from cash and marketable securities 15.89$ Current Capital Spending 71.34$ Current Depreciation and Amortization 9.62$ Current Revenues 44.55$ II. Balance Sheet This period Last period
Current Non-cash Working Capital (16.04)$ (20.55)$
Book Value of Debt -$ 0
Book Value of Equity 955.44$ 993
Cash & Marketable Securities 635.03$
non operating assets 327.96$ 327,961
III. Tax Information
NOL carried forward -$ according to company estimationMarginal tax rate 35.00%
Risk Premium
Inputs for Discount Rate revenue weight in year
Risk free rate 4.10% 10yr bond yield on 10/12/2004 2002 2003 2004 average
Unlevered Beta corrected for cash 2.28 United States 13% 9% 41% 21.00%
Risk Premium 5.37% England 47% 44% 21% 37.33%
Cost of Equity 16.34% France 22% 13% 11.67%
Japan 20% 15% 13% 16.00%
Expectations for the future all other countries 20% 10% 12% 14.00%
Compounded Annual Growth Rate in Revenues for next 10 years: 15.00% weighted average Risk Premiumnon-cash working capital as a percent of revenues in future periods 3.00%sales to capital ratio 1.50
Stable Growth Inputs
Expected Growth Rate in perpetutity = 4% Speed of convergence
Expected Operating Margin = 21.28% 1 rapid restructuring takes placeExpected Debt to Capital(MV) Ratio for the firm = 0.00%Expected Beta = 1.10 Expected Cost of Debt = 7.00%Return on Capital for the firm = 14.20% based on Return on Equity (Industry average)
Per Share Inputs
Number of Shares outstanding = 272.123Current Stock Price = 3.60$ Does your firm have equity options outstanding? YesIf yes, enter the number of options outstanding = 30.846472 and the average exercise price of the options outstanding = 6.95 and the average maturity of the options outstanding = 3.2 and the standard deviation in the firm's stock price = 95%

Valuation Summary
Sycamore Networks
The Valuation
PV of FCFF during high growth phase = (27)$ PV of Terminal Value = 83$ Value of Operating Assets of the firm = 56$ Value of Cash & Non-operating assets= 962.99$ Value of Equity = 1,019$ - Value of Equity Options = 33$ Value of Equity in Common Stock = 985$ Treasury Stock ApproachValue of Equity per share = 3.62$ 4.07$
Revenues $53 $64 $77 $92 $111 $129 $144 $158 $171 $181 $189EBIT -$30 -$11 $2 $11 $18 $24 $29 $33 $36 $38 $40EBIT(1-t) -$30 -$11 $2 $11 $18 $19 $19 $21 $23 $25 $26 - Reinvestment $6 $7 $9 $10 $12 $12 $10 $10 $8 $7 $7FCFF -$36 -$18 -$7 $0 $6 $8 $9 $12 $15 $18 $19
Detailed Calculations
Base 1 2 3 4 5 6 7 8 9 10 Terminal YearRevenue Growth Rate 20.00% 20.00% 20.00% 20.00% 20.00% 16.00% 12.00% 10.00% 8.00% 6.00% 4.10%
Revenues $44.547 $53.456 $64.148 $76.977 $92.373 $110.847 $128.583 $144.013 $158.414 $171.087 $181.352 $188.788
Operating Margin -133.08% -55.90% -17.31% 1.99% 11.64% 16.46% 18.87% 20.08% 20.68% 20.98% 21.13% 21.28%EBIT -$59.283 -$29.881 -$11.102 $1.530 $10.748 $18.245 $24.265 $28.913 $32.760 $35.897 $38.324 $40.180Taxes $0.000 $0.000 $0.000 $0.000 $0.000 $0.000 $4.831 $10.120 $11.466 $12.564 $13.413 $14.063EBIT(1-t) -$59.283 -$29.881 -$11.102 $1.530 $10.748 $18.245 $19.434 $18.794 $21.294 $23.333 $24.910 $26.117 + Depreciation $9.618 $11.542 $13.850 $16.066 $17.994 $19.793 $21.377 $22.659 $23.588 $24.555 $25.562 $26.610 - Capital Expenditures $71.341 $17.214 $20.657 $24.234 $27.796 $31.555 $32.668 $32.483 $32.757 $32.624 $32.098 $33.744 - Chg WC $4.505 $0.267 $0.321 $0.385 $0.462 $0.554 $0.532 $0.463 $0.432 $0.380 $0.308 $0.223FCFF -$125.511 -$35.821 -$18.230 -$7.023 $0.484 $5.928 $7.610 $8.507 $11.693 $14.884 $18.067 $18.760NOL $0.000 $29.881 $40.983 $39.453 $28.705 $10.461 $0.000 $0.000 $0.000 $0.000 $0.000 $0.000Terminal Value $317.736
Cost of Capital Calculations
Tax Rate 0.00% 0.00% 0.00% 0.00% 0.00% 0.00% 19.91% 35.00% 35.00% 35.00% 35.00% 35.00%Debt Ratio 0.00% 0.00% 0.00% 0.00% 0.00% 0.00% 0.00% 0.00% 0.00% 0.00% 0.00% 0.00%Beta 2.28 2.28 2.28 2.28 2.28 2.28 2.04 1.81 1.57 1.34 1.10 1.10 Cost of Equity 16.34% 16.34% 16.34% 16.34% 16.34% 16.34% 15.08% 13.81% 12.54% 11.27% 10.00% 10.00%Cost of Capital 16.34% 16.34% 16.34% 16.34% 16.34% 16.34% 15.08% 13.81% 12.54% 11.27% 10.00% 10.00%
Summary Output

Appendix II Sycamore Regression Results of multiple regression for Value/BV of Capital
Summary measures
Multiple R 0.5694
R-Square 0.3242
Adj R-Square 0.1975
StErr of Est 6.1879
ANOVA Table
Source df SS MS F p-value
Explained 3 293.8922 97.9641 2.5585 0.0915
Unexplained 16 612.6365 38.2898
Regression coefficients
Coefficient Std Err t-value p-value Lower limit Upper limit
Constant 5.8474 2.4783 2.3594 0.0313 0.5936 11.1012
ROC -7.2771 3.0945 -2.3516 0.0318 -13.8372 -0.7171
Expected Growth in Revenues: next 5 years 26.0711 16.2601 1.6034 0.1284 -8.3989 60.5410
Market Debt to Capital -16.4406 12.8402 -1.2804 0.2187 -43.6606 10.7793 Sycamore Value/BV of Capital ROC Expected Growth in Revenues: next 5 years Market Debt to Capital
1.05 -4.53% -8.00% 0.00%
expected V/BV from sector
regression 4.09
expected V/BV from market
regression: 3.04
average V/BV in sector 6.89
Appendix II A: Sample of positive earnings firms Results of multiple regression for Value/BV of Capital
Summary measures
Multiple R 0.8453
R-Square 0.7145
Adj R-Square 0.6366
StErr of Est 3.3789
ANOVA Table
Source df SS MS F p-value
Explained 3 314.2392 104.7464 9.1747 0.0025
Unexplained 11 125.5850 11.4168
Regression coefficients
Coefficient Std Err t-value p-value Lower limit Upper limit
Constant 1.3709 1.6581 0.8268 0.4259 -2.2785 5.0203
ROC 28.4040 6.3706 4.4586 0.0010 14.3823 42.4256
Expected Growth in Revenues: next 5 years -7.0592 12.6620 -0.5575 0.5883 -34.9281 20.8097
Market Debt to Capital 4.3825 11.8829 0.3688 0.7193 -21.7717 30.5366 SCMR expected V/BV = 0.65

PIXAR VALUATION Background Pixar was formed in 1986 and is a leading digital animation studio. The Company’s objective is “to create, develop and produce computer-animated feature films with heartwarming stories and memorable characters that appeal to audiences of all ages.” To date, the company has created and produced six full-length animated feature films: Toy Story, A Bug's Life, Toy Story 2, Monsters, Inc., Finding Nemo, and The Incredibles, which were marketed and distributed by The Walt Disney Company. The first five films are among the top eleven grossing animated films of all time, with combined worldwide box office receipts of more than $2.5 billion. The company is expected to continue growing during the next couple of years. Valuation Methodology.
• Pixar will be valued in US dollars using a 2-stage Free Cash Flow to Firm (FCFF) model. • The calculation will be performed using nominal values and rates.
Risk Free Rate The current yield on the 10 year US Treasury bond is 3.98%. This is the risk free rate used in calculating the cost of equity. Risk Premium Pixar operates in the US, and the geometric average of risk premium in the US from 1928 to 2003 is 4.82%. Market and Book Value of Equity and Debt Equity The book value of equity was given in the Pixar financial statements as $1 119 million. The market value of equity December 10 2004 was $4 779 million (56.901 million shares outstanding; stock price: $83.98). Debt Interest expenses 2,647
Average maturity for the debt 5
Pre-tax cost of debt 4.33%
Present value of annuity 11,676
Book value of debt 61,133
Present value of the book value of the debt 49,457
Estimated market value of conventional debt 61,133
Debt value of opearting leases 1,325
Market value of outstanding debt 62,458 The estimated market values of debt and equity gives Pixar a debt/equity ratio of 1.31% ($4779/$62.458). Compared to the industry average of 20.86%, Pixar is moderately levered.

Beta Calculation The beta of Pixar was estimated by analyzing betas of comparable firms. Pixar’s operations in the computer software industry were treated separately from the main operations in the entertainment industry. First, unlevered betas corrected for cash were calculated. Second, estimated enterprise values were used at weights in order to find Pixar’s total unlevered beta. The unlevered beta is estimated to be 1.107. Levered and unlevered betas by
industry
Average
Beta
Market D/E
Ratio Tax Rate
Unlevered
Beta
Cash/Firm
Value
Corrected
for cash
Entertainment 1.27 26.37% 17.16% 1.04 3.80% 1.08
Computer softw are 1.83 3.58% 9.95% 1.77 13.09% 2.04
Pixar competes in two industries Revenues EV / Sales
Enterprise
Value
Firm Value
Porportion
Unlevered
Beta
Entertainment 316,566 2.82 892,716 97.1% 1.08
Computer softw are 7,537 3.52 26,530 2.9% 2.04
Pixar 919,246 100% 1.107
Using the market values of debt and equity, Pixar’s levered beta is 1.117: Unlevered beta 1.107
Marginal tax rate 35%
Equity, market value 4,853,204
Debt, market value 62,458
Levered beta 1.117 Cost of Equity Pixar’s cost of equity is simply calculated using the risk free rate of 3.98%, the risk premium of 4.82% and the bottom-up levered beta of 1.117. Using the CAPM formula the Cost of Equity for Pixar is 9.28%. Cost of Debt Given Pixar’s conservative leverage, the company default spread is almost insignificant. Also, there is no country default risk. EBT 269,915
Interest expenses 2,647
EBIT 272,562
Operating lease expense 846
Interest expense 2,647
Interest coverage ratio 78.27
Riskfree rate 3.98%
Country default spread 0%
Company default spread (2004) 0.35%
Pre-tax cost of debt 4.33%

Firm Valuation – Two-Stage Free Cash Flow to Firm Model In order to value the firm, I have chosen to use a two-stage Free Cash Flow to Firm model (FCFF). I believe that Pixar will maintain its position as the leading digital animation studio for the next five years, before other companies start to catch up. Facing tougher competition in a more saturated market, it is likely that Pixar will mature during the five years that follows the high-growth period, and ultimately converge towards the industry averages regarding leverage and growth. The industry will also move towards the market (beta = 1). Input in the DCF-model: Length of High Grow th Period 5 Stable
Beta used for stock 1.12 1.00
Riskfree rate 3.98% 3.98%
Risk Premium 4.82% 4.82%
Cost of Equity 9.36% 8.80%
Cost of Debt 4.33% 4.33%
Tax Rate 36.86% 35.00%
After-tax Cost of debt 2.73% 2.81%
Equity/(Debt+Equity ) 79.14%
Debt/(Debt+Equity) 20.86%
Cost of Capital 7.55% Free Cash Flow to the Firm In order to calculate the FCFF, adjustments regarding leases and R&D expenses have to be made. Please see the appendix for detailed calculations. Leases
Average year life for assets 3
Reported operating lease expenses this year 846
Depreciation operating lease 442
Adjustments in operating income from operating leases 404
R&D
Reported R&D expense this year 8,963
Amortization R&D 7,933
Adjustments in operating income from R&D 1,030 These adjustments change Pixar’s operating income as follows: Operating income 259,547
Adjustments, operating leases 404
Adjustments, R&D 1,030
Adjusted operating income 260,981
Tax rate on income 36.9%
After-tax operating income 164,780
Ignored tax effect of R&D Expenditures 380
EBIT * (1-tax rate) 165,160 Growth, Return on Capital, and Reinvestment After an impressing growth in operating earnings of 136% and 84.3% during the past two years, Pixar is expected to continue growing fast, however at a downward sloping pace. To capture this

downward slope, the growth for the next five years is estimated by taking the natural log of (growtht / growtht-1). After the five-year long high-growth period, the growth is linearly scaled down towards the steady state rate of 3.98% (=risk free rate).
2002 2003 2004 2005 2006 2007 2008 2009
EBIT * (1-tax rate) 37,894 89,610 165,160
Grow th 136.5% 84.3% 52.1% 32.2% 19.9% 12.3% 7.6%
LN( ! Growth) 0.482 0.482 0.482 0.482 0.482 0.482 Pixar’s return on capital is at a relatively high 26.61% (data from Value Line), and I have assumed that Pixar is able to retain its current ROC for the next five years. However, as the company will gradually come under pressure from competitors, the ROC will slide down towards the stable-state cost of capital of 7.55%. This is higher than the industry average of 6.70%, but I’m assuming that Pixar doesn’t invest in negative NPV projects that will reduce the ROC below the cost of capital. Given the growth and the ROC, the next year’s reinvestment rate is 195.7%. To achieve high growth in the high-growth period, Pixar must reinvest more than its operating income, and is therefore forced to issue new debt. However, as the growth declines, there is less need for reinvestment, and the operating income will cover the reinvestment needs. Weighted Average Cost of Capital The weighted average cost of capital is calculated using the WACC-formula (rd * (1-t) * D/ (D+E) + re * E/ (D+E)). Because Pixar has to issue new debt to sustain the high growth, the leverage and thus the WACC will change continuously. I have assumed that Pixar eventually will move towards the industry average capital structure with an equity ratio of ca. 79%. This is a relatively conservative leverage, and I have therefore supposed that Pixar maintains its current credit rating and that the cost of debt remains stable. Valuing Options and Value of Equity per share Pixar’s outstanding options were valued using the Black-Scholes option pricing model. The inputs below were taken from the latest quarterly report, filed November 12, 2004. Stock Price 83.98
Strike Price 27.12
Adjusted S 82.95
Expiration (in years) 5.00
Number of options outstanding 2,771
Number of shares outstanding 56,901
T-Bond rate 3.98%
Standard deviation in stock prices 39.00%
Variance 0.1521
Annualized dividend yield 0.00%
Div. Adj. interest rate 3.98%
d1 1.946151
N (d1) 0.974182
d2 1.074084
N (d2) 0.858607
Value per option 61.72
Value of all options outstanding 171,030

The value of all options outstanding will be subtracted from the equity, reducing the equity claims on the firm and thus the share price. Estimating the Market Value of Equity per Share The DCF-valuation below indicates that Pixar is slightly overvalued. Length of High Grow th Period 5 Stable
Beta used for stock 1.12 1.00
Riskf ree rate 3.98% 3.98%
Risk Premium 4.82% 4.82%
Cost of Equity 9.36% 8.80%
Cost of Debt 4.33% 4.33%
Tax Rate 36.86% 35.00%
Af ter-tax Cost of debt 2.73% 2.81%
Equity/(Debt+Equity ) 79.14%
Debt/(Debt+Equity) 20.86%
Cost of Capital 7.55%
Grow th Rate 52.06% 3.98%
Return on Capital 7.55%
Reinvestment Rate 52.71%
Current 1 2 3 4 5 6 7 8 9 10 Terminal
Expected Growth Rate 52.1% 32.2% 19.9% 12.3% 7.6% 6.9% 6.1% 5.4% 4.7% 3.98% 3.98%
Return on Capital 26.61% 26.6% 26.6% 26.6% 26.6% 26.6% 22.8% 19.0% 15.2% 11.4% 7.55% 7.55%
Reinvestment Rate 195.7% 120.8% 74.6% 46.1% 28.5% 30.1% 32.3% 35.7% 41.4% 52.71% 52.71%
EBIT * (1 - tax rate) 165,160 251,147 331,900 397,828 446,645 480,486 513,434 544,949 574,478 601,474 625,413 650,304
Reinvestment 491,381 401,056 296,971 205,972 136,811 154,435 176,175 205,140 248,752 329,637 342,757
Free Cash Flow to Firm -240,234 -69,155 100,856 240,673 343,675 358,999 368,774 369,338 352,722 295,776 8,611,976
Equity 4,778,546 4,778,546 4,778,546 4,778,546 4,778,546 4,778,546 4,637,996 4,497,445 4,356,895 4,216,345 4,075,795 4,075,795
Debt 62,458 302,693 371,848 371,848 371,848 371,848 512,398 652,948 793,499 934,049 1,074,599 1,074,599
Equity/(Equity+Debt) 98.7% 94.0% 92.8% 92.8% 92.8% 92.8% 90.1% 87.3% 84.6% 81.9% 79.1% 79.14%
Cost of Capital 9.28% 8.97% 8.88% 8.88% 8.88% 8.88% 8.60% 8.33% 8.06% 7.80% 7.55% 7.55%
Cumulated Cost of Capital 108.97% 118.65% 129.19% 140.67% 153.17% 166.35% 180.20% 194.73% 209.93% 225.78% 242.83%
Present Value -220,463 -58,285 78,067 171,092 224,379 215,816 204,645 189,664 168,020 131,001 3,546,506
Percentage of value of operating assets -4.7% -1.3% 1.7% 3.7% 4.8% 4.6% 4.4% 4.1% 3.6% 2.8% 76.26%
Present Value of FCFF in high grow th phase 1,103,937
Present Value of Terminal Value of Firm 3,546,506
Value of operating assets of the f irm 4,650,443
Value of Cash, Marketable Securities & Non-operating assets 27,545
Value of Firm 4,677,988
Market Value of outstanding debt 62,458
Market Value of Equity 4,615,530
Value of Equity in Options 171,030
Value of Equity in Common Stock 4,444,500
Market Value of Equity/share 78.11
Price per share in the market 83.98
Recommendation SELL! Recommendation: SELL!! Relative Valuation Pixar is a high-growth company, and I have therefore chosen the PEG-ratio for the relative valuation. Independent variables The sample contains 25 firms, and three independent variables have been used in the regression. Given the relatively small sample, one could argue that the regression shouldn’t contain more than two independent variables (maximum one for every 10 stocks in the sample). However, the model’s explanatory power is increased when including three independent variables.
• FCFE/Net Income. The FCFE has been calculated as follows: FCFE = (FCFF - EBIT(1-t)) * (1-d) + Net Income
• LN (Expected growth in earnings per share for the next five years). I have used the natural log to achieve linearity between the PEG and Expected growth in EPS.

• Beta. Beta has been chosen as a proxy for cost of equity. Because there are more Value Line betas than Regression betas available, I have used the former to maximize the sample of firms in the regression.
The numbers below show the results from the regression. An R Square of 0.3693 is not great, but acceptable.
Regression Statistics
Multiple R 0.6077113
R Square 0.369313
Adjusted R Square 0.2792149
Standard Error 1.8473947
Observations 25
ANOVA
df SS MS F Significance F
Regression 3 41.968117 13.989372 4.0990087 0.0194618
Residual 21 71.670212 3.4128672
Total 24 113.63833
CoefficientsStandard Error t Stat P-value Lower 95% Upper 95% Lower 95.0%Upper 95.0%
Intercept 3.5246823 3.8291306 0.9204915 0.3677699 -4.4384307 11.487795 -4.4384307 11.487795
FCFE/Net Income 0.3127159 1.6152751 0.1935991 0.8483501 -3.0464326 3.6718644 -3.0464326 3.6718644
Value Line Beta -2.8021617 1.7575327 -1.5943725 0.1257934 -6.457151 0.8528275 -6.457151 0.8528275
LN(Grow th in EPS) -1.0754337 1.0141077 -1.0604729 0.3009746 -3.184386 1.0335186 -3.184386 1.0335186
Using the updated data on earnings and growth from the DCF-valuation, Pixar’s predicted PEG is 2.25, compared to 2.08 in the market.
Coefficients Pixar
Intercept 3.5246823
FCFE/Net Income 0.3127159 1.000
Levered beta -2.802162 1.117
Expected grow th in EPS the next f ive years 23.8%
LN(Grow th in EPS) -1.075434 -1.44
Predicted PEG 2.25
This indicates that Pixar is undervalued:
Earnings 170.42
Expected grow th in EPS the next f ive years 23.8%
Predicted share price 91.35
Price per share in the market 83.98
Recommendation BUY!
(Expected growth = (The product of the growth rates during the five-year period)^0.2 – 1). According to the relative valuation, Pixar is slightly undervalued in the market; the stock should sell for $91.35. Recommendation: BUY!!

Value Enhancement The analysis below shows that Pixar are investing in good projects Return on capital 26.61%
Cost of capital 9.28%
Spread 17.33%
Book value of capital 1,180,484
Economic value added 204,600 Compared to the Entertainment industry, the impression of Pixar as a well-managed firm is fortified: Entertainment Industry
Return on capital 6.70%
Cost of capital 8.92%
Spread -2.22% Where Pixar’s current ROC is 17.33% above its cost of capital, the entertainment industry is on average loosing money on its investments; the ROC is 2.22% below the cost of capital. Conclusion The results from the DCF valuation demonstrate that the market overvalues Pixar with ca. $4 per share, or about 7.5%. On the other hand, the relative valuation indicates that Pixar is undervalued by about $7.4 (8.8%). The Value Enhancement analysis suggests that Pixar invests in great projects and creates much more value than the entertainment industry on average. So, which conclusion should be drawn from these ambiguous results? Even though the relative valuation and the EVA-analysis propose a BUY-recommendation, I’m not completely convinced. All of Pixar’s six films have been big blockbusters, but it is unlikely that the future will bring the same impressing amount of home runs. Today, animation films are regarded as something new and exiting. However, I don’t think this will be the case in a few years, and Pixar’s movies will probably face stiffer competition both from other animation films and from “normal” movies. On the other hand, I don’t think the results from the DCF valuation are strong enough to recommend “SELL.” To sum up, my recommendation is HOLD.

Appendix
Future minimum lease payments PV at 6%
2004 882 845
2005 314 288
2006 93 82
2007 74 62
After 2007 58 47
Debt value of leases 1,325
Conventional debt 61,133
Debt value of opearting leases 1,325
Debt outstanding at Pixar 62,458
Convert operating leases into debt
Assumed life of R&D 3
Year
R&D
expense
Amort.
this year
2004 15,095 1.00 15,095
2003 8,963 0.67 5,975 2,988
2002 8,497 0.33 2,832 2,832
2001 6,339 0.00 0 2,113
Total 23,903 7,933
Tax effect on R&D expensing 380
Capitalize R&D expenditures
Unamortized protion
Related Documents