SEMI-ANNUAL REPORT | MARCH 31, 2022 EQUITY FUNDS Global Equity Thornburg Global Opportunities Fund International Equity Thornburg International Equity Fund Thornburg Better World International Fund Thornburg International Growth Fund Thornburg Developing World Fund U.S. Equity Thornburg Small/Mid Cap Core Fund Thornburg Small/Mid Cap Growth Fund Multi Asset Thornburg Investment Income Builder Fund Thornburg Summit Fund

Welcome message from author
This document is posted to help you gain knowledge. Please leave a comment to let me know what you think about it! Share it to your friends and learn new things together.
Transcript
SEMI-ANNUAL REPORT | MARCH 31, 2022
EQUITY FUNDSGlobal EquityThornburg Global Opportunities Fund
International EquityThornburg International Equity FundThornburg Better World International FundThornburg International Growth FundThornburg Developing World Fund
U.S. EquityThornburg Small/Mid Cap Core FundThornburg Small/Mid Cap Growth Fund
Multi AssetThornburg Investment Income Builder FundThornburg Summit Fund


Thornburg Equity FundsSemi-Annual Report | March 31, 2022
Table of Contents
Letter to Shareholders . . . . . . . . . . . . . . . . . . . . . . . . . . . . . . . . . . . . . . . . . . . . . . . . . . . . . . . . . . . . . . . . . . . . . 4
Performance Summary . . . . . . . . . . . . . . . . . . . . . . . . . . . . . . . . . . . . . . . . . . . . . . . . . . . . . . . . . . . . . . . . . . . . 11
The Dividend Landscape . . . . . . . . . . . . . . . . . . . . . . . . . . . . . . . . . . . . . . . . . . . . . . . . . . . . . . . . . . . . . . . . . . . 22
Fund Summary . . . . . . . . . . . . . . . . . . . . . . . . . . . . . . . . . . . . . . . . . . . . . . . . . . . . . . . . . . . . . . . . . . . . . . . . . . 24
Schedule of Investments
Thornburg Global Opportunities Fund . . . . . . . . . . . . . . . . . . . . . . . . . . . . . . . . . . . . . . . . . . . . . . . . . . . . . . . . 35
Thornburg International Equity Fund . . . . . . . . . . . . . . . . . . . . . . . . . . . . . . . . . . . . . . . . . . . . . . . . . . . . . . . . . 38
Thornburg Better World International Fund . . . . . . . . . . . . . . . . . . . . . . . . . . . . . . . . . . . . . . . . . . . . . . . . . . . . . 42
Thornburg International Growth Fund . . . . . . . . . . . . . . . . . . . . . . . . . . . . . . . . . . . . . . . . . . . . . . . . . . . . . . . . 46
Thornburg Developing World Fund . . . . . . . . . . . . . . . . . . . . . . . . . . . . . . . . . . . . . . . . . . . . . . . . . . . . . . . . . . 49
Thornburg Small/Mid Cap Core Fund . . . . . . . . . . . . . . . . . . . . . . . . . . . . . . . . . . . . . . . . . . . . . . . . . . . . . . . . 53
Thornburg Small/Mid Cap Growth Fund. . . . . . . . . . . . . . . . . . . . . . . . . . . . . . . . . . . . . . . . . . . . . . . . . . . . . . . 56
Thornburg Investment Income Builder Fund . . . . . . . . . . . . . . . . . . . . . . . . . . . . . . . . . . . . . . . . . . . . . . . . . . . . 59
Thornburg Summit Fund . . . . . . . . . . . . . . . . . . . . . . . . . . . . . . . . . . . . . . . . . . . . . . . . . . . . . . . . . . . . . . . . . 69
Statements of Assets and Liabilities . . . . . . . . . . . . . . . . . . . . . . . . . . . . . . . . . . . . . . . . . . . . . . . . . . . . . . . . . . . 76
Statements of Operations . . . . . . . . . . . . . . . . . . . . . . . . . . . . . . . . . . . . . . . . . . . . . . . . . . . . . . . . . . . . . . . . . . 80
Statements of Changes in Net Assets . . . . . . . . . . . . . . . . . . . . . . . . . . . . . . . . . . . . . . . . . . . . . . . . . . . . . . . . . . 84
Notes to Financial Statements . . . . . . . . . . . . . . . . . . . . . . . . . . . . . . . . . . . . . . . . . . . . . . . . . . . . . . . . . . . . . . . 89
Financial Highlights . . . . . . . . . . . . . . . . . . . . . . . . . . . . . . . . . . . . . . . . . . . . . . . . . . . . . . . . . . . . . . . . . . . . . . . 112
Expense Example . . . . . . . . . . . . . . . . . . . . . . . . . . . . . . . . . . . . . . . . . . . . . . . . . . . . . . . . . . . . . . . . . . . . . . . . 130
Other Information . . . . . . . . . . . . . . . . . . . . . . . . . . . . . . . . . . . . . . . . . . . . . . . . . . . . . . . . . . . . . . . . . . . . . . . . 132
Trustees’ Statement to Shareholders . . . . . . . . . . . . . . . . . . . . . . . . . . . . . . . . . . . . . . . . . . . . . . . . . . . . . . . . . . 133
Investments carry risks, including possible loss of principal. Additional risks may be associated with investments outside the United States, especially in emerging markets, including currencyfluctuations, illiquidity, volatility, and political and economic risks. Investments in small- and mid-capitalization companies may increase the risk of greater price fluctuations. Portfoliosinvesting in bonds have the same interest rate, inflation, and credit risks that are associated with the underlying bonds. The value of bonds will fluctuate relative to changes in interest rates,decreasing when interest rates rise. A short position will lose value as the security’s price increases. Theoretically, the loss on a short sale can be unlimited. Investments in derivatives aresubject to the risks associated with the securities or other assets underlying the pool of securities, including illiquidity and difficulty in valuation. Please see the Funds’ prospectus for adiscussion of the risks associated with an investment in the Funds. Investments in the Funds are not FDIC insured, nor are they deposits of or guaranteed by a bank or any other entity.
Thornburg Equity Funds Semi-Annual Report | 3

Dear Shareholder:
A one-time colleague of mine from decades ago, who wasprone to malapropisms, was also a Yogi Berra-esque sourceof wisdom at times. These days, I recall one of hispronouncements around the time of the dot.com bubbleand crash: “Just when you think you’re out of the woods,you go right back into the soup.” This seems to beappropriate relative to our emergence from a Covid-dominated recession into a new world that hinges onmassively increasing price pressures and a geopoliticalworst-case-scenario in Russia/Ukraine. I don’t expect thevolatility that we’ve seen in the last six months to abate andgiven somewhat elevated risk asset prices (though deflatedfrom my last letter to you), markets remain vulnerable toshocks. High inflation has been one of those shocks, and itwill take some time to resolve factors contributing to thatinflation, such as supply-chain challenges, home priceappreciation effects on measured shelter costs, and laborcost and availability issues. Ultimately, we expect variouscentral banks across the globe, certainly including theFederal Reserve, to be forced to make a choice betweencontaining inflation at the expense of employment and losingcontrol of inflation expectations in the name of supporting ahotter economy. It’s a tightrope walk without a net and justone of many elements of uncertainty in the aftermath ofCovid.
In recent weeks, we’ve seen yields on most fixed incomesecurities rise dramatically. Combined with the very lowstarting point on income return, the past quarter has beenone of the worst in history for those markets. Because manyarguments around valuation in equities hinged on the TINAargument (“There Is No Alternative”), and because theearnings yield (essentially the inverse of the Price/Earningsratio) on equities far surpassed the yield on bonds, there hasbeen a crossover effect into other risky assets. While weview this as only part of the overall valuation conversation,any time investors experience outsized moves in majormarkets, it’s worth taking a deeper dive. In this case, weexpect that the dramatic shift of policymakers’ approachfrom stimulating growth to containing price pressures maydrain liquidity and leave some market participants feeling likea fish out of water.
As in any environment, we will be focused on you, ourclients, as our most important constituency. Though there isnever a guarantee that we will be able to navigate theevolving marketplace as well as we may have before, I havea confidence born of experience that our unsiloed, globalapproach to active investment management gives us adistinct advantage. It is always the case that with challenge
comes opportunity, and I have watched our portfoliosperform well over the years when difficult situations arise.We continue to see that no market is an island, and theeffects from actions somewhere in the world are felteverywhere. Our process, which focuses on thisinterconnection through the development of a collaborativeand deeply informed perspective, is designed to thrive inthese investment conditions.
As we’ve discussed in the past, the story of Thornburg isone of consistent and deliberate evolution to meet yourneeds in the context of a changing business and investmentenvironment. As an example of this, we have completed theintegration of Environmental, Social, and Governance (ESG)considerations across our product set. While this does notmean that these considerations are part of our PrincipalInvestment Strategy for all portfolios, it does mean that,when evaluating potential investment opportunities, weevaluate the significance of a company’s ESGcharacteristics and their potential to impact the company’sinvestment performance. We believe that the integration ofthose ESG considerations into our investment process,alongside the other factors that we consider whenevaluating investments, is consistent with our long-terminvestment time horizon for both individual assets and wholeportfolios, as well as an indelible part of the marketlandscape.
I have great respect for other investment firms and there aremany good products that are available to investors. “It’stough to make predictions, especially, about the future” – anactual Yogi-ism – but we believe that in times like these, ourfirm’s broad perspective and collaborative, unsiloedapproach is our differentiator. These qualities are whatunderlie the excellent long-term outcomes we’ve been ableto deliver: we’re built to deliver on the promise of activemanagement.
Thank you so much for your time, and for your business.
Jason Brady, CFA
Portfolio ManagerCEO, President, andManaging Director
The matters discussed in this report may constitute forward-looking statements made pursuant to the safe harbor provisions of the Securities Litigation Reform Act of 1995. These includeany advisor or portfolio manager prediction, assessment, analysis or outlook for individual securities, industries, investment styles, market sectors and/or markets. These statements involverisks and uncertainties. In addition to the general risks described for each fund in its current prospectus, other factors bearing on these reports include the accuracy of the advisor’s orportfolio manager’s forecasts and predictions, the appropriateness of the investment strategies designed by the advisor or portfolio manager and the ability of the advisor or portfolio managerto implement their strategies efficiently and successfully. Any one or more of these factors, as well as other risks affecting the securities markets generally, could cause the actual results ofany fund to differ materially as compared to its benchmarks.
The views expressed are subject to change and do not necessarily reflect the views of Thornburg Investment Management, Inc. This information should not be relied upon as arecommendation or investment advice and is not intended to predict the performance of any investment or market.
Performance results of individual share classes will vary based on the fees and expenses associated with each share class, and may be higher or lower than other share classes within thesame Fund. Please see Performance Summary for performance results of each share class.
Letter to ShareholdersMarch 31, 2022 (Unaudited)
4 | Thornburg Equity Funds Semi-Annual Report

Thornburg Global Opportunities Fund |March 31, 2022 (Unaudited)
Dear Fellow Shareholder:
This letter highlights the results of the Thornburg GlobalOpportunities Fund for the six-month period endedMarch 31, 2022. Your Fund’s fiscal year ends on September30.
The Fund paid $5.14 per share of dividends with respect tothe Class I shares during the six-month period. Due to acombination of those dividend payments and modest overallchanges in the aggregate values of the Fund’s investments,the net asset value of the Class I shares decreased by $4.68per share ($39.49 to $34.81), bringing the total return for thesix-month period to +0.953%. This total returnapproximately matched the +0.958% return of the MSCI AllCountry World Index (the “Index”), the Fund’s benchmark,for the six-month period. Dividend amounts and returns forother classes of Thornburg Global Opportunities Fundshares varied slightly based on class-specific expenses.
We are now in the 16th year of managing Thornburg GlobalOpportunities Fund. From its inception on July 28, 2006through March 31, 2022, Thornburg Global OpportunitiesFund has outpaced the Index by an average margin of morethan 3.0% per year, resulting in a total cumulative returnsince inception of 363% (Class I shares) versus 198% forthe Index. Performance comparisons of Thornburg GlobalOpportunities Fund to the Index over various periods areshown below.
Most equities in the Fund’s portfolio recovered strongly inthe last 24 months from their March 2020 price troughs.Listed below in descending order are the 20 largest equityholdings of the Fund as of March 31, 2022, along with firstquarter 2022 and calendar year 2021 returns (the latter inparentheses). Returns are shown in U.S. dollars. We alsoshow the trailing five-year average annual revenue growthrates for these businesses through year end 2020 along withthe latest reported fiscal year ended September 30, 2021revenue growth of each company. Together, these firmscomprised approximately 71% of the Fund’s total assets, 18other equities comprised a total of approximately 25% ofFund assets, and near-cash debt comprised 4% of assets.Individual position sizes of the Fund’s top 20 positionsranged from 5% or more (Reliance Industries, Alphabet) toapproximately 2.5% for those shown near the bottom of thislist.
Name of Company
Q1’2022 &(Calendar 2021)
Returns(U.S. dollars)
5 Year AnnualRevenue GrowthRate 2015-20*/
Fiscal 2021Rev Growth
Reliance Industries
India-based conglomerate: chemicals, refining, #1 mobile telco and #1retailer in India
+9.2%; (+17.3%) +9.5%; +41.2%
Alphabet Inc “A”
(Google)Internet-based search & advertising, content, software applications, and datacenters.
-4.0%; (+65.3%) +19.6%; +41.1%
Samsung Electronics
Manufactures consumer & industrial electronic products; leading semiconductorproducer
-12.8%; (-10.4%) (per share) +5.0%; +18.1%
Total Energies SE
Global oil & gas producer and distributor and low carbon electricity supplier
+0.4%; (+26.2%) -3.6%; +33.6%
Capital One Financial
U.S. consumer-oriented commercial bank
-9.2%; (+49.3%) (per share) +7.6%; +10.7%
Barratt Developments,
PlcUK-based homebuilder with large land bank and no net debt
-32.2%; (+15.4%) +2.2%; +25.1%
NN Group
Netherlands-based life and casualty insurer
-6.2%; (+31.8%) +8.0%;+7.9%
Charles Schwab
CorporationU.S.-centric wealth management platform, securities brokerage, and bank
+0.5%; (+60.2%) (per share) +11.1%; +18.9%
Tesco
UK-based food & general merchandise retailer with > 4,000 stores &online presence
-7.6%; (+28.7%) +1.4%; +2.5%
Mineral Resources
Australian mining services, iron ore, and lithium mining firm
-3.0%; (+53.3%) +25.7%; +33.2%
AbbVie Inc.
Develops and sells pharmaceutical products
+21.0%; (+32.4%) +14.3%; +23.5%
China Telecom
China’s 2nd largest mobile & fixed line telecom and largest data center operator
+18.7%; (+25.9%) +3.5%; +12.7%
Citigroup
Multi-national banking & financial services firm
-10.9%; (+1.0%) (per share) +7.0%; -0.7%
TJX Companies
Leading off-price apparel & home fashion retailer with > 4,000 storesworldwide, TJ Maxx
-19.9%; (+12.8%) (per share) +3.1%; +51.1%
Meta Platforms
(Facebook)
-33.9%; (+23.1%) +36.3%; +38.9%
Global social networking, communications, internet-based content, andadvertising
Letter to Shareholders, Continued
March 31, 2022 (Unaudited)
Thornburg Equity Funds Semi-Annual Report | 5
* 2021, or latest fiscal year, if completed and reported during calendar 2021
Taiwan Semiconductor
Largest global contract semiconductor manufacturer
-5.7%; (+19.9%) +9.7%; +18.5%
Qorvo
U.S.-based manufacturer of integrated circuits for wireless communicationsdevices
-20.6%; (-5.9%) (per share) +7.9%; +27.2%
Micron Technology
Leading memory semiconductor manufacturer
-16.4%; (+24.2%) +15.6%; +5.1%
OCI NV
Producer & distributor of natural gas-based fertilizers and industrial chemicals
+35.6%; (+38.1%) +9.7%; +81.7%
Bank of Ireland
Diversified financial services provider serving Ireland and U.K. customers
+13.4%; (+40.7%) -4.3%; +13.4%
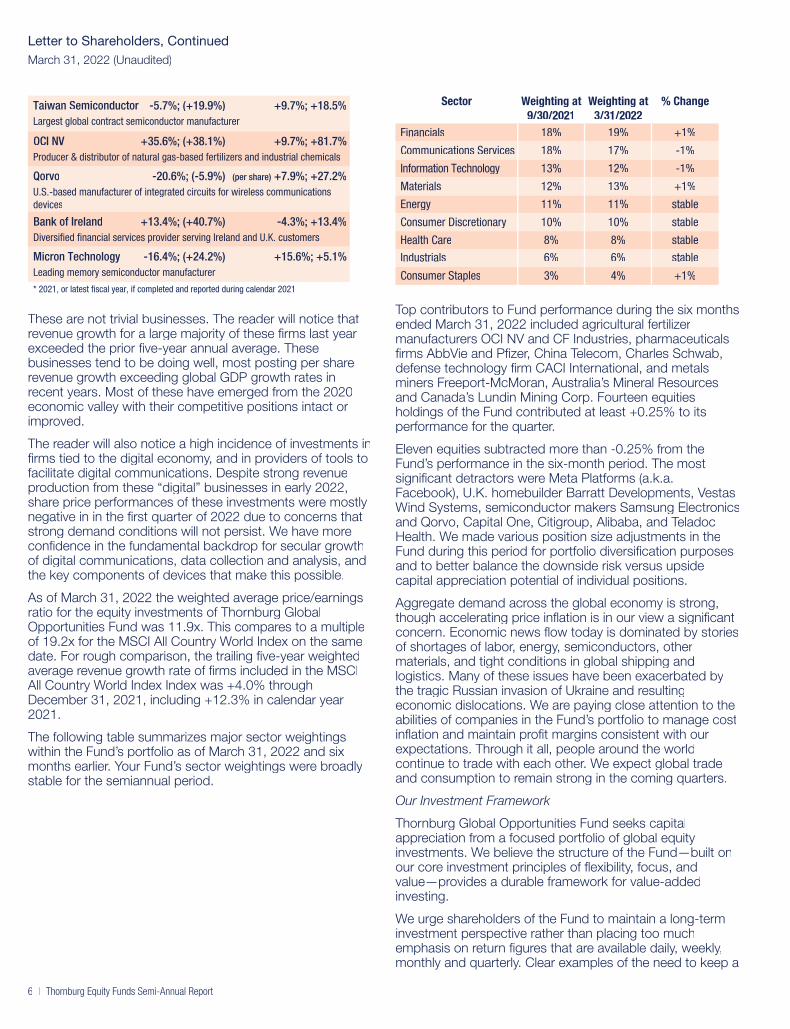
These are not trivial businesses. The reader will notice thatrevenue growth for a large majority of these firms last yearexceeded the prior five-year annual average. Thesebusinesses tend to be doing well, most posting per sharerevenue growth exceeding global GDP growth rates inrecent years. Most of these have emerged from the 2020economic valley with their competitive positions intact orimproved.
The reader will also notice a high incidence of investments infirms tied to the digital economy, and in providers of tools tofacilitate digital communications. Despite strong revenueproduction from these “digital” businesses in early 2022,share price performances of these investments were mostlynegative in in the first quarter of 2022 due to concerns thatstrong demand conditions will not persist. We have moreconfidence in the fundamental backdrop for secular growthof digital communications, data collection and analysis, andthe key components of devices that make this possible.
As of March 31, 2022 the weighted average price/earningsratio for the equity investments of Thornburg GlobalOpportunities Fund was 11.9x. This compares to a multipleof 19.2x for the MSCI All Country World Index on the samedate. For rough comparison, the trailing five-year weightedaverage revenue growth rate of firms included in the MSCIAll Country World Index Index was +4.0% throughDecember 31, 2021, including +12.3% in calendar year2021.
The following table summarizes major sector weightingswithin the Fund’s portfolio as of March 31, 2022 and sixmonths earlier. Your Fund’s sector weightings were broadlystable for the semiannual period.
Sector Weighting at9/30/2021
Weighting at3/31/2022
% Change
Financials 18%
Communications Services 18%
Information Technology 13%
Materials 12%
Energy 11%
Consumer Discretionary 10%
Health Care
Industrials
Consumer Staples
8%
6%
3%
19%
17%
12%
13%
11%
10%
8%
6%
4%
+1%
-1%
-1%
+1%
stable
stable
stable
stable
+1%
Top contributors to Fund performance during the six monthsended March 31, 2022 included agricultural fertilizermanufacturers OCI NV and CF Industries, pharmaceuticalsfirms AbbVie and Pfizer, China Telecom, Charles Schwab,defense technology firm CACI International, and metalsminers Freeport-McMoran, Australia’s Mineral Resourcesand Canada’s Lundin Mining Corp. Fourteen equitiesholdings of the Fund contributed at least +0.25% to itsperformance for the quarter.
Eleven equities subtracted more than -0.25% from theFund’s performance in the six-month period. The mostsignificant detractors were Meta Platforms (a.k.a.Facebook), U.K. homebuilder Barratt Developments, VestasWind Systems, semiconductor makers Samsung Electronicsand Qorvo, Capital One, Citigroup, Alibaba, and TeladocHealth. We made various position size adjustments in theFund during this period for portfolio diversification purposesand to better balance the downside risk versus upsidecapital appreciation potential of individual positions.
Aggregate demand across the global economy is strong,though accelerating price inflation is in our view a significantconcern. Economic news flow today is dominated by storiesof shortages of labor, energy, semiconductors, othermaterials, and tight conditions in global shipping andlogistics. Many of these issues have been exacerbated bythe tragic Russian invasion of Ukraine and resultingeconomic dislocations. We are paying close attention to theabilities of companies in the Fund’s portfolio to manage costinflation and maintain profit margins consistent with ourexpectations. Through it all, people around the worldcontinue to trade with each other. We expect global tradeand consumption to remain strong in the coming quarters.
Our Investment Framework
Thornburg Global Opportunities Fund seeks capitalappreciation from a focused portfolio of global equityinvestments. We believe the structure of the Fund—built onour core investment principles of flexibility, focus, andvalue—provides a durable framework for value-addedinvesting.
We urge shareholders of the Fund to maintain a long-terminvestment perspective rather than placing too muchemphasis on return figures that are available daily, weekly,monthly and quarterly. Clear examples of the need to keep a
Letter to Shareholders, Continued
March 31, 2022 (Unaudited)
6 | Thornburg Equity Funds Semi-Annual Report

longer-term investment perspective are illustrated bycomparing the trailing 12-month return of your Fund as ofMarch 31, 2021 [+74.18%] with the returns from the singlequarter ending March 31, 2020 [-24.8%]. In general, thebusinesses in your Fund’s portfolio have managed wellthrough the COVID-impacted quarters despite the initialimpact of the pandemic on their share prices. We continueto follow our core investment principles of flexibility, focus,and value, as we have since the Fund’s inception back in2006.
Thank you for being a shareholder of Thornburg GlobalOpportunities Fund.
Sincerely,
Brian McMahonPortfolio ManagerChief Investment Strategistand Managing Director
Miguel OleagaPortfolio Managerand Managing Director
Letter to Shareholders, Continued
March 31, 2022 (Unaudited)
Thornburg Equity Funds Semi-Annual Report | 7

Thornburg Investment Income Builder Fund |March 31, 2022 (Unaudited)
Dear Fellow Shareholder:
This letter highlights the results of Thornburg InvestmentIncome Builder Fund for the six-month period endedMarch 31, 2022. Your Fund’s fiscal year ended onSeptember 30.
The Fund paid ordinary dividends of $0.66 per Class I shareduring the six-month period. This was approximately 14.8%above the dividend of $0.54 for the prior year six-monthperiod ended March 31, 2021. Your Fund paid $1.287 perClass I share for the trailing four quarters, +33.6% versusthe prior year comparable period. The dividend per sharewas lower for Class A and class C shares, to account forvarying class specific expenses.
There were several drivers of your Fund’s higher dividendincome over the preceding year. We expect some, but notall, of these may repeat in calendar year 2022:
• Approximately 75% of the Fund’s equity investmentsincreased their dividends in calendar 2021. For now, wedo expect a significant majority of your Fund’s equityinvestments to pay higher dividends in their homecurrencies in 2022.
• Interest income was higher due to strong receipts fromasset backed securities and interest on tax rebatechallenges against several foreign governments. Thesechallenges succeeded in reclaiming prior year taxes thatwere improperly withheld, though it took court decisionsto resolve these claims. We do not expect a repeat ofthe interest earnings on tax rebates in 2022. It is tooearly in the year to know how much bond interest we willcollect in 2022. Bond yields have NOT caught up to theunfolding inflation picture, but macroeconomicfundamentals do appear to be setting up well for higherbond yields ahead.
• Foreign currencies were generally stronger versus theU.S. dollar when we received a significant portion of ourdividends from the Fund’s non-U.S. equity investments inthe first half of calendar 2021. For now, a stronger U.S.dollar is a high single digit percentage headwind todividends received in foreign currencies vis-à-vis thistime in 2021.
• Special non-recurring dividends from several of ourequity holdings relating to sales or spinoffs ofsubsidiaries, most notably Tesco and Daimler. Also,strong profits gave rise to enhanced distributions fromother investments late in calendar 2021. So far, we haveno special 2022 dividends to report. We do have somecandidates for such payments in the Fund’s portfolio.
The net asset value of the Fund’s Class I shares increasedby $0.71 per share ($23.13 to $23.84) during thesemiannual period and increased by $0.67 per share($23.17 to $23.84) for the year ending March 31, 2022.
The Fund’s Class I share total return of 5.88% for thesemiannual period exceeded its blended benchmark (75%MSCI World Index and 25% Bloomberg BarclaysU.S. Aggregate Bond Index), which returned 0.21% for theperiod. For the 12 months ended March 31, 2022 theFund’s Class I share return of +8.53% exceeded theblended benchmark return of +6.50%. Performancecomparisons of the Fund to its blended benchmark overvarious periods are shown below.
We believe the Fund is a bargain priced portfolio of incomeproducing assets that should be capable of generatingadditional price appreciation along with income in thecoming years. Listed below in descending order are the 25largest equity holdings in the Fund as of March 31, 2022,along with their Q1 2022 and 2021 calendar year shareprice changes in U.S. dollars. Also noted are dividend yieldsat closing March 31, 2022 stock prices. Together, these 25firms comprised 65% of the Fund’s total assets. Thirty-threeother equity investments comprised a total of approximately21% of Fund assets. Cash & approximately 200interest-bearing debt and hybrid securities comprisedaround 14% of assets. Individual position sizes of the 25equities range from 3.9% of Fund assets (Total Energies) toapproximately 1.4% for those shown near the bottom of thelist.
Name of CompanyDividend Yield
at March 31 Price
Total Energies SE
Produces, refines, transports, and markets oil and natural gas products globally
5.74%
Broadcom Inc.
Develops and markets digital and analogue semiconductors2.61%
Orange SA
Multi-national telecommunications network operator, home market isFrance Telecom
6.54%
AbbVie Inc.
Develops and sells pharmaceutical products
3.48%
Vodafone Group Plc
Multi-national telecommunications company
6.10%
Taiwan Semiconductor
ManufacturingLeading semiconductor chip foundry in the world, fabricating chips used inmany digital devices
1.84%
CME Group
Operates exchanges that trade futures contracts & options on rates, F/X,equities, commodities
2.94%
Deutsche Telekom
Multi-national telecommunications network operator, majority ownerof T-Mobile USA
3.78%
Samsung Electronics
Manufactures consumer & industrial electronic products; leadingsemiconductor producer
2.10%
Q1’2022 PriceChange &
Calendar 2021Year Price
Change +/- ($US)
+0.4%/+17.7%
-5.4/+52%
+10.7%/-9.9%
+19.7%/+26.4%
+7.9%/-8.0%
-6.2%/+17.8%
+4.1%/+25.5%
+1.7%/+9.0%
-12.8%/-11.6%
Letter to Shareholders, Continued
March 31, 2022 (Unaudited)
8 | Thornburg Equity Funds Semi-Annual Report

Tesco Plc
U.K.-based food retailer (paid 22% special dividend in 2021)
3.84%
Enel SpA
Generates, distributes, and sells electricity and gas in Southern Europe & Latam
6.26%
Assicurazioni Generali
Italy-based multinational life & property/casualty insurers
5.15%
NN Group
Netherlands based life and casualty insurer, with market leading positionsin Netherlands
5.43%
Regions Financial Corporation
U.S. regional banking group, mostly operating in Southeastern U.S. states
3.11%
Qualcomm Inc.
Develops and delivers key components for digital wirelesscommunications products
1.85%
Pfizer Inc.
Global health care company develops and sells medicines, vaccines,biologic therapies.
3.12%
Glencore Plc
Diversified miner & commodities trader
3.96%
Roche Holding
Global health care company develops and sells medicines and diagnostic tools
2.54%
Merck & Co.
Global health care company develops and sells medicines, vaccines,biologic therapies.
3.34%
Chimera Investment Corporation
U.S. listed mortgage REIT
10.98%
JP Morgan Chase & Co.
U.S. based global financial services conglomerate serving business &individuals
2.97%
Equitable Holdings Inc.
U.S. life insurer and asset manager (controls Alliance-Bernstein)
2.32%
UBS Group
Multinational wealth manager and investment bank
2.55%
LyondellBasell Industries
Manufacturer of plastics, chemicals, and fuel products
-7.6%/-1.9%
-17.2/-21.6%
+8.4%/+20.3%
-6.2%/+34.0%
+2.1%/+35.2%
-16.4%/+20.0%
-12.3%/+60.4%
+29.4%/+59.6%
-4.2%/+18.5%
+7.1%/-1.7%
-20.2%/+47.1%
-13.9%/+24.6%
-5.7%/+28.1%
+9.6%/+27.2%
+11.5/+0.6% 4.40%
China Mobile
World’s largest mobile telecommunications network operator, net cashbalance sheet
7.50%+14.6%/+6.6%
These equity holdings are not trivial businesses. These firmsoccupy important positions in their respective markets, andthey tend to be well capitalized. The reader will notice thatthese investments have delivered mixed share priceperformances for the last five quarters. Most have madereasonable progress in growing their bases of payingcustomers and distributable cash flows.
We have maintained your Fund’s exposure to dividendpaying firms that we believe have resilient businesses withstrong capital structures. We have reduced exposures toless resilient businesses, paying increased attention toexpected ability to generate cash in an inflationaryenvironment. Compare the sector allocations of the equitiesin the Fund from March 31, 2020 to March 31, 2022:
SectorMar 31
‘20Jun 30
’21Mar 31
‘21Jun 30
’20Dec 31
‘ 20
Financials 20.4% 23.4% 23.8% 25.5% 26.1%
CommunicationsSvcs
19.8% 22.5% 18.9% 19.9% 18.1%
InformationTechnology
11.7% 14.1% 20.3% 18.2% 17.5%
Health Care 14.1% 13.0% 11.2% 10.9% 11.3%
Utilities 5.2% 5.1% 3.8% 2.9% 4.6%
Dec 31’21
25.3%
14.6%
17.9%
13.1%
5.9%
Mar 31’22
24.9%
16.6%
16.1%
14.4%
6.3%
Materials 4.0% 3.6% 4.1% 4.3% 4.7%
ConsumerStaples
5.2% 3.5% 5.1% 6.0% 5.3%
Energy 8.6% 6.8% 4.8% 4.4% 4.6%
ConsumerDiscretionary
3.2% 3.5% 3.3% 4.0% 3.5%
Industrials 3.2% 0.5% 1.8% 1.4% 2.4%
Real Estate 4.1% 4.0% 2.5% 2.0% 1.7%
5.1%
5.7%
5.3%
3.7%
2.3%
0.8%
5.7%
4.7%
4.6%
3.5%
2.3%
0.8%
Sector Weights as of:
In the Fund’s portfolio, 14 equity investments contributedpositive returns of at least +0.25% to overall portfolioperformance during the semiannual period. These mostpositive contributors included pharmaceutical firms AbbVie,Pfizer and Roche Holding, commodities producer & traderGlencore, exchange operator CME Group, semiconductormanufacturers Broadcom and Qualcomm, Total Energies,and telecommunications network operators China Mobile,Orange, Vodafone Group, and China Telecom.
Seven of the Fund’s equity investments made negativecontributions to portfolio performance of below -0.25%during semiannual period ended March 31, 2022. Thesedetractors from Fund performance included Norilsk Nickel,JPMorgan Chase, Lukoil, Chimera Investment, SamsungElectronics, Siemens AG, and multi-national electric utilityENEL.
The Fund’s bond holdings delivered modest negative returnsduring the semiannual period. Six months of interestpayments from bonds could not overcome relatively sharpprice declines in bond values due to higher interest rates.Ten-year U.S. Treasury bond yields rose from 1.49% onSeptember 30, 2021 to 2.34% on March 31. Corporate andasset-backed bond prices declined in the March quarter asyield spreads to government bonds widened slightly. TheBloomberg U.S. Corporate High Yield Index rose from4.04% on September 30, 2021 to 6.01% on March 31 (yieldto lower of call price or maturity).
Readers of this commentary who are long time shareholdersof the Fund will recall that the interest-bearing debt portionof the Fund’s portfolio has varied over time, ranging fromless than 9% in 2015 to 45% on June 30, 2009. We tend toallocate more Fund assets to interest bearing debt whenyields are more attractive. On March 31, 86% of Fundassets were invested in equities, the remaining 14% ininterest bearing debt and near cash assets.
The outlook for bond returns is extremely cloudy. In ourview, the “real” yield on the 10-year U.S. Treasury note(market yield on 10-year UST of 2.9% minus core consumerprice index of 6.5%) is near a multi-decade low at -3.6%
Letter to Shareholders, Continued
March 31, 2022 (Unaudited)
Thornburg Equity Funds Semi-Annual Report | 9

using the March 2022 core consumer price index. Thisnegative real yield level differs materially from levels typicallyexperienced over the investment lifetimes of all readers ofthis commentary. The trailing 30-year average “real yield” on10-year U.S. Treasury notes was +1.77%, so the currentdifference versus historical average is extreme.
Aggregate demand across the global economy is strong,though high price inflation is a significant concern. Economicnews flow today is dominated by stories of shortages oflabor, energy, semiconductors, other materials, and tightconditions in global shipping and logistics. Many of theseissues have been exacerbated by the tragic Russianinvasion of Ukraine and resulting economic dislocations. Weare paying close attention to the abilities of companies in theFund’s portfolio to manage cost inflation and maintain profitmargins consistent with our expectations. Through it all,people around the world continue to trade with each other.We expect global trade and consumption to remain strongin the coming quarters.
We are optimistic about the future return potential ofThornburg Investment Income Builder Fund’s assets. Why?Virtually all the businesses in the Fund’s portfolio retain theirmarket positions providing important products and servicesthat generate cash flows to pay attractive dividends. Inaddition, we believe they are valued very attractively inrelation to their own histories and relative to other assets.The weighted average price/operating cash flow ratio for theFund’s equity portfolio tabulated using Bloomberg reportedresults was approximately 6.6x as of March 31, 2022,significantly below the 12.9x price/cash flow ratio of theMSCI All Country World Index. Income Builder’s 4.0%weighted average equity portfolio dividend yield significantlyexceeds the 2.2% dividend yield of the MSCI All CountryWorld Index. We believe investors will direct capital in the
coming quarters into dividend paying stocks, supportingprices of these.
The quarter ending March 31, 2022 was the 77th fullcalendar quarter since the inception of ThornburgInvestment Income Builder Fund in December 2002. In 57 ofthese quarters the Fund delivered a positive total return. TheFund has delivered positive total returns in 15 of its 19calendar years of existence. Importantly, ThornburgInvestment Income Builder Fund has delivered a compoundannualized total return of more than 9% since its inception,split between quarterly income distributions and share priceappreciation.
Thank you for being a shareholder of Thornburg InvestmentIncome Builder Fund.
Sincerely,
Brian McMahonPortfolio ManagerChief Investment Strategistand Managing Director
Jason Brady, CFA
Portfolio ManagerCEO, President, andManaging Director
Ben Kirby, CFA
Portfolio ManagerHead of Investmentsand Managing Director
Matt BurdettPortfolio Manager andManaging Director
Letter to Shareholders, Continued
March 31, 2022 (Unaudited)
10 | Thornburg Equity Funds Semi-Annual Report

Investment Goal andFund Overview
The Fund seeks long-term capitalappreciation by investing in equity and debtsecurities of all types from issuers around theworld.
A flexible mandate allows the Fund to pursuelong-term performance using a broadapproach to geography and marketcapitalization. The Fund invests primarily in abroad range of equity securities, includingcommon stocks, preferred stocks andpublicly traded real estate investment trusts,including smaller companies with marketcapitalizations less than $500 million.Investment decisions are based on domesticand international economic developments,outlooks for securities markets, interest ratesand inflation, the supply and demand fordebt and equity securities, and analysis ofspecific issuers.
See letter beginning on page 5 of this reportfor a discussion of factors affecting theFund’s performance for the reporting periodended March 31, 2022.
Performance SummaryMarch 31, 2022 (Unaudited)
GROWTH OF A HYPOTHETICAL $10,000 INVESTMENT
THORNBURG GLOBAL OPPORTUNITIES FUND FINAL VALUE
$0
$10,000
$20,000
$30,000
$40,000
$45,000
Jul-28-06 Dec-07 Dec-09 Dec-11 Dec-13 Dec-15 Dec-17 Dec-19 Mar-22
Thornburg Global Opportunities Fund, A Shares (with sales charge) $41,529MSCI AC World Net Total Return USD Index $29,766
AVERAGE ANNUAL TOTAL RETURNS
THORNBURG GLOBAL OPPORTUNITIES FUND 1-YR 3-YR 5-YR 10-YRSINCE
INCEPTION
Class A Shares (Incep: 7/28/06)Without sales charge 15.4.41% 92% 9.46 11.1% 6% 9.83%With sales charge -0.29 14.15%% 8.46 10.% 65% 9.51%
Class C Shares (Incep: 7/28/06)Without sales charge 3.6 15.02% 6% 8.6 10.32%4% 8.99%With sales charge 15.02.72% 6% 8.6 10.32%4% 8.99%
Class I Shares (Incep: 7/28/06) 14.75% 6.26% 9.79 11.5% 6% 10.28%Class R3 Shares (Incep: 2/1/08) 15.4.20% 67% 9 10..24% 99% 7.38%Class R4 Shares (Incep: 2/1/08) 15.78%4.30% 9 11.0.34% 9% 7.48%Class R5 Shares (Incep: 2/1/08) 14.74% 6.25% 9.79 11.55%% 7.93%Class R6 Shares (Incep: 4/10/17) 14.87% 6.40% - -- 9.87%MSCI AC World Net Total Return USD Index
(Since 7/28/06)13.75%7.28% 11.6 10.00%4% 7.21%
The matters discussed in this report may constitute forward-looking statements made pursuant to the safe harbor provisions of the Securities LitigationReform Act of 1995. These include any advisor or portfolio manager prediction, assessment, analysis or outlook for individual securities, industries,investment styles, market sectors and/or markets. These statements involve risks and uncertainties. In addition to the general risks described for each fundin its current prospectus, other factors bearing on these reports include the accuracy of the advisor’s or portfolio manager’s forecasts and predictions, theappropriateness of the investment strategies designed by the advisor or portfolio manager and the ability of the advisor or portfolio manager to implementtheir strategies efficiently and successfully. Any one or more of these factors, as well as other risks affecting the securities markets generally, could causethe actual results of any fund to differ materially as compared to its benchmarks.
The views expressed are subject to change and do not necessarily reflect the views of Thornburg Investment Management, Inc. This information should notbe relied upon as a recommendation or investment advice and is not intended to predict the performance of any investment or market.
Performance results of individual share classes will vary based on the fees and expenses associated with each share class, and may be higher or lower thanother share classes within the same Fund. Please see Performance Summary for performance results of each share class.
Performance data shown represents past performance and is no guarantee of future results. Investment return and principal value will fluctuate so shares,when redeemed, may be worth more or less than their original cost. Current performance may be lower or higher than quoted. For performance current tothe most recent month end, visit thornburg.com or call 800-847-0200. The performance information does not reflect the deduction of taxes that ashareholder would pay on distributions or the redemption of Fund shares. Returns reflect the reinvestment of dividends and capital gains. Class A shares aresold with a maximum sales charge of 4.50%. Class C shares are subject to a 1% CDSC for the first year only. There is no sales charge for Class I, R3, R4,R5 and R6 shares. As disclosed in the Fund’s most recent prospectus, the total annual fund operating expenses before fee waivers or expensereimbursements are as follows: A shares, 1.31%; C shares, 2.08%; I shares, 1.06%; R3 shares, 2.07%; R4 shares, 1.83%; R5 shares, 1.36%; R6 shares,1.00%. Thornburg Investment Management has contractually agreed to waive fees and reimburse expenses until at least February 1, 2023, for some of theshare classes, resulting in net expense ratios of the following: I shares, 0.99%;R3 shares, 1.50%; R4 shares, 1.40%; R5 shares, 0.99%; R6 shares, 0.85%.For more detailed information on fund expenses and waivers/reimbursements please see the Fund’s prospectus.
Thornburg Global Opportunities Fund
Thornburg Equity Funds Semi-Annual Report | 11

Investment Goal andFund Overview
The International Equity Fund seekslong-term capital appreciation by investing inequity and debt securities of all types. Thesecondary, nonfundamental goal of the Fundis to seek some current income. The Fundinvests primarily in non-U.S. companiesselected on a value basis using fundamentalresearch. Under normal conditions, the Fundinvests at least 80% of its assets in commonstocks or depositary receipts. As describedin more detail in the Fund Prospectus, theportfolio is diversified to include basic valuestocks, but also includes stocks ofcompanies with consistent earningscharacteristics and those of emergingfranchises, when these issues are valuepriced.
Performance drivers anddetractors for the reporting periodended March 31, 2022
» For the six-month period ended March 31, 2022the Fund (Class I shares) lost 7.96% versus a lossof 3.72% for the MSCI AC World ex-USA Net TotalReturn USD Index and a loss of 3.38% for theMSCI EAFE Net Total Return USD Index.
» Numerous macro crosswinds impacted marketperformance during the period, causing largedispersions in country and sector performance.Largest among them, the war in Ukraine, the rise inU.S. interest rates, and the beginning of Fedtightening.
» Within the MSCI AC World ex-USA Net TotalReturn USD Index, value stocks outperformedgrowth stocks by 10%, with growth losing 8.6%.Energy, materials, and financials outperformed.Canada, Australia, the U.K., and oil producers(except for Russia) outperformed, while theeurozone and China underperformed.
» In many prior periods, Fund performance hasbeen driven by bottom-up stock selection.Occasionally there are periods (like the pandemic inearly 2020 and the last six months) where macrofactors dominate stock selection and country andsector allocation are the biggest drivers ofperformance.
» The Fund was underweight most of theoutperformers listed above and overweight theeurozone and China, which hurt performance. Anoverweight in communication services andinformation technology, which underperformed,were also negatives. An overweight in utilities, azero weight in Russia, and an average 6%allocation to cash in a down market were notablepositives.
» Bottom-up stock selection also had a negativeimpact. Our Basic Value basket underperformed ina strong market for value stocks as most of ourholdings are higher quality value. We wereunderweight the growth companies in our EmergingFranchise basket, but many of them hadsubstantially negative returns. Our ConsistentEarners had the best performance of our threebaskets.
Performance SummaryMarch 31, 2022 (Unaudited)
GROWTH OF A HYPOTHETICAL $10,000 INVESTMENT
THORNBURG INTERNATIONAL EQUITY FUND FINAL VALUE
$0
$20,000
$40,000
$60,000
May-28-98 Dec-00 Dec-03 Dec-06 Dec-09 Dec-12 Dec-15 Dec-18 Mar-22
Thornburg International Value Fund, Class A Shares (with sales charge) $50,899MSCI EAFE Net Total Return USD Index $28,557MSCI AC World ex USA Net Total Return USD Index $34,442
AVERAGE ANNUAL TOTAL RETURNS
THORNBURG INTERNATIONAL EQUITY FUND 1-YR 3-YR 5-YR 10-YRSINCE
INCEPTION
Class A Shares (Incep: 5/28/98)Without sales charge -8.23% 9.21% 7.07% 5.77.07% 6% 7.27%With sales charge 7.55%-12.37% 6.09 5.28%% 7.06%
Class C Shares (Incep: 5/28/98)Without sales charge 8.45%-8.83% 6 5.00%.30% 6.45%With sales charge -9.6 8.45%2% 6 5.00%.30% 6.45%
Class I Shares (Incep: 3/30/01) -7.87% 9.57% 7.43% 6.15% 7.12%Class R3 Shares (Incep: 7/1/03) -8.34% 9.01% 6 5.58%.88% 7.79%Class R4 Shares (Incep: 2/1/07) -8.14% 9.22% 7.10% 5.77.10% 9% 4.17%Class R5 Shares (Incep: 2/1/05) -7.92% 9.49% 7.37% 6.07% 6.55%Class R6 Shares (Incep: 5/1/12) -7.74% 9.72% 7.58% -7.58% 6.39%MSCI AC World ex USA Net Total Return USD Index
(Since 5/28/98)7.51%-1.48% 6.76 5.55%% 4.92%
MSCI EAFE Net Total Return USD Index (Since 5/28/98) 1.16 7.78%% 6.72% 6.27% 4.50%
The matters discussed in this report may constitute forward-looking statements made pursuant to the safe harbor provisions of the Securities LitigationReform Act of 1995. These include any advisor or portfolio manager prediction, assessment, analysis or outlook for individual securities, industries,investment styles, market sectors and/or markets. These statements involve risks and uncertainties. In addition to the general risks described for each fundin its current prospectus, other factors bearing on these reports include the accuracy of the advisor’s or portfolio manager’s forecasts and predictions, theappropriateness of the investment strategies designed by the advisor or portfolio manager and the ability of the advisor or portfolio manager to implementtheir strategies efficiently and successfully. Any one or more of these factors, as well as other risks affecting the securities markets generally, could causethe actual results of any fund to differ materially as compared to its benchmarks.
The views expressed are subject to change and do not necessarily reflect the views of Thornburg Investment Management, Inc. This information should notbe relied upon as a recommendation or investment advice and is not intended to predict the performance of any investment or market.
Performance results of individual share classes will vary based on the fees and expenses associated with each share class, and may be higher or lower thanother share classes within the same Fund. Please see Performance Summary for performance results of each share class.
Performance data shown represents past performance and is no guarantee of future results. Investment return and principal value will fluctuate so shares,when redeemed, may be worth more or less than their original cost. Current performance may be lower or higher than quoted. For performance current tothe most recent month end, visit thornburg.com or call 800-847-0200. The performance information does not reflect the deduction of taxes that ashareholder would pay on distributions or the redemption of Fund shares. Returns reflect the reinvestment of dividends and capital gains. Class A shares aresold with a maximum sales charge of 4.50%. Class C shares are subject to a 1% CDSC for the first year only. There is no sales charge for Class I, R3, R4,R5 and R6 shares. As disclosed in the Fund’s most recent prospectus, the total annual fund operating expenses before fee waivers or expensereimbursements are as follows: A shares, 1.25%; C shares, 1.96%; I shares, 0.94%; R3 shares, 1.61%; R4 shares, 1.40%; R5 shares, 1.16%; R6 shares,0.88%. Thornburg Investment Management has contractually agreed to waive fees and reimburse expenses until at least February 1, 2023, for some of theshare classes, resulting in net expense ratios of the following: I shares, 0.90%; R3 shares, 1.36%; R4 shares, 1.16%; R5 shares, 0.90%;R6 shares 0.70%.For more detailed information on fund expenses and waivers/reimbursements please see the Fund’s prospectus.
Thornburg International Equity Fund
12 | Thornburg Equity Funds Semi-Annual Report

Investment Goal andFund Overview
The Better World International Fund seekslong-term capital appreciation. The Fundinvests primarily in a broad range of foreigncompanies, based on fundamental researchcombined with analysis of thoseenvironmental, social and governance (ESG)characteristics that the investment manageridentifies as significant. The Fund targetscompanies of any size or country of origin,and which are high-quality, attractively valuedand, in our view, also demonstrate one ormore significant positive ESG characteristics.The Fund portfolio is diversified to includebasic value stocks, companies withconsistent earnings, and emerging franchisesas described in more detail in the FundProspectus.
Performance drivers anddetractors for the reporting periodended March 31, 2022
» For the six-month period ended March 31, 2022the Fund (Class I shares) lost 7.41% versus a lossof 3.72% for the MSCI AC World ex-USA Net TotalReturn USD Index.
» Numerous macro crosswinds impacted marketperformance during the period, causing largedispersions in country and sector performance.Largest among them, the war in Ukraine, the rise inU.S. interest rates, and the beginning of Fedtightening.
» Within the Fund’s benchmark index, value stocksoutperformed growth stocks by 10%, with growthlosing 8.6%. Energy, materials, and financialsoutperformed. Canada, Australia, the U.K., and oilproducers (except for Russia) outperformed, whilethe eurozone and China underperformed.
» In many prior periods, the Fund’s performancehas been driven by bottom-up stock selection.Occasionally there are periods (like the pandemic inearly 2020 and the last six months) where macrofactors dominate stock selection and country andsector allocation are the biggest drivers ofperformance.
» The Fund was underweight most of theoutperformers listed above and overweight theeurozone and China, which hurt performance. Anoverweight in utilities, an underweight in consumerdiscretionary, a zero weight in Russia, and anaverage 9% allocation to cash in a down marketwere notable positives.
» Bottom-up stock selection also had a negativeimpact. Our Basic Value basket underperformed ina strong market for value stocks as most of ourholdings are higher quality value. Many of thegrowth stocks in our Emerging Franchise basketalso had substantially negative returns. OurConsistent Earners had the best performance ofthe three baskets during the period.
Performance SummaryMarch 31, 2022 (Unaudited)
GROWTH OF A HYPOTHETICAL $10,000 INVESTMENT
THORNBURG BETTER WORLD INTERNATIONAL FUND FINAL VALUE
$0
$4,000
$8,000
$12,000
$16,000
$20,000$22,000
Sep-30-15 Dec-16 Dec-17 Dec-18 Dec-19 Dec-20 Mar-22
Thornburg Better World International Fund, A Shares (with sales charge) $19,149MSCI AC World ex USA Net Total Return USD Index $16,141
AVERAGE ANNUAL TOTAL RETURNS
THORNBURG BETTER WORLDINTERNATIONAL FUND 1-YR 3-YR 5-YR 10-YR
SINCEINCEPTION
Class A Shares (Incep: 10/1/15)Without sales charge 11.72% 6.23% 11.41% -11.41% 11.29%With sales charge 14.4-2.87% 6% 10.39 -% 10.51%
Class C Shares (Incep: 10/1/15)Without sales charge 0.9 15.47% 10.73% -3% 10.73% 10.62%With sales charge 0.06 15.47% 10.73% -% 10.73% 10.62%
Class I Shares (Incep: 10/1/15) 12.24% 6.98% 12.17% -12.17% 12.08%MSCI AC World ex USA Net Total Return USD Index
(Since 9/30/15)7.51%-1.48% 6.76 -% 7.64%
The matters discussed in this report may constitute forward-looking statements made pursuant to the safe harbor provisions of the Securities LitigationReform Act of 1995. These include any advisor or portfolio manager prediction, assessment, analysis or outlook for individual securities, industries,investment styles, market sectors and/or markets. These statements involve risks and uncertainties. In addition to the general risks described for each fundin its current prospectus, other factors bearing on these reports include the accuracy of the advisor’s or portfolio manager’s forecasts and predictions, theappropriateness of the investment strategies designed by the advisor or portfolio manager and the ability of the advisor or portfolio manager to implementtheir strategies efficiently and successfully. Any one or more of these factors, as well as other risks affecting the securities markets generally, could causethe actual results of any fund to differ materially as compared to its benchmarks.
The views expressed are subject to change and do not necessarily reflect the views of Thornburg Investment Management, Inc. This information should notbe relied upon as a recommendation or investment advice and is not intended to predict the performance of any investment or market.
Performance results of individual share classes will vary based on the fees and expenses associated with each share class, and may be higher or lower thanother share classes within the same Fund. Please see Performance Summary for performance results of each share class.
Performance data shown represents past performance and is no guarantee of future results. Investment return and principal value will fluctuate so shares,when redeemed, may be worth more or less than their original cost. Current performance may be lower or higher than quoted. For performance current tothe most recent month end, visit thornburg.com or call 800-847-0200. The performance information does not reflect the deduction of taxes that ashareholder would pay on distributions or the redemption of Fund shares. Returns reflect the reinvestment of dividends and capital gains. Class A shares aresold with a maximum sales charge of 4.50%. Class C shares are subject to a 1% CDSC for the first year only. There is no sales charge for Class I shares. Asdisclosed in the Fund’s most recent prospectus, the total annual fund operating expenses before fee waivers or expense reimbursements are as follows: Ashares, 1.57%; C shares, 2.85%; I shares, 1.21%. Thornburg Investment Management has contractually agreed to waive fees and reimburse expenses untilat least February 1, 2023, for some of the share classes, resulting in net expense ratios of the following: C shares, 2.19%; I shares, 0.90%. For moredetailed information on fund expenses and waivers/reimbursements please see the Fund’s prospectus.
Thornburg Better World International Fund
Thornburg Equity Funds Semi-Annual Report | 13

Investment Goal andFund Overview
The International Growth Fund seekslong-term growth of capital by investing inequity securities from around the worldselected for their growth potential based onmanagement’s belief that the companies willhave growing revenues and earnings. TheFund can invest in companies of any size,from large, well-established firms to small,emerging growth franchises. Managementuses traditional fundamental research toevaluate securities and make buy/selldecisions.
Performance drivers anddetractors for the reporting periodended March 31, 2022
» For the six-month reporting period endedMarch 31, 2022, stock selection was the primarydriver of the Fund’s relative underperformance. Forthe period, the Fund (Class I shares) returned-15.94% versus a return of -8.66% for the MSCIAC World ex-USA Growth Net Total Return USDIndex.
» Currency had a slightly positive impact on theFund’s performance relative to the index due to aweakening dollar against the Japanese Yen.
» Positions in the U.K. and Emerging Asia were theprimary positive relative contributors to Fundperformance for the period, while positions inCanada and Emerging Latin America detractedfrom relative performance versus the index.
» Stock selection within health care and consumerstaples was a positive relative contributor to Fundperformance. Stock selections for the Fund withinthe information technology, communicationservices, and financials were the primary detractorsto its relative underperformance versus the index.
» Performance was negative for all of the Fund’sthree baskets during the period, with the consistentgrowers as the strongest relative basket andemerging growth franchises the weakest.
Performance SummaryMarch 31, 2022 (Unaudited)
GROWTH OF A HYPOTHETICAL $10,000 INVESTMENT
THORNBURG INTERNATIONAL GROWTH FUND FINAL VALUE
$0
$6,000
$12,000
$18,000
$24,000
$30,000$33,000
Feb-1-07 Dec-09 Dec-11 Dec-13 Dec-15 Dec-17 Dec-19 Mar-22
Thornburg International Growth Fund, Class A Shares (with sales charge) $25,295MSCI AC World ex USA Growth Net Total Return USD Index $18,816
AVERAGE ANNUAL TOTAL RETURNS
THORNBURG INTERNATIONAL GROWTH FUND 1-YR 3-YR 5-YR 10-YRSINCE
INCEPTION
Class A Shares (Incep: 2/1/07)Without sales charge -15.82% 6.08% 6.68% 6.84% 6.64%With sales charge -19.6 4.40% 6% 5.70% 6.35% 6.31%
Class C Shares (Incep: 2/1/07)Without sales charge -16 5.24%.54% 5.84% 6.02% 5.86%With sales charge 5.24%-17.31% 5.84% 6.02% 5.86%
Class I Shares (Incep: 2/1/07) -15.59% 6.39% 7.02% 7.24%7.02% 7.11%Class R3 Shares (Incep: 2/1/08) -15.99 5.87%% 6.48% 6.69% 5.70%Class R4 Shares (Incep: 2/1/08) -15.9 5.4% 97% 6.59% 6.80% 5.81%Class R5 Shares (Incep: 2/1/08) -15.58% 6.40% 7.02% 7.23%7.02% 6.24%Class R6 Shares (Incep: 2/1/13) -15.49% 6.52% 7.13% -7.13% 6.81%MSCI AC World ex USA Growth Net Total Return USD Index
(Since 2/1/07)-6.16% 9.12% 8.60% 6.70% 4.26%
The matters discussed in this report may constitute forward-looking statements made pursuant to the safe harbor provisions of the Securities LitigationReform Act of 1995. These include any advisor or portfolio manager prediction, assessment, analysis or outlook for individual securities, industries,investment styles, market sectors and/or markets. These statements involve risks and uncertainties. In addition to the general risks described for each fundin its current prospectus, other factors bearing on these reports include the accuracy of the advisor’s or portfolio manager’s forecasts and predictions, theappropriateness of the investment strategies designed by the advisor or portfolio manager and the ability of the advisor or portfolio manager to implementtheir strategies efficiently and successfully. Any one or more of these factors, as well as other risks affecting the securities markets generally, could causethe actual results of any fund to differ materially as compared to its benchmarks.
The views expressed are subject to change and do not necessarily reflect the views of Thornburg Investment Management, Inc. This information should notbe relied upon as a recommendation or investment advice and is not intended to predict the performance of any investment or market.
Performance results of individual share classes will vary based on the fees and expenses associated with each share class, and may be higher or lower thanother share classes within the same Fund. Please see Performance Summary for performance results of each share class.
Performance data shown represents past performance and is no guarantee of future results. Investment return and principal value will fluctuate so shares,when redeemed, may be worth more or less than their original cost. Current performance may be lower or higher than quoted. For performance current tothe most recent month end, visit thornburg.com or call 800-847-0200. The performance information does not reflect the deduction of taxes that ashareholder would pay on distributions or the redemption of Fund shares. Returns reflect the reinvestment of dividends and capital gains. Class A shares aresold with a maximum sales charge of 4.50%. Class C shares are subject to a 1% CDSC for the first year only. There is no sales charge for Class I, R3, R4,R5 and R6 shares. As disclosed in the Fund’s most recent prospectus, the total annual fund operating expenses before fee waivers or expensereimbursements are as follows: A shares, 1.26%; C shares, 2.07%; I shares, 0.99%; R3 shares, 1.88%; R4 shares, 1.62%; R5 shares, 1.26%; R6 shares,0.95%. Thornburg Investment Management has contractually agreed to waive fees and reimburse expenses until at least February 1, 2023, for some of theshare classes, resulting in net expense ratios of the following: R3 shares, 1.50%; R4 shares, 1.40%; R5 shares, 0.99%; R6 shares, 0.89%. For moredetailed information on fund expenses and waivers/reimbursements please see the Fund’s prospectus.
Thornburg International Growth Fund
14 | Thornburg Equity Funds Semi-Annual Report

Investment Goal andFund Overview
The Developing World Fund’s primaryinvestment goal is long-term capitalappreciation. The Fund invests at least 80%of its assets in equity securities of developingcountry issuers. A developing country issueris a company or sovereign entity that isdomiciled or otherwise tied economically toone or more developing countries. The Fundportfolio is diversified to include basic valuestocks, companies with consistent earnings,and emerging franchises as described inmore detail in the Fund Prospectus.
Performance drivers anddetractors for the reporting periodended March 31, 2022
» For the period ended March 31, 2022, the Fund’sunderperformance on a sector basis relative to itsbenchmark index was attributable to stockselection, with sector allocation decisionsessentially neutral and currency allocation decisionscontributing positively to relative performance.During the period, the Fund (Class I shares)returned -12.12% versus a return of -8.20% for theMSCI Emerging Markets Net Total Return USDIndex.
» Stock selection within financials, energy andconsumer staples detracted from relativeperformance.
» Stock selection within materials, consumerdiscretionary and communication services wereadditive to relative performance.
» On a geographic basis, the Fund’sunderperformance was driven by stock selection,with country allocation and currency allocation bothcontributing positively to relative performance.
» Stock selection in China and Brazil, and anunderweight allocation to Saudi Arabia, detractedfrom relative performance. Stock selection withinthe Philippines, as well as stock selection and anoverweight allocation to Mexico, contributedpositive to relative performance.
Performance SummaryMarch 31, 2022 (Unaudited)
GROWTH OF A HYPOTHETICAL $10,000 INVESTMENT
THORNBURG DEVELOPING WORLD FUND FINAL VALUE
$0
$10,000
$20,000
$25,000
Dec-16-09 Dec-11 Dec-13 Dec-15 Dec-17 Dec-19 Mar-22
Thornburg Developing World Fund, Class A Shares (with sales charge) $19,936MSCI Emerging Markets Net Total Return USD Index $15,654
AVERAGE ANNUAL TOTAL RETURNS
THORNBURG DEVELOPING WORLD FUND 1-YR 3-YR 5-YR 10-YRSINCE
INCEPTION
Class A Shares (Incep: 12/16/09)Without sales charge -14.46% 6.25% 7.80% 4.83%7.80% 6.17%With sales charge 4.-18.30% 63% 6 4.35%.81% 5.78%
Class C Shares (Incep: 12/16/09)Without sales charge 5.44%-15.14% 6.9 4.03%8% 5.39%With sales charge -15.99 5.44%% 6.9 4.03%8% 5.39%
Class I Shares (Incep: 12/16/09) -14.16% 6.63% 8.20% 5.27%8.20% 6.65%Class R5 Shares (Incep: 2/1/13) -14.17% 6.63% 8.21% -8.21% 4.48%Class R6 Shares (Incep: 2/1/13) -14.07% 6.73% 8.31% -8.31% 4.58%MSCI Emerging Markets Net Total Return USD Index
(Since 12/16/09)4.-11.37% 94% 5.9 3.38% 6% 3.71%
The matters discussed in this report may constitute forward-looking statements made pursuant to the safe harbor provisions of the Securities LitigationReform Act of 1995. These include any advisor or portfolio manager prediction, assessment, analysis or outlook for individual securities, industries,investment styles, market sectors and/or markets. These statements involve risks and uncertainties. In addition to the general risks described for each fundin its current prospectus, other factors bearing on these reports include the accuracy of the advisor’s or portfolio manager’s forecasts and predictions, theappropriateness of the investment strategies designed by the advisor or portfolio manager and the ability of the advisor or portfolio manager to implementtheir strategies efficiently and successfully. Any one or more of these factors, as well as other risks affecting the securities markets generally, could causethe actual results of any fund to differ materially as compared to its benchmarks.
The views expressed are subject to change and do not necessarily reflect the views of Thornburg Investment Management, Inc. This information should notbe relied upon as a recommendation or investment advice and is not intended to predict the performance of any investment or market.
Performance results of individual share classes will vary based on the fees and expenses associated with each share class, and may be higher or lower thanother share classes within the same Fund. Please see Performance Summary for performance results of each share class.
Performance data shown represents past performance and is no guarantee of future results. Investment return and principal value will fluctuate so shares,when redeemed, may be worth more or less than their original cost. Current performance may be lower or higher than quoted. For performance current tothe most recent month end, visit thornburg.com or call 800-847-0200. The performance information does not reflect the deduction of taxes that ashareholder would pay on distributions or the redemption of Fund shares. Returns reflect the reinvestment of dividends and capital gains. Class A shares aresold with a maximum sales charge of 4.50%. Class C shares are subject to a 1% CDSC for the first year only. There is no sales charge for Class I, R5 andR6 shares. As disclosed in the Fund’s most recent prospectus, the total annual fund operating expenses before fee waivers or expense reimbursements areas follows: A shares, 1.43%; C shares, 2.19%; I shares, 1.15%; R5 shares, 1.70%; R6 shares, 1.11%. Thornburg Investment Management hascontractually agreed to waive fees and reimburse expenses until at least February 1, 2023, for some of the share classes, resulting in net expense ratios ofthe following: I shares, 1.04%; R5 shares, 1.04%; R6 shares, 0.94%. For more detailed information on fund expenses and waivers/reimbursements pleasesee the Fund’s prospectus.
Thornburg Developing World Fund
Thornburg Equity Funds Semi-Annual Report | 15

Investment Goal andFund Overview
The Fund seeks long-term capital appreciation byinvesting in equity and debt securities of all types.The secondary, non-fundamental goal of the Fundis to seek some current income. Under normalconditions, the Fund invests at least 80% of its netassets in small- and mid-capitalization companies.
With its core approach to stock selection, the Fundseeks to invest in a broadly diversified portfolio ofcompanies the Fund categorizes as basic values,consistent earners, and emerging franchises, asdescribed in more detail in the Fund Prospectus.The relative proportions of securities invested ineach of those categories will vary over time.
Performance drivers anddetractors for the reporting periodended March 31, 2022
» For the six-month period ended March 31, 2022,the Fund (Class I shares) returned -1.71% versus areturn of -2.22% for the Russell 2500 Total ReturnIndex, primarily due to sector and market capallocations. The allocation towards slightly largercompanies was beneficial as mid-cap companiesoutperformed small-cap companies.
» Stock selection in health care and industrials hada positive relative impact on performance, as did anoverallocation to the outperforming energy sector.
» Stock selection in information technology,consumer staples, and real estate had a negativerelative impact on performance.
» Returns of mid-cap stocks outpaced small-capstocks within the benchmark. Stock selection wasa slight negative contributor within the small-capportion of the Fund’s portfolio. However, anoverweight to larger stocks within the universe anda positive impact from selection of stocks within the$2.5 billion to $12 billon market cap range werepositive, contributing to outperformance for theperiod.
Performance SummaryMarch 31, 2022 (Unaudited)
GROWTH OF A HYPOTHETICAL $10,000 INVESTMENT
THORNBURG SMALL/MID CAP CORE FUND FINAL VALUE
$0
$20,000
$40,000
$60,000
$80,000
$100,000
$120,000
$140,000$150,000
Oct-2-95 Dec-97 Dec-01 Dec-05 Dec-09 Dec-13 Dec-17 Mar-22
Thornburg SmallMid Cap Core Fund, Class A Shares (with sales charge) $116,058Russell 2500 Total Return Index $134,956
AVERAGE ANNUAL TOTAL RETURNS
THORNBURG SMALL/MID CAP CORE FUND 1-YR 3-YR 5-YR 10-YRSINCE
INCEPTION
Class A Shares (Incep: 10/2/95)Without sales charge 3.09 11.53% 10.31% 11.14%% 10.31% 9.88%With sales charge -1.56% 9.83% 9 10..30% 63% 9.69%
Class C Shares (Incep: 10/2/95)Without sales charge 10.2.21% 63% 9 10.27%.41% 9.03%With sales charge 1.49 10.% 63% 9 10.27%.41% 9.03%
Class I Shares (Incep: 11/2/98) 11.3.44% 91% 10.69 11.5% 6% 8.23%Class R3 Shares (Incep: 7/1/03) 11.52%3.07% 10.29 11.1% 6% 8.45%Class R4 Shares (Incep: 2/1/07) 11.3.17% 62% 10.40% 11.27%10.40% 6.92%Class R5 Shares (Incep: 2/1/05) 11.3.43% 91% 10.69 11.55%% 8.58%Russell 2500 Total Return Index
(Since 10/2/95)13.70.34% 9% 11.57% 12.011.57% 9% 10.32%
The matters discussed in this report may constitute forward-looking statements made pursuant to the safe harbor provisions of the Securities LitigationReform Act of 1995. These include any advisor or portfolio manager prediction, assessment, analysis or outlook for individual securities, industries,investment styles, market sectors and/or markets. These statements involve risks and uncertainties. In addition to the general risks described for each fundin its current prospectus, other factors bearing on these reports include the accuracy of the advisor’s or portfolio manager’s forecasts and predictions, theappropriateness of the investment strategies designed by the advisor or portfolio manager and the ability of the advisor or portfolio manager to implementtheir strategies efficiently and successfully. Any one or more of these factors, as well as other risks affecting the securities markets generally, could causethe actual results of any fund to differ materially as compared to its benchmarks.
The views expressed are subject to change and do not necessarily reflect the views of Thornburg Investment Management, Inc. This information should notbe relied upon as a recommendation or investment advice and is not intended to predict the performance of any investment or market.
Performance results of individual share classes will vary based on the fees and expenses associated with each share class, and may be higher or lower thanother share classes within the same Fund. Please see Performance Summary for performance results of each share class.
Performance data shown represents past performance and is no guarantee of future results. Investment return and principal value will fluctuate so shares,when redeemed, may be worth more or less than their original cost. Current performance may be lower or higher than quoted. For performance current tothe most recent month end, visit thornburg.com or call 800-847-0200. The performance information does not reflect the deduction of taxes that ashareholder would pay on distributions or the redemption of Fund shares. Returns reflect the reinvestment of dividends and capital gains. Class A shares aresold with a maximum sales charge of 4.50%. Class C shares are subject to a 1% CDSC for the first year only. There is no sales charge for Class I, R3, R4and R5 shares. As disclosed in the Fund’s most recent prospectus, the total annual fund operating expenses before fee waivers or expense reimbursementsare as follows: A shares, 1.31%; C shares, 2.13%; I shares, 1.06%; R3 shares, 1.79%; R4 shares, 1.76%; R5 shares, 1.46%. Thornburg InvestmentManagement has contractually agreed to waive fees and reimburse expenses until at least February 1, 2023, for some of the share classes, resulting in netexpense ratios of the following: I shares, 0.95%; R3 shares, 1.31%; R4 shares, 1.21%; R5 shares, 0.95%. For more detailed information on fund expensesand waivers/reimbursements please see the Fund’s prospectus.
Thornburg Small/Mid Cap Core Fund
16 | Thornburg Equity Funds Semi-Annual Report

Investment Goal andFund Overview
The Fund seeks long-term growth of capital byinvesting in equity securities selected for theirgrowth potential. Under normal conditions, theFund invests at least 80% of its net assets in small-and mid-capitalization companies.
The Fund seeks to invest in a diversified portfolio ofcompanies the Fund categorizes as consistentearners, disruptors, and emerging franchises, asdescribed in more detail in the Fund Prospectus.The relative proportions of securities invested ineach of those categories will vary over time.
Performance drivers anddetractors for the reporting periodended March 31, 2022
» For the six-month period ended March 31, 2022,the Fund (Class I shares) returned -18.64% versusa return of -12.13% for the Russell 2500 GrowthTotal Return Index, primarily due to stock selectionacross sectors and market cap ranges.
» Stock selection in information technology,consumer discretionary, and industrials had anegative relative impact on performance versus theindex.
» The Fund’s allocation towards slightly largercompanies was beneficial as larger companiesoutperformed smaller companies within the small-and mid-cap universe.
» Stock selection in health care and communicationservices had a positive relative impact on theFund’s performance relative to the index.
» Returns of mid-caps outpaced small-caps withinthe benchmark during the period. Stock selectionwas the primary negative contributor to the relativeunderperformance within both the small- andmid-cap portion of the Fund. However, anunderweighting in the Fund to smaller stocks withinthe index universe had a slight positive impact onrelative performance.
Performance SummaryMarch 31, 2022 (Unaudited)
GROWTH OF A HYPOTHETICAL $10,000 INVESTMENT
THORNBURG SMALL/MID CAP GROWTH FUND FINAL VALUE
$0
$20,000
$40,000
$60,000
$70,000
Dec-27-00 Dec-03 Dec-06 Dec-09 Dec-12 Dec-15 Dec-18 Mar-22
Thornburg SmallMid Cap Growth Fund, A Shares (with sales charge) $40,101Russell 2500 Growth Total Return Index $56,498
AVERAGE ANNUAL TOTAL RETURNS
THORNBURG SMALL/MID CAPGROWTH FUND 1-YR 3-YR 5-YR 10-YR
SINCEINCEPTION
Class A Shares (Incep: 12/27/00)Without sales charge 8.03% 10.48% 10.17%-14.54% 10.48% 6.98%With sales charge -18.39% 6.39% 9.46% 9.67% 6.75%
Class C Shares (Incep: 12/27/00)Without sales charge -15.29 7.17%% 9.59% 9.32% 6.14%With sales charge 7.17%-15.80% 9.59% 9.32% 6.14%
Class I Shares (Incep: 11/3/03) -14.26 8.40% 10.87% 10.% 10.87% 60% 9.14%Class R3 Shares (Incep: 7/1/03) -14.6 7.87% 6% 10.31% 10.04%10.31% 9.15%Class R4 Shares (Incep: 2/1/07) -14.6 7.1% 97% 10.42% 10.15%10.42% 6.54%Class R5 Shares (Incep: 10/3/05) 8.40% 10.87% 10.-14.25% 10.87% 61% 8.37%Russell 2500 Growth Total Return Index
(Since 12/27/00)12.-10.12% 99% 13.22% 12.13.22% 69% 8.49%
The matters discussed in this report may constitute forward-looking statements made pursuant to the safe harbor provisions of the Securities LitigationReform Act of 1995. These include any advisor or portfolio manager prediction, assessment, analysis or outlook for individual securities, industries,investment styles, market sectors and/or markets. These statements involve risks and uncertainties. In addition to the general risks described for each fundin its current prospectus, other factors bearing on these reports include the accuracy of the advisor’s or portfolio manager’s forecasts and predictions, theappropriateness of the investment strategies designed by the advisor or portfolio manager and the ability of the advisor or portfolio manager to implementtheir strategies efficiently and successfully. Any one or more of these factors, as well as other risks affecting the securities markets generally, could causethe actual results of any fund to differ materially as compared to its benchmarks.
The views expressed are subject to change and do not necessarily reflect the views of Thornburg Investment Management, Inc. This information should notbe relied upon as a recommendation or investment advice and is not intended to predict the performance of any investment or market.
Performance results of individual share classes will vary based on the fees and expenses associated with each share class, and may be higher or lower thanother share classes within the same Fund. Please see Performance Summary for performance results of each share class.
Performance data shown represents past performance and is no guarantee of future results. Investment return and principal value will fluctuate so shares,when redeemed, may be worth more or less than their original cost. Current performance may be lower or higher than quoted. For performance current tothe most recent month end, visit thornburg.com or call 800-847-0200. The performance information does not reflect the deduction of taxes that ashareholder would pay on distributions or the redemption of Fund shares. Returns reflect the reinvestment of dividends and capital gains. Class A shares aresold with a maximum sales charge of 4.50%. Class C shares are subject to a 1% CDSC for the first year only. There is no sales charge for Class I, R3, R4and R5 shares. As disclosed in the Fund’s most recent prospectus, the total annual fund operating expenses before fee waivers or expense reimbursementsare as follows: A shares, 1.31%; C shares, 2.09%; I shares, 1.04%; R3 shares, 1.79%; R4 shares, 2.17%; R5 shares, 1.31%. Thornburg InvestmentManagement has contractually agreed to waive fees and reimburse expenses until at least February 1, 2023, for some of the share classes, resulting in netexpense ratios of the following: I shares, 0.95%; R3 shares, 1.46%; R4 shares, 1.36%; R5 shares, 0.95%. For more detailed information on fund expensesand waivers/reimbursements please see the Fund’s prospectus.
Thornburg Small/Mid Cap Growth Fund
Thornburg Equity Funds Semi-Annual Report | 17

Investment Goal andFund Overview
The Investment Income Builder Fund’sprimary investment goal is to provide a levelof current income which exceeds theaverage yield on U.S. stocks generally, andwhich will generally grow, subject to periodicfluctuations, over the years on a per sharebasis. The Fund’s secondary investment goalis long-term capital appreciation.
The Fund pursues its investment goals byinvesting in a broad range of incomeproducing securities, primarily stocks andbonds. Equity investments normally will beweighted in favor of companies which paydividends. The Fund may invest in securitiesof issuers domiciled in or economically tied tocountries outside the United States, includingdeveloping countries. Investment decisionsare based on domestic and internationaleconomic developments, outlooks forsecurities markets, interest rates andinflation, the supply and demand for debtand equity securities, and analysis of specificissuers.
See letter beginning on page 8 of this reportfor a discussion of factors affecting theFund’s performance for the reporting periodended March 31, 2022.
Performance SummaryMarch 31, 2022 (Unaudited)
GROWTH OF A HYPOTHETICAL $10,000 INVESTMENT
THORNBURG INVESTMENT INCOME BUILDER FUND FINAL VALUE
$0
$20,000
$40,000
$60,000
Dec-24-02 Dec-06 Dec-09 Dec-12 Dec-15 Dec-18 Mar-22
Thornburg Investment Income Builder Fund, Class A Shares (with sales charge) $50,580Blended Index $44,843MSCI World Net Total Return USD Index $55,478
AVERAGE ANNUAL TOTAL RETURNS
THORNBURG INVESTMENT INCOME BUILDER FUND 1-YR 3-YR 5-YR 10-YRSINCE
INCEPTION
Class A Shares (Incep: 12/24/02)Without sales charge 8.8.25% 67% 7.72% 7.23%7.72% 9.04%With sales charge 3.39 7.02%% 6.73% 6.73% 8.78%
Class C Shares (Incep: 12/24/02)Without sales charge 7.87.43% 6% 6.92% 6.45% 8.34%With sales charge 6 7.8.43% 6% 6.92% 6.45% 8.34%
Class I Shares (Incep: 11/3/03) 8.8.53% 92% 8.01% 7.54%8.01% 8.55%Class R3 Shares (Incep: 2/1/05) 8.27%7.85% 7.34% 6.87% 7.18%Class R4 Shares (Incep: 2/1/08) 8.38.00% 9% 7.45% 6.99% 5.81%Class R5 Shares (Incep: 2/1/07) 8.83%8.41% 7.89 7.41%% 6.47%Class R6 Shares (Incep: 4/10/17) 8.62% 9.02% - -- 8.21%MSCI World Net Total Return USD Index
(Since 12/24/02)14.10.12% 98% 12.42% 10.88%12.42% 9.30%
The matters discussed in this report may constitute forward-looking statements made pursuant to the safe harbor provisions of the Securities LitigationReform Act of 1995. These include any advisor or portfolio manager prediction, assessment, analysis or outlook for individual securities, industries,investment styles, market sectors and/or markets. These statements involve risks and uncertainties. In addition to the general risks described for each fundin its current prospectus, other factors bearing on these reports include the accuracy of the advisor’s or portfolio manager’s forecasts and predictions, theappropriateness of the investment strategies designed by the advisor or portfolio manager and the ability of the advisor or portfolio manager to implementtheir strategies efficiently and successfully. Any one or more of these factors, as well as other risks affecting the securities markets generally, could causethe actual results of any fund to differ materially as compared to its benchmarks.
The views expressed are subject to change and do not necessarily reflect the views of Thornburg Investment Management, Inc. This information should notbe relied upon as a recommendation or investment advice and is not intended to predict the performance of any investment or market.
Performance results of individual share classes will vary based on the fees and expenses associated with each share class, and may be higher or lower thanother share classes within the same Fund. Please see Performance Summary for performance results of each share class.
Performance data shown represents past performance and is no guarantee of future results. Investment return and principal value will fluctuate so shares,when redeemed, may be worth more or less than their original cost. Current performance may be lower or higher than quoted. For performance current tothe Fund’s most recent month end, visit thornburg.com or call 800-847-0200. The performance information does not reflect the deduction of taxes that ashareholder would pay on distributions or the redemption of Fund shares. Returns reflect the reinvestment of dividends and capital gains. Class A shares aresold with a maximum sales charge of 4.50%. Class C shares are subject to a 1% CDSC for the first year only. There is no sales charge for Class I, R3, R4,R5 and R6 shares. As disclosed in the Fund’s most recent prospectus, the total annual fund operating expenses before fee waivers or expensereimbursements are as follows: A shares, 1.18%; C shares, 1.95%; I shares, 0.94%; R3 shares, 1.63%; R4 shares, 1.51%; R5 shares, 1.14%; R6 shares,0.89%. Thornburg Investment Management has contractually agreed to waive fees and reimburse expenses until at least February 1, 2023, for some of theshare classes, resulting in net expense ratios of the following: R3 shares,1.50%; R4 shares, 1.40%; R5 shares, 0.99%; R6 shares, 0.80%. For moredetailed information on fund expenses and waivers/reimbursements please see the Fund’s prospectus.
30-day SEC Yield as of 3/31/22 (Class A Shares) : 2.72%
Thornburg Investment Income Builder Fund
18 | Thornburg Equity Funds Semi-Annual Report

Investment Goal andFund Overview
The Summit Fund seeks to grow real wealthover time. “Real wealth” for this purpose is amix of capital appreciation and currentincome that is intended to exceed the rate ofinflation. Under normal conditions the Fund’sinvestments are expected to emphasize longpositions in equity securities and fixedincome obligations, though the Fund mayalso invest a significant amount of its assetsin short positions in equity securities andfixed income obligations, in commodities-related investments, in derivative instruments,in currencies, and in cash or cashequivalents.
There are no specific percentage limitationson the amount of the Fund’s portfolio thatmay be invested in a particular asset class,and the proportions of the Fund’s assets thatare invested in the respective asset classesare expected to vary over time and from timeto time depending upon Thornburg’sperceptions of which types of investmentsrepresent better values and opportunities toachieve the Fund’s investment goal.
Performance drivers anddetractors for the reporting periodended March 31, 2022
» Selection effect within both equities and fixedincome contributed strongly to the Fund’s relativeoutperformance versus its index during the trailingsix-month period ended March 31, 2022. TheFund’s position to cash was modestly detractive torelative performance. For the period, the Fund(Class I shares) returned 0.26% versus a return of-2.11% for the 60% MSCI All Country AC WorldIndex and 40% Bloomberg Barclays GlobalAggregate Bond Index (the benchmark blendedindex).
» Within equities, selection effect from informationtechnology and industrial stocks contributedpositively to the Fund’s relative outperformance.
» The Fund’s modestly underweight allocation toequities, versus its blended benchmark index, andits overweight allocation to communicationservices, as well as stock selection within financials,detracted from relative performance.
» Within fixed income, the Fund’s relativeoutperformance was primarily driven by strongsecurity selection across sectors. An overweightallocation to asset backed securities was alsoadditive to relative performance versus the blendedbenchmark index.
» On a geographic basis, an overweighting of Fundholdings in U.S. fixed income was additive to itsrelative performance.
Performance SummaryMarch 31, 2022 (Unaudited)
GROWTH OF A HYPOTHETICAL $10,000 INVESTMENT
THORNBURG SUMMIT FUND FINAL VALUE
$0
$8,000
$16,000
$20,000
Mar-1-19 Jun-19 Dec-19 Jun-20 Dec-20 Jun-21 Dec-21 Mar-22
Thornburg Summit Fund, Class I Shares $15,60960% MSCI All Country (AC) World Net Total Return USD Index/40% Bloomberg Global Aggregate Bond Index
$12,972
THORNBURG SUMMIT FUND 1-YR 3-YR 5-YR 10-YRSINCE
INCEPTION
Class A Shares (Incep: 1/26/22)Without sales charge - - -- - 0.76%With sales charge - - -- - -3.79%
Class I Shares (Incep: 3/1/19) 5.6 15.27% - -0% - 15.54%60% MSCI All Country (AC) World Net Total Return USD
Index/40% Bloomberg Global Aggregate Bond Index(Since 3/1/19)
8.1.72% 67% - -- 8.87%
The matters discussed in this report may constitute forward-looking statements made pursuant to the safe harbor provisions of the Securities LitigationReform Act of 1995. These include any advisor or portfolio manager prediction, assessment, analysis or outlook for individual securities, industries,investment styles, market sectors and/or markets. These statements involve risks and uncertainties. In addition to the general risks described for each fundin its current prospectus, other factors bearing on these reports include the accuracy of the advisor’s or portfolio manager’s forecasts and predictions, theappropriateness of the investment strategies designed by the advisor or portfolio manager and the ability of the advisor or portfolio manager to implementtheir strategies efficiently and successfully. Any one or more of these factors, as well as other risks affecting the securities markets generally, could causethe actual results of any fund to differ materially as compared to its benchmarks.
The views expressed are subject to change and do not necessarily reflect the views of Thornburg Investment Management, Inc. This information should notbe relied upon as a recommendation or investment advice and is not intended to predict the performance of any investment or market.
Performance results of individual share classes will vary based on the fees and expenses associated with each share class, and may be higher or lower thanother share classes within the same Fund. Please see Performance Summary for performance results of each share class.
Performance data shown represents past performance and is no guarantee of future results. Investment return and principal value will fluctuate so shares,when redeemed, may be worth more or less than their original cost. Current performance may be lower or higher than quoted. For performance current tothe Fund’s most recent month end, visit thornburg.com or call 800-847-0200. The performance information does not reflect the deduction of taxes that ashareholder would pay on distributions or the redemption of Fund shares. Returns reflect the reinvestment of dividends and capital gains. Class A shares aresold with a maximum sales charge of 4.50%. There is no sales charge for Class I shares. As disclosed in the Fund’s most recent prospectus, the total annualfund operating expenses before fee waivers or expense reimbursements are as follows: A shares, 1.47%; I shares, 1.22%. Thornburg InvestmentManagement has contractually agreed to waive fees and reimburse expenses until at least February 1, 2023, for some of the share classes, resulting in netexpense ratios of the following: A shares, 1.24%; I shares, 0.99%. For more detailed information on fund expenses and waivers/reimbursements please seethe Fund’s prospectus.
Thornburg Summit Fund
Thornburg Equity Funds Semi-Annual Report | 19

The Bloomberg U.S. Aggregate Bond Total Return Index Value USD is composed of approximately 8,000 publicly traded bonds including U.S. government, mortgage-backed, corporate andYankee bonds. The index is weighted by the market value of the bonds included in the index.
The Bloomberg Global Aggregate Bond Index provides a broad-based measure of the global investment-grade fixed-rate debt markets. It is comprised of the U.S. Aggregate, Pan EuropeanAggregate, and the Asian-Pacific Aggregate indices. It also includes a wide range of standard and customized sub-indices by liquidity constraint, sector, quality, and maturity.
Thornburg Investment Income Builder Fund’s Blended Index is composed of 25% Bloomberg US Aggregate Bond Total Return Index Value USD and 75% MSCI World Net Total Return USDIndex, rebalanced monthly.
Bond Credit Ratings (Credit Quality) – A bond credit rating assesses the financial ability of a debt issuer to make timely payments of principal and interest. Ratings of AAA (the highest), AA,A, and BBB are investment-grade quality. Ratings of BB, B, CCC, CC, C and D (the lowest) are considered below investment grade, speculative grade, or junk bonds.
The MSCI World Net Total Return USD Index is an unmanaged market-weighted index that consists of securities traded in 23 of the world’s most developed countries. Securities are listedon exchanges in the U.S., Europe, Canada, Australia, New Zealand, and the Far East. The index is calculated with net dividends reinvested in U.S. dollars.
The MSCI All Country (AC) World Net Total Return USD Index is a market capitalization weighted index that is representative of the market structure of 47 developed and emerging marketcountries in North and South America, Europe, Africa, the Middle East, and the Pacific Rim. The index is calculated with net dividends reinvested in U.S. dollars.
The MSCI All Country (AC) World ex-USA Total Return Index is a market capitalization weighted index representative of the market structure of 45 developed and emerging market countriesin North and South America, Europe, Africa, and the Pacific Rim, excluding securities of United States issuers. Beginning in January 2001, the index is calculated with net dividendsreinvested in U.S. dollars. Prior data is calculated with gross dividends.
The MSCI World ESG Leaders Index is a capitalization weighted index that provides exposure to companies with high Environmental, Social and Governance (ESG) performance relative totheir sector peers. MSCI World ESG Leaders Index is constructed by aggregating the following regional Index MSCI Pacific ESG Leaders Index, MSCI Europe & Middle East ESG Leaders Index,MSCI Canada ESG Leaders Index and MSCI USA ESG Leaders Index. The parent index is MSCI World Index, which consists of large and mid-cap companies in 23 Developed MarketsCountries.
The MSCI EAFE (Europe, Australasia, Far East) Net Total Return USD Index is an unmanaged index. It is a generally accepted benchmark for major overseas markets. Index weightingsrepresent the relative capitalizations of the major overseas developed markets on a U.S. dollar adjusted basis. The index is calculated with net dividends reinvested in U.S. dollars.
The MSCI All Country (AC) World ex USA Growth Net Total Return USD Index is a market capitalization weighted index that includes growth companies in developed and emerging marketsthroughout the world, excluding the United States.
The MSCI Emerging Markets Index is a free float-adjusted market capitalization index that is designed to measure equity market performance of emerging markets. The MSCI EmergingMarkets Index consists of the following 23 emerging market country indexes: Brazil, Chile, China, Colombia, Czech Republic, Egypt, Greece, Hungary, India, Indonesia, Korea, Malaysia,Mexico, Peru, Philippines, Poland, Qatar, Russia, South Africa, Taiwan, Thailand, Turkey and United Arab Emirates.
The Russell 2500 Total Return Index measures the performance of the 2,500 smallest companies in the Russell 3000 Index, with a weighted average market capitalization of approximately$4.3 billion, median capitalization of $1.2 billion and market capitalization of the largest company of $18.7 billion.
The Russell 2500 Growth Total Return Index measures the performance of the small to mid-cap growth segment of the U.S. equity universe. It includes those Russell 2500™ companieswith higher growth earning potential as defined by FTSE Russell’s leading style methodology. Source: Frank Russell Company.
Net Adjusted S&P 500 Index – For illustration purposes, the net adjusted S&P 500 Index adjusts the total return of the S&P 500 Index to reflect the same net exposure as the Fund.
P/E - Price/Earnings ratio (P/E ratio) is a valuation ratio of a company’s current share price compared to its per-share earnings. P/E equals a company’s market value per share divided byearnings per share. Forecasted P/E is not intended to be a forecast of the Fund’s future performance.
Price/Book ratio (P/B ratio) – A ratio used to compare a stock’s market value to its book value. It is calculated by dividing the current closing price of the stock by the latest quarter’s bookvalue per share.
Yield to Worst (YTW) – The lowest potential yield that can be received on a bond without the issuer actually defaulting.
The performance of any index is not indicative of the performance of any particular investment. Unless otherwise noted, index returns reflect the reinvestment of income dividends and capitalgains, if any, but do not reflect fees, brokerage commissions or other expenses of investing. Investors may not make direct investments into any index.
Any securities, sectors, or countries mentioned are for illustration purposes only. Holdings are subject to change. Under no circumstances does the information contained within represent arecommendation to buy or sell any security.
The information given should not be considered tax advice. Please consult your tax advisor for personal tax questions and concerns.
GlossaryMarch 31, 2022 (Unaudited)
20 | Thornburg Equity Funds Semi-Annual Report

This page intentionally left blank.
Thornburg Equity Funds Semi-Annual Report | 21

To appreciate the investment environment in which Thornburg Investment Income Builder Fund operates, youmay wish to review these highlights of the “dividend landscape.”
The S&P 500 Index Payout Ratio — A
Historical Perspective
The dividend payout ratio is a fraction thatexpresses dividend payments as a percentage ofper-share earnings. As the economy slowed inthe wake of the financial crisis, earnings-per-share on average declined, causing the payoutratio to spike, even as dividends paid by theS&P 500 portfolio declined. Earnings have sincematerially improved, bringing the payout ratioback in line with the overall trend in recent times.
Corporate Willingness to Pay
Dividends is Key to the Fund’s
Investment Process
The Russell 1000 Index includes approximately1,000 public companies that are supposed to begenerally representative of corporate America.Between 1980 and 1993, at least 75% of thesefirms paid some dividend. Between 1994 and2001, the percentage of Russell 1000 companiespaying dividends sank to just over 50%, indicat-ing a preference towards reinvesting retainedearnings in growth initiatives. Dividends returnedto fashion between 2002 and 2008. A reductionin the number of Russell 1000 firms paying divi-dends followed the 2008 recession. However,from early 2010, the number steadily climbedback to around 70%.
Rising Dividend Payments Despite
Decreasing Dividend Yields
Over time, the dollar dividend per unit of theS&P 500 Index has generally increased. Becausethe price of the index itself has increased evenmore, the yield on the S&P 500 Index, as a per-centage of the current index price, has generallydecreased in recent decades. You should note,however, that the dollar yield on an originalinvestment made at a fixed point in time (say,1970 or 1989) has increased, even without rein-vestment of dividends.
S&P 500 Index Payout Ratio
0%
20%
40%
60%
80%
100%
Sep-40 Feb-53 Jul-65 Dec-77 May-90 Oct-02 Mar-15 Mar-22
Source: Bloomberg, beginning in 1999 (uses operating earnings); “Irrational Exuberance”by Robert J. Shiller, through 1998 (uses reported earnings).
Percentage of Companies Paying Dividends in Russell 1000 Index
Nov-7950%
60%
70%
80%
90%
Aug-85 May-91 Feb-97 Nov-02 Aug-08 May-14 Mar-22Feb-20
Source: CSFB Quantitative and Equity Derivatives Strategy, Baseline, and FactSet.
S&P 500 Index Average Yield vs. Annual Dividends from aHypothetical $100,000 Investment (Dividends not Reinvested)
$0
$10,000
$20,000
$30,000
$40,000
$50,000
$60,000
$70,000
0%
5%
10%
15%
20%
25%
30%($) Dividends (left axis)Yield (right axis)
1970 1974 1978 1982 1986 1990 1994 1998 2002 2006 2010 2014 2018 1Q22
Source: Bloomberg and FactSet as of 3/31/22.Past performance does not guarantee future results.
The Dividend LandscapeThornburg Investment Income Builder Fund | March 31, 2022 (Unaudited)
22 | Thornburg Equity Funds Semi-Annual Report

The Top 100 Dividend Yields
RUSSELL 1000INDEX
RUSSELL 2000INDEX
Financials 26% 40%
Real Estate 22% 28%
Energy 10% 7%
Consumer Discretionary 9% 8%
Utilities 8% 1%
Consumer Staples 7% 4%
Materials 5% 4%
Health Care 4% 1%
Information Technology 4% 1%
Communication Services 3% 2%
Industrials 2% 4%
Source: FactSet as of March 31, 2022.
Estimated Average Dividend Yields (MSCI Indices) of MarketsAround the Globe
0%
1%
2%
3%
4%
5%
AUSTRALIAU.K.NORDICCOUNTRIES
EUROPEEX-U.K.
JAPANCHINAUSA0%
10%
20%
30%
40%
50%
60%
70%
80%
Payo
ut R
atio
202
2E
Divi
dend
Yie
ld 2
022E
Dividend Yield 2022EPayout Ratio 2022E
7%
6%
EM LATINAMERICA
Source: Bloomberg as of March 31, 2022.
A Truly Diversified Dividend-Paying
Portfolio Must Look Beyond the
Obvious High-Yield Stocks!
In the (large cap) Russell 1000 Index, 48% of thetop 100 dividend payers are in the financials andreal estate sectors. In the (small cap) Russell2000 Index, 68% of the top 100 dividend-yieldingstocks are real estate or financials companies. Toconstruct a diversified portfolio of attractive yield-ing stocks, one must look beyond these sectors.We certainly do.
Dividend yield is a ratio that shows how much a company pays outin dividends each year relative to its share price.
Global Diversification Can Improve the
Portfolio Yield
Since firms outside the U.S. tend to pay higherdividends than U.S. firms, particularly outside thefinancial and utility sectors, we maintain the abilityto diversify the Thornburg Investment IncomeBuilder Fund into foreign dividend-paying stocksto try to take advantage of these opportunities.
Diversification does not assure or guarantee better performanceand cannot eliminate the risk of investment losses.
Dividends are not guaranteed.
The Dividend Landscape, Continued
Thornburg Investment Income Builder Fund | March 31, 2022 (Unaudited)
Thornburg Equity Funds Semi-Annual Report | 23

Fund Summary
ASSET STRUCTURE
56.4%Foreign Equity
39.5%Domestic Equity
4.1%Other Assets Less Liabilities
0.0%Small Cap (<$2.5 B)
20.0%Mid Cap ($2.5-12 B)
80.0%Large Cap (>$12 B)
TOP TEN EQUITY HOLDINGS
Reliance Industries Ltd. 5.7%
Alphabet, Inc. Class A 5.0%
TotalEnergies SE 4.6%
OCI NV 4.3%
Samsung Electronics Co. Ltd. 4.2%
Capital One Financial Corp. 4.0%
Bank of Ireland Group plc 3.7%
NN Group NV 3.6%
Charles Schwab Corp. 3.5%
Tesco plc 3.4%
SECTOR EXPOSURE
Financials 18.1%
Communication Services 16.0%
Materials 12.7%
Information Technology 11.6%
Energy 10.3%
Consumer Discretionary 9.8%
Health Care 7.9%
Industrials 6.1%
Consumer Staples 3.4%
Other Assets Less Liabilities 4.1%
TOP TEN INDUSTRY GROUPS
Materials 12.7%
Energy 10.3%
Media & Entertainment 9.7%
Diversified Financials 7.5%
Semiconductors & Semiconductor Equipment 7.4%
Pharmaceuticals, Biotechnology & Life Sciences 7.4%
Banks 7.0%
Telecommunication Services 6.3%
Retailing 4.9%
Technology Hardware & Equipment 4.2%
THORNBURG GLOBALOPPORTUNITIES FUND NASDAQ SYMBOLS CUSIPS
Class A THOAX 885-215-343Class C THOCX 885-215-335Class I THOIX 885-215-327Class R3 THORX 885-215-145Class R4 THOVX 885-215-137Class R5 THOFX 885-215-129Class R6 THOGX 885-216-655
Class I, R3, R4, R5, and R6 shares may not be available to all investors. Minimuminvestments for Class I shares may be higher than those for other classes.
There is no guarantee that the Fund will meet its investment objectives.
All data is subject to change. Charts may not add up to 100% due to rounding.
Fund SummaryThornburg Global Opportunities Fund | March 31, 2022 (Unaudited)
24 | Thornburg Equity Funds Semi-Annual Report

MARKET CAPITALIZATION EXPOSURE
0.0%Small Cap (<$2.5 B)
2.5%Mid Cap ($2.5-12 B)
97.5%Large Cap (>$12 B)
BASKET STRUCTURE
48.0%Basic Value
39.4%Consistent Earners
6.9%Emerging Franchise
5.7%Other Assets Less Liabilities
TOP TEN EQUITY HOLDINGS
TotalEnergies SE 3.9%
CME Group, Inc. 3.1%
LVMH Moet Hennessy Louis Vuitton SE 2.8%
Kuehne + Nagel International AG 2.8%
Canadian Pacific Railway Ltd. 2.7%
Linde plc 2.7%
ABB Ltd. 2.7%
Kweichow Moutai Co. Ltd. Class A 2.6%
Roche Holding AG 2.5%
Tencent Holdings Ltd. 2.5%
SECTOR EXPOSURE
Industrials 19.1%
Information Technology 16.1%
Financials 13.5%
Utilities 8.4%
Communication Services 8.2%
Consumer Discretionary 8.2%
Materials 7.0%
Consumer Staples 5.0%
Health Care 4.9%
Energy 3.9%
Other Assets Less Liabilities 5.7%
TOP TEN INDUSTRY GROUPS
Capital Goods 11.7%
Utilities 8.4%
Consumer Durables & Apparel 7.0%
Materials 7.0%
Semiconductors & Semiconductor Equipment 6.9%
Banks 6.8%
Technology Hardware & Equipment 6.3%
Transportation 5.5%
Media & Entertainment 5.2%
Pharmaceuticals, Biotechnology & Life Sciences 4.9%
THORNBURG INTERNATIONALEQUITY FUND NASDAQ SYMBOLS CUSIPS
Class A TGVAX 885-215-657Class C THGCX 885-215-640Class I TGVIX 885-215-566Class R3 TGVRX 885-215-525Class R4 THVRX 885-215-269Class R5 TIVRX 885-215-368Class R6 TGIRX 885-216-804
Class I, R3, R4, R5, and R6 shares may not be available to all investors. Minimuminvestments for Class I shares may be higher than those for other classes.
There is no guarantee that the Fund will meet its investment objectives.
All data is subject to change. Charts may not add up to 100% due to rounding.
Fund SummaryThornburg International Equity Fund | March 31, 2022 (Unaudited)
Thornburg Equity Funds Semi-Annual Report | 25

MARKET CAPITALIZATION EXPOSURE
1.2%Small Cap (<$2.5 B)
9.5%Mid Cap ($2.5-12 B)
89.3%Large Cap (>$12 B)
BASKET STRUCTURE
39.2%Basic Value
35.0%Consistent Earners
14.8%Emerging Franchise
11.0%Other Assets Less Liabilities
TOP TEN EQUITY HOLDINGS
Roche Holding AG 2.8%
L’Oreal SA 2.7%
Taiwan Semiconductor Manufacturing Co. Ltd. 2.6%
Seven & i Holdings Co. Ltd. 2.5%
Tesco plc 2.5%
Sony Corp. 2.4%
Hitachi Ltd. 2.4%
Recruit Holdings Co. Ltd. 2.4%
Novartis AG 2.2%
Visa, Inc. Class A 2.2%
SECTOR EXPOSURE
Information Technology 23.4%
Industrials 16.7%
Consumer Staples 11.8%
Materials 9.6%
Consumer Discretionary 9.3%
Financials 7.6%
Health Care 6.3%
Communication Services 2.9%
Real Estate 0.7%
Utilities 0.7%
Other Assets Less Liabilities 11.0%
TOP TEN INDUSTRY GROUPS
Software & Services 10.5%
Materials 9.6%
Semiconductors & Semiconductor Equipment 8.3%
Capital Goods 8.0%
Commercial & Professional Services 7.2%
Food & Staples Retailing 6.3%
Pharmaceuticals, Biotechnology & Life Sciences 6.3%
Household & Personal Products 5.5%
Technology Hardware & Equipment 4.6%
Consumer Durables & Apparel 4.4%
THORNBURG BETTER WORLDINTERNATIONAL FUND NASDAQ SYMBOLS CUSIPS
Class A TBWAX 885-216-721Class C TBWCX 885-216-713Class I TBWIX 885-216-697
Class I shares may not be available to all investors. Minimum investments for Class I sharesmay be higher than those for other classes.
There is no guarantee that the Fund will meet its investment objectives.
All data is subject to change. Charts may not add up to 100% due to rounding.
Fund SummaryThornburg Better World International Fund | March 31, 2022 (Unaudited)
26 | Thornburg Equity Funds Semi-Annual Report
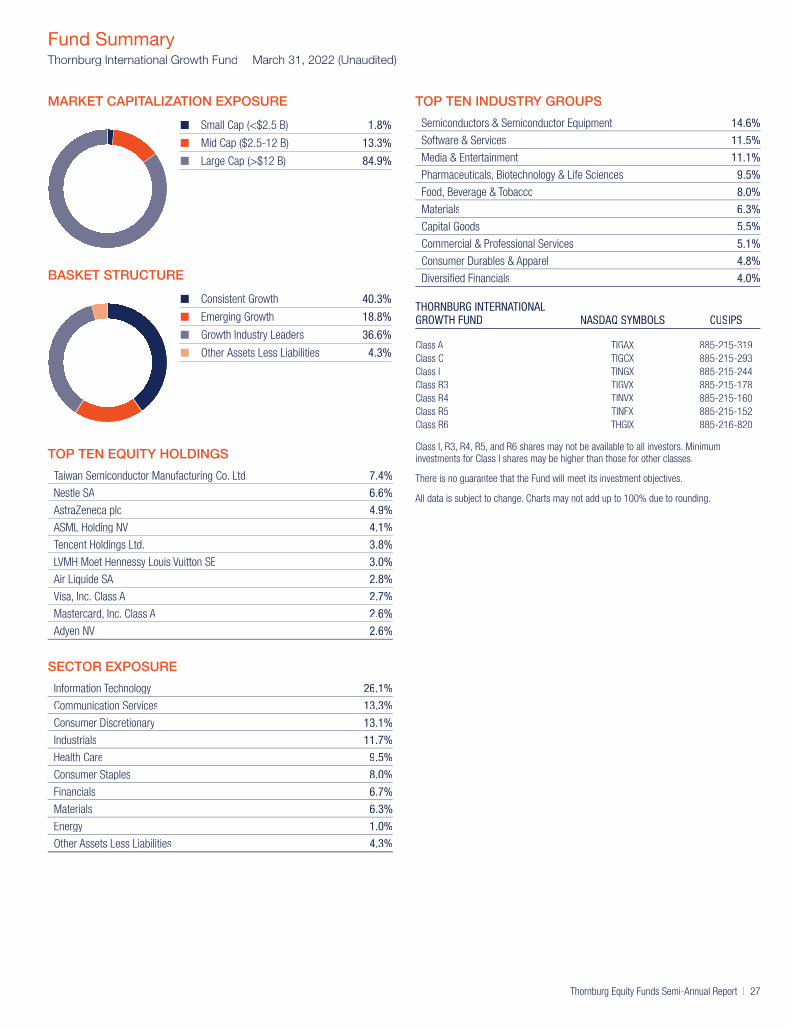
MARKET CAPITALIZATION EXPOSURE
1.8%Small Cap (<$2.5 B)
13.3%Mid Cap ($2.5-12 B)
84.9%Large Cap (>$12 B)
BASKET STRUCTURE
40.3%Consistent Growth
18.8%Emerging Growth
36.6%Growth Industry Leaders
4.3%Other Assets Less Liabilities
TOP TEN EQUITY HOLDINGS
Taiwan Semiconductor Manufacturing Co. Ltd. 7.4%
Nestle SA 6.6%
AstraZeneca plc 4.9%
ASML Holding NV 4.1%
Tencent Holdings Ltd. 3.8%
LVMH Moet Hennessy Louis Vuitton SE 3.0%
Air Liquide SA 2.8%
Visa, Inc. Class A 2.7%
Mastercard, Inc. Class A 2.6%
Adyen NV 2.6%
SECTOR EXPOSURE
Information Technology 26.1%
Communication Services 13.3%
Consumer Discretionary 13.1%
Industrials 11.7%
Health Care 9.5%
Consumer Staples 8.0%
Financials 6.7%
Materials 6.3%
Energy 1.0%
Other Assets Less Liabilities 4.3%
TOP TEN INDUSTRY GROUPS
Semiconductors & Semiconductor Equipment 14.6%
Software & Services 11.5%
Media & Entertainment 11.1%
Pharmaceuticals, Biotechnology & Life Sciences 9.5%
Food, Beverage & Tobacco 8.0%
Materials 6.3%
Capital Goods 5.5%
Commercial & Professional Services 5.1%
Consumer Durables & Apparel 4.8%
Diversified Financials 4.0%
THORNBURG INTERNATIONALGROWTH FUND NASDAQ SYMBOLS CUSIPS
Class A TIGAX 885-215-319Class C TIGCX 885-215-293Class I TINGX 885-215-244Class R3 TIGVX 885-215-178Class R4 TINVX 885-215-160Class R5 TINFX 885-215-152Class R6 THGIX 885-216-820
Class I, R3, R4, R5, and R6 shares may not be available to all investors. Minimuminvestments for Class I shares may be higher than those for other classes.
There is no guarantee that the Fund will meet its investment objectives.
All data is subject to change. Charts may not add up to 100% due to rounding.
Fund SummaryThornburg International Growth Fund | March 31, 2022 (Unaudited)
Thornburg Equity Funds Semi-Annual Report | 27

MARKET CAPITALIZATION EXPOSURE
3.7%Small Cap (<$2.5 B)
12.4%Mid Cap ($2.5-12 B)
83.9%Large Cap (>$12 B)
BASKET STRUCTURE
43.2%Basic Value
39.6%Consistent Earners
15.1%Emerging Franchise
2.1%Other Assets Less Liabilities
TOP TEN EQUITY HOLDINGS
Taiwan Semiconductor Manufacturing Co. Ltd. 9.0%
Tencent Holdings Ltd. 4.7%
Samsung Electronics Co. Ltd. 3.9%
First Quantum Minerals Ltd. 3.0%
Yum China Holdings, Inc. 3.0%
B3 S.A. - Brasil Bolsa Balcao 2.7%
AIA Group Ltd. 2.7%
Micron Technology, Inc. 2.6%
Grupo Aeroportuario del Pacifico SAB de CV Class B 2.6%
Infosys Ltd. Sponsored ADR 2.5%
SECTOR EXPOSURE
Financials 25.3%
Information Technology 23.4%
Consumer Discretionary 14.7%
Communication Services 12.2%
Materials 5.7%
Industrials 4.7%
Consumer Staples 4.0%
Energy 3.0%
Utilities 2.6%
Health Care 2.3%
Other Assets Less Liabilities 2.1%
TOP TEN INDUSTRY GROUPS
Semiconductors & Semiconductor Equipment 12.9%
Banks 12.0%
Diversified Financials 9.5%
Media & Entertainment 8.4%
Technology Hardware & Equipment 6.5%
Retailing 6.4%
Materials 5.7%
Consumer Services 4.3%
Software & Services 4.0%
Insurance 3.8%
THORNBURG DEVELOPING WORLD FUND NASDAQ SYMBOLS CUSIPS
Class A THDAX 885-216-408Class C THDCX 885-216-507Class I THDIX 885-216-606Class R5 THDRX 885-216-846Class R6 TDWRX 885-216-838
Class I, R5, and R6 shares may not be available to all investors. Minimum investments forClass I shares may be higher than those for other classes.
There is no guarantee that the Fund will meet its investment objectives.
All data is subject to change. Charts may not add up to 100% due to rounding.
Fund SummaryThornburg Developing World Fund | March 31, 2022 (Unaudited)
28 | Thornburg Equity Funds Semi-Annual Report
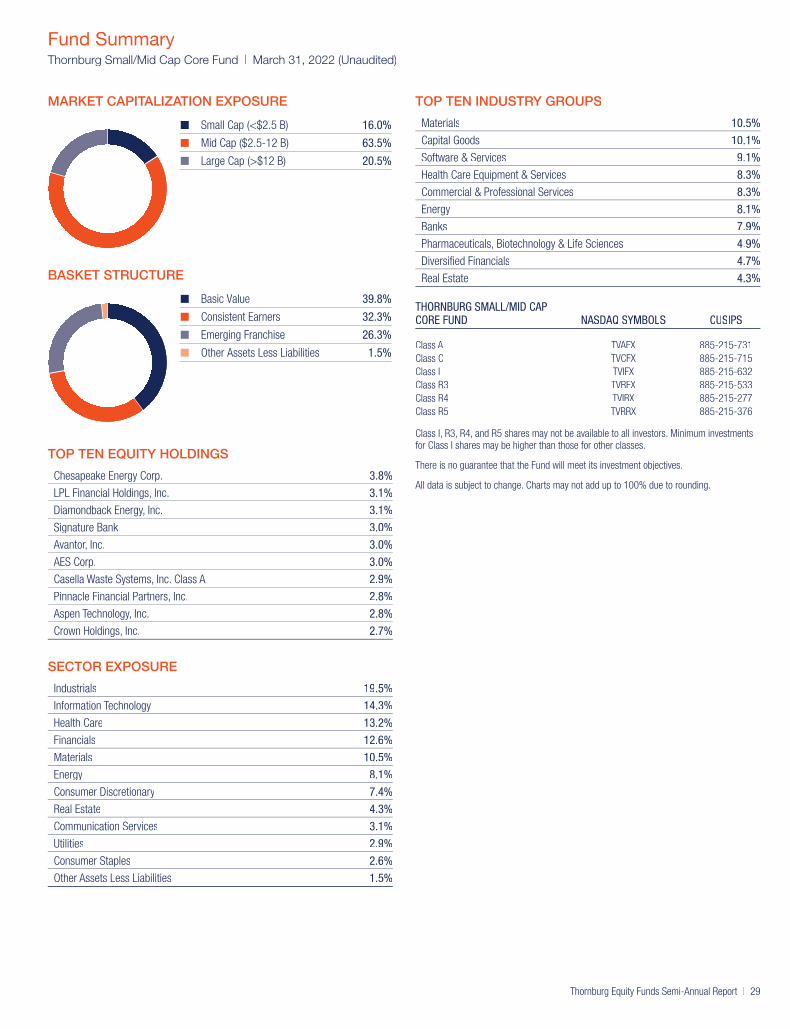
MARKET CAPITALIZATION EXPOSURE
16.0%Small Cap (<$2.5 B)
63.5%Mid Cap ($2.5-12 B)
20.5%Large Cap (>$12 B)
BASKET STRUCTURE
39.8%Basic Value
32.3%Consistent Earners
26.3%Emerging Franchise
1.5%Other Assets Less Liabilities
TOP TEN EQUITY HOLDINGS
Chesapeake Energy Corp. 3.8%
LPL Financial Holdings, Inc. 3.1%
Diamondback Energy, Inc. 3.1%
Signature Bank 3.0%
Avantor, Inc. 3.0%
AES Corp. 3.0%
Casella Waste Systems, Inc. Class A 2.9%
Pinnacle Financial Partners, Inc. 2.8%
Aspen Technology, Inc. 2.8%
Crown Holdings, Inc. 2.7%
SECTOR EXPOSURE
Industrials 19.5%
Information Technology 14.3%
Health Care 13.2%
Financials 12.6%
Materials 10.5%
Energy 8.1%
Consumer Discretionary 7.4%
Real Estate 4.3%
Communication Services 3.1%
Utilities 2.9%
Consumer Staples 2.6%
Other Assets Less Liabilities 1.5%
TOP TEN INDUSTRY GROUPS
Materials 10.5%
Capital Goods 10.1%
Software & Services 9.1%
Health Care Equipment & Services 8.3%
Commercial & Professional Services 8.3%
Energy 8.1%
Banks 7.9%
Pharmaceuticals, Biotechnology & Life Sciences 4.9%
Diversified Financials 4.7%
Real Estate 4.3%
THORNBURG SMALL/MID CAPCORE FUND NASDAQ SYMBOLS CUSIPS
Class A TVAFX 885-215-731Class C TVCFX 885-215-715Class I TVIFX 885-215-632Class R3 TVRFX 885-215-533Class R4 TVIRX 885-215-277Class R5 TVRRX 885-215-376
Class I, R3, R4, and R5 shares may not be available to all investors. Minimum investmentsfor Class I shares may be higher than those for other classes.
There is no guarantee that the Fund will meet its investment objectives.
All data is subject to change. Charts may not add up to 100% due to rounding.
Fund SummaryThornburg Small/Mid Cap Core Fund | March 31, 2022 (Unaudited)
Thornburg Equity Funds Semi-Annual Report | 29

MARKET CAPITALIZATION EXPOSURE
12.9%Small Cap (<$2.5 B)
66.3%Mid Cap ($2.5-12 B)
20.7%Large Cap (>$12 B)
BASKET STRUCTURE
24.7%Consistent Earners
22.1%Disruptor
51.9%Emerging Franchise
1.4%Other Assets Less Liabilities
TOP TEN EQUITY HOLDINGS
Avantor, Inc. 3.7%
Horizon Therapeutics plc 3.3%
Casella Waste Systems, Inc. Class A 3.0%
Signature Bank 2.9%
Chart Industries, Inc. 2.8%
Entegris, Inc. 2.8%
CONMED Corp. 2.7%
Monolithic Power Systems, Inc. 2.7%
Eventbrite, Inc. Class A 2.6%
Teledyne Technologies, Inc. 2.6%
SECTOR EXPOSURE
Information Technology 34.0%
Health Care 22.4%
Industrials 16.2%
Consumer Discretionary 11.5%
Financials 5.9%
Consumer Staples 3.8%
Communication Services 2.6%
Materials 2.2%
Other Assets Less Liabilities 1.4%
TOP TEN INDUSTRY GROUPS
Software & Services 19.6%
Pharmaceuticals, Biotechnology & Life Sciences 11.4%
Health Care Equipment & Services 11.0%
Semiconductors & Semiconductor Equipment 9.4%
Capital Goods 8.3%
Commercial & Professional Services 5.6%
Technology Hardware & Equipment 5.0%
Retailing 4.8%
Consumer Durables & Apparel 3.8%
Food, Beverage & Tobacco 3.8%
THORNBURG SMALL/MID CAPGROWTH FUND NASDAQ SYMBOLS CUSIPS
Class A THCGX 885-215-582Class C TCGCX 885-215-574Class I THIGX 885-215-475Class R3 THCRX 885-215-517Class R4 TCGRX 885-215-251Class R5 THGRX 885-215-350
Class I, R3, R4, and R5 shares may not be available to all investors. Minimum investmentsfor Class I shares may be higher than those for other classes.
There is no guarantee that the Fund will meet its investment objectives.
All data is subject to change. Charts may not add up to 100% due to rounding.
Fund SummaryThornburg Small/Mid Cap Growth Fund | March 31, 2022 (Unaudited)
30 | Thornburg Equity Funds Semi-Annual Report

PORTFOLIO COMPOSITION
52.6%Foreign Equity
32.8%Domestic Equity
4.4%Domestic Other Bonds
4.0%Domestic Corporate Bonds
2.9%Foreign Bonds
3.3%Other Assets Less Liabilities
TOP TEN EQUITY HOLDINGS
TotalEnergies SE 3.9%
Broadcom, Inc. 3.9%
Orange SA 3.8%
Vodafone Group plc 3.4%
AbbVie, Inc. 3.4%
Taiwan Semiconductor Manufacturing Co. Ltd. 3.3%
CME Group, Inc. 3.3%
Deutsche Telekom AG 3.0%
Samsung Electronics Co. Ltd. 3.0%
QUALCOMM, Inc. 2.5%
SECTOR EXPOSURE(percent of equity holdings)
Financials 25.0%
Communication Services 16.7%
Information Technology 16.0%
Health Care 14.3%
Utilities 6.3%
Materials 5.7%
Energy 4.8%
Consumer Staples 4.6%
Consumer Discretionary 3.5%
Industrials 2.3%
Real Estate 0.8%
Fund SummaryThornburg Investment Income Builder Fund | March 31, 2022 (Unaudited)
Thornburg Equity Funds Semi-Annual Report | 31

QUARTERLY DIVIDEND HISTORY, CLASS A
YEAR Q1 Q2 Q3 Q4 TOTAL
2003 9.2¢ 11.2¢ 12.4¢ 17.5¢ 50.3¢
2004 10.2¢ 12.5¢ 15.0¢ 21.8¢ 59.5¢
2005 11.0¢ 13.6¢ 17.4¢ 29.0¢ 71.0¢
2006 12.5¢ 16.0¢ 19.2¢ 33.0¢ 80.7¢
2007 14.2¢ 18.5¢ 21.5¢ 36.8¢ 91.0¢
2008 17.9 2¢ 1.8¢ 26.0¢ 36.8¢ 102.5¢
2009 18.0¢ 24.2¢ 28.0¢ 34.5¢ 104.7¢
2010 19.8¢ 25.0¢ 32.0¢ 36.0¢ 112.8¢
2011 21.0¢ 26.0¢ 32.0¢ 37.5¢ 116.5¢
2012 21.5¢ 26.0¢ 28.5¢ 36.0¢ 112.0¢
2013 21.5¢ 25.3¢ 25.0¢ 24.5¢ 96.3¢
2014 22.5¢ 24.0¢ 27.0¢ 26.0¢ 99.5¢
2015 16.5¢ 20.0¢ 20.0¢ 25.3¢ 81.8¢
2016 17.0¢ 18.5¢ 19.5¢ 21.5¢ 76.5¢
2017 17.0¢ 20.0¢ 26.0¢ 29.5¢ 92.5¢
2018 18.0¢ 20.0¢ 24.0¢ 28.0¢ 90.0¢
2019 19.0¢ 21.5¢ 25.0¢ 30.0¢ 95.5¢
2020 19.0¢ 19.0¢ 21.0¢ 29.0¢ 88.0¢
2021 22.5¢ 27.5¢ 31.0¢ 43.5¢ 124.5¢
2022 20.0¢
We do not expect each sequential quarter’s dividend to increase over that of the prior quarter, since dividend payments outside the United States tend to be seasonal. Rather, the Fund aspiresto increase the dividend paid on an annual basis.
Fund Summary, Continued
Thornburg Investment Income Builder Fund | March 31, 2022 (Unaudited)
32 | Thornburg Equity Funds Semi-Annual Report

EVOLUTION OF INDUSTRY GROUP EXPOSURETop 10 industry groups quarter by quarter (percent of equity holdings)
As of 3/31/2022
Telecommunication Services 16.7%
Pharmaceuticals, Biotechnology & Life Sciences 14.3%
Semiconductors & Semiconductor Equipment 11.4%
Diversified Financials 11.3%
Insurance 6.9%
Banks 6.8%
Utilities 6.3%
Materials 5.7%
Energy 4.8%
Technology Hardware & Equipment 4.6%
As of 12/31/2021
Telecommunication Services 14.6%
Pharmaceuticals, Biotechnology & Life Sciences 13.1%
Semiconductors & Semiconductor Equipment 12.9%
Diversified Financials 11.4%
Banks 7.2%
Insurance 6.8%
Utilities 5.9%
Energy 5.5%
Food & Staples Retailing 5.3%
Materials 5.1%
As of 9/30/2021
Telecommunication Services 16.0%
Pharmaceuticals, Biotechnology & Life Sciences 12.0%
Semiconductors & Semiconductor Equipment 11.7%
Diversified Financials 11.7%
Banks 7.9%
Insurance 7.4%
Energy 5.4%
Food & Staples Retailing 5.1%
Technology Hardware & Equipment 4.9%
Utilities 4.8%
As of 6/30/2021
Telecommunication Services 18.0%
Diversified Financials 12.5%
Semiconductors & Semiconductor Equipment 12.1%
Pharmaceuticals, Biotechnology & Life Sciences 11.2%
Banks 7.2%
Insurance 6.4%
Technology Hardware & Equipment 5.4%
Food & Staples Retailing 4.9%
Energy 4.8%
Utilities 4.7%
THORNBURG INVESTMENT INCOMEBUILDER FUND NASDAQ SYMBOLS CUSIPS
Class A TIBAX 885-215-558Class C TIBCX 885-215-541Class I TIBIX 885-215-467Class R3 TIBRX 885-215-384Class R4 TIBGX 885-215-186Class R5 TIBMX 885-215-236Class R6 TIBOX 885-216-663
Class I, R3, R4, R5, and R6 shares may not be available to all investors. Minimuminvestments for Class I shares may be higher than those for other classes.
There is no guarantee that the Fund will meet its investment objectives.
All data is subject to change. Charts may not add up to 100% due to rounding.
Fund Summary, Continued
Thornburg Investment Income Builder Fund | March 31, 2022 (Unaudited)
Thornburg Equity Funds Semi-Annual Report | 33
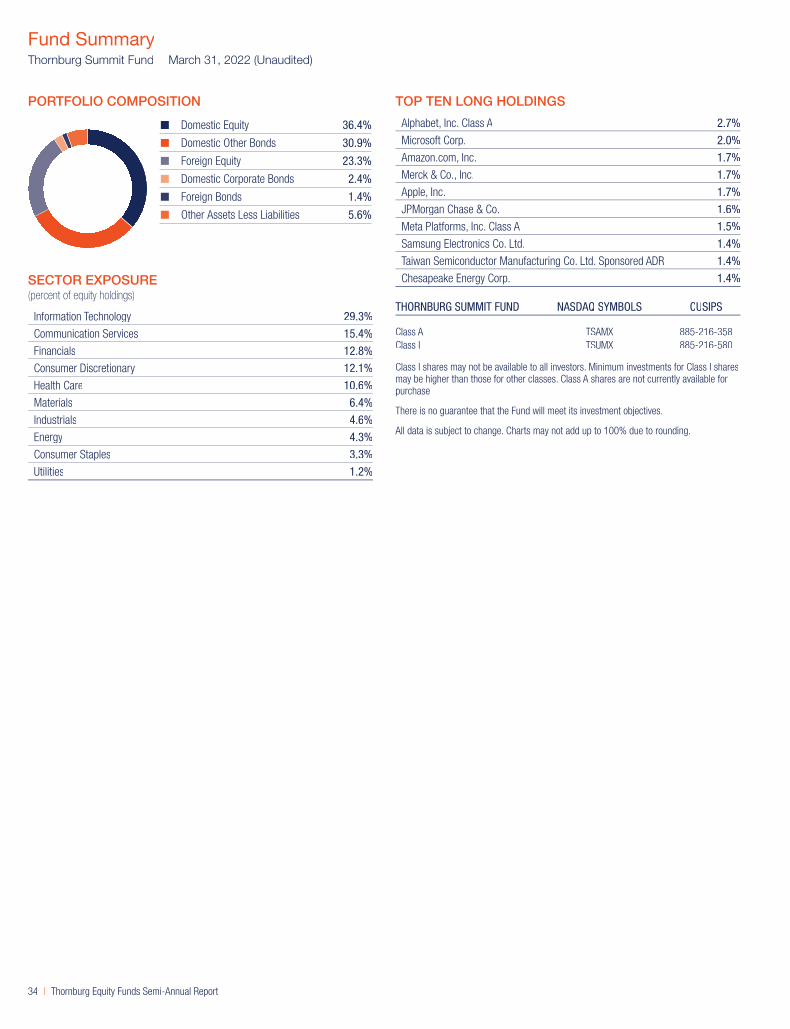
PORTFOLIO COMPOSITION
36.4%Domestic Equity
30.9%Domestic Other Bonds
23.3%Foreign Equity
2.4%Domestic Corporate Bonds
1.4%Foreign Bonds
5.6%Other Assets Less Liabilities
SECTOR EXPOSURE(percent of equity holdings)
Information Technology 29.3%
Communication Services 15.4%
Financials 12.8%
Consumer Discretionary 12.1%
Health Care 10.6%
Materials 6.4%
Industrials 4.6%
Energy 4.3%
Consumer Staples 3.3%
Utilities 1.2%
TOP TEN LONG HOLDINGS
Alphabet, Inc. Class A 2.7%
Microsoft Corp. 2.0%
Amazon.com, Inc. 1.7%
Merck & Co., Inc. 1.7%
Apple, Inc. 1.7%
JPMorgan Chase & Co. 1.6%
Meta Platforms, Inc. Class A 1.5%
Samsung Electronics Co. Ltd. 1.4%
Taiwan Semiconductor Manufacturing Co. Ltd. Sponsored ADR 1.4%
Chesapeake Energy Corp. 1.4%
THORNBURG SUMMIT FUND NASDAQ SYMBOLS CUSIPS
Class A TSAMX 885-216-358Class I TSUMX 885-216-580
Class I shares may not be available to all investors. Minimum investments for Class I sharesmay be higher than those for other classes. Class A shares are not currently available forpurchase.
There is no guarantee that the Fund will meet its investment objectives.
All data is subject to change. Charts may not add up to 100% due to rounding.
Fund SummaryThornburg Summit Fund | March 31, 2022 (Unaudited)
34 | Thornburg Equity Funds Semi-Annual Report

ISSUER-DESCRIPTION SHARES VALUE
COMMON STOCK — 95.9%
BANKS — 7.0%
Banks — 7.0%a Bank of Ireland Group plc 6,154,498 $ 39,137,141
Citigroup, Inc. 631,692 33,732,353
72,869,494
CAPITAL GOODS — 3.1%
Aerospace & Defense — 0.8%
L3Harris Technologies, Inc. 34,910 8,674,088
Electrical Equipment — 2.3%
Vestas Wind Systems A/S 809,286 23,740,243
32,414,331
COMMERCIAL & PROFESSIONAL SERVICES — 3.0%
Professional Services — 3.0%a CACI International, Inc. Class A 103,000 31,029,780
31,029,780
CONSUMER DURABLES & APPAREL — 2.9%
Household Durables — 2.9%
Barratt Developments plc 4,509,656 30,700,854
30,700,854
CONSUMER SERVICES — 2.0%
Hotels, Restaurants & Leisure — 2.0%a Booking Holdings, Inc. 3,657 8,588,282
Galaxy Entertainment Group Ltd. 2,036,462 12,050,522
20,638,804
DIVERSIFIED FINANCIALS — 7.5%
Capital Markets — 3.5%
Charles Schwab Corp. 438,660 36,983,425
Consumer Finance — 4.0%
Capital One Financial Corp. 315,950 41,481,075
78,464,500
ENERGY — 10.3%
Oil, Gas & Consumable Fuels — 10.3%
Reliance Industries Ltd. 1,719,455 59,499,977TotalEnergies SE 953,499 48,246,591
107,746,568
FOOD & STAPLES RETAILING — 3.4%
Food & Staples Retailing — 3.4%
Tesco plc 9,854,184 35,675,129
35,675,129
HEALTH CARE EQUIPMENT & SERVICES — 0.5%
Health Care Technology — 0.5%a Teladoc Health, Inc. 76,025 5,483,683
5,483,683
INSURANCE — 3.6%
Insurance — 3.6%
NN Group NV 736,862 37,343,234
37,343,234
MATERIALS — 12.7%
Chemicals — 5.9%
CF Industries Holdings, Inc. 155,954 16,072,619a OCI NV 1,282,103 45,263,940
Schedule of InvestmentsThornburg Global Opportunities Fund | March 31, 2022 (Unaudited)
See notes to financial statements. Thornburg Equity Funds Semi-Annual Report | 35

ISSUER-DESCRIPTION SHARES VALUE
Metals & Mining — 6.8%
Antofagasta plc 621,589 $ 13,506,461Freeport-McMoRan, Inc. 344,564 17,138,613Lundin Mining Corp. 888,870 9,008,505Mineral Resources Ltd. 810,255 31,940,467
132,930,605
MEDIA & ENTERTAINMENT — 9.7%
Interactive Media & Services — 9.7%a Alphabet, Inc. Class A 18,872 52,489,637a Meta Platforms, Inc. Class A 132,590 29,482,712
Tencent Holdings Ltd. 429,779 19,810,381
101,782,730
PHARMACEUTICALS, BIOTECHNOLOGY & LIFE SCIENCES — 7.4%
Biotechnology — 2.5%
AbbVie, Inc. 164,587 26,681,198
Pharmaceuticals — 4.9%
Pfizer, Inc. 463,991 24,020,814Roche Holding AG 68,837 27,236,165
77,938,177
RETAILING — 4.9%
Internet & Direct Marketing Retail — 2.1%a Alibaba Group Holding Ltd. Sponsored ADR 177,938 19,359,655a JD.com, Inc. Class A 97,720 2,776,701
Specialty Retail — 2.8%
TJX Companies, Inc. 483,726 29,304,121
51,440,477
SEMICONDUCTORS & SEMICONDUCTOR EQUIPMENT — 7.4%
Semiconductors & Semiconductor Equipment — 7.4%
Micron Technology, Inc. 293,561 22,865,466a Qorvo, Inc. 202,387 25,116,227
Taiwan Semiconductor Manufacturing Co. Ltd. 1,462,114 29,993,094
77,974,787
TECHNOLOGY HARDWARE & EQUIPMENT — 4.2%
Technology Hardware, Storage & Peripherals — 4.2%
Samsung Electronics Co. Ltd. 765,727 43,817,170
43,817,170
TELECOMMUNICATION SERVICES — 6.3%
Diversified Telecommunication Services — 5.9%b China Telecom Corp. Ltd. Class H 89,612,045 35,371,218a Converge ICT Solutions, Inc. 24,179,877 14,043,505
Deutsche Telekom AG 648,377 12,075,453
Wireless Telecommunication Services — 0.4%a T-Mobile US, Inc. 32,679 4,194,350
65,684,526
TOTAL COMMON STOCK (Cost $677,125,233) 1,003,934,849
SHORT-TERM INVESTMENTS — 3.7%c Thornburg Capital Management Fund 3,847,655 38,476,549
TOTAL SHORT-TERM INVESTMENTS (Cost $38,476,549) 38,476,549
TOTAL INVESTMENTS — 99.6% (Cost $715,601,782) $1,042,411,398
OTHER ASSETS LESS LIABILITIES — 0.4% 4,104,746
NET ASSETS — 100.0% $1,046,516,144
Schedule of Investments, Continued
Thornburg Global Opportunities Fund | March 31, 2022 (Unaudited)
36 | Thornburg Equity Funds Semi-Annual Report See notes to financial statements.

OUTSTANDING FORWARD CURRENCY CONTRACTS TO BUY OR SELL AT MARCH 31, 2022
CONTRACTDESCRIPTION
CONTRACTPARTY* BUY/SELL
CONTRACTAMOUNT
CONTRACTVALUE DATE
VALUEUSD
UNREALIZEDAPPRECIATION
UNREALIZEDDEPRECIATION
Great Britain Pound SSB Sell 44,626,700 4/14/2022 58,619,120 $ 2,480,812 $ —Great Britain Pound SSB Buy 5,052,400 4/14/2022 6,636,548 13,787 —Euro SSB Sell 26,548,500 5/18/2022 29,412,219 855,726 —Euro BBH Sell 20,187,100 5/18/2022 22,364,631 658,353 —
Total $ 4,008,678 —
Net unrealized appreciation (depreciation) $ 4,008,678
* Counterparties include State Street Bank and Trust Company (“SSB”) and Brown Brothers Harriman & Co. (“BBH”).
Footnote Legenda Non-income producing.b On November 12, 2020, the President of the United States issued an Executive Order (the �Order�) to prohibit, beginning January 11, 2021, US persons (which includes the Fund) from��
transacting in certain securities and derivatives of publicly traded securities of any company designated as a �Communist Chinese military company� (collectively with securities ofcertain subsidiaries of such companies and related depositary receipts that may be covered by the Order, �CCMC Securities�) by the US Department of Defense or the US Department of��
the Treasury’s Office of Foreign Assets Control (�(( OFAC�) unless such transactions are for purposes of divestment and occur through November 11, 2021. In addition, US persons are��
also prohibited from transacting in CCMS Securities designated as such 60 days after such designation.c Investment in Affiliates.
Portfolio AbbreviationsTo simplify the listings of securities, abbreviations are used per the table below:ADR American Depositary Receipt
COUNTRY EXPOSURE *(percent of equity holdings)
United States 41.2%
Netherlands 8.2%
China 7.7%
United Kingdom 6.6%
India 5.9%
France 4.8%
South Korea 4.4%
Ireland 3.9%
Australia 3.2%
Taiwan 3.0%
Switzerland 2.7%
Denmark 2.4%
Chile 2.2%
Philippines 1.4%
Germany 1.2%
Macao 1.2%
* Holdings are classified by country of risk as determined by MSCI and Bloomberg.
Schedule of Investments, Continued
Thornburg Global Opportunities Fund | March 31, 2022 (Unaudited)
See notes to financial statements. Thornburg Equity Funds Semi-Annual Report | 37

ISSUER-DESCRIPTION SHARES VALUE
COMMON STOCK — 94.2%
BANKS — 6.8%
Banks — 6.8%
China Merchants Bank Co. Ltd. Class A 3,085,084 $ 22,629,661ING Groep NV 5,806,357 60,623,736Intesa Sanpaolo SpA 25,987,646 59,479,598Mitsubishi UFJ Financial Group, Inc. 8,951,702 55,331,704
198,064,699
CAPITAL GOODS — 11.7%
Aerospace & Defense — 2.2%
Safran SA 542,046 63,818,034
Construction & Engineering — 2.0%
Ferrovial SA 2,146,055 57,074,016
Electrical Equipment — 5.7%
ABB Ltd. 2,357,979 76,494,469Schneider Electric SE 349,298 58,643,754Siemens Energy AG 1,290,935 29,369,714
Industrial Conglomerates — 1.3%
Hitachi Ltd. 773,679 38,718,117
Machinery — 0.5%
Kone OYJ Class B 274,755 14,377,949
338,496,053
COMMERCIAL & PROFESSIONAL SERVICES — 1.9%
Professional Services — 1.9%
Recruit Holdings Co. Ltd. 1,279,412 55,586,634
55,586,634
CONSUMER DURABLES & APPAREL — 7.0%
Household Durables — 2.4%
Sony Group Corp. 689,535 70,936,349
Textiles, Apparel & Luxury Goods — 4.6%
adidas AG 222,932 51,948,927LVMH Moet Hennessy Louis Vuitton SE 113,935 81,326,654
204,211,930
DIVERSIFIED FINANCIALS — 4.5%
Capital Markets — 4.5%
CITIC Securities Co. Ltd. Class A 11,983,838 39,276,617CME Group, Inc. 377,771 89,856,610
129,133,227
ENERGY — 3.9%
Oil, Gas & Consumable Fuels — 3.9%
TotalEnergies SE 2,215,151 112,085,575
112,085,575
FOOD & STAPLES RETAILING — 1.6%
Food & Staples Retailing — 1.6%
Seven & i Holdings Co. Ltd. 961,480 45,840,675
45,840,675
FOOD, BEVERAGE & TOBACCO — 2.6%
Beverages — 2.6%
Kweichow Moutai Co. Ltd. Class A 280,241 75,497,348
75,497,348
HOUSEHOLD & PERSONAL PRODUCTS — 0.8%
Personal Products — 0.8%
L’Oreal SA 55,579 22,200,758
22,200,758
Schedule of InvestmentsThornburg International Equity Fund | March 31, 2022 (Unaudited)
38 | Thornburg Equity Funds Semi-Annual Report See notes to financial statements.

ISSUER-DESCRIPTION SHARES VALUE
INSURANCE — 2.2%
Insurance — 2.2%
Assicurazioni Generali SpA 1,098,014 $ 25,113,938NN Group NV 748,905 37,953,558
63,067,496
MATERIALS — 7.0%
Chemicals — 5.7%
Air Liquide SA 331,413 57,978,638Linde plc 243,280 77,628,754Sika AG 89,987 29,772,525
Construction Materials — 0.9%
CRH plc 661,675 26,428,380
Metals & Mining — 0.4%
Norsk Hydro ASA 1,126,807 10,947,912
202,756,209
MEDIA & ENTERTAINMENT — 5.2%
Entertainment — 1.7%
Nintendo Co. Ltd. 101,194 51,078,876
Interactive Media & Services — 3.5%a Kanzhun Ltd. ADR 1,156,695 28,813,272
Tencent Holdings Ltd. 1,564,263 72,103,676
151,995,824
PHARMACEUTICALS, BIOTECHNOLOGY & LIFE SCIENCES — 4.9%
Pharmaceuticals — 4.9%
AstraZeneca plc 516,740 68,526,390Roche Holding AG 184,225 72,890,777
141,417,167
RETAILING — 1.2%
Internet & Direct Marketing Retail — 1.2%a Alibaba Group Holding Ltd. 522,908 7,135,974a JD.com, Inc. Class A 65,979 1,874,785
a,b Meituan Class B 1,386,035 26,256,960
35,267,719
SEMICONDUCTORS & SEMICONDUCTOR EQUIPMENT — 6.9%
Semiconductors & Semiconductor Equipment — 6.9%
Infineon Technologies AG 1,855,232 62,762,503a Renesas Electronics Corp. 4,695,169 54,402,767
Taiwan Semiconductor Manufacturing Co. Ltd. Sponsored ADR 576,898 60,147,385Tokyo Electron Ltd. 44,029 22,611,578
199,924,233
SOFTWARE & SERVICES — 2.9%
Information Technology Services — 2.9%
Mastercard, Inc. Class A 182,664 65,280,460a Shopify, Inc. Class A 28,308 19,135,076
84,415,536
TECHNOLOGY HARDWARE & EQUIPMENT — 6.3%
Communications Equipment — 2.4%
Telefonaktiebolaget LM Ericsson Class B 7,685,804 70,060,277
Electronic Equipment, Instruments & Components — 1.8%
Keyence Corp. 112,898 52,351,077
Technology Hardware, Storage & Peripherals — 2.1%
Samsung Electronics Co. Ltd. 1,056,941 60,481,299
182,892,653
Schedule of Investments, Continued
Thornburg International Equity Fund | March 31, 2022 (Unaudited)
See notes to financial statements. Thornburg Equity Funds Semi-Annual Report | 39

ISSUER-DESCRIPTION SHARES VALUE
TELECOMMUNICATION SERVICES — 3.0%
Diversified Telecommunication Services — 3.0%
Orange SA 3,600,706 $ 42,631,271Vantage Towers AG 1,243,231 43,911,313
86,542,584
TRANSPORTATION — 5.5%
Marine — 2.8%
Kuehne + Nagel International AG 281,638 79,965,209
Road & Rail — 2.7%
Canadian Pacific Railway Ltd. 957,580 79,038,653
159,003,862
UTILITIES — 8.3%
Electric Utilities — 6.1%
Electricite de France SA 3,020,447 28,350,478Endesa SA 2,030,396 44,269,969Enel SpA 7,974,555 53,244,105Iberdrola SA 4,750,930 51,927,517
Multi-Utilities — 2.2%
E.ON SE 5,377,710 62,478,995
240,271,064
TOTAL COMMON STOCK (Cost $2,382,079,400) 2,728,671,246
RIGHTS — 0.1%
UTILITIES — 0.1%
Electric Utilities — 0.1%a,c Electricite de France SA, 4/4/2022 3,020,446 1,122,699
1,122,699
TOTAL RIGHTS (Cost $0) 1,122,699
SHORT-TERM INVESTMENTS — 6.7%d Thornburg Capital Management Fund 19,365,609 193,656,095
TOTAL SHORT-TERM INVESTMENTS (Cost $193,656,095) 193,656,095
TOTAL INVESTMENTS — 101.0% (Cost $2,575,735,495) $2,923,450,040
LIABILITIES NET OF OTHER ASSETS — (1.0)% (27,874,512)
NET ASSETS — 100.0% $2,895,575,528
Footnote Legenda Non-income producing.b Securities exempt from registration under Rule 144A of the Securities Act of 1933, as amended. These securities are restricted but liquid and may only be resold in the ordinary course
of business in transactions exempt from registration, normally to qualified institutional buyers. As of March 31, 2022, the aggregate value of these securities in the Fund’s portfolio was$26,256,960, representing 0.91% of the Fund’s net assets.
c Security currently fair valued by the Valuation and Pricing Committee using procedures approved by the Trustees’ Audit Committee.d Investment in Affiliates.
Portfolio AbbreviationsTo simplify the listings of securities, abbreviations are used per the table below:ADR American Depositary Receipt
Schedule of Investments, Continued
Thornburg International Equity Fund | March 31, 2022 (Unaudited)
40 | Thornburg Equity Funds Semi-Annual Report See notes to financial statements.

COUNTRY EXPOSURE *(percent of equity holdings)
Japan 16.4%
France 15.0%
China 10.0%
Switzerland 9.5%
Germany 9.2%
United States 7.8%
Spain 5.6%
United Kingdom 5.4%
Italy 5.0%
Netherlands 3.6%
Canada 3.6%
Sweden 2.6%
South Korea 2.2%
Taiwan 2.2%
Ireland 1.0%
Finland 0.5%
Norway 0.4%
* Holdings are classified by country of risk as determined by MSCI and Bloomberg.
Schedule of Investments, Continued
Thornburg International Equity Fund | March 31, 2022 (Unaudited)
See notes to financial statements. Thornburg Equity Funds Semi-Annual Report | 41

ISSUER-DESCRIPTION SHARES VALUE
COMMON STOCK — 89.0%
BANKS — 3.7%
Banks — 3.7%
Bank of Montreal 77,078 $ 9,070,068ING Groep NV 222,322 2,321,247United Overseas Bank Ltd. 230,000 5,381,540
16,772,855
CAPITAL GOODS — 8.0%
Construction & Engineering — 1.4%
Skanska AB Class B 291,934 6,531,204
Electrical Equipment — 3.8%
ABB Ltd. 282,748 9,172,541Schneider Electric SE 47,987 8,056,553
Industrial Conglomerates — 2.4%
Hitachi Ltd. 217,000 10,859,583
Trading Companies & Distributors — 0.4%
Ashtead Group plc 32,876 2,070,017
36,689,898
COMMERCIAL & PROFESSIONAL SERVICES — 7.2%
Commercial Services & Supplies — 2.0%a China Conch Environment Protection Holdings Ltd. 936,500 1,171,627
Waste Connections, Inc. 56,866 7,944,180
Professional Services — 5.2%
Experian plc 218,108 8,402,743Recruit Holdings Co. Ltd. 248,900 10,813,962
a Visional, Inc. 76,000 4,677,336
33,009,848
CONSUMER DURABLES & APPAREL — 4.4%
Household Durables — 2.4%
Sony Group Corp. 106,183 10,923,643
Textiles, Apparel & Luxury Goods — 2.0%
LVMH Moet Hennessy Louis Vuitton SE 12,614 9,003,857
19,927,500
CONSUMER SERVICES — 2.6%
Diversified Consumer Services — 1.0%a Coursera, Inc. 198,537 4,574,293
Hotels, Restaurants & Leisure — 1.6%a Booking Holdings, Inc. 3,121 7,329,512
11,903,805
DIVERSIFIED FINANCIALS — 3.1%
Capital Markets — 3.1%
CITIC Securities Co. Ltd. Class A 2,751,835 9,019,045East Money Information Co. Ltd. Class A 1,345,620 5,330,048
14,349,093
FOOD & STAPLES RETAILING — 6.3%
Food & Staples Retailing — 6.3%
Alimentation Couche-Tard, Inc. 134,035 6,038,356Seven & i Holdings Co. Ltd. 245,700 11,714,288Tesco plc 3,125,486 11,315,206
29,067,850
Schedule of InvestmentsThornburg Better World International Fund | March 31, 2022 (Unaudited)
42 | Thornburg Equity Funds Semi-Annual Report See notes to financial statements.

ISSUER-DESCRIPTION SHARES VALUE
HOUSEHOLD & PERSONAL PRODUCTS — 5.5%
Personal Products — 5.5%
L’Oreal SA 31,099 $ 12,422,342a Natura & Co. Holding SA 831,298 4,548,432
Shiseido Co. Ltd. 161,400 8,152,065
25,122,839
INSURANCE — 0.8%
Insurance — 0.8%
NN Group NV 70,961 3,596,214
3,596,214
MATERIALS — 9.6%
Chemicals — 5.9%
Air Liquide SA 42,661 7,463,276Albemarle Corp. 34,958 7,730,962JSR Corp. 148,500 4,373,014Linde plc 23,795 7,592,799
Containers & Packaging — 1.1%
Crown Holdings, Inc. 38,486 4,814,214
Metals & Mining — 2.6%
Norsk Hydro ASA 785,478 7,631,603Shandong Nanshan Aluminum Co. Ltd. Class A 7,061,825 4,496,378
44,102,246
MEDIA & ENTERTAINMENT — 2.9%
Interactive Media & Services — 2.9%a Kanzhun Ltd. ADR 258,927 6,449,872
Tencent Holdings Ltd. 145,300 6,697,508
13,147,380
PHARMACEUTICALS, BIOTECHNOLOGY & LIFE SCIENCES — 6.3%
Biotechnology — 1.2%
CSL Ltd. 28,453 5,680,430
Pharmaceuticals — 5.1%
Novartis AG 116,927 10,265,197Roche Holding AG 33,045 13,074,641
29,020,268
REAL ESTATE — 0.7%
Real Estate Management & Development — 0.7%
Vonovia SE 72,262 3,368,160
3,368,160
RETAILING — 2.3%
Internet & Direct Marketing Retail — 2.3%a JD.com, Inc. Class A 9,952 282,785
a,b Meituan Class B 474,600 8,990,792a MercadoLibre, Inc. 912 1,084,806
10,358,383
SEMICONDUCTORS & SEMICONDUCTOR EQUIPMENT — 8.3%
Semiconductors & Semiconductor Equipment — 8.3%
Infineon Technologies AG 216,300 7,317,430NVIDIA Corp. 16,154 4,407,780
a Renesas Electronics Corp. 627,600 7,271,980Taiwan Semiconductor Manufacturing Co. Ltd. Sponsored ADR 113,927 11,878,029Tokyo Electron Ltd. 13,900 7,138,498
38,013,717
SOFTWARE & SERVICES — 10.5%
Information Technology Services — 8.1%a,b Adyen NV 4,093 8,106,978
Computershare Ltd. 368,500 6,772,693
Schedule of Investments, Continued
Thornburg Better World International Fund | March 31, 2022 (Unaudited)
See notes to financial statements. Thornburg Equity Funds Semi-Annual Report | 43

ISSUER-DESCRIPTION SHARES VALUE
Nomura Research Institute Ltd. 174,900 $ 5,706,512a Shopify, Inc. Class A 10,142 6,855,586
Visa, Inc. Class A 44,731 9,919,994
Software — 2.4%
Constellation Software, Inc. 2,636 4,505,965SAP SE 58,090 6,438,005
48,305,733
TECHNOLOGY HARDWARE & EQUIPMENT — 4.6%
Communications Equipment — 2.1%
Telefonaktiebolaget LM Ericsson Class B 1,065,006 9,708,108
Electronic Equipment, Instruments & Components — 2.5%
Halma plc 139,951 4,578,791Keyence Corp. 14,500 6,723,685
21,010,584
TRANSPORTATION — 1.5%
Road & Rail — 1.5%
Canadian Pacific Railway Ltd. 81,778 6,749,956
6,749,956
UTILITIES — 0.7%
Electric Utilities — 0.7%
Electricite de France SA 360,493 3,383,654
3,383,654
TOTAL COMMON STOCK (Cost $413,010,252) 407,899,983
RIGHTS — 0.0%
UTILITIES — 0.0%
Electric Utilities — 0.0%a,c Electricite de France SA, 4/4/2022 360,490 133,994
133,994
TOTAL RIGHTS (Cost $0) 133,994
SHORT-TERM INVESTMENTS — 10.9%d Thornburg Capital Management Fund 5,028,133 50,281,331
TOTAL SHORT-TERM INVESTMENTS (Cost $50,281,331) 50,281,331
TOTAL INVESTMENTS — 99.9% (Cost $463,291,583) $458,315,308
OTHER ASSETS LESS LIABILITIES — 0.1% 307,411
NET ASSETS — 100.0% $458,622,719
Footnote Legenda Non-income producing.b Securities exempt from registration under Rule 144A of the Securities Act of 1933, as amended. These securities are restricted but liquid and may only be resold in the ordinary course
of business in transactions exempt from registration, normally to qualified institutional buyers. As of March 31, 2022, the aggregate value of these securities in the Fund’s portfolio was$17,097,770, representing 3.73% of the Fund’s net assets.
c Security currently fair valued by the Valuation and Pricing Committee using procedures approved by the Trustees’ Audit Committee.d Investment in Affiliates.
Portfolio AbbreviationsTo simplify the listings of securities, abbreviations are used per the table below:ADR American Depositary Receipt
Schedule of Investments, Continued
Thornburg Better World International Fund | March 31, 2022 (Unaudited)
44 | Thornburg Equity Funds Semi-Annual Report See notes to financial statements.

COUNTRY EXPOSURE *(percent of equity holdings)
Japan 21.7%
United States 13.4%
China 10.4%
United Kingdom 8.3%
Canada 8.1%
Switzerland 8.0%
France 7.9%
Germany 4.2%
Sweden 4.0%
Netherlands 3.4%
Australia 3.1%
Taiwan 2.9%
Norway 1.9%
Brazil 1.4%
Singapore 1.3%
* Holdings are classified by country of risk as determined by MSCI and Bloomberg.
Schedule of Investments, Continued
Thornburg Better World International Fund | March 31, 2022 (Unaudited)
See notes to financial statements. Thornburg Equity Funds Semi-Annual Report | 45

ISSUER-DESCRIPTION SHARES VALUE
COMMON STOCK — 95.7%
AUTOMOBILES & COMPONENTS — 1.8%
Automobiles — 1.8%
Ferrari NV 118,938 $ 25,939,188
25,939,188
BANKS — 2.7%
Banks — 2.7%a BAWAG Group AG 254,230 12,828,209
HDFC Bank Ltd. ADR 397,344 24,369,107
37,197,316
CAPITAL GOODS — 5.5%
Electrical Equipment — 1.8%
Schneider Electric SE 145,434 24,416,961
Machinery — 2.5%
Otis Worldwide Corp. 453,168 34,871,278
Trading Companies & Distributors — 1.2%
Ashtead Group plc 276,450 17,406,507
76,694,746
COMMERCIAL & PROFESSIONAL SERVICES — 5.1%
Professional Services — 5.1%
Experian plc 644,407 24,826,171Nihon M&A Center Holdings, Inc. 1,115,100 15,597,961Wolters Kluwer NV 291,920 31,120,521
71,544,653
CONSUMER DURABLES & APPAREL — 4.8%
Textiles, Apparel & Luxury Goods — 4.8%
adidas AG 105,635 24,615,690LVMH Moet Hennessy Louis Vuitton SE 59,315 42,338,969
66,954,659
CONSUMER SERVICES — 2.6%
Hotels, Restaurants & Leisure — 2.6%b Booking Holdings, Inc. 9,828 23,080,567a Evolution AB 138,096 14,049,101
37,129,668
DIVERSIFIED FINANCIALS — 4.0%
Capital Markets — 4.0%
Deutsche Boerse AG 177,708 31,989,346Japan Exchange Group, Inc. 1,279,800 23,763,199
55,752,545
ENERGY — 1.0%
Oil, Gas & Consumable Fuels — 1.0%
TotalEnergies SE 286,900 14,517,002
14,517,002
FOOD, BEVERAGE & TOBACCO — 8.0%
Beverages — 1.4%
Kweichow Moutai Co. Ltd. Class A 70,681 19,041,568
Food Products — 6.6%
Nestle SA 711,044 92,448,991
111,490,559
MATERIALS — 6.3%
Chemicals — 5.2%
Air Liquide SA 224,199 39,222,217JSR Corp. 498,600 14,682,726Sika AG 59,834 19,796,295
Schedule of InvestmentsThornburg International Growth Fund | March 31, 2022 (Unaudited)
46 | Thornburg Equity Funds Semi-Annual Report See notes to financial statements.

ISSUER-DESCRIPTION SHARES VALUE
Containers & Packaging — 1.1%
SIG Combibloc Group AG 603,763 $ 15,220,779
88,922,017
MEDIA & ENTERTAINMENT — 11.1%
Entertainment — 4.5%
Activision Blizzard, Inc. 436,798 34,991,888b Sea Ltd. ADR 104,124 12,473,014b Ubisoft Entertainment SA 366,108 16,087,815
Interactive Media & Services — 6.6%
carsales.com Ltd. 1,457,493 22,563,889b Hemnet Group AB 1,045,510 15,724,091
Tencent Holdings Ltd. 1,160,400 53,487,876
155,328,573
PHARMACEUTICALS, BIOTECHNOLOGY & LIFE SCIENCES — 9.5%
Biotechnology — 2.1%
CSL Ltd. 148,768 29,700,429
Life Sciences Tools & Services — 2.5%
Lonza Group AG 48,756 35,328,759
Pharmaceuticals — 4.9%
AstraZeneca plc 514,634 68,247,107
133,276,295
RETAILING — 3.9%
Internet & Direct Marketing Retail — 2.3%a,b Boozt AB 518,149 6,617,006
b JD.com, Inc. Class A 72,666 2,064,795b MercadoLibre, Inc. 19,010 22,612,015
Multiline Retail — 1.6%
B&M European Value Retail SA 3,245,456 22,706,165
53,999,981
SEMICONDUCTORS & SEMICONDUCTOR EQUIPMENT — 14.6%
Semiconductors & Semiconductor Equipment — 14.6%
ASML Holding NV 87,228 58,287,622BE Semiconductor Industries NV 196,990 16,792,075SK Hynix, Inc. 277,142 26,660,820Taiwan Semiconductor Manufacturing Co. Ltd. 5,029,000 103,162,457
204,902,974
SOFTWARE & SERVICES — 11.5%
Information Technology Services — 9.4%a,b Adyen NV 18,402 36,448,721
Mastercard, Inc. Class A 102,639 36,681,126Nomura Research Institute Ltd. 626,300 20,434,467Visa, Inc. Class A 170,672 37,849,929
Software — 2.1%b Atlassian Corp. plc Class A 33,493 9,841,248b Elastic NV 198,756 17,679,346b Unifiedpost Group SA 289,623 2,045,142
160,979,979
TELECOMMUNICATION SERVICES — 2.2%
Diversified Telecommunication Services — 2.2%a Cellnex Telecom SA 630,488 30,341,855
30,341,855
TRANSPORTATION — 1.1%
Air Freight & Logistics — 1.1%
DSV AS 82,831 15,875,019
15,875,019
TOTAL COMMON STOCK (Cost $1,045,436,830) 1,340,847,029
Schedule of Investments, Continued
Thornburg International Growth Fund | March 31, 2022 (Unaudited)
See notes to financial statements. Thornburg Equity Funds Semi-Annual Report | 47
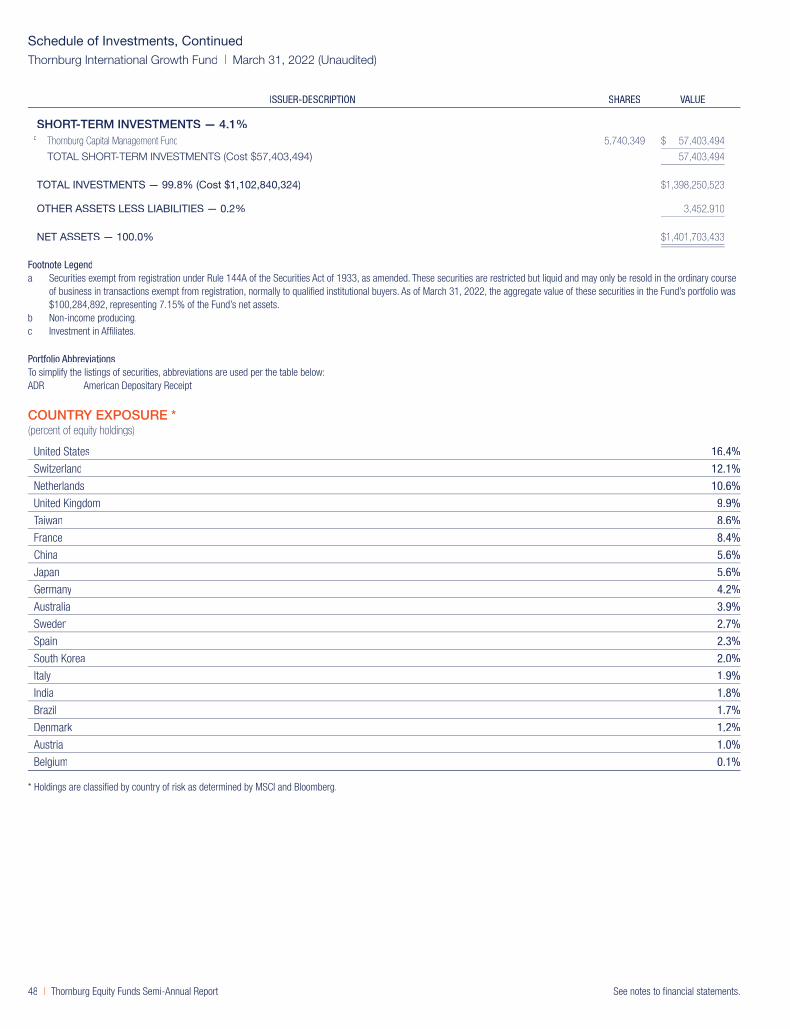
ISSUER-DESCRIPTION SHARES VALUE
SHORT-TERM INVESTMENTS — 4.1%c Thornburg Capital Management Fund 5,740,349 $ 57,403,494
TOTAL SHORT-TERM INVESTMENTS (Cost $57,403,494) 57,403,494
TOTAL INVESTMENTS — 99.8% (Cost $1,102,840,324) $1,398,250,523
OTHER ASSETS LESS LIABILITIES — 0.2% 3,452,910
NET ASSETS — 100.0% $1,401,703,433
Footnote Legenda Securities exempt from registration under Rule 144A of the Securities Act of 1933, as amended. These securities are restricted but liquid and may only be resold in the ordinary course
of business in transactions exempt from registration, normally to qualified institutional buyers. As of March 31, 2022, the aggregate value of these securities in the Fund’s portfolio was$100,284,892, representing 7.15% of the Fund’s net assets.
b Non-income producing.c Investment in Affiliates.
Portfolio AbbreviationsTo simplify the listings of securities, abbreviations are used per the table below:ADR American Depositary Receipt
COUNTRY EXPOSURE *(percent of equity holdings)
United States 16.4%
Switzerland 12.1%
Netherlands 10.6%
United Kingdom 9.9%
Taiwan 8.6%
France 8.4%
China 5.6%
Japan 5.6%
Germany 4.2%
Australia 3.9%
Sweden 2.7%
Spain 2.3%
South Korea 2.0%
Italy 1.9%
India 1.8%
Brazil 1.7%
Denmark 1.2%
Austria 1.0%
Belgium 0.1%
* Holdings are classified by country of risk as determined by MSCI and Bloomberg.
Schedule of Investments, Continued
Thornburg International Growth Fund | March 31, 2022 (Unaudited)
48 | Thornburg Equity Funds Semi-Annual Report See notes to financial statements.
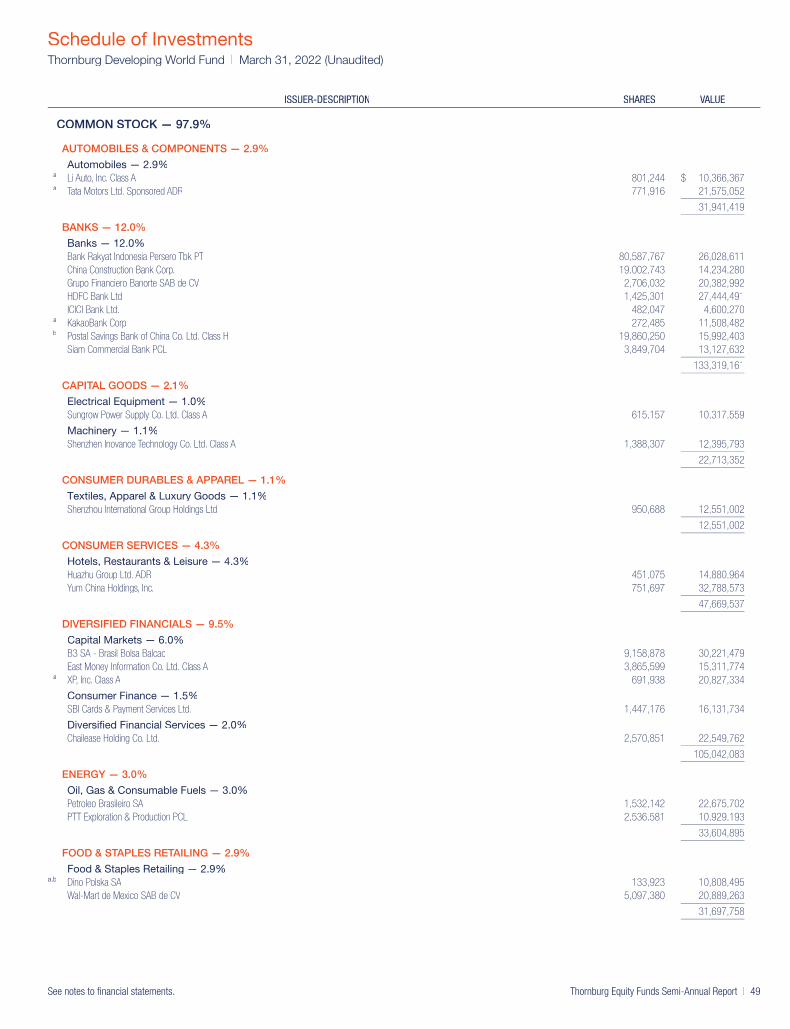
ISSUER-DESCRIPTION SHARES VALUE
COMMON STOCK — 97.9%
AUTOMOBILES & COMPONENTS — 2.9%
Automobiles — 2.9%a Li Auto, Inc. Class A 801,244 $ 10,366,367a Tata Motors Ltd. Sponsored ADR 771,916 21,575,052
31,941,419
BANKS — 12.0%
Banks — 12.0%
Bank Rakyat Indonesia Persero Tbk PT 80,587,767 26,028,611China Construction Bank Corp. 19,002,743 14,234,280Grupo Financiero Banorte SAB de CV 2,706,032 20,382,992HDFC Bank Ltd. 1,425,301 27,444,491ICICI Bank Ltd. 482,047 4,600,270
a KakaoBank Corp. 272,485 11,508,482b Postal Savings Bank of China Co. Ltd. Class H 19,860,250 15,992,403
Siam Commercial Bank PCL 3,849,704 13,127,632
133,319,161
CAPITAL GOODS — 2.1%
Electrical Equipment — 1.0%
Sungrow Power Supply Co. Ltd. Class A 615,157 10,317,559
Machinery — 1.1%
Shenzhen Inovance Technology Co. Ltd. Class A 1,388,307 12,395,793
22,713,352
CONSUMER DURABLES & APPAREL — 1.1%
Textiles, Apparel & Luxury Goods — 1.1%
Shenzhou International Group Holdings Ltd. 950,688 12,551,002
12,551,002
CONSUMER SERVICES — 4.3%
Hotels, Restaurants & Leisure — 4.3%
Huazhu Group Ltd. ADR 451,075 14,880,964Yum China Holdings, Inc. 751,697 32,788,573
47,669,537
DIVERSIFIED FINANCIALS — 9.5%
Capital Markets — 6.0%
B3 SA - Brasil Bolsa Balcao 9,158,878 30,221,479East Money Information Co. Ltd. Class A 3,865,599 15,311,774
a XP, Inc. Class A 691,938 20,827,334
Consumer Finance — 1.5%
SBI Cards & Payment Services Ltd. 1,447,176 16,131,734
Diversified Financial Services — 2.0%
Chailease Holding Co. Ltd. 2,570,851 22,549,762
105,042,083
ENERGY — 3.0%
Oil, Gas & Consumable Fuels — 3.0%
Petroleo Brasileiro SA 1,532,142 22,675,702PTT Exploration & Production PCL 2,536,581 10,929,193
33,604,895
FOOD & STAPLES RETAILING — 2.9%
Food & Staples Retailing — 2.9%a,b Dino Polska SA 133,923 10,808,495
Wal-Mart de Mexico SAB de CV 5,097,380 20,889,263
31,697,758
Schedule of InvestmentsThornburg Developing World Fund | March 31, 2022 (Unaudited)
See notes to financial statements. Thornburg Equity Funds Semi-Annual Report | 49

ISSUER-DESCRIPTION SHARES VALUE
FOOD, BEVERAGE & TOBACCO — 1.1%
Beverages — 1.1%
Wuliangye Yibin Co. Ltd. Class A 513,089 $ 12,456,842
12,456,842
HEALTH CARE EQUIPMENT & SERVICES — 1.2%
Health Care Providers & Services — 1.2%a Oncoclinicas do Brasil Servicos Medicos SA 6,052,591 13,424,635
13,424,635
INSURANCE — 3.8%
Insurance — 3.8%
AIA Group Ltd. 2,846,482 29,722,615a Star Health & Allied Insurance Co. Ltd. 1,329,809 12,452,657
42,175,272
MATERIALS — 5.7%
Chemicals — 2.7%
Fertiglobe plc 7,424,235 10,098,827Sociedad Quimica y Minera de Chile SA Sponsored ADR 225,922 19,338,923
Metals & Mining — 3.0%
First Quantum Minerals Ltd. 964,420 33,388,072
62,825,822
MEDIA & ENTERTAINMENT — 8.4%
Entertainment — 1.3%
NetEase, Inc. 832,571 15,021,884
Interactive Media & Services — 7.1%
NAVER Corp. 93,269 25,922,157Tencent Holdings Ltd. 1,138,201 52,464,627
93,408,668
PHARMACEUTICALS, BIOTECHNOLOGY & LIFE SCIENCES — 1.1%
Pharmaceuticals — 1.1%a,b Gland Pharma Ltd. 269,214 11,586,518
11,586,518
RETAILING — 6.4%
Internet & Direct Marketing Retail — 3.9%a Alibaba Group Holding Ltd. 1,262,301 17,226,257a JD.com, Inc. Class A 48,916 1,389,942
a,b Meituan Class B 620,075 11,746,662a MercadoLibre, Inc. 11,377 13,532,714
Specialty Retail — 2.5%
China Tourism Group Duty Free Corp. Ltd. Class A 586,550 15,087,548K Car Co. Ltd. 457,341 12,204,536
71,187,659
SEMICONDUCTORS & SEMICONDUCTOR EQUIPMENT — 12.9%
Semiconductors & Semiconductor Equipment — 12.9%
MediaTek, Inc. 459,968 14,314,441Micron Technology, Inc. 375,398 29,239,750Taiwan Semiconductor Manufacturing Co. Ltd. 4,861,960 99,735,880
143,290,071
SOFTWARE & SERVICES — 4.0%
Information Technology Services — 3.0%
Infosys Ltd. Sponsored ADR 1,105,038 27,504,396a,b Network International Holdings plc 1,694,885 6,193,858
Software — 1.0%
Yonyou Network Technology Co. Ltd. Class A 3,064,494 11,017,480
44,715,734
Schedule of Investments, Continued
Thornburg Developing World Fund | March 31, 2022 (Unaudited)
50 | Thornburg Equity Funds Semi-Annual Report See notes to financial statements.
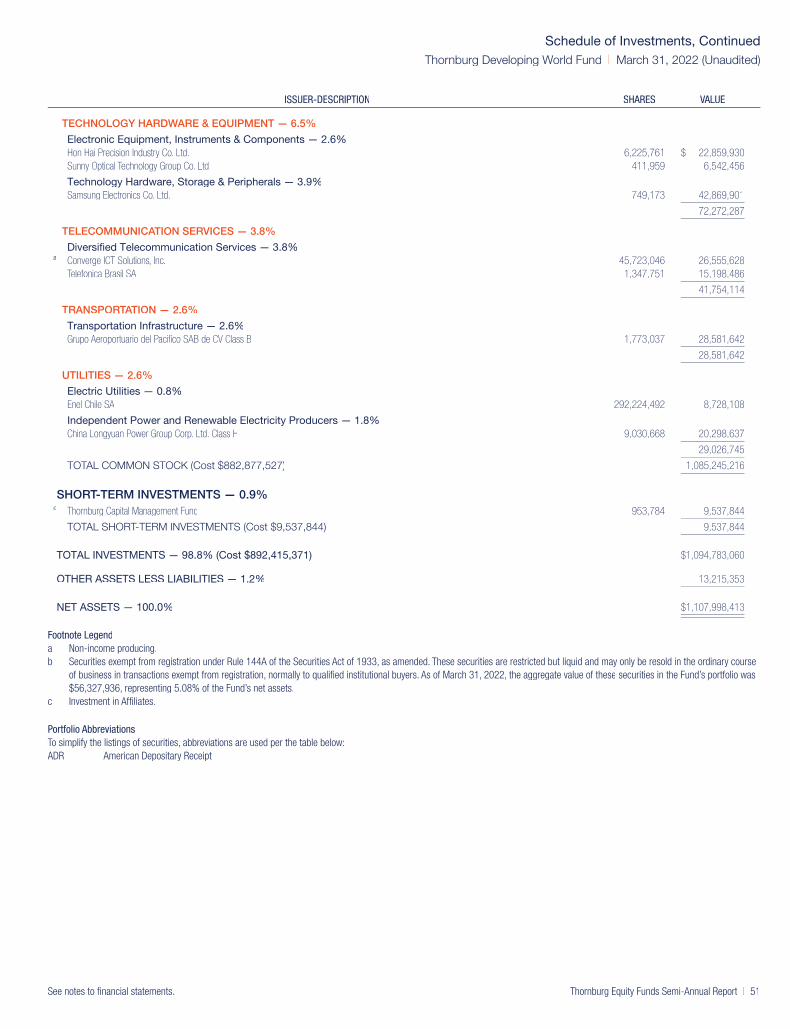
ISSUER-DESCRIPTION SHARES VALUE
TECHNOLOGY HARDWARE & EQUIPMENT — 6.5%
Electronic Equipment, Instruments & Components — 2.6%
Hon Hai Precision Industry Co. Ltd. 6,225,761 $ 22,859,930Sunny Optical Technology Group Co. Ltd. 411,959 6,542,456
Technology Hardware, Storage & Peripherals — 3.9%
Samsung Electronics Co. Ltd. 749,173 42,869,901
72,272,287
TELECOMMUNICATION SERVICES — 3.8%
Diversified Telecommunication Services — 3.8%a Converge ICT Solutions, Inc. 45,723,046 26,555,628
Telefonica Brasil SA 1,347,751 15,198,486
41,754,114
TRANSPORTATION — 2.6%
Transportation Infrastructure — 2.6%
Grupo Aeroportuario del Pacifico SAB de CV Class B 1,773,037 28,581,642
28,581,642
UTILITIES — 2.6%
Electric Utilities — 0.8%
Enel Chile SA 292,224,492 8,728,108
Independent Power and Renewable Electricity Producers — 1.8%
China Longyuan Power Group Corp. Ltd. Class H 9,030,668 20,298,637
29,026,745
TOTAL COMMON STOCK (Cost $882,877,527) 1,085,245,216
SHORT-TERM INVESTMENTS — 0.9%c Thornburg Capital Management Fund 953,784 9,537,844
TOTAL SHORT-TERM INVESTMENTS (Cost $9,537,844) 9,537,844
TOTAL INVESTMENTS — 98.8% (Cost $892,415,371) $1,094,783,060
OTHER ASSETS LESS LIABILITIES — 1.2% 13,215,353
NET ASSETS — 100.0% $1,107,998,413
Footnote Legenda Non-income producing.b Securities exempt from registration under Rule 144A of the Securities Act of 1933, as amended. These securities are restricted but liquid and may only be resold in the ordinary course
of business in transactions exempt from registration, normally to qualified institutional buyers. As of March 31, 2022, the aggregate value of these securities in the Fund’s portfolio was$56,327,936, representing 5.08% of the Fund’s net assets.
c Investment in Affiliates.
Portfolio AbbreviationsTo simplify the listings of securities, abbreviations are used per the table below:ADR American Depositary Receipt
Schedule of Investments, Continued
Thornburg Developing World Fund | March 31, 2022 (Unaudited)
See notes to financial statements. Thornburg Equity Funds Semi-Annual Report | 51

COUNTRY EXPOSURE *(percent of equity holdings)
China 27.8%
Taiwan 14.7%
India 11.2%
Brazil 10.7%
South Korea 8.5%
Mexico 6.4%
Zambia 3.1%
Hong Kong 2.7%
United States 2.7%
Chile 2.6%
Philippines 2.5%
Indonesia 2.4%
Thailand 2.2%
United Arab Emirates 1.5%
Poland 1.0%
* Holdings are classified by country of risk as determined by MSCI and Bloomberg.
Schedule of Investments, Continued
Thornburg Developing World Fund | March 31, 2022 (Unaudited)
52 | Thornburg Equity Funds Semi-Annual Report See notes to financial statements.

ISSUER-DESCRIPTION SHARES VALUE
COMMON STOCK — 98.5%
AUTOMOBILES & COMPONENTS — 0.8%
Auto Components — 0.8%a Gentherm, Inc. 83,921 $ 6,129,590
6,129,590
BANKS — 7.9%
Banks — 5.9%
Pinnacle Financial Partners, Inc. 223,775 20,605,202Signature Bank 75,690 22,214,258
Thrifts & Mortgage Finance — 2.0%
Walker & Dunlop, Inc. 116,271 15,047,793
57,867,253
CAPITAL GOODS — 10.1%
Aerospace & Defense — 1.8%
Spirit AeroSystems Holdings, Inc. Class A 258,559 12,640,949
Building Products — 2.4%a Builders FirstSource, Inc. 274,953 17,745,467
Construction & Engineering — 0.5%a API Group Corp. 171,771 3,612,344
Machinery — 5.4%a Chart Industries, Inc. 74,839 12,855,095a Gates Industrial Corp. plc 1,065,241 16,042,529
ITT, Inc. 140,594 10,574,075
73,470,459
COMMERCIAL & PROFESSIONAL SERVICES — 8.3%
Commercial Services & Supplies — 4.9%a Casella Waste Systems, Inc. Class A 240,648 21,092,797a Clean Harbors, Inc. 134,298 14,993,029
Professional Services — 3.4%
Booz Allen Hamilton Holding Corp. Class A 141,110 12,395,102a Sterling Check Corp. 461,613 12,200,432
60,681,360
CONSUMER DURABLES & APPAREL — 1.6%
Household Durables — 1.6%a Sonos, Inc. 415,366 11,721,628
11,721,628
CONSUMER SERVICES — 2.8%
Diversified Consumer Services — 1.2%a Bright Horizons Family Solutions, Inc. 65,381 8,675,405
Hotels, Restaurants & Leisure — 1.6%a Norwegian Cruise Line Holdings Ltd. 552,548 12,089,750
20,765,155
DIVERSIFIED FINANCIALS — 4.7%
Capital Markets — 3.1%
LPL Financial Holdings, Inc. 125,669 22,957,213
Consumer Finance — 1.6%
OneMain Holdings, Inc. 238,857 11,324,210
34,281,423
ENERGY — 8.1%
Energy Equipment & Services — 1.2%a Liberty Oilfield Services, Inc. Class A 583,801 8,651,931
Oil, Gas & Consumable Fuels — 6.9%
Chesapeake Energy Corp. 314,278 27,342,186Diamondback Energy, Inc. 166,997 22,891,949
58,886,066
Schedule of InvestmentsThornburg Small/Mid Cap Core Fund | March 31, 2022 (Unaudited)
See notes to financial statements. Thornburg Equity Funds Semi-Annual Report | 53

ISSUER-DESCRIPTION SHARES VALUE
FOOD, BEVERAGE & TOBACCO — 2.6%
Food Products — 2.6%
Lamb Weston Holdings, Inc. 184,931 $ 11,079,216a SunOpta, Inc. 1,638,084 8,223,182
19,302,398
HEALTH CARE EQUIPMENT & SERVICES — 8.3%
Health Care Equipment & Supplies — 5.2%a Envista Holdings Corp. 331,340 16,139,571a Haemonetics Corp. 205,595 12,997,716a Heska Corp. 66,667 9,218,713
Health Care Providers & Services — 3.1%a Amedisys, Inc. 42,094 7,252,375a PetIQ, Inc. Class A 625,208 15,255,075
60,863,450
MATERIALS — 10.5%
Chemicals — 5.5%
Element Solutions, Inc. 646,710 14,162,949a Livent Corp. 330,707 8,621,532
Sensient Technologies Corp. 201,972 16,955,549
Containers & Packaging — 2.7%
Crown Holdings, Inc. 156,936 19,631,124
Metals & Mining — 2.3%
Hudbay Minerals, Inc. 2,168,077 17,019,405
76,390,559
MEDIA & ENTERTAINMENT — 1.3%
Media — 1.3%a WideOpenWest, Inc. 532,572 9,288,056
9,288,056
PHARMACEUTICALS, BIOTECHNOLOGY & LIFE SCIENCES — 4.9%
Life Sciences Tools & Services — 4.9%a Avantor, Inc. 656,499 22,202,796
Azenta, Inc. 163,385 13,541,349
35,744,145
REAL ESTATE — 4.3%
Equity Real Estate Investment Trusts — 1.8%
Kite Realty Group Trust 563,643 12,834,151
Real Estate Management & Development — 2.5%a Jones Lang LaSalle, Inc. 77,355 18,523,428
31,357,579
RETAILING — 2.2%
Specialty Retail — 2.2%a Floor & Decor Holdings, Inc. Class A 71,389 5,782,509a Leslie’s, Inc. 542,328 10,499,470
16,281,979
SEMICONDUCTORS & SEMICONDUCTOR EQUIPMENT — 3.0%
Semiconductors & Semiconductor Equipment — 3.0%a FormFactor, Inc. 308,548 12,968,272a MaxLinear, Inc. 153,542 8,959,176
21,927,448
SOFTWARE & SERVICES — 9.1%
Information Technology Services — 2.3%a Repay Holdings Corp. Class A 1,161,089 17,149,285
Software — 6.8%a Agilysys, Inc. 196,205 7,824,655a Aspen Technology, Inc. 122,934 20,329,596
Schedule of Investments, Continued
Thornburg Small/Mid Cap Core Fund | March 31, 2022 (Unaudited)
54 | Thornburg Equity Funds Semi-Annual Report See notes to financial statements.

ISSUER-DESCRIPTION SHARES VALUE
a Black Knight, Inc. 188,886 $ 10,953,499a Varonis Systems, Inc. Class B 215,391 10,239,688
66,496,723
TECHNOLOGY HARDWARE & EQUIPMENT — 2.2%
Electronic Equipment, Instruments & Components — 2.2%a Teledyne Technologies, Inc. 33,546 15,854,846
15,854,846
TELECOMMUNICATION SERVICES — 1.8%
Diversified Telecommunication Services — 1.8%a Radius Global Infrastructure, Inc. Class A 895,664 12,790,082
12,790,082
TRANSPORTATION — 1.1%
Road & Rail — 1.1%a XPO Logistics, Inc. 109,012 7,936,074
7,936,074
UTILITIES — 2.9%
Independent Power and Renewable Electricity Producers — 2.9%
AES Corp. 837,790 21,556,337
21,556,337
TOTAL COMMON STOCK (Cost $640,428,399) 719,592,610
SHORT-TERM INVESTMENTS — 1.8%b Thornburg Capital Management Fund 1,322,677 13,226,766
TOTAL SHORT-TERM INVESTMENTS (Cost $13,226,766) 13,226,766
TOTAL INVESTMENTS — 100.3% (Cost $653,655,165) $732,819,376
LIABILITIES NET OF OTHER ASSETS — (0.3)% (2,114,191)
NET ASSETS — 100.0% $730,705,185
Footnote Legenda Non-income producing.b Investment in Affiliates.
Schedule of Investments, Continued
Thornburg Small/Mid Cap Core Fund | March 31, 2022 (Unaudited)
See notes to financial statements. Thornburg Equity Funds Semi-Annual Report | 55

ISSUER-DESCRIPTION SHARES VALUE
COMMON STOCK — 98.6%
AUTOMOBILES & COMPONENTS — 2.9%
Auto Components — 2.9%a Fox Factory Holding Corp. 93,311 $ 9,139,812a Gentherm, Inc. 52,316 3,821,161
12,960,973
BANKS — 2.9%
Banks — 2.9%
Signature Bank 44,762 13,137,199
13,137,199
CAPITAL GOODS — 8.3%
Building Products — 3.6%a Trex Co., Inc. 98,363 6,426,055
Zurn Water Solutions Corp. 268,306 9,498,032
Machinery — 4.7%a Chart Industries, Inc. 72,809 12,506,402a Kornit Digital Ltd. 106,069 8,770,846
37,201,335
COMMERCIAL & PROFESSIONAL SERVICES — 5.6%
Commercial Services & Supplies — 3.1%a Casella Waste Systems, Inc. Class A 155,076 13,592,412
Professional Services — 2.5%
Booz Allen Hamilton Holding Corp. Class A 99,634 8,751,850a Sterling Check Corp. 96,699 2,555,755
24,900,017
CONSUMER DURABLES & APPAREL — 3.8%
Household Durables — 2.4%a Sonos, Inc. 389,123 10,981,051
Leisure Products — 1.4%a YETI Holdings, Inc. 103,165 6,187,837
17,168,888
DIVERSIFIED FINANCIALS — 1.1%
Capital Markets — 1.1%a Open Lending Corp. Class A 250,582 4,738,506
4,738,506
FOOD, BEVERAGE & TOBACCO — 3.8%
Beverages — 1.9%a Celsius Holdings, Inc. 151,262 8,346,637
Food Products — 1.9%a Freshpet, Inc. 85,102 8,734,869
17,081,506
HEALTH CARE EQUIPMENT & SERVICES — 11.0%
Health Care Equipment & Supplies — 9.2%a AtriCure, Inc. 110,741 7,272,361
CONMED Corp. 80,225 11,917,424a Heska Corp. 80,759 11,167,355a Shockwave Medical, Inc. 50,948 10,564,577
Health Care Providers & Services — 1.8%a Amedisys, Inc. 46,497 8,010,968
48,932,685
INSURANCE — 1.9%
Insurance — 1.9%a Ryan Specialty Group Holdings, Inc. Class A 222,931 8,647,494
8,647,494
Schedule of InvestmentsThornburg Small/Mid Cap Growth Fund | March 31, 2022 (Unaudited)
56 | Thornburg Equity Funds Semi-Annual Report See notes to financial statements.

ISSUER-DESCRIPTION SHARES VALUE
MATERIALS — 2.2%
Chemicals — 2.2%a Livent Corp. 379,331 $ 9,889,159
9,889,159
MEDIA & ENTERTAINMENT — 2.6%
Interactive Media & Services — 2.6%a Eventbrite, Inc. Class A 792,462 11,704,664
11,704,664
PHARMACEUTICALS, BIOTECHNOLOGY & LIFE SCIENCES — 11.4%
Biotechnology — 5.8%a ChemoCentryx, Inc. 228,123 5,719,043a Horizon Therapeutics plc 138,471 14,568,534a IVERIC bio, Inc. 319,524 5,377,589
Life Sciences Tools & Services — 5.6%a Avantor, Inc. 494,342 16,718,646a Repligen Corp. 44,361 8,343,861
50,727,673
RETAILING — 4.8%
Internet & Direct Marketing Retail — 0.9%a Overstock.com, Inc. 90,717 3,992,001
Specialty Retail — 3.9%a Floor & Decor Holdings, Inc. Class A 102,389 8,293,509a Leslie’s, Inc. 472,935 9,156,022
21,441,532
SEMICONDUCTORS & SEMICONDUCTOR EQUIPMENT — 9.4%
Semiconductors & Semiconductor Equipment — 9.4%a Ambarella, Inc. 82,923 8,700,281
Entegris, Inc. 94,570 12,413,258a MaxLinear, Inc. 152,925 8,923,174
Monolithic Power Systems, Inc. 24,529 11,913,245
41,949,958
SOFTWARE & SERVICES — 19.6%
Information Technology Services — 7.6%a BigCommerce Holdings, Inc. Series 1 205,872 4,510,655a Endava plc Sponsored ADR 52,727 7,014,273
a,b Nuvei Corp. 149,676 11,254,285a Shift4 Payments, Inc. Class A 176,255 10,915,472
Software — 12.0%
Bentley Systems, Inc. Class B 252,659 11,162,475a Black Knight, Inc. 165,099 9,574,091a Domo, Inc. Class B 158,924 8,036,787a Elastic NV 98,803 8,788,527a Smartsheet, Inc. Class A 135,375 7,415,842a Varonis Systems, Inc. Class B 181,671 8,636,639
87,309,046
TECHNOLOGY HARDWARE & EQUIPMENT — 5.0%
Communications Equipment — 2.5%a Calix, Inc. 256,670 11,013,710
Electronic Equipment, Instruments & Components — 2.5%a Teledyne Technologies, Inc. 24,118 11,398,890
22,412,600
TRANSPORTATION — 2.3%
Air Freight & Logistics — 2.3%a GXO Logistics, Inc. 140,748 10,040,962
10,040,962
TOTAL COMMON STOCK (Cost $450,047,082) 440,244,197
Schedule of Investments, Continued
Thornburg Small/Mid Cap Growth Fund | March 31, 2022 (Unaudited)
See notes to financial statements. Thornburg Equity Funds Semi-Annual Report | 57

ISSUER-DESCRIPTION SHARES VALUE
SHORT-TERM INVESTMENTS — 0.5%c Thornburg Capital Management Fund 220,082 $ 2,200,818
TOTAL SHORT-TERM INVESTMENTS (Cost $2,200,818) 2,200,818
TOTAL INVESTMENTS — 99.1% (Cost $452,247,900) $442,445,015
OTHER ASSETS LESS LIABILITIES — 0.9% 3,851,775
NET ASSETS — 100.0% $446,296,790
Footnote Legenda Non-income producing.b Securities exempt from registration under Rule 144A of the Securities Act of 1933, as amended. These securities are restricted but liquid and may only be resold in the ordinary course
of business in transactions exempt from registration, normally to qualified institutional buyers. As of March 31, 2022, the aggregate value of these securities in the Fund’s portfolio was$11,254,285, representing 2.52% of the Fund’s net assets.
c Investment in Affiliates.
Portfolio AbbreviationsTo simplify the listings of securities, abbreviations are used per the table below:ADR American Depositary Receipt
COUNTRY EXPOSURE *(percent of equity holdings)
United States 93.9%
Canada 2.5%
Israel 2.0%
United Kingdom 1.6%
* Holdings are classified by country of risk as determined by MSCI and Bloomberg.
Schedule of Investments, Continued
Thornburg Small/Mid Cap Growth Fund | March 31, 2022 (Unaudited)
58 | Thornburg Equity Funds Semi-Annual Report See notes to financial statements.

ISSUER-DESCRIPTIONSHARES/
PRINCIPAL AMOUNT VALUE
COMMON STOCK — 85.1%
AUTOMOBILES & COMPONENTS — 1.7%
Automobiles — 1.7%
Mercedes-Benz Group AG 1,479,700 $ 103,859,376Stellantis NV 5,164,500 83,610,505
187,469,881
BANKS — 5.7%
Banks — 5.7%
BNP Paribas SA 2,408,000 137,604,266Citigroup, Inc. 664,799 35,500,267JPMorgan Chase & Co. 1,747,148 238,171,215Regions Financial Corp. 10,525,108 234,288,904
645,564,652
CAPITAL GOODS — 2.0%
Aerospace & Defense — 0.8%
BAE Systems plc 9,463,900 88,879,723
Industrial Conglomerates — 1.2%
Siemens AG 971,100 134,465,550
223,345,273
DIVERSIFIED FINANCIALS — 9.6%
Capital Markets — 5.7%
Apollo Investment Corp. 2,937,783 38,837,491CME Group, Inc. 1,562,801 371,727,846
a SLR Investment Corp. 4,407,900 79,915,227UBS Group AG 8,018,372 156,689,437
Diversified Financial Services — 1.9%
Equitable Holdings, Inc. 5,628,308 173,971,000M&G plc 15,374,000 44,297,590
Mortgage Real Estate Investment Trusts — 2.0%a Chimera Investment Corp. 17,217,311 207,296,424
Granite Point Mortgage Trust, Inc. 1,417,500 15,762,600
1,088,497,615
ENERGY — 3.9%
Oil, Gas & Consumable Fuels — 3.9%b LUKOIL PJSC Sponsored ADR 314,000 226,080
a,b,c Malamute Energy, Inc. 12,439 12,439TotalEnergies SE 8,807,100 445,635,022
445,873,541
FOOD & STAPLES RETAILING — 3.6%
Food & Staples Retailing — 3.6%
Tesco plc 78,102,630 282,755,164Walgreens Boots Alliance, Inc. 2,856,139 127,869,343
410,624,507
FOOD, BEVERAGE & TOBACCO — 0.3%
Food Products — 0.3%
Nestle SA 289,900 37,692,410
37,692,410
INSURANCE — 5.9%
Insurance — 5.9%
Assicurazioni Generali SpA 11,749,147 268,728,222Aviva plc 7,027,000 41,578,129AXA SA 2,620,500 76,713,365Legal & General Group plc 5,479,000 19,425,180NN Group NV 5,244,000 265,759,287
672,204,183
Schedule of InvestmentsThornburg Investment Income Builder Fund | March 31, 2022 (Unaudited)
See notes to financial statements. Thornburg Equity Funds Semi-Annual Report | 59

ISSUER-DESCRIPTIONSHARES/
PRINCIPAL AMOUNT VALUE
MATERIALS — 4.9%
Chemicals — 1.5%
LyondellBasell Industries NV Class A 1,626,496 $ 167,236,319
Metals & Mining — 3.4%
BHP Group Ltd. 2,820,000 108,703,918Glencore plc 41,903,800 272,655,604
b MMC Norilsk Nickel PJSC ADR 3,514,000 2,073,260
550,669,101
PHARMACEUTICALS, BIOTECHNOLOGY & LIFE SCIENCES — 12.2%
Biotechnology — 3.4%
AbbVie, Inc. 2,399,490 388,981,324
Pharmaceuticals — 8.8%
AstraZeneca plc 1,175,800 155,926,248Merck & Co., Inc. 2,157,969 177,061,356Novartis AG 1,383,800 121,485,880Pfizer, Inc. 5,360,409 277,508,374Roche Holding AG 674,600 266,913,384
1,387,876,566
REAL ESTATE — 0.7%
Equity Real Estate Investment Trusts — 0.7%
Washington Real Estate Investment Trust 2,963,074 75,558,387
75,558,387
RETAILING — 1.3%
Specialty Retail — 1.3%
Home Depot, Inc. 505,482 151,305,927
151,305,927
SEMICONDUCTORS & SEMICONDUCTOR EQUIPMENT — 9.7%
Semiconductors & Semiconductor Equipment — 9.7%
Broadcom, Inc. 698,040 439,541,827QUALCOMM, Inc. 1,857,277 283,829,071Taiwan Semiconductor Manufacturing Co. Ltd. 18,600,000 381,551,342
1,104,922,240
TECHNOLOGY HARDWARE & EQUIPMENT — 4.0%
Communications Equipment — 1.0%
Cisco Systems, Inc. 2,053,251 114,489,276
Technology Hardware, Storage & Peripherals — 3.0%
Samsung Electronics Co. Ltd. 5,837,000 334,010,453
448,499,729
TELECOMMUNICATION SERVICES — 14.2%
Diversified Telecommunication Services — 8.3%d China Telecom Corp. Ltd. Class H 334,555,000 132,053,876
Deutsche Telekom AG 18,574,500 345,933,771Koninklijke KPN NV 9,361,000 32,482,464Orange SA 36,645,780 433,874,960
Wireless Telecommunication Services — 5.9%d China Mobile Ltd. 40,920,774 281,616,999
Vodafone Group plc 237,227,924 389,002,587
1,614,964,657
UTILITIES — 5.4%
Electric Utilities — 4.8%
Electricite de France SA 9,094,920 85,366,613Endesa SA 4,632,800 101,011,778Enel SpA 41,182,671 274,966,374Energias de Portugal SA 16,048,000 78,986,401
Schedule of Investments, Continued
Thornburg Investment Income Builder Fund | March 31, 2022 (Unaudited)
60 | Thornburg Equity Funds Semi-Annual Report See notes to financial statements.

ISSUER-DESCRIPTIONSHARES/
PRINCIPAL AMOUNT VALUE
Multi-Utilities — 0.6%
E.ON SE 5,714,000 $ 66,386,060
606,717,226
TOTAL COMMON STOCK (Cost $7,063,850,092) 9,651,785,895
PREFERRED STOCK — 0.3%
BANKS — 0.1%
Banks — 0.1%e,f,g First Horizon Bank 3.75% (LIBOR 3 Month + 0.85%) 12,000 10,444,500
10,444,500
DIVERSIFIED FINANCIALS — 0.0%
Capital Markets — 0.0%f,g Morgan Stanley Series A, 4.00% (LIBOR 3 Month + 0.70%) 120,000 2,658,000
2,658,000
ENERGY — 0.2%
Oil, Gas & Consumable Fuels — 0.2%f Crestwood Equity Partners LP 9.25% 2,166,596 20,799,321
20,799,321
TOTAL PREFERRED STOCK (Cost $34,858,652) 33,901,821
ASSET BACKED SECURITIES — 2.7%
AUTO RECEIVABLES — 1.6%ACC Trust,
e Series 2019-1 Class C, 6.41% due 2/20/2024 $ 2,212,725 2,225,515e Series 2020-A Class A, 6.00% due 3/20/2023 3,390,983 3,395,638e Series 2020-A Class B, 12.50% due 6/20/2025 6,680,000 6,713,190
American Credit Acceptance Receivables Trust,e Series 2019-3 Class F, 5.42% due 5/12/2026 6,850,000 6,901,608e Series 2019-4 Class F, 5.37% due 9/14/2026 5,000,000 5,034,682e Series 2020-1 Class F, 4.75% due 11/13/2026 5,460,000 5,439,317
Carvana Auto Receivables Trust,e 0.01% due 1/10/2029 24,000 8,609,520e Series 2019-4A Class R, 0.01% due 10/15/2026 32,000 11,980,359e Series 2021-N1 Class R, due 1/10/2028 24,500 8,899,309e Series 2021-N2 Class R, 0.01% due 3/10/2028 10,500 4,747,883e Series 2021-P1 Class R, due 12/10/2027 24,000 6,381,121e Series 2021-P2 Class R, due 5/10/2028 8,000 4,011,432e Series 2021-P4 Class R, due 9/11/2028 17,500 9,970,551
CPS Auto Receivables Trust,e Series 2018-B Class E, 5.61% due 12/16/2024 5,158,000 5,219,736e Series 2019-A Class E, 5.81% due 3/16/2026 1,000,000 1,021,462e Series 2020-A Class E, 4.09% due 12/15/2025 2,000,000 2,014,303e Series 2020-C Class F, 6.67% due 11/15/2027 3,000,000 3,003,304
b,e CPS Auto Securitization Trust, Series 2021-1A Class A, 7.86% due 6/16/2026 14,000,000 13,538,000b,e Credit Suisse ABS Trust, Series 2020-AT1 Class CERT, 0.01% due 6/15/2026 40,000 2,117,284
e DT Auto Owner Trust, Series 2020-1A Class E, 3.48% due 2/16/2027 4,500,000 4,384,026Flagship Credit Auto Trust,
e Series 2018-4 Class R, 0.01% due 3/16/2026 53,000 5,254,442e Series 2019-1 Class R, 0.01% due 6/15/2026 6,000 637,448e Series 2019-3 Class R, 0.01% due 12/15/2026 60,000 9,548,288e Series 2019-4 Class R, 0.01% due 3/15/2027 42,000 7,774,151e Foursight Capital Automobile Receivables Trust, Series 2020-1 Class F, 4.62% due 6/15/2027 3,180,000 3,168,988
JPMorgan Chase Bank NA - CACLN,e Series 2020 -1 Class R, 33.784% due 1/25/2028 1,865,260 2,272,421e Series 2020-2 Class R, 31.355% due 2/25/2028 1,189,179 1,452,213e Series 2021-1 Class R, 28.348% due 9/25/2028 3,826,489 4,571,778e Santander Consumer Auto Receivables Trust, Series 2020-AA Class R, 0.01% due 1/16/2029 45,588 7,670,035e United Auto Credit Securitization Trust, Series 2022-1 Class R, 0.01% due 11/10/2028 37,000 13,864,217
Schedule of Investments, Continued
Thornburg Investment Income Builder Fund | March 31, 2022 (Unaudited)
See notes to financial statements. Thornburg Equity Funds Semi-Annual Report | 61
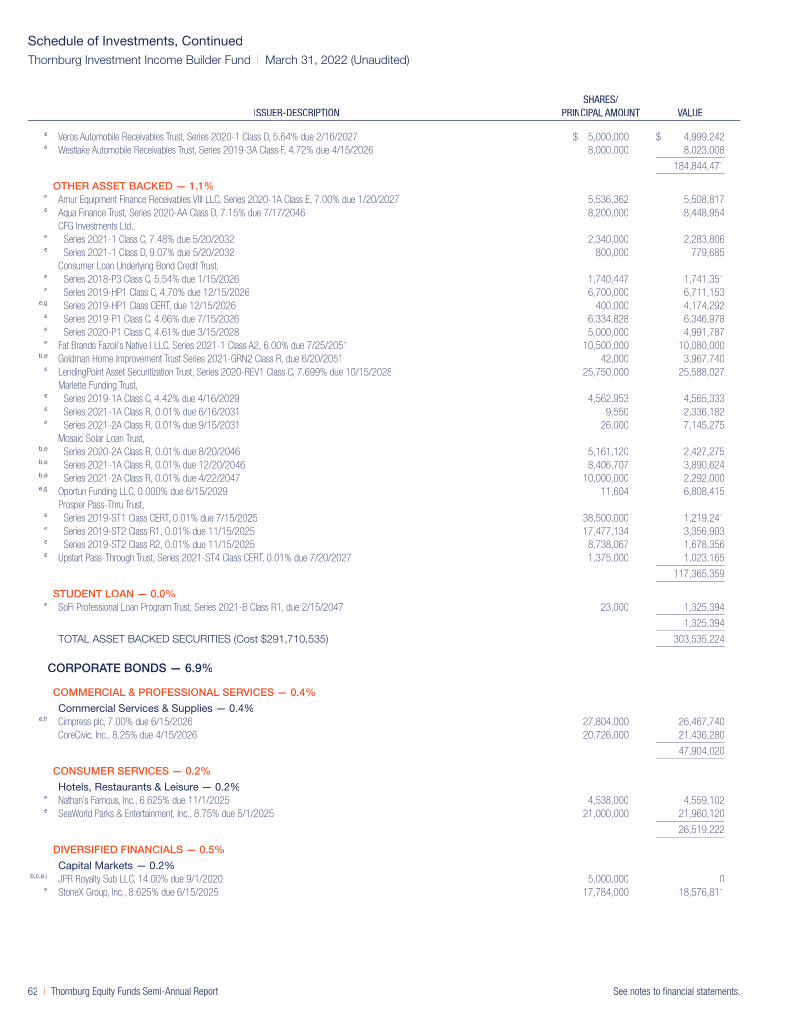
ISSUER-DESCRIPTIONSHARES/
PRINCIPAL AMOUNT VALUE
e Veros Automobile Receivables Trust, Series 2020-1 Class D, 5.64% due 2/16/2027 $ 5,000,000 $ 4,999,242e Westlake Automobile Receivables Trust, Series 2019-3A Class F, 4.72% due 4/15/2026 8,000,000 8,023,008
184,844,471
OTHER ASSET BACKED — 1.1%e Amur Equipment Finance Receivables VIII LLC, Series 2020-1A Class E, 7.00% due 1/20/2027 5,536,362 5,508,817e Aqua Finance Trust, Series 2020-AA Class D, 7.15% due 7/17/2046 8,200,000 8,448,954
CFG Investments Ltd.,e Series 2021-1 Class C, 7.48% due 5/20/2032 2,340,000 2,283,806e Series 2021-1 Class D, 9.07% due 5/20/2032 800,000 779,685
Consumer Loan Underlying Bond Credit Trust,e Series 2018-P3 Class C, 5.54% due 1/15/2026 1,740,447 1,741,351e Series 2019-HP1 Class C, 4.70% due 12/15/2026 6,700,000 6,711,153
e,g Series 2019-HP1 Class CERT, due 12/15/2026 400,000 4,174,292e Series 2019-P1 Class C, 4.66% due 7/15/2026 6,334,828 6,346,978e Series 2020-P1 Class C, 4.61% due 3/15/2028 5,000,000 4,991,787e Fat Brands Fazoli’s Native I LLC, Series 2021-1 Class A2, 6.00% due 7/25/2051 10,500,000 10,080,000
b,e Goldman Home Improvement Trust Series 2021-GRN2 Class R, due 6/20/2051 42,000 3,967,740e LendingPoint Asset Securitization Trust, Series 2020-REV1 Class C, 7.699% due 10/15/2028 25,750,000 25,588,027
Marlette Funding Trust,e Series 2019-1A Class C, 4.42% due 4/16/2029 4,562,953 4,565,333e Series 2021-1A Class R, 0.01% due 6/16/2031 9,550 2,336,182e Series 2021-2A Class R, 0.01% due 9/15/2031 26,000 7,145,275
Mosaic Solar Loan Trust,b,e Series 2020-2A Class R, 0.01% due 8/20/2046 5,161,120 2,427,275b,e Series 2021-1A Class R, 0.01% due 12/20/2046 8,406,707 3,890,624b,e Series 2021-2A Class R, 0.01% due 4/22/2047 10,000,000 2,292,000e,g Oportun Funding LLC, 0.000% due 6/15/2029 11,604 6,808,415
Prosper Pass-Thru Trust,e Series 2019-ST1 Class CERT, 0.01% due 7/15/2025 38,500,000 1,219,241e Series 2019-ST2 Class R1, 0.01% due 11/15/2025 17,477,134 3,356,903e Series 2019-ST2 Class R2, 0.01% due 11/15/2025 8,738,067 1,678,356e Upstart Pass-Through Trust, Series 2021-ST4 Class CERT, 0.01% due 7/20/2027 1,375,000 1,023,165
117,365,359
STUDENT LOAN — 0.0%e SoFi Professional Loan Program Trust, Series 2021-B Class R1, due 2/15/2047 23,000 1,325,394
1,325,394
TOTAL ASSET BACKED SECURITIES (Cost $291,710,535) 303,535,224
CORPORATE BONDS — 6.9%
COMMERCIAL & PROFESSIONAL SERVICES — 0.4%
Commercial Services & Supplies — 0.4%e,h Cimpress plc, 7.00% due 6/15/2026 27,804,000 26,467,740
CoreCivic, Inc., 8.25% due 4/15/2026 20,726,000 21,436,280
47,904,020
CONSUMER SERVICES — 0.2%
Hotels, Restaurants & Leisure — 0.2%e Nathan’s Famous, Inc., 6.625% due 11/1/2025 4,538,000 4,559,102e SeaWorld Parks & Entertainment, Inc., 8.75% due 5/1/2025 21,000,000 21,960,120
26,519,222
DIVERSIFIED FINANCIALS — 0.5%
Capital Markets — 0.2%b,c,e,i JPR Royalty Sub LLC, 14.00% due 9/1/2020 5,000,000 0
e StoneX Group, Inc., 8.625% due 6/15/2025 17,784,000 18,576,811
Schedule of Investments, Continued
Thornburg Investment Income Builder Fund | March 31, 2022 (Unaudited)
62 | Thornburg Equity Funds Semi-Annual Report See notes to financial statements.

ISSUER-DESCRIPTIONSHARES/
PRINCIPAL AMOUNT VALUE
Diversified Financial Services — 0.3%
Antares Holdings LP,e 6.00% due 8/15/2023 $ 18,000,000 $ 18,453,060e 8.50% due 5/18/2025 11,500,000 12,654,370
f,g JPMorgan Chase & Co., Series I, 3.769% (LIBOR 3 Month + 3.47%) due 7/30/2022 7,334,000 7,334,146
57,018,387
ENERGY — 2.5%
Energy Equipment & Services — 0.0%
Odebrecht Offshore Drilling Finance Ltd.,e,h 6.72% due 12/1/2022 726,088 716,577
e,h,j 7.72% due 12/1/2026 PIK 19,311,272 4,349,671e,f,h Odebrecht Oil & Gas Finance Ltd. (Guaranty: Odebrecht Oleo e Gas SA), Zero coupon due 5/2/2022 2,337,727 10,987
c,e,h,i Schahin II Finance Co. SPV Ltd., 5.875% due 9/25/2023 11,396,735 770,419
Oil, Gas & Consumable Fuels — 2.5%e Citgo Holding, Inc., 9.25% due 8/1/2024 14,196,000 14,342,077e CITGO Petroleum Corp., 7.00% due 6/15/2025 8,000,000 8,093,280g Energy Transfer LP, 3.334% (LIBOR 3 Month + 3.02%) due 11/1/2066 13,820,000 11,299,370g Enterprise TE Partners LP, Series 1, 3.301% (LIBOR 3 Month + 2.78%) due 6/1/2067 7,000,000 5,715,990
Kinder Morgan Energy Partners LP,5.00% due 3/1/2043 10,000,000 10,293,9005.80% due 3/15/2035 10,000,000 11,348,000
Kinder Morgan, Inc.,5.30% due 12/1/2034 23,630,000 25,877,6865.55% due 6/1/2045 5,000,000 5,601,150
ONEOK Partners LP, 4.90% due 3/15/2025 9,544,000 9,855,134e Par Petroleum LLC/Par Petroleum Finance Corp., 7.75% due 12/15/2025 1,672,000 1,655,246h Petroleos Mexicanos, 5.95% due 1/28/2031 7,820,000 7,222,396
Petroleos Mexicanos (EUR), 3.75% due 2/21/2024 2,000,000 2,217,367f,g Summit Midstream Partners LP, Series A, 9.50% (LIBOR 3 Month + 7.43%) due 12/15/2022 16,097,000 12,475,819
Transcontinental Gas Pipe Line Co. LLC, 7.85% due 2/1/2026 32,700,000 37,487,607Williams Cos., Inc.,
3.70% due 1/15/2023 29,129,000 29,330,5734.55% due 6/24/2024 69,318,000 71,242,2685.75% due 6/24/2044 14,198,000 16,389,745
286,295,262
FOOD & STAPLES RETAILING — 0.1%
Food & Staples Retailing — 0.1%e KeHE Distributors LLC/KeHE Finance Corp., 8.625% due 10/15/2026 4,675,000 4,955,781
4,955,781
FOOD, BEVERAGE & TOBACCO — 0.4%
Tobacco — 0.4%e Vector Group Ltd., 10.50% due 11/1/2026 44,464,000 45,549,366
45,549,366
INSURANCE — 0.5%
Insurance — 0.5%e MetLife, Inc., 9.25% due 4/8/2068 12,000,000 15,565,800
e,g,h QBE Insurance Group Ltd., 7.50% (USSW10 + 6.03%) due 11/24/2043 40,000,000 41,956,800
57,522,600
MATERIALS — 0.2%
Containers & Packaging — 0.1%e Matthews International Corp., Class C, 5.25% due 12/1/2025 14,969,000 15,095,787
Metals & Mining — 0.1%e Cleveland-Cliffs, Inc., 6.75% due 3/15/2026 5,000,000 5,266,500
20,362,287
Schedule of Investments, Continued
Thornburg Investment Income Builder Fund | March 31, 2022 (Unaudited)
See notes to financial statements. Thornburg Equity Funds Semi-Annual Report | 63

ISSUER-DESCRIPTIONSHARES/
PRINCIPAL AMOUNT VALUE
MEDIA & ENTERTAINMENT — 0.1%
Media — 0.1%e,h Telenet Finance Luxembourg Notes Sarl, 5.50% due 3/1/2028 $ 10,000,000 $ 9,781,100
9,781,100
TELECOMMUNICATION SERVICES — 1.7%
Diversified Telecommunication Services — 1.3%h Deutsche Telekom International Finance BV (Guaranty: Deutsche Telekom AG), 8.75% due 6/15/2030 26,150,000 35,147,431h Telefonica Emisiones SA (Guaranty: Telefonica SA), 7.045% due 6/20/2036 85,390,000 107,221,661
Wireless Telecommunication Services — 0.4%
Digicel International Finance Ltd./Digicel Holdings Bermuda Ltd.,e,h 8.00% due 12/31/2026 10,003,281 9,303,051e,h 8.75% due 5/25/2024 36,785,955 36,634,182
188,306,325
TRANSPORTATION — 0.2%
Airlines — 0.2%
American Airlines Pass Through Trust,Series 2013-2, 4.95% due 7/15/2024 3,046,106 3,012,659Series 2016-3 Class B, 3.75% due 4/15/2027 11,924,064 10,964,297Series 2019-1B Class PPT, 3.85% due 8/15/2029 8,222,335 7,345,587
US Airways Pass Through Trust, Series 2010-1A Class PTT, 6.25% due 10/22/2024 966,385 967,632
22,290,175
UTILITIES — 0.1%
Gas Utilities — 0.1%e,h Rockpoint Gas Storage Canada Ltd., 7.00% due 3/31/2023 13,880,000 13,870,839
13,870,839
TOTAL CORPORATE BONDS (Cost $698,917,031) 780,375,364
MORTGAGE BACKED — 1.3%g Bear Stearns ARM Trust, Whole Loan Securities Trust CMO, Series 2003-6 Class 2B1, 2.396% due 8/25/2033 29,093 29,093
Chase Home Lending Mortgage Trust, Whole Loan Securities Trust CMO,e,g Series 2019-1 Class B4, 3.917% due 3/25/2050 1,058,874 1,047,601e,g Series 2019-1 Class B5, 3.917% due 3/25/2050 489,808 458,289e,g Series 2019-1 Class B6, 3.054% due 3/25/2050 748,607 646,944e,g Chase Mortgage Finance Corp., Whole Loan Securities Trust CMO, Series 2016-SH2 Class M4, 3.75% due 12/25/2045 865,770 839,216
CIM Trust, Whole Loan Securities Trust CMO,e,g,k Series 2020-J1 Class AIO1, 0.451% due 7/25/2050 73,470,201 749,896e,g,k Series 2020-J1 Class AIO2, 0.50% due 7/25/2050 65,529,420 849,510e,g,k Series 2020-J1 Class AIOS, 0.20% due 6/25/2050 86,631,831 474,067
e,g Series 2020-J1 Class B4, 3.451% due 7/25/2050 1,395,391 1,258,106e,g Series 2020-J1 Class B5, 3.451% due 7/25/2050 698,178 609,721e,g Series 2020-J1 Class B6, 3.451% due 7/25/2050 1,299,775 723,689
e,g,k Series 2020-J2 Class AX1, 0.267% due 1/25/2051 117,622,500 1,017,223e,g,k Series 2020-J2 Class AXS, 0.21% due 1/25/2051 124,792,254 877,452
e,g Series 2020-J2 Class B4, 2.767% due 1/25/2051 491,000 319,698e,g Series 2020-J2 Class B5, 2.767% due 1/25/2051 164,000 103,824e,g Series 2020-J2 Class B6, 2.767% due 1/25/2051 655,000 225,249
Citigroup Mortgage Loan Trust, Whole Loan Securities Trust CMO,g Series 2004-HYB2 Class B1, 2.485% due 3/25/2034 220,434 220,434
e,g Series 2020-EXP1 Class B1, 4.467% due 5/25/2060 2,150,000 1,862,298e,g Series 2020-EXP1 Class B2, 4.467% due 5/25/2060 1,450,000 1,159,013e,g Series 2020-EXP1 Class B3, 4.467% due 5/25/2060 725,000 378,662e,k Series 2020-EXP1 Class XS, 0.01% due 5/25/2060 46,358,490 34,769
e,g,k Series 2020-EXP2 Class A3IW, 0.862% due 8/25/2050 76,612,085 2,027,700e,g,k Series 2020-EXP2 Class A4IW, 0.862% due 8/25/2050 8,235,799 217,978
e,g Series 2020-EXP2 Class B5, 3.362% due 8/25/2050 585,000 510,435e,g Series 2020-EXP2 Class B6, 3.362% due 8/25/2050 1,400,000 756,870
e,g,k Series 2021-J1 Class A5IX, 0.112% due 4/25/2051 125,152,881 546,931e,g,k Series 2021-J1 Class AIOS, 0.23% due 4/25/2051 127,432,464 1,402,840
e,g Series 2021-J1 Class B4, 2.612% due 4/25/2051 379,000 214,143
Schedule of Investments, Continued
Thornburg Investment Income Builder Fund | March 31, 2022 (Unaudited)
64 | Thornburg Equity Funds Semi-Annual Report See notes to financial statements.

ISSUER-DESCRIPTIONSHARES/
PRINCIPAL AMOUNT VALUE
e,g Series 2021-J1 Class B5, 2.612% due 4/25/2051 $ 615,000 $ 296,918e,g Series 2021-J1 Class B6, 2.612% due 4/25/2051 460,000 145,485
e,g,k Series 2021-J3 Class A3I1, 0.50% due 9/25/2051 16,145,552 375,949e,g,k Series 2021-J3 Class A5I2, 0.25% due 9/25/2051 132,887,331 1,555,327e,g,k Series 2021-J3 Class AIOS, 0.08% due 9/25/2051 139,563,348 439,625
e,g Series 2021-J3 Class B4, 2.859% due 9/25/2051 1,033,000 604,824e,g Series 2021-J3 Class B6, 2.859% due 9/25/2051 590,000 201,092
CSMC Trust, Whole Loan Securities Trust CMO,e,g Series 2020-AFC1 Class M1, 2.841% due 2/25/2050 3,808,500 3,760,805
e,g,k Series 2021-AFC1 Class AIOS, 0.25% due 3/25/2056 103,545,948 648,560e,g Series 2021-AFC1 Class B3, 4.398% due 3/25/2056 215,000 196,041
e,g,k Series 2021-AFC1 Class XS, 3.392% due 3/25/2056 103,545,948 4,966,364Flagstar Mortgage Trust, Whole Loan Securities Trust CMO,
e,g,k Series 2020-2 Class AX1, 0.69% due 8/25/2050 128,327,143 1,905,992e,g,k Series 2020-2 Class AX2, 0.50% due 8/25/2050 21,994,605 257,036
e,g Series 2020-2 Class B4, 3.69% due 8/25/2050 862,670 799,006e,g Series 2020-2 Class B5, 3.69% due 8/25/2050 2,588,009 2,369,763e,g Series 2020-2 Class B6C, 3.617% due 8/25/2050 3,450,679 2,281,600
e,g,k Series 2021-13INV Class AX1, 0.194% due 12/30/2051 188,821,806 1,524,774e,g,k Series 2021-13INV Class AX17, 0.18% due 12/30/2051 15,653,621 139,328e,g,k Series 2021-13INV Class AX4, 0.50% due 12/30/2051 14,283,929 361,585
e,g Series 2021-13INV Class B4, 3.374% due 12/30/2051 2,483,914 1,995,650e,g Series 2021-13INV Class B5, 3.374% due 12/30/2051 486,847 367,705e,g Series 2021-13INV Class B6C, 3.31% due 12/30/2051 4,272,333 2,459,352e,g Galton Funding Mortgage Trust, Whole Loan Securities Trust CMO, Series 2020-H1 Class B1, 3.386% due 1/25/2060 4,379,900 4,182,881
GS Mortgage-Backed Securities Trust, Whole Loan Securities Trust CMO,e,g,k Series 2020-INV1 Class A11X, 3.452% due 10/25/2050 1,759,987 90,447e,g,k Series 2020-INV1 Class A12X, 2.959% due 10/25/2050 21,072,781 930,129e,g,k Series 2020-INV1 Class AIOS, 0.19% due 10/25/2050 106,822,925 620,225e,g,k Series 2020-INV1 Class AX1, due 10/25/2050 77,136,663 771e,g,k Series 2020-INV1 Class AX2, 0.459% due 10/25/2050 3,797,866 27,177e,g,k Series 2020-INV1 Class AX4, 0.937% due 10/25/2050 4,088,726 63,404
e,g Series 2020-INV1 Class B4, 3.896% due 10/25/2050 1,948,753 1,881,744e,g Series 2020-INV1 Class B5, 3.896% due 10/25/2050 1,948,753 1,734,653e,g Series 2020-INV1 Class B6, 3.896% due 10/25/2050 4,491,544 3,290,232
e,g,k Series 2020-INV1 Class BX, 0.396% due 10/25/2050 22,241,096 358,008JPMorgan Mortgage Trust, Whole Loan Securities Trust CMO,
e,g Series 2016-5 Class B5, 2.318% due 12/25/2046 1,999,994 1,240,815e,g,k Series 2020-3 Class AX1, 0.166% due 8/25/2050 18,266,305 26,950e,g,k Series 2020-4 Class A11X, 5.063% (5.25% - LIBOR 1 Month) due 11/25/2050 3,519,926 122,352e,g,k Series 2020-4 Class A3X, 0.50% due 11/25/2050 15,956,997 120,780e,g,k Series 2020-4 Class AX1, 0.13% due 11/25/2050 58,939,396 80,494e,g,k Series 2020-4 Class AX3, 3.50% due 11/25/2050 1,630,703 86,401e,g,k Series 2020-4 Class AX4, 0.55% due 11/25/2050 3,763,387 31,334
e,g Series 2020-4 Class B4, 3.68% due 11/25/2050 2,008,847 1,991,581e,g Series 2020-4 Class B5, 3.68% due 11/25/2050 927,308 846,243e,g Series 2020-4 Class B6, 3.68% due 11/25/2050 1,603,555 1,400,718
e,g,k Series 2020-7 Class A3X, 0.50% due 1/25/2051 35,269,791 297,994e,g,k Series 2020-7 Class AX1, 0.13% due 1/25/2051 167,618,810 266,598e,g,k Series 2020-7 Class AX3, 3.50% due 1/25/2051 11,523,793 677,011e,g,k Series 2020-7 Class AX4, 0.40% due 1/25/2051 10,685,699 71,168
e,g Series 2020-7 Class B4, 3.53% due 1/25/2051 2,456,831 2,236,795e,g Series 2020-7 Class B5, 3.53% due 1/25/2051 1,721,716 1,507,076e,g Series 2020-7 Class B6, 3.53% due 1/25/2051 2,277,936 1,343,899
e,g,k Series 2021-11 Class A3X, 0.50% due 1/25/2052 19,351,611 491,684e,g,k Series 2021-11 Class AX1, 0.233% due 1/25/2052 368,602,104 3,550,044e,g,k Series 2021-11 Class AX4, 0.30% due 1/25/2052 47,918,274 742,091
e,g Series 2021-11 Class B5, 3.033% due 1/25/2052 3,833,059 2,606,481e,g Series 2021-11 Class B6, 2.935% due 1/25/2052 4,499,892 2,106,001
e,g,k Series 2022-2 Class AX1, 0.138% due 8/25/2052 234,066,676 1,146,927e,g,k Series 2022-2 Class AX4, 0.50% due 8/25/2052 14,783,159 314,142
e,g Series 2022-2 Class B4, 3.138% due 8/25/2052 3,363,867 2,648,311e,g Series 2022-2 Class B5, 3.138% due 8/25/2052 1,786,742 1,178,782
Schedule of Investments, Continued
Thornburg Investment Income Builder Fund | March 31, 2022 (Unaudited)
See notes to financial statements. Thornburg Equity Funds Semi-Annual Report | 65
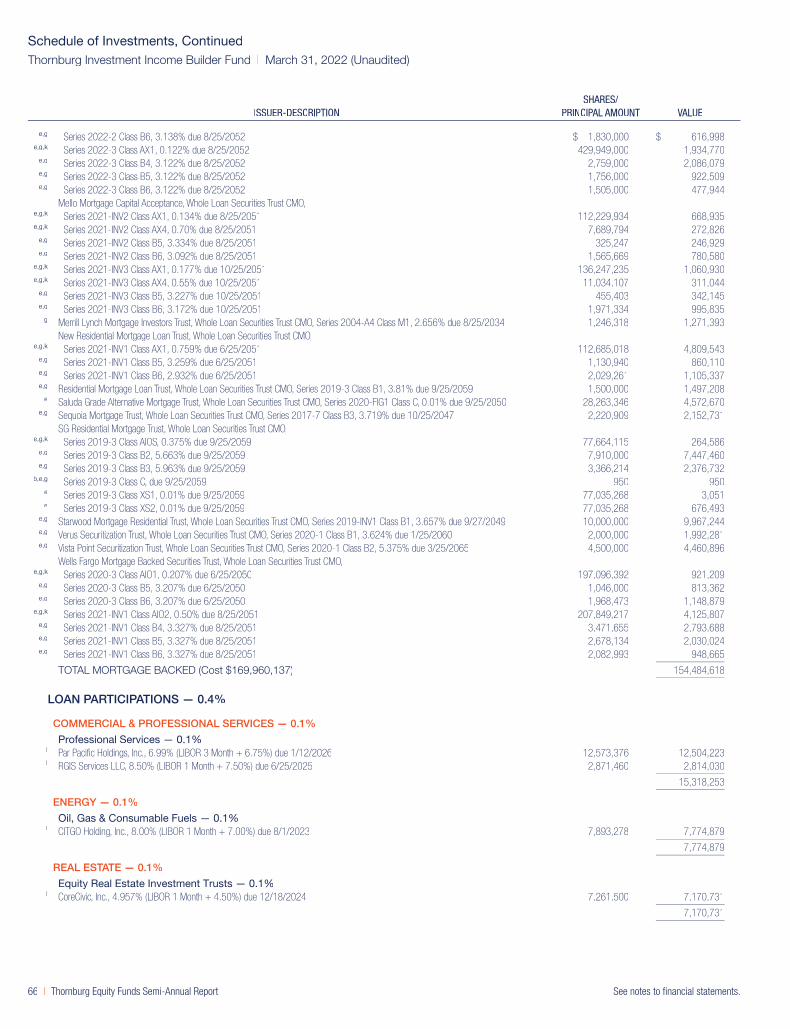
ISSUER-DESCRIPTIONSHARES/
PRINCIPAL AMOUNT VALUE
e,g Series 2022-2 Class B6, 3.138% due 8/25/2052 $ 1,830,000 $ 616,998e,g,k Series 2022-3 Class AX1, 0.122% due 8/25/2052 429,949,000 1,934,770
e,g Series 2022-3 Class B4, 3.122% due 8/25/2052 2,759,000 2,086,079e,g Series 2022-3 Class B5, 3.122% due 8/25/2052 1,756,000 922,509e,g Series 2022-3 Class B6, 3.122% due 8/25/2052 1,505,000 477,944
Mello Mortgage Capital Acceptance, Whole Loan Securities Trust CMO,e,g,k Series 2021-INV2 Class AX1, 0.134% due 8/25/2051 112,229,934 668,935e,g,k Series 2021-INV2 Class AX4, 0.70% due 8/25/2051 7,689,794 272,826
e,g Series 2021-INV2 Class B5, 3.334% due 8/25/2051 325,247 246,929e,g Series 2021-INV2 Class B6, 3.092% due 8/25/2051 1,565,669 780,580
e,g,k Series 2021-INV3 Class AX1, 0.177% due 10/25/2051 136,247,235 1,060,930e,g,k Series 2021-INV3 Class AX4, 0.55% due 10/25/2051 11,034,107 311,044
e,g Series 2021-INV3 Class B5, 3.227% due 10/25/2051 455,403 342,145e,g Series 2021-INV3 Class B6, 3.172% due 10/25/2051 1,971,334 995,835
g Merrill Lynch Mortgage Investors Trust, Whole Loan Securities Trust CMO, Series 2004-A4 Class M1, 2.656% due 8/25/2034 1,246,318 1,271,393New Residential Mortgage Loan Trust, Whole Loan Securities Trust CMO,
e,g,k Series 2021-INV1 Class AX1, 0.759% due 6/25/2051 112,685,018 4,809,543e,g Series 2021-INV1 Class B5, 3.259% due 6/25/2051 1,130,940 860,110e,g Series 2021-INV1 Class B6, 2.932% due 6/25/2051 2,029,261 1,105,337e,g Residential Mortgage Loan Trust, Whole Loan Securities Trust CMO, Series 2019-3 Class B1, 3.81% due 9/25/2059 1,500,000 1,497,208
e Saluda Grade Alternative Mortgage Trust, Whole Loan Securities Trust CMO, Series 2020-FIG1 Class C, 0.01% due 9/25/2050 28,263,346 4,572,670e,g Sequoia Mortgage Trust, Whole Loan Securities Trust CMO, Series 2017-7 Class B3, 3.719% due 10/25/2047 2,220,909 2,152,731
SG Residential Mortgage Trust, Whole Loan Securities Trust CMO,e,g,k Series 2019-3 Class AIOS, 0.375% due 9/25/2059 77,664,115 264,586
e,g Series 2019-3 Class B2, 5.663% due 9/25/2059 7,910,000 7,447,460e,g Series 2019-3 Class B3, 5.963% due 9/25/2059 3,366,214 2,376,732
b,e,g Series 2019-3 Class C, due 9/25/2059 950 950e Series 2019-3 Class XS1, 0.01% due 9/25/2059 77,035,268 3,051e Series 2019-3 Class XS2, 0.01% due 9/25/2059 77,035,268 676,493
e,g Starwood Mortgage Residential Trust, Whole Loan Securities Trust CMO, Series 2019-INV1 Class B1, 3.657% due 9/27/2049 10,000,000 9,967,244e,g Verus Securitization Trust, Whole Loan Securities Trust CMO, Series 2020-1 Class B1, 3.624% due 1/25/2060 2,000,000 1,992,281e,g Vista Point Securitization Trust, Whole Loan Securities Trust CMO, Series 2020-1 Class B2, 5.375% due 3/25/2065 4,500,000 4,460,896
Wells Fargo Mortgage Backed Securities Trust, Whole Loan Securities Trust CMO,e,g,k Series 2020-3 Class AIO1, 0.207% due 6/25/2050 197,096,392 921,209
e,g Series 2020-3 Class B5, 3.207% due 6/25/2050 1,046,000 813,362e,g Series 2020-3 Class B6, 3.207% due 6/25/2050 1,968,473 1,148,879
e,g,k Series 2021-INV1 Class AIO2, 0.50% due 8/25/2051 207,849,217 4,125,807e,g Series 2021-INV1 Class B4, 3.327% due 8/25/2051 3,471,655 2,793,688e,g Series 2021-INV1 Class B5, 3.327% due 8/25/2051 2,678,134 2,030,024e,g Series 2021-INV1 Class B6, 3.327% due 8/25/2051 2,082,993 948,665
TOTAL MORTGAGE BACKED (Cost $169,960,137) 154,484,618
LOAN PARTICIPATIONS — 0.4%
COMMERCIAL & PROFESSIONAL SERVICES — 0.1%
Professional Services — 0.1%l Par Pacific Holdings, Inc., 6.99% (LIBOR 3 Month + 6.75%) due 1/12/2026 12,573,376 12,504,223l RGIS Services LLC, 8.50% (LIBOR 1 Month + 7.50%) due 6/25/2025 2,871,460 2,814,030
15,318,253
ENERGY — 0.1%
Oil, Gas & Consumable Fuels — 0.1%l CITGO Holding, Inc., 8.00% (LIBOR 1 Month + 7.00%) due 8/1/2023 7,893,278 7,774,879
7,774,879
REAL ESTATE — 0.1%
Equity Real Estate Investment Trusts — 0.1%l CoreCivic, Inc., 4.957% (LIBOR 1 Month + 4.50%) due 12/18/2024 7,261,500 7,170,731
7,170,731
Schedule of Investments, Continued
Thornburg Investment Income Builder Fund | March 31, 2022 (Unaudited)
66 | Thornburg Equity Funds Semi-Annual Report See notes to financial statements.
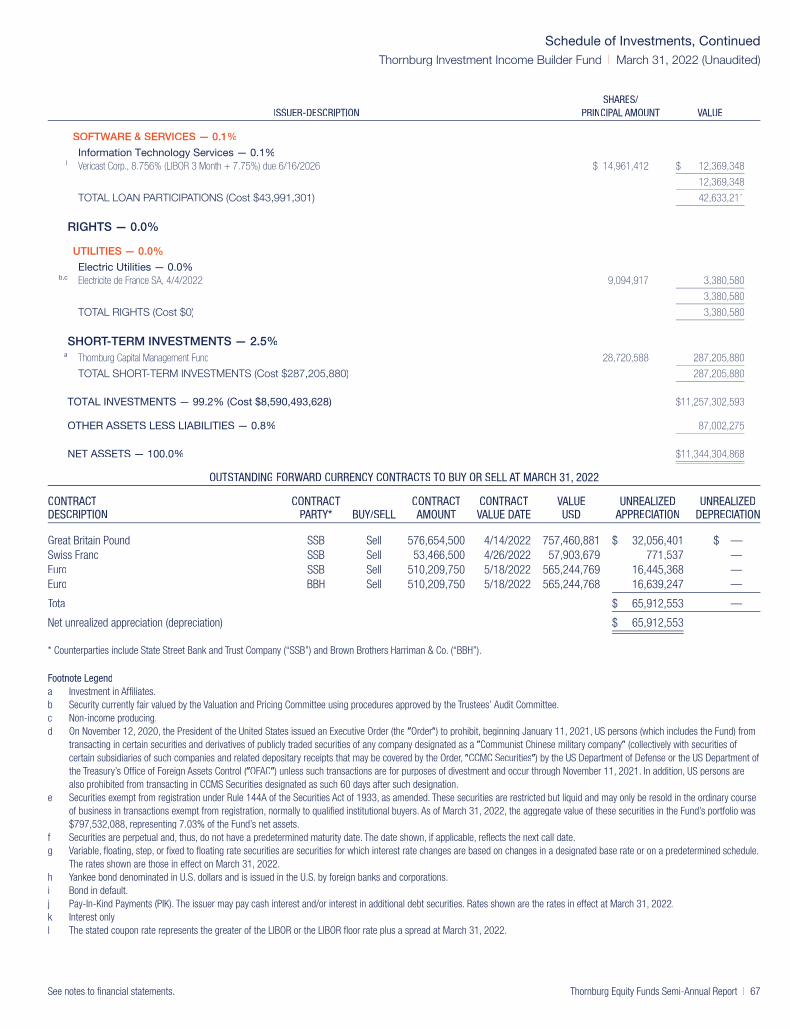
ISSUER-DESCRIPTIONSHARES/
PRINCIPAL AMOUNT VALUE
SOFTWARE & SERVICES — 0.1%
Information Technology Services — 0.1%l Vericast Corp., 8.756% (LIBOR 3 Month + 7.75%) due 6/16/2026 $ 14,961,412 $ 12,369,348
12,369,348
TOTAL LOAN PARTICIPATIONS (Cost $43,991,301) 42,633,211
RIGHTS — 0.0%
UTILITIES — 0.0%
Electric Utilities — 0.0%b,c Electricite de France SA, 4/4/2022 9,094,917 3,380,580
3,380,580
TOTAL RIGHTS (Cost $0) 3,380,580
SHORT-TERM INVESTMENTS — 2.5%a Thornburg Capital Management Fund 28,720,588 287,205,880
TOTAL SHORT-TERM INVESTMENTS (Cost $287,205,880) 287,205,880
TOTAL INVESTMENTS — 99.2% (Cost $8,590,493,628) $11,257,302,593
OTHER ASSETS LESS LIABILITIES — 0.8% 87,002,275
NET ASSETS — 100.0% $11,344,304,868
OUTSTANDING FORWARD CURRENCY CONTRACTS TO BUY OR SELL AT MARCH 31, 2022
CONTRACTDESCRIPTION
CONTRACTPARTY* BUY/SELL
CONTRACTAMOUNT
CONTRACTVALUE DATE
VALUEUSD
UNREALIZEDAPPRECIATION
UNREALIZEDDEPRECIATION
Great Britain Pound SSB Sell 576,654,500 4/14/2022 757,460,881 $ 32,056,401 $ —Swiss Franc SSB Sell 53,466,500 4/26/2022 57,903,679 771,537 —Euro SSB Sell 510,209,750 5/18/2022 565,244,769 16,445,368 —Euro BBH Sell 510,209,750 5/18/2022 565,244,768 16,639,247 —
Total $ 65,912,553 —
Net unrealized appreciation (depreciation) $ 65,912,553
* Counterparties include State Street Bank and Trust Company (“SSB”) and Brown Brothers Harriman & Co. (“BBH”).
Footnote Legenda Investment in Affiliates.b Security currently fair valued by the Valuation and Pricing Committee using procedures approved by the Trustees’ Audit Committee.c Non-income producing.d On November 12, 2020, the President of the United States issued an Executive Order (the �Order�) to prohibit, beginning January 11, 2021, US persons (which includes the Fund) from��
transacting in certain securities and derivatives of publicly traded securities of any company designated as a �Communist Chinese military company� (collectively with securities ofcertain subsidiaries of such companies and related depositary receipts that may be covered by the Order, �CCMC Securities�) by the US Department of Defense or the US Department of��
the Treasury’s Office of Foreign Assets Control (�(( OFAC�) unless such transactions are for purposes of divestment and occur through November 11, 2021. In addition, US persons are��
also prohibited from transacting in CCMS Securities designated as such 60 days after such designation.e Securities exempt from registration under Rule 144A of the Securities Act of 1933, as amended. These securities are restricted but liquid and may only be resold in the ordinary course
of business in transactions exempt from registration, normally to qualified institutional buyers. As of March 31, 2022, the aggregate value of these securities in the Fund’s portfolio was$797,532,088, representing 7.03% of the Fund’s net assets.
f Securities are perpetual and, thus, do not have a predetermined maturity date. The date shown, if applicable, reflects the next call date.g Variable, floating, step, or fixed to floating rate securities are securities for which interest rate changes are based on changes in a designated base rate or on a predetermined schedule.
The rates shown are those in effect on March 31, 2022.h Yankee bond denominated in U.S. dollars and is issued in the U.S. by foreign banks and corporations.i Bond in default.j Pay-In-Kind Payments (PIK). The issuer may pay cash interest and/or interest in additional debt securities. Rates shown are the rates in effect at March 31, 2022.k Interest only.l The stated coupon rate represents the greater of the LIBOR or the LIBOR floor rate plus a spread at March 31, 2022.
Schedule of Investments, Continued
Thornburg Investment Income Builder Fund | March 31, 2022 (Unaudited)
See notes to financial statements. Thornburg Equity Funds Semi-Annual Report | 67
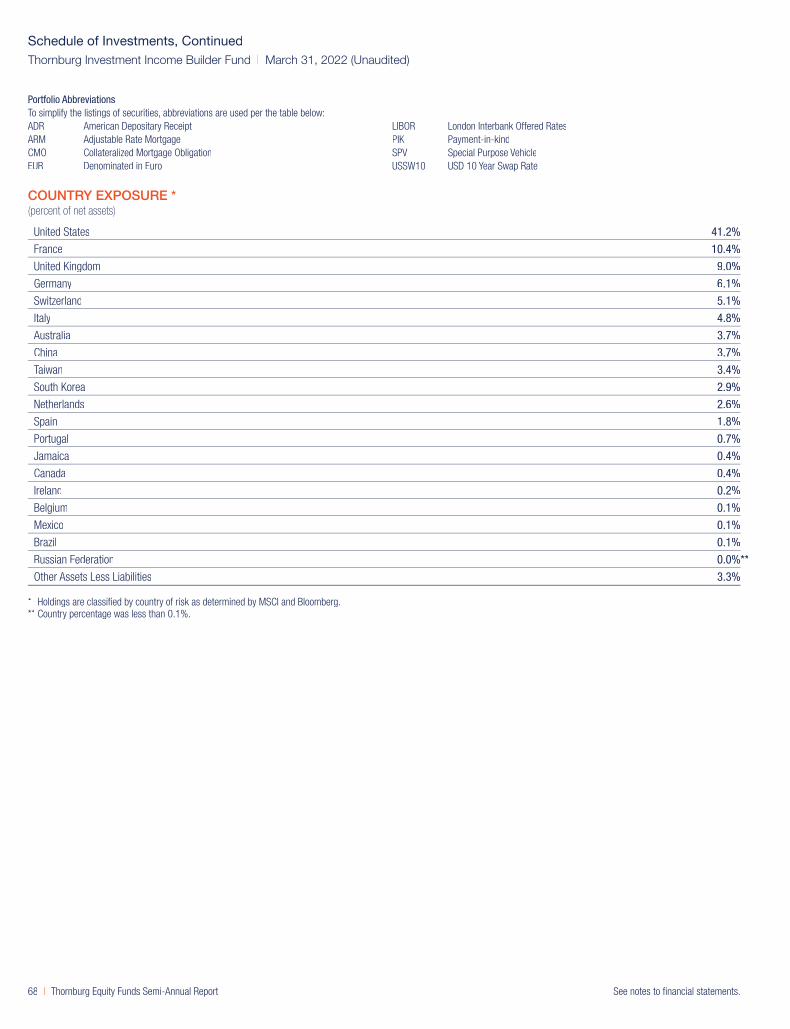
Portfolio AbbreviationsTo simplify the listings of securities, abbreviations are used per the table below:ADR American Depositary ReceiptARM Adjustable Rate MortgageCMO Collateralized Mortgage ObligationEUR Denominated in Euro
LIBOR London Interbank Offered RatesPIK Payment-in-kindSPV Special Purpose VehicleUSSW10 USD 10 Year Swap Rate
COUNTRY EXPOSURE *(percent of net assets)
United States 41.2%
France 10.4%
United Kingdom 9.0%
Germany 6.1%
Switzerland 5.1%
Italy 4.8%
Australia 3.7%
China 3.7%
Taiwan 3.4%
South Korea 2.9%
Netherlands 2.6%
Spain 1.8%
Portugal 0.7%
Jamaica 0.4%
Canada 0.4%
Ireland 0.2%
Belgium 0.1%
Mexico 0.1%
Brazil 0.1%
Russian Federation 0.0%**
Other Assets Less Liabilities 3.3%
* Holdings are classified by country of risk as determined by MSCI and Bloomberg.** Country percentage was less than 0.1%.
Schedule of Investments, Continued
Thornburg Investment Income Builder Fund | March 31, 2022 (Unaudited)
68 | Thornburg Equity Funds Semi-Annual Report See notes to financial statements.

ISSUER-DESCRIPTIONSHARES/
PRINCIPAL AMOUNT VALUE
COMMON STOCK — 54.4%
AUTOMOBILES & COMPONENTS — 0.3%
Automobiles — 0.3%
Stellantis NV 14,739 $ 239,804
239,804
BANKS — 2.8%
Banks — 2.8%
BNP Paribas SA 7,702 440,128JPMorgan Chase & Co. 8,633 1,176,851Mitsubishi UFJ Financial Group, Inc. 58,900 364,069
1,981,048
CAPITAL GOODS — 1.7%
Aerospace & Defense — 0.5%
L3Harris Technologies, Inc. 1,445 359,039
Machinery — 1.2%a Kornit Digital Ltd. 2,529 209,123
Otis Worldwide Corp. 8,160 627,912
1,196,074
CONSUMER DURABLES & APPAREL — 1.1%
Household Durables — 0.6%
Barratt Developments plc 57,281 389,958
Textiles, Apparel & Luxury Goods — 0.5%
LVMH Moet Hennessy Louis Vuitton SE 514 366,892
756,850
CONSUMER SERVICES — 1.2%
Hotels, Restaurants & Leisure — 1.2%
Wyndham Hotels & Resorts, Inc. 10,204 864,177
864,177
DIVERSIFIED FINANCIALS — 3.1%
Capital Markets — 1.4%
B3 SA - Brasil Bolsa Balcao 71,949 237,410CME Group, Inc. 3,157 750,924
Consumer Finance — 1.7%
Capital One Financial Corp. 6,506 854,173SBI Cards & Payment Services Ltd. 32,326 360,339
2,202,846
ENERGY — 2.4%
Oil, Gas & Consumable Fuels — 2.4%
Chesapeake Energy Corp. 11,410 992,670TotalEnergies SE 13,661 691,240
1,683,910
FOOD, BEVERAGE & TOBACCO — 1.0%
Food Products — 1.0%
Nestle SA 5,694 740,326
740,326
HOUSEHOLD & PERSONAL PRODUCTS — 0.7%
Personal Products — 0.7%
Estee Lauder Cos., Inc. Class A 1,938 527,756
527,756
INSURANCE — 1.1%
Insurance — 1.1%
NN Group NV 15,781 799,761
799,761
Schedule of InvestmentsThornburg Summit Fund | March 31, 2022 (Unaudited)
See notes to financial statements. Thornburg Equity Funds Semi-Annual Report | 69

ISSUER-DESCRIPTIONSHARES/
PRINCIPAL AMOUNT VALUE
MATERIALS — 3.5%
Chemicals — 2.7%
Fertiglobe plc 324,966 $ 442,036Linde plc 2,142 684,219LyondellBasell Industries NV Class A 3,644 374,676PPG Industries, Inc. 3,442 451,143
Metals & Mining — 0.8%
Glencore plc 83,749 544,930
2,497,004
MEDIA & ENTERTAINMENT — 5.9%
Entertainment — 1.8%
Nintendo Co. Ltd. 900 454,286a Sea Ltd. ADR 3,654 437,712a Walt Disney Co. 2,743 376,230
Interactive Media & Services — 4.1%a Alphabet, Inc. Class A 691 1,921,913a Meta Platforms, Inc. Class A 4,712 1,047,760
4,237,901
PHARMACEUTICALS, BIOTECHNOLOGY & LIFE SCIENCES — 5.8%
Biotechnology — 0.7%a ChemoCentryx, Inc. 18,154 455,121
Life Sciences Tools & Services — 1.2%
Thermo Fisher Scientific, Inc. 1,481 874,752
Pharmaceuticals — 3.9%
AstraZeneca plc 4,845 642,510Merck & Co., Inc. 14,580 1,196,289Roche Holding AG 2,373 938,905
4,107,577
RETAILING — 4.0%
Internet & Direct Marketing Retail — 2.3%a Amazon.com, Inc. 375 1,222,481a MercadoLibre, Inc. 362 430,592
Multiline Retail — 0.8%
Dollar General Corp. 2,542 565,925
Specialty Retail — 0.9%
Home Depot, Inc. 2,053 614,525
2,833,523
SEMICONDUCTORS & SEMICONDUCTOR EQUIPMENT — 4.2%
Semiconductors & Semiconductor Equipment — 4.2%
ASML Holding NV 1,014 677,577Broadcom, Inc. 1,005 632,828NVIDIA Corp. 2,396 653,773Taiwan Semiconductor Manufacturing Co. Ltd. Sponsored ADR 9,686 1,009,862
2,974,040
SOFTWARE & SERVICES — 6.8%
Information Technology Services — 2.8%
Mastercard, Inc. Class A 1,958 699,750Nomura Research Institute Ltd. 17,400 567,715Visa, Inc. Class A 3,322 736,720
Software — 4.0%a Fair Isaac Corp. 389 181,453
Microsoft Corp. 4,632 1,428,092SAP SE 7,858 870,887
a ServiceNow, Inc. 619 344,715
4,829,332
Schedule of Investments, Continued
Thornburg Summit Fund | March 31, 2022 (Unaudited)
70 | Thornburg Equity Funds Semi-Annual Report See notes to financial statements.

ISSUER-DESCRIPTIONSHARES/
PRINCIPAL AMOUNT VALUE
TECHNOLOGY HARDWARE & EQUIPMENT — 5.0%
Communications Equipment — 1.2%
Cisco Systems, Inc. 15,061 $ 839,801
Electronic Equipment, Instruments & Components — 0.7%
Keyence Corp. 1,100 510,073
Technology Hardware, Storage & Peripherals — 3.1%
Apple, Inc. 6,789 1,185,427Samsung Electronics Co. Ltd. 17,903 1,024,463
3,559,764
TELECOMMUNICATION SERVICES — 2.4%
Diversified Telecommunication Services — 2.4%a Converge ICT Solutions, Inc. 561,400 326,057
Deutsche Telekom AG 26,746 498,121Orange SA 75,531 894,264
1,718,442
TRANSPORTATION — 0.8%
Road & Rail — 0.8%
Canadian Pacific Railway Ltd. 7,195 593,875
593,875
UTILITIES — 0.6%
Electric Utilities — 0.6%
Enel SpA 69,409 463,426
463,426
TOTAL COMMON STOCK (Cost $34,658,658) 38,807,436
ASSET BACKED SECURITIES — 10.4%
AUTO RECEIVABLES — 3.0%CPS Auto Receivables Trust,
b Series 2021-A 0.61% due 2/18/2025 $ 577,718 575,724b Series 2022-A 0.98% due 4/16/2029 366,226 362,671
GM Financial Automobile Leasing Trust, Series 2021-3 0.24% due 12/20/2023 535,630 531,770Volkswagen Auto Lease Trust, Series 2020-A Class A3, 0.39% due 1/22/2024 700,000 693,936
2,164,101
CREDIT CARD — 0.6%b Mission Lane Credit Card Master Trust, Series 2021-A Class A, 1.59% due 9/15/2026 450,000 438,742
438,742
OTHER ASSET BACKED — 6.2%b Amur Equipment Finance Receivables X LLC, Series 2022-1A 0.335% due 1/20/2023 274,160 273,611
Aqua Finance Trust,b Series 2019-A Class A, 3.14% due 7/16/2040 28,840 28,536b Series 2019-A Class B, 3.47% due 7/16/2040 200,000 194,262b AXIS Equipment Finance Receivables LLC, Series 2021-1A Class F, 6.09% due 2/20/2029 600,000 571,362b Conn’s Receivables Funding LLC, Series 2020-A Class A, 1.71% due 6/16/2025 6,121 6,119b Diamond Resorts Owner Trust, Series 2018-1 Class A, 3.70% due 1/21/2031 20,372 20,501
b,c ECAF I Ltd., Series 2015-1A Class A2, 4.947% due 6/15/2040 184,144 151,011b Foundation Finance Trust, Series 2019-1A Class A, 3.86% due 11/15/2034 55,783 55,747
b,d Goldman Home Improvement Trust Series 2021-GRN2 Class R, due 6/20/2051 2,000 188,940b LendingPoint Asset Securitization Trust, Series 2021-A Class A, 1.00% due 12/15/2028 172,820 170,886b LendingPoint Pass-Through Trust, Series 2022-ST1 2.50% due 3/15/2028 287,601 281,354
Marlette Funding Trust,b Series 2021-1A Class R, 0.01% due 6/16/2031 1,200 293,552b Series 2021-2A Class R, 0.01% due 9/15/2031 1,150 316,041
b,d Mosaic Solar Loan Trust, Series 2021-2A Class R, 0.01% due 4/22/2047 1,150,000 263,580b New Residential Advance Receivables Trust Advance Receivables Backed, Series 2020-T1 Class DT1, 3.011% due 8/15/2053 250,000 244,507b New Residential Advance Receivables Trust Advance Receivables Backed Notes, Series 2020-APT1 Class AT1, 1.035% due 12/16/2052 400,000 394,283
b,e SBA Tower Trust, Series 2014-2A Class C, 3.869% due 10/15/2049 30,000 30,249b Sierra Timeshare Receivables Funding LLC, Series 2019-1A Class A, 3.20% due 1/20/2036 23,851 23,906
Schedule of Investments, Continued
Thornburg Summit Fund | March 31, 2022 (Unaudited)
See notes to financial statements. Thornburg Equity Funds Semi-Annual Report | 71

ISSUER-DESCRIPTIONSHARES/
PRINCIPAL AMOUNT VALUE
b SoFi Consumer Loan Program Trust, Series 2018-3 Class C, 4.67% due 8/25/2027 $ 118,885 $ 119,182Upstart Pass-Through Trust,
b Series 2021-ST4 Class CERT, 0.01% due 7/20/2027 500,000 372,060b Series 2021-ST7 Class A, 1.85% due 9/20/2029 409,755 395,568
4,395,257
STUDENT LOAN — 0.6%b,e Navient Private Education Loan Trust, Series 2015-AA Class A2B, 1.597% (LIBOR 1 Month + 1.20%) due 12/15/2028 230,898 230,719
b SMB Private Education Loan Trust, Series 2020-B Class A1A, 1.29% due 7/15/2053 178,585 167,944
398,663
TOTAL ASSET BACKED SECURITIES (Cost $7,799,245) 7,396,763
CORPORATE BONDS — 3.6%
AUTOMOBILES & COMPONENTS — 0.4%
Automobiles — 0.4%b Hyundai Capital America, 0.875% due 6/14/2024 300,000 283,773
283,773
DIVERSIFIED FINANCIALS — 1.3%
Capital Markets — 0.2%
Owl Rock Technology Finance Corp.,2.50% due 1/15/2027 168,000 151,637
b 4.75% due 12/15/2025 11,000 10,853
Diversified Financial Services — 1.1%e Goldman Sachs Group, Inc., 0.836% (SOFR + 0.70%) due 1/24/2025 400,000 396,344
b,c,e Societe Generale SA, 1.178% (SOFR + 1.05%) due 1/21/2026 400,000 393,788
952,622
ENERGY — 0.7%
Oil, Gas & Consumable Fuels — 0.7%
Petroleos Mexicanos (EUR), 3.75% due 2/21/2024 170,000 188,476b,c SA Global Sukuk Ltd., 0.946% due 6/17/2024 300,000 287,073
475,549
FOOD, BEVERAGE & TOBACCO — 0.4%
Tobacco — 0.4%b Vector Group Ltd., 10.50% due 11/1/2026 251,000 257,127
257,127
REAL ESTATE — 0.0%
Equity Real Estate Investment Trusts — 0.0%
Service Properties Trust, 4.95% due 2/15/2027 40,000 37,004
37,004
TECHNOLOGY HARDWARE & EQUIPMENT — 0.4%
Technology Hardware, Storage & Peripherals — 0.4%
Dell International LLC/EMC Corp., 4.90% due 10/1/2026 250,000 262,430
262,430
TELECOMMUNICATION SERVICES — 0.4%
Wireless Telecommunication Services — 0.4%
Sprint Communications, Inc., 9.25% due 4/15/2022 310,000 310,884
310,884
TOTAL CORPORATE BONDS (Cost $2,663,477) 2,579,389
Schedule of Investments, Continued
Thornburg Summit Fund | March 31, 2022 (Unaudited)
72 | Thornburg Equity Funds Semi-Annual Report See notes to financial statements.

ISSUER-DESCRIPTIONSHARES/
PRINCIPAL AMOUNT VALUE
CONVERTIBLE BONDS — 0.3%
DIVERSIFIED FINANCIALS — 0.3%
Diversified Financial Services — 0.3%
EZCORP, Inc., 2.375% due 5/1/2025 $ 230,000 $ 204,291
204,291
TOTAL CONVERTIBLE BONDS (Cost $193,099) 204,291
U.S. TREASURY SECURITIES — 13.8%United States Treasury Inflation Indexed Bonds, 0.125%, 7/15/2031 209,740 222,948United States Treasury Notes,
0.125%, 5/31/2022 - 2/15/2024 2,000,000 1,967,6880.375%, 11/30/2025 610,000 563,9160.625%, 5/15/2030 - 8/15/2030 675,000 588,5391.25%, 8/15/2031 550,000 500,0701.375%, 11/15/2031 1,700,000 1,560,0161.625%, 5/15/2031 600,000 565,1252.25%, 12/31/2023 1,400,000 1,399,617
United States Treasury Notes Inflationary Index,0.125%, 1/15/2030 - 7/15/2030 1,642,110 1,735,2750.25%, 2/15/2050 546,630 574,2573.625%, 4/15/2028 158,140 199,847
TOTAL U.S. TREASURY SECURITIES (Cost $10,249,365) 9,877,298
MORTGAGE BACKED — 6.5%b,e Angel Oak Mortgage Trust I LLC, Whole Loan Securities Trust CMO, Series 2019-2 Class A1, 3.628% due 3/25/2049 12,690 12,690b,e Arroyo Mortgage Trust, Whole Loan Securities Trust CMO, Series 2019-1 Class A1, 3.805% due 1/25/2049 60,311 60,311
Citigroup Mortgage Loan Trust, Whole Loan Securities Trust CMO,b,e,f Series 2021-J1 Class A5IX, 0.112% due 4/25/2051 12,696,669 55,486b,e,f Series 2021-J1 Class AIOS, 0.23% due 4/25/2051 18,204,638 200,406
b,e Series 2021-J1 Class B4, 2.612% due 4/25/2051 100,000 56,502b,e Series 2021-J1 Class B5, 2.612% due 4/25/2051 100,000 48,279b,e Series 2021-J1 Class B6, 2.612% due 4/25/2051 100,000 31,627
COMM Mortgage Trust, CMBS, Series 2015-LC23 Class ASB, 3.598% due 10/10/2048 423,312 425,663b,e Ellington Financial Mortgage Trust, Whole Loan Securities Trust CMO, Series 2022-1 2.206% due 1/25/2067 292,564 272,179
Federal Home Loan Mtg Corp., Seasoned Credit Risk Transfer, Whole Loan Securities Trust CMO, Series 2019-1 Class MA, 3.50% due7/25/2058 59,039 59,331
Federal Home Loan Mtg Corp., UMBS Collateral,Pool RC1535, 2.00% due 8/1/2035 473,539 460,764Pool SB0308, 2.50% due 1/1/2035 258,271 256,483
Federal Home Loan Mtg Corp., Whole Loan Securities Trust CMO, Series 2017-SC02 Class 1A, 3.00% due 5/25/2047 83,008 80,384Federal National Mtg Assoc., UMBS Collateral,
Pool BP9550, 2.50% due 7/1/2035 173,833 172,351Pool FM3758, 2.50% due 8/1/2031 131,084 130,746Pool MA4045, 2.00% due 6/1/2040 123,187 116,036
b,e Flagstar Mortgage Trust, Whole Loan Securities Trust CMO, Series 2019-2 Class B3, 4.056% due 12/25/2049 119,127 116,519b,e GCAT Trust, Whole Loan Securities Trust CMO, Series 2021-CM2 Class A1, 2.352% due 8/25/2066 350,659 341,117b,e Imperial Fund Mortgage Trust, Whole Loan Securities Trust CMO, Series 2021-NQM3 Class A1, 1.595% due 11/25/2056 382,046 370,463
JPMorgan Chase Commercial Mortgage Securities Trust, CMBS,b Series 2012-HSBC Class A, 3.093% due 7/5/2032 240,212 240,547
Series 2013-LC11 Class A5, 2.96% due 4/15/2046 425,000 425,054b,e Metlife Securitization Trust, Whole Loan Securities Trust CMO, Series 2019-1A Class A1A, 3.75% due 4/25/2058 69,694 70,178b,e MFRA Trust Whole Loan Securities Trust CMO, Series 2022-CHM1, 3.875% due 9/25/2056 375,924 371,025
e Morgan Stanley Bank of America Merrill Lynch Trust, CMBS, Series 2013-C10 Class ASB, 3.912% due 7/15/2046 98,876 99,603b,e TIAA Bank Mortgage Loan Trust, Whole Loan Securities Trust CMO, Series 2018-2 Class B3, 3.755% due 7/25/2048 167,241 160,260
TOTAL MORTGAGE BACKED (Cost $4,759,040) 4,634,004
Schedule of Investments, Continued
Thornburg Summit Fund | March 31, 2022 (Unaudited)
See notes to financial statements. Thornburg Equity Funds Semi-Annual Report | 73

ISSUER-DESCRIPTIONSHARES/
PRINCIPAL AMOUNT VALUE
LOAN PARTICIPATIONS — 0.1%
REAL ESTATE — 0.1%
Equity Real Estate Investment Trusts — 0.1%g CoreCivic, Inc., 4.957% (LIBOR 1 Month + 4.50%) due 12/18/2024 $ 41,200 $ 40,685
40,685
TOTAL LOAN PARTICIPATIONS (Cost $39,957) 40,685
EXCHANGE-TRADED FUNDS — 5.3%a Invesco DB Agriculture Fund 25,677 561,813a Invesco DB Base Metals Fund 40,742 1,052,773a SPDR Gold Shares Fund 7,233 1,306,642a United States Oil Fund LP 11,520 853,862
TOTAL EXCHANGE-TRADED FUNDS (Cost $2,949,078) 3,775,090
SHORT-TERM INVESTMENTS — 4.0%h Thornburg Capital Management Fund 287,344 2,873,440
TOTAL SHORT-TERM INVESTMENTS (Cost $2,873,440) 2,873,440
TOTAL INVESTMENTS — 98.4% (Cost $66,185,359) $70,188,396
OTHER ASSETS LESS LIABILITIES — 1.6% 1,143,136
NET ASSETS — 100.0% $71,331,532
OUTSTANDING FORWARD CURRENCY CONTRACTS TO BUY OR SELL AT MARCH 31, 2022
CONTRACTDESCRIPTION
CONTRACTPARTY* BUY/SELL
CONTRACTAMOUNT
CONTRACTVALUE DATE
VALUEUSD
UNREALIZEDAPPRECIATION
UNREALIZEDDEPRECIATION
Euro MSC Buy 433,820 4/28/2022 480,251 $ — $ (10,288)Japanese Yen MSC Buy 73,300,000 4/28/2022 602,365 — (39,459)
Total — $ (49,747)
Net unrealized appreciation (depreciation) $ (49,747)
* Counterparty includes Morgan Stanely & Co. Inc. (�(( MSC�).��
Footnote Legenda Non-income producing.b Securities exempt from registration under Rule 144A of the Securities Act of 1933, as amended. These securities are restricted but liquid and may only be resold in the ordinary course
of business in transactions exempt from registration, normally to qualified institutional buyers. As of March 31, 2022, the aggregate value of these securities in the Fund’s portfolio was$9,811,260, representing 13.75% of the Fund’s net assets.
c Yankee bond denominated in U.S. dollars and is issued in the U.S. by foreign banks and corporations.d Security currently fair valued by the Valuation and Pricing Committee using procedures approved by the Trustees’ Audit Committee.e Variable, floating, step, or fixed to floating rate securities are securities for which interest rate changes are based on changes in a designated base rate or on a predetermined schedule.
The rates shown are those in effect on March 31, 2022.f Interest only.g The stated coupon rate represents the greater of the LIBOR or the LIBOR floor rate plus a spread at March 31, 2022.h Investment in Affiliates.
Portfolio AbbreviationsTo simplify the listings of securities, abbreviations are used per the table below:ADR American Depositary ReceiptCMBS Commercial Mortgage-Backed SecuritiesCMO Collateralized Mortgage ObligationEUR Denominated in Euro
LIBOR London Interbank Offered RatesMtg MortgageSOFR Secured Overnight Financing RateUMBS Uniform Mortgage Backed Securities
Schedule of Investments, Continued
Thornburg Summit Fund | March 31, 2022 (Unaudited)
74 | Thornburg Equity Funds Semi-Annual Report See notes to financial statements.

COUNTRY EXPOSURE *(percent of net assets)
United States 69.7%
France 3.9%
Japan 2.7%
United Kingdom 2.4%
Switzerland 2.4%
Netherlands 2.1%
Taiwan 2.0%
Germany 1.9%
South Korea 1.4%
Brazil 0.9%
Canada 0.8%
Australia 0.8%
Italy 0.6%
United Arab Emirates 0.6%
India 0.5%
Philippines 0.5%
Saudi Arabia 0.4%
Israel 0.3%
Mexico 0.3%
Cayman Islands 0.2%
Other Assets Less Liabilities 5.6%
* Holdings are classified by country of risk as determined by MSCI and Bloomberg.
Schedule of Investments, Continued
Thornburg Summit Fund | March 31, 2022 (Unaudited)
See notes to financial statements. Thornburg Equity Funds Semi-Annual Report | 75
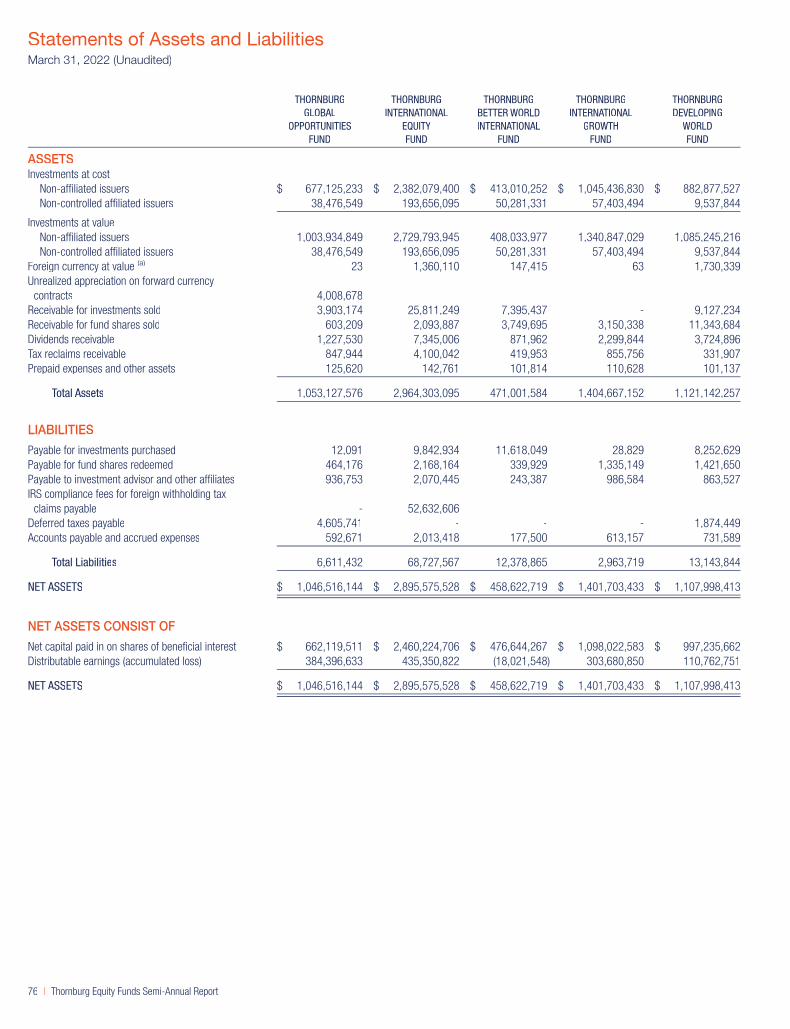
THORNBURGGLOBAL
OPPORTUNITIESFUND
THORNBURGINTERNATIONAL
EQUITYFUND
THORNBURGBETTER WORLDINTERNATIONAL
FUND
THORNBURGINTERNATIONAL
GROWTHFUND
THORNBURGDEVELOPING
WORLDFUND
ASSETSInvestments at cost
Non-affiliated issuers $ 677,125,233 $ 2,382,079,400 $ 413,010,252 $ 1,045,436,830 $ 882,877,527Non-controlled affiliated issuers 38,476,549 193,656,095 50,281,331 57,403,494 9,537,844
Investments at valueNon-affiliated issuers 1,003,934,849 2,729,793,945 408,033,977 1,340,847,029 1,085,245,216Non-controlled affiliated issuers 38,476,549 193,656,095 50,281,331 57,403,494 9,537,844
Foreign currency at value (a) 23 1,360,110 147,415 63 1,730,339Unrealized appreciation on forward currency
contracts 4,008,678 - - - -Receivable for investments sold 3,903,174 25,811,249 7,395,437 - 9,127,234Receivable for fund shares sold 603,209 2,093,887 3,749,695 3,150,338 11,343,684Dividends receivable 1,227,530 7,345,006 871,962 2,299,844 3,724,896Tax reclaims receivable 847,944 4,100,042 419,953 855,756 331,907Prepaid expenses and other assets 125,620 142,761 101,814 110,628 101,137
Total Assets 1,053,127,576 2,964,303,095 471,001,584 1,404,667,152 1,121,142,257
LIABILITIES
Payable for investments purchased 12,091 9,842,934 11,618,049 28,829 8,252,629Payable for fund shares redeemed 464,176 2,168,164 339,929 1,335,149 1,421,650Payable to investment advisor and other affiliates 936,753 2,070,445 243,387 986,584 863,527IRS compliance fees for foreign withholding tax
claims payable - 52,632,606 - - -Deferred taxes payable 4,605,741 - - - 1,874,449Accounts payable and accrued expenses 592,671 2,013,418 177,500 613,157 731,589
Total Liabilities 6,611,432 68,727,567 12,378,865 2,963,719 13,143,844
NET ASSETS $ 1,046,516,144 $ 2,895,575,528 $ 458,622,719 $ 1,401,703,433 $ 1,107,998,413
NET ASSETS CONSIST OF
Net capital paid in on shares of beneficial interest $ 662,119,511 $ 2,460,224,706 $ 476,644,267 $ 1,098,022,583 $ 997,235,662Distributable earnings (accumulated loss) 384,396,633 435,350,822 (18,021,548) 303,680,850 110,762,751
NET ASSETS $ 1,046,516,144 $ 2,895,575,528 $ 458,622,719 $ 1,401,703,433 $ 1,107,998,413
Statements of Assets and LiabilitiesMarch 31, 2022 (Unaudited)
76 | Thornburg Equity Funds Semi-Annual Report
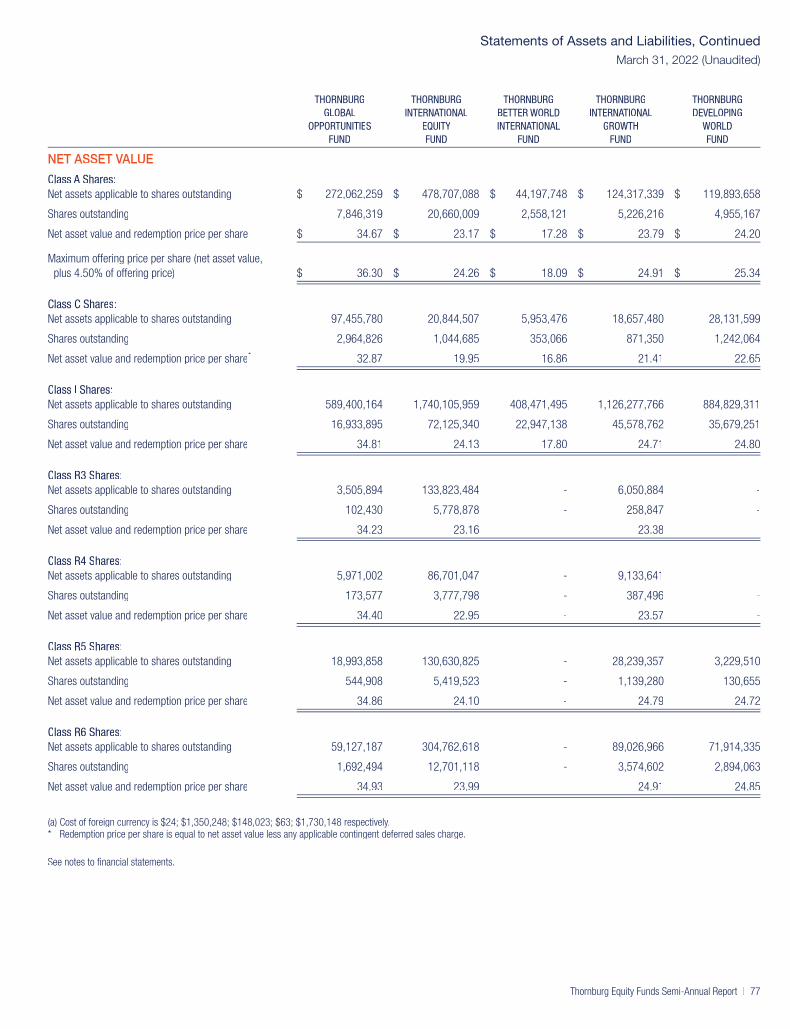
THORNBURGGLOBAL
OPPORTUNITIESFUND
THORNBURGINTERNATIONAL
EQUITYFUND
THORNBURGBETTER WORLDINTERNATIONAL
FUND
THORNBURGINTERNATIONAL
GROWTHFUND
THORNBURGDEVELOPING
WORLDFUND
NET ASSET VALUE
Class A Shares:Net assets applicable to shares outstanding $ 272,062,259 $ 478,707,088 $ 44,197,748 $ 124,317,339 $ 119,893,658
Shares outstanding 7,846,319 20,660,009 2,558,121 5,226,216 4,955,167
Net asset value and redemption price per share $ 34.67 $ 23.17 $ 17.28 $ 23.79 $ 24.20
Maximum offering price per share (net asset value,plus 4.50% of offering price) $ 36.30 $ 24.26 $ 18.09 $ 24.91 $ 25.34
Class C Shares:Net assets applicable to shares outstanding 97,455,780 20,844,507 5,953,476 18,657,480 28,131,599
Shares outstanding 2,964,826 1,044,685 353,066 871,350 1,242,064
Net asset value and redemption price per share* 32.87 19.95 16.86 21.41 22.65
Class I Shares:Net assets applicable to shares outstanding 589,400,164 1,740,105,959 408,471,495 1,126,277,766 884,829,311
Shares outstanding 16,933,895 72,125,340 22,947,138 45,578,762 35,679,251
Net asset value and redemption price per share 34.81 24.13 17.80 24.71 24.80
Class R3 Shares:Net assets applicable to shares outstanding 3,505,894 133,823,484 - 6,050,884 -
Shares outstanding 102,430 5,778,878 - 258,847 -
Net asset value and redemption price per share 34.23 23.16 - 23.38 -
Class R4 Shares:Net assets applicable to shares outstanding 5,971,002 86,701,047 - 9,133,641 -
Shares outstanding 173,577 3,777,798 - 387,496 -
Net asset value and redemption price per share 34.40 22.95 - 23.57 -
Class R5 Shares:Net assets applicable to shares outstanding 18,993,858 130,630,825 - 28,239,357 3,229,510
Shares outstanding 544,908 5,419,523 - 1,139,280 130,655
Net asset value and redemption price per share 34.86 24.10 - 24.79 24.72
Class R6 Shares:Net assets applicable to shares outstanding 59,127,187 304,762,618 - 89,026,966 71,914,335
Shares outstanding 1,692,494 12,701,118 - 3,574,602 2,894,063
Net asset value and redemption price per share 34.93 23.99 - 24.91 24.85
(a) Cost of foreign currency is $24; $1,350,248; $148,023; $63; $1,730,148 respectively.* Redemption price per share is equal to net asset value less any applicable contingent deferred sales charge.
See notes to financial statements.
Statements of Assets and Liabilities, Continued
March 31, 2022 (Unaudited)
Thornburg Equity Funds Semi-Annual Report | 77
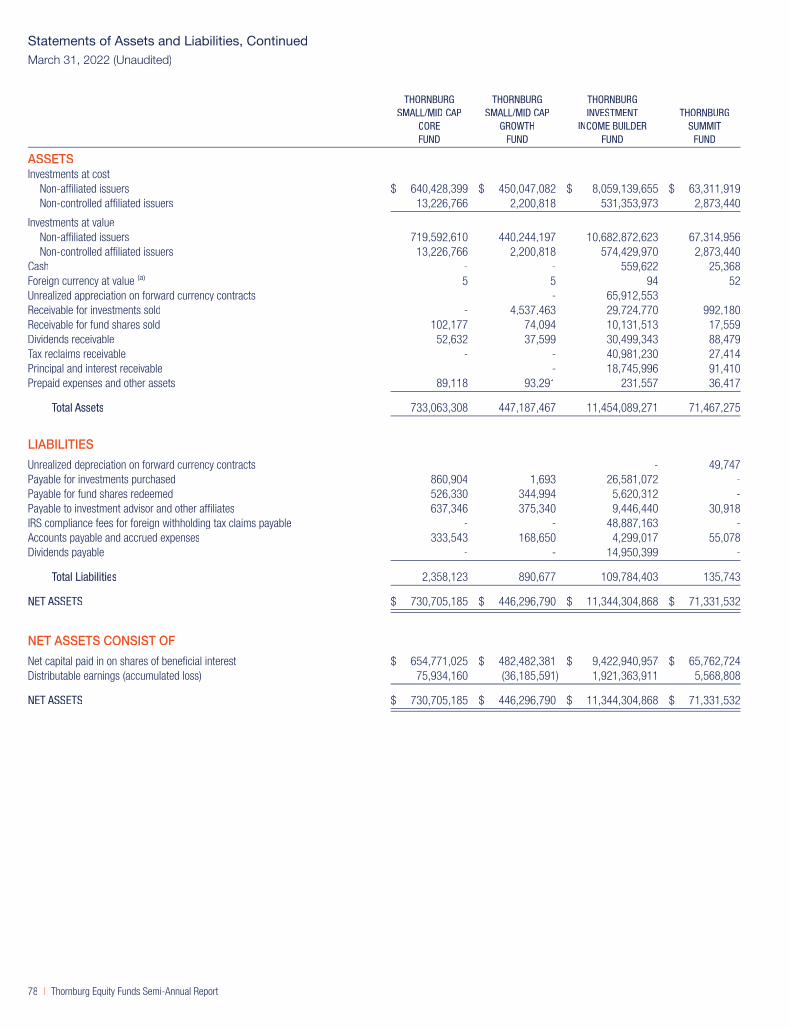
THORNBURGSMALL/MID CAP
COREFUND
THORNBURGSMALL/MID CAP
GROWTHFUND
THORNBURGINVESTMENT
INCOME BUILDERFUND
THORNBURGSUMMIT
FUND
ASSETSInvestments at cost
Non-affiliated issuers $ 640,428,399 $ 450,047,082 $ 8,059,139,655 $ 63,311,919Non-controlled affiliated issuers 13,226,766 2,200,818 531,353,973 2,873,440
Investments at valueNon-affiliated issuers 719,592,610 440,244,197 10,682,872,623 67,314,956Non-controlled affiliated issuers 13,226,766 2,200,818 574,429,970 2,873,440
Cash - - 559,622 25,368Foreign currency at value (a) 5 5 94 52Unrealized appreciation on forward currency contracts - - 65,912,553 -Receivable for investments sold - 4,537,463 29,724,770 992,180Receivable for fund shares sold 102,177 74,094 10,131,513 17,559Dividends receivable 52,632 37,599 30,499,343 88,479Tax reclaims receivable - - 40,981,230 27,414Principal and interest receivable - - 18,745,996 91,410Prepaid expenses and other assets 89,118 93,291 231,557 36,417
Total Assets 733,063,308 447,187,467 11,454,089,271 71,467,275
LIABILITIES
Unrealized depreciation on forward currency contracts - - - 49,747Payable for investments purchased 860,904 1,693 26,581,072 -Payable for fund shares redeemed 526,330 344,994 5,620,312 -Payable to investment advisor and other affiliates 637,346 375,340 9,446,440 30,918IRS compliance fees for foreign withholding tax claims payable - - 48,887,163 -Accounts payable and accrued expenses 333,543 168,650 4,299,017 55,078Dividends payable - - 14,950,399 -
Total Liabilities 2,358,123 890,677 109,784,403 135,743
NET ASSETS $ 730,705,185 $ 446,296,790 $ 11,344,304,868 $ 71,331,532
NET ASSETS CONSIST OF
Net capital paid in on shares of beneficial interest $ 654,771,025 $ 482,482,381 $ 9,422,940,957 $ 65,762,724Distributable earnings (accumulated loss) 75,934,160 (36,185,591) 1,921,363,911 5,568,808
NET ASSETS $ 730,705,185 $ 446,296,790 $ 11,344,304,868 $ 71,331,532
Statements of Assets and Liabilities, Continued
March 31, 2022 (Unaudited)
78 | Thornburg Equity Funds Semi-Annual Report

THORNBURGSMALL/MID CAP
COREFUND
THORNBURGSMALL/MID CAP
GROWTHFUND
THORNBURGINVESTMENT
INCOME BUILDERFUND
THORNBURGSUMMIT
FUND
NET ASSET VALUE
Class A Shares:Net assets applicable to shares outstanding $ 398,484,297 $ 225,823,853 $ 4,080,525,611 $ 117,015
Shares outstanding 5,639,098 8,034,483 172,440,989 9,682
Net asset value and redemption price per share $ 70.66 $ 28.11 $ 23.66 $ 12.09
Maximum offering price per share (net asset value, plus 4.50% of offering price) $ 73.99 $ 29.43 $ 24.77 $ -
Class C Shares:Net assets applicable to shares outstanding 12,139,578 10,566,894 811,519,578 -
Shares outstanding 200,130 512,893 34,343,113 -
Net asset value and redemption price per share* 60.66 20.60 23.63 -
Class I Shares:Net assets applicable to shares outstanding 284,889,979 173,739,429 6,255,460,558 71,214,517
Shares outstanding 3,855,740 5,391,662 262,411,189 5,890,785
Net asset value and redemption price per share 73.89 32.22 23.84 12.09
Class R3 Shares:Net assets applicable to shares outstanding 19,699,807 20,066,941 25,378,528 -
Shares outstanding 280,553 728,682 1,072,978 -
Net asset value and redemption price per share 70.22 27.54 23.65 -
Class R4 Shares:Net assets applicable to shares outstanding 3,870,703 1,555,703 13,359,010 -
Shares outstanding 54,241 55,207 564,002 -
Net asset value and redemption price per share 71.36 28.18 23.69 -
Class R5 Shares:Net assets applicable to shares outstanding 11,620,821 14,543,970 35,259,198 -
Shares outstanding 157,583 452,133 1,480,144 -
Net asset value and redemption price per share 73.74 32.17 23.82 -
Class R6 Shares:Net assets applicable to shares outstanding - - 122,802,385 -
Shares outstanding - - 5,167,807 -
Net asset value and redemption price per share - - 23.76 -
(a) Cost of foreign currency is $6; $6; $94; $52 respectively.* Redemption price per share is equal to net asset value less any applicable contingent deferred sales charge.
See notes to financial statements.
Statements of Assets and Liabilities, Continued
March 31, 2022 (Unaudited)
Thornburg Equity Funds Semi-Annual Report | 79

THORNBURGGLOBAL
OPPORTUNITIESFUND
THORNBURGINTERNATIONAL
EQUITYFUND
THORNBURGBETTER WORLDINTERNATIONAL
FUND
THORNBURGINTERNATIONAL
GROWTHFUND
THORNBURGDEVELOPING
WORLDFUND
INVESTMENT INCOMEDividend income
Non-affiliated issuers $ 6,621,414 $ 32,639,787 $ 3,486,076 $ 6,552,114 $ 8,910,396Non-controlled affiliated issuers 33,029 189,646 45,878 84,504 30,303Non-cash dividend 598,530 4,082,496 363,051 2,650,869 1,784,464Dividend taxes withheld (512,631) (4,439,232) (523,672) (704,565) (1,249,392)
Interest income 24,909 109,544 2,579 24,558 1,910Foreign withholding tax claims 416,639 2,293,018 55,517 601,283 37,896
Adjusted for: IRS compliance fees forforeign withholding tax claims - (2,307,638) - - -
Total Income 7,181,890 32,567,621 3,429,429 9,208,763 9,515,577
EXPENSESInvestment management fees 4,515,373 12,045,445 1,965,257 6,902,567 5,478,766Administration fees 448,083 1,340,901 169,185 711,646 489,113Distribution and service fees
Class A Shares 345,848 668,519 55,700 179,283 161,842Class C Shares 527,864 121,685 29,124 119,268 172,736Class R3 Shares 9,210 374,228 - 17,262 -Class R4 Shares 7,649 122,656 - 11,867 -
Transfer agent feesClass A Shares 122,623 586,750 27,069 67,750 67,875Class C Shares 58,027 5,826 6,764 16,236 23,081Class I Shares 210,580 744,500 159,894 527,430 323,560Class R3 Shares 6,796 202,135 - 14,403 -Class R4 Shares 15,098 148,390 - 22,460 -Class R5 Shares 35,486 235,335 - 62,152 5,546Class R6 Shares 2,730 10,805 - 5,096 7,644
Registration and filing feesClass A Shares 7,728 12,930 4,276 10,503 10,090Class C Shares 7,339 8,006 3,351 8,957 9,480Class I Shares 8,349 15,712 5,355 9,820 13,576Class R3 Shares 8,739 7,014 - 9,099 -Class R4 Shares 8,739 8,666 - 9,106 -Class R5 Shares 8,925 8,743 - 9,505 9,550Class R6 Shares 8,784 10,326 - 9,605 9,549
Custodian fees 121,580 619,600 78,945 261,400 570,800Professional fees 50,548 81,192 35,147 48,672 34,912Trustee and officer fees 29,299 90,673 9,965 50,365 31,391Other expenses 45,359 178,527 29,209 145,783 65,805
Total Expenses 6,610,756 17,648,564 2,579,241 9,230,235 7,485,316Less:
Expenses reimbursed (180,106) (727,467) (311,863) (420,857) (389,330)Investment management fees waived (184,687) (545,602) (68,652) (41,481) (422,213)
Net Expenses 6,245,963 16,375,495 2,198,726 8,767,897 6,673,773
Net Investment Income (Loss) $ 935,927 $ 16,192,126 $ 1,230,703 $ 440,866 $ 2,841,804
Statements of OperationsSix Months Ended March 31, 2022 (Unaudited)
80 | Thornburg Equity Funds Semi-Annual Report

THORNBURGGLOBAL
OPPORTUNITIESFUND
THORNBURGINTERNATIONAL
EQUITYFUND
THORNBURGBETTER WORLDINTERNATIONAL
FUND
THORNBURGINTERNATIONAL
GROWTHFUND
THORNBURGDEVELOPING
WORLDFUND
REALIZED AND UNREALIZEDGAIN (LOSS)
Net realized gain (loss) on:Non-affiliated issuer investments* $ 69,597,995 $ 75,177,953 $ (6,335,021) $ 22,451,597 $ (35,547,852)Forward currency contracts 1,713,642 - - - -Foreign currency transactions 7,263 (469,217) (120,537) 180,046 (202,099)
Net realized gain (loss) 71,318,900 74,708,736 (6,455,558) 22,631,643 (35,749,951)
Net change in unrealized appreciation(depreciation) on:
Non-affiliated issuers investments** (65,203,910) (342,688,629) (29,680,182) (303,820,202) (119,366,088)Forward currency contracts 2,471,424 - - - -Foreign currency translations (8,569) 3,671 (14,611) (25,213) 106,627
Change in net unrealizedappreciation (depreciation) (62,741,055) (342,684,958) (29,694,793) (303,845,415) (119,259,461)
Net Realized and Unrealized Gain(Loss) 8,577,845 (267,976,222) (36,150,351) (281,213,772) (155,009,412)
Change in Net Assets Resulting fromOperations $ 9,513,772 $ (251,784,096) $ (34,919,648) $ (280,772,906) $ (152,167,608)
* Net of foreign capital gain taxes $ 615,910 $ - $ - $ 97,373 $ 4,109,830
** Net of change in deferred taxes $ 350,742 $ - $ - $ 537,183 $ 4,889,723
See notes to financial statements.
Statements of Operations, Continued
Six Months Ended March 31, 2022 (Unaudited)
Thornburg Equity Funds Semi-Annual Report | 81
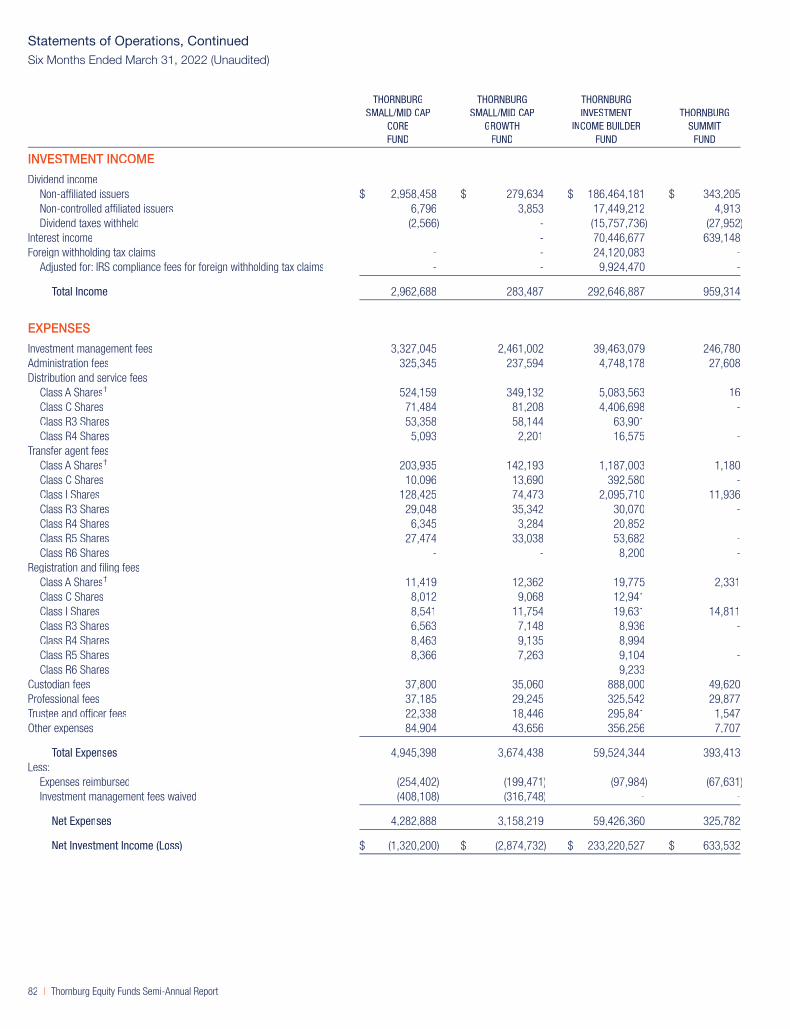
THORNBURGSMALL/MID CAP
COREFUND
THORNBURGSMALL/MID CAP
GROWTHFUND
THORNBURGINVESTMENT
INCOME BUILDERFUND
THORNBURGSUMMIT
FUND
INVESTMENT INCOME
Dividend incomeNon-affiliated issuers $ 2,958,458 $ 279,634 $ 186,464,181 $ 343,205Non-controlled affiliated issuers 6,796 3,853 17,449,212 4,913Dividend taxes withheld (2,566) - (15,757,736) (27,952)
Interest income - - 70,446,677 639,148Foreign withholding tax claims - - 24,120,083 -
Adjusted for: IRS compliance fees for foreign withholding tax claims - - 9,924,470 -
Total Income 2,962,688 283,487 292,646,887 959,314
EXPENSES
Investment management fees 3,327,045 2,461,002 39,463,079 246,780Administration fees 325,345 237,594 4,748,178 27,608Distribution and service fees
Class A Shares† 524,159 349,132 5,083,563 16Class C Shares 71,484 81,208 4,406,698 -Class R3 Shares 53,358 58,144 63,901 -Class R4 Shares 5,093 2,201 16,575 -
Transfer agent feesClass A Shares† 203,935 142,193 1,187,003 1,180Class C Shares 10,096 13,690 392,580 -Class I Shares 128,425 74,473 2,095,710 11,936Class R3 Shares 29,048 35,342 30,070 -Class R4 Shares 6,345 3,284 20,852 -Class R5 Shares 27,474 33,038 53,682 -Class R6 Shares - - 8,200 -
Registration and filing feesClass A Shares† 11,419 12,362 19,775 2,331Class C Shares 8,012 9,068 12,941 -Class I Shares 8,541 11,754 19,631 14,811Class R3 Shares 6,563 7,148 8,936 -Class R4 Shares 8,463 9,135 8,994 -Class R5 Shares 8,366 7,263 9,104 -Class R6 Shares - - 9,233 -
Custodian fees 37,800 35,060 888,000 49,620Professional fees 37,185 29,245 325,542 29,877Trustee and officer fees 22,338 18,446 295,841 1,547Other expenses 84,904 43,656 356,256 7,707
Total Expenses 4,945,398 3,674,438 59,524,344 393,413Less:
Expenses reimbursed (254,402) (199,471) (97,984) (67,631)Investment management fees waived (408,108) (316,748) - -
Net Expenses 4,282,888 3,158,219 59,426,360 325,782
Net Investment Income (Loss) $ (1,320,200) $ (2,874,732) $ 233,220,527 $ 633,532
Statements of Operations, Continued
Six Months Ended March 31, 2022 (Unaudited)
82 | Thornburg Equity Funds Semi-Annual Report

THORNBURGSMALL/MID CAP
COREFUND
THORNBURGSMALL/MID CAP
GROWTHFUND
THORNBURGINVESTMENT
INCOME BUILDERFUND
THORNBURGSUMMIT
FUND
REALIZED AND UNREALIZED GAIN (LOSS)
Net realized gain (loss) on:Non-affiliated issuer investments* $ 5,197,561 $ (23,117,373) $ 142,917,004 $ 1,753,313Non-controlled affiliated issuers - - (9,426,374) -Options written - - - 32,635Forward currency contracts - - 28,883,969 (64,783)Foreign currency transactions 4,658 (331) 345,406 1,190
Net realized gain (loss) 5,202,219 (23,117,704) 162,720,005 1,722,355
Net change in unrealized appreciation (depreciation) on:Non-affiliated issuers investments** (16,397,243) (90,127,483) 229,880,317 (2,256,917)Non-controlled affiliated issuers - - (41,373,165) -Forward currency contracts - - 41,665,563 (29,011)Foreign currency translations (1) (65) (10,321) 931
Change in net unrealized appreciation (depreciation) (16,397,244) (90,127,548) 230,162,394 (2,284,997)
Net Realized and Unrealized Gain (Loss) (11,195,025) (113,245,252) 392,882,399 (562,642)
Change in Net Assets Resulting from Operations $ (12,515,225) $ (116,119,984) $ 626,102,926 $ 70,890
* Net of foreign capital gain taxes $ - $ - $ - $ 41
** Net of change in deferred taxes $ - $ - $ - $ 2,144
† Effective date of this class of shares of Summit Fund was January 26, 2022.
See notes to financial statements.
Statements of Operations, Continued
Six Months Ended March 31, 2022 (Unaudited)
Thornburg Equity Funds Semi-Annual Report | 83

THORNBURG GLOBAL OPPORTUNITIES FUND THORNBURG INTERNATIONAL EQUITY FUNDSIX MONTHS ENDEDMARCH 31, 2022*
YEAR ENDEDSEPTEMBER 30, 2021
SIX MONTHS ENDEDMARCH 31, 2022*
YEAR ENDEDSEPTEMBER 30, 2021
INCREASE (DECREASE) IN NET ASSETS FROM
OPERATIONS
Net investment income (loss) $ 935,927 $ 15,954,214 $ 16,192,126 $ 44,951,706Net realized gain (loss) 71,318,900 121,063,647 74,708,736 570,017,512Net change in unrealized appreciation (depreciation) (62,741,055) 148,995,914 (342,684,958) 29,574,717
Net Increase (Decrease) in Net Assets Resulting fromOperations 9,513,772 286,013,775 (251,784,096) 644,543,935
DIVIDENDS TO SHAREHOLDERS
From distributable earningsClass A Shares (35,940,962) (15,556,947) (71,630,114) (27,537,806)Class C Shares (13,819,338) (8,198,327) (3,618,672) (1,051,963)Class I Shares (79,676,826) (35,542,986) (255,342,551) (59,075,703)Class R3 Shares (482,303) (248,648) (19,948,636) (4,557,933)Class R4 Shares (784,298) (365,924) (13,551,778) (3,204,878)Class R5 Shares (2,624,396) (2,182,325) (20,223,366) (4,382,041)Class R6 Shares (7,791,346) (3,376,168) (44,109,955) (9,265,153)
FUND SHARE TRANSACTIONS
Class A Shares 28,629,847 7,882,180 49,140,428 (427,661,468)Class C Shares (1,794,650) (30,089,588) (818,878) (22,813,554)Class I Shares 57,677,966 (38,078,183) 144,863,757 6,617,111Class R3 Shares 186,857 (700,070) 7,984,397 (19,695,062)Class R4 Shares 528,054 (202,245) 3,136,484 (13,597,831)Class R5 Shares 763,940 (19,124,205) 2,263,544 4,995,604Class R6 Shares 9,304,770 1,787,617 43,953,466 39,193,004
Net Increase (Decrease) in Net Assets (36,308,913) 142,017,956 (429,685,970) 102,506,262
NET ASSETS
Beginning of Period 1,082,825,057 940,807,101 3,325,261,498 3,222,755,236
End of Period $ 1,046,516,144 $ 1,082,825,057 $ 2,895,575,528 $ 3,325,261,498
* Unaudited.
See notes to financial statements.
Statements of Changes in Net Assets
84 | Thornburg Equity Funds Semi-Annual Report

THORNBURG BETTER WORLD INTERNATIONAL FUND THORNBURG INTERNATIONAL GROWTH FUNDSIX MONTHS ENDEDMARCH 31, 2022*
YEAR ENDEDSEPTEMBER 30, 2021
SIX MONTHS ENDEDMARCH 31, 2022*
YEAR ENDEDSEPTEMBER 30, 2021
INCREASE (DECREASE) IN NET ASSETS FROM
OPERATIONS
Net investment income (loss) $ 1,230,703 $ 957,396 $ 440,866 $ (1,206,755)Net realized gain (loss) (6,455,558) 43,117,549 22,631,643 126,958,821Net change in unrealized appreciation (depreciation) (29,694,793) 8,005,551 (303,845,415) 21,850,369
Net Increase (Decrease) in Net Assets Resulting fromOperations (34,919,648) 52,080,496 (280,772,906) 147,602,435
DIVIDENDS TO SHAREHOLDERS
From distributable earningsClass A Shares (5,765,352) - (10,325,458) (1,957,081)Class C Shares (780,125) - (1,922,046) (510,190)Class I Shares (42,774,823) (467,138) (99,259,527) (19,125,765)Class R3 Shares - - (497,684) (88,563)Class R4 Shares - - (657,230) (114,616)Class R5 Shares - - (2,277,399) (406,256)Class R6 Shares - - (6,805,277) (845,284)
FUND SHARE TRANSACTIONS
Class A Shares 13,430,339 22,545,088 4,083,499 5,663,748Class C Shares 1,625,601 2,514,883 (3,206,632) (17,085,519)Class I Shares 179,897,033 174,010,009 (131,277,647) 23,821,895Class R3 Shares - - 83,995 813,193Class R4 Shares - - 1,518,188 1,028,673Class R5 Shares - - (419,446) (221,191)Class R6 Shares - - 5,033,762 43,772,314
Net Increase (Decrease) in Net Assets 110,713,025 250,683,338 (526,701,808) 182,347,793
NET ASSETS
Beginning of Period 347,909,694 97,226,356 1,928,405,241 1,746,057,448
End of Period $ 458,622,719 $ 347,909,694 $ 1,401,703,433 $ 1,928,405,241
* Unaudited.
See notes to financial statements.
Statements of Changes in Net Assets, Continued
Thornburg Equity Funds Semi-Annual Report | 85

THORNBURG DEVELOPING WORLD FUND THORNBURG SMALL/MID CAP CORE FUNDSIX MONTHS ENDEDMARCH 31, 2022*
YEAR ENDEDSEPTEMBER 30, 2021
SIX MONTHS ENDEDMARCH 31, 2022*
YEAR ENDEDSEPTEMBER 30, 2021
INCREASE (DECREASE) IN NET ASSETS FROM
OPERATIONS
Net investment income (loss) $ 2,841,804 $ 2,995,896 $ (1,320,200) $ 465,695Net realized gain (loss) (35,749,951) 92,825,380 5,202,219 226,101,666Net change in unrealized appreciation (depreciation) (119,259,461) 81,047,307 (16,397,244) (8,975,742)
Net Increase (Decrease) in Net Assets Resulting fromOperations (152,167,608) 176,868,583 (12,515,225) 217,591,619
DIVIDENDS TO SHAREHOLDERS
From distributable earningsClass A Shares - - (122,071,650) -Class C Shares - - (4,832,240) -Class I Shares - (1,240,033) (87,917,193) -Class R3 Shares - - (6,082,568) -Class R4 Shares - - (1,155,008) -Class R5 Shares - (5,775) (3,628,978) -Class R6 Shares - (173,993) - -
FUND SHARE TRANSACTIONS
Class A Shares 5,131,947 9,170,861 73,044,815 (48,852,077)Class C Shares (8,403,546) (17,794,278) (95,622) (11,067,483)Class I Shares 80,486,648 125,144,133 45,160,686 (40,995,537)Class R3 Shares - - 2,589,334 (8,215,545)Class R4 Shares - - 710,846 (1,500,983)Class R5 Shares (451,225) 899,908 721,009 (3,417,832)Class R6 Shares 3,555,597 2,122,539 - -
Net Increase (Decrease) in Net Assets (71,848,187) 294,991,945 (116,071,794) 103,542,162
NET ASSETS
Beginning of Period 1,179,846,600 884,854,655 846,776,979 743,234,817
End of Period $ 1,107,998,413 $ 1,179,846,600 $ 730,705,185 $ 846,776,979
* Unaudited.
See notes to financial statements.
Statements of Changes in Net Assets, Continued
86 | Thornburg Equity Funds Semi-Annual Report
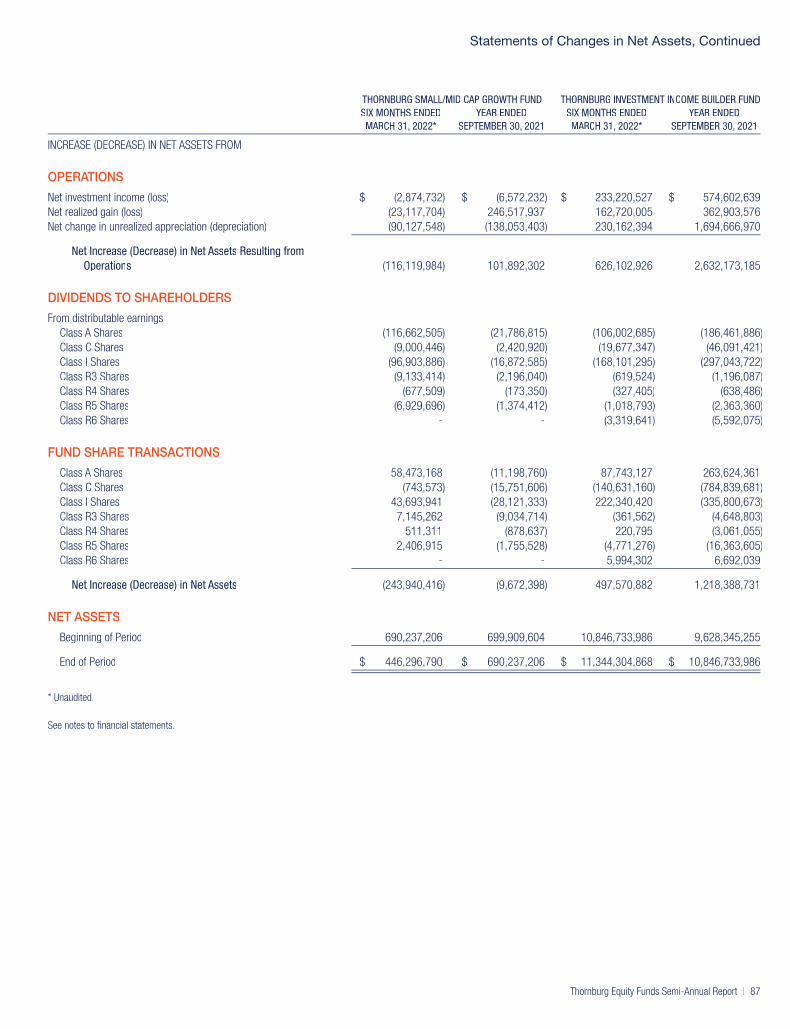
THORNBURG SMALL/MID CAP GROWTH FUND THORNBURG INVESTMENT INCOME BUILDER FUNDSIX MONTHS ENDEDMARCH 31, 2022*
YEAR ENDEDSEPTEMBER 30, 2021
SIX MONTHS ENDEDMARCH 31, 2022*
YEAR ENDEDSEPTEMBER 30, 2021
INCREASE (DECREASE) IN NET ASSETS FROM
OPERATIONS
Net investment income (loss) $ (2,874,732) $ (6,572,232) $ 233,220,527 $ 574,602,639Net realized gain (loss) (23,117,704) 246,517,937 162,720,005 362,903,576Net change in unrealized appreciation (depreciation) (90,127,548) (138,053,403) 230,162,394 1,694,666,970
Net Increase (Decrease) in Net Assets Resulting fromOperations (116,119,984) 101,892,302 626,102,926 2,632,173,185
DIVIDENDS TO SHAREHOLDERS
From distributable earningsClass A Shares (116,662,505) (21,786,815) (106,002,685) (186,461,886)Class C Shares (9,000,446) (2,420,920) (19,677,347) (46,091,421)Class I Shares (96,903,886) (16,872,585) (168,101,295) (297,043,722)Class R3 Shares (9,133,414) (2,196,040) (619,524) (1,196,087)Class R4 Shares (677,509) (173,350) (327,405) (638,486)Class R5 Shares (6,929,696) (1,374,412) (1,018,793) (2,363,360)Class R6 Shares - - (3,319,641) (5,592,075)
FUND SHARE TRANSACTIONS
Class A Shares 58,473,168 (11,198,760) 87,743,127 263,624,361Class C Shares (743,573) (15,751,606) (140,631,160) (784,839,681)Class I Shares 43,693,941 (28,121,333) 222,340,420 (335,800,673)Class R3 Shares 7,145,262 (9,034,714) (361,562) (4,648,803)Class R4 Shares 511,311 (878,637) 220,795 (3,061,055)Class R5 Shares 2,406,915 (1,755,528) (4,771,276) (16,363,605)Class R6 Shares - - 5,994,302 6,692,039
Net Increase (Decrease) in Net Assets (243,940,416) (9,672,398) 497,570,882 1,218,388,731
NET ASSETS
Beginning of Period 690,237,206 699,909,604 10,846,733,986 9,628,345,255
End of Period $ 446,296,790 $ 690,237,206 $ 11,344,304,868 $ 10,846,733,986
* Unaudited.
See notes to financial statements.
Statements of Changes in Net Assets, Continued
Thornburg Equity Funds Semi-Annual Report | 87

THORNBURG SUMMIT FUNDSIX MONTHS ENDEDMARCH 31, 2022*
YEAR ENDEDSEPTEMBER 30, 2021
INCREASE (DECREASE) IN NET ASSETS FROM
OPERATIONS
Net investment income (loss) $ 633,532 $ 679,700Net realized gain (loss) 1,722,355 10,340,154Net change in unrealized appreciation (depreciation) (2,284,997) 562,641
Net Increase (Decrease) in Net Assets Resulting from Operations 70,890 11,582,495
DIVIDENDS TO SHAREHOLDERS
From distributable earningsClass A Shares† (548) -Class I Shares (10,072,626) (3,131,551)
FUND SHARE TRANSACTIONS
Class A Shares† 117,078 -Class I Shares 18,750,890 8,128,955
Net Increase (Decrease) in Net Assets 8,865,684 16,579,899
NET ASSETS
Beginning of Period 62,465,848 45,885,949
End of Period $ 71,331,532 $ 62,465,848
* Unaudited.† Effective date of this class of shares was January 26, 2022.
See notes to financial statements.
Statements of Changes in Net Assets, Continued
88 | Thornburg Equity Funds Semi-Annual Report

NOTE 1 – ORGANIZATION
Thornburg Global Opportunities Fund ("Global Opportunities Fund"), Thornburg International Equity Fund ("International Equity Fund"),Thornburg Better World International Fund ("Better World International Fund"), Thornburg International Growth Fund ("International GrowthFund"), Thornburg Developing World Fund ("Developing World Fund"), Thornburg Small/Mid Cap Core Fund ("Small/Mid Cap Core Fund"),Thornburg Small/Mid Cap Growth Fund ("Small/Mid Cap Growth Fund"), Thornburg Investment Income Builder Fund ("Income BuilderFund"), and Thornburg Summit Fund ("Summit Fund"), collectively the "Funds", are diversified series of Thornburg Investment Trust (the“Trust”). The Trust is organized as a Massachusetts business trust under a Declaration of Trust dated June 3, 1987 and is registered as adiversified, open-end management investment company under the Investment Company Act of 1940, as amended (the "1940 Act"). TheFunds are currently nine of twenty-one separate series of the Trust. Each series is considered to be a separate entity for financial reportingand tax purposes and bears expenses directly attributable to it.
Global Opportunities Fund: The Fund’s investment goal is to seek long-term capital appreciation by investing in equity and debt securitiesof all types from issuers around the world. The Fund’s investments subject it to certain risks. As of the date of this report, the principal risksof investing in the Fund include management risk, market and economic risk, equity risk, risks affecting specific issuers, foreign investmentrisk, developing country risk, foreign currency risk, risks affecting specific countries or regions, small and mid-cap company risk, credit risk,liquidity risk, real estate risk, redemption risk, and cybersecurity and operational risk. Please see the Fund’s prospectus for a discussion ofthose principal risks and other risks associated with an investment in the Fund.
International Equity Fund: The Fund’s primary investment goal is to seek long-term capital appreciation by investing in equity and debtsecurities of all types. As a secondary objective, the Fund also seeks some current income. The Fund’s investments subject it to certainrisks. As of the date of this report, the principal risks of investing in the Fund include management risk, market and economic risk, equityrisk, risks affecting specific issuers, foreign investment risk, developing country risk, foreign currency risk, risks affecting specific countriesor regions, risks affecting investments in China, small and mid-cap company risk, credit risk, liquidity risk, redemption risk, andcybersecurity and operational risk. Please see the Fund’s prospectus for a discussion of those principal risks and other risks associatedwith an investment in the Fund.
Better World International Fund: The Fund’s investment goal is to seek long-term capital appreciation. The Fund’s investments subject itto certain risks. As of the date of this report, the principal risks of investing in the Fund include management risk, market and economicrisk, equity risk, risks affecting specific issuers, foreign investment risk, developing country risk, foreign currency risk, risks affecting specificcountries or regions, risks affecting investments in China, small and mid-cap company risk, credit risk, liquidity risk, ESG investing risk, realestate risk, redemption risk, and cybersecurity and operational risk. Please see the Fund’s prospectus for a discussion of those principalrisks and other risks associated with an investment in the Fund.
International Growth Fund: The Fund’s investment goal is to seek long-term capital appreciation by investing in equity securities selectedfor their growth potential. The Fund’s investments subject it to certain risks. As of the date of this report, the principal risks of investing inthe Fund include management risk, market and economic risk, equity risk, risks affecting specific issuers, foreign investment risk,developing country risk, foreign currency risk, risks affecting specific countries or regions, small and mid-cap company risk, credit risk,liquidity risk, redemption risk, and cybersecurity and operational risk. Please see the Fund’s prospectus for a discussion of those principalrisks and other risks associated with an investment in the Fund.
Developing World Fund: The Fund’s investment goal is to seek long-term capital appreciation. The Fund’s investments subject it to certainrisks. As of the date of this report, the principal risks of investing in the Fund include management risk, market and economic risk, equityrisk, risks affecting specific issuers, foreign investment risk, developing country risk, foreign currency risk, risks affecting specific countriesor regions, risks affecting investments in China, small and mid-cap company risk, credit risk, liquidity risk, redemption risk, andcybersecurity and operational risk. Please see the Fund’s prospectus for a discussion of those principal risks and other risks associatedwith an investment in the Fund.
Small/Mid Cap Core Fund: The Fund investment goal is to seek Long term capital appreciation by investing in equity and debt securitiesof all types. As a secondary objective, the Fund also seeks some current income. The Fund’s investments subject it to certain risks. As ofthe date of this report, the principal risks of investing in the Fund include, management risk, market and economic risk, equity risk, risksaffecting specific issuers, small and mid-cap company risk, foreign investment risk, liquidity risk, redemption risk, and cybersecurity andoperational risk. Please see the Fund’s prospectus for a discussion of those principal risks and other risks associated with an investment inthe Fund.
Small/Mid Cap Growth Fund: The Fund’s investment goal is to seek long-term capital appreciation by investing in equity securitiesselected for their growth potential. The Fund’s investments subject it to certain risks. As of the date of this report, the principal risks ofinvesting in the Fund include management risk, market and economic risk, equity risk, risks affecting specific issuers, small and mid-capcompany risk, information technology securities risk, foreign investment risk, liquidity risk, redemption risk, and cybersecurity andoperational risk. Please see the Fund’s prospectus for a discussion of those principal risks and other risks associated with an investment inthe Fund.
Notes to Financial StatementsMarch 31, 2022 (Unaudited)
Thornburg Equity Funds Semi-Annual Report | 89

Income Builder Fund: The Fund’s primary investment goal is to provide a level of current income which exceeds the average yield on U.S.stocks generally, and which will generally grow, subject to periodic fluctuations, over the years on a per share basis. The Fund’s secondaryinvestment goal is long-term capital appreciation. The Fund’s investments subject it to certain risks. As of the date of this report, theprincipal risks of investing in the Fund include management risk, market and economic risk, equity risk, risks affecting specific issuers, smalland mid-cap company risk, credit risk, high-yield risk, interest rate risk, prepayment and extension risk, foreign investment risk, developingcountry risk, foreign currency risk, risks affecting specific countries or regions, liquidity risk, real estate risk, redemption risk, andcybersecurity and operational risk. Please see the Fund’s prospectus for a discussion of those principal risks and other risks associatedwith an investment in the Fund.
Summit Fund: The Fund’s investment goal is to seek to grow real wealth over time. The Fund’s investments subject it to certain risks. As ofthe date of this report, the principal risks of investing in the Fund include management risk, market and economic risk, equity risk, risksaffecting specific issuers, foreign investment risk, developing country risk, foreign currency risk, small and mid-cap company risk, short salerisk, credit risk, high yield risk, interest rate risk, prepayment and extension risk, liquidity risk, inflation risk, structured products risk,commodities-related investment risk, real estate risk, derivatives risk, redemption risk, and cybersecurity and operational risk. Please seethe Fund’s prospectus for a discussion of those principal risks and other risks associated with an investment in the Fund.
Certain Funds have invested in securities that are economically tied to Russia. Russia’s invasion of Ukraine in February 2022 resulted inmarket disruptions which have adversely affected, and which may continue to adversely affect, the value of those securities and certainother investments of the Funds. The ongoing conflict has also caused investments in Russia to be subject to increased levels of political,economic, legal, market and currency risks, as well as the risk that further economic sanctions may be imposed by the United States andother countries. Furthermore, transactions in certain Russian securities have been, or may in the future be, prohibited, and certain of theFunds’ existing investments have or may become illiquid.
As of March 31, 2022, the Funds currently offer up to seven classes of shares of beneficial interest:
Each class of shares of the Funds represents an interest in the same portfolio of investments, except that (i) Class A shares are sold subjectto a front-end sales charge collected at the time the shares are purchased and bear a service fee, (ii) Class C shares are sold at net assetvalue without a sales charge at the time of purchase, but are subject to a contingent deferred sales charge upon redemption within oneyear of purchase, and bear both a service fee and a distribution fee, (iii) Class I and Class R5 shares are sold at net asset value without asales charge at the time of purchase and may be subject to a service fee, (iv) Class R3 shares are sold at net asset value without a salescharge, but bear both a service fee and a distribution fee, (v) Class R4 shares are sold at net asset value without a sales charge at the timeof purchase but bear a service fee, (vi) Class R6 shares are sold at net asset value without a sales charge at the time of purchase, and (vii)the respective classes may have different reinvestment privileges and conversion rights. Additionally, each Fund may allocate among itsclasses certain expenses, to the extent allocable to specific classes, including administration fees, transfer agent fees, governmentregistration fees, certain printing and postage costs and legal expenses. Currently, class specific expenses of the Funds are limited todistribution and service fees, transfer agent fees, and certain registration and filing fees.
At March 31, 2022, the following classes of shares are offered in each respective Fund:
CLASS A CLASS C CLASS I CLASS R3 CLASS R4 CLASS R5 CLASS R6
Global Opportunities Fund X X X X X X XInternational Equity Fund X X X X X X XBetter World International Fund X X XInternational Growth Fund X X X X X X XDeveloping World Fund X X X X XSmall/Mid Cap Core Fund X X X X X XSmall/Mid Cap Growth Fund X X X X X XIncome Builder Fund X X X X X X XSummit Fund X X
NOTE 2 – SIGNIFICANT ACCOUNTING POLICIES
The following is a summary of significant accounting policies followed by each of the Funds in the preparation of its financial statements.Each Fund prepares its financial statements in conformity with United States generally accepted accounting principles (“GAAP”), includinginvestment company accounting and reporting guidance in the Financial Accounting Standards Board (the “FASB”) Accounting StandardCodification Topic 946.
Allocation of Income, Gains, Losses and Expenses: Net investment income (other than class specific expenses) and realized and unrealized, , pgains and losses are allocated daily to each class of shares based upon the relative net asset value of outstanding shares (or the value ofthe dividend-eligible shares, as appropriate) of each class of shares at the beginning of the day (after adjusting for the current capital shares
Notes to Financial Statements, Continued
March 31, 2022 (Unaudited)
90 | Thornburg Equity Funds Semi-Annual Report

activity of the respective class). Expenses common to all Funds are allocated daily among the Funds comprising the Trust based upon theirrelative net asset values or other appropriate allocation methods. Operating expenses directly attributable to a specific class are chargedagainst the operating income of that class.
Dividends and Distributions to Shareholders: Dividends and distributions to shareholders, which are determined in accordance with federalincome tax regulations and may differ from GAAP, are recorded on the ex-dividend date. Ordinary income dividends, if any, are declareddaily and paid quarterly or annually. Capital gain distributions, if any, are declared and paid annually and more often if deemed necessary byThornburg Investment Management, Inc., the Trust’s investment advisor (the “Advisor”). Dividends and distributions are paid and arereinvested in additional shares of the Funds at net asset value per share at the close of business on the ex-dividend date, or at theshareholder’s option, paid in cash.
Foreign Currency Translation: Portfolio investments and other assets and liabilities denominated in foreign currencies are translated intog yU.S. dollars based on the exchange rate of such currencies against the U.S. dollar on the date of valuation. Purchases and sales ofinvestments and income items denominated in foreign currencies are translated into U.S. dollars at the exchange rate in effect on thetransaction date. When the Funds purchase or sell foreign investments, they will customarily enter into a foreign exchange contract tominimize foreign exchange risk from the trade date to the settlement date of such transactions. The values of such spot contracts areincluded in receivable for investments sold and payable for investments purchased on the Statement of Assets and Liabilities.
The Funds do not separately report the effect of changes in foreign exchange rates from changes in market prices on investments held.Such changes are included in net unrealized appreciation (depreciation) from investments in the Statement of Operations.
Reported net realized gains and losses from foreign currency transactions arise due to purchases and sales of foreign currencies, currencygains and losses realized between the trade and settlement dates on investment transactions and the difference between the amounts ofdividends, interest, and foreign withholding taxes recorded on the Funds’ books, and the U.S. dollar equivalent of the amounts actuallyreceived or paid. These amounts are included in foreign currency transactions in the Statement of Operations.
Net change in unrealized appreciation (depreciation) on foreign currency translations arise from changes in the fair value of assets andliabilities, other than investments at period end, resulting from changes in exchange rates.
Guarantees and Indemnifications: Under the Trust’s organizational documents (and under separate agreements with the independentTrustees), its officers and Trustees are provided with an indemnification against certain liabilities arising out of the performance of theirduties to the Funds. In the normal course of business the Trust may also enter into contracts with service providers that contain generalindemnifications. The Trust’s maximum exposure under these arrangements is unknown. However, based on experience, the Trust expectsthe risk of loss to be remote.
Investment Income: Dividend income is recorded on the ex-dividend date. Certain income from foreign investments is recognized as soonas information is available to the Funds. Interest income is accrued as earned. Premiums and discounts are amortized and accreted,respectively, to first call dates or maturity dates using the effective yield method of the respective investments. These amounts are includedin Investment Income in the Statement of Operations.
Investment Transactions: Investment transactions are accounted for on a trade date basis. Realized gains and losses from the sale ofinvestments are recorded on an identified cost basis.
Repurchase Agreements: The Funds may invest excess cash in repurchase agreements whereby the Funds purchase investments, whichp gserve as collateral, with an agreement to resell such collateral to the seller at an agreed upon price at the maturity date of the repurchaseagreement. Investments pledged as collateral for repurchase agreements are held in custody until maturity of the repurchase agreement.Provisions in the agreements require that the market value of the collateral is at least equal to the repurchase value in the event of default.In the event of default, the Funds have the right to liquidate the collateral and apply the proceeds in satisfaction of the obligation. Undercertain circumstances, in the event of default or bankruptcy by the other party to the agreement, realization and/or retention of thecollateral may be subject to legal proceedings.
Security Valuation: All investments in securities held by the Funds are valued as described in Note 3.y
Short Sales: A short sale involves the sale by the Funds of a security that the Funds do not own. The Funds borrow the security that theyintend to sell from a broker or other institution, and at a later date the Funds complete the short sale by purchasing that same security onthe open market and delivering it to the lending institution. The Funds may be required to pay a premium, fee, or other amount to thelender in exchange for borrowing the security. These amounts are included in "Short sale financing fees" on the Statement of Operations.When it enters into a short sale, the Funds seek to profit on a decline in the price of the security between the date the Funds borrow thesecurity and the date the Funds purchase the security to deliver it to the lender. If, however, the price of the security increases betweenthose dates, or if the price of the security declines by an amount which is not sufficient to cover the expenses of borrowing the security, theFunds will experience a loss. Although the potential for gain as a result of a short sale is limited to the price at which the Funds sold the
Notes to Financial Statements, Continued
March 31, 2022 (Unaudited)
Thornburg Equity Funds Semi-Annual Report | 91

security short less the cost of borrowing the security, the potential for loss is theoretically unlimited because there is no limit to the cost ofreplacing the borrowed security. Short sales held by the Funds during the six month period were fully collateralized by segregated cash orother securities, which are denoted on the Schedule of Investments.
Use of Estimates: The preparation of financial statements in conformity with GAAP requires management to make estimates andassumptions that affect the reported amounts of assets and liabilities and disclosure of contingent assets and liabilities at the date of thefinancial statements and the reported amounts of increases (decreases) in net assets from operations during the reporting period. Actualresults could differ from those estimates.
When-Issued and Delayed Delivery Transactions: The Funds may engage in when-issued or delayed delivery transactions. To the extent they yFunds engage in such transactions, they will do so for the purpose of acquiring portfolio investments consistent with the Funds’ investmentobjectives and not for the purpose of investment leverage or to speculate on interest rate or market changes. At the time the Funds make acommitment to purchase an investment on a when-issued or delayed delivery basis, the Funds will record the transaction and reflect thevalue in determining its net asset value. When effecting such transactions, assets of an amount sufficient to make payment for the portfolioinvestments to be purchased will be segregated on the Funds’ records on the trade date. Investments purchased on a when-issued ordelayed delivery basis do not earn interest until the settlement date. The values of these securities held at March 31, 2022 are detailed inthe Schedule of Investments.
NOTE 3 – SECURITY VALUATION
Valuation of the Funds’ portfolio investment securities is performed in accordance with policies and procedures adopted by and under theoversight of the Trustees.
The Trustees of the Trust have appointed the Advisor to assist the Trustees with obtaining fair market values for portfolio investments,evaluating and monitoring professional pricing service providers appointed by the Trustees’ Audit Committee (the “Audit Committee”) toassist in determining fair values for portfolio investments, assisting in calculating fair values for portfolio investments in certaincircumstances, and performing other functions in connection with the valuation of investments. The Advisor acts through its Valuation andPricing Committee (the “Committee”) and other employees of the Advisor. The Committee regularly reviews its own valuation calculations,reviews the valuations, valuation techniques and services furnished by pricing service providers, considers circumstances which mayrequire valuation calculations by the Committee, and reviews previous valuation calculations. The Committee reports to the AuditCommittee on the Committee’s activities, the performance of pricing service providers, and other matters relating to valuation of portfolioinvestments.
In those instances when the Committee assists in calculating a fair value for a portfolio investment, the Committee seeks to determine theprice that the Funds would reasonably expect to receive upon a sale of the investment in an orderly transaction between marketparticipants on the valuation date. The Committee customarily utilizes quotations from securities broker dealers in calculating valuations,but also may utilize prices obtained from pricing service providers or other methods approved by the Audit Committee. Because fair valuescalculated by the Committee are estimates, the calculation of a value for an investment may differ from the price that would be realized bythe Funds upon a sale of the investment, and the difference could be material to the Funds’ financial statements. The Committee’scalculation of a fair value for an investment may also differ from the prices obtained by other persons (including other mutual funds) for theinvestment.
Valuation of Securities: Securities and other portfolio investments which are listed or traded on a United States securities exchange arevalued at the last reported sale price on the valuation date. Investments listed or traded on an exchange for which there has been no salethat day are valued at the mean between the last reported bid and asked prices on that valuation date. Portfolio investments reported byNASDAQ are valued at the official closing price on the valuation date. If an investment is traded on more than one exchange, theinvestment is considered traded on the exchange that is normally the primary market for that investment. Securities and other portfolioinvestments which are listed or traded on exchanges outside the United States are valued at the last price or the closing price of theinvestment on the exchange that is normally the primary market for the investment, as of the close of the exchange preceding the Funds’valuation date. Foreign investments listed or traded on an exchange for which there has been no sale that day are valued at the meanbetween the last reported bid and asked prices on that valuation date.
In any case when a market quotation is not readily available for a portfolio investment ordinarily valued by market quotation, the Committeecalculates a fair value for the investment using alternative methods approved by the Audit Committee. A market quotation is not readilyavailable when the primary market or exchange for the investment is not open for the entire scheduled day of trading. Market quotations foran investment also may not be readily available if developments after the most recent close of the investment’s primary exchange ormarket, but prior to the close of business on any Funds’ business day, or an unusual event or significant period of time occurring since theavailability of a market quotation, create a serious question concerning the reliability of the most recent market quotation available for theinvestment. In particular, on days when market volatility thresholds established by the Audit Committee are exceeded, foreign equityinvestments held by the Funds may be valued using alternative methods. The Committee customarily obtains valuations in these instances
Notes to Financial Statements, Continued
March 31, 2022 (Unaudited)
92 | Thornburg Equity Funds Semi-Annual Report

from pricing service providers approved by the Audit Committee. Pricing service providers ordinarily calculate valuations using multi-factormodels to adjust market prices based upon various inputs, including exchange data, depository receipt prices, futures, index data andother data.
Debt obligations held by the Funds which are not listed or traded on exchanges or for which no reported market exists are ordinarily valuedat the valuation obtained from a pricing service provider approved by the Audit Committee.
Investments in open-end U.S. mutual funds are valued at net asset value (“NAV”) each business day.
In any case when a pricing service provider fails to provide a valuation for a debt obligation held by the Funds, the Committee calculates afair value for the obligation using alternative methods under procedures approved by the Audit Committee. Additionally, in cases whenmanagement believes that a valuation obtained from a pricing service provider is stale, does not reflect material factors affecting thevaluation of the investment, is significantly different than the value the Funds are likely to obtain if it sought a bid for the investment, or isotherwise unreliable, the Committee may calculate a fair value for the obligation using an alternative method approved by the AuditCommittee.
Quotations for foreign investments expressed in foreign currency amounts are converted to U.S. dollar equivalents using a foreignexchange quotation from a third party service provider at the time of valuation. Foreign investments held by the Funds may be tradedon days and at times when the Funds are not open for business. Consequently, the value of Funds’ investments may be significantlyaffected on days when shareholders cannot purchase or sell Funds’ shares.
Valuation Hierarchy: The Funds categorize their investments based upon the inputs used in valuing those investments, according to aythree-level hierarchy established in guidance from the FASB. Categorization of investments using this hierarchy is intended by the FASB tomaximize the use of observable inputs in valuing investments and minimize the use of unobservable inputs by requiring that the mostobservable inputs be used when available. Observable inputs are those that market participants would use in valuing an investment basedon available market information. Unobservable inputs are those that reflect assumptions about the information market participants woulduse in valuing an investment. An investment’s level within the hierarchy is based on the lowest level input that is deemed significant to thevaluation. The methodologies and inputs used to value investments are not necessarily indications of the risk or liquidity associated withthose investments.
Various inputs are used in calculating valuations for the Funds’ investments. These inputs are generally summarized according to thethree-level hierarchy below:
Level 1: Quoted prices in active markets for identical investments.
Level 2: Other direct or indirect significant observable inputs (including quoted prices for similar investments in active markets and otherobservable inputs, such as interest rates, prepayment rates, credit ratings, etc.).
Level 3: Significant unobservable inputs (including the Committee’s own assumptions in calculating the fair values of investments).
Valuations for debt obligations held by the Funds are typically calculated by pricing service providers approved by the Audit Committee andare generally characterized as Level 2 within the valuation hierarchy.
On days when market volatility thresholds established by the Audit Committee are exceeded, foreign securities for which valuations areobtained from pricing service providers are fair valued. On these days, the foreign securities are characterized as Level 2 within thevaluation hierarchy and revert to Level 1 after the threshold is no longer exceeded.
In any case when a pricing service provider fails to provide a valuation for a debt obligation held by the Funds, the Committee calculates afair value for the obligation using alternative methods under procedures approved by the Audit Committee. Additionally, in cases whenmanagement believes that a valuation obtained from a pricing service provider is stale, does not reflect material factors affecting thevaluation of the investment, is significantly different than the value the Funds are likely to obtain if they sought a bid for the investment, or isotherwise unreliable, the Committee calculates a fair value for the obligation using an alternative method approved by the Audit Committee.
In a limited number of cases the Committee calculates a fair value for investments using broker quotations or other methods approved bythe Audit Committee. When the Committee uses a single broker quotation to calculate a fair value for an investment without othersignificant observable inputs, or if a fair value is calculated using other significant inputs that are considered unobservable, the investment ischaracterized as Level 3 within the hierarchy. Other significant unobservable inputs used to calculate a fair value in these instances mightinclude an income-based valuation approach which considers discounted anticipated future cash flows from the investment andapplication of discounts due to the nature or duration of any restrictions on the disposition of the investment.
Notes to Financial Statements, Continued
March 31, 2022 (Unaudited)
Thornburg Equity Funds Semi-Annual Report | 93

Valuations based upon the use of inputs from Levels 1, 2 or 3 may not represent the actual price received upon the disposition of aninvestment, and a Fund may receive a price that is lower than the valuation based upon these inputs when it sells the investment.
GLOBAL OPPORTUNITIES FUND TOTAL LEVEL 1 LEVEL 2 LEVEL 3
AssetsInvestments in Securities
Common Stock $ 1,003,934,849 $ 441,706,603 $ 562,228,246 $ —Short-Term Investments 38,476,549 38,476,549 — —
Total Investments in Securities $ 1,042,411,398 $ 480,183,152 $ 562,228,246 $ —
Other Financial InstrumentsForward currency contracts $ 4,008,677 $ — $ 4,008,677 $ —
Total Assets $ 1,046,420,075 $ 480,183,152 $ 566,236,923 $ —
INTERNATIONAL EQUITY FUND TOTAL LEVEL 1 LEVEL 2 LEVEL 3
AssetsInvestments in Securities
Common Stock $ 2,728,671,246 $ 342,271,456 $ 2,386,399,790 $ —Rights 1,122,699 — — 1,122,699Short-Term Investments 193,656,095 193,656,095 — —
Total Investments in Securities $ 2,923,450,040 $ 535,927,551 $ 2,386,399,790 $ 1,122,699
Total Assets $ 2,923,450,040 $ 535,927,551 $ 2,386,399,790 $ 1,122,699
BETTER WORLD INTERNATIONAL FUND TOTAL LEVEL 1 LEVEL 2 LEVEL 3
AssetsInvestments in Securities
Common Stock $ 407,899,983 $ 105,073,632 $ 302,826,351 $ —Rights 133,994 — — 133,994Short-Term Investments 50,281,331 50,281,331 — —
Total Investments in Securities $ 458,315,308 $ 155,354,963 $ 302,826,351 $ 133,994
Total Assets $ 458,315,308 $ 155,354,963 $ 302,826,351 $ 133,994
INTERNATIONAL GROWTH FUND TOTAL LEVEL 1 LEVEL 2 LEVEL 3
AssetsInvestments in Securities
Common Stock $ 1,340,847,029 $ 280,388,706 $ 1,060,458,323 $ —Short-Term Investments 57,403,494 57,403,494 — —
Total Investments in Securities $ 1,398,250,523 $ 337,792,200 $ 1,060,458,323 $ —
Total Assets $ 1,398,250,523 $ 337,792,200 $ 1,060,458,323 $ —
DEVELOPING WORLD FUND TOTAL LEVEL 1 LEVEL 2 LEVEL 3
AssetsInvestments in Securities
Common Stock $ 1,085,245,216 $ 331,661,404 $ 753,583,812 $ —Short-Term Investments 9,537,844 9,537,844 — —
Total Investments in Securities $ 1,094,783,060 $ 341,199,248 $ 753,583,812 $ —
Total Assets $ 1,094,783,060 $ 341,199,248 $ 753,583,812 $ —
SMALL/MID CAP CORE FUND TOTAL LEVEL 1 LEVEL 2 LEVEL 3
AssetsInvestments in Securities
Common Stock $ 719,592,610 $ 719,592,610 $ — $ —Short-Term Investments 13,226,766 13,226,766 — —
Total Investments in Securities $ 732,819,376 $ 732,819,376 $ — $ —
Total Assets $ 732,819,376 $ 732,819,376 $ — $ —
Notes to Financial Statements, Continued
March 31, 2022 (Unaudited)
94 | Thornburg Equity Funds Semi-Annual Report

SMALL/MID CAP GROWTH FUND TOTAL LEVEL 1 LEVEL 2 LEVEL 3
AssetsInvestments in Securities
Common Stock $ 440,244,197 $ 440,244,197 $ — $ —Short-Term Investments 2,200,818 2,200,818 — —
Total Investments in Securities $ 442,445,015 $ 442,445,015 $ — $ —
Total Assets $ 442,445,015 $ 442,445,015 $ — $ —
The following tables display a summary of the fair value hierarchy measurements of each Fund’s investments as of March 31, 2022:
INCOME BUILDER FUND TOTAL LEVEL 1 LEVEL 2 LEVEL 3
AssetsInvestments in Securities
Common Stock $ 9,651,785,895 $ 3,598,852,178 $ 6,050,621,938 $ 2,311,779Preferred Stock 33,901,821 23,457,321 10,444,500 —Asset Backed Securities 303,535,224 — 275,302,301 28,232,923Corporate Bonds 780,375,364 — 780,375,364 —(a)
Mortgage Backed 154,484,618 — 154,483,668 950Loan Participations 42,633,211 — 42,633,211 —Rights 3,380,580 — — 3,380,580Short-Term Investments 287,205,880 287,205,880 — —
Total Investments in Securities $ 11,257,302,593 $ 3,909,515,379 $ 7,313,860,982 $ 33,926,232(b)
Other Financial InstrumentsForward currency contracts $ 65,912,553 $ — $ 65,912,553 $ —
Total Assets $ 11,323,215,146 $ 3,909,515,379 $ 7,379,773,535 $ 33,926,232(a) A security categorized as Level 3 is currently valued at zero.
(b) Level 3 investments at the beginning and end of the period in relation to net assets were not significant and accordingly, a reconciliation of Level 3 assets for the period ended March 31,2022 is not presented.
SUMMIT FUND TOTAL LEVEL 1 LEVEL 2 LEVEL 3
AssetsInvestments in Securities
Common Stock $ 38,807,436 $ 25,799,473 $ 13,007,963 $ —Asset Backed Securities 7,396,763 — 6,944,243 452,520Corporate Bonds 2,579,389 — 2,579,389 —Convertible Bonds 204,291 — 204,291 —U.S. Treasury Securities 9,877,298 9,877,298 — —Mortgage Backed 4,634,004 — 4,634,004 —Loan Participations 40,685 — 40,685 —Exchange-Traded Funds 3,775,090 3,775,090 — —Short-Term Investments 2,873,440 2,873,440 — —
Total Investments in Securities $ 70,188,396 $ 42,325,301 $ 27,410,575 $ 452,520
Total Assets $ 70,188,396 $ 42,325,301 $ 27,410,575 $ 452,520
LiabilitiesOther Financial Instruments
Forward currency contracts $ (49,747) $ — $ (49,747) $ —
Total Other Financial Instruments $ (49,747) $ — $ (49,747) $ —
Total Liabilities $ (49,747) $ — $ (49,747) $ —
NOTE 4 – INVESTMENT MANAGEMENT FEE AND OTHER TRANSACTIONS WITH AFFILIATES
Pursuant to an investment management agreement with the Trust, the Advisor serves as the investment advisor and performs advisoryservices for the Funds for which the Advisor’s management fees are payable at the end of each month. Under the investment advisory
Notes to Financial Statements, Continued
March 31, 2022 (Unaudited)
Thornburg Equity Funds Semi-Annual Report | 95

agreement, each Fund pays the Advisor a management fee based on the average daily net assets of that fund at an annual rate as shownin the following table:
GLOBAL OPPORTUNITIES FUND,INTERNATIONAL EQUITY FUND,
INTERNATIONAL GROWTH FUND,SMALL/MID CAP CORE FUND,
SMALL/MID CAP GROWTH FUND,INCOME BUILDER FUND
BETTER WORLDINTERNATIONAL FUND,
DEVELOPING WORLD FUND SUMMIT FUND
DAILY NET ASSETS FEE RATE DAILY NET ASSETS FEE RATE DAILY NET ASSETS FEE RATE
Up to $500 million 0.875% Up to $500 million 0.975% Up to $500 million 0.750%
Next $500 million 0.825 Next $500 million 0.925 Next $500 million 0.700
Next $500 million 0.775 Next $500 million 0.875 Next $500 million 0.650
Next $500 million 0.725 Next $500 million 0.825 Next $500 million 0.625
Over $2 billion 0.675 Over $2 billion 0.775 Over $2 billion 0.600
The Funds’ effective management fee, calculated on the basis of the Funds’ average daily net assets (before applicable management feewaivers) for the six months ended March 31, 2022 were as shown in the following table. Total management fees incurred by the Funds forthe six months ended March 31, 2022 are set forth in the Statement of Operations.
EFFECTIVEMANAGEMENT
FEE
Global Opportunities Fund 0.845%
International Equity Fund 0.753
Better World International Fund 0.975
International Growth Fund 0.812
Developing World Fund 0.939
Small/Mid Cap Core Fund 0.857
Small/Mid Cap Growth Fund 0.867
Income Builder Fund 0.697
Summit Fund 0.750
The Trust has entered into an administrative services agreement with the Advisor, whereby the Advisor will perform certain administrativeservices. The administrative services fees are computed as an annual percentage of the aggregate average daily net assets of all Funds inthe Trust as follows:
ADMINISTRATIVE SERVICES FEE SCHEDULEDAILY NET ASSETS FEE RATE
Up to $20 billion 0.100%
$20 billion to $40 billion 0.075
$40 billion to $60 billion 0.040
Over $60 billion 0.030
The aggregate administrative services fee amount is allocated on a daily basis to each Fund based on net assets and subsequentlyallocated to each class of shares of the Funds. Total administrative services fees incurred by each class of shares of the Funds for the sixmonths ended March 31, 2022, are set forth in the Statement of Operations.
The Trust has an underwriting agreement with Thornburg Securities Corporation (the “Distributor”), an affiliate of the Advisor, which acts asthe distributor of the Funds’ shares. For the six months ended March 31, 2022, the Distributor has advised the Funds that they earned netcommissions from the sale of Class A shares and collected contingent deferred sales charges ("CDSC Fees") from redemptions of Class Cshares as follows:
Notes to Financial Statements, Continued
March 31, 2022 (Unaudited)
96 | Thornburg Equity Funds Semi-Annual Report

COMMISSIONS CDSC FEES
Global Opportunities Fund $ 3,101 $ 1,203International Equity Fund 2,233 —Better World International Fund 6,631 731International Growth Fund 2,725 822Developing World Fund 3,221 561Small/Mid Cap Core Fund 1,908 14Small/Mid Cap Growth Fund 2,604 —Income Builder Fund 169,914 13,283Summit Fund 25 —
Pursuant to a service plan under Rule 12b-1 of the 1940 Act, the Funds may reimburse to the Distributor an amount not to exceed .25 of1% per annum of the average daily net assets attributable to the applicable Class A, Class C, Class I, Class R3, Class R4, and Class R5shares of the Global Opportunities Fund, International Equity Fund, International Growth Fund, Small/Mid Cap Core Fund, Small/Mid CapGrowth Fund and Income Builder Fund, Class A, Class C, Class I, and Class R5 shares of the Developing World Fund, Class A, Class C,Class I shares of the Better World International Fund and Class A and Class I shares of the Summit Fund. For the six months endedMarch 31, 2022, there were no 12b-1 service plan fees charged for Class I or Class R5 shares. Class R6 shares are not subject to aservice plan. The Advisor and Distributor each may pay out of its own resources additional expenses for distribution of each Fund’s sharesand shareholder services.
The Trust has also adopted a distribution plan pursuant to Rule 12b-1, applicable only to the Funds’ Class C and Class R3 shares, underwhich the Funds compensate the Distributor for services in promoting the sale of Class C and Class R3 shares of the Funds at an annualrate of up to .75 of 1% per annum of the average daily net assets attributable to Class C shares and an annual rate of up to .25 of 1% perannum of the average daily net assets attributable to Class R3 shares. Total fees incurred by each class of shares of the Funds under theirrespective service and distribution plans for the six months ended March 31, 2022 are set forth in the Statements of Operations.
The Advisor has contractually agreed to waive certain fees and reimburse certain expenses incurred by the Funds. The agreement may beterminated by the Funds at any time, but may not be terminated by the Advisor before February 1, 2023 unless the Advisor ceases to bethe investment advisor to the Funds prior to that date. The Advisor may recoup amounts waived or reimbursed during the six monthsended March 31, 2022 if, during the fiscal year, expenses fall below the contractual limit that was in place at the time these fees andexpenses were waived or reimbursed. The Advisor will not recoup fees or expenses as described in the preceding sentence if thatrecoupment would cause the Fund’s total annual operating expenses (after the recoupment is taken into account) to exceed the lesserof: (a) the expense cap that was in place at the time the waiver or reimbursement occurred; or (b) the expense cap that is in place at thetime of the recoupment.
Actual expenses of certain share classes do not exceed levels as specified in each Fund’s most recent prospectus as shown in thefollowing table:
CLASS A CLASS C CLASS I CLASS R3 CLASS R4 CLASS R5 CLASS R6
Global Opportunities Fund —% —% 0.99% 1.50% 1.40% 0.99% 0.85%International Equity Fund — — 0.90 1.36 1.16 0.90 0.70Better World International Fund — 2.19 0.90 — — — —International Growth Fund — — — 1.50 1.40 0.99 0.89Developing World Fund — — 1.04 — — 1.04 0.94Small/Mid Cap Core Fund — — 0.95 1.31 1.21 0.95 —Small/Mid Cap Growth Fund — — 0.95 1.46 1.36 0.95 —Income Builder Fund — — — 1.50 1.40 0.99 0.80Summit Fund 1.24 — 0.99 — — — —
Notes to Financial Statements, Continued
March 31, 2022 (Unaudited)
Thornburg Equity Funds Semi-Annual Report | 97

For the six months ended March 31, 2022, the Advisor contractually reimbursed certain class specific expenses and distribution fees andvoluntarily waived Fund level investment advisory fees as follows:
CONTRACTUAL:CLASS
ACLASS
CCLASS
ICLASS
R3CLASS
R4CLASS
R5CLASS
R6 TOTAL
Global Opportunities Fund $ — $ — $ 28,479 $ 14,464 $ 17,437 $ 39,531 $ 38,235 $ 138,146International Equity Fund — — 101,077 164,672 103,371 170,148 79,535 618,803Better World International Fund — 4,879 306,984 — — — — 311,863International Growth Fund — — — 21,865 22,274 65,467 46,486 156,092Developing World Fund — — 320,079 — — 15,139 54,112 389,330Small/Mid Cap Core Fund 219,558 7,766 311,875 62,885 16,945 43,481 — 662,510Small/Mid Cap Growth Fund 154,509 9,424 231,469 56,151 12,130 52,276 — 515,959Income Builder Fund — — — 15,211 7,550 29,178 26,134 78,073Summit Fund 3,510 — 64,121 — — — — 67,631
VOLUNTARY:CLASS
ACLASS
CCLASS
ICLASS
R3CLASS
R4CLASS
R5CLASS
R6 TOTAL
Global Opportunities Fund $ 48,017 $ 17,344 $ 145,885 $ 605 $ 1,048 $ 3,363 $ 10,385 $ 226,647International Equity Fund 90,094 3,941 328,368 25,199 16,281 24,643 165,740 654,266Better World International Fund 6,665 890 61,097 — — — — 68,652International Growth Fund 3,663 555 298,145 179 259 829 2,616 306,246Developing World Fund 46,053 10,939 336,612 — — 1,239 27,370 422,213Small/Mid Cap Growth Fund — 260 — — — — — 260Income Builder Fund — 19,911 — — — — — 19,911
Certain officers and Trustees of the Trust are also officers or directors of the Advisor and Distributor. The compensation of the independentTrustees is borne by the Trust. The Trust also pays a portion of the Chief Compliance Officer’s compensation. These amounts are reflectedas Trustee and officer fees in the Statement of Operations.
As of March 31, 2022, the percentage of direct investments in the Funds held by the Trustees, officers of the Trust, and the Advisor isapproximately as follows.
PERCENTAGE OF DIRECT INVESTMENTS
Global Opportunities Fund 5.47%International Equity Fund 1.45Better World International Fund 9.65International Growth Fund 2.43Developing World Fund 3.68Small/Mid Cap Core Fund 5.68Small/Mid Cap Growth Fund 5.48Income Builder Fund 1.39Summit Fund 56.97
The Funds may purchase or sell securities from or to an affiliated fund, provided the affiliation is due solely to having a common investmentadvisor, common officers, or common trustees, and provided that all such transactions will comply with Rule 17a-7 under the 1940 Act.For the year ended at March 31, 2022, the Rule 17a-7 purchases, sales and gains/(losses) were as follows.
PURCHASES SALES REALIZED GAINS/(LOSSES)
Small/Mid Cap Core Fund $ 15,017,169 $ 6,910,492 $ 2,339,166Small/Mid Cap Growth Fund 6,910,492 15,017,169 (3,903,148)
Shown below are holdings of voting securities of each portfolio company which is considered "affiliated" to the Funds under the 1940 Act,including companies for which the Funds’ holding represented 5% or more of the company’s voting securities, and a series of theThornburg Investment Trust in which the Funds invested for cash management purposes during the period:
GLOBAL OPPORTUNITIES FUNDMARKET VALUE
9/30/21PURCHASES
AT COSTSALES
PROCEEDS
REALIZEDGAIN
(LOSS)
CHANGE INUNREALIZED
APPR./(DEPR.)MARKET VALUE
3/31/22DIVIDENDINCOME
Thornburg Capital Mgmt. Fund $ 34,427,071 $109,513,010 $(105,463,532) $ - $ - $ 38,476,549 $ 33,029
Notes to Financial Statements, Continued
March 31, 2022 (Unaudited)
98 | Thornburg Equity Funds Semi-Annual Report

INTERNATIONAL EQUITY FUNDMARKET VALUE
9/30/21PURCHASES
AT COSTSALES
PROCEEDS
REALIZEDGAIN
(LOSS)
CHANGE INUNREALIZED
APPR./(DEPR.)MARKET VALUE
3/31/22DIVIDENDINCOME
Thornburg Capital Mgmt. Fund $352,027,123 $511,936,180 $(670,307,208) $ - $ - $193,656,095 $ 189,646
BETTER WORLD INTERNATIONAL FUND
Thornburg Capital Mgmt. Fund $ 31,700,716 $220,735,588 $(202,154,973) $ - $ - $ 50,281,331 $ 45,878
INTERNATIONAL GROWTH FUND
Thornburg Capital Mgmt. Fund $ 64,240,267 $414,381,472 $(421,218,245) $ - $ - $ 57,403,494 $ 84,504
DEVELOPING WORLD FUND
Thornburg Capital Mgmt. Fund $ 29,224,822 $251,370,396 $(271,057,374) $ - $ - $ 9,537,844 $ 30,303
SMALL/MID CAP CORE FUND
Thornburg Capital Mgmt. Fund $ 2,280,880 $ 99,075,965 $ (88,130,079) $ - $ - $ 13,226,766 $ 6,796
SMALL/MID CAP GROWTH FUND
Thornburg Capital Mgmt. Fund $ 4,142,746 $116,906,924 $(118,848,852) $ - $ - $ 2,200,818 $ 3,853
INCOME BUILDER FUND
Apollo Investment Corp.* $ 49,127,545 $ - $ (11,305,237) $(7,482,325) $ 8,497,508 $ - $ 2,187,204Chimera Investment Corp 264,958,318 - (10,205,936) (819,325) (46,636,633) 207,296,424 11,363,425Malamute Energy, Inc. 12,439 - - - - 12,439 -SLR Investment Corp 88,149,127 - (3,875,136) (1,124,724) (3,234,040) 79,915,227 3,614,478Thornburg Capital Mgmt. Fund 271,426,844 689,507,872 (673,728,836) - - 287,205,880 284,105
Total $673,674,273 $689,507,872 $(699,115,145) $(9,426,374) $(41,373,165) $574,429,970 $17,449,212
* Issuer no longer affiliated at March 31, 2022.
SUMMIT FUND
Thornburg Capital Mgmt. Fund $ 5,946,069 $ 18,089,908 $ (21,162,537) $ - $ - $ 2,873,440 $ 4,913
NOTE 5 – TAXES
Federal Income Taxes: It is the policy of the Trust to comply with the provisions of the Internal Revenue Code of 1986 applicable toregulated investment companies and to distribute to shareholders substantially all investment company taxable income including netrealized gains on investments (if any), and tax exempt income of the Funds. Therefore, no provision for federal income or excise tax isrequired.
The Funds file income tax returns in United States federal and applicable state jurisdictions. The statute of limitations on the Funds’ taxreturn filings generally remains open for the three years following a return’s filing date. The Funds have analyzed each uncertain tax positionbelieved to be material in the preparation of the Funds’ financial statements for the six month period ended March 31, 2022, includingopen tax years, to assess whether it is more likely than not that the position would be sustained upon examination, based on the technicalmerits of the position. The Funds have not identified any such position for which an asset or liability must be reflected in the Statements ofAssets and Liabilities.
Notes to Financial Statements, Continued
March 31, 2022 (Unaudited)
Thornburg Equity Funds Semi-Annual Report | 99

At March 31, 2022, information on the tax components of capital was as follows:
COSTUNREALIZED
APPRECIATIONUNREALIZED
DEPRECIATION
NET UNREALIZEDAPPRECIATION
(DEPRECIATION)
Global Opportunities Fund $ 715,601,782 $ 351,990,888 $ (25,181,272) $ 326,809,616International Equity Fund 2,575,735,495 500,434,036 (152,719,491) 347,714,545Better World International Fund 463,291,583 16,794,012 (21,770,287) (4,976,275)International Growth Fund 1,102,840,324 355,412,432 (60,002,233) 295,410,199Developing World Fund 892,415,371 271,485,598 (69,117,909) 202,367,689Small/Mid Cap Core Fund 653,655,165 125,584,214 (46,420,003) 79,164,211Small/Mid Cap Growth Fund 452,247,900 50,514,285 (60,317,170) (9,802,885)Income Builder Fund 8,590,493,628 3,178,630,688 (511,821,723) 2,666,808,965Summit Fund 66,185,359 5,920,550 (1,917,513) 4,003,037
At March 31, 2022, the Funds had deferred tax basis late-year ordinary investment losses and deferred tax basis capital losses occurringsubsequent to October 31, 2020 through September 30, 2021 per the following table. For tax purposes, such losses will be recognized inthe year ending September 30, 2022.
DEFERRED TAX BASISLATE-YEAR ORDINARY LOSSES
Developing World Fund $ 1,948,545
At March 31, 2022, the Funds had cumulative tax basis capital losses from prior fiscal years as shown on the following table, which may becarried forward to offset future capital gains. To the extent such carryforwards are used, capital gain distributions may be reduced to theextent provided by regulations. Such capital loss carryforwards do not expire.
CUMULATIVE CAPITAL LOSSESSHORT-TERM LONG-TERM
Developing World Fund $ 54,039,967 $ —Income Builder Fund 864,072,456 —
Foreign Withholding Taxes: The Funds are subject to foreign tax withholding imposed by certain foreign countries in which the Funds mayg ginvest. Withholding taxes are incurred on certain foreign dividends and are accrued at the time the dividend is recognized based onapplicable foreign tax laws. The Funds may file withholding tax reclaims in certain jurisdictions to recover a portion of amounts previouslywithheld, in view of various considerations, including recent decisions rendered by the courts in those and other jurisdictions. The Fundswould expect to record a receivable for such a tax reclaim based on a variety of factors, including assessment of a jurisdiction’s legalobligation to pay reclaims, the jurisdiction’s administrative practices and payment history, and industry convention.
As a result of several court rulings in France, the French tax authorities recently paid several of the Funds’ tax reclaims for prior taxwithholding. These tax reclaim payments are reflected as “Foreign withholding tax claims” in the Statements of Operations and any relatedinterest is included in “Interest Income”. Reducing the “Foreign withholding tax claim” amounts are fees paid by certain Funds to athird-party service provider that assisted in the recovery of the tax reclaims by pursuing administrative and judicial proceedings on theFunds’ behalf. These third-party service provider fees are reflected in the Statement of Operations under “Tax reclaim collection fees.” ForU.S. income tax purposes, tax reclaims paid by France and received by the Funds will reduce the amount of foreign taxes paid in a fiscalyear that Fund shareholders can use as tax credits in their individual income tax returns.
In the event that tax reclaims received by the Funds during the fiscal year ending September 30, 2022 exceed the foreign withholding taxespaid by the Funds for other foreign investments, and the Funds have previously passed foreign tax credits on to their shareholders, theFunds will have a U.S. tax liability. The Funds will enter into a closing agreement with the Internal Revenue Service (IRS) in order to pay theassociated tax liability (fees) on behalf of the Funds’ shareholders. These IRS fees are estimated thru the six months period endedMarch 31, 2022 and are reflected as “IRS Compliance Fees” in the Statements of Operations.
Deferred Foreign Capital Gain Taxes: The Funds are subject to a tax imposed on net realized gains of securities of certain foreign countries.g pThe Funds record an estimated deferred tax liability for net unrealized gains on these investments as reflected in the accompanyingfinancial statements. Such changes are included in net unrealized appreciation (depreciation) from investments in the Statement ofOperations.
Notes to Financial Statements, Continued
March 31, 2022 (Unaudited)
100 | Thornburg Equity Funds Semi-Annual Report

NOTE 6 – SHARES OF BENEFICIAL INTEREST
At March 31, 2022, there were an unlimited number of shares of each Fund with no par value of beneficial interest authorized. Transactionsin each Fund’s shares of beneficial interest were as follows:
SIX MONTHS ENDEDMARCH 31, 2022
YEAR ENDEDSEPTEMBER 30, 2021
GLOBAL OPPORTUNITIES FUND SHARES AMOUNT SHARES AMOUNT
Class A SharesShares sold 428,164 $ 15,572,679 874,275 $ 32,438,647Shares issued to shareholders in
reinvestment of dividends 932,299 33,290,506 442,778 14,478,834Shares repurchased (562,706) (20,233,338) (1,067,193) (39,035,301)
Net increase (decrease) 797,757 $ 28,629,847 249,860 $ 7,882,180
Class C SharesShares sold 55,369 $ 1,878,677 113,898 $ 4,047,616Shares issued to shareholders in
reinvestment of dividends 402,531 13,579,745 255,394 7,988,719Shares repurchased (501,862) (17,253,072) (1,194,390) (42,125,923)
Net increase (decrease) (43,962) $ (1,794,650) (825,098) $ (30,089,588)
Class I SharesShares sold 1,542,406 $ 55,604,813 1,864,870 $ 70,845,527Shares issued to shareholders in
reinvestment of dividends 2,086,899 74,888,020 991,332 32,632,180Shares repurchased (2,029,937) (72,814,867) (3,967,733) (141,555,890)
Net increase (decrease) 1,599,368 $ 57,677,966 (1,111,531) $ (38,078,183)
Class R3 SharesShares sold 7,836 $ 274,134 20,970 $ 794,404Shares issued to shareholders in
reinvestment of dividends 13,696 482,287 7,186 232,451Shares repurchased (16,391) (569,564) (46,653) (1,726,925)
Net increase (decrease) 5,141 $ 186,857 (18,497) $ (700,070)
Class R4 SharesShares sold 11,350 $ 403,284 30,008 $ 1,114,726Shares issued to shareholders in
reinvestment of dividends 17,674 625,825 9,046 293,903Shares repurchased (13,778) (501,055) (42,391) (1,610,874)
Net increase (decrease) 15,246 $ 528,054 (3,337) $ (202,245)
Class R5 SharesShares sold 58,493 $ 2,142,095 123,067 $ 4,568,125Shares issued to shareholders in
reinvestment of dividends 63,528 2,282,290 58,718 1,934,612Shares repurchased (100,055) (3,660,445) (689,498) (25,626,942)
Net increase (decrease) 21,966 $ 763,940 (507,713) $ (19,124,205)
Class R6 SharesShares sold 75,370 $ 2,948,165 131,284 $ 4,960,273Shares issued to shareholders in
reinvestment of dividends 210,743 7,594,896 101,230 3,347,578Shares repurchased (33,248) (1,238,291) (168,320) (6,520,234)
Net increase (decrease) 252,865 $ 9,304,770 64,194 $ 1,787,617
Notes to Financial Statements, Continued
March 31, 2022 (Unaudited)
Thornburg Equity Funds Semi-Annual Report | 101

SIX MONTHS ENDEDMARCH 31, 2022
YEAR ENDEDSEPTEMBER 30, 2021
INTERNATIONAL EQUITY FUND SHARES AMOUNT SHARES AMOUNT
Class A SharesShares sold 1,497,651 $ 40,821,311 2,896,091 $ 81,589,572Shares issued to shareholders in
reinvestment of dividends 2,401,673 64,165,504 967,980 25,503,852In-kind redemptions - - (13,269,318) (391,975,649)Shares repurchased (2,132,657) (55,846,387) (5,021,375) (142,779,243)
Net increase (decrease) 1,766,667 $ 49,140,428 (14,426,622) $ (427,661,468)
Class C SharesShares sold 57,307 $ 1,326,379 152,073 $ 3,848,667Shares issued to shareholders in
reinvestment of dividends 147,243 3,385,937 43,045 994,770Shares repurchased (238,930) (5,531,194) (1,151,785) (27,656,991)
Net increase (decrease) (34,380) $ (818,878) (956,667) $ (22,813,554)
Class I SharesShares sold 7,804,946 $ 207,096,133 11,175,901 $ 334,435,484Shares issued to shareholders in
reinvestment of dividends 8,538,732 237,811,796 1,980,851 54,339,971Shares repurchased (11,187,238) (300,044,172) (12,867,557) (382,158,344)
Net increase (decrease) 5,156,440 $ 144,863,757 289,195 $ 6,617,111
Class R3 SharesShares sold 360,750 $ 9,057,545 984,210 $ 28,294,741Shares issued to shareholders in
reinvestment of dividends 740,732 19,783,311 170,983 4,488,294Shares repurchased (808,845) (20,856,459) (1,836,277) (52,478,097)
Net increase (decrease) 292,637 $ 7,984,397 (681,084) $ (19,695,062)
Class R4 SharesShares sold 573,171 $ 14,352,431 645,614 $ 18,494,549Shares issued to shareholders in
reinvestment of dividends 420,162 11,128,522 102,231 2,670,773Shares repurchased (883,349) (22,344,469) (1,238,024) (34,763,153)
Net increase (decrease) 109,984 $ 3,136,484 (490,179) $ (13,597,831)
Class R5 SharesShares sold 366,156 $ 9,675,260 1,683,407 $ 50,629,374Shares issued to shareholders in
reinvestment of dividends 717,832 19,976,446 158,583 4,338,871Shares repurchased (1,025,935) (27,388,162) (1,691,896) (49,972,641)
Net increase (decrease) 58,053 $ 2,263,544 150,094 $ 4,995,604
Class R6 SharesShares sold 1,316,181 $ 34,578,204 3,588,727 $ 105,156,756Shares issued to shareholders in
reinvestment of dividends 1,437,278 39,828,164 300,976 8,231,829Shares repurchased (1,197,783) (30,452,902) (2,530,737) (74,195,581)
Net increase (decrease) 1,555,676 $ 43,953,466 1,358,966 $ 39,193,004
Notes to Financial Statements, Continued
March 31, 2022 (Unaudited)
102 | Thornburg Equity Funds Semi-Annual Report
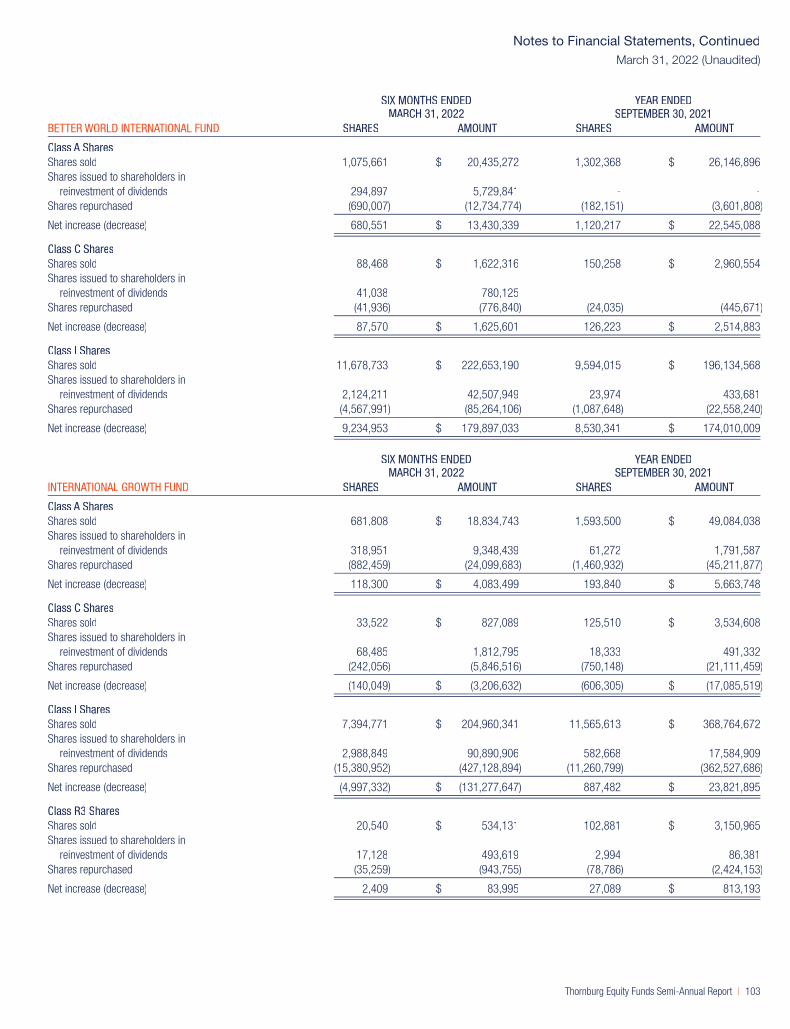
SIX MONTHS ENDEDMARCH 31, 2022
YEAR ENDEDSEPTEMBER 30, 2021
BETTER WORLD INTERNATIONAL FUND SHARES AMOUNT SHARES AMOUNT
Class A SharesShares sold 1,075,661 $ 20,435,272 1,302,368 $ 26,146,896Shares issued to shareholders in
reinvestment of dividends 294,897 5,729,841 - -Shares repurchased (690,007) (12,734,774) (182,151) (3,601,808)
Net increase (decrease) 680,551 $ 13,430,339 1,120,217 $ 22,545,088
Class C SharesShares sold 88,468 $ 1,622,316 150,258 $ 2,960,554Shares issued to shareholders in
reinvestment of dividends 41,038 780,125 - -Shares repurchased (41,936) (776,840) (24,035) (445,671)
Net increase (decrease) 87,570 $ 1,625,601 126,223 $ 2,514,883
Class I SharesShares sold 11,678,733 $ 222,653,190 9,594,015 $ 196,134,568Shares issued to shareholders in
reinvestment of dividends 2,124,211 42,507,949 23,974 433,681Shares repurchased (4,567,991) (85,264,106) (1,087,648) (22,558,240)
Net increase (decrease) 9,234,953 $ 179,897,033 8,530,341 $ 174,010,009
SIX MONTHS ENDEDMARCH 31, 2022
YEAR ENDEDSEPTEMBER 30, 2021
INTERNATIONAL GROWTH FUND SHARES AMOUNT SHARES AMOUNT
Class A SharesShares sold 681,808 $ 18,834,743 1,593,500 $ 49,084,038Shares issued to shareholders in
reinvestment of dividends 318,951 9,348,439 61,272 1,791,587Shares repurchased (882,459) (24,099,683) (1,460,932) (45,211,877)
Net increase (decrease) 118,300 $ 4,083,499 193,840 $ 5,663,748
Class C SharesShares sold 33,522 $ 827,089 125,510 $ 3,534,608Shares issued to shareholders in
reinvestment of dividends 68,485 1,812,795 18,333 491,332Shares repurchased (242,056) (5,846,516) (750,148) (21,111,459)
Net increase (decrease) (140,049) $ (3,206,632) (606,305) $ (17,085,519)
Class I SharesShares sold 7,394,771 $ 204,960,341 11,565,613 $ 368,764,672Shares issued to shareholders in
reinvestment of dividends 2,988,849 90,890,906 582,668 17,584,909Shares repurchased (15,380,952) (427,128,894) (11,260,799) (362,527,686)
Net increase (decrease) (4,997,332) $ (131,277,647) 887,482 $ 23,821,895
Class R3 SharesShares sold 20,540 $ 534,131 102,881 $ 3,150,965Shares issued to shareholders in
reinvestment of dividends 17,128 493,619 2,994 86,381Shares repurchased (35,259) (943,755) (78,786) (2,424,153)
Net increase (decrease) 2,409 $ 83,995 27,089 $ 813,193
Notes to Financial Statements, Continued
March 31, 2022 (Unaudited)
Thornburg Equity Funds Semi-Annual Report | 103

SIX MONTHS ENDEDMARCH 31, 2022
YEAR ENDEDSEPTEMBER 30, 2021
INTERNATIONAL GROWTH FUND SHARES AMOUNT SHARES AMOUNT
Class R4 SharesShares sold 79,278 $ 2,130,441 178,688 $ 5,508,749Shares issued to shareholders in
reinvestment of dividends 11,821 343,404 2,535 73,581Shares repurchased (33,430) (955,657) (150,715) (4,553,657)
Net increase (decrease) 57,669 $ 1,518,188 30,508 $ 1,028,673
Class R5 SharesShares sold 91,040 $ 2,456,418 492,795 $ 15,657,087Shares issued to shareholders in
reinvestment of dividends 74,090 2,260,498 13,159 398,322Shares repurchased (184,523) (5,136,362) (510,772) (16,276,600)
Net increase (decrease) (19,393) $ (419,446) (4,818) $ (221,191)
Class R6 SharesShares sold 139,262 $ 3,913,312 1,619,650 $ 52,755,172Shares issued to shareholders in
reinvestment of dividends 210,948 6,463,441 26,476 803,816Shares repurchased (196,421) (5,342,991) (301,858) (9,786,674)
Net increase (decrease) 153,789 $ 5,033,762 1,344,268 $ 43,772,314
SIX MONTHS ENDEDMARCH 31, 2022
YEAR ENDEDSEPTEMBER 30, 2021
DEVELOPING WORLD FUND SHARES AMOUNT SHARES AMOUNT
Class A SharesShares sold 716,810 $ 19,157,644 1,441,855 $ 40,291,192Shares issued to shareholders in
reinvestment of dividends - - - -Shares repurchased (528,246) (14,025,697) (1,113,929) (31,120,331)
Net increase (decrease) 188,564 $ 5,131,947 327,926 $ 9,170,861
Class C SharesShares sold 80,577 $ 2,014,100 180,889 $ 4,875,796Shares issued to shareholders in
reinvestment of dividends - - - -Shares repurchased (417,350) (10,417,646) (858,481) (22,670,074)
Net increase (decrease) (336,773) $ (8,403,546) (677,592) $ (17,794,278)
Class I SharesShares sold 7,723,739 $ 207,088,521 10,225,864 $ 297,861,014Shares issued to shareholders in
reinvestment of dividends - - 42,677 1,197,932Shares repurchased (4,834,917) (126,601,873) (6,041,340) (173,914,813)
Net increase (decrease) 2,888,822 $ 80,486,648 4,227,201 $ 125,144,133
Class R5 SharesShares sold 14,529 $ 384,954 61,806 $ 1,799,071Shares issued to shareholders in
reinvestment of dividends - - 206 5,772Shares repurchased (31,662) (836,179) (31,472) (904,935)
Net increase (decrease) (17,133) $ (451,225) 30,540 $ 899,908
Notes to Financial Statements, Continued
March 31, 2022 (Unaudited)
104 | Thornburg Equity Funds Semi-Annual Report

SIX MONTHS ENDEDMARCH 31, 2022
YEAR ENDEDSEPTEMBER 30, 2021
DEVELOPING WORLD FUND SHARES AMOUNT SHARES AMOUNT
Class R6 SharesShares sold 295,727 $ 7,862,735 497,571 $ 14,615,052Shares issued to shareholders in
reinvestment of dividends - - 5,578 156,695Shares repurchased (161,964) (4,307,138) (431,178) (12,649,208)
Net increase (decrease) 133,763 $ 3,555,597 71,971 $ 2,122,539
SIX MONTHS ENDEDMARCH 31, 2022
YEAR ENDEDSEPTEMBER 30, 2021
SMALL/MID CAP CORE FUND SHARES AMOUNT SHARES AMOUNT
Class A SharesShares sold 125,347 $ 9,444,604 178,986 $ 15,661,024Shares issued to shareholders in
reinvestment of dividends 1,546,880 116,587,733 - -Shares repurchased (689,847) (52,987,522) (720,458) (64,513,101)
Net increase (decrease) 982,380 $ 73,044,815 (541,472) $ (48,852,077)
Class C SharesShares sold 2,230 $ 144,495 14,454 $ 1,131,222Shares issued to shareholders in
reinvestment of dividends 74,225 4,803,824 - -Shares repurchased (75,007) (5,043,941) (155,579) (12,198,705)
Net increase (decrease) 1,448 $ (95,622) (141,125) $ (11,067,483)
Class I SharesShares sold 118,099 $ 9,582,318 176,656 $ 16,739,230Shares issued to shareholders in
reinvestment of dividends 1,089,537 85,936,055 - -Shares repurchased (641,758) (50,357,687) (615,795) (57,734,767)
Net increase (decrease) 565,878 $ 45,160,686 (439,139) $ (40,995,537)
Class R3 SharesShares sold 12,131 $ 924,331 25,950 $ 2,397,735Shares issued to shareholders in
reinvestment of dividends 81,262 6,082,567 - -Shares repurchased (55,836) (4,417,564) (117,894) (10,613,280)
Net increase (decrease) 37,557 $ 2,589,334 (91,944) $ (8,215,545)
Class R4 SharesShares sold 8,749 $ 634,659 3,422 $ 318,202Shares issued to shareholders in
reinvestment of dividends 14,252 1,084,494 - -Shares repurchased (13,376) (1,008,307) (19,198) (1,819,185)
Net increase (decrease) 9,625 $ 710,846 (15,776) $ (1,500,983)
Class R5 SharesShares sold 5,795 $ 448,827 17,992 $ 1,705,968Shares issued to shareholders in
reinvestment of dividends 46,107 3,628,979 - -Shares repurchased (40,192) (3,356,797) (55,840) (5,123,800)
Net increase (decrease) 11,710 $ 721,009 (37,848) $ (3,417,832)
Notes to Financial Statements, Continued
March 31, 2022 (Unaudited)
Thornburg Equity Funds Semi-Annual Report | 105
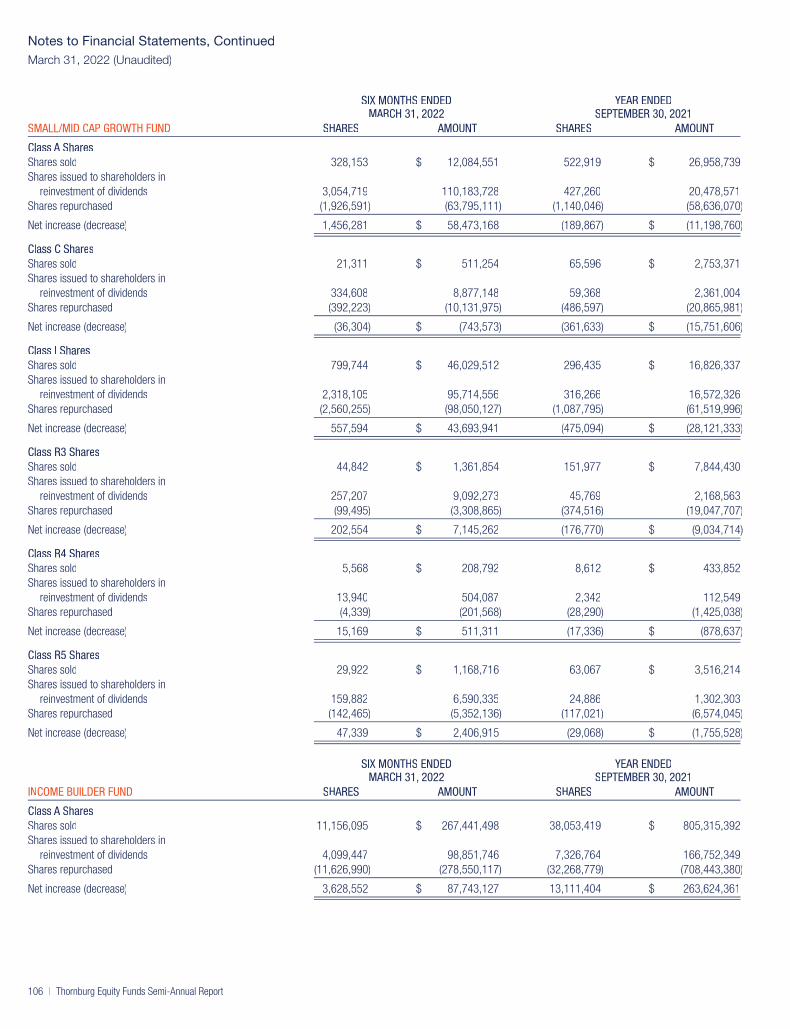
SIX MONTHS ENDEDMARCH 31, 2022
YEAR ENDEDSEPTEMBER 30, 2021
SMALL/MID CAP GROWTH FUND SHARES AMOUNT SHARES AMOUNT
Class A SharesShares sold 328,153 $ 12,084,551 522,919 $ 26,958,739Shares issued to shareholders in
reinvestment of dividends 3,054,719 110,183,728 427,260 20,478,571Shares repurchased (1,926,591) (63,795,111) (1,140,046) (58,636,070)
Net increase (decrease) 1,456,281 $ 58,473,168 (189,867) $ (11,198,760)
Class C SharesShares sold 21,311 $ 511,254 65,596 $ 2,753,371Shares issued to shareholders in
reinvestment of dividends 334,608 8,877,148 59,368 2,361,004Shares repurchased (392,223) (10,131,975) (486,597) (20,865,981)
Net increase (decrease) (36,304) $ (743,573) (361,633) $ (15,751,606)
Class I SharesShares sold 799,744 $ 46,029,512 296,435 $ 16,826,337Shares issued to shareholders in
reinvestment of dividends 2,318,105 95,714,556 316,266 16,572,326Shares repurchased (2,560,255) (98,050,127) (1,087,795) (61,519,996)
Net increase (decrease) 557,594 $ 43,693,941 (475,094) $ (28,121,333)
Class R3 SharesShares sold 44,842 $ 1,361,854 151,977 $ 7,844,430Shares issued to shareholders in
reinvestment of dividends 257,207 9,092,273 45,769 2,168,563Shares repurchased (99,495) (3,308,865) (374,516) (19,047,707)
Net increase (decrease) 202,554 $ 7,145,262 (176,770) $ (9,034,714)
Class R4 SharesShares sold 5,568 $ 208,792 8,612 $ 433,852Shares issued to shareholders in
reinvestment of dividends 13,940 504,087 2,342 112,549Shares repurchased (4,339) (201,568) (28,290) (1,425,038)
Net increase (decrease) 15,169 $ 511,311 (17,336) $ (878,637)
Class R5 SharesShares sold 29,922 $ 1,168,716 63,067 $ 3,516,214Shares issued to shareholders in
reinvestment of dividends 159,882 6,590,335 24,886 1,302,303Shares repurchased (142,465) (5,352,136) (117,021) (6,574,045)
Net increase (decrease) 47,339 $ 2,406,915 (29,068) $ (1,755,528)
SIX MONTHS ENDEDMARCH 31, 2022
YEAR ENDEDSEPTEMBER 30, 2021
INCOME BUILDER FUND SHARES AMOUNT SHARES AMOUNT
Class A SharesShares sold 11,156,095 $ 267,441,498 38,053,419 $ 805,315,392Shares issued to shareholders in
reinvestment of dividends 4,099,447 98,851,746 7,326,764 166,752,349Shares repurchased (11,626,990) (278,550,117) (32,268,779) (708,443,380)
Net increase (decrease) 3,628,552 $ 87,743,127 13,111,404 $ 263,624,361
Notes to Financial Statements, Continued
March 31, 2022 (Unaudited)
106 | Thornburg Equity Funds Semi-Annual Report
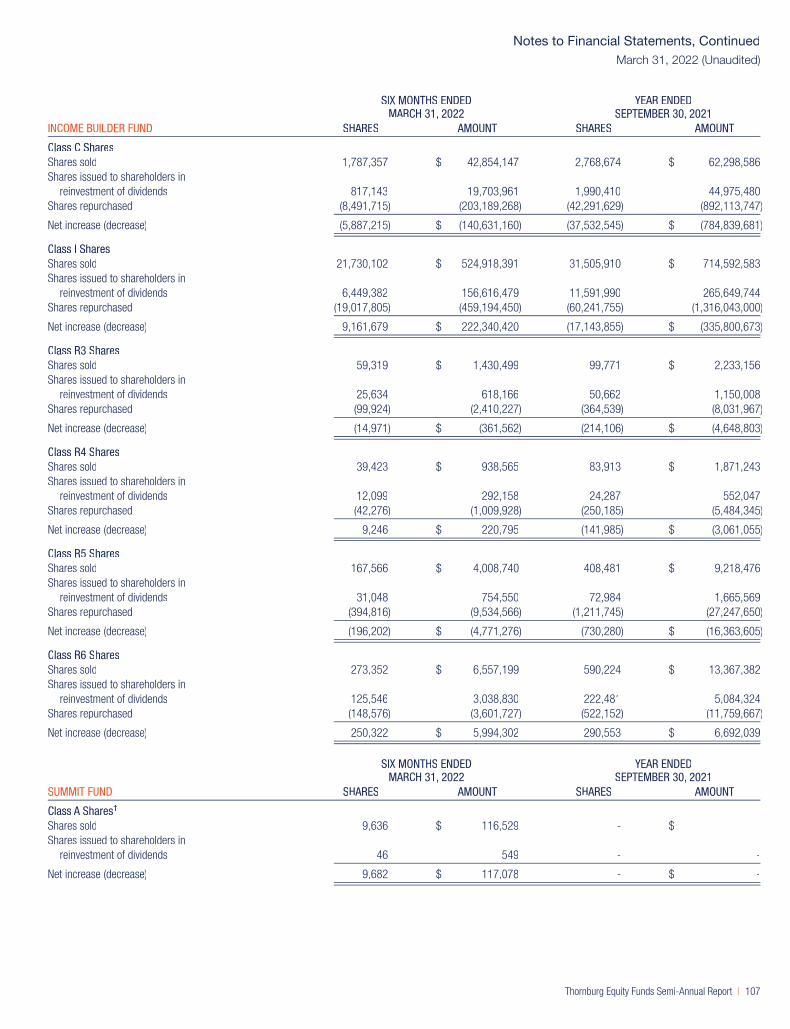
SIX MONTHS ENDEDMARCH 31, 2022
YEAR ENDEDSEPTEMBER 30, 2021
INCOME BUILDER FUND SHARES AMOUNT SHARES AMOUNT
Class C SharesShares sold 1,787,357 $ 42,854,147 2,768,674 $ 62,298,586Shares issued to shareholders in
reinvestment of dividends 817,143 19,703,961 1,990,410 44,975,480Shares repurchased (8,491,715) (203,189,268) (42,291,629) (892,113,747)
Net increase (decrease) (5,887,215) $ (140,631,160) (37,532,545) $ (784,839,681)
Class I SharesShares sold 21,730,102 $ 524,918,391 31,505,910 $ 714,592,583Shares issued to shareholders in
reinvestment of dividends 6,449,382 156,616,479 11,591,990 265,649,744Shares repurchased (19,017,805) (459,194,450) (60,241,755) (1,316,043,000)
Net increase (decrease) 9,161,679 $ 222,340,420 (17,143,855) $ (335,800,673)
Class R3 SharesShares sold 59,319 $ 1,430,499 99,771 $ 2,233,156Shares issued to shareholders in
reinvestment of dividends 25,634 618,166 50,662 1,150,008Shares repurchased (99,924) (2,410,227) (364,539) (8,031,967)
Net increase (decrease) (14,971) $ (361,562) (214,106) $ (4,648,803)
Class R4 SharesShares sold 39,423 $ 938,565 83,913 $ 1,871,243Shares issued to shareholders in
reinvestment of dividends 12,099 292,158 24,287 552,047Shares repurchased (42,276) (1,009,928) (250,185) (5,484,345)
Net increase (decrease) 9,246 $ 220,795 (141,985) $ (3,061,055)
Class R5 SharesShares sold 167,566 $ 4,008,740 408,481 $ 9,218,476Shares issued to shareholders in
reinvestment of dividends 31,048 754,550 72,984 1,665,569Shares repurchased (394,816) (9,534,566) (1,211,745) (27,247,650)
Net increase (decrease) (196,202) $ (4,771,276) (730,280) $ (16,363,605)
Class R6 SharesShares sold 273,352 $ 6,557,199 590,224 $ 13,367,382Shares issued to shareholders in
reinvestment of dividends 125,546 3,038,830 222,481 5,084,324Shares repurchased (148,576) (3,601,727) (522,152) (11,759,667)
Net increase (decrease) 250,322 $ 5,994,302 290,553 $ 6,692,039
SIX MONTHS ENDEDMARCH 31, 2022
YEAR ENDEDSEPTEMBER 30, 2021
SUMMIT FUND SHARES AMOUNT SHARES AMOUNT
Class A Shares†
Shares sold 9,636 $ 116,529 - $ -Shares issued to shareholders in
reinvestment of dividends 46 549 - -
Net increase (decrease) 9,682 $ 117,078 - $ -
Notes to Financial Statements, Continued
March 31, 2022 (Unaudited)
Thornburg Equity Funds Semi-Annual Report | 107

SIX MONTHS ENDEDMARCH 31, 2022
YEAR ENDEDSEPTEMBER 30, 2021
SUMMIT FUND SHARES AMOUNT SHARES AMOUNT
Class I SharesShares sold 738,801 $ 9,085,155 501,726 $ 6,924,014Shares issued to shareholders in
reinvestment of dividends 791,182 9,941,769 241,184 3,005,041Shares repurchased (23,003) (276,034) (126,679) (1,800,100)
Net increase (decrease) 1,506,980 $ 18,750,890 616,231 $ 8,128,955
† Effective date of this class of shares was January 26, 2022.
NOTE 7 – INVESTMENT TRANSACTIONS
For the six months ended March 31, 2022, the Funds had purchase and sale transactions of investments as listed in the table below(excluding short-term investments).
LONGPURCHASES SALES
Global Opportunities Fund $ 102,222,394 $ 157,809,973International Equity Fund 746,532,824 768,353,847Better World International Fund 440,195,612 313,730,183International Growth Fund 489,280,254 729,072,359Developing World Fund 503,431,163 418,366,553Small/Mid Cap Core Fund 164,836,883 279,463,908Small/Mid Cap Growth Fund 172,459,208 306,131,572Income Builder Fund 1,324,444,390 1,199,235,815Summit Fund 41,512,634 30,222,736
NOTE 8 – DERIVATIVE FINANCIAL INSTRUMENTS
The Funds may use a variety of derivative financial instruments to hedge or adjust the risks affecting its investment portfolio or to enhanceinvestment returns. Provisions of the FASB Accounting Standards Codification 815-10-50 (“ASC 815”) require certain disclosures. Thedisclosures are intended to provide users of financial statements with an understanding of the use of derivative instruments by the Fundsand how these derivatives affect the financial position, financial performance and cash flows of the Funds. The Funds do not designate anyderivative instruments as hedging instruments under ASC 815. During the six months ended March 31, 2022, the Funds’ principalexposure to derivative financial instruments of the type addressed by ASC 815 was investment in foreign currency contracts, except thatthe Summit Fund also had exposure during the period to options.
Forward Currency Contracts: During the six months ended March 31, 2022, some of the Funds entered into forward currency contracts inythe normal course of pursuing their investment objectives, with the intent of reducing the risk to the value of the Funds’ foreign investmentsfrom adverse changes in the relationship between the U.S. dollar and foreign currencies. Each of the forward currency contracts enteredinto by the Funds is an agreement between two parties to exchange different currencies at a specified rate of exchange at an agreed uponfuture date. Foreign currency contracts involve risks to the Funds, including the risk that a contract’s counterparty will not meet itsobligations to the Funds, the risk that a change in a contract’s value may not correlate perfectly with the currency the contract wasintended to track, and the risk that the Funds’ Advisor is unable to correctly implement its strategy in using a contract. In any suchinstance, the Funds may not achieve the intended benefit of entering into a contract and may experience a loss.
The monthly average values of open forward currency sell contracts for the six months ended March 31, 2022 for Global OpportunitiesFund and Income Builder Fund were $ 99,641,644; and $1,496,053,538 respectively.
These contracts are accounted for by the Funds under ASC 815. Unrealized appreciation and depreciation on outstanding contracts arereported in each Fund’s Statement of Assets and Liabilities, as measured by the difference between the forward exchange rates at thereporting date and the forward exchange rates at each contract’s inception date. Net realized gain (loss) on contracts closed during theperiod, and changes in net unrealized appreciation (depreciation) on outstanding contracts are recognized in each Fund’s Statement ofOperations.
These outstanding forward currency contracts in the table located in the Schedule of Investments which were entered into with State StreetBank and Trust Company (“SSB”), with Brown Brothers Harriman & Co. (“BBH”) and with Morgan Stanley & Co. Inc. ("MSC") were entered
Notes to Financial Statements, Continued
March 31, 2022 (Unaudited)
108 | Thornburg Equity Funds Semi-Annual Report

into pursuant to International Swaps and Derivatives Association (“ISDA”) Master Agreements. In the event of a default or termination underthe ISDA Master Agreement with SSB or MSC, the non-defaulting party has the right to close out all outstanding forward currencycontracts between the parties and to net any payment amounts under those contracts, resulting in a single net amount payable by oneparty to the other.
Because the ISDA Master Agreement with SSB and the ISDA Master Agreement with MSC do not result in an offset of reported amountsof financial assets and liabilities in the Funds’ Statement of Assets and Liabilities unless there has been an event of default or terminationevent under such agreements, the Funds do not net its outstanding forward currency contracts for the purpose of disclosure in the Funds’Statement of Assets and Liabilities. Instead the Funds recognize the unrealized appreciation (depreciation) on those forward currencycontracts on a gross basis in the Funds’ Statement of Assets and Liabilities.
Option Contracts: Each Fund may engage in option transactions and in doing so achieves similar objectives to what it would achievepthrough the sale or purchase of individual securities. A call option, upon payment of a premium, gives the purchaser of the option the rightto buy, and the seller of the option the obligation to sell, the underlying security, index or other instrument at the exercise price.
A put option gives the purchaser of the option, upon payment of a premium, the right to sell, and the seller the obligation to buy, theunderlying security, index, or other instrument at the exercise price. To seek to offset some of the risk of a potential decline in value ofcertain long positions, each Fund may also purchase put options on individual securities, broad-based securities indexes or certainexchange-traded funds (“ETFs”). Each Fund may also seek to generate income from option premiums by writing (selling) options on aportion of the equity securities (including securities that are convertible into equity securities) in the Funds’ portfolio, on broad-basedsecurities indexes, or certain ETFs.
When the Fund purchases an option, it pays a premium and an amount equal to that premium is recorded as an asset. When the Fundwrites an option, it receives a premium and an amount equal to that premium is recorded as a liability. The asset or liability is adjusted dailyto reflect the current market value of the option. If an option expires unexercised, the Fund realizes a gain or loss to the extent of thepremium received or paid. If an option is exercised, the premium received or paid is recorded as an adjustment to the proceeds from thesale or the cost basis of the purchase. The difference between the premium and the amount received or paid on a closing purchase or saletransaction is also treated as a realized gain or loss. The cost of securities acquired through the exercise of call options is increased bypremiums paid. The proceeds from securities sold through the exercise of put options are decreased by the premiums paid. Gain or losson written options and purchased options is presented separately on the Statements of Operations as net realized gain or loss on writtenoptions and net realized gain or loss on purchased options, respectively.
During the six month period ended March 31, 2022, Summit Fund engaged in over-the-counter (OTC) option trades.
Options written by each Fund do not typically give rise to counterparty credit risk since options written obligate each Fund and not thecounterparty to perform. Exchange traded purchased options have minimal counterparty credit risk to each Fund since the exchange’sclearinghouse, as counterparty to such instruments, guarantees against a possible default.
The monthly average notional value of open options written for the six months ended March 31, 2022 for Summit Fund was $263,174. Asof March 31, 2022, the Funds had no outstanding purchased options and/or written options.
The unrealized appreciation (depreciation) of the outstanding forward currency contracts recognized in each Fund’s Statement of Assetsand Liabilities at March 31, 2022 is disclosed in the following table:
TYPE OF DERIVATIVE(a)COUNTER
PARTYASSET
DERIVATIVESLIABILITY
DERIVATIVESNET
AMOUNT
Global Opportunities Fund Forward currency contracts SSB $ 3,350,325 $ — $ 3,350,325Forward currency contracts BBH 658,353 — 658,353
$ 4,008,678 $ — $ 4,008,678
Income Builder Fund Forward currency contracts SSB 49,273,306 — 49,273,306Forward currency contracts BBH 16,639,247 — 16,639,247
$ 65,912,553 $ — $ 65,912,553
Summit Fund Forward currency contracts MSC — (49,747) (49,747)
(a) Generally, the Statement of Assets and Liabilities location for forward currency contracts is Assets - Unrealized appreciation on forward currency contracts for asset derivatives andLiabilities - Unrealized depreciation on forward currency contracts for liabilities derivatives.
Because the Funds did not receive or post cash collateral in connection with its currency forward contracts during the period, the netamounts of each Fund’s assets and liabilities which are attributable to those contracts at March 31, 2022 can be determined by offsettingthe dollar amounts shown in the asset and liability columns in the preceding table, the results of which are reflected in the "Net Amount"
Notes to Financial Statements, Continued
March 31, 2022 (Unaudited)
Thornburg Equity Funds Semi-Annual Report | 109

column. The Funds’ forward currency contracts and written options are valued each day, and the net amounts of each Fund’s assets andliabilities which are attributable to those contracts and options are expected to vary over time.
The net realized gain (loss) from forward currency contracts and written options and net change in unrealized appreciation (depreciation) onoutstanding forward currency contracts and written options recognized in each Fund’s Statement of Operations for the six months endedMarch 31, 2022 are disclosed in the following table:
NET REALIZED NET CHANGE IN UNREALIZEDTYPE OF DERIVATIVE(a) GAIN (LOSS) APPRECIATION (DEPRECIATION)
Global Opportunities Fund Forward currency contracts $ 1,713,642 $ 2,471,424Income Builder Fund Forward currency contracts 28,883,969 41,665,563Summit Fund Forward currency contracts (64,783) (29,011)Summit Fund Written Options 32,635 —
(a) Generally, the Statement of Operations location for forward currency contracts is Net realized gain (loss) on: forward currency contracts and Net change in unrealized appreciation(depreciation) on: forward currency contracts. The Statement of Operations location for written option contracts is Net realized gain (loss) on: options written and Net change in unrealizedappreciation (depreciation) on: options written.
Notes to Financial Statements, Continued
March 31, 2022 (Unaudited)
110 | Thornburg Equity Funds Semi-Annual Report

This page intentionally left blank.
Thornburg Equity Funds Semi-Annual Report | 111

PER SHARE PERFORMANCE (FOR A SHARE OUTSTANDING THROUGHOUT THE PERIOD)UNLESS OTHERWISENOTED, PERIODS AREFISCAL YEARS ENDED
SEPTEMBER 30,
NET ASSETVALUE,
BEGINNINGOF PERIOD
NETINVESTMENT
INCOME(LOSS)+
NET REALIZED &UNREALIZED
GAIN (LOSS) ONINVESTMENTS
TOTAL FROMINVESTMENTOPERATIONS
DIVIDENDSFROM NET
INVESTMENTINCOME
DIVIDENDSFROM NETREALIZED
GAINS
DIVIDENDSFROM
RETURN OFCAPITAL
TOTALDIVIDENDS
NET ASSETVALUE,END OFPERIOD
CLASS A SHARES(c)
2022(d) $ 39.32 0.01 0.38 0.39 (0.49) (4.55) — (5.04) $ 34.672021 $ 31.69 0.53 9.40 9.93 —(f)
))(2.30) — (2.30) $ 39.32( ) ( )
2020 $ 27.56 0.08 4.47 4.55 (0.14) (0.28) — (0.42) $ 31.69( ) ( )
2019 $ 29.93 0.20 (2.02) (1.82) (0.55) — — (0.55) $ 27.56( ) ( ) ( )
2018 $ 30.98 0.44 (1.42) (0.98) (0.07) — — (0.07) $ 29.93( ) ( ) ( ) ( )( ) ( ) ( ) ( )
2017 $ 24.90 0.13 6.05(
6.18 (0.10) — — (0.10) $ 30.98) ( ) ( )
CLASS C SHARES
2022(d) $ 37.36 (0.13) 0.38 0.25 (0.19) (4.55) — (4.74) $ 32.872021 $ 30.44 0.22 9.00
( )9.22 — (2.30) — (2.30) $ 37.36
( ) ( ) ( )
2020 $ 26.55 (0.14) 4.31 4.17 — (0.28) — (0.28) $ 30.44( ) ( )
2019 $ 28.70 (0.01) (1.89) (1.90) (0.25) — — (0.25) $ 26.55( ) ( ) ( )
2018 $ 29.88 0.23 (1.39) (1.16) (0.02) — — (0.02) $ 28.70( ) ( ) ( ) ( ) ( )( ) ( ) ( ) ( ) ( )
2017 $ 24.13 (0.08) 5.84(
5.76 (0.01) — — (0.01) $ 29.88) ( ) ( )
CLASS I SHARES
2022(d) $ 39.49 0.06 0.40 0.46 (0.59) (4.55) — (5.14) $ 34.812021 $ 31.81 0.64 9.43 10.07 (0.09) (2.30) — (2.39) $ 39.49
( ) ( ) ( )
2020 $ 27.67 0.15 4.50 4.65 (0.23) (0.28) — (0.51) $ 31.81( ) ( ) ( )
2019 $ 30.07 0.29 (2.04) (1.75) (0.65) — — (0.65) $ 27.67( ) ( ) ( )
2018 $ 31.06 0.56 (1.45) (0.89) (0.10) — — (0.10) $ 30.07( ) ( ) ( ) ( )( ) ( ) ( ) ( )
2017 $ 24.96 0.23 6.07(
6.30 (0.20) — — (0.20) $ 31.06) ( ) ( )
CLASS R3 SHARES
2022(d) $ 38.81 (0.03) 0.40 0.37 (0.40) (4.55) — (4.95) $ 34.232021 $ 31.38 0.42 9.31
( )9.73 — (2.30) — (2.30) $ 38.81
( ) ( ) ( )
2020 $ 27.28 0.01 4.42 4.43 (0.05) (0.28) — (0.33) $ 31.38( ) ( )
2019 $ 29.57 0.15 (1.98) (1.83) (0.46) — — (0.46) $ 27.28( ) ( ) ( )
2018 $ 30.66 0.38 (1.41) (1.03) (0.06) — — (0.06) $ 29.57( ) ( ) ( ) ( )( ) ( ) ( ) ( )
2017 $ 24.66 0.08 5.99(
6.07 (0.07) — — (0.07) $ 30.66) ( ) ( )
CLASS R4 SHARES
2022(d) $ 39.01 (0.01) 0.39 0.38 (0.44) (4.55) — (4.99) $ 34.402021 $ 31.50 0.49 9.32
( )9.81 — (2.30) — (2.30) $ 39.01
( ) ( ) ( )
2020 $ 27.32 0.03 4.43 4.46 — (0.28) — (0.28) $ 31.50( ) ( )
2019 $ 29.62 0.19 (2.00) (1.81) (0.49) — — (0.49) $ 27.32( ) ( )
2018 $ 30.69 0.46 (1.47) (1.01) (0.06) — — (0.06) $ 29.62( ) ( ) ( ) ( )( ) ( ) ( ) ( )
2017 $ 24.67 0.11 6.00(
6.11 (0.09) — — (0.09) $ 30.69) ( ) ( )
CLASS R5 SHARES
2022(d) $ 39.53 0.06 0.40 0.46 (0.58) (4.55) — (5.13) $ 34.862021 $ 31.84 0.61 9.47 10.08 (0.09) (2.30) — (2.39) $ 39.53
( ) ( ) ( )
2020 $ 27.70 0.15 4.50 4.65 (0.23) (0.28) — (0.51) $ 31.84( ) ( ) ( )
2019 $ 30.10 0.28 (2.02) (1.74) (0.66) — — (0.66) $ 27.70( ) ( ) ( )
2018 $ 31.10 0.57 (1.47) (0.90) (0.10) — — (0.10) $ 30.10( ) ( ) ( ) ( )( ) ( ) ( ) ( )
2017 $ 24.99 0.22 6.08(
6.30 (0.19) — — (0.19) $ 31.10) ( ) ( )
CLASS R6 SHARES
2022(d) $ 39.64 0.09 0.39 0.48 (0.64) (4.55) — (5.19) $ 34.932021 $ 31.93 0.70 9.44 10.14 (0.13) (2.30) — (2.43) $ 39.64
( ) ( ) ( )
2020 $ 27.77 0.21 4.50 4.71 (0.27) (0.28) — (0.55) $ 31.93( ) ( ) ( )
2019 $ 30.20 0.32 (2.05) (1.73) (0.70) — — (0.70) $ 27.77( ) ( ) ( )
2018 $ 31.16 0.90 (1.75) (0.85) (0.11) — — (0.11) $ 30.20( ) ( ) ( ) ( )( ) ( ) ( ) ( )
2017(g) $ 28.35 0.11 2.73(
2.84 (0.03) — — (0.03) $ 31.16) ( ) ( )
(a) Net investment income (loss) includes income from foreign withholding tax claims adjusted for IRS compliance fees and/or tax reclaim collection fees. Without these proceeds, the NetInvestment Income (Loss) ratios for 2022 would have been: Class A, (0.02)%; Class C, (0.81)%; Class I, 0.28%; Class R3, (0.24)%; Class R4, (0.13)%; Class R5, 0.27%; Class R6, 0.42%and 2021 would have been: Class A, 1.36%; Class C, 0.57%; Class I, 1.64%; Class R3, 1.10%; Class R4, 1.27%; Class R5, 1.60%; Class R6, 1.80%.
(b) Not annualized for periods less than one year.(c) Sales loads are not reflected in computing total return.(d) Unaudited Six Month Period Ended March 31.(e) Annualized.(f) Dividends From Net Investment Income was less than 0.01.(g) Effective date of this class of shares was April 10, 2017.(h) Due to the size of net assets and fixed expenses, ratios may appear disproportionate.+ Based on weighted average shares outstanding.
See notes to financial statements.
Financial HighlightsGlobal Opportunities Fund
112 | Thornburg Equity Funds Semi-Annual Report

RATIOS TO AVERAGE NET ASSETS SUPPLEMENTAL DATAUNLESS OTHERWISENOTED, PERIODS AREFISCAL YEARS ENDED
SEPTEMBER 30,NET INVESTMENT
INCOME (LOSS) (%)(a)
EXPENSES, AFTEREXPENSE
REDUCTIONS (%)
EXPENSES,BEFORE EXPENSEREDUCTIONS (%)
TOTALRETURN (%)(b)
PORTFOLIOTURNOVERRATE (%)(b)
NETASSETS
AT END OF PERIOD(THOUSANDS)
CLASS A SHARES(c)
2022(d) 0.06(e) 1.28(e) 1.32(e) 0.77 9.84 $ 272,0622021 1.42 1.27 1.31 32.82 25.48 $ 277,1262020 0.27 1.28 1.32 16.59 35.63 $ 215,4732019 0.73 1.31 1.33 (5.78) 29.12 $ 236,5602018 1.40 1.28 1.28 (3.16) 41.99 $ 367,449
( )
2017 0.46 1.33 1.33 24.85 43.70 $ 442,522
CLASS C SHARES
2022(d) (0.73)(e) 2.06(e) 2.10(e) 0.41 9.84 $ 97,4562021 0.63 2.04 2.08 31.77 25.48 $ 112,4202020 (0.49) 2.02 2.06 15.78 35.63 $ 116,7052019 (0.02) 2.07 2.09 (6.49) 29.12 $ 151,4692018 0.78 2.03 2.03 (3.90) 41.99 $ 253,907
( )
2017 (0.30) 2.08 2.08 23.88 43.70 $ 380,046
CLASS I SHARES
2022(d) 0.35(e) 0.99(e) 1.05(e) 0.95 9.84 $ 589,4002021 1.69 0.99 1.06 33.17 25.48 $ 605,5812020 0.50 0.99 1.08 16.91 35.63 $ 523,1752019 1.05 0.99 1.06 (5.46) 29.12 $ 762,6972018 1.79 0.97 0.97 (2.88) 41.99 $ 1,200,267
( )
2017 0.80 0.97 0.98 25.31 43.70 $ 1,514,039
CLASS R3 SHARES
2022(d) (0.16)(e) 1.50(e) 2.32(e) 0.71 9.84 $ 3,5062021 1.15 1.50 2.07 32.48 25.48 $ 3,7762020 0.03 1.50 2.00 16.32 35.63 $ 3,6332019 0.55 1.50 2.20 (5.95) 29.12 $ 4,3172018 1.22 1.50 1.92 (3.38) 41.99 $ 7,577
( )
2017 0.28 1.50 1.97 24.66 43.70 $ 12,059
CLASS R4 SHARES
2022(d) (0.06)(e) 1.40(e) 2.00(e) 0.75 9.84 $ 5,9712021 1.32 1.40 1.83 32.62 25.48 $ 6,1772020 0.09 1.40 1.62 16.41 35.63 $ 5,0932019 0.71 1.40 1.86 (5.84) 29.12 $ 9,2542018 1.49 1.40 1.61 (3.29) 41.99 $ 20,786
( )
2017 0.38 1.40 1.65 24.81 43.70 $ 28,061
CLASS R5 SHARES
2022(d) 0.35(e) 0.99(e) 1.42(e) 0.95 9.84 $ 18,9942021 1.64 0.99 1.36 33.18 25.48 $ 20,6732020 0.53 0.99 1.28 16.89 35.63 $ 32,8172019 1.04 0.99 1.27 (5.45) 29.12 $ 42,3542018 1.82 0.99 1.16 (2.92) 41.99 $ 70,084
( )
2017 0.79 0.99 1.16 25.29 43.70 $ 80,704
CLASS R6 SHARES
2022(d) 0.50(e) 0.85(e) 1.01(e) 1.00 9.84 $ 59,1272021 1.85 0.85 1.00 33.32 25.48 $ 57,0722020 0.70 0.85 1.03 17.08 35.63 $ 43,9112019 1.17 0.85 1.00 (5.34) 29.12 $ 45,6992018 2.93 0.85 0.98 (2.75) 41.99 $ 51,836
( )
2017(g) 0.77(e) 0.85(e) 13.31(e)(h) 10.02 43.70 $ 1,576
Financial Highlights, Continued
Global Opportunities Fund
Thornburg Equity Funds Semi-Annual Report | 113

PER SHARE PERFORMANCE (FOR A SHARE OUTSTANDING THROUGHOUT THE PERIOD)UNLESS OTHERWISENOTED, PERIODS AREFISCAL YEARS ENDED
SEPTEMBER 30,
NET ASSETVALUE,
BEGINNINGOF PERIOD
NETINVESTMENT
INCOME(LOSS)+
NET REALIZED &UNREALIZED
GAIN (LOSS) ONINVESTMENTS
TOTAL FROMINVESTMENTOPERATIONS
DIVIDENDSFROM NET
INVESTMENTINCOME
DIVIDENDSFROM NETREALIZED
GAINS
DIVIDENDSFROM
RETURN OFCAPITAL
TOTALDIVIDENDS
NET ASSETVALUE,END OFPERIOD
CLASS A SHARES(d)
2022(e) $ 28.75 0.09 (1.97) (1.88) (0.27) (3.43) — (3.70) $ 23.172021 $ 24.78 0.31 4.49 4.80 (0.06) (0.77) — (0.83) $ 28.75
( ) ( ) ( ) ( ) ( )( ) ( ) ( ) ( ) ( )
2020 $ 22.91 0.07 3.29 3.36 (0.21) (1.28) — (1.49) $ 24.78( ) ( ) ( )( ) ( ) ( )
2019 $ 22.69 0.19 0.31 0.50 (0.28) — — (0.28) $ 22.91( ) ( ) ( )( ) ( ) ( )
2018 $ 27.63 0.19 (1.10) (0.91) — (4.03) — (4.03) $ 22.69( ) ( )( ) ( )
2017 $ 23.43 0.16 4.24 4.40 (0.20) — — (0.20) $ 27.63( ) ( ) ( ) ( )( ) ( ) ( ) ( )
CLASS C SHARES
2022(e) $ 25.20 —(g) (1.68) (1.68) (0.14) (3.43) — (3.57) $ 19.952021 $ 21.91 0.06 4.00 4.06 — (0.77) — (0.77) $ 25.20
( ) ( ) ( ) ( ) ( )
2020 $ 20.33 (0.08) 2.94 2.86 — (1.28) — (1.28) $ 21.91( ) ( )( ) ( )
2019 $ 20.01 —( )
(g)))
0.32 0.32 — — — — $ 20.33( ) ( )
2018 $ 25.00 0.02 (0.98) (0.96) — (4.03) — (4.03) $ 20.012017 $ 21.29 (0.02) 3.84 3.82 (0.11) — — (0.11) $ 25.00
( ) ( ) ( ) ( )( ) ( ) ( ) ( )
CLASS I SHARES
2022(e) $ 29.88 0.15 (2.06) (1.91) (0.41) (3.43) — (3.84) $ 24.132021 $ 25.70 0.39 4.68 5.07 (0.12) (0.77) — (0.89) $ 29.88
( ) ( ) ( ) ( ) ( )( ) ( ) ( ) ( ) ( )
2020 $ 23.69 0.15 3.42 3.57 (0.28) (1.28) — (1.56) $ 25.70( ) ( ) ( )( ) ( ) ( )
2019 $ 23.47 0.25 0.32 0.57 (0.35) — — (0.35) $ 23.69( ) ( ) ( )( ) ( ) ( )
2018 $ 28.37 0.29 (1.15) (0.86) (0.01) (4.03) — (4.04) $ 23.47( ) ( )( ) ( )
2017 $ 24.02 0.25 4.37 4.62 (0.27) — — (0.27) $ 28.37( ) ( ) ( ) ( ) ( )( ) ( ) ( ) ( ) ( )
CLASS R3 SHARES
2022(e) $ 28.75 0.08 (1.98) (1.90) (0.26) (3.43) — (3.69) $ 23.162021 $ 24.77 0.23 4.52 4.75 — (0.77) — (0.77) $ 28.75
( ) ( ) ( ) ( ) ( )( ) ( ) ( ) ( ) ( )
2020 $ 22.89 0.03 3.29 3.32 (0.16) (1.28) — (1.44) $ 24.77( ) ( )( ) ( )
2019 $ 22.65 0.15 0.31 0.46 (0.22) — — (0.22) $ 22.89( ) ( ) ( )( ) ( ) ( )
2018 $ 27.63 0.14 (1.09) (0.95) — (4.03) — (4.03) $ 22.65( ) ( )( ) ( )
2017 $ 23.44 0.14 4.22 4.36 (0.17) — — (0.17) $ 27.63( ) ( ) ( ) ( )( ) ( ) ( ) ( )
CLASS R4 SHARES
2022(e) $ 28.56 0.10 (1.96) (1.86) (0.32) (3.43) — (3.75) $ 22.952021 $ 24.60 0.28 4.49 4.77 (0.04) (0.77) — (0.81) $ 28.56
( ) ( ) ( ) ( ) ( )( ) ( ) ( ) ( ) ( )
2020 $ 22.74 0.07 3.27 3.34 (0.20) (1.28) — (1.48) $ 24.60( ) ( ) ( )( ) ( ) ( )
2019 $ 22.52 0.19 0.30 0.49 (0.27) — — (0.27) $ 22.74( ) ( ) ( )( ) ( ) ( )
2018 $ 27.45 0.20 (1.10) (0.90) — (4.03) — (4.03) $ 22.52( ) ( )( ) ( )
2017 $ 23.26 0.18 4.21 4.39 (0.20) — — (0.20) $ 27.45( ) ( ) ( ) ( )( ) ( ) ( ) ( )
CLASS R5 SHARES
2022(e) $ 29.84 0.14 (2.05) (1.91) (0.40) (3.43) — (3.83) $ 24.102021 $ 25.66 0.38 4.67 5.05 (0.10) (0.77) — (0.87) $ 29.84
( ) ( ) ( ) ( ) ( )( ) ( ) ( ) ( ) ( )
2020 $ 23.67 0.13 3.42 3.55 (0.28) (1.28) — (1.56) $ 25.66( ) ( ) ( )( ) ( ) ( )
2019 $ 23.44 0.25 0.32 0.57 (0.34) — — (0.34) $ 23.67( ) ( ) ( )( ) ( ) ( )
2018 $ 28.35 0.27 (1.15) (0.88) —( )
(h)))
(4.03) — (4.03) $ 23.44( )
2017 $ 24.01 0.24 4.35 4.59 (0.25) — — (0.25) $ 28.35( ) ( ) ( ) ( )
CLASS R6 SHARES
2022(e) $ 29.75 0.17 (2.05) (1.88) (0.45) (3.43) — (3.88) $ 23.992021 $ 25.59 0.44 4.65 5.09 (0.16) (0.77) — (0.93) $ 29.75
( ) ( ) ( ) ( ) ( )( ) ( ) ( ) ( ) ( )
2020 $ 23.61 0.18 3.41 3.59 (0.33) (1.28) — (1.61) $ 25.59( ) ( ) ( )( ) ( ) ( )
2019 $ 23.40 0.31 0.29 0.60 (0.39) — — (0.39) $ 23.61( ) ( ) ( )( ) ( ) ( )
2018 $ 28.27 0.33 (1.15) (0.82) (0.02) (4.03) — (4.05) $ 23.40( ) ( )( ) ( )
2017 $ 23.95 0.31 4.33 4.64 (0.32) — — (0.32) $ 28.27( ) ( ) ( ) ( ) ( )( ) ( ) ( ) ( ) ( )
(a) Net investment income (loss) includes income from foreign withholding tax claims adjusted for IRS compliance fees and/or tax reclaim collection fees. Without these proceeds, the NetInvestment Income (Loss) ratios for 2022 would have been: Class A, 0.69%; Class C, 0.04%; Class I, 1.11%; Class R3, 0.61%; Class R4, 0.81%; Class R5, 1.06%; Class R6, 1.28% and2021 would have been: Class A, 0.99%; Class C, 0.16%; Class I, 1.23%; Class R3, 0.71%; Class R4, 0.90%; Class R5, 1.18%; Class R6, 1.40%.
(b) Net expenses include tax reclaim collection fees that are excluded from the expense limitation agreement. If such expenses and fees had not occurred, the Expenses After ExpenseReductions ratios for 2021 would have been: Class A, 1.25%; Class C, 1.96%; Class I, 0.94%; Class R3, 1.45%; Class R4, 1.25%; Class R5, 0.99%; Class R6, 0.79%.
(c) Not annualized for periods less than one year.(d) Sales loads are not reflected in computing total return.(e) Unaudited Six Month Period Ended March 31.(f) Annualized.(g) Net investment income (loss) was less than $(0.01) per share.(h) Dividends from net investment income per share were less than $(0.01).+ Based on weighted average shares outstanding.
See notes to financial statements.
Financial HighlightsInternational Equity Fund
114 | Thornburg Equity Funds Semi-Annual Report

RATIOS TO AVERAGE NET ASSETS SUPPLEMENTAL DATAUNLESS OTHERWISENOTED, PERIODS AREFISCAL YEARS ENDED
SEPTEMBER 30,NET INVESTMENT
INCOME (LOSS) (%)(a)
EXPENSES, AFTEREXPENSE
REDUCTIONS (%)(b)
EXPENSES,BEFORE EXPENSEREDUCTIONS (%)
TOTALRETURN (%)(c)
PORTFOLIOTURNOVERRATE (%)(c)
NETASSETS
AT END OF PERIOD(THOUSANDS)
CLASS A SHARES(d)
2022(e) 0.69(f) 1.34(f) 1.37(f) (8.14) 24.70 $ 478,7072021 1.07 1.58 1.58 19.66 42.85 $ 543,262
( )
2020 0.31 1.25 1.26 15.33 79.05 $ 825,6772019 0.86 1.26 1.26 2.47 71.09 $ 655,8072018 0.77 1.27 1.27 (4.13) 44.41 $ 782,3712017 0.65 1.31 1.31 18.78 86.88 $ 840,244
( )
CLASS C SHARES
2022(e) 0.03(f) 1.98(f) 2.01(f) (8.47) 24.70 $ 20,8452021 0.24 2.26 2.26 18.83 42.85 $ 27,189
( )
2020 (0.40) 1.93 1.94 14.69 79.05 $ 44,5942019 (0.02) 2.09 2.09 1.60 71.09 $ 81,4012018 0.07 2.02 2.02 (4.86) 44.41 $ 159,7892017 (0.08) 2.04 2.04 17.94 86.88 $ 400,859
( )
CLASS I SHARES
2022(e) 1.11(f) 0.93(f) 0.98(f) (7.96) 24.70 $ 1,740,1062021 1.32 1.24 1.24 20.05 42.85 $ 2,000,723
( )
2020 0.64 0.92 0.93 15.74 79.05 $ 1,713,3582019 1.11 0.97 0.97 2.76 71.09 $ 1,694,7802018 1.15 0.91 0.91 (3.81) 44.41 $ 2,462,5642017 0.99 0.92 0.92 19.29 86.88 $ 3,370,930
( )
CLASS R3 SHARES
2022(e) 0.61(f) 1.42(f) 1.68(f) (8.18) 24.70 $ 133,8232021 0.80 1.75 1.91 19.46 42.85 $ 157,724
( )
2020 0.12 1.45 1.58 15.11 79.05 $ 152,7642019 0.67 1.45 1.65 2.25 71.09 $ 164,4372018 0.59 1.45 1.64 (4.29) 44.41 $ 213,0072017 0.55 1.45 1.64 18.63 86.88 $ 285,510
( )
CLASS R4 SHARES
2022(e) 0.80(f) 1.22(f) 1.47(f) (8.11) 24.70 $ 86,7012021 0.99 1.55 1.70 19.69 42.85 $ 104,735
( )
2020 0.30 1.25 1.32 15.35 79.05 $ 102,2662019 0.88 1.25 1.44 2.45 71.09 $ 125,3632018 0.81 1.25 1.47 (4.11) 44.41 $ 164,6632017 0.74 1.25 1.46 18.90 86.88 $ 209,066
( )
CLASS R5 SHARES
2022(e) 1.06(f) 0.96(f) 1.23(f) (7.98) 24.70 $ 130,6312021 1.26 1.29 1.46 19.97 42.85 $ 160,007
( )
2020 0.55 0.99 1.02 15.64 79.05 $ 133,7052019 1.10 0.99 1.12 2.74 71.09 $ 153,3662018 1.06 0.99 1.17 (3.87) 44.41 $ 229,4852017 0.96 0.99 1.15 19.17 86.88 $ 298,970
( )
CLASS R6 SHARES
2022(e) 1.28(f) 0.76(f) 0.91(f) (7.89) 24.70 $ 304,7632021 1.49 1.09 1.18 20.21 42.85 $ 331,621
( )
2020 0.78 0.79 0.90 15.90 79.05 $ 250,3912019 1.37 0.79 0.88 2.95 71.09 $ 219,4412018 1.33 0.79 0.83 (3.68) 44.41 $ 457,0062017 1.23 0.78 0.79 19.40 86.88 $ 536,296
( )
Financial Highlights, Continued
International Equity Fund
Thornburg Equity Funds Semi-Annual Report | 115

PER SHARE PERFORMANCE (FOR A SHARE OUTSTANDING THROUGHOUT THE PERIOD)UNLESS OTHERWISENOTED, PERIODS AREFISCAL YEARS ENDED
SEPTEMBER 30,
NET ASSETVALUE,
BEGINNINGOF PERIOD
NETINVESTMENT
INCOME(LOSS)+
NET REALIZED &UNREALIZED
GAIN (LOSS) ONINVESTMENTS
TOTAL FROMINVESTMENTOPERATIONS
DIVIDENDSFROM NET
INVESTMENTINCOME
DIVIDENDSFROM NETREALIZED
GAINS
DIVIDENDSFROM
RETURN OFCAPITAL
TOTALDIVIDENDS
NET ASSETVALUE,END OFPERIOD
CLASS A SHARES(c)
2022(d) $ 21.46 0.02 (1.34) (1.32) — (2.86) — (2.86) $ 17.282021 $ 15.66 0.01 5.79 5.80 — — — — $ 21.46
( ) ( ) ( ) ( )( ) ( ) ( ) ( )
2020 $ 12.85 —(f) 2.90 2.90 (0.09) — — (0.09) $ 15.662019 $ 14.51 0.12 (0.66) (0.54) (0.15) (0.97) — (1.12) $ 12.85
( ) ( )
2018 $ 14.13 0.09 0.66 0.75 — (0.37) — (0.37) $ 14.51( ) ( ) ( ) ( ) ( )( ) ( ) ( ) ( ) ( )
2017 $ 13.86 0.09 0.99 1.08 (0.12) (0.69) — (0.81) $ 14.13( ) ( )( ) ( )
CLASS C SHARES
2022(d) $ 21.08 (0.05) (1.31) (1.36) — (2.86) — (2.86) $ 16.862021 $ 15.51 (0.15) 5.72 5.57 — — — — $ 21.08
( ) ( ) ( ) ( ) ( )( ) ( ) ( ) ( ) ( )
2020 $ 12.72 (0.08) 2.88 2.80 (0.01) — — (0.01) $ 15.51( )( )
2019 $ 14.32 0.03 (0.62) (0.59) (0.04) (0.97) — (1.01) $ 12.72( ) ( ) ( )( ) ( ) ( )
2018 $ 14.02 —(f) 0.67 0.67 — (0.37) — (0.37) $ 14.32) ( ) ( ) ( ) ( )
2017 $ 13.79 0.02 0.97 0.99 (0.07) (0.69) — (0.76) $ 14.02( ) ( )
CLASS I SHARES
2022(d) $ 22.03 0.07 (1.39) (1.32) (0.05) (2.86) — (2.91) $ 17.802021 $ 16.06 0.11 5.93 6.04 (0.07) — — (0.07) $ 22.03
( ) ( ) ( ) ( ) ( )( ) ( ) ( ) ( ) ( )
2020 $ 13.16 0.10 2.99 3.09 (0.19) — — (0.19) $ 16.06( ) ( )( ) ( )
2019 $ 14.83 0.20 (0.67) (0.47) (0.23) (0.97) — (1.20) $ 13.16( ) ( )( ) ( )
2018 $ 14.33 0.18 0.69 0.87 — (0.37) — (0.37) $ 14.83( ) ( ) ( ) ( ) ( )( ) ( ) ( ) ( ) ( )
2017 $ 13.96 0.20 1.02 1.22 (0.16) (0.69) — (0.85) $ 14.33( ) ( )( ) ( )
(a) Net investment income (loss) includes income from foreign withholding tax claims adjusted for IRS compliance fees and/or tax reclaim collection fees. Without these proceeds, the NetInvestment Income (Loss) ratios for 2022 would have been: Class A, 0.16%; Class C, (0.61)%; Class I, 0.66% and 2021 would have been: Class A, 0.04%; Class C, (0.78)%; Class I,0.51%.
(b) Not annualized for periods less than one year.(c) Sales loads are not reflected in computing total return.(d) Unaudited Six Month Period Ended March 31.(e) Annualized.(f) Net investment income (loss) was less than $0.01 per share.+ Based on weighted average shares outstanding.
See notes to financial statements.
Financial HighlightsBetter World International Fund
116 | Thornburg Equity Funds Semi-Annual Report

RATIOS TO AVERAGE NET ASSETS SUPPLEMENTAL DATAUNLESS OTHERWISENOTED, PERIODS AREFISCAL YEARS ENDED
SEPTEMBER 30,NET INVESTMENT
INCOME (LOSS) (%)(a)
EXPENSES, AFTEREXPENSE
REDUCTIONS (%)
EXPENSES,BEFORE EXPENSEREDUCTIONS (%)
TOTALRETURN (%)(b)
PORTFOLIOTURNOVERRATE (%)(b)
NETASSETS
AT END OF PERIOD(THOUSANDS)
CLASS A SHARES(c)
2022(d) 0.18(e) 1.49(e) 1.52(e) (7.67) 85.89 $ 44,1982021 0.05 1.57 1.57 37.04 119.96 $ 40,287
( )
2020 (0.02) 1.83 1.94 22.65 42.87 $ 11,8592019 0.91 1.82 2.10 (3.19) 62.33 $ 9,3782018 0.64 1.82 2.12 5.37 111.99 $ 8,537
)
2017 0.64 1.79 3.21 8.61 105.55 $ 6,450
CLASS C SHARES
2022(d) (0.58)(e) 2.28(e) 2.48(e) (7.97) 85.89 $ 5,9532021 (0.77) 2.38 2.85 35.91 119.96 $ 5,597
( )
2020 (0.56) 2.38 3.31 22.02 42.87 $ 2,1592019 0.25 2.38 3.48 (3.75) 62.33 $ 1,6872018 (0.03) 2.38 3.09 4.82 111.99 $ 2,292
)
2017 0.18 2.32 4.48 7.97 105.55 $ 2,205
CLASS I SHARES
2022(d) 0.68(e) 1.02(e) 1.23(e) (7.41) 85.89 $ 408,4722021 0.53 1.09 1.21 37.72 119.96 $ 302,026
( )
2020 0.74 1.09 1.33 23.62 42.87 $ 83,2082019 1.57 1.09 1.44 (2.54) 62.33 $ 59,8332018 1.20 1.09 1.35 6.15 111.99 $ 55,989
)
2017 1.48 0.94 1.62 9.58 105.55 $ 59,951
Financial Highlights, Continued
Better World International Fund
Thornburg Equity Funds Semi-Annual Report | 117

PER SHARE PERFORMANCE (FOR A SHARE OUTSTANDING THROUGHOUT THE PERIOD)UNLESS OTHERWISENOTED, PERIODS AREFISCAL YEARS ENDED
SEPTEMBER 30,
NET ASSETVALUE,
BEGINNINGOF PERIOD
NETINVESTMENT
INCOME(LOSS)+
NET REALIZED &UNREALIZED
GAIN (LOSS) ONINVESTMENTS
TOTAL FROMINVESTMENTOPERATIONS
DIVIDENDSFROM NET
INVESTMENTINCOME
DIVIDENDSFROM NETREALIZED
GAINS
DIVIDENDSFROM
RETURN OFCAPITAL
TOTALDIVIDENDS
NET ASSETVALUE,END OFPERIOD
CLASS A SHARES(d)
2022(e) $ 30.27 (0.03) (4.46) (4.49) — (1.99) — (1.99) $ 23.792021 $ 28.37 (0.09) 2.37 2.28 — (0.38) — (0.38) $ 30.27
( ) ( ) ( ) ( ) ( )( ) ( ) ( ) ( ) ( )
2020 $ 21.46 (0.08) 7.10 7.02 —( )
(g) (0.11) — (0.11) $ 28.37( ) ( )
2019 $ 23.78 —( )
(h)))
(1.55) (1.55) (0.02) (0.75) — (0.77) $ 21.46( ) ( )
2018 $ 23.85 0.02 0.72 0.74 (0.05) (0.76) — (0.81) $ 23.78( ) ( ) ( ) ( ) ( )
2017 $ 19.22 (0.01) 4.65 4.64 (0.01) — — (0.01) $ 23.85( ) ( ) ( )( ) ( ) ( )
CLASS C SHARES
2022(e) $ 27.55 (0.13) (4.02) (4.15) — (1.99) — (1.99) $ 21.412021 $ 26.06 (0.31) 2.18 1.87 — (0.38) — (0.38) $ 27.55
( ) ( ) ( ) ( ) ( )( ) ( ) ( ) ( ) ( )
2020 $ 19.87 (0.25) 6.55 6.30 — (0.11) — (0.11) $ 26.06( ) ( ) ( )( ) ( ) ( )
2019 $ 22.21 (0.15) (1.44) (1.59) — (0.75) — (0.75) $ 19.87( ) ( ) ( )( ) ( ) ( )
2018 $ 22.50 (0.15) 0.67 0.52 (0.05) (0.76) — (0.81) $ 22.21( ) ( ) ( ) ( ) ( )( ) ( ) ( ) ( ) ( )
2017 $ 18.26 (0.13) 4.37 4.24 — — — — $ 22.50( ) ( ) ( ) ( )( ) ( ) ( ) ( )
CLASS I SHARES
2022(e) $ 31.32 0.01 (4.63) (4.62) — (1.99) — (1.99) $ 24.712021 $ 29.27 (0.01) 2.44 2.43 — (0.38) — (0.38) $ 31.32
( ) ( ) ( ) ( )( ) ( ) ( ) ( )
2020 $ 22.13 (0.01) 7.33 7.32 (0.07) (0.11) — (0.18) $ 29.27( ) ( ) ( )( ) ( ) ( )
2019 $ 24.51 0.07 (1.60) (1.53) (0.10) (0.75) — (0.85) $ 22.13( ) ( ) ( ) ( )( ) ( ) ( ) ( )
2018 $ 24.48 0.12 0.72 0.84 (0.05) (0.76) — (0.81) $ 24.51( ) ( ) ( ) ( ) ( )( ) ( ) ( ) ( ) ( )
2017 $ 19.69 0.10 4.75 4.85 (0.06) — — (0.06) $ 24.48( ) ( ) ( )( ) ( ) ( )
CLASS R3 SHARES
2022(e) $ 29.80 (0.05) (4.38) (4.43) — (1.99) — (1.99) $ 23.382021 $ 28.01 (0.16) 2.33 2.17 — (0.38) — (0.38) $ 29.80
( ) ( ) ( ) ( ) ( )( ) ( ) ( ) ( ) ( )
2020 $ 21.23 (0.13) 7.02 6.89 — (0.11) — (0.11) $ 28.01( ) ( ) ( )( ) ( ) ( )
2019 $ 23.54 (0.04) (1.52) (1.56) — (0.75) — (0.75) $ 21.23( ) ( ) ( )( ) ( ) ( )
2018 $ 23.66 (0.02) 0.71 0.69 (0.05) (0.76) — (0.81) $ 23.54( ) ( ) ( ) ( ) ( )( ) ( ) ( ) ( ) ( )
2017 $ 19.07 (0.01) 4.60 4.59 — — — — $ 23.66( ) ( ) ( ) ( )( ) ( ) ( ) ( )
CLASS R4 SHARES
2022(e) $ 30.02 (0.04) (4.42) (4.46) — (1.99) — (1.99) $ 23.572021 $ 28.18 (0.13) 2.35 2.22 — (0.38) — (0.38) $ 30.02
( ) ( ) ( ) ( ) ( )( ) ( ) ( ) ( ) ( )
2020 $ 21.34 (0.03) 6.98 6.95 — (0.11) — (0.11) $ 28.18( ) ( ) ( )( ) ( ) ( )
2019 $ 23.63 (0.02) (1.52) (1.54) — (0.75) — (0.75) $ 21.34( ) ( ) ( )( ) ( ) ( )
2018 $ 23.73 (0.01) 0.72 0.71 (0.05) (0.76) — (0.81) $ 23.63( ) ( ) ( ) ( ) ( )( ) ( ) ( ) ( ) ( )
2017 $ 19.11 0.01 4.61 4.62 —( ) ( )
(g)))
— — — $ 23.73) ( )
CLASS R5 SHARES
2022(e) $ 31.41 0.01 (4.64) (4.63) — (1.99) — (1.99) $ 24.792021 $ 29.35 (0.01) 2.45 2.44 — (0.38) — (0.38) $ 31.41
( ) ( ) ( ) ( )( ) ( ) ( ) ( )
2020 $ 22.19 (0.03) 7.37 7.34 (0.07) (0.11) — (0.18) $ 29.35( ) ( ) ( )( ) ( ) ( )
2019 $ 24.58 0.07 (1.61) (1.54) (0.10) (0.75) — (0.85) $ 22.19( ) ( ) ( ) ( )( ) ( ) ( ) ( )
2018 $ 24.54 0.10 0.75 0.85 (0.05) (0.76) — (0.81) $ 24.58( ) ( ) ( ) ( ) ( )( ) ( ) ( ) ( ) ( )
2017 $ 19.73 0.08 4.79 4.87 (0.06) — — (0.06) $ 24.54( ) ( ) ( )( ) ( ) ( )
CLASS R6 SHARES
2022(e) $ 31.54 0.03 (4.67) (4.64) — (1.99) — (1.99) $ 24.912021 $ 29.44 0.02 2.46 2.48 — (0.38) — (0.38) $ 31.54
( ) ( ) ( ) ( )( ) ( ) ( ) ( )
2020 $ 22.26 0.02 7.37 7.39 (0.10) (0.11) — (0.21) $ 29.44( ) ( )( ) ( )
2019 $ 24.65 0.10 (1.61) (1.51) (0.13) (0.75) — (0.88) $ 22.26( ) ( ) ( )( ) ( ) ( )
2018 $ 24.59 0.21 0.66 0.87 (0.05) (0.76) — (0.81) $ 24.65( ) ( ) ( ) ( ) ( )( ) ( ) ( ) ( ) ( )
2017 $ 19.77 0.09 4.81 4.90 (0.08) — — (0.08) $ 24.59( ) ( ) ( )( ) ( ) ( )
(a) Net investment income (loss) includes income from foreign withholding tax claims adjusted for IRS compliance fees and/or tax reclaim collection fees. Without these proceeds, the NetInvestment Income (Loss) ratios for 2022 would have been: Class A, (0.29)%; Class C, (1.16)%; Class I, 0.02%; Class R3, (0.47)%; Class R4, (0.34)%; Class R5, 0.03%; Class R6, 0.15%and 2021 would have been: Class A, (0.37)%; Class C, (1.18)%; Class I, (0.10)%; Class R3, (0.60)%; Class R4, (0.51)%; Class R5, (0.11)%; Class R6, (0.02)%.
(b) Net expenses include tax reclaim collection fees that are excluded from the expense limitation agreement. If such expenses and fees had not occurred, the Expenses After ExpenseReductions ratios for 2021 would have been: Class A, 1.26%; Class C, 2.07%; Class I, 0.99%; Class R3, 1.50%; Class R4, 1.40%; Class R5, 0.99%; Class R6, 0.89%.
(c) Not annualized for periods less than one year.(d) Sales loads are not reflected in computing total return.(e) Unaudited Six Month Period Ended March 31.(f) Annualized.(g) Dividends from net investment income per share were less than $(0.01).(h) Net investment income (loss) was less than $0.01 per share.+ Based on weighted average shares outstanding.
See notes to financial statements.
Financial HighlightsInternational Growth Fund
118 | Thornburg Equity Funds Semi-Annual Report

RATIOS TO AVERAGE NET ASSETS SUPPLEMENTAL DATAUNLESS OTHERWISENOTED, PERIODS AREFISCAL YEARS ENDED
SEPTEMBER 30,NET INVESTMENT
INCOME (LOSS) (%)(a)
EXPENSES, AFTEREXPENSE
REDUCTIONS (%)(b)
EXPENSES,BEFORE EXPENSEREDUCTIONS (%)
TOTALRETURN (%)(c)
PORTFOLIOTURNOVERRATE (%)(c)
NETASSETS
AT END OF PERIOD(THOUSANDS)
CLASS A SHARES(d)
2022(e) (0.21)(f) 1.31(f) 1.32(f) (16.07) 30.27 $ 124,3172021 (0.29) 1.27 1.27 8.07 34.41 $ 154,613
)
2020 (0.35) 1.31 1.31 32.88 35.88 $ 139,4292019 0.02 1.32 1.32 (6.36) 25.83 $ 107,1962018 0.09 1.32 1.32 3.28 33.28 $ 127,863
)
2017 (0.05) 1.42 1.43 24.12 60.88 $ 121,989
CLASS C SHARES
2022(e) (1.09)(f) 2.16(f) 2.17(f) (16.45) 30.27 $ 18,6572021 (1.10) 2.07 2.07 7.21 34.41 $ 27,864
)
2020 (1.13) 2.07 2.07 31.87 35.88 $ 42,1642019 (0.78) 2.08 2.08 (7.04) 25.83 $ 47,9802018 (0.65) 2.08 2.08 2.47 33.28 $ 77,262
)
2017 (0.69) 2.15 2.16 23.22 60.88 $ 90,689
CLASS I SHARES
2022(e) 0.09(f) 0.99(f) 1.03(f) (15.94) 30.27 $ 1,126,2782021 (0.02) 1.00 1.00 8.34 34.41 $ 1,584,102
)
2020 (0.03) 0.99 1.02 33.31 35.88 $ 1,454,3222019 0.34 0.99 1.03 (6.02) 25.83 $ 1,203,5382018 0.47 0.99 0.99 3.61 33.28 $ 1,470,211
)
2017 0.50 0.99 1.03 24.66 60.88 $ 1,128,804
CLASS R3 SHARES
2022(e) (0.39)(f) 1.50(f) 2.14(f) (16.13) 30.27 $ 6,0512021 (0.52) 1.51 1.89 7.78 34.41 $ 7,643
)
2020 (0.56) 1.50 2.03 32.61 35.88 $ 6,4242019 (0.17) 1.50 2.02 (6.50) 25.83 $ 6,2742018 (0.10) 1.50 1.98 3.08 33.28 $ 8,426
)
2017 (0.03) 1.50 2.08 24.07 60.88 $ 10,525
CLASS R4 SHARES
2022(e) (0.27)(f) 1.40(f) 1.87(f) (16.11) 30.27 $ 9,1342021 (0.42) 1.41 1.63 7.91 34.41 $ 9,903
)
2020 (0.44) 1.40 1.45 32.73 35.88 $ 8,4362019 (0.09) 1.40 1.91 (6.39) 25.83 $ 7,5152018 (0.02) 1.40 1.88 3.16 33.28 $ 12,644
)
2017 0.07 1.40 1.84 24.19 60.88 $ 17,200
CLASS R5 SHARES
2022(e) 0.11(f) 0.99(f) 1.39(f) (15.93) 30.27 $ 28,2392021 (0.02) 1.00 1.27 8.35 34.41 $ 36,396
)
2020 (0.03) 0.99 1.31 33.31 35.88 $ 34,1522019 0.32 0.99 1.29 (6.05) 25.83 $ 28,7292018 0.40 0.99 1.25 3.64 33.28 $ 38,052
)
2017 0.40 0.99 1.28 24.68 60.88 $ 45,591
CLASS R6 SHARES
2022(e) 0.23(f) 0.89(f) 0.99(f) (15.89) 30.27 $ 89,0272021 0.06 0.90 0.96 8.46 34.41 $ 107,884
)
2020 0.07 0.89 0.99 33.42 35.88 $ 61,1302019 0.47 0.89 0.99 (5.91) 25.83 $ 44,9232018 0.82 0.89 0.99 3.72 33.28 $ 51,091
)
2017 0.44 0.89 1.03 24.82 60.88 $ 12,261
Financial Highlights, Continued
International Growth Fund
Thornburg Equity Funds Semi-Annual Report | 119

PER SHARE PERFORMANCE (FOR A SHARE OUTSTANDING THROUGHOUT THE PERIOD)UNLESS OTHERWISENOTED, PERIODS AREFISCAL YEARS ENDED
SEPTEMBER 30,
NET ASSETVALUE,
BEGINNINGOF PERIOD
NETINVESTMENT
INCOME(LOSS)+
NET REALIZED &UNREALIZED
GAIN (LOSS) ONINVESTMENTS
TOTAL FROMINVESTMENTOPERATIONS
DIVIDENDSFROM NET
INVESTMENTINCOME
DIVIDENDSFROM NETREALIZED
GAINS
DIVIDENDSFROM
RETURN OFCAPITAL
TOTALDIVIDENDS
NET ASSETVALUE,END OFPERIOD
CLASS A SHARES(d)
2022(e) $ 27.58 0.03 (3.41) (3.38) — — — — $ 24.202021 $ 22.92 —(g) 4.66 4.66 — — — — $ 27.58
) ( )
2020 $ 20.43 0.03 2.69 2.72 (0.23) — — (0.23) $ 22.922019 $ 19.13 0.23 1.22 1.45 (0.15) — — (0.15) $ 20.43
( ) ( )( ) ( )
2018 $ 19.86 0.11 (0.84) (0.73) — — — — $ 19.13( ) ( )( ) ( )
2017 $ 16.98 0.09 2.89 2.98 (0.10) — — (0.10) $ 19.86( ) ( )( ) ( )
CLASS C SHARES
2022(e) $ 25.93 (0.08) (3.20) (3.28) — — — — $ 22.652021 $ 21.71 (0.21) 4.43 4.22 — — — — $ 25.93
( ) ( ) ( )( ) ( ) ( )
2020 $ 19.35 (0.13) 2.54 2.41 (0.05) — — (0.05) $ 21.71( )( )
2019 $ 18.10 0.06 1.19 1.25 — — — — $ 19.35( ) ( ) ( )( ) ( ) ( )
2018 $ 18.93 (0.05) (0.78) (0.83) — — — — $ 18.102017 $ 16.26 (0.03) 2.74 2.71 (0.04) — — (0.04) $ 18.93
( ) ( ) ( )( ) ( ) ( )
CLASS I SHARES
2022(e) $ 28.22 0.08 (3.50) (3.42) — — — — $ 24.802021 $ 23.40 0.10 4.76 4.86 (0.04) — — (0.04) $ 28.22
( ) ( )( ) ( )
2020 $ 20.86 0.11 2.74 2.85 (0.31) — — (0.31) $ 23.40( ) ( )( ) ( )
2019 $ 19.55 0.31 1.24 1.55 (0.24) — — (0.24) $ 20.86( ) ( )( ) ( )
2018 $ 20.21 0.19 (0.85) (0.66) — — — — $ 19.55( ) ( )( ) ( )
2017 $ 17.26 0.19 2.92 3.11 (0.16) — — (0.16) $ 20.21( ) ( )( ) ( )
CLASS R5 SHARES
2022(e) $ 28.12 0.07 (3.47) (3.40) — — — — $ 24.722021 $ 23.33 0.10 4.73 4.83 (0.04) — — (0.04) $ 28.12
( ) ( )( ) ( )
2020 $ 20.79 0.10 2.75 2.85 (0.31) — — (0.31) $ 23.33( ) ( )( ) ( )
2019 $ 19.48 0.27 1.28 1.55 (0.24) — — (0.24) $ 20.79( ) ( )( ) ( )
2018 $ 20.14 0.19 (0.85) (0.66) — — — — $ 19.48( ) ( )( ) ( )
2017 $ 17.20 0.18 2.92 3.10 (0.16) — — (0.16) $ 20.14( ) ( )( ) ( )
CLASS R6 SHARES
2022(e) $ 28.26 0.09 (3.50) (3.41) — — — — $ 24.852021 $ 23.43 0.12 4.78 4.90 (0.07) — — (0.07) $ 28.26
( ) ( )( ) ( )
2020 $ 20.88 0.13 2.75 2.88 (0.33) — — (0.33) $ 23.43( ) ( )( ) ( )
2019 $ 19.57 0.33 1.24 1.57 (0.26) — — (0.26) $ 20.88( ) ( )( ) ( )
2018 $ 20.21 0.24 (0.88) (0.64) — — — — $ 19.57( ) ( )( ) ( )
2017 $ 17.25 0.20 2.93 3.13 (0.17) — — (0.17) $ 20.21( ) ( )( ) ( )
(a) Net investment income (loss) includes income from foreign withholding tax claims adjusted for IRS compliance fees and/or tax reclaim collection fees. Without these proceeds, the NetInvestment Income (Loss) ratios for 2022 would have been: Class A, 0.19%; Class C, (0.69)%; Class I, 0.55%; Class R5, 0.55%; Class R6, 0.65% and 2021 would have been: Class A,(0.02)%; Class C, (0.82)%; Class I, 0.33%; Class R5, 0.34%; Class R6, 0.42%.
(b) Net expenses include tax reclaim collection fees that are excluded from the expense limitation agreement. If such expenses and fees had not occurred, the Expenses After ExpenseReductions ratios for 2021 would have been: Class A, 1.43%; Class C, 2.19%; Class I, 1.09%; Class R5, 1.09%; Class R6, 0.99%.
(c) Not annualized for periods less than one year.(d) Sales loads are not reflected in computing total return.(e) Unaudited Six Month Period Ended March 31.(f) Annualized.(g) Net investment income (loss) was less than $0.01 per share.(h) The total return based on the NAV which reflects adjustments in accordance with U.S. GAAP is 12.47% for 2020 and 19.44% for 2021.+ Based on weighted average shares outstanding.
See notes to financial statements.
Financial HighlightsDeveloping World Fund
120 | Thornburg Equity Funds Semi-Annual Report
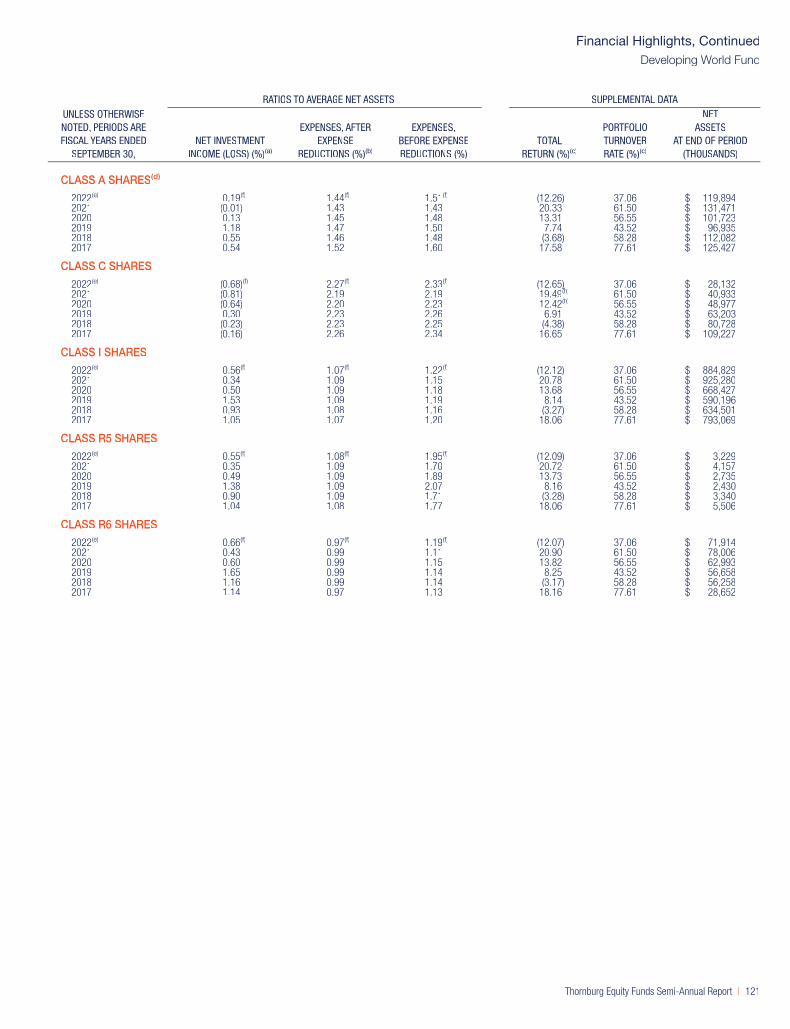
RATIOS TO AVERAGE NET ASSETS SUPPLEMENTAL DATAUNLESS OTHERWISENOTED, PERIODS AREFISCAL YEARS ENDED
SEPTEMBER 30,NET INVESTMENT
INCOME (LOSS) (%)(a)
EXPENSES, AFTEREXPENSE
REDUCTIONS (%)(b)
EXPENSES,BEFORE EXPENSEREDUCTIONS (%)
TOTALRETURN (%)(c)
PORTFOLIOTURNOVERRATE (%)(c)
NETASSETS
AT END OF PERIOD(THOUSANDS)
CLASS A SHARES(d)
2022(e) 0.19(f) 1.44(f) 1.51(f) (12.26) 37.06 $ 119,8942021 (0.01) 1.43 1.43 20.33 61.50 $ 131,471
)
2020 0.13 1.45 1.48 13.31 56.55 $ 101,7232019 1.18 1.47 1.50 7.74 43.52 $ 96,9352018 0.55 1.46 1.48 (3.68) 58.28 $ 112,0822017 0.54 1.52 1.60 17.58 77.61 $ 125,427
( )
CLASS C SHARES
2022(e) (0.68)(f) 2.27(f) 2.33(f) (12.65) 37.06 $ 28,1322021 (0.81) 2.19 2.19 19.49(h)
))61.50 $ 40,933
2020 (0.64) 2.20 2.23 12.42(h) 56.55 $ 48,9772019 0.30 2.23 2.26 6.91 43.52 $ 63,2032018 (0.23) 2.23 2.25 (4.38) 58.28 $ 80,7282017 (0.16) 2.26 2.34 16.65 77.61 $ 109,227
( )
CLASS I SHARES
2022(e) 0.56(f) 1.07(f) 1.22(f) (12.12) 37.06 $ 884,8292021 0.34 1.09 1.15 20.78 61.50 $ 925,280
)
2020 0.50 1.09 1.18 13.68 56.55 $ 668,4272019 1.53 1.09 1.19 8.14 43.52 $ 590,1962018 0.93 1.08 1.16 (3.27) 58.28 $ 634,5012017 1.05 1.07 1.20 18.06 77.61 $ 793,069
( )
CLASS R5 SHARES
2022(e) 0.55(f) 1.08(f) 1.95(f) (12.09) 37.06 $ 3,2292021 0.35 1.09 1.70 20.72 61.50 $ 4,157
)
2020 0.49 1.09 1.89 13.73 56.55 $ 2,7352019 1.38 1.09 2.07 8.16 43.52 $ 2,4302018 0.90 1.09 1.71 (3.28) 58.28 $ 3,3402017 1.04 1.08 1.77 18.06 77.61 $ 5,506
( )
CLASS R6 SHARES
2022(e) 0.66(f) 0.97(f) 1.19(f) (12.07) 37.06 $ 71,9142021 0.43 0.99 1.11 20.90 61.50 $ 78,006
)
2020 0.60 0.99 1.15 13.82 56.55 $ 62,9932019 1.65 0.99 1.14 8.25 43.52 $ 56,6582018 1.16 0.99 1.14 (3.17) 58.28 $ 56,2582017 1.14 0.97 1.13 18.16 77.61 $ 28,652
( )
Financial Highlights, Continued
Developing World Fund
Thornburg Equity Funds Semi-Annual Report | 121

PER SHARE PERFORMANCE (FOR A SHARE OUTSTANDING THROUGHOUT THE PERIOD)UNLESS OTHERWISENOTED, PERIODS AREFISCAL YEARS ENDED
SEPTEMBER 30,
NET ASSETVALUE,
BEGINNINGOF PERIOD
NETINVESTMENT
INCOME(LOSS)+
NET REALIZED &UNREALIZED
GAIN (LOSS) ONINVESTMENTS
TOTAL FROMINVESTMENTOPERATIONS
DIVIDENDSFROM NET
INVESTMENTINCOME
DIVIDENDSFROM NETREALIZED
GAINS
DIVIDENDSFROM
RETURN OFCAPITAL
TOTALDIVIDENDS
NET ASSETVALUE,END OFPERIOD
CLASS A SHARES(d)
2022(e) $ 97.60 (0.18) (0.11) (0.29) (0.30) (26.35) — (26.65) $ 70.662021 $ 74.81 (0.05) 22.84 22.79 — — — — $ 97.60
( ) ( ) ( ) ( ) ( ) ( )( ) ( ) ( ) ( ) ( ) ( )
2020 $ 71.81 0.07(
3.11 3.18 (0.18) — — (0.18) $ 74.812019 $ 72.46 0.24 (0.60) (0.36) (0.29) — — (0.29) $ 71.81
( ) ( )
2018 $ 65.26 0.39 7.17 7.56 (0.36) — — (0.36) $ 72.46) ( ) ( ) ( )
2017 $ 54.08 0.16 11.04 11.20 (0.02) — — (0.02) $ 65.26( ) ( )
CLASS C SHARES
2022(e) $ 87.40 (0.46) 0.07 (0.39) — (26.35) — (26.35) $ 60.662021 $ 67.54 (0.71) 20.57 19.86 — — — — $ 87.40
( ) ( ) ( ) ( )( ) ( ) ( ) ( )
2020 $ 65.19 (0.45) 2.80 2.35 — — — — $ 67.54( )( )
2019 $ 66.03 (0.31) (0.53) (0.84) — — — — $ 65.19( )( )
2018 $ 59.87 (0.11) 6.52 6.41 (0.25) — — (0.25) $ 66.03( ) ( ) ( )( ) ( ) ( )
2017 $ 49.97 (0.27) 10.17 9.90 — — — — $ 59.87( ) ( ) ( )( ) ( ) ( )
CLASS I SHARES
2022(e) $ 100.99 (0.04) (0.16) (0.20) (0.55) (26.35) — (26.90) $ 73.892021 $ 77.16 0.25 23.58 23.83 — — — — $ 100.99
( ) ( ) ( ) ( ) ( ) ( )( ) ( ) ( ) ( ) ( ) ( )
2020 $ 74.04 0.33 3.22 3.55 (0.43) — — (0.43) $ 77.162019 $ 74.70 0.49 (0.65) (0.16) (0.50) — — (0.50) $ 74.04
( ) ( )
2018 $ 67.10 0.64 7.38 8.02 (0.42) — — (0.42) $ 74.70) ( ) ( ) ( )
2017 $ 55.58 0.42 11.35 11.77 (0.25) — — (0.25) $ 67.10( ) ( )
CLASS R3 SHARES
2022(e) $ 97.10 (0.18) (0.09) (0.27) (0.26) (26.35) — (26.61) $ 70.222021 $ 74.46 (0.08) 22.72 22.64 — — — — $ 97.10
( ) ( ) ( ) ( ) ( ) ( )( ) ( ) ( ) ( ) ( ) ( )
2020 $ 71.44 0.06(
3.10 3.16 (0.14) — — (0.14) $ 74.462019 $ 72.02 0.23 (0.59) (0.36) (0.22) — — (0.22) $ 71.44
( ) ( )
2018 $ 64.88 0.39 7.11 7.50 (0.36) — — (0.36) $ 72.02) ( ) ( ) ( )
2017 $ 53.76 0.18 10.97 11.15 (0.03) — — (0.03) $ 64.88( ) ( )
CLASS R4 SHARES
2022(e) $ 98.30 (0.14) (0.12) (0.26) (0.33) (26.35) — (26.68) $ 71.362021 $ 75.30 0.01 22.99 23.00 — — — — $ 98.30
( ) ( ) ( ) ( ) ( ) ( )( ) ( ) ( ) ( ) ( ) ( )
2020 $ 72.25 0.12 3.14 3.26 (0.21) — — (0.21) $ 75.302019 $ 72.83 0.30 (0.60) (0.30) (0.28) — — (0.28) $ 72.25
( ) ( )
2018 $ 65.55 0.47 7.19 7.66 (0.38) — — (0.38) $ 72.83) ( ) ( ) ( )
2017 $ 54.31 0.25 11.08 11.33 (0.09) — — (0.09) $ 65.55( ) ( )
CLASS R5 SHARES
2022(e) $ 100.84 (0.05) (0.15) (0.20) (0.55) (26.35) — (26.90) $ 73.742021 $ 77.05 0.26 23.53 23.79 — — — — $ 100.84
( ) ( ) ( ) ( ) ( ) ( )( ) ( ) ( ) ( ) ( ) ( )
2020 $ 73.93 0.33 3.22 3.55 (0.43) — — (0.43) $ 77.052019 $ 74.60 0.49 (0.66) (0.17) (0.50) — — (0.50) $ 73.93
( ) ( )
2018 $ 67.01 0.63 7.38 8.01 (0.42) — — (0.42) $ 74.60) ( ) ( ) ( )
2017 $ 55.50 0.41 11.35 11.76 (0.25) — — (0.25) $ 67.01( ) ( )
(a) Net investment income (loss) includes income from foreign withholding tax claims adjusted for IRS compliance fees and/or tax reclaim collection fees. Without these proceeds, the NetInvestment Income (Loss) ratios for 2021 would have been: Class A, (0.15)%; Class C, (0.95)%; Class I, 0.17%; Class R3, (0.17)%; Class R4, (0.09)%; Class R5, 0.18%.
(b) Net expenses include tax reclaim collection fees that are excluded from the expense limitation agreement. If such expenses and fees had not occurred, the Expenses After ExpenseReductions ratios for 2021 would have been: Class A, 1.16%; Class C, 1.98%; Class I, 0.84%; Class R3, 1.20%; Class R4, 1.10%; Class R5, 0.84%.
(c) Not annualized for periods less than one year.(d) Sales loads are not reflected in computing total return.(e) Unaudited Six Month Period Ended March 31.(f) Annualized.(g) The Fund modified its strategy in December 2020 and due to the change, the Fund experienced a higher portfolio turnover from higher purchases and sales.+ Based on weighted average shares outstanding.
See notes to financial statements.
Financial HighlightsSmall/Mid Cap Core Fund
122 | Thornburg Equity Funds Semi-Annual Report

RATIOS TO AVERAGE NET ASSETS SUPPLEMENTAL DATAUNLESS OTHERWISENOTED, PERIODS AREFISCAL YEARS ENDED
SEPTEMBER 30,NET INVESTMENT
INCOME (LOSS) (%)(a)
EXPENSES, AFTEREXPENSE
REDUCTIONS (%)(b)
EXPENSES,BEFORE EXPENSEREDUCTIONS (%)
TOTALRETURN (%)(c)
PORTFOLIOTURNOVERRATE (%)(c)
NETASSETS
AT END OF PERIOD(THOUSANDS)
CLASS A SHARES(d)
2022(e) (0.47)(f) 1.24(f) 1.34(f) (1.90) 21.28 $ 398,4842021 (0.06) 1.18 1.33 30.46 135.80(g) $ 454,4882020 0.10 1.33 1.34 4.42 20.39 $ 388,8952019 0.35 1.33 1.33 (0.42) 24.94 $ 425,2182018 0.56 1.33 1.33 11.62 57.33 $ 473,7402017 0.27 1.39 1.39 20.72 43.53 $ 383,118
CLASS C SHARES
2022(e) (1.37)(f) 2.13(f) 2.24(f) (2.34) 21.28 $ 12,1392021 (0.86) 2.00 2.15 29.40 135.80(g) $ 17,3642020 (0.69) 2.12 2.12 3.59 20.39 $ 22,9512019 (0.50) 2.19 2.19 (1.26) 24.94 $ 35,9342018 (0.17) 2.11 2.11 10.73 57.33 $ 52,0232017 (0.49) 2.14 2.14 19.81 43.53 $ 160,663
CLASS I SHARES
2022(e) (0.11)(f) 0.87(f) 1.08(f) (1.71) 21.28 $ 284,8902021 0.26 0.86 1.08 30.88 135.80(g) $ 332,2352020 0.44 0.99 1.09 4.77 20.39 $ 287,7462019 0.70 0.99 1.07 (0.07) 24.94 $ 360,0702018 0.90 0.99 1.06 12.00 57.33 $ 422,3022017 0.68 0.99 1.06 21.20 43.53 $ 368,790
CLASS R3 SHARES
2022(e) (0.47)(f) 1.23(f) 1.82(f) (1.89) 21.28 $ 19,7002021 (0.08) 1.22 1.81 30.41 135.80(g) $ 23,5942020 0.09 1.35 1.73 4.40 20.39 $ 24,9392019 0.34 1.35 1.79 (0.43) 24.94 $ 29,6012018 0.57 1.35 1.78 11.60 57.33 $ 39,2112017 0.30 1.35 1.82 20.75 43.53 $ 45,668
CLASS R4 SHARES
2022(e) (0.37)(f) 1.13(f) 1.96(f) (1.85) 21.28 $ 3,8712021 0.01 1.12 1.78 30.54 135.80(g) $ 4,3862020 0.17 1.25 1.74 4.50 20.39 $ 4,5482019 0.44 1.25 1.75 (0.33) 24.94 $ 6,4342018 0.68 1.25 1.77 11.72 57.33 $ 7,8682017 0.42 1.24 1.78 20.87 43.53 $ 10,159
CLASS R5 SHARES
2022(e) (0.11)(f) 0.87(f) 1.53(f) (1.72) 21.28 $ 11,6212021 0.27 0.86 1.48 30.88 135.80(g) $ 14,7102020 0.45 0.99 1.43 4.76 20.39 $ 14,1562019 0.70 0.99 1.43 (0.07) 24.94 $ 18,1192018 0.89 0.99 1.38 12.00 57.33 $ 19,0852017 0.68 0.99 1.42 21.21 43.53 $ 17,060
Financial Highlights, Continued
Small/Mid Cap Core Fund
Thornburg Equity Funds Semi-Annual Report | 123

PER SHARE PERFORMANCE (FOR A SHARE OUTSTANDING THROUGHOUT THE PERIOD)UNLESS OTHERWISENOTED, PERIODS AREFISCAL YEARS ENDED
SEPTEMBER 30,
NET ASSETVALUE,
BEGINNINGOF PERIOD
NETINVESTMENT
INCOME(LOSS)+
NET REALIZED &UNREALIZED
GAIN (LOSS) ONINVESTMENTS
TOTAL FROMINVESTMENTOPERATIONS
DIVIDENDSFROM NET
INVESTMENTINCOME
DIVIDENDSFROM NETREALIZED
GAINS
DIVIDENDSFROM
RETURN OFCAPITAL
TOTALDIVIDENDS
NET ASSETVALUE,END OFPERIOD
CLASS A SHARES(b)
2022(c) $ 51.77 (0.20) (5.58) (5.78) — (17.88) — (17.88) $ 28.112021 $ 48.17 (0.51) 7.33 6.82 — (3.22) — (3.22) $ 51.77
( ) ( ) ( ) ( ) ( )( ) ( ) ( ) ( ) ( )
2020 $ 39.37 (0.30) 12.72 12.42 — (3.62) — (3.62) $ 48.17( ) ( ) ( )( ) ( ) ( )
2019 $ 40.43 (0.17) (0.89) (1.06) —( )
— — — $ 39.37) ( )
2018 $ 32.46 (0.21) 8.18 7.97 —( ) ( ) ( )
— — — $ 40.432017 $ 28.22 (0.24) 4.48 4.24 —
( )— — — $ 32.46
CLASS C SHARES
2022(c) $ 42.67 (0.28) (3.91) (4.19) — (17.88) — (17.88) $ 20.602021 $ 40.53 (0.75) 6.11 5.36 — (3.22) — (3.22) $ 42.67
( ) ( ) ( ) ( ) ( )( ) ( ) ( ) ( ) ( )
2020 $ 33.91 (0.51) 10.75 10.24 — (3.62) — (3.62) $ 40.53( ) ( ) ( )( ) ( ) ( )
2019 $ 35.11 (0.42) (0.78) (1.20) —( )
— — — $ 33.91) ( )
2018 $ 28.43 (0.42) 7.10 6.68 —( ) ( ) ( )
— — — $ 35.112017 $ 24.90 (0.41) 3.94 3.53 —
( )— — — $ 28.43
CLASS I SHARES
2022(c) $ 56.75 (0.15) (6.50) (6.65) — (17.88) — (17.88) $ 32.222021 $ 52.36 (0.38) 7.99 7.61 — (3.22) — (3.22) $ 56.75
( ) ( ) ( ) ( ) ( )( ) ( ) ( ) ( ) ( )
2020 $ 42.35 (0.17) 13.80 13.63 — (3.62) — (3.62) $ 52.36( ) ( ) ( )( ) ( ) ( )
2019 $ 43.33 (0.03) (0.95) (0.98) —( )
— — — $ 42.35) ( )
2018 $ 34.67 (0.08) 8.74 8.66 —( ) ( ) ( )
— — — $ 43.332017 $ 30.01 (0.12) 4.78 4.66 —
( )— — — $ 34.67
CLASS R3 SHARES
2022(c) $ 51.09 (0.22) (5.45) (5.67) — (17.88) — (17.88) $ 27.542021 $ 47.67 (0.60) 7.24 6.64 — (3.22) — (3.22) $ 51.09
( ) ( ) ( ) ( ) ( )( ) ( ) ( ) ( ) ( )
2020 $ 39.05 (0.36) 12.60 12.24 — (3.62) — (3.62) $ 47.67( ) ( ) ( )( ) ( ) ( )
2019 $ 40.16 (0.23) (0.88) (1.11) —( )
— — — $ 39.05) ( )
2018 $ 32.30 (0.26) 8.12 7.86 —( ) ( ) ( )
— — — $ 40.162017 $ 28.10 (0.27) 4.47 4.20 —
( )— — — $ 32.30
CLASS R4 SHARES
2022(c) $ 51.86 (0.20) (5.60) (5.80) — (17.88) — (17.88) $ 28.182021 $ 48.30 (0.55) 7.33 6.78 — (3.22) — (3.22) $ 51.86
( ) ( ) ( ) ( ) ( )( ) ( ) ( ) ( ) ( )
2020 $ 39.49 (0.32) 12.75 12.43 — (3.62) — (3.62) $ 48.30( ) ( ) ( )( ) ( ) ( )
2019 $ 40.56 (0.19) (0.88) (1.07) —( )
— — — $ 39.49) ( )
2018 $ 32.59 (0.23) 8.20 7.97 —( ) ( ) ( )
— — — $ 40.562017 $ 28.33 (0.24) 4.50 4.26 —
( )— — — $ 32.59
CLASS R5 SHARES
2022(c) $ 56.68 (0.15) (6.48) (6.63) — (17.88) — (17.88) $ 32.172021 $ 52.30 (0.38) 7.98 7.60 — (3.22) — (3.22) $ 56.68
( ) ( ) ( ) ( ) ( )( ) ( ) ( ) ( ) ( )
2020 $ 42.31 (0.16) 13.77 13.61 — (3.62) — (3.62) $ 52.30( ) ( ) ( )( ) ( ) ( )
2019 $ 43.29 (0.04) (0.94) (0.98) —( )
— — — $ 42.31) ( )
2018 $ 34.64 (0.08) 8.73 8.65 —( ) ( ) ( )
— — — $ 43.292017 $ 29.98 (0.12) 4.78 4.66 —
( )— — — $ 34.64
(a) Not annualized for periods less than one year.(b) Sales loads are not reflected in computing total return.(c) Unaudited Six Month Period Ended March 31.(d) Annualized.(e) The Fund modified its strategy in December 2020 and due to the change, the Fund experienced a higher portfolio turnover from higher purchases and sales.+ Based on weighted average shares outstanding.
See notes to financial statements.
Financial HighlightsSmall/Mid Cap Growth Fund
124 | Thornburg Equity Funds Semi-Annual Report

RATIOS TO AVERAGE NET ASSETS SUPPLEMENTAL DATAUNLESS OTHERWISENOTED, PERIODS AREFISCAL YEARS ENDED
SEPTEMBER 30,NET INVESTMENT
INCOME (LOSS) (%)
EXPENSES, AFTEREXPENSE
REDUCTIONS (%)
EXPENSES,BEFORE EXPENSEREDUCTIONS (%)
TOTALRETURN (%)(a)
PORTFOLIOTURNOVERRATE (%)(a)
NETASSETS
AT END OF PERIOD(THOUSANDS)
CLASS A SHARES(b)
2022(c) (1.15)(d) 1.25(d) 1.36(d) (18.79) 30.28 $ 225,8242021 (0.99) 1.16 1.31 14.69 161.43(e) $ 340,5452020 (0.72) 1.33 1.33 34.37 43.82 $ 326,0352019 (0.44) 1.35 1.35 (2.62) 40.69 $ 259,7992018 (0.57) 1.34 1.34 24.55 54.98 $ 296,4292017 (0.79) 1.40 1.40 15.02 72.03 $ 187,062
CLASS C SHARES
2022(c) (2.05)(d) 2.15(d) 2.27(d) (19.18) 30.28 $ 10,5672021 (1.76) 1.94 2.09 13.80 161.43(e) $ 23,4332020 (1.47) 2.09 2.09 33.38 43.82 $ 36,9172019 (1.27) 2.18 2.18 (3.42) 40.69 $ 36,8412018 (1.33) 2.14 2.14 23.50 54.98 $ 53,9032017 (1.56) 2.16 2.16 14.18 72.03 $ 130,165
CLASS I SHARES
2022(c) (0.77)(d) 0.87(d) 1.07(d) (18.64) 30.28 $ 173,7392021 (0.67) 0.84 1.04 15.04 161.43(e) $ 274,3572020 (0.37) 0.99 1.06 34.84 43.82 $ 277,9912019 (0.08) 0.99 1.05 (2.26) 40.69 $ 254,7212018 (0.20) 0.99 1.05 24.98 54.98 $ 286,1522017 (0.37) 0.99 1.05 15.53 72.03 $ 234,922
CLASS R3 SHARES
2022(c) (1.28)(d) 1.38(d) 1.86(d) (18.83) 30.28 $ 20,0672021 (1.17) 1.35 1.79 14.45 161.43(e) $ 26,8812020 (0.88) 1.50 1.71 34.17 43.82 $ 33,5052019 (0.60) 1.50 1.80 (2.76) 40.69 $ 30,0842018 (0.72) 1.50 1.80 24.33 54.98 $ 40,9632017 (0.90) 1.50 1.84 14.95 72.03 $ 47,064
CLASS R4 SHARES
2022(c) (1.18)(d) 1.28(d) 2.66(d) (18.79) 30.28 $ 1,5562021 (1.07) 1.25 2.17 14.56 161.43(e) $ 2,0762020 (0.78) 1.40 2.00 34.28 43.82 $ 2,7712019 (0.50) 1.40 1.91 (2.64) 40.69 $ 4,1832018 (0.62) 1.40 1.97 24.46 54.98 $ 4,4842017 (0.80) 1.40 2.00 15.04 72.03 $ 5,330
CLASS R5 SHARES
2022(c) (0.77)(d) 0.87(d) 1.42(d) (18.62) 30.28 $ 14,5442021 (0.67) 0.84 1.31 15.04 161.43(e) $ 22,9452020 (0.37) 0.99 1.26 34.83 43.82 $ 22,6912019 (0.09) 0.99 1.39 (2.26) 40.69 $ 19,9842018 (0.21) 0.99 1.33 24.97 54.98 $ 31,4332017 (0.38) 0.99 1.34 15.54 72.03 $ 32,197
Financial Highlights, Continued
Small/Mid Cap Growth Fund
Thornburg Equity Funds Semi-Annual Report | 125

PER SHARE PERFORMANCE (FOR A SHARE OUTSTANDING THROUGHOUT THE PERIOD)UNLESS OTHERWISENOTED, PERIODS AREFISCAL YEARS ENDED
SEPTEMBER 30,
NET ASSETVALUE,
BEGINNINGOF PERIOD
NETINVESTMENT
INCOME(LOSS)+
NET REALIZED &UNREALIZED
GAIN (LOSS) ONINVESTMENTS
TOTAL FROMINVESTMENTOPERATIONS
DIVIDENDSFROM NET
INVESTMENTINCOME
DIVIDENDSFROM NETREALIZED
GAINS
DIVIDENDSFROM
RETURN OFCAPITAL
TOTALDIVIDENDS
NET ASSETVALUE,END OFPERIOD
CLASS A SHARES(d)
2022(e) $ 22.96 0.48 0.84 1.32 (0.62) — — (0.62) $ 23.662021 $ 18.70 1.19 4.19 5.38 (1.12) — — (1.12) $ 22.96
( ) ( )
2020 $ 21.72 0.86 (2.98) (2.12) (0.90) — — (0.90) $ 18.70( ) ( )
2019 $ 21.80 0.93 (0.07) 0.86 (0.94) — — (0.94) $ 21.72( ) ( ) ( ) ( )( ) ( ) ( ) ( )
2018 $ 21.50 0.92 0.30 1.22 (0.92) — — (0.92) $ 21.80) ( ) ( )
2017 $ 19.82 0.92 1.61 2.53 (0.85) — — (0.85) $ 21.50( ) ( )
CLASS C SHARES
2022(e) $ 22.93 0.38 0.85 1.23 (0.53) — — (0.53) $ 23.632021 $ 18.68 1.00 4.19 5.19 (0.94) — — (0.94) $ 22.93
( ) ( )
2020 $ 21.69 0.69 (2.95) (2.26) (0.75) — — (0.75) $ 18.68( ) ( )
2019 $ 21.78 0.76 (0.06) 0.70 (0.79) — — (0.79) $ 21.69( ) ( ) ( ) ( )( ) ( ) ( ) ( )
2018 $ 21.48 0.76 0.30 1.06 (0.76) — — (0.76) $ 21.78) ( ) ( )
2017 $ 19.81 0.78 1.60 2.38 (0.71) — — (0.71) $ 21.48( ) ( )
CLASS I SHARES
2022(e) $ 23.13 0.52 0.85 1.37 (0.66) — — (0.66) $ 23.842021 $ 18.84 1.25 4.22 5.47 (1.18) — — (1.18) $ 23.13
( ) ( )
2020 $ 21.88 0.89 (2.98) (2.09) (0.95) — — (0.95) $ 18.84( ) ( )
2019 $ 21.96 0.99 (0.07) 0.92 (1.00) — — (1.00) $ 21.88( ) ( ) ( ) ( )( ) ( ) ( ) ( )
2018 $ 21.65 1.00 0.29 1.29 (0.98) — — (0.98) $ 21.96) ( ) ( )
2017 $ 19.97 1.02 1.59 2.61 (0.93) — — (0.93) $ 21.65( ) ( )
CLASS R3 SHARES
2022(e) $ 22.95 0.44 0.84 1.28 (0.58) — — (0.58) $ 23.652021 $ 18.70 1.10 4.18 5.28 (1.03) — — (1.03) $ 22.95
( ) ( )
2020 $ 21.71 0.78 (2.96) (2.18) (0.83) — — (0.83) $ 18.70( ) ( )
2019 $ 21.80 0.84 (0.07) 0.77 (0.86) — — (0.86) $ 21.71( ) ( ) ( ) ( )( ) ( ) ( ) ( )
2018 $ 21.49 0.83 0.32 1.15 (0.84) — — (0.84) $ 21.80) ( ) ( )
2017 $ 19.82 0.87 1.59 2.46 (0.79) — — (0.79) $ 21.49( ) ( )
CLASS R4 SHARES
2022(e) $ 22.98 0.45 0.85 1.30 (0.59) — — (0.59) $ 23.692021 $ 18.72 1.12 4.20 5.32 (1.06) — — (1.06) $ 22.98
( ) ( )
2020 $ 21.74 0.77 (2.94) (2.17) (0.85) — — (0.85) $ 18.72( ) ( )
2019 $ 21.83 0.86 (0.07) 0.79 (0.88) — — (0.88) $ 21.74( ) ( ) ( ) ( )( ) ( ) ( ) ( )
2018 $ 21.52 0.85 0.33 1.18 (0.87) — — (0.87) $ 21.83) ( ) ( )
2017 $ 19.85 0.89 1.59 2.48 (0.81) — — (0.81) $ 21.52( ) ( )
CLASS R5 SHARES
2022(e) $ 23.11 0.50 0.85 1.35 (0.64) — — (0.64) $ 23.822021 $ 18.83 1.22 4.21 5.43 (1.15) — — (1.15) $ 23.11
( ) ( )
2020 $ 21.86 0.90 (3.00) (2.10) (0.93) — — (0.93) $ 18.83( ) ( )
2019 $ 21.95 0.97 (0.09) 0.88 (0.97) — — (0.97) $ 21.86( ) ( ) ( ) ( )( ) ( ) ( ) ( )
2018 $ 21.64 0.94 0.33 1.27 (0.96) — — (0.96) $ 21.95) ( ) ( )
2017 $ 19.95 0.98 1.61 2.59 (0.90) — — (0.90) $ 21.64( ) ( )
CLASS R6 SHARES
2022(e) $ 23.06 0.53 0.83 1.36 (0.66) — — (0.66) $ 23.762021 $ 18.78 1.27 4.20 5.47 (1.19) — — (1.19) $ 23.06
( ) ( )
2020 $ 21.81 0.92 (2.98) (2.06) (0.97) — — (0.97) $ 18.78( ) ( )
2019 $ 21.89 1.01 (0.08) 0.93 (1.01) — — (1.01) $ 21.81( ) ( ) ( ) ( )( ) ( ) ( ) ( )
2018 $ 21.58 1.16 0.14 1.30 (0.99) — — (0.99) $ 21.89) ( ) ( )
2017(i) $ 20.55 0.44 1.12 1.56 (0.53) — — (0.53) $ 21.58( ) ( )
(a) Net investment income (loss) includes income from foreign withholding tax claims adjusted for IRS compliance fees and/or tax reclaim collection fees. Without these proceeds, the NetInvestment Income (Loss) ratios for 2022 would have been: Class A, 3.45%; Class C, 2.63%; Class I, 3.69%; Class R3, 3.07%; Class R4, 3.17%; Class R5, 3.56%; Class R6, 3.77% and2021 would have been: Class A, 5.07%; Class C, 4.25%; Class I, 5.28%; Class R3, 4.68%; Class R4, 4.77%; Class R5, 5.18%; Class R6, 5.40%.
(b) Net expenses include tax reclaim collection fees that are excluded from the expense limitation agreement. If such expenses and fees had not occurred, the Expenses After ExpenseReductions ratios for 2021 would have been: Class A, 1.13%; Class C, 1.90%; Class I, 0.89%; Class R3, 1.50%; Class R4, 1.40%; Class R5, 0.99%; Class R6, 0.80%.
(c) Not annualized for periods less than one year.(d) Sales loads are not reflected in computing total return.(e) Unaudited Six Month Period Ended March 31.(f) Annualized.(g) The total return based on the NAV which reflects the adjustments in accordance with U.S. GAAP is 28.55%.(h) The total return based on the NAV which reflects the adjustments in accordance with U.S. GAAP is 29.02%.(i) Effective date of this class of shares was April 10, 2017.+ Based on weighted average shares outstanding.
See notes to financial statements.
Financial HighlightsIncome Builder Fund
126 | Thornburg Equity Funds Semi-Annual Report

RATIOS TO AVERAGE NET ASSETS SUPPLEMENTAL DATAUNLESS OTHERWISENOTED, PERIODS AREFISCAL YEARS ENDED
SEPTEMBER 30,NET INVESTMENT
INCOME (LOSS) (%)(a)
EXPENSES, AFTEREXPENSE
REDUCTIONS (%)(b)
EXPENSES,BEFORE EXPENSEREDUCTIONS (%)
TOTALRETURN (%)(c)
PORTFOLIOTURNOVERRATE (%)(c)
NETASSETS
AT END OF PERIOD(THOUSANDS)
CLASS A SHARES(d)
2022(e) 4.05(f) 1.12(f) 1.12(f) 5.74 10.88 $ 4,080,5262021 5.32 1.26 1.26 28.90 18.99 $ 3,876,3332020 4.27 1.15 1.15 (9.78) 47.60 $ 2,912,0632019 4.42 1.13 1.13 4.13 43.69 $ 3,458,385
)
2018 4.25 1.15 1.15 5.79 41.17 $ 3,378,1492017 4.52 1.19 1.19 13.01 37.37 $ 3,374,895
CLASS C SHARES
2022(e) 3.20(f) 1.90(f) 1.90(f) 5.34 10.88 $ 811,5202021 4.49 2.03 2.03 27.93 18.99 $ 922,5232020 3.40 1.88 1.88 (10.44) 47.60 $ 1,452,6432019 3.60 1.87 1.87 3.35 43.69 $ 2,658,581
)
2018 3.51 1.90 1.90 5.01 41.17 $ 3,591,8562017 3.80 1.90 1.93 12.19 37.37 $ 4,677,322
CLASS I SHARES
2022(e) 4.29(f) 0.88(f) 0.88(f) 5.88 10.88 $ 6,255,4612021 5.54 1.02 1.02 29.18 18.99 $ 5,858,0202020 4.40 0.91 0.91 (9.55) 47.60 $ 5,094,0552019 4.67 0.88 0.88 4.39 43.69 $ 7,810,067
)
2018 4.58 0.86 0.86 6.12 41.17 $ 7,806,2452017 4.93 0.86 0.86 13.30 37.37 $ 7,804,930
CLASS R3 SHARES
2022(e) 3.67(f) 1.50(f) 1.62(f) 5.54 10.88 $ 25,3782021 4.93 1.63 1.71 28.39 18.99 $ 24,9712020 3.86 1.49 1.49 (10.06) 47.60 $ 24,3432019 3.97 1.50 1.58 3.72 43.69 $ 36,155
)
2018 3.84 1.50 1.61 5.47 41.17 $ 46,9012017 4.24 1.47 1.56 12.63 37.37 $ 67,623
CLASS R4 SHARES
2022(e) 3.77(f) 1.40(f) 1.51(f) 5.59 10.88 $ 13,3592021 5.02 1.53 1.59 28.60(g) 18.99 $ 12,7512020 3.79 1.40 1.51 (10.01) 47.60 $ 13,0442019 4.09 1.40 1.50 3.79 43.69 $ 25,221
)
2018 3.91 1.40 1.56 5.58 41.17 $ 31,1322017 4.35 1.40 1.51 12.72 37.37 $ 44,069
CLASS R5 SHARES
2022(e) 4.14(f) 0.99(f) 1.14(f) 5.78 10.88 $ 35,2592021 5.43 1.12 1.22 29.07(h) 18.99 $ 38,7492020 4.44 0.99 1.05 (9.58) 47.60 $ 45,3082019 4.55 0.99 1.08 4.20 43.69 $ 59,890
)
2018 4.30 0.99 1.12 5.99 41.17 $ 59,5452017 4.76 0.99 1.09 13.22 37.37 $ 91,735
CLASS R6 SHARES
2022(e) 4.38(f) 0.80(f) 0.84(f) 5.89 10.88 $ 122,8022021 5.66 0.93 0.97 29.32 18.99 $ 113,3872020 4.58 0.80 0.84 (9.44) 47.60 $ 86,8892019 4.76 0.80 0.82 4.47 43.69 $ 157,924
)
2018 5.39 0.80 0.82 6.20 41.17 $ 156,7502017(i) 4.37(f) 0.80(f) 1.09(f) 7.65 37.37 $ 36,909
Financial Highlights, Continued
Income Builder Fund
Thornburg Equity Funds Semi-Annual Report | 127

PER SHARE PERFORMANCE (FOR A SHARE OUTSTANDING THROUGHOUT THE PERIOD)UNLESS OTHERWISENOTED, PERIODS AREFISCAL YEARS ENDED
SEPTEMBER 30,
NET ASSETVALUE,
BEGINNINGOF PERIOD
NETINVESTMENT
INCOME(LOSS)+
NET REALIZED &UNREALIZED
GAIN (LOSS) ONINVESTMENTS
TOTAL FROMINVESTMENTOPERATIONS
DIVIDENDSFROM NET
INVESTMENTINCOME
DIVIDENDSFROM NETREALIZED
GAINS
DIVIDENDSFROM
RETURN OFCAPITAL
TOTALDIVIDENDS
NET ASSETVALUE,END OFPERIOD
CLASS A SHARES(d)(e)
2022(f) $ 12.06 0.04 0.05 0.09 (0.06) — — (0.06) $ 12.09
CLASS I SHARES
2022(f) $ 14.25 0.12 (0.01) 0.11 (0.10) (2.17) — (2.27) $ 12.092021 $ 12.18 0.16 2.71 2.87 (0.22) (0.58) — (0.80) $ 14.25
) ( ) ( ) ( )
2020 $ 10.47 0.09 1.80 1.89 (0.13) (0.05) — (0.18) $ 12.18( ) ( ) ( )
2019(h) $ 10.00 0.11 0.43 0.54 (0.07) — — (0.07) $ 10.47( ) ( ) ( )
(a) The Fund incurs certain expenses and fees in connection with investments in short positions. If such expenses and fees had not occurred, the Expenses After Expense Reductions ratiosfor 2021, 2020 and 2019 would have been 0.99%, 0.99% and 0.99% respectively.
(b) The Fund incurs certain expenses and fees in connection with investments in short positions. If such expenses and fees had not occurred, the Expenses Before Expense Reductions ratiosfor 2021, 2020 and 2019 would have been 1.19%, 1.31% and 1.71% respectively.
(c) Not annualized for periods less than one year.(d) Effective date of this class of shares was January 26, 2022.(e) Sales loads are not reflected in computing total return.(f) Unaudited Six Month Period Ended March 31.(g) Annualized.(h) Fund commenced operations on March 1, 2019.+ Based on weighted average shares outstanding.
See notes to financial statements.
Financial HighlightsSummit Fund
128 | Thornburg Equity Funds Semi-Annual Report

RATIOS TO AVERAGE NET ASSETS SUPPLEMENTAL DATAUNLESS OTHERWISENOTED, PERIODS AREFISCAL YEARS ENDED
SEPTEMBER 30,NET INVESTMENT
INCOME (LOSS) (%)
EXPENSES, AFTEREXPENSE
REDUCTIONS (%)(a)
EXPENSES,BEFORE EXPENSEREDUCTIONS (%)(b)
TOTALRETURN (%)(c)
PORTFOLIOTURNOVERRATE (%)(c)
NETASSETS
AT END OF PERIOD(THOUSANDS)
CLASS A SHARES(d)(e)
2022(f) 2.04(g) 1.24(g) 28.32(g) 0.76 49.21 $ 117
CLASS I SHARES
2022(f) 1.93(g) 0.99(g) 1.18(g) 0.26 49.21 $ 71,2152021 1.20 1.01 1.21 24.63 155.26 $ 62,4662020 0.81 1.09 1.41 18.45 139.88 $ 45,8862019(h) 1.78(g) 1.72(g) 2.44(g) 5.45 53.38 $ 35,489
Financial Highlights, Continued
Summit Fund
Thornburg Equity Funds Semi-Annual Report | 129

As a shareholder of the Fund, you incur two types of costs:
(1) transaction costs, including
(a) sales charges (loads) on purchase payments, for Class A shares;
(b) a deferred sales charge on redemptions of any part or all of a purchase of $1 million of Class A shares within 12 months ofpurchase;
(c) a deferred sales charge on redemptions of Class C shares within 12 months of purchase;
(2) ongoing costs, including management fees; distribution and/or service (12b-1) fees; and other Fund expenses.
This example is intended to help you understand your ongoing costs (in dollars) of investing in the Fund and to compare these costs withthe ongoing costs of investing in other mutual funds.
The example is based on a $1,000 investment beginning on October 1, 2021, and held until March 31, 2022.
ACTUAL EXPENSES
For each class of shares, the Actual section of the accompanying table provides information about actual account values and actualexpenses. You may use the information in this line, together with the amount you invested, to estimate the expenses that you paid over theperiod. Simply divide your account value by $1,000 (for example, an $8,600 account value divided by $1,000 = 8.6), then multiply theresult by the number in the Actual section for your class of shares under the heading entitled “Expenses Paid During Period” to estimatethe expenses you paid on your account during this period.
HYPOTHETICAL EXAMPLE FOR COMPARISON PURPOSES
For each class of shares, the Hypothetical section of the accompanying table provides information about hypothetical account values andhypothetical expenses based on the Fund’s actual expense ratio and an assumed rate of return of 5% per year before expenses, which isnot the Fund’s actual return. The hypothetical account values and expenses may not be used to estimate the actual ending accountbalance or expenses you paid for the period. You may use this information to compare the ongoing costs of investing in the Fund and otherfunds. To do so, compare this 5% hypothetical example with the 5% hypothetical examples that appear in the shareholder reports of theother funds.
Please note that the expenses shown in the table are meant to highlight your ongoing costs only and do not reflect any transactional costs,such as sales charges (loads), redemption fees, or exchange fees. Therefore, the Hypothetical section of the table for each class of sharesis useful in comparing ongoing costs only, and will not help you determine the relative total costs of owning different mutual funds. Inaddition, if these transactional costs were included, your costs would have been higher.
The actual and hypothetical examples shown assume a $1,000 investment at the beginning of the period, October 1, 2021 and heldthrough March 31, 2022.
ACTUAL HYPOTHETICAL*
ENDINGACCOUNT VALUE
3/31/22
EXPENSES PAIDDURING PERIOD10/1/21-3/31/22
ENDINGACCOUNT VALUE
3/31/22
EXPENSES PAIDDURING PERIOD†
10/1/21-3/31/22ANNUALIZED
EXPENSE RATIO
GLOBAL OPPORTUNITIES FUNDCLASS A SHARES $1,007.70 $ 6.41 $1,018.55 $ 6.44 1.28%CLASS C SHARES $1,004.06 $10.29 $1,014.66 $10.35 2.06%CLASS I SHARES $1,009.53 $ 4.96 $1,020.00 $ 4.99 0.99%CLASS R3 SHARES $1,007.09 $ 7.51 $1,017.45 $ 7.54 1.50%CLASS R4 SHARES $1,007.46 $ 7.01 $1,017.95 $ 7.04 1.40%CLASS R5 SHARES $1,009.51 $ 4.96 $1,020.00 $ 4.99 0.99%CLASS R6 SHARES $1,010.04 $ 4.26 $1,020.69 $ 4.28 0.85%
INTERNATIONAL EQUITY FUNDCLASS A SHARES $ 918.62 $ 6.41 $1,018.25 $ 6.74 1.34%CLASS C SHARES $ 915.33 $ 9.45 $1,015.06 $ 9.95 1.98%CLASS I SHARES $ 920.39 $ 4.45 $1,020.29 $ 4.68 0.93%CLASS R3 SHARES $ 918.16 $ 6.79 $1,017.85 $ 7.14 1.42%CLASS R4 SHARES $ 918.89 $ 5.84 $1,018.85 $ 6.14 1.22%CLASS R5 SHARES $ 920.22 $ 4.60 $1,020.14 $ 4.84 0.96%CLASS R6 SHARES $ 921.10 $ 3.64 $1,021.14 $ 3.83 0.76%
BETTER WORLD INTERNATIONAL FUNDCLASS A SHARES $ 923.35 $ 7.14 $1,017.50 $ 7.49 1.49%CLASS C SHARES $ 920.29 $10.92 $1,013.56 $11.45 2.28%CLASS I SHARES $ 925.88 $ 4.90 $1,019.85 $ 5.14 1.02%
Expense ExampleMarch 31, 2022 (Unaudited)
130 | Thornburg Equity Funds Semi-Annual Report

ACTUAL HYPOTHETICAL*
ENDINGACCOUNT VALUE
3/31/22
EXPENSES PAIDDURING PERIOD10/1/21-3/31/22
ENDINGACCOUNT VALUE
3/31/22
EXPENSES PAIDDURING PERIOD†
10/1/21-3/31/22ANNUALIZED
EXPENSE RATIO
INTERNATIONAL GROWTH FUNDCLASS A SHARES $ 839.29 $ 6.01 $1,018.40 $ 6.59 1.31%CLASS C SHARES $ 835.55 $ 9.88 $1,014.16 $10.85 2.16%CLASS I SHARES $ 840.58 $ 4.54 $1,020.00 $ 4.99 0.99%CLASS R3 SHARES $ 838.73 $ 6.88 $1,017.45 $ 7.54 1.50%CLASS R4 SHARES $ 838.93 $ 6.42 $1,017.95 $ 7.04 1.40%CLASS R5 SHARES $ 840.72 $ 4.54 $1,020.00 $ 4.99 0.99%CLASS R6 SHARES $ 841.09 $ 4.09 $1,020.49 $ 4.48 0.89%
DEVELOPING WORLD FUNDCLASS A SHARES $ 877.45 $ 6.74 $1,017.75 $ 7.24 1.44%CLASS C SHARES $ 873.51 $10.60 $1,013.61 $11.40 2.27%CLASS I SHARES $ 878.82 $ 5.01 $1,019.60 $ 5.39 1.07%CLASS R5 SHARES $ 879.10 $ 5.06 $1,019.55 $ 5.44 1.08%CLASS R6 SHARES $ 879.34 $ 4.54 $1,020.09 $ 4.89 0.97%
SMALL/MID CAP CORE FUNDCLASS A SHARES $ 981.01 $ 6.12 $1,018.75 $ 6.24 1.24%CLASS C SHARES $ 976.63 $10.50 $1,014.31 $10.70 2.13%CLASS I SHARES $ 982.89 $ 4.30 $1,020.59 $ 4.38 0.87%CLASS R3 SHARES $ 981.13 $ 6.08 $1,018.80 $ 6.19 1.23%CLASS R4 SHARES $ 981.54 $ 5.58 $1,019.30 $ 5.69 1.13%CLASS R5 SHARES $ 982.84 $ 4.30 $1,020.59 $ 4.38 0.87%
SMALL/MID CAP GROWTH FUNDCLASS A SHARES $ 812.15 $ 5.65 $1,018.70 $ 6.29 1.25%CLASS C SHARES $ 808.16 $ 9.69 $1,014.21 $10.80 2.15%CLASS I SHARES $ 813.62 $ 3.93 $1,020.59 $ 4.38 0.87%CLASS R3 SHARES $ 811.71 $ 6.23 $1,018.05 $ 6.94 1.38%CLASS R4 SHARES $ 812.09 $ 5.78 $1,018.55 $ 6.44 1.28%CLASS R5 SHARES $ 813.78 $ 3.93 $1,020.59 $ 4.38 0.87%
INCOME BUILDER FUNDCLASS A SHARES $1,057.37 $ 5.74 $1,019.35 $ 5.64 1.12%CLASS C SHARES $1,053.41 $ 9.73 $1,015.46 $ 9.55 1.90%CLASS I SHARES $1,058.81 $ 4.52 $1,020.54 $ 4.43 0.88%CLASS R3 SHARES $1,055.44 $ 7.69 $1,017.45 $ 7.54 1.50%CLASS R4 SHARES $1,055.89 $ 7.18 $1,017.95 $ 7.04 1.40%CLASS R5 SHARES $1,057.81 $ 5.08 $1,020.00 $ 4.99 0.99%CLASS R6 SHARES $1,058.87 $ 4.11 $1,020.94 $ 4.03 0.80%
SUMMIT FUNDCLASS A SHARES‡ $1,007.60 $ 2.01 $1,006.08 $ 2.01 1.24%CLASS I SHARES $1,002.63 $ 4.94 $1,020.00 $ 4.99 0.99%
* Hypothetical assumes a rate of return of 5% per year before expenses.† Expenses are equal to the annualized expense ratio for each class multiplied by the average account value over the period, multiplied by 182/365 to reflect the one-half year period.
‡ Expenses are equal to the annualized expense ratio for Class A multiplied by the average account value over the period, multiplied by 59/365 to reflect the accrual period from 2/1/22 to3/31/2022.
Expense Example, Continued
March 31, 2022 (Unaudited)
Thornburg Equity Funds Semi-Annual Report | 131

PORTFOLIO PROXY VOTING
Policies and Procedures:
The Trust has delegated to the Advisor voting decisions respecting proxies for the Fund’s voting securities. The Advisor makes votingdecisions in accordance with its Proxy Voting Policy and Procedures. A description of the Policy and Procedures is available (i) withoutcharge, upon request, by calling the Advisor toll-free at 1-800-847-0200, (ii) on the Thornburg website at www.thornburg.com, and (iii) onthe U.S. Securities and Exchange Commission’s website at www.sec.gov.
Information regarding how proxies were voted is available on or before August 31 of each year for the twelve months ending the precedingJune 30. This information is available (i) without charge, upon request by calling the Advisor toll-free at 1-800-847-0200, (ii) on theThornburg website at www.thornburg.com, and (iii) on the U.S. Securities and Exchange Commission’s website at www.sec.gov.
AVAILABILITY OF QUARTERLY PORTFOLIO SCHEDULE
The Funds file with the Securities and Exchange Commission schedules of their portfolio holdings on Form N-PORT EX for the first andthird quarters of each fiscal year. The Funds’ Forms N-PORT EX are available on the Commission’s website at www.sec.gov, or may bereviewed and copied at the Commission’s Public Reference Room in Washington, D.C. Information on the operation of the PublicReference Room may be obtained by calling 1-800-SEC-0330. The Funds also make this information available on their website atwww.thornburg.com/download or upon request by calling 1-800-847-0200.
STATEMENT REGARDING LIQUIDITY RISK MANAGEMENT PROGRAM
The Trustees of the Trust have appointed the Advisor (“Program Administrator”) to administer the Trust’s liquidity risk management program(the “LRMP”) adopted for each of the Funds under rule 22e-4 under the 1940 Act (the “Liquidity Rule”). The LRMP is designed to reducethe risk that a Fund will be unable to meet its redemption obligations under the 1940 Act, and to mitigate the dilution of the interests ofFund shareholders occasioned by redemptions tendered by other shareholders (“Liquidity Risk”). Pursuant to the LRMP, the ProgramAdministrator has delegated certain functions, including daily oversight and management of the Funds’ Liquidity Risk, to its Liquidity RiskManagement Committee (the “Liquidity Committee”). Under the LRMP, the Liquidity Committee performs the annual review of the LRMPrequired by the Liquidity Rule.
On December 8, 2021, the Trustees reviewed the Liquidity Committee’s written report (the “Report”) concerning the operation of the LRMPfor the period from November 21, 2020 through November 20, 2021 (the “Reporting Period”). The Report addressed the operation,adequacy and effectiveness of the LRMP, the operation of a Fund’s highly liquid investment minimum, and any material changes to theLRMP during the Reporting Period. The Report provided an assessment of the various factors relevant to each Fund’s Liquidity Risk, anevaluation of data provided by a third-party liquidity assessment vendor and other relevant data, and reports on the Liquidity Committee’sconsideration of intermediary firms with the largest beneficial ownership positions in each Fund, the likelihood that any of those firms mayredeem their clients’ investments from the Funds without prior notice, and the effect that such redemptions could have on Fund liquidity.The Report concluded that the LRMP remains adequate and effective to address each Fund’s Liquidity Risk, that all of the Funds are ableto meet redemption requests in current market conditions and in reasonably expected stressed conditions without significant dilution ofremaining shareholders, that each Fund remains primarily highly liquid, each Fund’s liquidity classifications during the reporting period werereasonable, and the third-party liquidity assessment vendor’s system continues to be a useful tool for assessing the Funds’ Liquidity Risk.The Report stated that there have been no instances since the LRMP’s adoption in which a Fund exceeded its limitation on illiquidinvestments, nor have there been any material changes to the LRMP since its adoption.
Other InformationMarch 31, 2022 (Unaudited)
132 | Thornburg Equity Funds Semi-Annual Report

Readopted September 14, 2021
The Trustees believe current and prospective shareholders should know how we discharge our responsibilities in supervising the Funds’investment advisor and in reviewing the advisor’s contract for renewal. Since 2005, we have issued a statement which sets out clearly thethree principal guidelines that we follow in supervising the Trust’s investment advisor on your behalf. In accordance with our customarypractice, in September of this year we again reviewed our statement and concluded we should reissue this statement outlining the principalfeatures of our supervision of the advisor’s performance of investment management services for the Funds.
We begin with the premise that each shareholder selected his or her Fund because its investments are managed by the investment advisoridentified in the prospectus and in accordance with the objective and policies described in the prospectus. We realize, as each of you do,that if you believe that your Fund’s stated objective and policies no longer serve your personal investment goals, you can sell your sharesand leave the Fund.
Therefore, we believe that our primary supervisory task – our principal obligation to you – is to assess the nature and quality of the advisor’sservices, and to confirm that the advisor actively and competently pursues the Fund’s objective, in accordance with the policies set out inthe prospectus. To do this, we meet regularly with management to review your Fund’s portfolio and to discuss the advisor’s specific actionsand judgments in pursuing the Fund’s objective. We do not substitute our own judgment for the advisor’s decisions in selectinginvestments; the advisor is paid to exercise its informed judgment on investment decisions, and we seek to confirm, in reviewing theadvisor’s performance, that the advisor is doing just that.
Second, we are conscious of costs and the effect that costs have on shareholders’ returns. We try to make sure that your Fund’s fees andcosts are reasonable in relationship to the services rendered and that they are generally in line with those charged by other expertinvestment advisors, consistent with our belief that the Fund’s investors searched for and expect that expertise and attention and havedecided to pay a reasonable price for it. We do not put the management contract “out to bid” as a matter of course, and we would not doso unless we had concluded that the advisor materially had failed to pursue the Fund’s objectives in accordance with its policies, or forother equally important reasons. We believe that any other approach would be inconsistent with your interests and contrary to yourexpectations when you bought shares of the Fund in the first place.
Finally, because we believe that most Thornburg Fund shareholders have invested with a long-term perspective, we try not to focus toomuch on the fashions of the moment and on short-term performance. The market will not favor any specific investment objective or set ofpolicies at all times and under all economic circumstances. A fund will experience periods of both high and low returns relative to otherfunds and other investments. Even if one of our Funds is not favored by the market at a particular time, we believe that the advisor isnonetheless obliged to remain true to the Fund’s objective and policies, and we watch to see that it does so.
[This statement is submitted for the general information of the shareholders of Thornburg Investment Trust. For prospective investors
in any fund of Thornburg Investment Trust, this communication must be preceded or accompanied by a prospectus. You may obtain
a current copy of the Funds’ prospectus, which describes the Funds’ management fees, expenses and risks, by calling
1-800-847-0200 or by visiting www.thornburg.com/download. Please read the prospectus carefully before investing.]
Thornburg Investment Trust
2300 North Ridgetop Road
Santa Fe, NM 87506
505.984.0200 Tel
505.992.8681 Fax
www.thornburg.com
Trustees’ Statement to Shareholders (Unaudited)
Thornburg Equity Funds Semi-Annual Report | 133

Thornburg Investment Management is a privately-owned global investment firm that offers a range of solutions for retail andinstitutional investors. Founded in 1982 and headquartered in Santa Fe, New Mexico, we manage approximately $44.3 billion(as of March 31, 2022) across U.S. mutual funds, separate accounts for high-net-worth investors, institutional accounts, andUCITS funds for non-U.S. investors.
The funds outlined in this report are some of the many equity and fixed-income products available from ThornburgInvestment Management.
GLOBAL EQUITY
� Thornburg Global Opportunities Fund
INTERNATIONAL EQUITY
� Thornburg International Equity Fund
� Thornburg Better World International Fund
� Thornburg International Growth Fund
� Thornburg Developing World Fund
U.S. EQUITY
� Thornburg Small/Mid Cap Core Fund
� Thornburg Small/Mid Cap Growth Fund
MULTI ASSET
� Thornburg Investment Income Builder Fund
� Thornburg Income Builder Opportunities Trust
� Thornburg Summit Fund
TAXABLE FIXED INCOME
� Thornburg Limited Term U.S. Government Fund
� Thornburg Limited Term Income Fund
� Thornburg Ultra Short Income Fund
� Thornburg Strategic Income Fund
MUNICIPAL
� Thornburg Short Duration Municipal Fund
� Thornburg Limited Term Municipal Fund
� Thornburg California Limited Term Municipal Fund
� Thornburg New Mexico Intermediate Municipal Fund
� Thornburg New York Intermediate Municipal Fund
� Thornburg Intermediate Municipal Fund
� Thornburg Strategic Municipal Income Fund
Before investing, carefully consider each Fund’s investment goals, risks, charges, and expenses. For a prospectus or summary prospectus containingthis and other information, contact your financial advisor or visit thornburg.com. Read it carefully before investing.
For additional information, please visit thornburg.comThornburg Investment Management, Inc. 2300 North Ridgetop Road, Santa Fe, NM 87506
Thornburg Funds
134 | Thornburg Equity Funds Semi-Annual Report

This page intentionally left blank.
Thornburg Equity Funds Semi-Annual Report | 135
To receive shareholder reports, prospectuses, and proxy statements electronically, go towww.thornburg.com/edelivery.
This Semi-Annual Report is submitted for the general information of shareholders of the Fund. It is not authorized for distribution to prospective investors in theFund unless preceded or accompanied by an effective prospectus.
Investment Advisor:Thornburg Investment Management®
800.847.0200
Distributor:Thornburg Securities Corporation®
800.847.0200 TH4624
Related Documents