EQUITY ANALYSIS OF THE HOUSTON QUICKRIDE PROJECT MARK W. BURRIS, Ph.D. ASSISTANT PROFESSOR DEPARTMENT OF CIVIL ENGINEERING Texas A&M University CE/TTI Building Room 301G 3136 TAMU College Station, TX 77843-3136 [email protected] Ph: 979-845-9875 Fax: 979-845-6481 & ROBERT L. HANNAY DEPARTMENT OF CIVIL ENGINEERING Texas A&M University CE/TTI Building Room 301G 3136 TAMU College Station, TX 77843-3136 [email protected] Paper Submitted for Publication and Presentation at the Transportation Research Board Annual Meeting, 2003 March 2003 Words: 4450 + (4 Tables)*250 = 5450. 1

Welcome message from author
This document is posted to help you gain knowledge. Please leave a comment to let me know what you think about it! Share it to your friends and learn new things together.
Transcript
EQUITY ANALYSIS OF THE HOUSTON QUICKRIDE PROJECT
MARK W. BURRIS, Ph.D. ASSISTANT PROFESSOR
DEPARTMENT OF CIVIL ENGINEERING Texas A&M University
CE/TTI Building Room 301G 3136 TAMU
College Station, TX 77843-3136 [email protected] Ph: 979-845-9875 Fax: 979-845-6481
&
ROBERT L. HANNAY
DEPARTMENT OF CIVIL ENGINEERING Texas A&M University
CE/TTI Building Room 301G 3136 TAMU
College Station, TX 77843-3136 [email protected]
Paper Submitted for Publication and Presentation at the Transportation Research Board Annual Meeting, 2003
March 2003
Words: 4450 + (4 Tables)*250 = 5450.
1

ABSTRACT
This paper examines the equity considerations involved with the QuickRide program along the
Katy Freeway in Houston, Texas. The QuickRide program allows two-person carpools to utilize
the Katy Freeway HOV lane during peak periods for a $2 fee.
Survey data gathered on QuickRide enrollees, along with 1998 QuickRide usage data, was
analyzed for potential equity issues that might exist with the QuickRide program. QuickRide
usage did not vary significantly by respondent income, occupation, age, or household size.
Additionally, the difference between respondents stated and actual use of QuickRide did not vary
significantly by respondent income, occupation, age, or household size. However, QuickRide
enrollees were found to have significantly higher incomes and to be significantly younger than
drivers on the Katy Freeway main lanes. Therefore, although income was not an indicator of the
amount of QuickRide use amongst enrollees, it was a significant indicator as to whether or not an
individual enrolled in the program.
This result raises some equity concerns over the ability or interest of low-income individuals to
enroll in the program. However, it was also found that no drivers were made worse off due to
the program. Additionally, once enrolled, the QuickRide program is a benefit to most travelers,
as long as the occupants of the vehicle value their travel time at a rate exceeding $3/hour each.
2

INTRODUCTION
Economists have long recognized the potential of value pricing (or congestion pricing) to
improve the flow of traffic (1,2,3) and reduce the societal costs of congestion. However, it was
not until December 1995, with the opening of the SR 91 express lanes in California, that a value
pricing project was implemented in the United States. Since value pricing projects implicitly
involve adjusting the price of travel it is important to consider the financial impacts these
projects will have on various groups of drivers. Lower income groups typically spend a higher
proportion of their income on transportation (4). Therefore, changes in transportation costs will
tend to impact these groups to a greater degree. Additionally, equity concerns, resulting in
political opposition, have been a primary reason in the delay or abandonment of many value
pricing projects (5,6,7,8). Therefore, equity considerations are important both on their own merit
and from the standpoint of successful implementation of a value pricing project.
This paper examines, ex-post, potential equity issues with the High Occupancy/Toll (HOT) lane
program on the Katy Freeway in Houston, Texas. The analysis examined a combined dataset of
revealed preference survey data with data on actual HOT lane use. Drivers’ perceptions and use
of the HOT lane were examined by their socio-economic status. The difference in stated use and
actual use was also examined by socio-economic characteristics. Finally, the potential costs and
benefits to drivers of the HOT lane was briefly examined for additional insight into potential
equity impacts.
The Houston HOT Lane (QuickRide) Program
In 1984 a reversible high occupancy vehicle (HOV) lane was opened along the Katy Freeway in
Houston to allow transit vehicles and vanpools to bypass congestion on the highway. By 1988,
occupancy requirements had been reduced to two passengers. Over time, traffic volumes
increased on the HOV lane to the point where volumes exceeded capacity during peak periods.
Occupancy requirements were then raised to three occupants during peak periods, causing traffic
on the HOV lane to return to free-flow, but creating excess capacity. The peak periods were
from 6:45 a.m. to 8:00 a.m. and 5:00 p.m. to 6:00 p.m. every weekday.
3
The Houston QuickRide program was implemented in January of 1998 to allow vehicles with
two passengers to utilize the HOV lane during peak periods for a fee of $2. This type of lane is
known as a High Occupancy/Toll lane, or HOT lane. The objectives of the program were to
increase overall person throughput along the Katy Freeway during peak periods, increase travel
speeds on the mixed flow lanes, and efficiently manage demand without adverse operating
impacts on both the HOV lane and the mixed-flow lanes (9).
The Houston QuickRide program is one example of a value pricing project. Value pricing
harnesses the power of the market, in this case, through tolls, to manage demand and control
congestion on transportation facilities. These tolls, collected electronically, vary with the level
of congestion, thereby encouraging drivers to utilize the facility more efficiently. The peak
period tolls provide an incentive to change travel times, change travel modes, or to eliminate
lower-valued trips (10). Other than the Houston HOT lanes, there are a limited number of
operational value pricing projects in the United States. These include:
• SR 91 express lanes in Orange County, California,
• I-15 HOT lane in San Diego,
• Port Authority of New York and New Jersey crossings,
• New Jersey Turnpike Authority facilities,
• Two bridges in Lee County, Florida.
Several other value pricing projects are currently being considered throughout the United States
under the Federal Highway Administration’s Value Pricing Pilot Program (11).
Previous studies have been performed which have examined numerous aspects of the QuickRide
program (9,12,13). These studies were based on 1998 usage of the QuickRide program and data
from a survey conducted in mid-1998. The main findings from the studies were:
1. The total demand for HOV2 value pricing may be limited in major travel corridors
despite large potential time savings.
2. Substantial shifts in mode and time are possible with HOV2 value pricing.
3. Household size and income are good indicators, but HOV lane use is a poor indicator, of
the demand for HOV2 value pricing.
4

4. QuickRide users were typically familiar with the Houston HOV system prior to signing
up for the program.
These QuickRide studies only touched on the subject of equity by examining the characteristics
of the average QuickRide user: a 38-to-49-year-old professional or manager with a household
size of three or four and a household income of over $100,000. Survey respondents who
participated in QuickRide had similar demographic characteristics to those who did not
participate. However, participants were, on average, younger and had slightly higher incomes
(9,13). The issue of equity was never directly addressed.
Equity
To perform an equity analysis, the definition of equity must first be established. The 1994
National Cooperative Highway Research Program Report on Congestion Pricing defined equity
as follows (14):
“Equity refers to the distribution of costs and benefits resulting from a policy decision.
Traditionally, distribution has been considered with respect to household income.”
In addition, equity can be examined in three different ways (15):
1. Horizontal equity is concerned with the fairness of costs and benefits between similar
groups.
2. Vertical equity with regard to income and social class is concerned with allocation of
costs between income and social classes.
3. Vertical equity with regard to mobility need and ability is concerned with measuring how
well an individual’s transportation needs are met compared with that of the community.
This study concentrated on vertical equity issues with regard to income and social class. The
impact and use of QuickRide was therefore examined primarily by income level and by
occupation.
DATA SOURCES
The data examined here was obtained from the following sources:
• The 1998 QuickRide usage data
5

• The 1998 QuickRide enrollee survey data
• The 1998 Survey of Katy Freeway drivers who were not enrolled in QuickRide
QuickRide Usage Data
The original usage data listed the Tag ID (transponder number) of each vehicle using QuickRide,
the date the vehicle used QuickRide, and the time (hours, minutes, seconds) that the vehicle
passed the QuickRide electronic toll collector. Data recording errors resulted in the removal of
two days of data (December 22 and 28, 1998). This left 22,937 individual records of QuickRide
usage during 1998 for all QuickRide enrollees (both survey respondents and non-respondents).
QuickRide Participant Survey Data
A survey was mailed to all individuals who registered with QuickRide between January 1998
and March 1998 in order to collect demographic and opinion data (9). Of the 387 surveys mailed
out, 190 were returned for a 49 percent response rate. All survey information was entered into a
database, with each entry containing the QuickRide user’s name, a unique Survey ID number,
and their response to survey questions. On one survey, two names were listed and this survey
was removed. Also, not everyone listed in the survey data was also listed in the QuickRide
signup data. Those that were not listed in the signup data could not be linked to a transponder
number, and so could not be linked to any of the usage data. There were seven surveys removed
because of this, leaving 182 usable survey responses.
QuickRide Non-Participant Survey Data
At the same time as the QuickRide survey was mailed to QuickRide participants, another survey
was mailed to users of the Katy Freeway who did not participate in QuickRide. Of the 2,500
individuals who were mailed a survey, 289 were returned for a 12 percent response rate (9). In
this survey the respondents also provided their household income, age, occupation, and
household size.
6
For analysis purposes, a table was created which contained all of the survey responses and the
corresponding QuickRide usage for those transponder numbers. Unfortunately, there were 54
QuickRide users who filled out a single survey, but who had two transponders listed under their
name. This was expected since multiple persons from a single household could register for
QuickRide. Each user obtained a unique transponder but only one survey per household was
completed. Generally, it was assumed that the survey respondent was the one who owned the
transponder that had the higher usage rate. The database then contained 177 unique respondents
who had completed the survey and made a total of 9,525 QuickRide trips during 1998. This
selection of data biases results towards additional QuickRide trips per person. However,
respondents only used QuickRide an average of 1.2 times per week, which was still less than half
of what they indicated on the survey.
ANALYSIS OF DATA
Standard methods of statistical analyses were used to identify significant differences in
QuickRide user variables. The Mann-Whitney test was used for 2-way comparisons of ordinal
data, the ANOVA test was used for 3-way or 5-way comparisons of continuous data, and the t-
test was used for 2-way comparisons of continuous data.
Perceived and Actual Usage of QuickRide
All survey respondents were asked to estimate how often they used QuickRide in both the
morning and afternoon peak periods. Their responses were then compared with their actual
weekly usage for 1998 (see Table 1). Each respondent’s average weekly QuickRide usage was
found by dividing the respondent’s actual number of trips by the number of weeks left in 1998
after that user’s first QuickRide trip. There was a significant difference (p≤0.01) between the
perceived and actual QuickRide usage during both the morning (6:45 a.m. to 8:00 a.m.) and
afternoon (5:00 p.m. to 6:00 p.m.) peak periods. The respondents’ estimated usage did correlate
(p≤0.01, r=0.374) with their actual usage of QuickRide.
The difference between actual and stated QuickRide use by income category, age group,
household size, and occupation type (see Table 2) was examined for significant (p≤0.05)
7
differences. It was possible that respondents in low income groups may have predicted a large
volume of QuickRide use but, due to the expenses, chose not to make many QuickRide trips.
However, the difference in stated and actual QuickRide uses per week did not vary significantly
by income, age, household size, or occupation. The lack of significant differences could have
been caused by the small sample sizes and high variability within groups. A new study of the
QuickRide program is underway and, with more QuickRide users now, this problem of small
sample size may be overcome. Therefore, although survey respondents greatly overstated their
use of QuickRide, this overstatement did not vary significantly by socio-economic
characteristics.
Factors Influencing QuickRide Use
Data on the average morning, afternoon, and total QuickRide use was presented in previous
studies on the QuickRide survey and usage data (9,13). The average usage data used in this
study differs only slightly due to the method used to calculate average weekly trips, and the
method used to determine which transponder records linked to a particular survey in the case of
multiple transponders belonging to a single household.
Of the 177 survey respondents, only ten individuals had household incomes under $40,000. To
ensure adequate sample sizes for a statistical analysis the income categories were aggregated. A
high-income group (104 respondents with annual household incomes exceeding $75,000) and a
low-income group (48 respondents with annual household incomes below $75,000) were
developed. There were 25 respondents who did not indicate their household income. Using this
distribution, there were no significant differences by income in morning, afternoon, or total
QuickRide usage. Users in both the high-income group and low-income group had similar usage
patterns, suggesting household income was not a significant factor in a respondent’s amount of
QuickRide usage.
In the event that the aggregation of household income categories may have hidden significant
differences between groups, household income was also split into three groups. This included
low (less than $40,000), medium ($40,000 to $100,000) and high (greater than $100,000)
8
household incomes. Statistical analysis indicated that, as before, QuickRide usage did not vary
significantly by income level.
Respondents listed their age in one of five categories. The morning, afternoon, and total amount
of QuickRide usage did not vary significantly with the age of the respondent. Respondents listed
their household size in one of four categories. Statistical analysis revealed that a respondent’s
morning, afternoon, and total use of QuickRide did not vary significantly by household size.
Respondents were asked to give their occupation, with eight choices, and a ninth choice of
“other”. Of the 172 respondents who gave their occupation, 94% had either a professional,
managerial, technical, administrative, or clerical occupation. Statistical analysis revealed that a
respondent’s morning, afternoon, and total use of QuickRide did not vary significantly by
occupation.
Other factors were examined as to whether or not they significantly affected QuickRide usage.
One question on the survey asked if the respondent would increase their QuickRide usage if the
program allowed single occupancy vehicles onto the HOV lane. Of those who responded, 135
users stated they would increase usage if allowed to drive alone, and 42 would not increase
usage. Those who would increase their usage if allowed to drive alone on the HOV lane used
QuickRide significantly (p=0.034) less than those who would not increase usage.
Respondents were also asked, on a scale from 1 to 5, how expensive they felt QuickRide was
and, on a scale from 1 to 5, how much the price factors into their use of QuickRide. There were
no significant differences in the respondents use of QuickRide based on either of these
responses. In summary, there was little difference in QuickRide use amongst the socio-
economic groups of QuickRide enrollees.
Factors Affecting the Opinion of the QuickRide Price
Three questions on the QuickRide survey were related to the respondent’s opinion of the
QuickRide price ($2 per use). For two of the questions, the respondent was asked, on a scale
from 1 to 5, how expensive they felt the price was and, on a scale from 1 to 5, how much price
factored into their decision to use QuickRide. A third question asked if the respondent would
9

increase their usage of QuickRide if the price were reduced. For each of these questions, the
respondents’ answers did not vary significantly based on household income, household size, age,
or occupation.
Factors Affecting Opinion Regarding Driving Alone on the HOV Lane
QuickRide users were asked if they would increase their usage of QuickRide if they were
allowed to drive alone on the HOV lane. The respondent’s opinion regarding driving alone did
not vary significantly based on household income, household size, age, or occupation. Also, the
respondent’s opinion on driving alone on the HOV lane did not vary significantly based on their
opinion of the QuickRide price. The only significant finding was that those who used QuickRide
with a family member were significantly less likely (p=0.032) to increase their QuickRide usage
if they could drive alone on the HOV, than those who did not ride with a family member.
Factors Affecting QuickRide Users Sharing the Price of QuickRide
Survey respondents were asked if they shared the price of QuickRide with the passenger in their
carpool. Of the 173 users who responded to the question, only 27% shared the price of
QuickRide. Respondents who shared the QuickRide toll did not vary significantly from those
who did not based on household income, household size, age, or occupation. However, those
who traveled on QuickRide with family members were significantly less likely to share the
QuickRide price (p=≤0.01) than those who did not travel with family members. This result
seemed intuitive, since most users riding on QuickRide with a family member would consider
the $2 toll as a single charge to the entire household.
QuickRide users and non-users
Socio-economic data from the survey of Katy Freeway travelers who did not enroll in QuickRide
was compared with that of the QuickRide users (See Table 3). It was found that those who
enrolled in the QuickRide program were both younger (p≤0.01) and had higher incomes
(p=0.039) than those who did not enroll.
By making several assumptions, the average age, household size, and household income of the
average QuickRide user survey respondent and non-user survey respondent could be roughly
10

estimated. For each age group on the survey, the average age of the group’s range was assumed,
with those over 65-years-old assumed to be 70-years-old. For household size, the mean
household size of each group was assumed, with the 7 or more group assumed to be a household
size of 8. For household income, the $10,000 or less group was assumed to have an average
household income of $10,000, and the over $100,000 group was assumed to have an average
household income of $150,000. The remaining groups were assumed to be the average of their
income range. The average age, household size, and household income of both users and non-
users were then calculated (see Table 4). These results compare well with results from a 1989
survey conducted by the Texas Transportation Institute on drivers on the Katy Freeway main
lanes (16). In the 1989 survey, the median age was 40, and the percent of drivers in each
occupation category was very similar to the 1998 survey.
COSTS AND BENEFITS OF QUICKRIDE
Since the focus of this research was on the equity issues associated with the QuickRide program,
this analysis of the costs and benefits of QuickRide was limited to drivers only – both users and
non-users. The externalities of the program, as well as the costs and benefits of the program to
the operating agency, were not addressed.
The costs of the QuickRide program were charged solely to those who used it. Therefore, non-
users were not disadvantaged in any way. This included those traveling in the main lanes as they
experienced a small reduction in traffic and those HOV and transit users in the HOT lanes who
did experience more traffic, but still traveled at free flow speeds. Any free services a motorist
using the Katy Freeway had before the implementation of QuickRide, remained free after the
program began. For those who did enroll in the program, there was another transportation option
available to them for their morning and afternoon commute. Although the price (both implicit
and explicit) of using QuickRide might have prohibited regular use of the HOT lane for some
drivers, the option to bypass regular congestion was available for those times when a user’s value
of time exceeded the minimum value of time savings offered by QuickRide.
11
There were almost no significant differences in the perceptions of QuickRide, and of QuickRide
usage, amongst the different socio-economic groups of QuickRide enrollees. The one significant
difference that may indicate a potential equity concern was that QuickRide enrollees had
significantly higher incomes than drivers on the Katy Freeway who had not enrolled.
To better understand why QuickRide users typically had higher incomes, the cost of signing up
for QuickRide was examined. To enroll in the program, a $15 transponder deposit was required,
along with a $40 prepaid account. Each time a transponder was used, a $2 fee was deducted
from the prepaid account. Once the account depleted to a value of $10, the user’s account was
charged to bring the credit back to $40. A $2.50 monthly service fee was also charged for each
transponder. A credit card was required to enroll in QuickRide. This requirement, along with
the fees, could have made QuickRide prohibitively expensive for some users, particularly those
with low incomes.
For each QuickRide use, there were two primary costs involved: the cost of the toll ($2.00), and
the cost involved in forming a two-person carpool. The $2.00 toll charge would seem relatively
more expensive to an individual with a lower income, than it would to an individual with a
higher income. Also, lower income individuals already spend a higher proportion of their
income on transportation (4). However, the cost involved with forming a two-person carpool
(mainly a time cost) would seem relatively more expensive to an individual with a higher
income, due to their higher value of time.
A QuickRide trip provided an estimated value of time savings of $6.00 per hour (9). This was
based on a 20-minute average time savings from using the lane. Therefore, it was assumed that
if the combined value of time of the two members of a carpool exceeded $6.00 an hour, then the
two individuals would use QuickRide. However, in practice, less than 12% of QuickRide
participants averaged more than two QuickRide trips per week, despite the users’ high average
income.
There were several possible reason for the infrequent use of QuickRide, including:
12

• Enrollees only carpooled occasionally and therefore only used QuickRide occasionally.
However, a large number of QuickRide users did carpool frequently and many took their
children back and forth to school. Therefore, this does not explain the low frequency of
QuickRide use.
• Enrollees only used the program when traffic appeared much worse than average.
However, from usage records, QuickRide had a fairly consistent number of uses per day
and did not fluctuate greatly. Therefore, this reason cannot explain the infrequent use.
This leaves the option that drivers, and passengers, simply did not value their time at more than
$6/hour (per vehicle) very often. In other words, the QuickRide program might have been
considered by many drivers to be a rare luxury, used only when saving time was particularly
important.
The data gathered on QuickRide users and non users suggests that the monetary costs involved
with QuickRide are still great enough to deter some from signing up for the program. However,
when non-users were asked why they did not enroll in QuickRide, these were their top five
responses (9):
1. No one to carpool with (16%)
2. Do not know how to sign up (15%)
3. HOV lanes should be free (14%)
4. Price too high (12%)
5. Do not want to carpool (12%)
So, although cost is a deterrent for some potential users, there are also many other significant
deterrents including the hassle of forming a two-person carpool.
CONCLUSION
For the QuickRide enrollees who responded to the survey, QuickRide usage did not vary with
income, age, occupation, or household size. Opinions on QuickRide price, opinions on driving
alone on the HOV lane, and whether or not a user shared the QuickRide price were also found
not to vary with income, age, occupation, or household income. However, those who used
13

QuickRide and who filled out the survey had higher incomes, and were younger, than Katy
Freeway drivers who did not enroll in the QuickRide program.
The price of signing up for and using QuickRide could account for this difference. The
QuickRide program could potentially benefit anyone traveling along the Katy Freeway in a two-
person carpool with a combined value of time greater than $6.00 per hour. The cost implied with
forming a two-person carpool may also have deterred some individuals from using QuickRide.
However, this cost should not prove greater to individuals with a lower household income.
QuickRide increased the number of travel choices along the Katy Freeway for those who
enrolled in the program. At the same time, some cars moved from the main lanes to the HOV
lane, though not enough to cause a significant decrease in congestion on the main lanes. Those
who used the HOV lane for free (three or more person carpools and transit riders) were no worse
off due to the program because the HOV lane remained uncongested during peak periods.
Therefore, no individuals were worse off due to the program. If the program had any drawbacks
in terms of equity, it is the possibility that the price prohibits some individuals with lower
incomes from enrolling in the program.
It is recommended that further study be conducted on why many individuals choose not to enroll
in QuickRide and why those who do use QuickRide use it so infrequently. A project is currently
underway to further investigate equity issues and driver opinion regarding the QuickRide
program. With this information, a better understanding can be developed on the demand for
HOV2 value pricing, and on the equity considerations of other HOT lane programs.
ACKNOWLEDGMENTS
The contents of this paper reflect the views of the authors, who are responsible for the facts and
the accuracy of the data presented herein. This paper was a result of research conducted in
cooperation with the Federal Highway Administration (FHWA), the Texas Department of
Transportation (TxDOT) and the Metropolitan Transit Authority of Harris County, Texas. The
14
authors gratefully acknowledge the contributions of numerous individuals and organizations who
made the successful completion of this paper possible.
REFERENCES
1. Pigou, A.C. The Economics of Welfare. Macmillan, London, 1920.
2. Walters, A. The Economics of Road User Charges. International Bank for Reconstruction
and Development, Johns Hopkins Press, MD, 1968.
3. U.K. Ministry of Transport. Road Pricing: The Economic and Technical Possibilities.
London: Her Majesty's Stationary Office, 1964.
4. Bureau of Labor Statistics. (1997) 1997 Consumer Expenditure Survey,
<ftp://ftp.bls.gov/pub/special.requests/ce/standard/1997>, accessed January, 2003.
5. Transportation Research Board. Curbing Gridlock, Peak-Period Fees to Relieve Traffic
Congestion, Vol. 1, National Research Council Special Report # 242, Washington, D.C.,
1994.
6. Harrington, Winston, Alan J. Krupnick, Anna Alberini. Overcoming Public Aversion to
Congestion Pricing. Transportation Research, Part A 35, 2001, p. 93-111.
7. Jakobsson, C., S. Fujii, and T. Garling. Determinants of Private Car Users’ Acceptance of
Road Pricing. Transport Policy, Volume 7, 2000, p. 153-158.
8. Viegas, J. Making Urban Road Pricing Acceptable and Effective: Searching for Quality
and Equity in Urban Mobility, Transport Policy, Volume 8, Issue 4, 2001, pp. 289-294.
15

9. Stockton, W., N. Edmonson, P. Hughes, M. Hickman, D. Puckett, Q. Brown, A. Miranda,
and S. Woong. An Evaluation of the Katy Freeway HOV Lane Pricing Project. Texas
Transportation Institute, Report Number E 305001, College Station, Texas, 2000.
10. Federal Highway Administration. 2000 Report on the Value Pricing Pilot Program. U.S.
Department of Transportation, Report Number FHWA-PL-00-026, Washington D.C.,
2000.
11. Hubert H. Humphrey Institute of Public Affairs. Value Pricing Homepage.
http://www.hhh.umn.edu/centers/slp/projects/conpric/index.htm. Accessed Jul. 15, 2002.
12. Shin, S. W., and M. Hickman. Effectiveness of the Katy Freeway HOV-Lane Pricing
Project: Preliminary Assessment. In Transportation Research Record 1659, TRB,
National Research Council, Washington, D.C., 1999, pp. 97-104
13. Hickman, M., Q. Brown, and A. Miranda. Katy Freeway High-Occupancy Vehicle Lane
Pricing Project, Houston, Texas. In Transportation Research Record 1732, TRB,
National Research Council, Washington, D.C., 2000, pp. 32-41.
14. Giuliano, G. Equity and Fairness Considerations of Congestion Pricing. Curbing
Gridlock: Peak-Period Fees to Relieve Traffic Congestion. Transportation Research
Board Special Report 242, Vol. 2. Washington, DC: National Academy Press, 1994, pp.
250-279.
15. Litman, T. Evaluating Transportation Equity. Victoria Transport Policy Institute,
Victoria, BC, Canada, 1999.
16. Bullard, D.L. An Assessment of Carpool Utilization of the Katy High-Occupancy Vehicle
Lane and the Characteristics of Houston’s HOV Lane Users and Nonusers. Texas
Transportation Institute, Research Report 484-14F, College Station, TX, 1991.
16

LIST OF TABLES
TABLE 1 Stated and Actual Average QuickRide Usage
TABLE 2 Difference in Stated and Actual QuickRide Usage
TABLE 3 User and Non-user Demographics
TABLE 4 User and Non-user Average Age, Household Size and Household Income
17
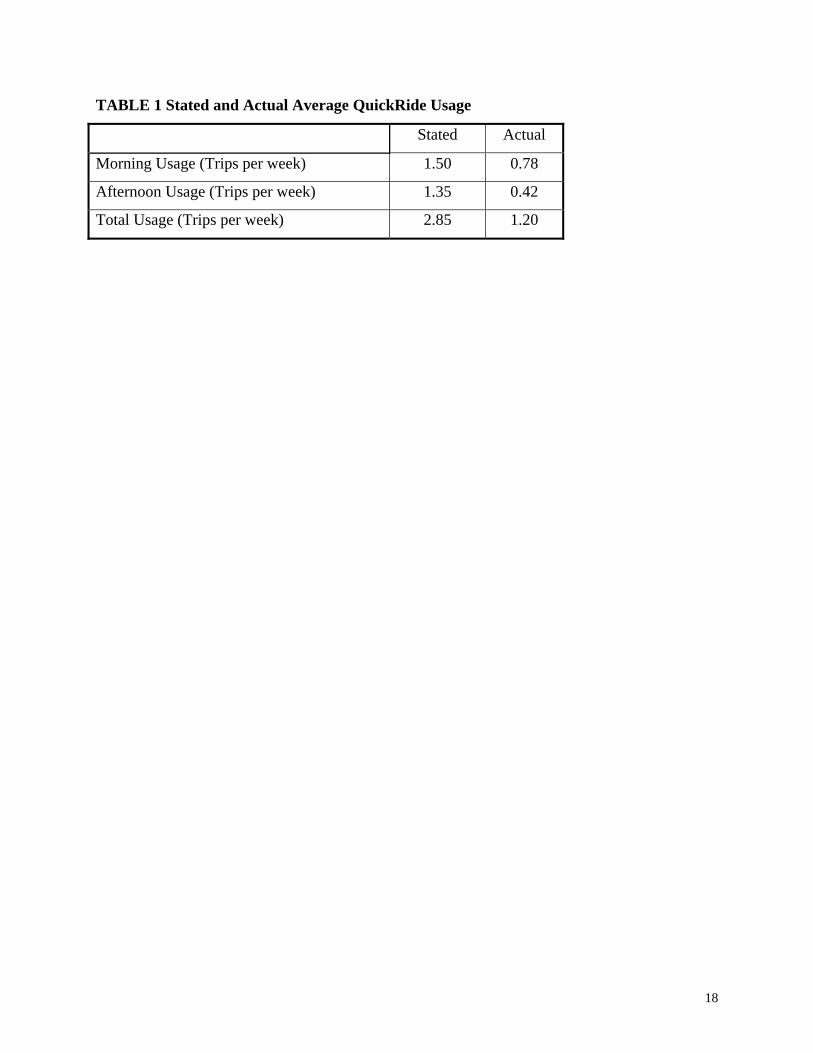
TABLE 1 Stated and Actual Average QuickRide Usage
Stated Actual
Morning Usage (Trips per week) 1.50 0.78
Afternoon Usage (Trips per week) 1.35 0.42
Total Usage (Trips per week) 2.85 1.20
18

TABLE 2 Difference in Stated and Actual QuickRide Usage Category Stated Minus
Actual Weekly Number of Trips
(Morning)
Stated Minus Actual Weekly
Number of Trips (Afternoon)
Household Income Under $75,000 0.70 0.98 Above $75,000 0.79 0.97
Age 16 to 25 1.81 1.29 26 to 37 0.39 0.90 38 to 49 0.77 0.97 50 to 64 0.72 0.70
65 and over 1.74 0.60 Occupation
Professional/Managerial 0.71 1.00 Technical 0.46 1.14
Sales 0.51 0.37 Administration/Clerical 0.69 0.35
Manufacturing - - Retired 2.82 1.75 Student 2.92 -0.04
Unemployed - - Other -0.41 0.18
Household Size 1 to 2 0.76 1.07 3 to 4 0.63 0.89 5 to 6 0.98 0.75
7 or more -0.31 -0.36
19
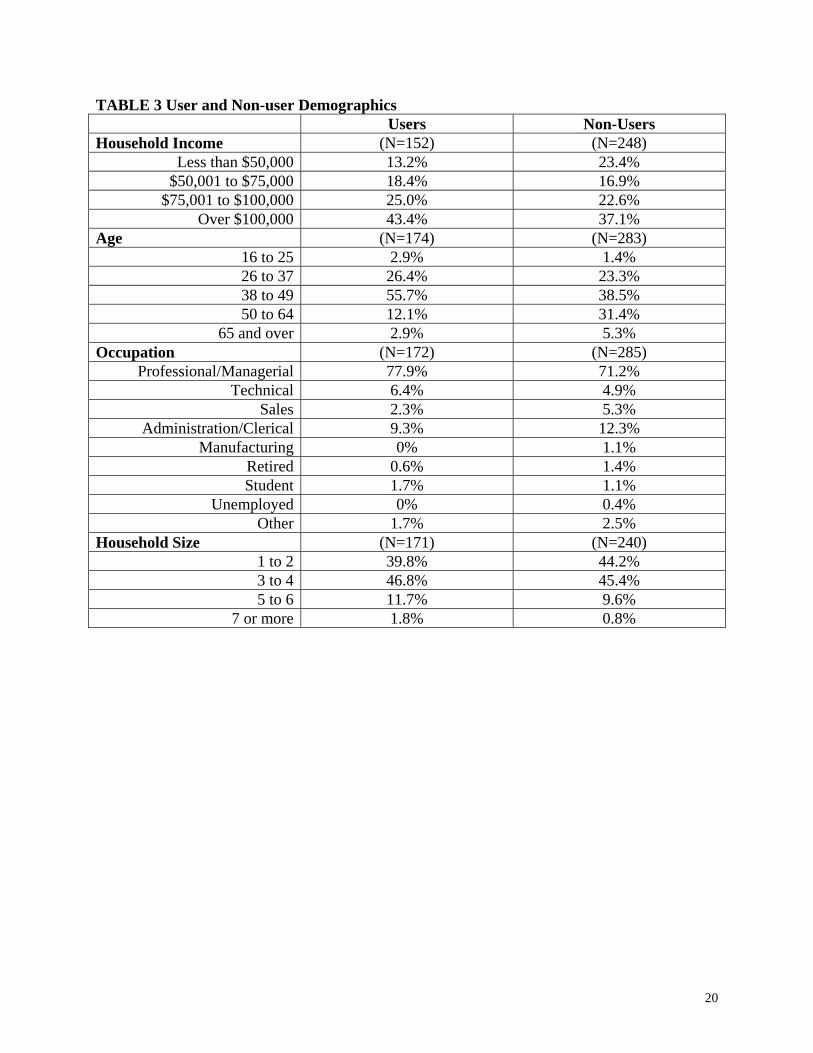
TABLE 3 User and Non-user Demographics Users Non-Users Household Income (N=152) (N=248)
Less than $50,000 13.2% 23.4% $50,001 to $75,000 18.4% 16.9%
$75,001 to $100,000 25.0% 22.6% Over $100,000 43.4% 37.1%
Age (N=174) (N=283) 16 to 25 2.9% 1.4% 26 to 37 26.4% 23.3% 38 to 49 55.7% 38.5% 50 to 64 12.1% 31.4%
65 and over 2.9% 5.3% Occupation (N=172) (N=285)
Professional/Managerial 77.9% 71.2% Technical 6.4% 4.9%
Sales 2.3% 5.3% Administration/Clerical 9.3% 12.3%
Manufacturing 0% 1.1% Retired 0.6% 1.4% Student 1.7% 1.1%
Unemployed 0% 0.4% Other 1.7% 2.5%
Household Size (N=171) (N=240) 1 to 2 39.8% 44.2% 3 to 4 46.8% 45.4% 5 to 6 11.7% 9.6%
7 or more 1.8% 0.8%
20
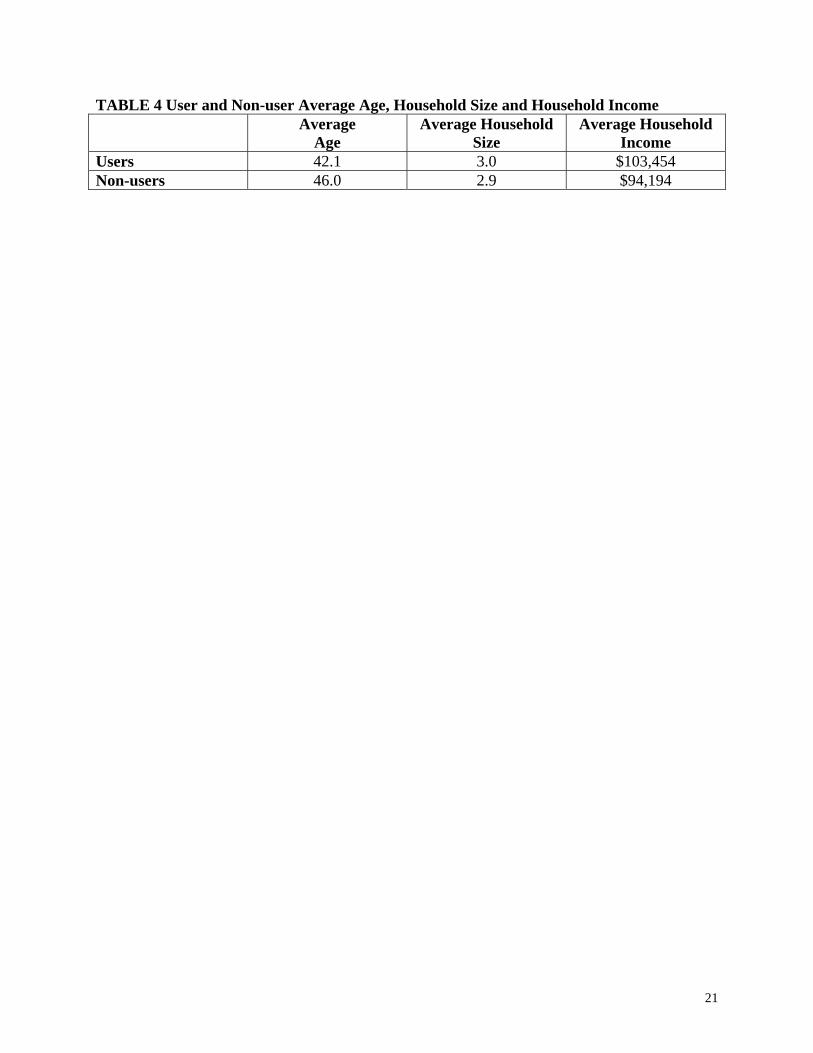
TABLE 4 User and Non-user Average Age, Household Size and Household Income Average
Age Average Household
Size Average Household
Income Users 42.1 3.0 $103,454 Non-users 46.0 2.9 $94,194
21
Related Documents