Equatorial aerosol-ozone structure and variations as observed by balloon-borne backscattersondes since 1995 at Natal, Brazil (6° ° S) James M. Rosen, Raymond M. Morales, and Norman T. Kjome Department of Physics and Astronomy, University of Wyoming, Laramie, Wyoming, USA Volker W. J. H. Kirchhoff Laboratorio Ozonio, Instituto Nacional de Pequisas Espaciais (INPE), Sa ˜o Jose ´ dos Campos, Brazil Francisco R. da Silva Laboratorio Ozonio, Instituto Nacional de Pequisas Espaciais (INPE), Natal, Brazil Received 24 April 2003; revised 5 August 2003; accepted 12 November 2003; published 3 February 2004. [1] Simultaneous aerosol and ozone profiles have been measured near Natal, Brazil (6.07°S, 35.34°W) in an irregular but continuing effort since 1995 using balloon-borne backscattersondes. This study introduces the primary features of the data set and our preliminary interpretation. Although measurements from ground level to 32 km are made, the results reported here focus on the free troposphere (FT). An apparent clear annual cycle in the occurrence of FT aerosol layers is observed, which peaks during the biomass burning season, similar to the previously reported annual cycle in tropical ozone layers. A majority of the layers occurring during the burning season contain enhancements of both aerosol and ozone. The comparatively low amounts of aerosol backscatter enhancements found in the FT layers indicate that any aerosols originating in the much higher concentrations of the planetary boundary layer (PBL) must have been greatly reduced in backscatter before they were observed in the soundings. In general, the FT backscatter profile over Natal can be described as displaying a background or baseline character that is frequently perturbed by layers of various concentrations and thicknesses. Although only the last stages of the Pinatubo volcanic aerosol decay were observed, a curious multiple-step reduction in the aerosol was seen in the profiles near 20 km. Because the soundings were conducted with varying regularity in a limited time period, current interpretation of results can only be considered tentative. INDEX TERMS: 0305 Atmospheric Composition and Structure: Aerosols and particles (0345, 4801); 0345 Atmospheric Composition and Structure: Pollution—urban and regional (0305); 0368 Atmospheric Composition and Structure: Troposphere—constituent transport and chemistry; KEYWORDS: aerosol, ozone, backscattering Citation: Rosen, J. M., R. M. Morales, N. T. Kjome, V. W. J. H. Kirchhoff, and F. R. da Silva (2004), Equatorial aerosol-ozone structure and variations as observed by balloon-borne backscattersondes since 1995 at Natal, Brazil (6°S), J. Geophys. Res., 109, D03201, doi:10.1029/2003JD003715. 1. Introduction [2] Aerosols have long been recognized as an important component in a wide range of atmospheric processes. The possible role of volcanic aerosols in shaping long term climate variations has been the subject of many studies. More recently considerable attention has been given to quantitatively identifying the radiative impact of tropo- spheric aerosols in relation to the overall assessment of global warming. Aerosols are also an essential component of atmospheric chemistry because they may provide sites for surface reactions and form from trace gas species whose reaction products have sufficiently low effective vapor pressures for condensation. Since aerosols are easily and routinely measured at the sub ppbm level, they can provide a very sensitive method of identifying perturbations from normal conditions, chemically active air masses, sources and sinks, and atmospheric transport. [3] The present study, which began on an irregular basis in 1995, employs the backscattersonde for a high-resolution quantitative measurement of aerosols in an altitude and latitude region that was notably lacking in systematic observations, namely, the equatorial free troposphere extending from the PBL top to the tropopause. We also obtain measurements throughout the PBL and stratosphere, and while such information is frequently useful for inter- preting aspects of the FT aerosol, they are not the principal focus of the present report. To assist in the interpretation of the aerosol profiles and to provide further insights, simul- taneous measurements of ozone, temperature, relative humidity (RH), and pressure are also part of the standard backscattersonde data system. JOURNAL OF GEOPHYSICAL RESEARCH, VOL. 109, D03201, doi:10.1029/2003JD003715, 2004 Copyright 2004 by the American Geophysical Union. 0148-0227/04/2003JD003715 D03201 1 of 10

Welcome message from author
This document is posted to help you gain knowledge. Please leave a comment to let me know what you think about it! Share it to your friends and learn new things together.
Transcript
Equatorial aerosol-ozone structure and variations as observed by
balloon-borne backscattersondes since 1995 at Natal, Brazil (6��S)James M. Rosen, Raymond M. Morales, and Norman T. KjomeDepartment of Physics and Astronomy, University of Wyoming, Laramie, Wyoming, USA
Volker W. J. H. KirchhoffLaboratorio Ozonio, Instituto Nacional de Pequisas Espaciais (INPE), Sao Jose dos Campos, Brazil
Francisco R. da SilvaLaboratorio Ozonio, Instituto Nacional de Pequisas Espaciais (INPE), Natal, Brazil
Received 24 April 2003; revised 5 August 2003; accepted 12 November 2003; published 3 February 2004.
[1] Simultaneous aerosol and ozone profiles have been measured near Natal, Brazil(6.07�S, 35.34�W) in an irregular but continuing effort since 1995 using balloon-bornebackscattersondes. This study introduces the primary features of the data set and ourpreliminary interpretation. Although measurements from ground level to �32 km aremade, the results reported here focus on the free troposphere (FT). An apparent clearannual cycle in the occurrence of FT aerosol layers is observed, which peaks during thebiomass burning season, similar to the previously reported annual cycle in tropical ozonelayers. A majority of the layers occurring during the burning season contain enhancementsof both aerosol and ozone. The comparatively low amounts of aerosol backscatterenhancements found in the FT layers indicate that any aerosols originating in the muchhigher concentrations of the planetary boundary layer (PBL) must have been greatlyreduced in backscatter before they were observed in the soundings. In general, the FTbackscatter profile over Natal can be described as displaying a background or baselinecharacter that is frequently perturbed by layers of various concentrations and thicknesses.Although only the last stages of the Pinatubo volcanic aerosol decay were observed, acurious multiple-step reduction in the aerosol was seen in the profiles near 20 km. Becausethe soundings were conducted with varying regularity in a limited time period, currentinterpretation of results can only be considered tentative. INDEX TERMS: 0305 Atmospheric
Composition and Structure: Aerosols and particles (0345, 4801); 0345 Atmospheric Composition and
Structure: Pollution—urban and regional (0305); 0368 Atmospheric Composition and Structure:
Troposphere—constituent transport and chemistry; KEYWORDS: aerosol, ozone, backscattering
Citation: Rosen, J. M., R. M. Morales, N. T. Kjome, V. W. J. H. Kirchhoff, and F. R. da Silva (2004), Equatorial aerosol-ozone
structure and variations as observed by balloon-borne backscattersondes since 1995 at Natal, Brazil (6�S), J. Geophys. Res., 109,
D03201, doi:10.1029/2003JD003715.
1. Introduction
[2] Aerosols have long been recognized as an importantcomponent in a wide range of atmospheric processes. Thepossible role of volcanic aerosols in shaping long termclimate variations has been the subject of many studies.More recently considerable attention has been given toquantitatively identifying the radiative impact of tropo-spheric aerosols in relation to the overall assessment ofglobal warming. Aerosols are also an essential componentof atmospheric chemistry because they may provide sitesfor surface reactions and form from trace gas species whosereaction products have sufficiently low effective vaporpressures for condensation. Since aerosols are easily androutinely measured at the sub ppbm level, they can provide
a very sensitive method of identifying perturbations fromnormal conditions, chemically active air masses, sourcesand sinks, and atmospheric transport.[3] The present study, which began on an irregular basis
in 1995, employs the backscattersonde for a high-resolutionquantitative measurement of aerosols in an altitude andlatitude region that was notably lacking in systematicobservations, namely, the equatorial free troposphereextending from the PBL top to the tropopause. We alsoobtain measurements throughout the PBL and stratosphere,and while such information is frequently useful for inter-preting aspects of the FT aerosol, they are not the principalfocus of the present report. To assist in the interpretation ofthe aerosol profiles and to provide further insights, simul-taneous measurements of ozone, temperature, relativehumidity (RH), and pressure are also part of the standardbackscattersonde data system.
JOURNAL OF GEOPHYSICAL RESEARCH, VOL. 109, D03201, doi:10.1029/2003JD003715, 2004
Copyright 2004 by the American Geophysical Union.0148-0227/04/2003JD003715
D03201 1 of 10
[4] In this report we present an overview of initial results,which are based on 31 soundings. Two of these soundingswere made at Cuiaba, Brazil (16�S, 56�W) in September andOctober 1995 (peak of the biomass burning season at thatlocation) and the remainder were made at Natal, Brazil(5.8�S, 35.2�W) from November 1995 to December 2002.In particular, we begin here by addressing the followingquestions and issues concerning the tropical FT: (1) Is therean annual cycle in the aerosol profiles similar to knowncycles in ozone and biomass burning? (2) Is there anidentifiable FT background or baseline profile similar to thatfound at other latitudes? (3) What are the probable sourceregions of the perturbing layers as inferred through backtrajectory analysis? (4) To what extent do the burning seasonaerosol perturbations enhance the column loadings of the FT?[5] Our current equatorial backscattersonde program is a
continuing effort with monthly soundings, and it is expectedthat future papers will appear describing results not treatedhere as well as updating and elaborating previous findings.The full data set will be made available through theNetwork for Detection of Stratospheric Change (NDSC)web site data base (www.ndsc.ncep.noaa.gov), which atpresent contains most of the backscattersonde data fromother latitudes.
2. Instrumentation
[6] The backscattersonde was first described by Rosen andKjome [1991] and has since been frequently employed instudies similar to the work here but for northern and southernmidlatitudes [Rosen et al., 1997, 2000; Liley et al., 2001], forarctic regions [Suortti et al., 2001], and for Antarctica [Rosenet al., 1993]. A further description of the accuracy, errors,resolution, calibration, calibration stability, and supportingonboard integrated sensors (pressure, temperature, RH andozone) has been given by Rosen et al. [2000].[7] Briefly, the balloon-borne instrument measures the
local ambient backscattered light at two wavelengths ofnominally 940 nm (red channel) and 490 nm (blue channel)wavelength and thus is not a remote sensing type device. Theresulting aerosol data product is similar to profiles obtainedwith high-resolution, low-noise lidar but has the decidedadvantage of concurrent air temperature, ozone and RH, aswell as pressure information. In addition, profiles can beobtained in cloudy conditions. It should also be noted that theaerosols are observed truly in situ and are not subject tomodification by inlet sampling, sedimentation and/or evap-oration as might occur in other types of sampling techniques.[8] Before flight every instrument is absolutely calibrated
in the sense that the signal for aerosol free air under ambienttemperature and pressure conditions is known. Thus thebackscatter ratio (BKSR, ratio of signal to aerosol freesignal) and the aerosol backscatter ratio (ABKSR =BKSR-1) can be calculated throughout each flight usingthe preflight calibration as well as the ambient pressure andtemperature to adjust the surface level calibration to ambientconditions. This procedure does not require any normaliza-tion to presumed aerosol free air occurring somewhere inthe profile, as is assumed in many lidar data reductionschemes. The short term stability of the calibrated instru-ments can be determined by the repeatability of the strato-spheric profiles in ascent-descent profiles and the longer
term calibration stability can be assessed by comparingprofiles over periods of stable stratospheric conditions, asfound in the soundings since 1995 and exemplified by thelowest stratospheric values shown in Figure 1.[9] The two wavelength measurements allow for a crude
size estimate of the aerosol particles. In practice onlythree size ranges are clearly identifiable, namely ‘‘small’’,‘‘medium’’ and ‘‘large.’’ Experience shows that the largeparticles include clouds and wind blown dust, while mostother natural aerosols fall into the medium size range. Verylarge numbers of fine particles (such as condensation nuclei)are needed to obtain a sufficient signal to identify particles inthe small range. A color index (CI = ABKSR red/ABKSRblue) has been defined to help quantitatively categorize thesizes. Usually aerosol CI falls between �4 and �6, whilewind blown dust is�10, and cloud particles are above 10 andusually closer to 15. A more quantitative effort to relate CI toparticle size for various size distributions is given by Rosenand Kjome [1991] and supports the quantitative CI valuesgiven above.[10] The pressure, temperature, and RH measurements are
made with the well known Vaisala RS80 sensors whichundergo a pressure recalibration check in our laboratorybefore every flight. Although the accuracy of the pressureand temperature sensors are more than sufficient for thebackscattersonde analysis, it is known that the RH sensorrequires a temperature correction, especially for the middleand upper troposphere [Carlson and Wang, 2002] and doesnot produce a useful response in the very dry air of the
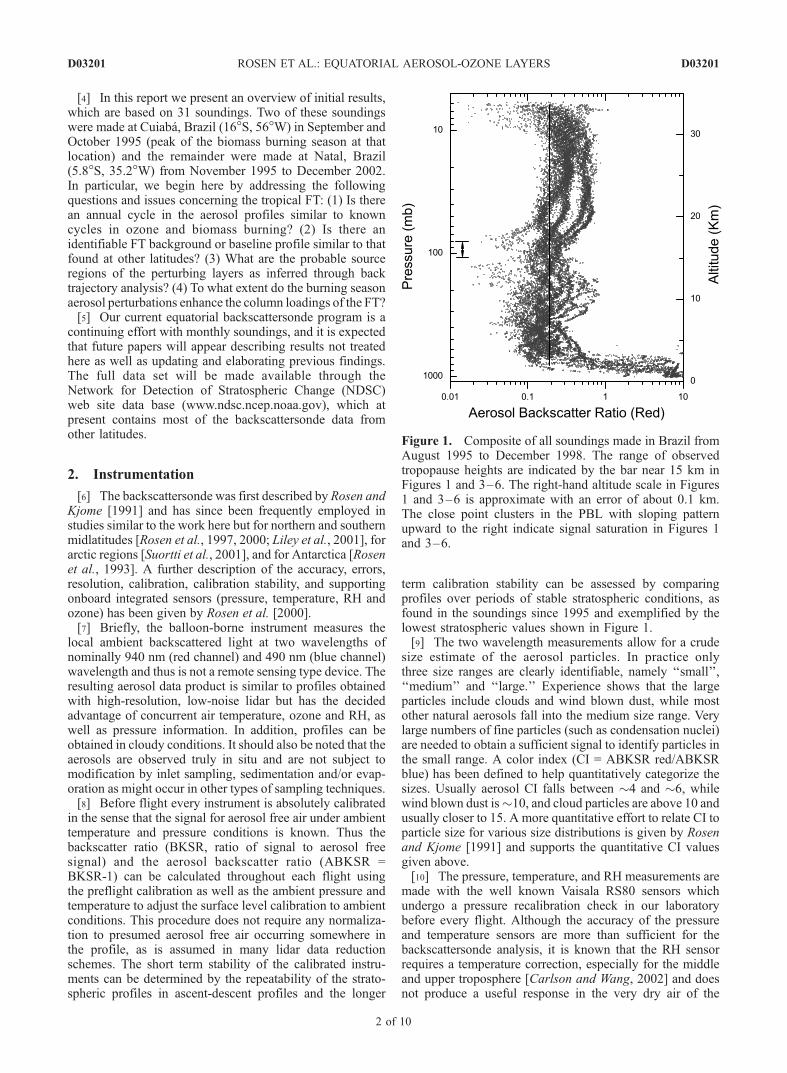
Figure 1. Composite of all soundings made in Brazil fromAugust 1995 to December 1998. The range of observedtropopause heights are indicated by the bar near 15 km inFigures 1 and 3–6. The right-hand altitude scale in Figures1 and 3–6 is approximate with an error of about 0.1 km.The close point clusters in the PBL with sloping patternupward to the right indicate signal saturation in Figures 1and 3–6.
D03201 ROSEN ET AL.: EQUATORIAL AEROSOL-OZONE LAYERS
2 of 10
D03201
stratosphere. We have developed our own temperature cor-rection algorithm based on the average response of theVaisala sensors used in our soundings in conjunction withthe requirement that the frost point equals the air temperaturein upper tropospheric clouds (as detected by the backscatter-sonde). This can only be considered an approximate generalcorrection, since each sensor may differ somewhat in therequired correction factor and the frost point in clouds is notnecessarily equal to the local air temperature [Ovarlez et al.,2002]. However, when plotting our algorithmic frost pointwith the temperature profile as an analysis tool, the frost pointvisually appears essentially equal to the air temperature inclouds in almost all cases, as would be expected for a perfectcorrection. Thus we believe that our frost point algorithmused in this way with the temperature profile plots provides auseful supporting tool to aid in the general identification ofsaturated or nearly saturated air where the probability ofcloud occurrence is expected to be high. It might also benoted that comparison of ascent and descent frost pointprofiles usually shows good agreement to temperatures aslow as �65�C which addresses the question of sensorresponse and repeatability. However, the reader is warnedthat while our frost point algorithm may be justified as aspecifically focused analysis tool, it would not necessarilyyield water vapor mixing ratio values of sufficient accuracyto address most questions of interest, since the uncertainty infrost point will lead to a large error in mixing ratio.[11] The ozone sensor is an electro-chemical cell (ECC)
type and prepared in the same manner and by the samepersonnel that launch ozonesondes from Natal as part of theSHADOZ network [Thompson et al., 2003].
3. Atmospheric Setting and Conditions
[12] The balloon launches take place from Monte Alegre(6.07�S, 35.34�W), a small town about 35 km southwest ofNatal and about 25 km inland. The typical time of release is�2 hours after local sunset and not during extended rainyconditions or local rain showers.[13] A very pronounced PBL is almost always present,
being easily identified at the top (3.0 ± 0.6 km) by atemperature inversion, sudden large drop in ABKSR aswell as RH. Although the ABKSR is relatively large in thePBL at Monte Alegre, it does not appear to be significantlydifferent from observed coastal surface conditions, whichare heavily influenced by the flushing action of the tradewinds. Visually the air in the region usually appearsrelatively clear, suggesting that the area is not heavilyinfluenced by local pollution probably because most poten-tial sources are downwind. During fire season, Natal isoutside the main burning regions as is evident from satelliteobservations [Kaufman et al., 1998; Prins et al., 1998].[14] The location of the tropopause in our soundings
(16.7 ± 0.6 km, �80.7 ± 2�C) is usually unambiguouslyidentified in the temperature structure with a large, consist-ent change in lapse rate occurring at or close to theminimum temperature and near a location where ozoneabruptly starts a monotonic increase to stratospheric values.For our soundings these parameter changes take placewithin about a 1 km thick region (or less) so that there isa relatively small uncertainty in the tropopause locationsindicated in the relevant figures below.
[15] Winds aloft might be described as light and variablefrom the experience of only a few soundings. The balloonusually ascends approximately strait overhead and lands afew tens of km from the launch site. Although the averagewinds aloft could be described systematically in terms ofperiodic variations using larger databases, it has proven to bemore applicable for our current limited soundings to simplyuse back trajectory calculations related to the sounding ofinterest.
4. Results
4.1. Preliminary: Cloud Removal
[16] In the data presented here except in one noted exam-ple, cloud layers have been removed for improved clarity.There is little ambiguity in identifying cloud layers sinceabrupt and continuing significant changes in the ABKSR areobserved when the backscattersonde enters or exits a cloud.In addition, the CI reflects a major change when entering acloud, indicating much larger particles. Our frost pointalgorithm also provides independent supporting evidencethat will suggest if cloud conditions are probable, notprobable, or not possible, depending on the frost pointdepression and measurement uncertainty. The profiles shownhere would not appear drastically different if the cloud datawere included because that data would be off scale (or nearlyoff scale) and only a few of the cloud edge points would showin the noncloud regions. Since the data set is fairly small, weprefer to inspect each sounding separately to make sure noprobable cloud or cloud edge data is included. As more dataaccumulates, it should be possible to develop a more objec-tive computer based algorithm for reliably removing cloudand cloud edge data. However, at present we do not considerthis to be a significant issue.
4.2. Overview of 1995––1999: Volcanic Decay Phase
[17] It is convenient to first present an overview of thefirst 18 soundings made in Brazil covering the years 1995 to1999 since this embraces the final stages of the Mt.Pinatubo volcanic decay period which impacts the interpre-tation of FT aerosols in the tropopause region. Figure 1 is acomposite of these soundings (including the two Cuiabaprofiles) in which the full resolution data has been plotted assingle points and without any smoothing or averaging (butwith clouds removed). The higher ABKSR associated withthe PBL and the variability of aerosols in the 7 to 15 kmregion are easily recognized. Near the 20 km level the18 profiles appear to be gathered into 4 distinct groups withthe ABKSR decreasing in steps monotonically in time.[18] To address possible reasons for the 20 km profile
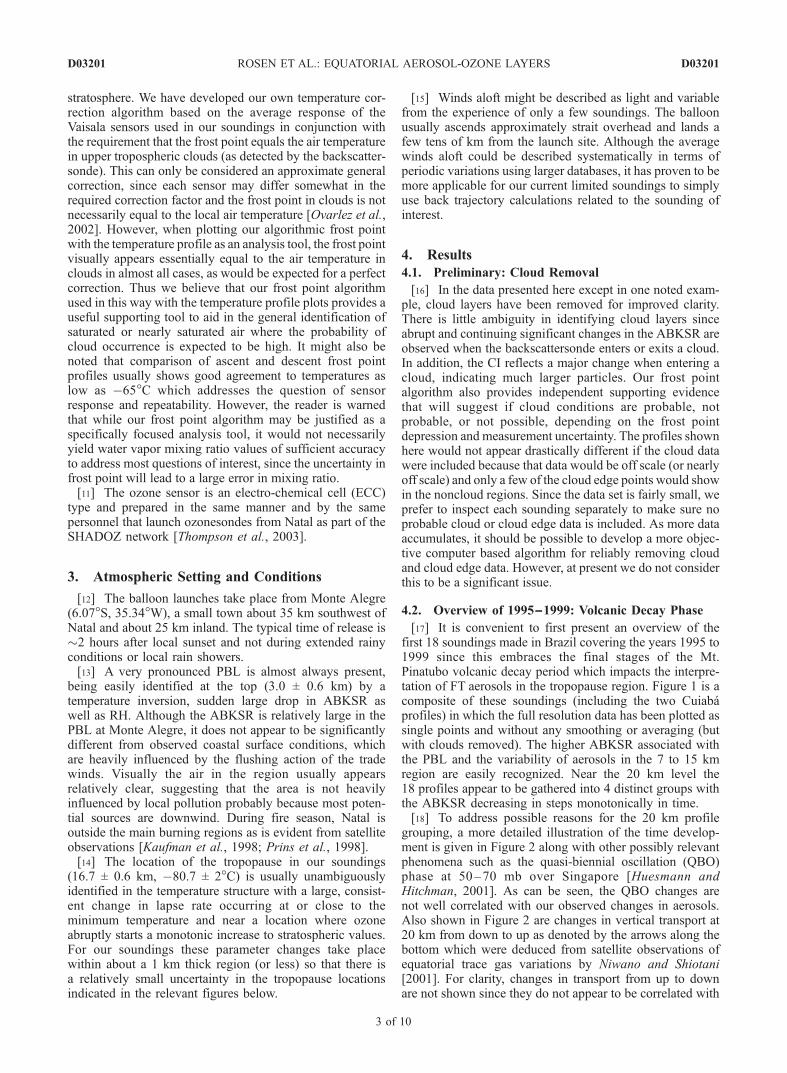
grouping, a more detailed illustration of the time develop-ment is given in Figure 2 along with other possibly relevantphenomena such as the quasi-biennial oscillation (QBO)phase at 50–70 mb over Singapore [Huesmann andHitchman, 2001]. As can be seen, the QBO changes arenot well correlated with our observed changes in aerosols.Also shown in Figure 2 are changes in vertical transport at20 km from down to up as denoted by the arrows along thebottom which were deduced from satellite observations ofequatorial trace gas variations by Niwano and Shiotani[2001]. For clarity, changes in transport from up to downare not shown since they do not appear to be correlated with
D03201 ROSEN ET AL.: EQUATORIAL AEROSOL-OZONE LAYERS
3 of 10
D03201
the aerosol changes. It would appear that there is anapproximate simultaneity between the observed abruptaerosol changes and the arrows along the bottom (signalingchange in vertical transport). However, because the data islacking in good time resolution including one rather largeinterval of no observations, the possibility must be consid-ered that the apparent step decay may be fortuitous andwould not be supported if more data were available. Forexample, if a short term aerosol increase occurred in late1996 to late 1997, a period of no observations, the inter-pretation of Figure 2 might be considerably different. Thusit is not possible using the backscattersonde data alone tocome to a definitive conclusion concerning the reason forthe step decay at 20 km as observed in our data. On theother hand, in viewing Figure 1, it would seem more thanjust chance that 18 soundings would be arranged into 4 suchdistinct successive profile groups near 20 km.
4.3. PBL Aerosols
[19] Although the PBL is not of primary concern here, it isnecessary to have some knowledge of the typical near surfaceABKSR since the PBLmay be a significant potential supplierof aerosols to the FT through deep convective activity andother processes. As shown in Figure 1 and the other profilesillustrated below, the ABKSR in the PBL at Natal is typically40 times more than the baseline FT aerosols. In Brazilianregions under the influence of local biomass burning, such asCuiaba, the PBL ABKSR is considerably more than at Natal[Rosen and Kirchhoff, 1997]. Thus the aerosols of the PBL
have a very large perturbing potential on the relatively cleanFT, especially in burning regions.
4.4. Free Troposphere Aerosols
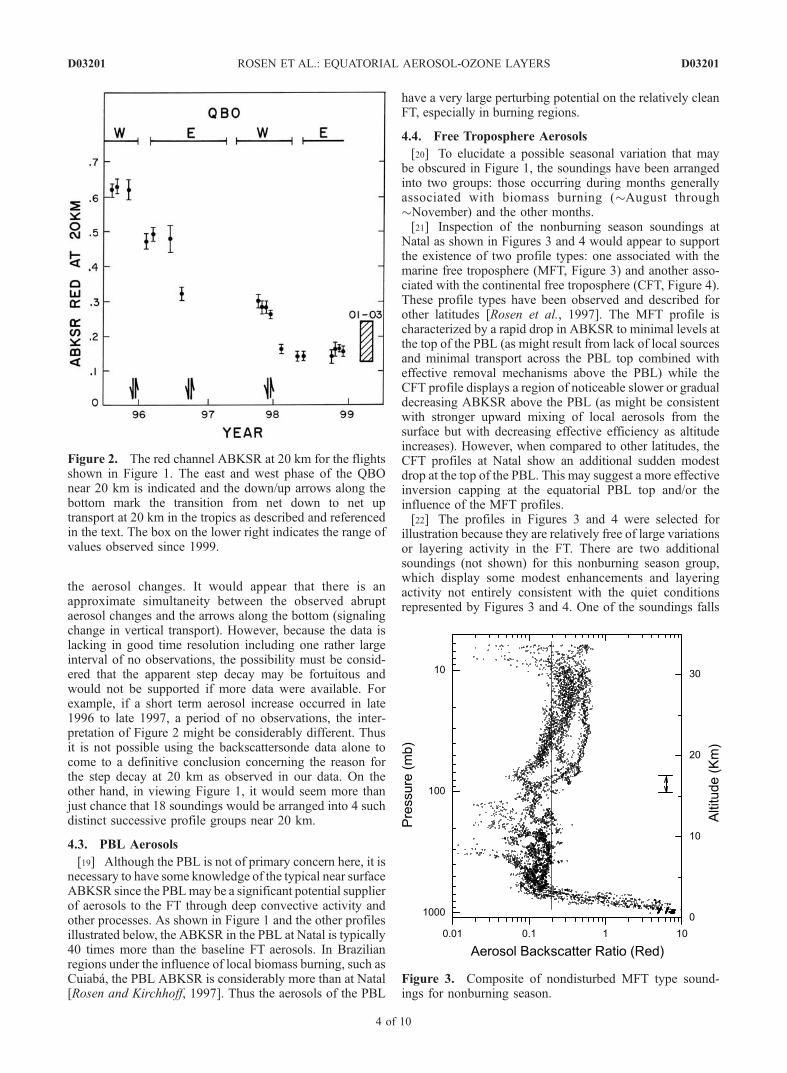
[20] To elucidate a possible seasonal variation that maybe obscured in Figure 1, the soundings have been arrangedinto two groups: those occurring during months generallyassociated with biomass burning (�August through�November) and the other months.[21] Inspection of the nonburning season soundings at
Natal as shown in Figures 3 and 4 would appear to supportthe existence of two profile types: one associated with themarine free troposphere (MFT, Figure 3) and another asso-ciated with the continental free troposphere (CFT, Figure 4).These profile types have been observed and described forother latitudes [Rosen et al., 1997]. The MFT profile ischaracterized by a rapid drop in ABKSR to minimal levels atthe top of the PBL (as might result from lack of local sourcesand minimal transport across the PBL top combined witheffective removal mechanisms above the PBL) while theCFT profile displays a region of noticeable slower or gradualdecreasing ABKSR above the PBL (as might be consistentwith stronger upward mixing of local aerosols from thesurface but with decreasing effective efficiency as altitudeincreases). However, when compared to other latitudes, theCFT profiles at Natal show an additional sudden modestdrop at the top of the PBL. This may suggest a more effectiveinversion capping at the equatorial PBL top and/or theinfluence of the MFT profiles.[22] The profiles in Figures 3 and 4 were selected for
illustration because they are relatively free of large variationsor layering activity in the FT. There are two additionalsoundings (not shown) for this nonburning season group,which display some modest enhancements and layeringactivity not entirely consistent with the quiet conditionsrepresented by Figures 3 and 4. One of the soundings falls
Figure 2. The red channel ABKSR at 20 km for the flightsshown in Figure 1. The east and west phase of the QBOnear 20 km is indicated and the down/up arrows along thebottom mark the transition from net down to net uptransport at 20 km in the tropics as described and referencedin the text. The box on the lower right indicates the range ofvalues observed since 1999.
Figure 3. Composite of nondisturbed MFT type sound-ings for nonburning season.
D03201 ROSEN ET AL.: EQUATORIAL AEROSOL-OZONE LAYERS
4 of 10
D03201
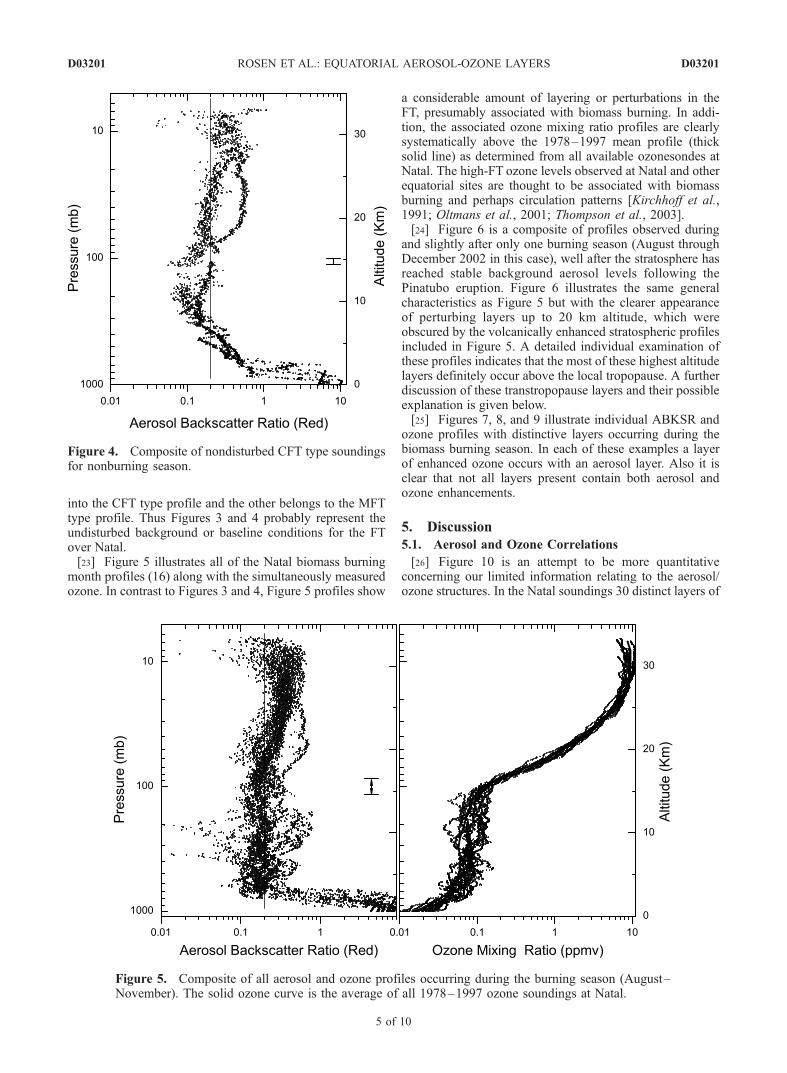
into the CFT type profile and the other belongs to the MFTtype profile. Thus Figures 3 and 4 probably represent theundisturbed background or baseline conditions for the FTover Natal.[23] Figure 5 illustrates all of the Natal biomass burning
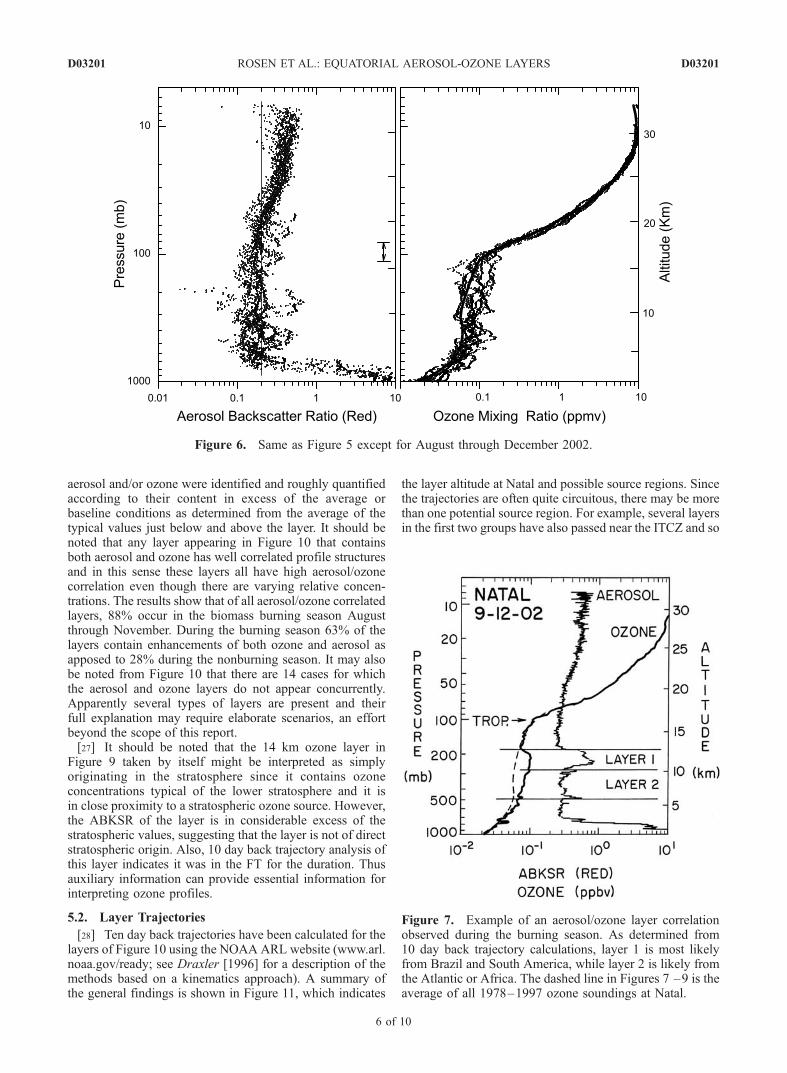
month profiles (16) along with the simultaneously measuredozone. In contrast to Figures 3 and 4, Figure 5 profiles show
a considerable amount of layering or perturbations in theFT, presumably associated with biomass burning. In addi-tion, the associated ozone mixing ratio profiles are clearlysystematically above the 1978–1997 mean profile (thicksolid line) as determined from all available ozonesondes atNatal. The high-FT ozone levels observed at Natal and otherequatorial sites are thought to be associated with biomassburning and perhaps circulation patterns [Kirchhoff et al.,1991; Oltmans et al., 2001; Thompson et al., 2003].[24] Figure 6 is a composite of profiles observed during
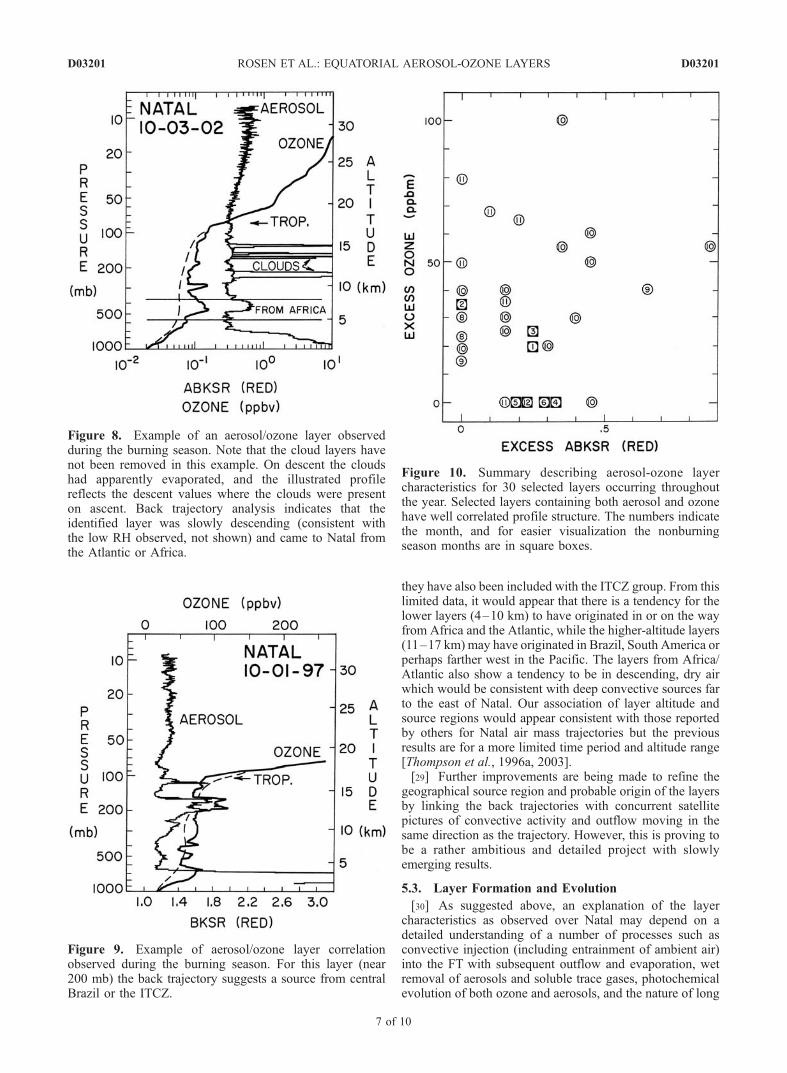
and slightly after only one burning season (August throughDecember 2002 in this case), well after the stratosphere hasreached stable background aerosol levels following thePinatubo eruption. Figure 6 illustrates the same generalcharacteristics as Figure 5 but with the clearer appearanceof perturbing layers up to 20 km altitude, which wereobscured by the volcanically enhanced stratospheric profilesincluded in Figure 5. A detailed individual examination ofthese profiles indicates that the most of these highest altitudelayers definitely occur above the local tropopause. A furtherdiscussion of these transtropopause layers and their possibleexplanation is given below.[25] Figures 7, 8, and 9 illustrate individual ABKSR and
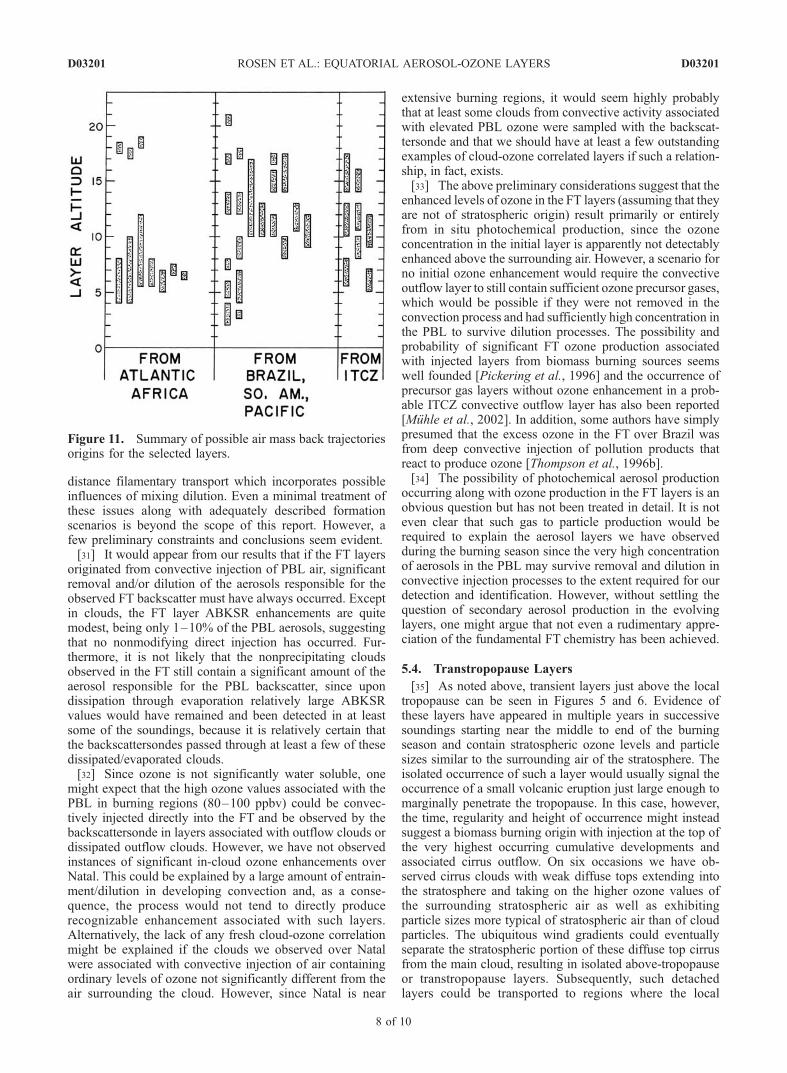
ozone profiles with distinctive layers occurring during thebiomass burning season. In each of these examples a layerof enhanced ozone occurs with an aerosol layer. Also it isclear that not all layers present contain both aerosol andozone enhancements.
5. Discussion
5.1. Aerosol and Ozone Correlations
[26] Figure 10 is an attempt to be more quantitativeconcerning our limited information relating to the aerosol/ozone structures. In the Natal soundings 30 distinct layers of
Figure 4. Composite of nondisturbed CFT type soundingsfor nonburning season.
Figure 5. Composite of all aerosol and ozone profiles occurring during the burning season (August–November). The solid ozone curve is the average of all 1978–1997 ozone soundings at Natal.
D03201 ROSEN ET AL.: EQUATORIAL AEROSOL-OZONE LAYERS
5 of 10
D03201
aerosol and/or ozone were identified and roughly quantifiedaccording to their content in excess of the average orbaseline conditions as determined from the average of thetypical values just below and above the layer. It should benoted that any layer appearing in Figure 10 that containsboth aerosol and ozone has well correlated profile structuresand in this sense these layers all have high aerosol/ozonecorrelation even though there are varying relative concen-trations. The results show that of all aerosol/ozone correlatedlayers, 88% occur in the biomass burning season Augustthrough November. During the burning season 63% of thelayers contain enhancements of both ozone and aerosol asapposed to 28% during the nonburning season. It may alsobe noted from Figure 10 that there are 14 cases for whichthe aerosol and ozone layers do not appear concurrently.Apparently several types of layers are present and theirfull explanation may require elaborate scenarios, an effortbeyond the scope of this report.[27] It should be noted that the 14 km ozone layer in
Figure 9 taken by itself might be interpreted as simplyoriginating in the stratosphere since it contains ozoneconcentrations typical of the lower stratosphere and it isin close proximity to a stratospheric ozone source. However,the ABKSR of the layer is in considerable excess of thestratospheric values, suggesting that the layer is not of directstratospheric origin. Also, 10 day back trajectory analysis ofthis layer indicates it was in the FT for the duration. Thusauxiliary information can provide essential information forinterpreting ozone profiles.
5.2. Layer Trajectories
[28] Ten day back trajectories have been calculated for thelayers of Figure 10 using the NOAA ARL website (www.arl.noaa.gov/ready; see Draxler [1996] for a description of themethods based on a kinematics approach). A summary ofthe general findings is shown in Figure 11, which indicates
the layer altitude at Natal and possible source regions. Sincethe trajectories are often quite circuitous, there may be morethan one potential source region. For example, several layersin the first two groups have also passed near the ITCZ and so
Figure 6. Same as Figure 5 except for August through December 2002.
Figure 7. Example of an aerosol/ozone layer correlationobserved during the burning season. As determined from10 day back trajectory calculations, layer 1 is most likelyfrom Brazil and South America, while layer 2 is likely fromthe Atlantic or Africa. The dashed line in Figures 7 –9 is theaverage of all 1978–1997 ozone soundings at Natal.
D03201 ROSEN ET AL.: EQUATORIAL AEROSOL-OZONE LAYERS
6 of 10
D03201
they have also been included with the ITCZ group. From thislimited data, it would appear that there is a tendency for thelower layers (4–10 km) to have originated in or on the wayfrom Africa and the Atlantic, while the higher-altitude layers(11–17 km) may have originated in Brazil, South America orperhaps farther west in the Pacific. The layers from Africa/Atlantic also show a tendency to be in descending, dry airwhich would be consistent with deep convective sources farto the east of Natal. Our association of layer altitude andsource regions would appear consistent with those reportedby others for Natal air mass trajectories but the previousresults are for a more limited time period and altitude range[Thompson et al., 1996a, 2003].[29] Further improvements are being made to refine the
geographical source region and probable origin of the layersby linking the back trajectories with concurrent satellitepictures of convective activity and outflow moving in thesame direction as the trajectory. However, this is proving tobe a rather ambitious and detailed project with slowlyemerging results.
5.3. Layer Formation and Evolution
[30] As suggested above, an explanation of the layercharacteristics as observed over Natal may depend on adetailed understanding of a number of processes such asconvective injection (including entrainment of ambient air)into the FT with subsequent outflow and evaporation, wetremoval of aerosols and soluble trace gases, photochemicalevolution of both ozone and aerosols, and the nature of long
Figure 9. Example of aerosol/ozone layer correlationobserved during the burning season. For this layer (near200 mb) the back trajectory suggests a source from centralBrazil or the ITCZ.
Figure 8. Example of an aerosol/ozone layer observedduring the burning season. Note that the cloud layers havenot been removed in this example. On descent the cloudshad apparently evaporated, and the illustrated profilereflects the descent values where the clouds were presenton ascent. Back trajectory analysis indicates that theidentified layer was slowly descending (consistent withthe low RH observed, not shown) and came to Natal fromthe Atlantic or Africa.
Figure 10. Summary describing aerosol-ozone layercharacteristics for 30 selected layers occurring throughoutthe year. Selected layers containing both aerosol and ozonehave well correlated profile structure. The numbers indicatethe month, and for easier visualization the nonburningseason months are in square boxes.
D03201 ROSEN ET AL.: EQUATORIAL AEROSOL-OZONE LAYERS
7 of 10
D03201
distance filamentary transport which incorporates possibleinfluences of mixing dilution. Even a minimal treatment ofthese issues along with adequately described formationscenarios is beyond the scope of this report. However, afew preliminary constraints and conclusions seem evident.[31] It would appear from our results that if the FT layers
originated from convective injection of PBL air, significantremoval and/or dilution of the aerosols responsible for theobserved FT backscatter must have always occurred. Exceptin clouds, the FT layer ABKSR enhancements are quitemodest, being only 1–10% of the PBL aerosols, suggestingthat no nonmodifying direct injection has occurred. Fur-thermore, it is not likely that the nonprecipitating cloudsobserved in the FT still contain a significant amount of theaerosol responsible for the PBL backscatter, since upondissipation through evaporation relatively large ABKSRvalues would have remained and been detected in at leastsome of the soundings, because it is relatively certain thatthe backscattersondes passed through at least a few of thesedissipated/evaporated clouds.[32] Since ozone is not significantly water soluble, one
might expect that the high ozone values associated with thePBL in burning regions (80–100 ppbv) could be convec-tively injected directly into the FT and be observed by thebackscattersonde in layers associated with outflow clouds ordissipated outflow clouds. However, we have not observedinstances of significant in-cloud ozone enhancements overNatal. This could be explained by a large amount of entrain-ment/dilution in developing convection and, as a conse-quence, the process would not tend to directly producerecognizable enhancement associated with such layers.Alternatively, the lack of any fresh cloud-ozone correlationmight be explained if the clouds we observed over Natalwere associated with convective injection of air containingordinary levels of ozone not significantly different from theair surrounding the cloud. However, since Natal is near
extensive burning regions, it would seem highly probablythat at least some clouds from convective activity associatedwith elevated PBL ozone were sampled with the backscat-tersonde and that we should have at least a few outstandingexamples of cloud-ozone correlated layers if such a relation-ship, in fact, exists.[33] The above preliminary considerations suggest that the
enhanced levels of ozone in the FT layers (assuming that theyare not of stratospheric origin) result primarily or entirelyfrom in situ photochemical production, since the ozoneconcentration in the initial layer is apparently not detectablyenhanced above the surrounding air. However, a scenario forno initial ozone enhancement would require the convectiveoutflow layer to still contain sufficient ozone precursor gases,which would be possible if they were not removed in theconvection process and had sufficiently high concentration inthe PBL to survive dilution processes. The possibility andprobability of significant FT ozone production associatedwith injected layers from biomass burning sources seemswell founded [Pickering et al., 1996] and the occurrence ofprecursor gas layers without ozone enhancement in a prob-able ITCZ convective outflow layer has also been reported[Muhle et al., 2002]. In addition, some authors have simplypresumed that the excess ozone in the FT over Brazil wasfrom deep convective injection of pollution products thatreact to produce ozone [Thompson et al., 1996b].[34] The possibility of photochemical aerosol production
occurring along with ozone production in the FT layers is anobvious question but has not been treated in detail. It is noteven clear that such gas to particle production would berequired to explain the aerosol layers we have observedduring the burning season since the very high concentrationof aerosols in the PBL may survive removal and dilution inconvective injection processes to the extent required for ourdetection and identification. However, without settling thequestion of secondary aerosol production in the evolvinglayers, one might argue that not even a rudimentary appre-ciation of the fundamental FT chemistry has been achieved.
5.4. Transtropopause Layers
[35] As noted above, transient layers just above the localtropopause can be seen in Figures 5 and 6. Evidence ofthese layers have appeared in multiple years in successivesoundings starting near the middle to end of the burningseason and contain stratospheric ozone levels and particlesizes similar to the surrounding air of the stratosphere. Theisolated occurrence of such a layer would usually signal theoccurrence of a small volcanic eruption just large enough tomarginally penetrate the tropopause. In this case, however,the time, regularity and height of occurrence might insteadsuggest a biomass burning origin with injection at the top ofthe very highest occurring cumulative developments andassociated cirrus outflow. On six occasions we have ob-served cirrus clouds with weak diffuse tops extending intothe stratosphere and taking on the higher ozone values ofthe surrounding stratospheric air as well as exhibitingparticle sizes more typical of stratospheric air than of cloudparticles. The ubiquitous wind gradients could eventuallyseparate the stratospheric portion of these diffuse top cirrusfrom the main cloud, resulting in isolated above-tropopauseor transtropopause layers. Subsequently, such detachedlayers could be transported to regions where the local
Figure 11. Summary of possible air mass back trajectoriesorigins for the selected layers.
D03201 ROSEN ET AL.: EQUATORIAL AEROSOL-OZONE LAYERS
8 of 10
D03201
tropopause is at a significantly lower altitude. Thus theselayers at Natal could be a measure of the very highestcumulative injections taking place in the tropics. However,our limited number of soundings does not preclude thepossibility that at least some of the transtropopause layersare not, in fact, of volcanic origin. For example, it istempting to associate the layers near 20 km in Figure 6with the eruption of Reventador (0.078�S, 77.656� W) on4 November 2002 [Wunderman et al., 2002], which report-edly sent an ash cloud to 15–17 km. However, backtrajectory analysis and launch date does not support thisorigin, but the proximity in time and space is suspiciouslyclose. Furthermore, the layer CI is not consistent with freshash particles but is more representative of backgroundstratospheric aerosol. At the time of this writing (July2003), the layer continues to be detectable and apparentlyrisen to 22 km. Hopefully, this question can be resolvedwith the continuing sounding program.
5.5. Column Loadings
[36] The integrated column backscatter has been calculatedfor the PBL, FT and stratosphere employing the altitudeboundaries as determined by the appropriate sounding. Usingthe FTaverage aerosol conditions of Figure 3 as a baseline forundisturbed profiles, it is found that about 85% of the totalatmospheric column aerosol backscatter in the red channelcan be attributed to the PBL, about 13% to the FT and 2–3%to the stratosphere. The average above baseline contributionof the FT enhancements shown in Figure 1, presumably frombiomass burning activity, increases the column backscatterfor this region by a factor of �1.35. Although this is not alarge factor, it still may be important because it is probablyapplicable on a global scale at tropical latitudes in contrast tothe comparatively small biomass burning regions influencingthe PBL on local scales.
5.6. Comparison to Other Latitudes
[37] As indicated above, we interpret the profiles ofFigure 3 to represent undisturbed conditions that might beeffectively used to define a baseline or background for theFT with typical values of ABKSR � 0.15. Figure 4 alsoshows minimal disturbances except for the lower FT, wherethere is the influence of the CFT type profile as discussedabove. In comparing Figures 3 and 4 with profiles contain-ing disturbances (Figures 1, 5, and 6) it would appear thatthe same general underlying baseline profile (ABKSR �0.15) is still evident in the disturbed soundings but withsuperimposed layers or perturbations. These same featuresare also suggested in the backscattersonde data taken atnorthern midlatitudes [Rosen et al., 1997, 2000] southernmidlatitudes [Liley et al., 2001] and arctic regions [Suortti etal., 2001] but involving different perturbation sources. Ifsubstantiated, this view of FT aerosol similarity wouldpresent a simplifying or organizational aspect to the inter-pretation of global FT aerosols. Additionally, it wouldindicate that the indiscriminate averaging of profiles coulddestroy information and lead to unrealistic profile shapesthat never actually occur in nature.
6. Conclusion
[38] A clear annual aerosol enhancement can be observedin the FT over Natal during the burning season. Many of
these layers occur congruently with ozone enrichments,which are also thought to be at least partially associatedwith the burning season. Trajectory analysis suggests thatsome of the layers, typically those at lower altitudes, haveoriginated over the Atlantic or Africa while the higher-altitude layers tend to originate over Brazil or possibly thePacific. A peculiar step decay in the aerosols at 20 kmduring the final stages of the Pinatubo volcanic influencewas observed but the data is not of sufficient regularity toconvincingly test possible explanations. The general natureof the ABKSR profile over Natal can be described in termsidentical to those used for other latitudes: the FT ABKSRseems to exhibit a quasi-constant background or baselineprofile which is perturbed by seasonally dependent layers ofhigher ABKSR. The simultaneous cloud/ozone measure-ments provided by the backscattersonde indicate PBL air(typically containing ozone concentrations of 80 ppbv ormore during the burning season) that experiences cloudformation with convective injection into the FT, initiallydoes not contain ozone levels noticeably different from thesurrounding FT air. Aerosol layers just above the localtropopause have been observed in what may prove to bean annual cycle but continuing observations are needed toconfirm their proposed explanations. We hope that thepreliminary results reported here will serve to bring furtherattention to the wealth of FT information potentially avail-able through systematic measurements of multiple param-eters using current cost effective technology.
[39] Acknowledgments. This work was supported by NSF undergrant ATM-0086484 and the Brazilian Instituto Nacional de PesquisasEspaciais (INPE). We gratefully acknowledge the enthusiastic and compe-tent balloon launch support provide by Carlos R. da Silva, Edmilson L. daSilva, and Tercio L. B. Penha.
ReferencesCarlson, D., and J. Wang (2002), RS80 humidity data set corrections,Vaisala News, 159, 14–15.
Draxler, R. R. (1996), Boundary layer isentropic and kinematic trajectoriesduring the August 1993 North Atlantic Regional Experiment Intensive,J. Geophys. Res., 101, 22,255–29,268.
Huesmann, A. S., and M. H. Hitchman (2001), The stratospheric quasi-biennial oscillation in the NCEP reanalyses: Climatological structures,J. Geophys. Res., 106, 11,859–11,874.
Kaufman, Y. J., et al. (1998), Smoke Clouds and Radiation-Brazil (SCAR-B)Experiment, J. Geophys. Res., 103, 31,783–31,808.
Kirchhoff, V. W. J. H., R. A. Barnesw, and A. L. Torres (1991), Ozoneclimatology at Natal from in situ ozonesonde data, J. Geophys. Res., 96,10,899–10,909.
Liley, J. B., J. M. Rosen, N. T. Kjome, N. B. Jones, and C. P. Rinsland(2001), Springtime enhancement of upper tropospheric aerosol at 45 degS, Geophys. Res. Lett., 28, 1495–1498.
Muhle, J., et al. (2002), Biomass burning and fossil fuel signatures inthe upper troposphere observed during a CARIBIC flight from Namibiato Germany, Geophys. Res. Lett., 29(19), 1910, doi:10.1029/2002GL015764.
Niwano, M., and M. Shiotani (2001), Quasi-biennial oscillation in verticalvelocity inferred from trace gas data in the equatorial lower stratosphere,J. Geophys. Res., 106, 7281–7290.
Oltmans, S. J., et al. (2001), Ozone in the Pacific tropical troposphere fromozonesonde observations, J. Geophys. Res., 106, 32,503–32,525.
Ovarlez, J., et al. (2002), Water vapour measurements inside cirrus cloudsin Northern and Southern Hemispheres during INCA, Geophys. Res.Lett., 29(16), 1813, doi:10.1029/2001GL014440.
Pickering, K. E., et al. (1996), Convective transport of biomass burningemissions over Brazil during TRACE A, J. Geophys. Res., 101, 22,993–23,012.
Prins, E. M., J. M. Feltz, W. P. Menzel, and D. E. Ward (1998), Anoverview of Goes-8 diurnal fire and smoke results for SCAR-B and1995 fire season in South America, J. Geophys. Res., 103, 31,821–31,835.
D03201 ROSEN ET AL.: EQUATORIAL AEROSOL-OZONE LAYERS
9 of 10
D03201
Rosen, J. M., and V. W. J. H. Kirchhoff (1997), Balloonborne aerosol andozone measurements over central Brazil during a period of intense bio-mass burning, in SCAR-B Proceedings, edited by V. W. J. H. Kirchhoff,pp. 183–186, Transtec Ed., Sao Jose dos Campos, Brazil.
Rosen, J. M., and N. T. Kjome (1991), The backscattersonde: A newinstrument for atmospheric aerosol research, Appl. Opt., 30, 1552–1561.
Rosen, J. M., N. T. Kjome, and S. J. Oltmans (1993), Simultaneous ozoneand polar stratospheric cloud observations at South Pole Station duringwinter and spring 1991, J. Geophys. Res., 98, 12,741–12,751.
Rosen, J. M., N. T. Kjome, and J. B. Liley (1997), Tropospheric aerosolbackscatter at a midlatitude site in the northern and southern hemispheres,J. Geophys. Res., 102, 21,329–21,339.
Rosen, J. M., S. Young, J. Laby, N. T. Kjome, and J. Gras (2000), Spring-time aerosol layers in the free troposphere over Australia: MilduraAerosol Tropospheric Experiment (MATE 98), J. Geophys. Res., 105,17,833–17,842.
Suortti, T., et al. (2001), Evolution of the Arctic stratospheric aerosol mix-ing ratio measured with balloon-borne aerosol sondes for the years1998–2000, J. Geophys. Res., 106, 20,759–20,766.
Thompson, A. M., M. K. E. Pickering, D. P. McNamara, M. R. Schoeberi,R. D. Hudson, J. H. Kim, E. V. Browell, V. W. J. H. Kirchhoff, andD. Nganga (1996a), Where did tropospheric ozone over southern Africa
and the tropical Atlantic come from in October 1992? Insights fromTOMS, GTE, TRACE A and SAFARI 1992, J. Geophys. Res., 101,24,251–24,278.
Thompson, A. M., D. P. McNamara, V. W. J. H. Kirchhoff, and A. Setzer,(1996b), Tropospheric ozone at Cuiaba during SCAR-B and TRACE-A,in SCAR-B Proceedings, pp. 191 –194, Transtec Ed., Sao Jose dosCampos, Brazil.
Thompson, A. M., et al. (2003), Southern Hemisphere Additional Ozone-sondes (SHADOZ) 1998–2000 tropical ozone climatology: 2. Tropo-spheric variability and the zonal wave-one, J. Geophys. Res., 108(D2),8241, doi:10.1029/2002JD002241.
Wunderman, R., J. Fela, E. Venzke, and G. Mayberry (Eds.) (2002),Reventador, Bull. Global Volcan. Network, 27(11), 2–5.
�����������������������F. R. da Silva, Laboratorio Ozonio, Instituto Nacional de Pequisas
Espaciais (INPE), 59001-970 Natal, Brazil.V. W. J. H. Kirchhoff, Laboratorio Ozonio, Instituto Nacional de Pequisas
Espaciais (INPE), 12227-010 Sao Jose dos Campos, Brazil.N. T. Kjome, R. M. Morales, and J. M. Rosen, Department of Physics
and Astronomy, University of Wyoming, Laramie, WY 82071, USA.([email protected])
D03201 ROSEN ET AL.: EQUATORIAL AEROSOL-OZONE LAYERS
10 of 10
D03201
Related Documents