EQUAL EMPLOYMENT PRACTICES COMMISSION WORKFORCE ANALYSIS CALENDAR YEAR 2008

Welcome message from author
This document is posted to help you gain knowledge. Please leave a comment to let me know what you think about it! Share it to your friends and learn new things together.
Transcript

EQUAL EMPLOYMENT PRACTICES COMMISSION
WORKFORCE ANALYSIS
CALENDAR YEAR 2008

001 Administrators: Occupations in which employees set broad policies and exercise overall responsibility for the execution of these policies. This category includes: Elected officials, commissioners, executive directors, deputy commissioners, chairpersons, general counsels, controllers, chiefs of department, inspector generals and kindred workers.
002 Managers: Occupations in which employees direct individual departments or special phases of the agency’s operations, or provide specialized consultation on a regional, district or area basis. This category includes: Assistant commissioners, deputy directors, assistant directors, project managers, special assistants, superintendents, deputy counsels and kindred workers.
003 Management Specialists: Occupations which require specialized and theoretical knowledge of management, finance or personnel, which is usually acquired through college training or through work experience and other training which provides comparable knowledge. This category includes: Accountants, underwriters, financial analysts, personnel analysts, staff analysts, program analysts, buyers, purchasing specialists, inspectors, research analysts, program officers, project coordinators and kindred workers.
004 Science Professionals: Occupations which require specialized and theoretical knowledge of various scientific or mathematical fields, which is usually acquired through college training or through work experience and other training which provides comparable knowledge. This category includes: Architects, engineers (chemical, nuclear, civil, electrical, industrial, mechanical, marine), computer specialists, telecommunications specialists, actuaries, statisticians, physicists, chemists, geologists, biologists, foresters and kindred workers.
005 Health Professionals: Occupations which require specialized and theoretical knowledge of the medical or health fields, which is usually acquired through college training or through work experience and other training which provides comparable knowledge. This category includes: Physicians, dentists, veterinarians, optometrists, podiatrists, registered nurses, pharmacists, dieticians, occupational therapists, physical therapists, speech therapists, physician’s assistants and kindred workers.
006 Social Scientists: Occupations which require specialized and theoretical knowledge of the social sciences, which is usually acquired through college training or through work experience and other training which provides comparable knowledge. This category includes: Librarians, archivists, economists, psychologists, sociologists, urban planners and kindred workers.
007 Social Workers: Occupations which require specialized and theoretical knowledge of social work, youth and family counseling, addiction treatment and casework, which is usually acquired through college or training or through work experience and other training which provides comparable knowledge. This category includes: Caseworkers, probation officers, correctional counselors, juvenile counselors, addiction treatment counselors, eligibility specialists, human rights specialists, community liaison workers, clergy and kindred workers.
CITYWIDE EQUAL EMPLOYMENT OPPORTUNITYDATABASE SYSTEM (CEEDS) DESCRIPTION OF JOB
GROUP CATEGORIES
pg. 1 of 4

008 Lawyers: Occupations which require specialized and theoretical knowledge of the law and the judicial process, which is usually acquired through college training. This category includes: Attorneys, assistant district attorneys, counsels, assistant counsels, deputy counsels, law judges, and kindred workers.
009 Public Relations: Occupations which require special knowledge or skills in public relations, journalism, modern language or the fine arts, which are usually acquired through college training, specialized post-secondary school education, or work experience or training which provides comparable knowledge. This category includes: Technical writers, graphic designers, musicians, actors, directors, announcers, painters, illustrators, photographers, artists, editors, press officers, public relations specialists, public relations advisors, interpreters, customer service specialists and kindred workers.
010 Technicians: Occupations which require a combination of basic scientific or technical knowledge and manual skill which can be obtained through specialized post-secondary school education or through equivalent on-the-job training. This category includes: Health technicians (clinical laboratory, dental hygienists, health records, radiologic and licensed practical nurses), electrical and electronic technicians, engineering technicians (electrical, electronic, industrial, and mechanical), drafting occupations, surveying and mapping technicians, science technicians, airline pilots and navigators, air traffic controllers, broadcast equipment operators, computer programmers, legal assistants, investigators, and kindred workers.
011 Sales: Not applicable.
012 Clerical Supervisors: Occupations in which employees are responsible for overseeing and supervising the duties of clerical staff. This category includes: Chief clerks, supervising clerks, principal administrative associates, supervising cashiers, telegraph superintendents, supervising stenographers and kindred workers.
013 Clerical: Occupations in which employees are responsible for internal and external communication, recording and retrieval of data and/or information and other paperwork required in an office. This category includes: Cashiers, computer operators, word processors, secretaries, stenographers, typists, ticket agents, receptionists, clerks (information, personnel, file, library, records), bookkeepers, office machine operators, telephone operators, messengers, dispatchers, stock clerks, meter readers, office aides, general office clerks, bank tellers and kindred workers.
014 Household Services: Not applicable.
015 Police Supervisors: Occupations in which uniformed employees with peace officers status set broad policies in the area of public safety and security, exercise overall responsibility for execution of policies, direct individuals units or special phases of the agency’s operations, or supervise on a regional, district or area basis. This category includes: Sergeants, captains, lieutenants, inspectors, captains (correction), wardens and kindred workers.
pg. 2 of 4
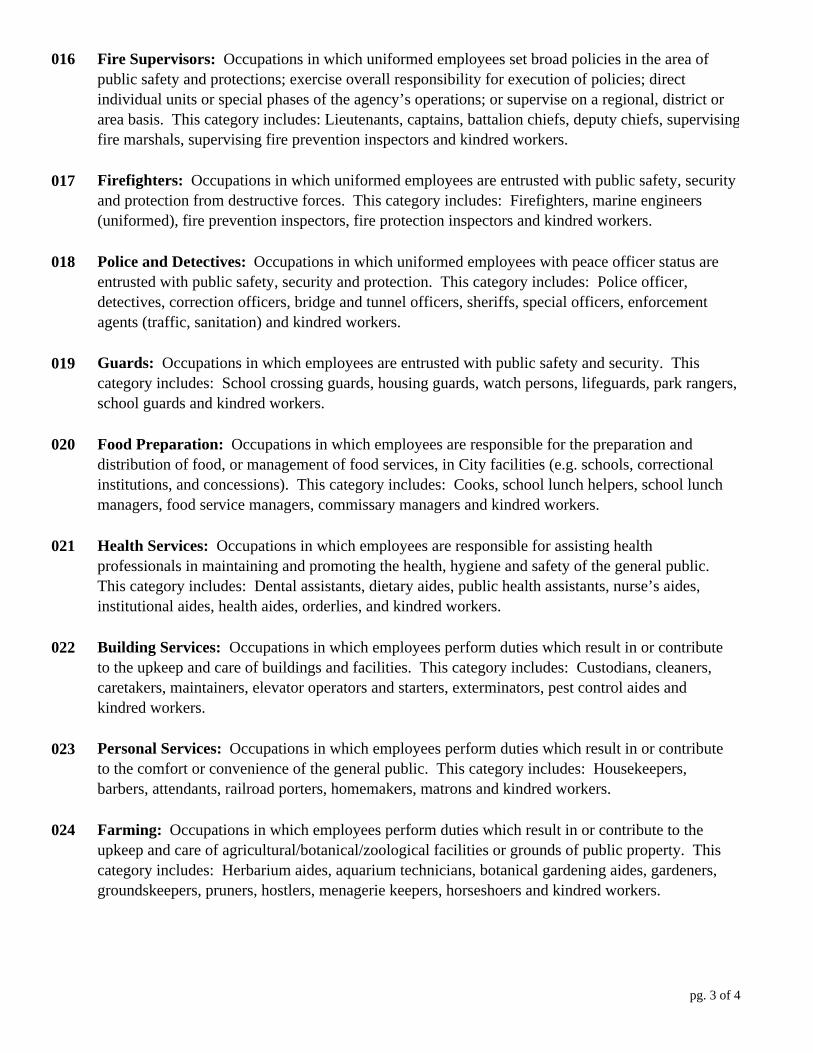
016 Fire Supervisors: Occupations in which uniformed employees set broad policies in the area of public safety and protections; exercise overall responsibility for execution of policies; direct individual units or special phases of the agency’s operations; or supervise on a regional, district or area basis. This category includes: Lieutenants, captains, battalion chiefs, deputy chiefs, supervisingfire marshals, supervising fire prevention inspectors and kindred workers.
017 Firefighters: Occupations in which uniformed employees are entrusted with public safety, security and protection from destructive forces. This category includes: Firefighters, marine engineers (uniformed), fire prevention inspectors, fire protection inspectors and kindred workers.
018 Police and Detectives: Occupations in which uniformed employees with peace officer status are entrusted with public safety, security and protection. This category includes: Police officer, detectives, correction officers, bridge and tunnel officers, sheriffs, special officers, enforcement agents (traffic, sanitation) and kindred workers.
019 Guards: Occupations in which employees are entrusted with public safety and security. This category includes: School crossing guards, housing guards, watch persons, lifeguards, park rangers, school guards and kindred workers.
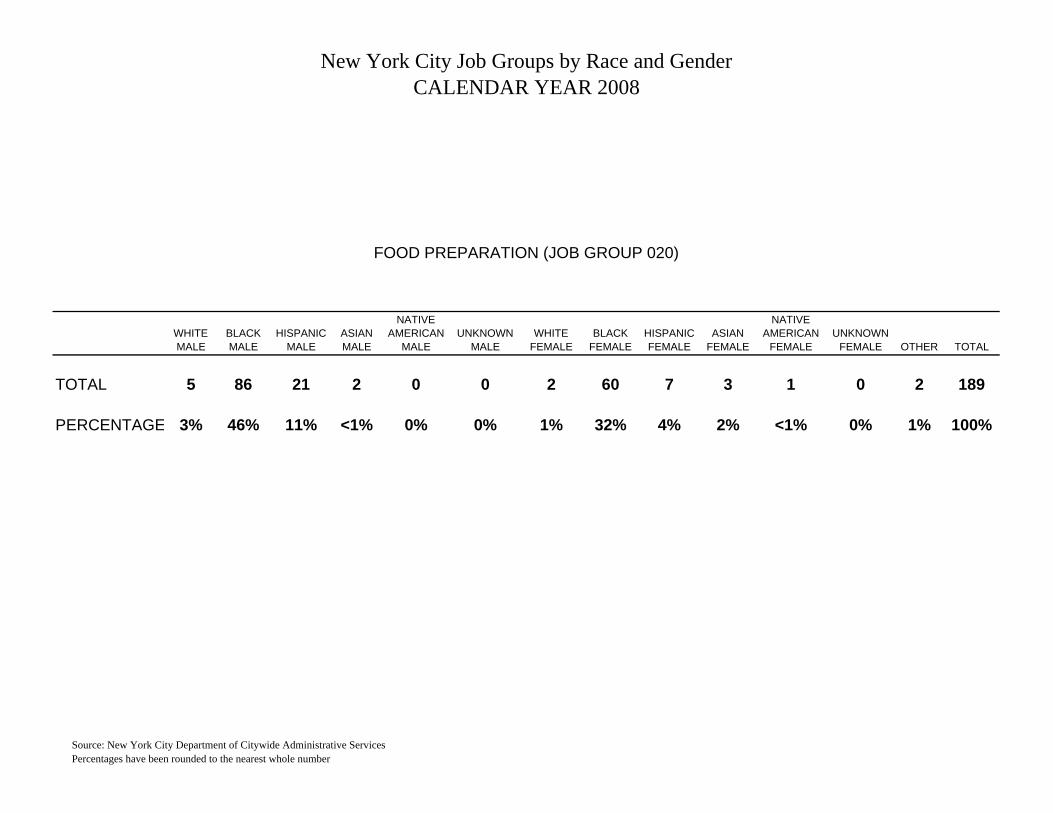
020 Food Preparation: Occupations in which employees are responsible for the preparation and distribution of food, or management of food services, in City facilities (e.g. schools, correctional institutions, and concessions). This category includes: Cooks, school lunch helpers, school lunch managers, food service managers, commissary managers and kindred workers.
021 Health Services: Occupations in which employees are responsible for assisting health professionals in maintaining and promoting the health, hygiene and safety of the general public. This category includes: Dental assistants, dietary aides, public health assistants, nurse’s aides, institutional aides, health aides, orderlies, and kindred workers.
022 Building Services: Occupations in which employees perform duties which result in or contribute to the upkeep and care of buildings and facilities. This category includes: Custodians, cleaners, caretakers, maintainers, elevator operators and starters, exterminators, pest control aides and kindred workers.
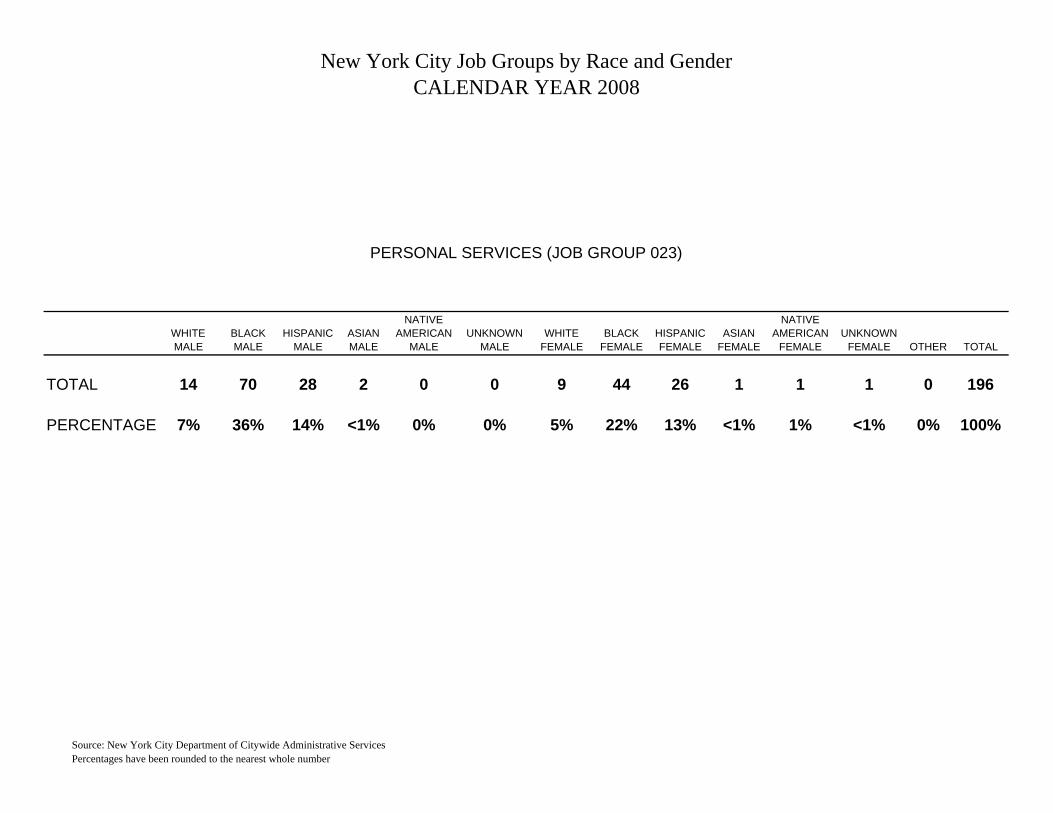
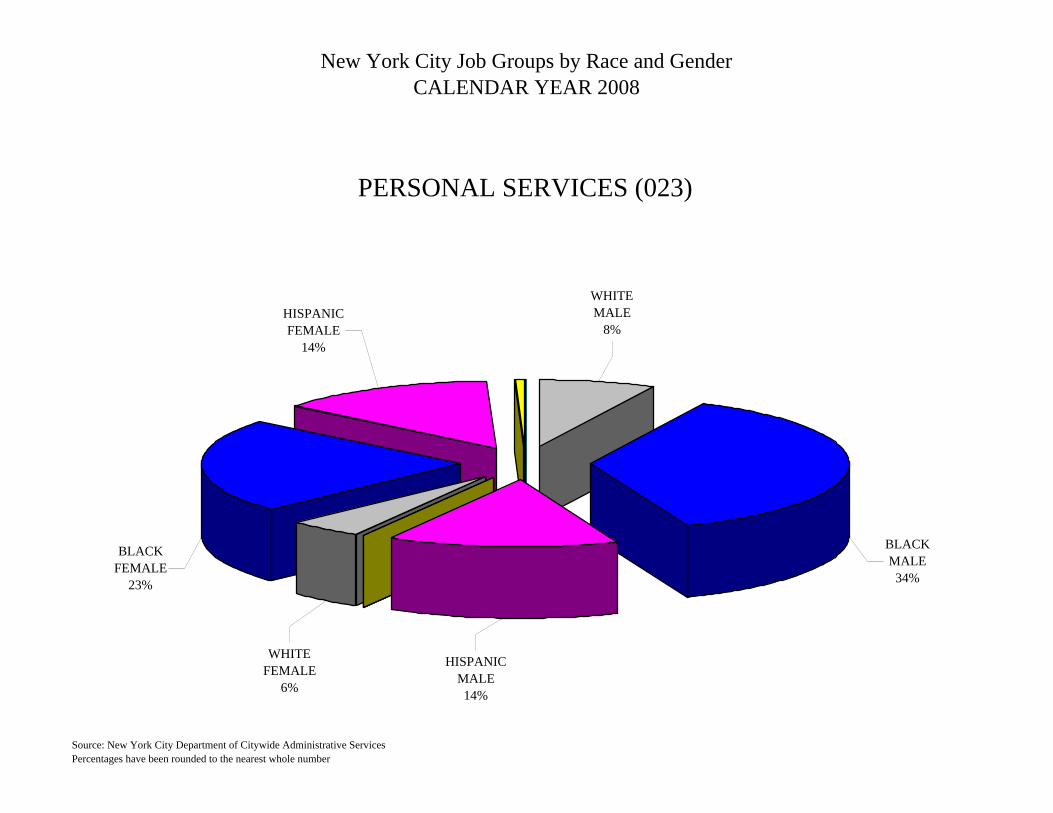
023 Personal Services: Occupations in which employees perform duties which result in or contribute to the comfort or convenience of the general public. This category includes: Housekeepers, barbers, attendants, railroad porters, homemakers, matrons and kindred workers.
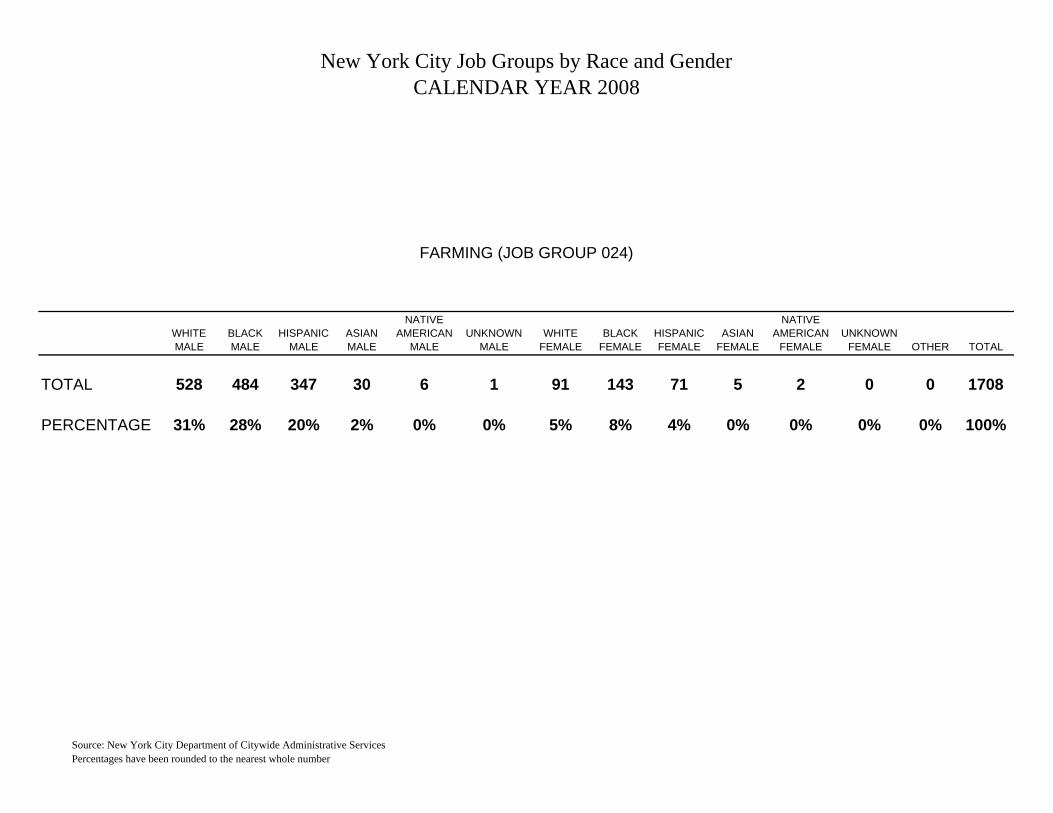
024 Farming: Occupations in which employees perform duties which result in or contribute to the upkeep and care of agricultural/botanical/zoological facilities or grounds of public property. This category includes: Herbarium aides, aquarium technicians, botanical gardening aides, gardeners, groundskeepers, pruners, hostlers, menagerie keepers, horseshoers and kindred workers.
pg. 3 of 4
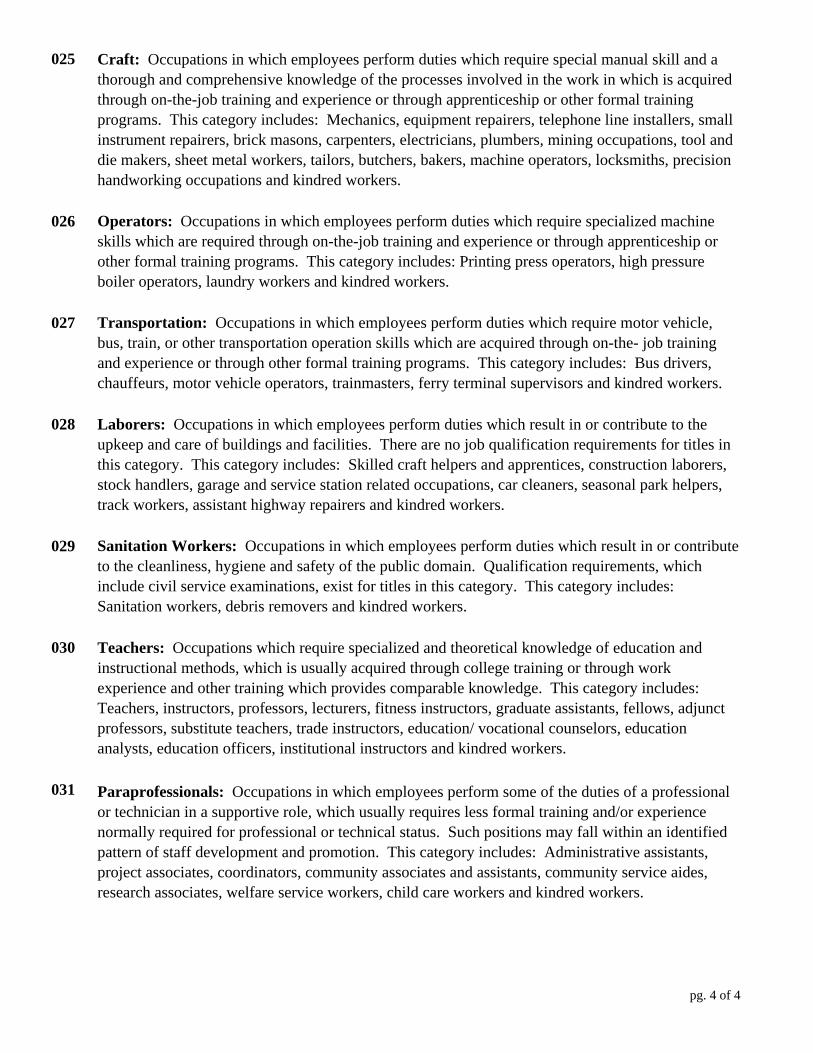
025 Craft: Occupations in which employees perform duties which require special manual skill and a thorough and comprehensive knowledge of the processes involved in the work in which is acquired through on-the-job training and experience or through apprenticeship or other formal training programs. This category includes: Mechanics, equipment repairers, telephone line installers, small instrument repairers, brick masons, carpenters, electricians, plumbers, mining occupations, tool and die makers, sheet metal workers, tailors, butchers, bakers, machine operators, locksmiths, precision handworking occupations and kindred workers.
026 Operators: Occupations in which employees perform duties which require specialized machine skills which are required through on-the-job training and experience or through apprenticeship or other formal training programs. This category includes: Printing press operators, high pressure boiler operators, laundry workers and kindred workers.
027 Transportation: Occupations in which employees perform duties which require motor vehicle, bus, train, or other transportation operation skills which are acquired through on-the- job training and experience or through other formal training programs. This category includes: Bus drivers, chauffeurs, motor vehicle operators, trainmasters, ferry terminal supervisors and kindred workers.
028 Laborers: Occupations in which employees perform duties which result in or contribute to the upkeep and care of buildings and facilities. There are no job qualification requirements for titles in this category. This category includes: Skilled craft helpers and apprentices, construction laborers, stock handlers, garage and service station related occupations, car cleaners, seasonal park helpers, track workers, assistant highway repairers and kindred workers.
029 Sanitation Workers: Occupations in which employees perform duties which result in or contribute to the cleanliness, hygiene and safety of the public domain. Qualification requirements, which include civil service examinations, exist for titles in this category. This category includes: Sanitation workers, debris removers and kindred workers.
030 Teachers: Occupations which require specialized and theoretical knowledge of education and instructional methods, which is usually acquired through college training or through work experience and other training which provides comparable knowledge. This category includes: Teachers, instructors, professors, lecturers, fitness instructors, graduate assistants, fellows, adjunct professors, substitute teachers, trade instructors, education/ vocational counselors, education analysts, education officers, institutional instructors and kindred workers.
031 Paraprofessionals: Occupations in which employees perform some of the duties of a professional or technician in a supportive role, which usually requires less formal training and/or experience normally required for professional or technical status. Such positions may fall within an identified pattern of staff development and promotion. This category includes: Administrative assistants, project associates, coordinators, community associates and assistants, community service aides, research associates, welfare service workers, child care workers and kindred workers.
pg. 4 of 4

1 NEW YORK CITY DEPARTMENT OF CITYWIDE ADMINISTRATIVE SERVICESOMIS CITYWIDE PERSONNEL PRODUCTION SYSTEMS
PERSONNEL REPORTING AND INFORMATION SYSTEM FOR EMPLOYEES (PRISE)WORKFORCE SUMMARY AS OF DECEMBER 31, 2008
REPORT: PBUTNO31
MAYOR'S OFFICE (002)
MALE FEMALE
JOB GRP WHITE BLACK HSPN ASIANNATIVE AMER UKWN WHITE BLACK HSPN ASIAN
NATIVE AMER UKWN OTHR TOTAL
001 5 1 0 0 0 0 2 0 1 0 0 0 0 9002 66 5 13 5 0 0 109 14 20 12 0 0 0 244003 6 4 4 3 0 0 7 1 3 2 0 0 0 30008 0 0 1 0 0 0 0 0 0 0 0 0 0 1009 11 0 2 0 0 0 1 1 1 0 0 0 0 16012 0 0 0 0 1 0 0 0 0 0 0 1013 13 8 14 3 0 0 42 42 32 8 1 2 0 165020 0 0 3 0 0 0 0 0 0 0 0 0 0 3022 0 0 0 0 0 0 0 1 0 0 0 0 0 1031 8 2 5 3 0 0 19 9 7 1 0 0 1 55
TOTAL 109 20 42 14 0 0 181 68 64 23 1 2 1 525%TAGE 21% 4% 8% 3% 0% 0% 34% 13% 12% 4% <1% <1% <1% 100%

2 NEW YORK CITY DEPARTMENT OF CITYWIDE ADMINISTRATIVE SERVICESOMIS CITYWIDE PERSONNEL PRODUCTION SYSTEMS
PERSONNEL REPORTING AND INFORMATION SYSTEM FOR EMPLOYEES (PRISE)WORKFORCE SUMMARY AS OF DECEMBER 31, 2008
REPORT: PBUTNO31
OFFICE OF THE ACTUARY (008)
MALE FEMALE
JOB GRP WHITE BLACK HSPN ASIANNATIVE AMER UKWN WHITE BLACK HSPN ASIAN
NATIVE AMER UKWN OTHR TOTAL
002 6 2 0 0 0 0 2 0 0 0 0 0 0 10003 1 0 0 0 0 0 0 0 0 0 0 0 0 1004 4 1 0 5 0 0 6 0 0 3 0 3 0 22012 0 0 0 0 0 0 0 1 1 0 0 0 0 2013 0 0 0 0 0 0 0 2 0 0 0 1 0 3
TOTAL 11 3 0 5 0 0 8 3 1 3 0 4 0 38%TAGE 29% 8% 0% 13% 0% 0% 21% 8% 3% 8% 0% 11% 0% 100%
3 NEW YORK CITY DEPARTMENT OF CITYWIDE ADMINISTRATIVE SERVICESOMIS CITYWIDE PERSONNEL PRODUCTION SYSTEMS
PERSONNEL REPORTING AND INFORMATION SYSTEM FOR EMPLOYEES (PRISE)WORKFORCE SUMMARY AS OF DECEMBER 31, 2008
REPORT: PBUTNO31
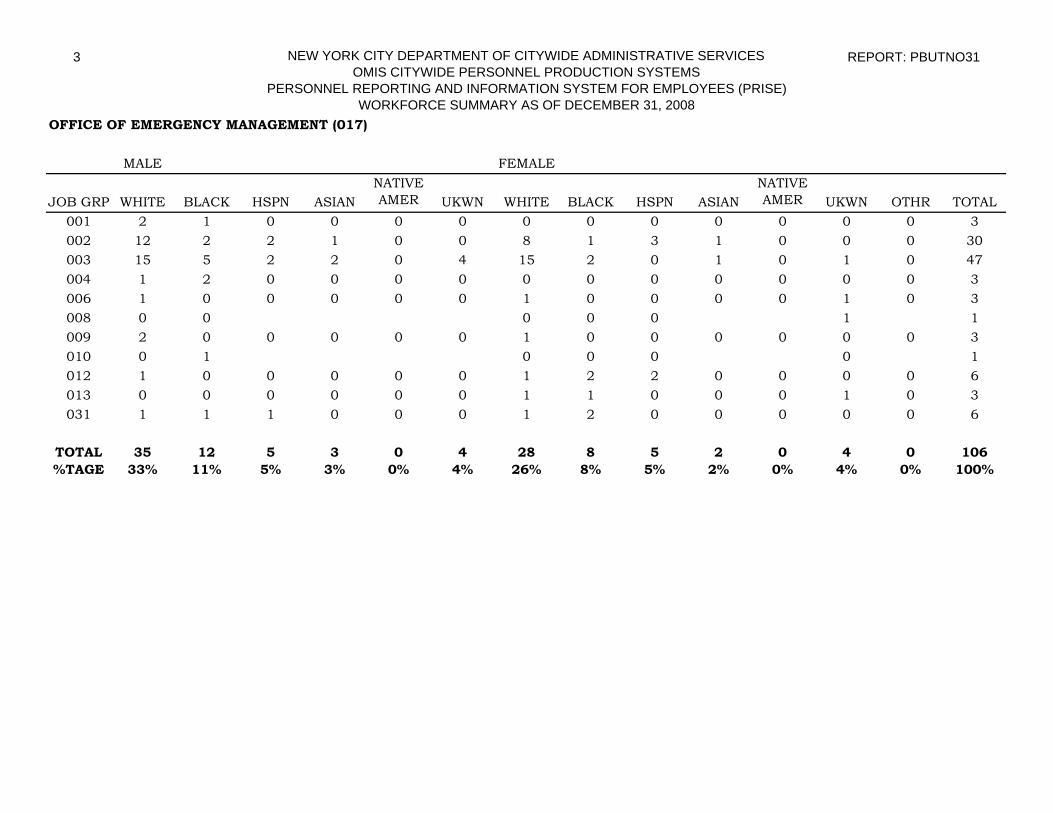
OFFICE OF EMERGENCY MANAGEMENT (017)
MALE FEMALE
JOB GRP WHITE BLACK HSPN ASIANNATIVE AMER UKWN WHITE BLACK HSPN ASIAN
NATIVE AMER UKWN OTHR TOTAL
001 2 1 0 0 0 0 0 0 0 0 0 0 0 3002 12 2 2 1 0 0 8 1 3 1 0 0 0 30003 15 5 2 2 0 4 15 2 0 1 0 1 0 47004 1 2 0 0 0 0 0 0 0 0 0 0 0 3006 1 0 0 0 0 0 1 0 0 0 0 1 0 3008 0 0 0 0 0 1 1009 2 0 0 0 0 0 1 0 0 0 0 0 0 3010 0 1 0 0 0 0 1012 1 0 0 0 0 0 1 2 2 0 0 0 0 6013 0 0 0 0 0 0 1 1 0 0 0 1 0 3031 1 1 1 0 0 0 1 2 0 0 0 0 0 6
TOTAL 35 12 5 3 0 4 28 8 5 2 0 4 0 106%TAGE 33% 11% 5% 3% 0% 4% 26% 8% 5% 2% 0% 4% 0% 100%

4 NEW YORK CITY DEPARTMENT OF CITYWIDE ADMINISTRATIVE SERVICESOMIS CITYWIDE PERSONNEL PRODUCTION SYSTEMS
PERSONNEL REPORTING AND INFORMATION SYSTEM FOR EMPLOYEES (PRISE)WORKFORCE SUMMARY AS OF DECEMBER 31, 2008
REPORT: PBUTNO31
OFFICE OF MANAGEMENT & BUDGET (019)
MALE FEMALE
JOB GRP WHITE BLACK HSPN ASIANNATIVE AMER UKWN WHITE BLACK HSPN ASIAN
NATIVE AMER UKWN OTHR TOTAL
001 4 0 0 1 0 0 1 0 0 0 0 0 0 6002 38 1 2 8 0 0 22 3 1 6 0 0 0 81003 52 8 18 18 0 1 46 16 13 37 1 0 0 210004 2 0 0 0 0 0 0 0 0 0 0 0 0 2012 0 0 0 0 0 0 0 1 0 1 0 0 0 2013 0 1 1 0 0 0 4 9 8 3 0 0 0 26031 1 1 1 0 0 0 0 0 0 1 0 0 0 4
TOTAL 97 11 22 27 0 1 73 29 22 48 1 0 0 331%TAGE 29% 3% 7% 8% 0% 0% 22% 9% 7% 15% 0% <1% 0% 100%

5 NEW YORK CITY DEPARTMENT OF CITYWIDE ADMINISTRATIVE SERVICESOMIS CITYWIDE PERSONNEL PRODUCTION SYSTEMS
PERSONNEL REPORTING AND INFORMATION SYSTEM FOR EMPLOYEES (PRISE)WORKFORCE SUMMARY AS OF DECEMBER 31, 2008
REPORT: PBUTNO31
TAX COMMISSION (021)
MALE FEMALE
JOB GRP WHITE BLACK HSPN ASIANNATIVE AMER UKWN WHITE BLACK HSPN ASIAN
NATIVE AMER UKWN OTHR TOTAL
001 6 0 0 0 0 0 3 0 0 0 0 0 0 9002 4 0 0 1 0 0 2 0 1 0 0 0 0 8003 7 0 1 0 0 0 1 2 0 1 0 0 0 12004 0 0 1 2 0 0 0 0 0 2 0 0 0 5008 0 0 0 0 0 0 3 0 0 0 0 0 0 3012 0 1 0 0 0 0 0 3 2 0 0 0 0 6013 1 0 0 0 0 0 0 1 1 0 0 0 0 3031 0 0 0 2 1 0 0 1 0 0 0 0 0 4
TOTAL 18 1 2 5 1 0 9 7 4 3 0 0 0 50%TAGE 36% 2% 4% 10% 2% 0% 18% 14% 8% 6% 0% 0% 0% 100%

6 NEW YORK CITY DEPARTMENT OF CITYWIDE ADMINISTRATIVE SERVICESOMIS CITYWIDE PERSONNEL PRODUCTION SYSTEMS
PERSONNEL REPORTING AND INFORMATION SYSTEM FOR EMPLOYEES (PRISE)WORKFORCE SUMMARY AS OF DECEMBER 31, 2008
REPORT: PBUTNO31
LAW DEPARTMENT (025)
MALE FEMALE
JOB GRP WHITE BLACK HSPN ASIANNATIVE AMER UKWN WHITE BLACK HSPN ASIAN
NATIVE AMER UKWN OTHR TOTAL
001 2 0 0 0 0 0 0 0 0 0 0 0 0 2002 34 5 1 1 0 0 27 2 2 2 0 0 0 74003 9 8 3 1 0 0 6 9 2 0 0 0 0 38004 5 1 1 3 0 0 4 1 0 3 0 0 0 18005 0 0 0 0 0 0 2 0 0 0 0 0 0 2006 1 0 0 0 0 0 1 0 0 0 0 0 0 2008 222 18 17 11 0 3 262 44 20 31 0 3 0 631010 47 41 22 12 1 0 67 114 23 12 0 0 0 339012 6 2 1 1 0 0 3 8 1 1 0 0 0 23013 13 40 5 9 0 0 40 135 37 9 1 2 0 291022 0 9 0 0 0 0 0 0 0 0 0 0 0 9027 1 3 0 0 0 0 0 0 0 0 0 0 0 4031 6 2 3 1 0 0 0 6 2 2 0 1 0 23
TOTAL 346 129 53 39 1 3 412 319 87 60 1 6 0 1456%TAGE 24% 9% 4% 3% 0% <1% 28% 22% 6% 4% <1% <1% <1% 100%
7 NEW YORK CITY DEPARTMENT OF CITYWIDE ADMINISTRATIVE SERVICESOMIS CITYWIDE PERSONNEL PRODUCTION SYSTEMS
PERSONNEL REPORTING AND INFORMATION SYSTEM FOR EMPLOYEES (PRISE)WORKFORCE SUMMARY AS OF DECEMBER 31, 2008
REPORT: PBUTNO31
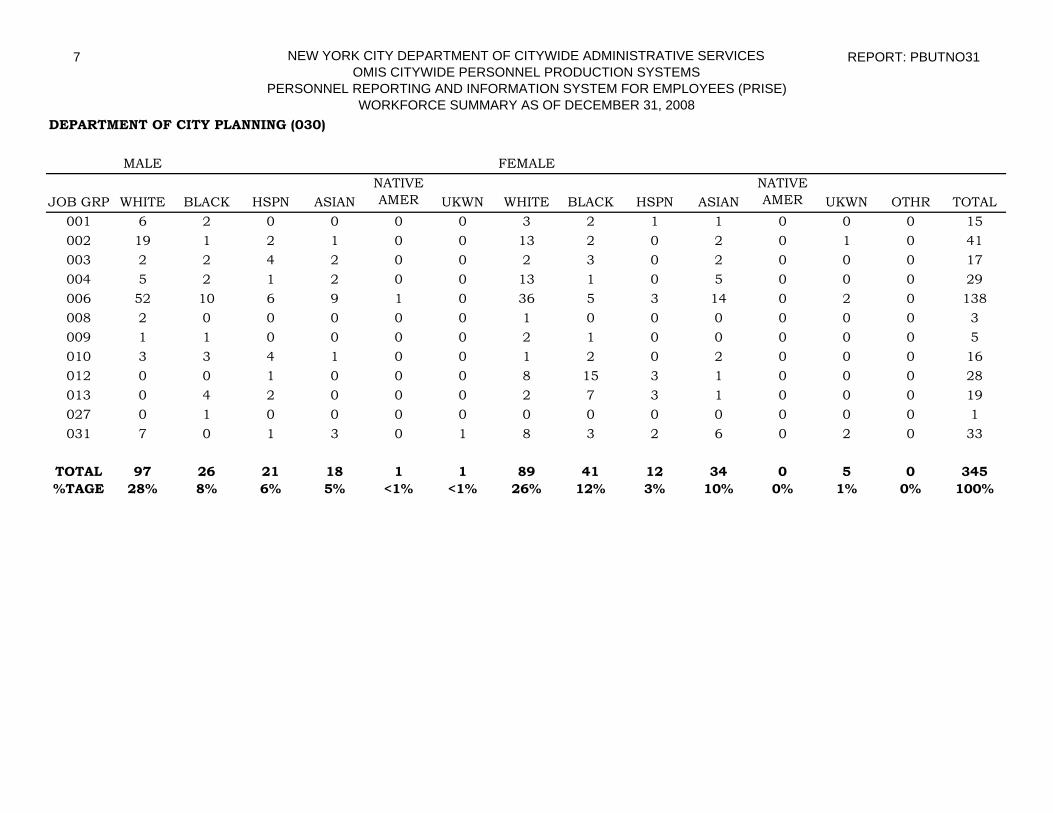
DEPARTMENT OF CITY PLANNING (030)
MALE FEMALE
JOB GRP WHITE BLACK HSPN ASIANNATIVE AMER UKWN WHITE BLACK HSPN ASIAN
NATIVE AMER UKWN OTHR TOTAL
001 6 2 0 0 0 0 3 2 1 1 0 0 0 15002 19 1 2 1 0 0 13 2 0 2 0 1 0 41003 2 2 4 2 0 0 2 3 0 2 0 0 0 17004 5 2 1 2 0 0 13 1 0 5 0 0 0 29006 52 10 6 9 1 0 36 5 3 14 0 2 0 138008 2 0 0 0 0 0 1 0 0 0 0 0 0 3009 1 1 0 0 0 0 2 1 0 0 0 0 0 5010 3 3 4 1 0 0 1 2 0 2 0 0 0 16012 0 0 1 0 0 0 8 15 3 1 0 0 0 28013 0 4 2 0 0 0 2 7 3 1 0 0 0 19027 0 1 0 0 0 0 0 0 0 0 0 0 0 1031 7 0 1 3 0 1 8 3 2 6 0 2 0 33
TOTAL 97 26 21 18 1 1 89 41 12 34 0 5 0 345%TAGE 28% 8% 6% 5% <1% <1% 26% 12% 3% 10% 0% 1% 0% 100%

8 NEW YORK CITY DEPARTMENT OF CITYWIDE ADMINISTRATIVE SERVICESOMIS CITYWIDE PERSONNEL PRODUCTION SYSTEMS
PERSONNEL REPORTING AND INFORMATION SYSTEM FOR EMPLOYEES (PRISE)WORKFORCE SUMMARY AS OF DECEMBER 31, 2008
REPORT: PBUTNO31
DEPARTMENT OF INVESTIGATION (032)
MALE FEMALE
JOB GRP WHITE BLACK HSPN ASIANNATIVE AMER UKWN WHITE BLACK HSPN ASIAN
NATIVE AMER UKWN OTHR TOTAL
001 13 1 0 1 0 0 5 0 0 0 0 0 0 20002 11 2 1 0 0 0 17 4 1 3 0 1 0 40003 2 0 0 0 0 0 0 1 2 0 0 0 0 5004 1 1 0 1 0 0 0 1 0 2 0 0 0 6010 17 7 5 3 0 0 16 18 6 3 0 0 0 75012 0 0 0 0 0 0 3 13 5 0 0 0 0 21013 1 2 0 1 0 0 0 13 3 1 0 0 0 21018 11 7 5 2 0 0 6 2 2 1 0 0 0 36031 1 1 3 0 0 0 0 3 3 1 0 0 0 12
TOTAL 57 21 14 8 0 0 47 55 22 11 0 1 0 236%TAGE 24% 9% 6% 3% 0% 0% 20% 23% 9% 5% 0% 0% 0% 100%

9 NEW YORK CITY DEPARTMENT OF CITYWIDE ADMINISTRATIVE SERVICESOMIS CITYWIDE PERSONNEL PRODUCTION SYSTEMS
PERSONNEL REPORTING AND INFORMATION SYSTEM FOR EMPLOYEES (PRISE)WORKFORCE SUMMARY AS OF DECEMBER 31, 2008
REPORT: PBUTNO31
CIVILIAN COMPLAINT REVIEW BOARD (054)
MALE FEMALE
JOB GRP WHITE BLACK HSPN ASIANNATIVE AMER UKWN WHITE BLACK HSPN ASIAN
NATIVE AMER UKWN OTHR TOTAL
001 5 3 2 3 0 0 3 3 0 2 0 0 0 21002 5 2 1 0 0 0 9 0 3 0 0 1 0 21003 0 0 0 0 0 0 1 0 0 0 0 0 0 1004 0 0 0 0 0 0 0 0 0 1 0 0 0 1009 1 0 0 0 0 0 0 0 0 0 0 0 0 1010 46 3 2 3 0 0 37 15 8 3 0 3 0 120012 1 0 0 0 0 0 2 4 2 0 0 0 0 9013 0 2 1 0 0 0 0 1 1 0 1 0 0 6031 0 1 1 0 0 0 0 4 0 0 0 0 0 6
TOTAL 58 11 7 6 0 0 52 27 14 6 1 4 0 186%TAGE 31% 6% 4% 3% 0% 0% 28% 15% 8% 3% <1% 2% 0% 100%

10 NEW YORK CITY DEPARTMENT OF CITYWIDE ADMINISTRATIVE SERVICESOMIS CITYWIDE PERSONNEL PRODUCTION SYSTEMS
PERSONNEL REPORTING AND INFORMATION SYSTEM FOR EMPLOYEES (PRISE)WORKFORCE SUMMARY AS OF DECEMBER 31, 2008
REPORT: PBUTNO31
POLICE DEPARTMENT (056)
MALE FEMALE
JOB GRP WHITE BLACK HSPN ASIANNATIVE AMER UKWN WHITE BLACK HSPN ASIAN
NATIVE AMER UKWN OTHR TOTAL
001 8 0 0 0 0 0 0 1 0 0 0 0 0 9002 61 12 9 2 0 1 29 17 3 4 0 0 0 138003 44 14 4 18 0 0 51 58 25 22 0 0 0 236004 140 33 15 43 0 0 83 38 15 40 1 1 0 409005 27 1 2 1 0 0 8 9 1 0 0 0 0 49006 10 5 3 2 0 1 12 3 2 1 0 0 0 39007 4 0 2 1 0 0 0 2 0 0 0 0 0 9008 31 1 3 1 0 0 26 9 2 0 0 0 0 73009 18 2 4 0 0 0 3 3 1 2 0 0 0 33010 25 16 5 2 0 5 33 115 14 2 0 0 0 217012 23 34 10 16 0 0 230 603 102 24 7 2 1 1052013 80 174 50 54 1 0 298 2282 454 72 10 4 2 3481015 4452 572 919 205 12 10 377 313 229 23 11 6 3 7132018 12815 4052 6274 1783 32 31 1576 2707 2216 157 45 10 5 31703019 98 724 378 143 72 178 797 2949 1358 214 144 231 3 7289021 0 0 0 1 0 0 0 1 0 0 0 0 0 2022 26 76 50 10 1 1 11 97 88 3 0 0 0 363023 0 2 0 0 0 0 0 0 0 0 0 0 0 2024 8 4 15 0 0 0 3 0 3 0 0 0 0 33025 334 60 58 24 4 2 1 1 0 2 0 0 0 486026 10 5 1 2 0 0 0 0 0 0 0 0 0 18027 17 24 13 7 0 0 0 4 0 0 0 0 0 65028 7 5 2 2 0 0 2 0 0 0 0 0 0 18030 8 1 1 0 0 0 2 0 0 0 0 0 0 12031 5 6 4 6 0 0 4 20 10 5 0 1 1 62
TOTAL 18251 5823 7822 2323 122 229 3546 9232 4523 571 218 255 15 52930%TAGE 34% 11% 15% 4% <1% 0% 7% 17% 9% 1% <1% 0% <1% 100%

11 NEW YORK CITY DEPARTMENT OF CITYWIDE ADMINISTRATIVE SERVICESOMIS CITYWIDE PERSONNEL PRODUCTION SYSTEMS
PERSONNEL REPORTING AND INFORMATION SYSTEM FOR EMPLOYEES (PRISE)WORKFORCE SUMMARY AS OF DECEMBER 31, 2008
REPORT: PBUTNO31
FIRE DEPARTMENT (057)
MALE FEMALE
JOB GRP WHITE BLACK HSPN ASIANNATIVE AMER UKWN WHITE BLACK HSPN ASIAN
NATIVE AMER UKWN OTHR TOTAL
001 5 1 0 0 0 0 0 0 0 0 0 0 0 6002 83 9 4 2 1 2 26 7 3 4 0 0 0 141003 52 12 6 8 0 2 45 17 12 4 0 2 0 160004 28 8 5 16 1 3 11 9 2 12 0 0 0 95005 28 2 1 4 0 3 20 3 1 1 0 5 6 74007 7 0 0 0 0 0 0 0 0 0 0 0 0 7008 2 0 0 1 0 0 5 2 1 1 0 1 0 13009 1 0 0 0 0 0 2 0 0 1 0 0 0 4010 1119 508 574 93 5 9 290 264 226 24 5 1 2 3120012 10 9 9 4 0 0 53 70 30 10 1 0 0 196013 111 25 27 10 0 0 27 76 27 0 3 0 2 312016 2430 29 55 1 5 1 6 0 1 1 0 0 0 2528017 8032 418 688 109 9 6 17 9 10 0 0 0 1 9300021 3 1 5 0 0 1 0 0 1 0 0 0 0 11025 249 36 30 20 1 1 0 1 0 0 0 0 1 339026 2 0 0 0 0 0 0 0 0 0 0 0 0 2027 10 11 8 2 0 0 1 1 1 0 0 0 0 34028 9 4 2 0 0 0 0 0 0 0 0 0 0 15030 0 0 0 0 0 0 0 0 0 0 0 0 1 1031 2 0 2 0 0 0 4 0 1 0 0 0 1 10
TOTAL 12183 1073 1416 270 22 28 507 459 316 62 9 9 14 16368%TAGE 74% 7% 9% 2% <1% <1% 3% 3% 2% <1% <1% <1% <1% 100%

12 NEW YORK CITY DEPARTMENT OF CITYWIDE ADMINISTRATIVE SERVICESOMIS CITYWIDE PERSONNEL PRODUCTION SYSTEMS
PERSONNEL REPORTING AND INFORMATION SYSTEM FOR EMPLOYEES (PRISE)WORKFORCE SUMMARY AS OF DECEMBER 31, 2008
REPORT: PBUTNO31
ADMINISTRATION FOR CHILDREN'S SERVICES (067)
MALE FEMALE
JOB GRP WHITE BLACK HSPN ASIANNATIVE AMER UKWN WHITE BLACK HSPN ASIAN
NATIVE AMER UKWN OTHR TOTAL
001 1 0 0 0 0 0 0 0 0 0 0 0 0 1002 72 73 20 19 0 0 104 207 38 15 0 0 0 548003 51 69 14 22 1 0 47 111 19 18 0 0 0 352004 22 11 3 13 0 0 20 14 11 5 0 0 0 99005 1 0 0 0 0 0 1 6 0 2 0 0 0 10006 1 0 0 0 0 0 251 0 0 0 0 0 0 1007 122 569 104 43 3 0 111 2505 533 74 6 6 1 4217008 52 14 4 4 0 0 0 43 15 19 0 4 0 266009 0 0 0 0 0 0 4 0 1 1 0 0 0 2010 7 22 15 9 0 0 28 12 4 3 0 0 0 76012 9 34 9 4 0 0 32 262 41 11 4 0 0 402013 13 43 11 5 0 0 0 321 62 11 1 0 0 499015 1 0 0 0 0 0 4 0 0 0 0 0 0 1018 31 36 27 3 1 0 0 23 10 0 0 0 0 135021 0 1 2 0 0 0 0 0 0 0 0 0 0 3022 1 8 1 0 0 0 0 2 0 0 0 0 0 12025 7 1 0 0 0 0 0 0 0 0 0 0 0 8026 0 1 0 0 0 0 0 0 0 0 0 0 0 1027 5 24 3 2 0 0 0 4 0 0 0 0 0 38028 0 3 1 1 0 0 0 0 0 0 0 0 0 5030 0 1 0 0 0 0 2 20 4 3 0 0 0 30031 5 37 17 5 0 0 14 117 52 5 1 0 0 253
TOTAL 401 947 231 130 5 0 618 3648 790 167 12 10 1 6960%TAGE 4% 14% 3% 2% <1% <1% 9% 52% 11% 2% <1% <1% 0% 100%
13 NEW YORK CITY DEPARTMENT OF CITYWIDE ADMINISTRATIVE SERVICESOMIS CITYWIDE PERSONNEL PRODUCTION SYSTEMS
PERSONNEL REPORTING AND INFORMATION SYSTEM FOR EMPLOYEES (PRISE)WORKFORCE SUMMARY AS OF DECEMBER 31, 2008
REPORT: PBUTNO31
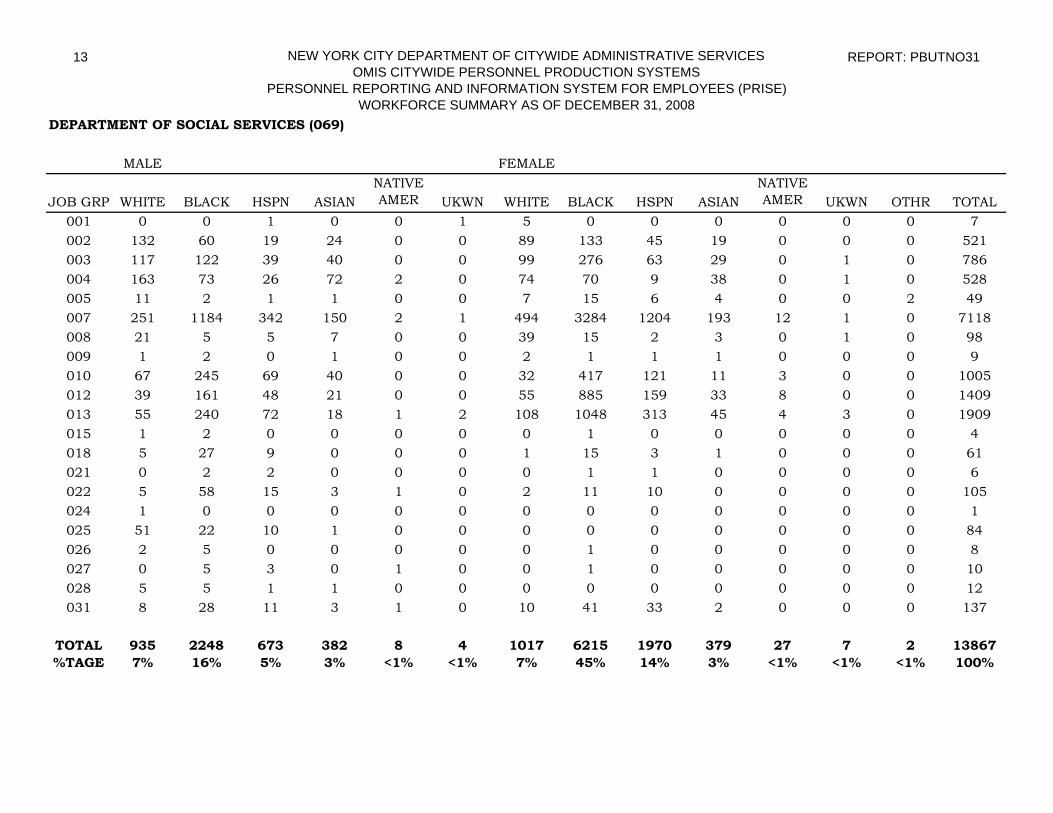
DEPARTMENT OF SOCIAL SERVICES (069)
MALE FEMALE
JOB GRP WHITE BLACK HSPN ASIANNATIVE AMER UKWN WHITE BLACK HSPN ASIAN
NATIVE AMER UKWN OTHR TOTAL
001 0 0 1 0 0 1 5 0 0 0 0 0 0 7002 132 60 19 24 0 0 89 133 45 19 0 0 0 521003 117 122 39 40 0 0 99 276 63 29 0 1 0 786004 163 73 26 72 2 0 74 70 9 38 0 1 0 528005 11 2 1 1 0 0 7 15 6 4 0 0 2 49007 251 1184 342 150 2 1 494 3284 1204 193 12 1 0 7118008 21 5 5 7 0 0 39 15 2 3 0 1 0 98009 1 2 0 1 0 0 2 1 1 1 0 0 0 9010 67 245 69 40 0 0 32 417 121 11 3 0 0 1005012 39 161 48 21 0 0 55 885 159 33 8 0 0 1409013 55 240 72 18 1 2 108 1048 313 45 4 3 0 1909015 1 2 0 0 0 0 0 1 0 0 0 0 0 4018 5 27 9 0 0 0 1 15 3 1 0 0 0 61021 0 2 2 0 0 0 0 1 1 0 0 0 0 6022 5 58 15 3 1 0 2 11 10 0 0 0 0 105024 1 0 0 0 0 0 0 0 0 0 0 0 0 1025 51 22 10 1 0 0 0 0 0 0 0 0 0 84026 2 5 0 0 0 0 0 1 0 0 0 0 0 8027 0 5 3 0 1 0 0 1 0 0 0 0 0 10028 5 5 1 1 0 0 0 0 0 0 0 0 0 12031 8 28 11 3 1 0 10 41 33 2 0 0 0 137
TOTAL 935 2248 673 382 8 4 1017 6215 1970 379 27 7 2 13867%TAGE 7% 16% 5% 3% <1% <1% 7% 45% 14% 3% <1% <1% <1% 100%

14 NEW YORK CITY DEPARTMENT OF CITYWIDE ADMINISTRATIVE SERVICESOMIS CITYWIDE PERSONNEL PRODUCTION SYSTEMS
PERSONNEL REPORTING AND INFORMATION SYSTEM FOR EMPLOYEES (PRISE)WORKFORCE SUMMARY AS OF DECEMBER 31, 2008
REPORT: PBUTNO31
DEPARTMENT OF HOMELESS SERVICES (071)
MALE FEMALE
JOB GRP WHITE BLACK HSPN ASIANNATIVE AMER UKWN WHITE BLACK HSPN ASIAN
NATIVE AMER UKWN OTHR TOTAL
001 1 0 0 0 0 0 2 0 0 0 0 0 0 3002 25 33 5 4 1 2 31 48 8 3 0 3 0 163003 30 52 12 9 0 0 23 71 17 5 1 1 1 222004 15 6 5 4 0 0 3 1 1 1 0 0 0 36007 11 65 17 6 0 0 12 86 19 0 0 0 0 216008 8 4 1 1 0 0 6 9 2 1 0 0 0 32009 0 0 0 0 0 0 1 0 0 0 0 0 0 1010 8 75 15 8 0 0 2 77 20 1 0 0 0 206012 6 15 10 1 1 0 8 97 28 1 0 0 0 167013 1 16 2 1 0 0 2 26 4 2 1 0 0 55018 15 132 58 4 1 0 1 110 28 0 2 0 0 351019 0 1 0 0 0 0 0 0 0 0 0 0 0 1022 1 35 4 2 0 0 0 21 0 2 0 0 0 65023 0 0 0 0 0 0 0 1 0 0 0 0 0 1025 80 20 10 10 0 0 0 1 0 0 0 0 0 121026 1 0 0 0 0 0 0 0 0 0 0 0 0 1027 10 33 5 1 0 0 0 4 3 0 0 0 0 56028 5 4 1 1 0 0 0 0 0 0 0 0 0 11030 0 0 0 0 0 0 0 1 0 0 0 0 0 1031 7 115 41 2 1 0 3 149 33 5 0 4 1 361
TOTAL 224 606 186 54 4 2 94 702 163 21 4 8 2 2070%TAGE 11% 29% 9% 3% <1% <1% 5% 34% 8% 1% <1% 0% <1% 100%

15 NEW YORK CITY DEPARTMENT OF CITYWIDE ADMINISTRATIVE SERVICESOMIS CITYWIDE PERSONNEL PRODUCTION SYSTEMS
PERSONNEL REPORTING AND INFORMATION SYSTEM FOR EMPLOYEES (PRISE)WORKFORCE SUMMARY AS OF DECEMBER 31, 2008
REPORT: PBUTNO31
DEPARTMENT OF CORRECTIONS (072)
MALE FEMALE
JOB GRP WHITE BLACK HSPN ASIANNATIVE AMER UKWN WHITE BLACK HSPN ASIAN
NATIVE AMER UKWN OTHR TOTAL
001 2 0 0 0 0 0 0 0 0 0 0 0 0 2002 59 61 24 2 0 2 15 54 3 1 0 0 0 221003 27 35 5 9 0 0 14 65 20 4 1 0 0 180004 44 18 4 14 0 0 4 5 0 0 0 0 0 89005 4 0 1 2 0 0 2 11 0 6 0 2 0 28006 4 0 0 0 0 0 0 0 0 0 0 0 0 4007 11 34 4 2 0 0 3 16 1 0 0 0 0 71008 7 1 1 1 0 1 5 5 1 0 0 0 0 22009 1 0 0 0 0 0 1 0 0 0 0 0 0 2010 8 11 6 7 0 1 2 22 7 3 1 1 0 69012 3 8 4 6 0 0 6 58 16 6 0 0 0 107013 8 24 8 8 0 0 4 61 18 5 0 0 0 136015 128 251 79 6 1 0 13 349 43 4 4 0 0 878018 777 2452 933 119 19 5 109 2852 465 19 52 6 6 7814020 5 79 17 2 0 0 2 59 7 3 1 0 2 177021 0 17 3 3 0 0 0 6 1 0 0 0 0 30022 5 8 3 0 0 0 0 2 0 0 0 0 0 18023 0 9 1 0 0 0 0 2 0 0 0 0 0 12025 178 60 28 7 0 2 0 2 0 0 0 0 1 278026 11 11 6 2 0 0 0 0 0 0 0 0 0 30027 4 29 8 2 0 0 1 3 2 0 0 0 0 49028 42 8 8 7 0 0 0 0 0 0 0 0 0 65030 0 0 0 1 0 0 0 0 0 0 0 0 0 1031 2 5 2 0 0 0 1 12 7 0 0 0 0 29
TOTAL 1330 3121 1145 200 20 11 182 3584 591 51 59 9 9 10312%TAGE 13% 30% 11% 2% <1% <1% 2% 35% 6% <1% <1% <1% <1% 100%

16 NEW YORK CITY DEPARTMENT OF CITYWIDE ADMINISTRATIVE SERVICESOMIS CITYWIDE PERSONNEL PRODUCTION SYSTEMS
PERSONNEL REPORTING AND INFORMATION SYSTEM FOR EMPLOYEES (PRISE)WORKFORCE SUMMARY AS OF DECEMBER 31, 2008
REPORT: PBUTNO31
DEPARTMENT FOR THE AGING (125)
MALE FEMALE
JOB GRP WHITE BLACK HSPN ASIANNATIVE AMER UKWN WHITE BLACK HSPN ASIAN
NATIVE AMER UKWN OTHR TOTAL
001 0 0 1 0 0 0 2 0 0 0 0 0 0 3002 6 3 2 1 0 0 17 5 4 5 0 0 0 43003 13 7 7 11 0 0 34 28 11 13 0 0 0 124004 2 1 1 3 0 0 3 1 0 3 0 0 0 14005 0 0 0 0 0 0 1 12 1 4 0 0 0 18006 1 0 0 0 0 0 0 1 0 0 0 0 0 2007 1 0 0 0 0 0 4 1 0 0 0 0 0 6008 1 0 0 0 0 0 0 0 0 0 0 0 0 1010 3 1 0 4 0 0 0 1 0 2 0 0 0 11012 4 4 2 1 0 0 6 20 6 4 0 0 0 47013 0 4 0 0 0 0 4 13 7 1 0 0 0 29022 0 0 0 0 0 0 0 0 1 0 0 0 0 1031 38 89 58 87 1 6 130 461 189 103 6 17 6 1191
TOTAL 69 109 71 107 1 6 201 543 219 135 6 17 6 1490%TAGE 5% 7% 5% 7% <1% <1% 13% 36% 15% 9% <1% <1% <1% 100%

17 NEW YORK CITY DEPARTMENT OF CITYWIDE ADMINISTRATIVE SERVICESOMIS CITYWIDE PERSONNEL PRODUCTION SYSTEMS
PERSONNEL REPORTING AND INFORMATION SYSTEM FOR EMPLOYEES (PRISE)WORKFORCE SUMMARY AS OF DECEMBER 31, 2008
REPORT: PBUTNO31
DEPARTMENT OF CULTURAL AFFAIRS (126)
MALE FEMALE
JOB GRP WHITE BLACK HSPN ASIANNATIVE AMER UKWN WHITE BLACK HSPN ASIAN
NATIVE AMER UKWN OTHR TOTAL
001 0 0 0 0 0 0 1 1 0 0 0 0 0 2002 3 0 0 0 0 0 4 1 0 2 0 0 0 10003 1 2 0 0 0 0 3 1 0 0 0 0 1 8009 3 1 0 0 0 0 7 3 0 1 0 3 1 19010 0 0 0 0 0 1 0 0 0 0 0 0 0 1012 1 0 0 0 0 0 0 1 1 0 0 0 0 3013 0 0 0 0 0 0 0 2 1 0 0 0 0 3028 1 1 0 0 0 0 0 0 0 0 0 0 0 2031 3 2 2 0 0 0 3 4 1 0 0 0 0 15
TOTAL 12 6 2 0 0 1 18 13 3 3 0 3 2 63%TAGE 19% 10% 3% 0% 0% 2% 29% 21% 5% 5% 0% 5% 3% 100%

18 NEW YORK CITY DEPARTMENT OF CITYWIDE ADMINISTRATIVE SERVICESOMIS CITYWIDE PERSONNEL PRODUCTION SYSTEMS
PERSONNEL REPORTING AND INFORMATION SYSTEM FOR EMPLOYEES (PRISE)WORKFORCE SUMMARY AS OF DECEMBER 31, 2008
REPORT: PBUTNO31
FINANCIAL INFORMATION SERVICES (127)
MALE FEMALE
JOB GRP WHITE BLACK HSPN ASIANNATIVE AMER UKWN WHITE BLACK HSPN ASIAN
NATIVE AMER UKWN OTHR TOTAL
001 1 0 0 0 0 0 0 0 0 0 0 0 0 1002 51 8 5 30 0 1 21 5 2 14 0 0 0 137003 6 0 1 0 0 0 6 6 0 4 0 0 0 23004 43 15 8 15 0 0 9 14 1 7 0 0 0 112008 0 0 0 0 0 0 2 0 0 0 0 0 0 2010 2 0 1 3 0 0 1 0 0 0 0 0 0 7012 2 0 4 0 0 0 3 7 4 2 0 1 0 23013 2 2 4 1 1 0 2 11 0 0 0 0 0 23022 0 0 2 1 0 0 0 0 0 0 0 0 0 3027 1 1 0 1 0 0 0 0 0 0 0 0 0 3031 0 0 0 1 0 0 0 0 0 0 0 0 0 1
TOTAL 108 26 25 52 1 1 44 43 7 27 0 1 0 335%TAGE 32% 8% 7% 16% <1% <1% 13% 13% 2% 8% 0% <1% <1% 100%
19 NEW YORK CITY DEPARTMENT OF CITYWIDE ADMINISTRATIVE SERVICESOMIS CITYWIDE PERSONNEL PRODUCTION SYSTEMS
PERSONNEL REPORTING AND INFORMATION SYSTEM FOR EMPLOYEES (PRISE)WORKFORCE SUMMARY AS OF DECEMBER 31, 2008
REPORT: PBUTNO31
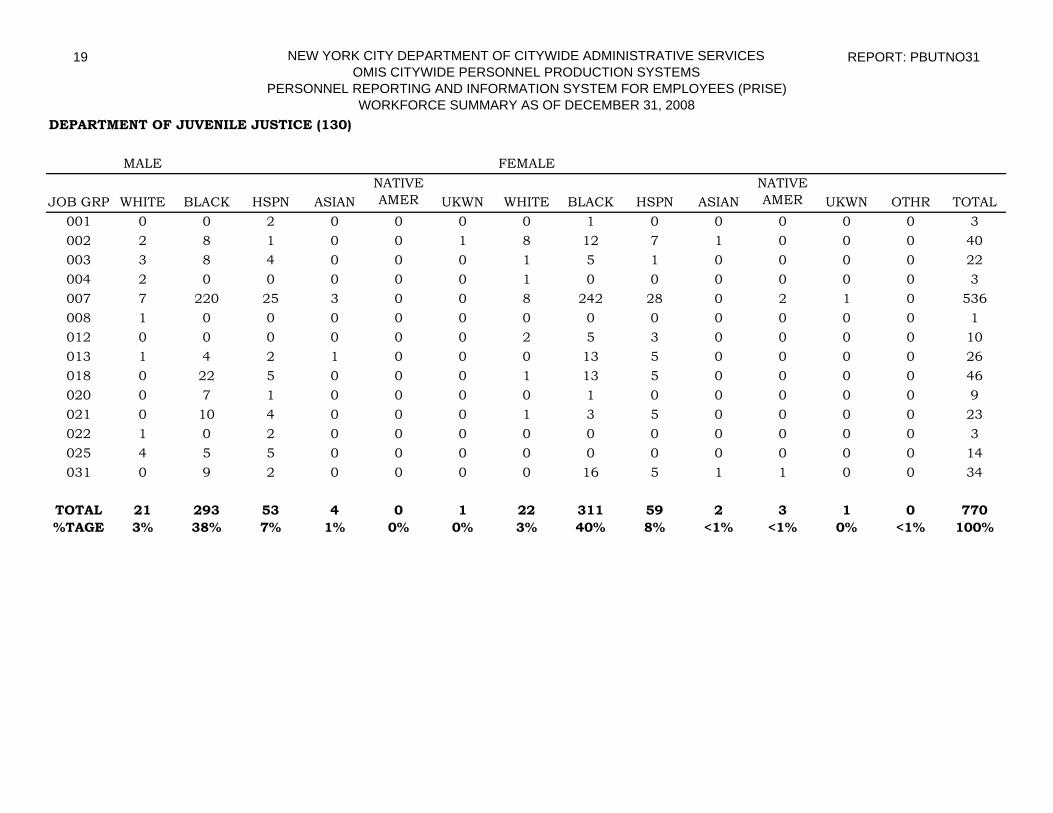
DEPARTMENT OF JUVENILE JUSTICE (130)
MALE FEMALE
JOB GRP WHITE BLACK HSPN ASIANNATIVE AMER UKWN WHITE BLACK HSPN ASIAN
NATIVE AMER UKWN OTHR TOTAL
001 0 0 2 0 0 0 0 1 0 0 0 0 0 3002 2 8 1 0 0 1 8 12 7 1 0 0 0 40003 3 8 4 0 0 0 1 5 1 0 0 0 0 22004 2 0 0 0 0 0 1 0 0 0 0 0 0 3007 7 220 25 3 0 0 8 242 28 0 2 1 0 536008 1 0 0 0 0 0 0 0 0 0 0 0 0 1012 0 0 0 0 0 0 2 5 3 0 0 0 0 10013 1 4 2 1 0 0 0 13 5 0 0 0 0 26018 0 22 5 0 0 0 1 13 5 0 0 0 0 46020 0 7 1 0 0 0 0 1 0 0 0 0 0 9021 0 10 4 0 0 0 1 3 5 0 0 0 0 23022 1 0 2 0 0 0 0 0 0 0 0 0 0 3025 4 5 5 0 0 0 0 0 0 0 0 0 0 14031 0 9 2 0 0 0 0 16 5 1 1 0 0 34
TOTAL 21 293 53 4 0 1 22 311 59 2 3 1 0 770%TAGE 3% 38% 7% 1% 0% 0% 3% 40% 8% <1% <1% 0% <1% 100%

20 NEW YORK CITY DEPARTMENT OF CITYWIDE ADMINISTRATIVE SERVICESOMIS CITYWIDE PERSONNEL PRODUCTION SYSTEMS
PERSONNEL REPORTING AND INFORMATION SYSTEM FOR EMPLOYEES (PRISE)WORKFORCE SUMMARY AS OF DECEMBER 31, 2008
REPORT: PBUTNO31
OFFICE OF PAYROLL ADMINISTRATION (131)
MALE FEMALE
JOB GRP WHITE BLACK HSPN ASIANNATIVE AMER UKWN WHITE BLACK HSPN ASIAN
NATIVE AMER UKWN OTHR TOTAL
001 1 0 1 0 0 0 0 0 0 0 0 0 0 2002 6 3 1 0 0 0 5 1 1 4 0 0 0 21003 5 3 0 5 0 0 4 5 4 0 0 0 0 26004 3 3 0 3 1 0 2 2 2 5 0 0 0 21008 0 0 0 0 0 0 1 0 0 0 0 0 0 1010 0 0 1 0 0 0 0 0 0 0 0 0 0 1012 3 2 1 0 0 0 2 11 4 1 0 0 0 24013 3 4 0 3 0 0 4 10 10 3 0 1 0 38022 0 1 0 0 0 0 0 0 0 0 0 0 0 1031 0 0 0 0 0 0 0 2 1 0 0 0 0 3
TOTAL 21 16 4 11 1 0 18 31 22 13 0 1 0 138%TAGE 15% 12% 3% 8% 1% 0% 13% 22% 16% 9% 0% 1% 0% 100%

21 NEW YORK CITY DEPARTMENT OF CITYWIDE ADMINISTRATIVE SERVICESOMIS CITYWIDE PERSONNEL PRODUCTION SYSTEMS
PERSONNEL REPORTING AND INFORMATION SYSTEM FOR EMPLOYEES (PRISE)WORKFORCE SUMMARY AS OF DECEMBER 31, 2008
REPORT: PBUTNO31
CITY CIVIL SERVICE COMMISSION (134)
MALE FEMALE
JOB GRP WHITE BLACK HSPN ASIANNATIVE AMER UKWN WHITE BLACK HSPN ASIAN
NATIVE AMER UKWN OTHR TOTAL
001 2 2 1 0 0 0 0 0 0 0 0 0 0 5002 0 0 0 0 0 0 0 0 2 0 0 0 0 2012 0 0 1 0 0 0 0 1 0 0 0 0 0 2
TOTAL 2 2 2 0 0 0 0 1 2 0 0 0 0 9%TAGE 22% 22% 22% 0% 0% 0% 0% 11% 22% 0% 0% 0% 0% 100%
22 NEW YORK CITY DEPARTMENT OF CITYWIDE ADMINISTRATIVE SERVICESOMIS CITYWIDE PERSONNEL PRODUCTION SYSTEMS
PERSONNEL REPORTING AND INFORMATION SYSTEM FOR EMPLOYEES (PRISE)WORKFORCE SUMMARY AS OF DECEMBER 31, 2008
REPORT: PBUTNO31
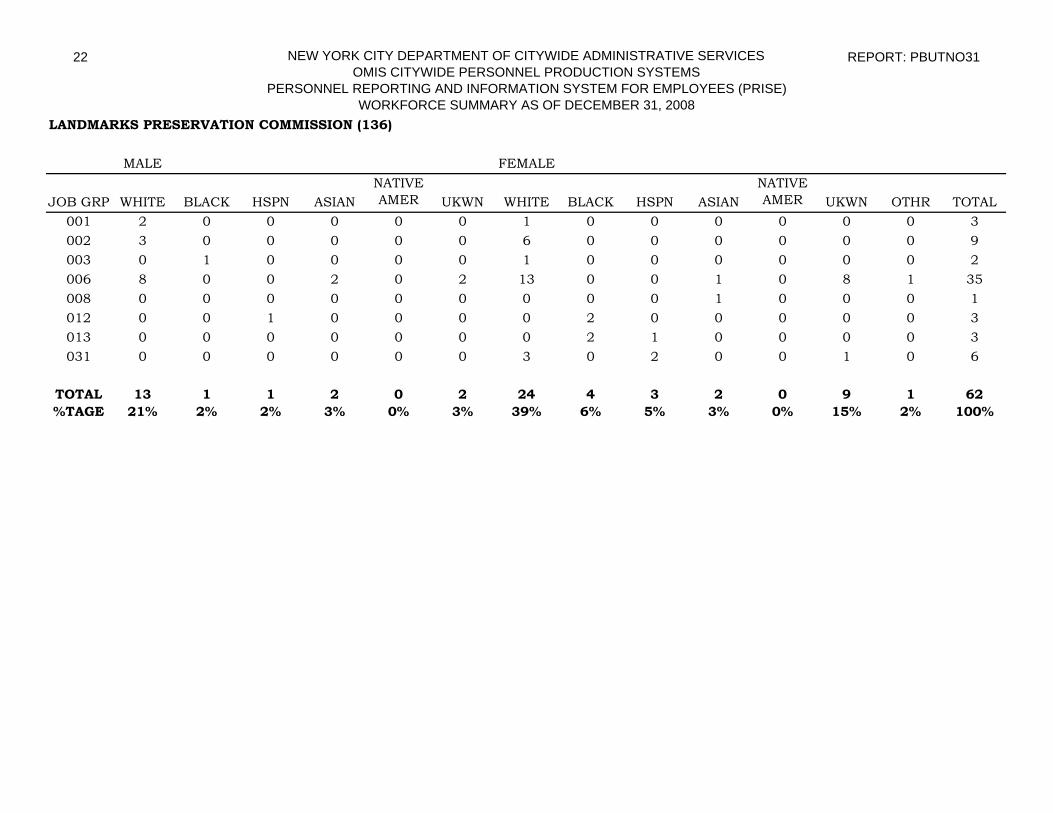
LANDMARKS PRESERVATION COMMISSION (136)
MALE FEMALE
JOB GRP WHITE BLACK HSPN ASIANNATIVE AMER UKWN WHITE BLACK HSPN ASIAN
NATIVE AMER UKWN OTHR TOTAL
001 2 0 0 0 0 0 1 0 0 0 0 0 0 3002 3 0 0 0 0 0 6 0 0 0 0 0 0 9003 0 1 0 0 0 0 1 0 0 0 0 0 0 2006 8 0 0 2 0 2 13 0 0 1 0 8 1 35008 0 0 0 0 0 0 0 0 0 1 0 0 0 1012 0 0 1 0 0 0 0 2 0 0 0 0 0 3013 0 0 0 0 0 0 0 2 1 0 0 0 0 3031 0 0 0 0 0 0 3 0 2 0 0 1 0 6
TOTAL 13 1 1 2 0 2 24 4 3 2 0 9 1 62%TAGE 21% 2% 2% 3% 0% 3% 39% 6% 5% 3% 0% 15% 2% 100%

23 NEW YORK CITY DEPARTMENT OF CITYWIDE ADMINISTRATIVE SERVICESOMIS CITYWIDE PERSONNEL PRODUCTION SYSTEMS
PERSONNEL REPORTING AND INFORMATION SYSTEM FOR EMPLOYEES (PRISE)WORKFORCE SUMMARY AS OF DECEMBER 31, 2008
REPORT: PBUTNO31
TAXI & LIMOUSINE COMMISSION (156)
MALE FEMALE
JOB GRP WHITE BLACK HSPN ASIANNATIVE AMER UKWN WHITE BLACK HSPN ASIAN
NATIVE AMER UKWN OTHR TOTAL
001 2 0 0 0 0 0 0 0 0 0 0 0 0 2002 11 2 2 0 0 0 6 5 2 0 0 0 0 28003 7 1 0 1 0 0 1 0 0 0 0 0 0 10004 2 4 0 0 0 0 1 1 0 0 0 0 1 9008 40 4 3 3 0 1 33 3 1 1 0 1 0 90009 0 0 0 0 0 0 1 0 0 0 0 0 0 1010 1 2 0 0 0 0 1 2 0 0 0 0 0 6012 5 0 2 2 0 0 7 13 3 3 0 0 0 35013 7 13 5 8 0 0 9 37 21 8 0 0 0 108018 39 44 48 9 0 0 1 8 8 0 1 0 0 158025 0 0 0 0 0 0 0 0 0 0 0 0 1 1031 6 6 3 0 0 0 1 12 5 2 0 0 0 35
TOTAL 120 76 63 23 0 1 61 81 40 14 1 1 2 483%TAGE 25% 16% 13% 5% 0% <1% 13% 17% 8% 3% <1% 0% <1% 100%

24 NEW YORK CITY DEPARTMENT OF CITYWIDE ADMINISTRATIVE SERVICESOMIS CITYWIDE PERSONNEL PRODUCTION SYSTEMS
PERSONNEL REPORTING AND INFORMATION SYSTEM FOR EMPLOYEES (PRISE)WORKFORCE SUMMARY AS OF DECEMBER 31, 2008
REPORT: PBUTNO31
OFFICE OF LABOR RELATIONS (214)
MALE FEMALE
JOB GRP WHITE BLACK HSPN ASIANNATIVE AMER UKWN WHITE BLACK HSPN ASIAN
NATIVE AMER UKWN OTHR TOTAL
001 1 0 0 0 0 0 1 0 1 0 0 0 0 3002 6 0 1 1 0 0 14 2 0 0 0 0 0 24003 2 3 0 3 0 0 5 3 1 2 0 0 0 19004 2 0 0 0 0 0 1 0 0 0 0 0 0 3008 4 0 0 0 0 0 1 1 0 0 0 0 0 6010 0 0 1 0 0 0 0 1 0 0 0 0 0 2012 0 1 0 0 0 0 5 5 3 1 0 0 0 15013 0 1 2 0 0 0 3 13 2 2 1 0 0 24031 0 2 1 0 0 0 2 4 0 0 0 0 0 9
TOTAL 15 7 5 4 0 0 32 29 7 5 1 0 0 105%TAGE 14% 7% 5% 4% 0% 0% 30% 28% 7% 5% 1% 0% 0% 100%

25 NEW YORK CITY DEPARTMENT OF CITYWIDE ADMINISTRATIVE SERVICESOMIS CITYWIDE PERSONNEL PRODUCTION SYSTEMS
PERSONNEL REPORTING AND INFORMATION SYSTEM FOR EMPLOYEES (PRISE)WORKFORCE SUMMARY AS OF DECEMBER 31, 2008
REPORT: PBUTNO31
COMMISSION ON HUMAN RIGHTS (226)
MALE FEMALE
JOB GRP WHITE BLACK HSPN ASIANNATIVE AMER UKWN WHITE BLACK HSPN ASIAN
NATIVE AMER UKWN OTHR TOTAL
001 1 0 1 0 0 0 1 1 0 0 0 0 0 4002 1 0 0 0 0 0 1 0 0 0 0 0 0 2003 0 0 0 0 0 0 1 1 0 0 0 0 0 2004 0 0 0 0 0 0 1 0 0 0 0 0 0 1007 8 11 6 1 0 0 3 6 1 0 0 0 0 36008 5 3 0 0 0 0 4 3 0 2 0 2 0 19009 0 0 0 0 0 0 1 0 0 1 0 0 0 2010 0 0 0 0 0 0 0 0 1 0 0 0 0 1012 0 0 0 0 0 0 0 3 3 0 0 0 0 6013 0 0 0 0 0 0 0 4 0 0 0 0 0 4031 2 0 0 0 0 2 0 1 1 0 0 2 0 8
TOTAL 17 14 7 1 0 2 12 19 6 3 0 4 0 85%TAGE 20% 16% 8% 1% 0% 2% 14% 22% 7% 4% 0% 5% 0% 100%
26 NEW YORK CITY DEPARTMENT OF CITYWIDE ADMINISTRATIVE SERVICESOMIS CITYWIDE PERSONNEL PRODUCTION SYSTEMS
PERSONNEL REPORTING AND INFORMATION SYSTEM FOR EMPLOYEES (PRISE)WORKFORCE SUMMARY AS OF DECEMBER 31, 2008
REPORT: PBUTNO31
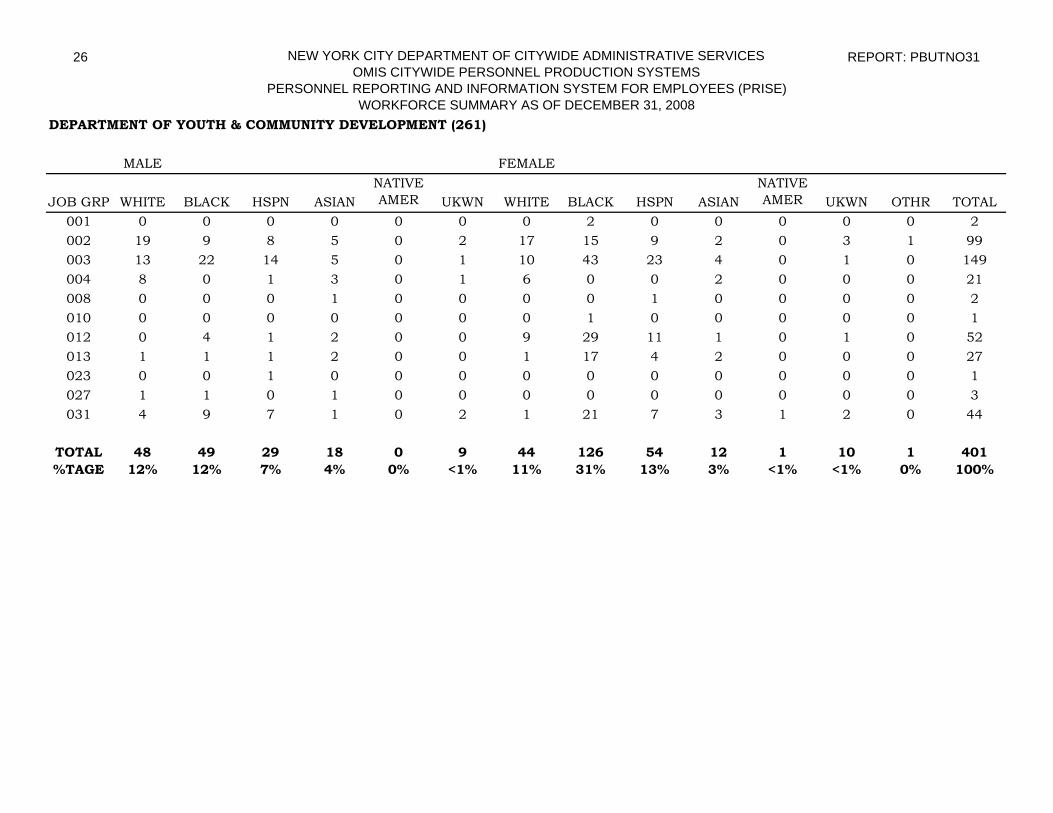
DEPARTMENT OF YOUTH & COMMUNITY DEVELOPMENT (261)
MALE FEMALE
JOB GRP WHITE BLACK HSPN ASIANNATIVE AMER UKWN WHITE BLACK HSPN ASIAN
NATIVE AMER UKWN OTHR TOTAL
001 0 0 0 0 0 0 0 2 0 0 0 0 0 2002 19 9 8 5 0 2 17 15 9 2 0 3 1 99003 13 22 14 5 0 1 10 43 23 4 0 1 0 149004 8 0 1 3 0 1 6 0 0 2 0 0 0 21008 0 0 0 1 0 0 0 0 1 0 0 0 0 2010 0 0 0 0 0 0 0 1 0 0 0 0 0 1012 0 4 1 2 0 0 9 29 11 1 0 1 0 52013 1 1 1 2 0 0 1 17 4 2 0 0 0 27023 0 0 1 0 0 0 0 0 0 0 0 0 0 1027 1 1 0 1 0 0 0 0 0 0 0 0 0 3031 4 9 7 1 0 2 1 21 7 3 1 2 0 44
TOTAL 48 49 29 18 0 9 44 126 54 12 1 10 1 401%TAGE 12% 12% 7% 4% 0% <1% 11% 31% 13% 3% <1% <1% 0% 100%
27 NEW YORK CITY DEPARTMENT OF CITYWIDE ADMINISTRATIVE SERVICESOMIS CITYWIDE PERSONNEL PRODUCTION SYSTEMS
PERSONNEL REPORTING AND INFORMATION SYSTEM FOR EMPLOYEES (PRISE)WORKFORCE SUMMARY AS OF DECEMBER 31, 2008
REPORT: PBUTNO31
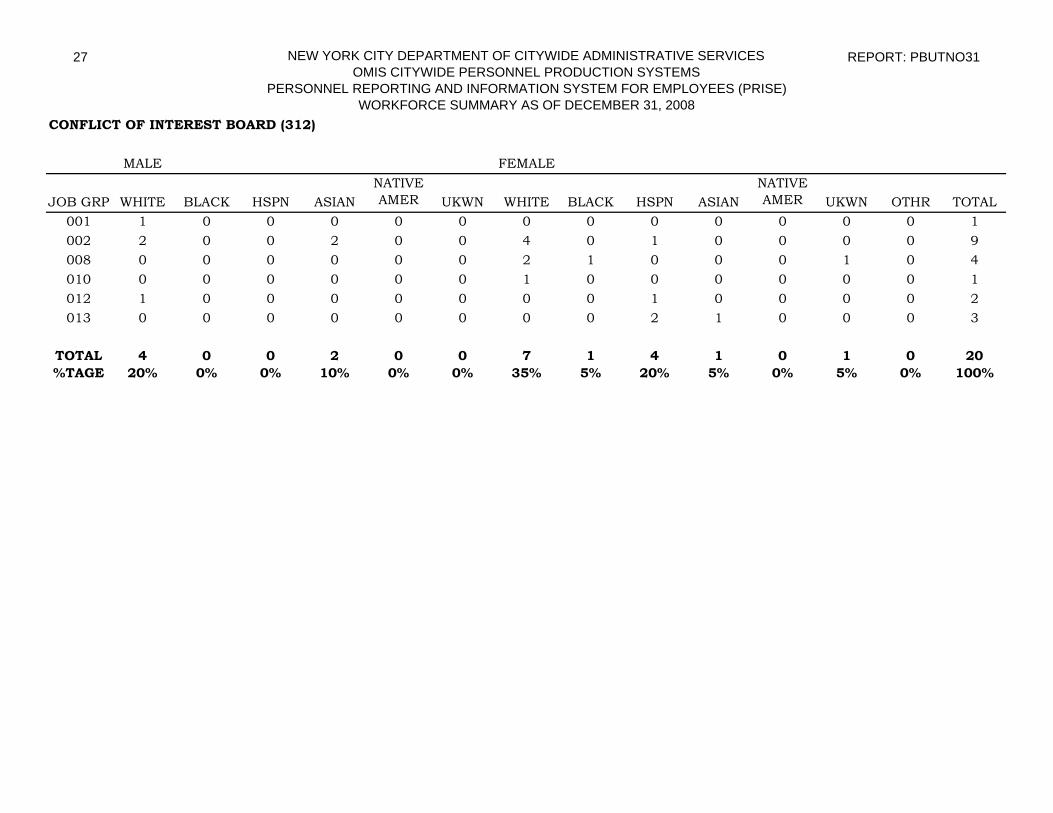
CONFLICT OF INTEREST BOARD (312)
MALE FEMALE
JOB GRP WHITE BLACK HSPN ASIANNATIVE AMER UKWN WHITE BLACK HSPN ASIAN
NATIVE AMER UKWN OTHR TOTAL
001 1 0 0 0 0 0 0 0 0 0 0 0 0 1002 2 0 0 2 0 0 4 0 1 0 0 0 0 9008 0 0 0 0 0 0 2 1 0 0 0 1 0 4010 0 0 0 0 0 0 1 0 0 0 0 0 0 1012 1 0 0 0 0 0 0 0 1 0 0 0 0 2013 0 0 0 0 0 0 0 0 2 1 0 0 0 3
TOTAL 4 0 0 2 0 0 7 1 4 1 0 1 0 20%TAGE 20% 0% 0% 10% 0% 0% 35% 5% 20% 5% 0% 5% 0% 100%

28 NEW YORK CITY DEPARTMENT OF CITYWIDE ADMINISTRATIVE SERVICESOMIS CITYWIDE PERSONNEL PRODUCTION SYSTEMS
PERSONNEL REPORTING AND INFORMATION SYSTEM FOR EMPLOYEES (PRISE)WORKFORCE SUMMARY AS OF DECEMBER 31, 2008
REPORT: PBUTNO31
DEPARTMENT OF PROBATION (781)
MALE FEMALE
JOB GRP WHITE BLACK HSPN ASIANNATIVE AMER UKWN WHITE BLACK HSPN ASIAN
NATIVE AMER UKWN OTHR TOTAL
002 18 7 1 0 0 0 15 14 5 0 0 0 0 60003 7 1 2 1 0 0 5 9 0 0 0 0 0 25004 0 1 2 3 0 1 2 0 2 0 0 0 0 11006 0 1 0 0 0 0 0 0 0 0 0 0 0 1007 70 148 35 8 1 4 60 384 65 6 3 1 0 785008 4 0 0 1 0 0 5 1 0 1 0 0 0 12009 0 0 0 0 0 0 0 0 3 0 0 0 0 3010 2 0 3 0 0 0 0 0 1 0 0 0 0 6012 0 2 2 0 0 0 7 36 9 0 0 0 0 56013 3 8 1 3 0 0 19 118 21 6 1 3 0 183022 2 1 1 0 0 0 0 0 0 0 0 0 0 4028 0 5 1 0 0 0 0 5 0 0 0 0 0 11031 1 10 2 1 0 0 2 11 5 0 0 0 0 32
TOTAL 107 184 50 17 1 5 115 578 111 13 4 4 0 1189%TAGE 9% 15% 4% 1% <1% <1% 10% 49% 9% 1% <1% <1% 0% 100%
29 NEW YORK CITY DEPARTMENT OF CITYWIDE ADMINISTRATIVE SERVICESOMIS CITYWIDE PERSONNEL PRODUCTION SYSTEMS
PERSONNEL REPORTING AND INFORMATION SYSTEM FOR EMPLOYEES (PRISE)WORKFORCE SUMMARY AS OF DECEMBER 31, 2008
REPORT: PBUTNO31
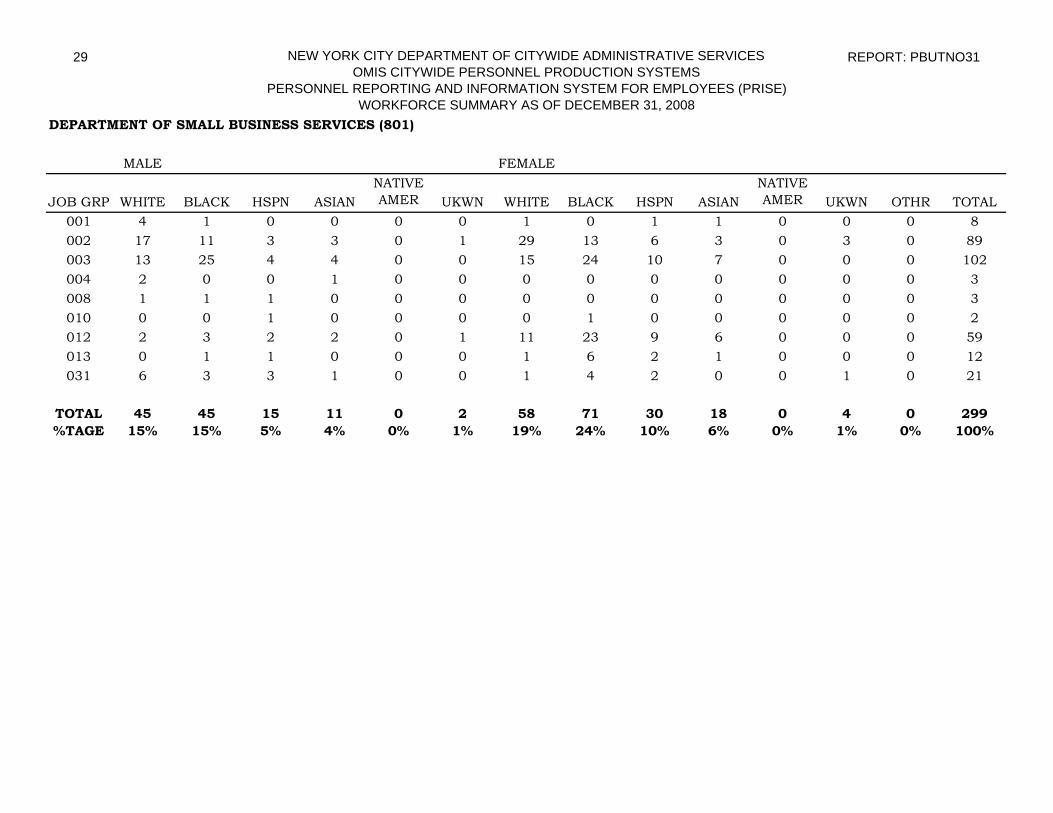
DEPARTMENT OF SMALL BUSINESS SERVICES (801)
MALE FEMALE
JOB GRP WHITE BLACK HSPN ASIANNATIVE AMER UKWN WHITE BLACK HSPN ASIAN
NATIVE AMER UKWN OTHR TOTAL
001 4 1 0 0 0 0 1 0 1 1 0 0 0 8002 17 11 3 3 0 1 29 13 6 3 0 3 0 89003 13 25 4 4 0 0 15 24 10 7 0 0 0 102004 2 0 0 1 0 0 0 0 0 0 0 0 0 3008 1 1 1 0 0 0 0 0 0 0 0 0 0 3010 0 0 1 0 0 0 0 1 0 0 0 0 0 2012 2 3 2 2 0 1 11 23 9 6 0 0 0 59013 0 1 1 0 0 0 1 6 2 1 0 0 0 12031 6 3 3 1 0 0 1 4 2 0 0 1 0 21
TOTAL 45 45 15 11 0 2 58 71 30 18 0 4 0 299%TAGE 15% 15% 5% 4% 0% 1% 19% 24% 10% 6% 0% 1% 0% 100%

30 NEW YORK CITY DEPARTMENT OF CITYWIDE ADMINISTRATIVE SERVICESOMIS CITYWIDE PERSONNEL PRODUCTION SYSTEMS
PERSONNEL REPORTING AND INFORMATION SYSTEM FOR EMPLOYEES (PRISE)WORKFORCE SUMMARY AS OF DECEMBER 31, 2008
REPORT: PBUTNO31
DEPARTMENT OF HOUSING PRESERVATION AND DEVELOPMENT (806)
MALE FEMALE
JOB GRP WHITE BLACK HSPN ASIANNATIVE AMER UKWN WHITE BLACK HSPN ASIAN
NATIVE AMER UKWN OTHR TOTAL
001 5 0 0 0 0 0 1 1 0 0 0 0 0 7002 137 105 44 47 0 1 51 21 10 5 0 0 0 421003 174 254 110 61 3 0 55 127 29 20 0 0 0 833004 19 9 6 10 0 1 9 11 0 5 0 0 0 70006 44 24 15 4 0 0 29 41 13 6 0 0 0 176007 0 0 0 0 0 0 0 1 0 1 0 0 0 2008 20 5 5 5 0 1 16 13 1 7 0 0 0 73009 0 1 2 0 0 0 0 0 0 0 0 0 0 3010 2 3 1 4 0 0 2 2 0 0 0 0 0 14012 12 18 11 6 0 0 22 186 50 10 0 0 0 315013 7 27 12 4 0 0 17 194 60 13 1 0 0 335025 19 22 18 7 0 1 1 0 0 1 0 0 1 70027 1 1 0 1 0 0 0 0 0 0 0 0 0 3028 0 2 0 0 0 0 1 6 3 0 0 0 0 12031 10 40 20 4 0 0 15 147 80 8 1 0 0 325
TOTAL 450 511 244 153 3 4 219 750 246 76 2 0 1 2659%TAGE 17% 19% 9% 6% <1% 1% 8% 28% 9% 3% <1% <1% <1% 100%

31 NEW YORK CITY DEPARTMENT OF CITYWIDE ADMINISTRATIVE SERVICESOMIS CITYWIDE PERSONNEL PRODUCTION SYSTEMS
PERSONNEL REPORTING AND INFORMATION SYSTEM FOR EMPLOYEES (PRISE)WORKFORCE SUMMARY AS OF DECEMBER 31, 2008
REPORT: PBUTNO31
DEPARTMENT OF BUILDINGS (810)
MALE FEMALE
JOB GRP WHITE BLACK HSPN ASIANNATIVE AMER UKWN WHITE BLACK HSPN ASIAN
NATIVE AMER UKWN OTHR TOTAL
001 1 0 0 0 0 0 1 0 0 0 0 0 0 2002 81 18 14 23 0 0 30 14 1 4 0 0 0 185003 252 95 37 56 1 2 20 27 12 5 1 0 0 508004 24 10 4 15 0 0 7 1 4 5 0 0 0 70006 1 0 0 1 0 0 0 0 0 0 0 0 0 2008 11 1 0 0 1 0 8 6 4 2 0 0 0 33010 0 0 0 0 0 0 0 0 0 1 0 0 0 1012 7 14 8 6 0 0 28 97 28 6 0 0 0 194013 6 8 6 2 0 0 6 45 6 2 1 0 0 82031 10 38 9 1 0 1 8 85 37 8 1 1 1 200
TOTAL 393 184 78 104 2 3 108 275 92 33 3 1 1 1277%TAGE 31% 14% 6% 8% <1% <1% 8% 22% 7% 3% <1% 0% 0% 100%

32 NEW YORK CITY DEPARTMENT OF CITYWIDE ADMINISTRATIVE SERVICESOMIS CITYWIDE PERSONNEL PRODUCTION SYSTEMS
PERSONNEL REPORTING AND INFORMATION SYSTEM FOR EMPLOYEES (PRISE)WORKFORCE SUMMARY AS OF DECEMBER 31, 2008
REPORT: PBUTNO31
DEPARTMENT OF HEALTH & MENTAL HYGIENE (816)
MALE FEMALE
JOB GRP WHITE BLACK HSPN ASIANNATIVE AMER UKWN WHITE BLACK HSPN ASIAN
NATIVE AMER UKWN OTHR TOTAL
001 7 0 0 0 0 0 1 1 1 0 0 0 0 10002 118 35 19 24 0 3 150 92 24 28 0 7 0 500003 101 157 56 46 0 5 176 527 195 76 1 47 0 1387004 154 58 39 87 0 4 301 134 52 113 0 23 1 966005 70 34 5 26 0 0 368 401 63 128 2 0 1 1098006 7 2 3 0 0 0 12 12 3 0 0 0 0 39007 1 7 2 0 0 0 5 38 5 0 0 0 0 58008 12 2 2 1 0 1 40 5 0 1 0 0 0 64009 5 0 0 0 0 0 3 2 0 2 0 0 0 12010 46 157 51 48 1 1 24 162 41 26 1 0 2 560012 9 30 14 5 0 0 35 276 88 20 2 0 0 479013 25 77 32 10 1 0 58 323 89 18 2 4 1 640015 1 0 0 0 0 0 0 0 0 0 0 0 0 1018 3 23 9 1 0 0 0 13 5 0 0 0 0 54019 4 13 10 3 0 0 0 17 2 0 1 0 0 50021 1 17 2 4 0 0 37 126 43 8 1 0 0 239022 13 96 51 2 1 0 2 25 12 0 1 0 0 203025 36 8 8 3 0 0 0 0 0 0 0 0 0 55026 3 1 2 2 0 0 0 0 0 0 0 0 0 8027 11 42 23 4 0 0 4 7 4 0 0 0 0 95028 5 18 6 2 0 0 0 1 1 0 0 0 0 33030 2 7 4 2 0 0 10 62 19 8 0 0 0 114031 16 42 14 9 0 3 37 112 38 21 2 4 2 300
TOTAL 650 826 353 279 3 17 1263 2336 685 449 13 85 7 6965%TAGE 9% 12% 5% 4% <1% <1% 18% 34% 10% 6% <1% <1% <1% 100%
33 NEW YORK CITY DEPARTMENT OF CITYWIDE ADMINISTRATIVE SERVICESOMIS CITYWIDE PERSONNEL PRODUCTION SYSTEMS
PERSONNEL REPORTING AND INFORMATION SYSTEM FOR EMPLOYEES (PRISE)WORKFORCE SUMMARY AS OF DECEMBER 31, 2008
REPORT: PBUTNO31
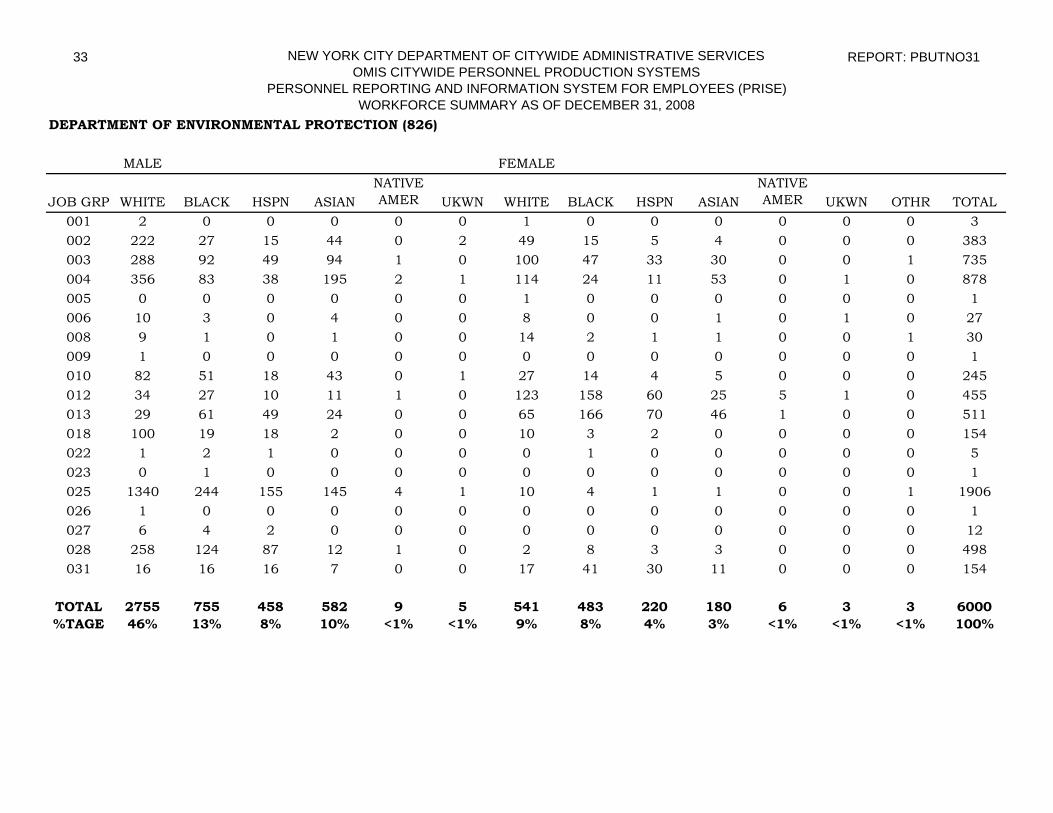
DEPARTMENT OF ENVIRONMENTAL PROTECTION (826)
MALE FEMALE
JOB GRP WHITE BLACK HSPN ASIANNATIVE AMER UKWN WHITE BLACK HSPN ASIAN
NATIVE AMER UKWN OTHR TOTAL
001 2 0 0 0 0 0 1 0 0 0 0 0 0 3002 222 27 15 44 0 2 49 15 5 4 0 0 0 383003 288 92 49 94 1 0 100 47 33 30 0 0 1 735004 356 83 38 195 2 1 114 24 11 53 0 1 0 878005 0 0 0 0 0 0 1 0 0 0 0 0 0 1006 10 3 0 4 0 0 8 0 0 1 0 1 0 27008 9 1 0 1 0 0 14 2 1 1 0 0 1 30009 1 0 0 0 0 0 0 0 0 0 0 0 0 1010 82 51 18 43 0 1 27 14 4 5 0 0 0 245012 34 27 10 11 1 0 123 158 60 25 5 1 0 455013 29 61 49 24 0 0 65 166 70 46 1 0 0 511018 100 19 18 2 0 0 10 3 2 0 0 0 0 154022 1 2 1 0 0 0 0 1 0 0 0 0 0 5023 0 1 0 0 0 0 0 0 0 0 0 0 0 1025 1340 244 155 145 4 1 10 4 1 1 0 0 1 1906026 1 0 0 0 0 0 0 0 0 0 0 0 0 1027 6 4 2 0 0 0 0 0 0 0 0 0 0 12028 258 124 87 12 1 0 2 8 3 3 0 0 0 498031 16 16 16 7 0 0 17 41 30 11 0 0 0 154
TOTAL 2755 755 458 582 9 5 541 483 220 180 6 3 3 6000%TAGE 46% 13% 8% 10% <1% <1% 9% 8% 4% 3% <1% <1% <1% 100%

34 NEW YORK CITY DEPARTMENT OF CITYWIDE ADMINISTRATIVE SERVICESOMIS CITYWIDE PERSONNEL PRODUCTION SYSTEMS
PERSONNEL REPORTING AND INFORMATION SYSTEM FOR EMPLOYEES (PRISE)WORKFORCE SUMMARY AS OF DECEMBER 31, 2008
REPORT: PBUTNO31
DEPARTMENT OF SANITATION (827)
MALE FEMALE
JOB GRP WHITE BLACK HSPN ASIANNATIVE AMER UKWN WHITE BLACK HSPN ASIAN
NATIVE AMER UKWN OTHR TOTAL
001 4 0 0 0 0 0 0 0 0 0 0 0 0 4002 253 20 15 24 0 2 14 9 2 1 0 0 0 340003 59 76 29 21 2 0 22 74 36 5 2 0 0 326004 27 17 5 23 0 0 18 13 5 5 0 0 0 113005 2 2 0 0 0 0 3 2 1 0 0 0 0 10006 1 1 1 1 0 0 0 1 0 1 0 0 0 6007 3 1 0 0 0 0 1 0 0 0 0 0 0 5008 3 1 0 0 0 0 8 0 0 0 0 0 0 12009 4 1 0 0 0 0 1 0 1 0 0 0 0 7010 3 7 1 1 0 0 3 2 4 2 0 0 0 23012 9 1 3 3 0 0 13 14 8 1 0 0 0 52013 39 52 18 9 0 0 61 156 43 16 0 0 2 396019 3 0 1 0 0 0 0 0 0 0 0 0 0 4022 0 1 0 0 0 0 0 0 0 0 0 0 0 1023 8 9 5 0 0 0 0 2 3 0 0 0 0 27025 602 83 61 35 0 3 4 3 1 0 0 0 0 792026 18 14 0 0 0 0 0 0 0 0 0 0 0 32027 3 2 1 0 0 0 0 1 0 0 0 0 0 7028 23 31 16 1 0 0 1 18 9 0 1 0 2 102029 4005 1616 1274 90 13 5 30 112 36 0 4 0 2 7187031 4 17 17 1 0 0 6 25 7 1 0 0 0 78
TOTAL 5073 1952 1447 209 15 10 185 432 156 32 7 0 6 9524%TAGE 53% 20% 15% 2% <1% <1% 2% 5% 2% <1% <1% 0% <1% 100%
35 NEW YORK CITY DEPARTMENT OF CITYWIDE ADMINISTRATIVE SERVICESOMIS CITYWIDE PERSONNEL PRODUCTION SYSTEMS
PERSONNEL REPORTING AND INFORMATION SYSTEM FOR EMPLOYEES (PRISE)WORKFORCE SUMMARY AS OF DECEMBER 31, 2008
REPORT: PBUTNO31
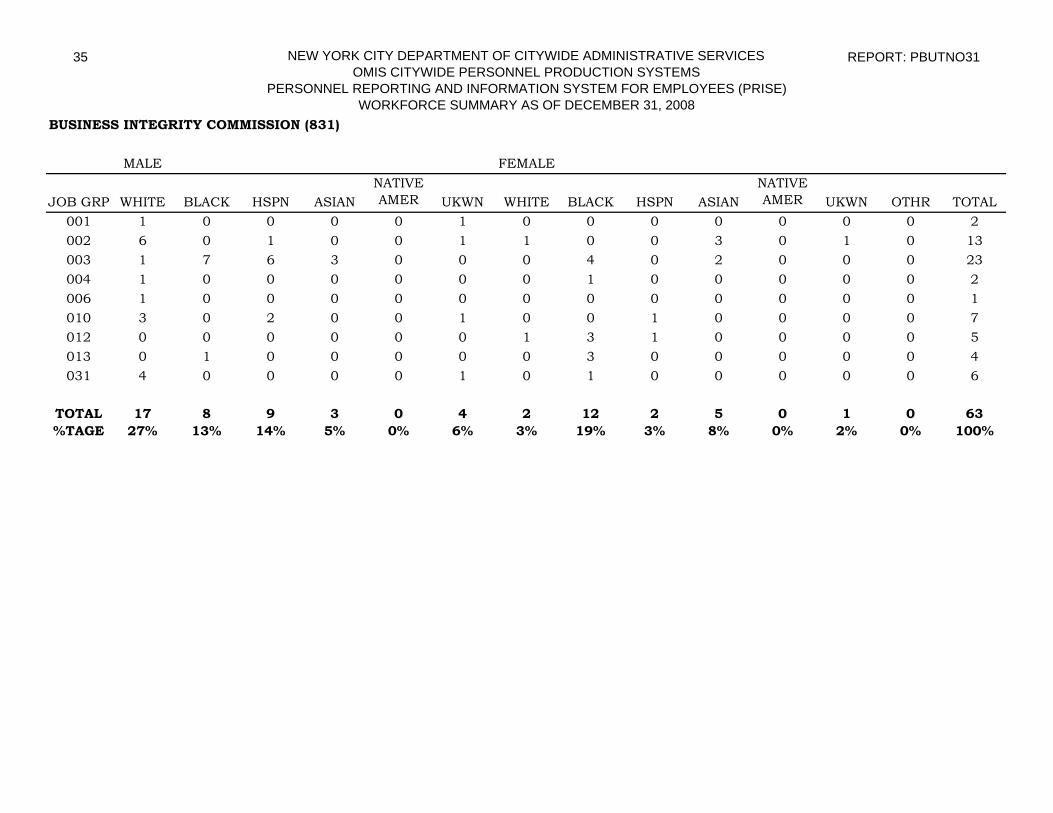
BUSINESS INTEGRITY COMMISSION (831)
MALE FEMALE
JOB GRP WHITE BLACK HSPN ASIANNATIVE AMER UKWN WHITE BLACK HSPN ASIAN
NATIVE AMER UKWN OTHR TOTAL
001 1 0 0 0 0 1 0 0 0 0 0 0 0 2002 6 0 1 0 0 1 1 0 0 3 0 1 0 13003 1 7 6 3 0 0 0 4 0 2 0 0 0 23004 1 0 0 0 0 0 0 1 0 0 0 0 0 2006 1 0 0 0 0 0 0 0 0 0 0 0 0 1010 3 0 2 0 0 1 0 0 1 0 0 0 0 7012 0 0 0 0 0 0 1 3 1 0 0 0 0 5013 0 1 0 0 0 0 0 3 0 0 0 0 0 4031 4 0 0 0 0 1 0 1 0 0 0 0 0 6
TOTAL 17 8 9 3 0 4 2 12 2 5 0 1 0 63%TAGE 27% 13% 14% 5% 0% 6% 3% 19% 3% 8% 0% 2% 0% 100%

36 NEW YORK CITY DEPARTMENT OF CITYWIDE ADMINISTRATIVE SERVICESOMIS CITYWIDE PERSONNEL PRODUCTION SYSTEMS
PERSONNEL REPORTING AND INFORMATION SYSTEM FOR EMPLOYEES (PRISE)WORKFORCE SUMMARY AS OF DECEMBER 31, 2008
REPORT: PBUTNO31
DEPARTMENT OF FINANCE (836)
MALE FEMALE
JOB GRP WHITE BLACK HSPN ASIANNATIVE AMER UKWN WHITE BLACK HSPN ASIAN
NATIVE AMER UKWN OTHR TOTAL
001 0 2 0 0 0 0 1 1 0 0 0 0 0 4002 46 24 11 11 0 1 38 28 3 8 0 0 0 170003 166 90 20 47 0 0 51 86 16 43 0 0 0 519004 68 14 9 20 0 0 19 23 4 14 0 0 0 171006 0 0 0 0 0 0 0 0 0 1 0 0 1008 16 2 1 0 0 0 11 1 2 0 0 0 0 33009 1 0 0 0 0 0 1 0 0 0 0 0 0 2010 5 15 2 1 0 0 1 5 3 0 0 0 0 32012 17 38 18 14 0 0 51 239 32 22 1 0 0 432013 27 79 33 13 1 1 37 235 55 15 2 0 0 498018 37 38 29 3 0 0 3 10 6 0 0 0 0 126022 0 0 1 0 0 0 0 0 0 0 0 0 0 1026 0 2 0 0 0 0 0 0 0 0 0 0 0 2027 1 0 0 0 0 0 0 0 0 0 0 0 0 1031 4 11 5 2 1 0 1 33 8 3 1 4 0 73
TOTAL 388 315 129 111 2 2 214 661 129 106 4 4 0 2065%TAGE 19% 15% 6% 5% <1% <1% 10% 32% 6% 5% <1% 0% <1% 100%

37 NEW YORK CITY DEPARTMENT OF CITYWIDE ADMINISTRATIVE SERVICESOMIS CITYWIDE PERSONNEL PRODUCTION SYSTEMS
PERSONNEL REPORTING AND INFORMATION SYSTEM FOR EMPLOYEES (PRISE)WORKFORCE SUMMARY AS OF DECEMBER 31, 2008
REPORT: PBUTNO31
DEPARTMENT OF TRANSPORTATION (841)
MALE FEMALE
JOB GRP WHITE BLACK HSPN ASIANNATIVE AMER UKWN WHITE BLACK HSPN ASIAN
NATIVE AMER UKWN OTHR TOTAL
001 3 0 0 0 0 0 2 0 0 0 0 0 0 5002 137 29 12 49 0 5 38 20 6 5 0 0 0 301003 181 135 57 52 1 2 80 114 28 18 2 2 0 672004 194 48 24 122 1 1 49 14 5 16 0 1 0 475006 25 4 1 5 0 0 14 4 3 3 0 0 0 59008 3 0 0 1 0 0 0 2 3 1 0 1 0 11009 0 1 1 0 0 0 1 1 0 0 0 0 0 4010 16 9 4 8 0 2 3 11 2 4 1 0 0 60012 15 19 13 4 0 1 38 154 22 9 2 3 0 280013 31 45 12 4 2 0 27 153 42 9 5 1 0 331022 0 1 1 0 0 0 0 0 0 0 0 0 0 2023 0 11 0 0 0 0 3 8 6 0 0 1 0 29024 7 0 2 0 0 0 0 0 0 0 0 0 0 9025 1164 398 254 97 7 30 29 47 24 2 0 1 0 2053026 7 2 3 2 0 2 1 2 0 0 0 0 0 19027 0 1 0 0 0 0 0 0 0 0 0 0 0 1028 120 154 94 7 1 0 5 12 8 1 0 0 0 402029 3 6 1 0 0 1 1 1 0 0 0 0 0 13031 16 22 9 13 0 1 13 29 9 7 2 1 0 122
TOTAL 1922 885 488 364 12 45 304 572 158 75 12 11 0 4848%TAGE 40% 18% 10% 8% <1% 1% 6% 12% 3% 2% <1% <1% <1% 100%
38 NEW YORK CITY DEPARTMENT OF CITYWIDE ADMINISTRATIVE SERVICESOMIS CITYWIDE PERSONNEL PRODUCTION SYSTEMS
PERSONNEL REPORTING AND INFORMATION SYSTEM FOR EMPLOYEES (PRISE)WORKFORCE SUMMARY AS OF DECEMBER 31, 2008
REPORT: PBUTNO31
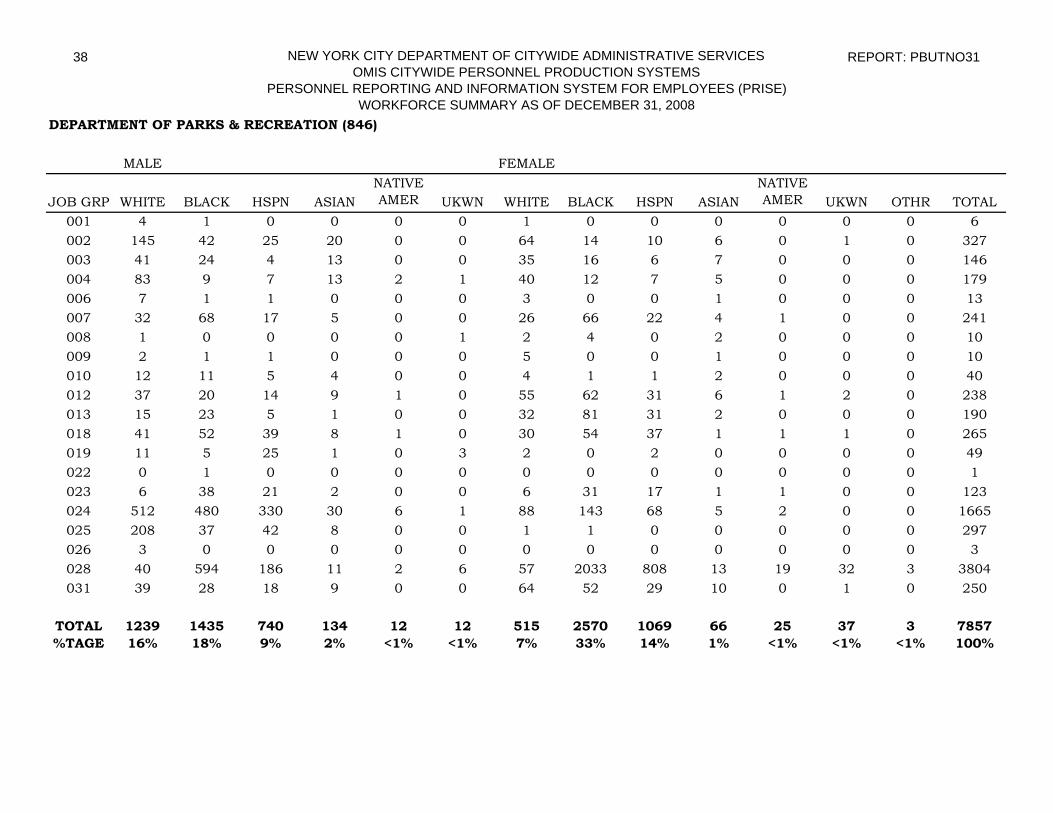
DEPARTMENT OF PARKS & RECREATION (846)
MALE FEMALE
JOB GRP WHITE BLACK HSPN ASIANNATIVE AMER UKWN WHITE BLACK HSPN ASIAN
NATIVE AMER UKWN OTHR TOTAL
001 4 1 0 0 0 0 1 0 0 0 0 0 0 6002 145 42 25 20 0 0 64 14 10 6 0 1 0 327003 41 24 4 13 0 0 35 16 6 7 0 0 0 146004 83 9 7 13 2 1 40 12 7 5 0 0 0 179006 7 1 1 0 0 0 3 0 0 1 0 0 0 13007 32 68 17 5 0 0 26 66 22 4 1 0 0 241008 1 0 0 0 0 1 2 4 0 2 0 0 0 10009 2 1 1 0 0 0 5 0 0 1 0 0 0 10010 12 11 5 4 0 0 4 1 1 2 0 0 0 40012 37 20 14 9 1 0 55 62 31 6 1 2 0 238013 15 23 5 1 0 0 32 81 31 2 0 0 0 190018 41 52 39 8 1 0 30 54 37 1 1 1 0 265019 11 5 25 1 0 3 2 0 2 0 0 0 0 49022 0 1 0 0 0 0 0 0 0 0 0 0 0 1023 6 38 21 2 0 0 6 31 17 1 1 0 0 123024 512 480 330 30 6 1 88 143 68 5 2 0 0 1665025 208 37 42 8 0 0 1 1 0 0 0 0 0 297026 3 0 0 0 0 0 0 0 0 0 0 0 0 3028 40 594 186 11 2 6 57 2033 808 13 19 32 3 3804031 39 28 18 9 0 0 64 52 29 10 0 1 0 250
TOTAL 1239 1435 740 134 12 12 515 2570 1069 66 25 37 3 7857%TAGE 16% 18% 9% 2% <1% <1% 7% 33% 14% 1% <1% <1% <1% 100%

39 NEW YORK CITY DEPARTMENT OF CITYWIDE ADMINISTRATIVE SERVICESOMIS CITYWIDE PERSONNEL PRODUCTION SYSTEMS
PERSONNEL REPORTING AND INFORMATION SYSTEM FOR EMPLOYEES (PRISE)WORKFORCE SUMMARY AS OF DECEMBER 31, 2008
REPORT: PBUTNO31
DEPARTMENT OF DESIGN & CONSTRUCTION (850)
MALE FEMALE
JOB GRP WHITE BLACK HSPN ASIANNATIVE AMER UKWN WHITE BLACK HSPN ASIAN
NATIVE AMER UKWN OTHR TOTAL
001 1 0 0 0 0 0 0 0 0 0 0 0 0 1002 137 41 18 76 1 0 32 17 4 6 0 0 0 332003 60 40 12 58 0 1 24 31 9 19 1 1 0 256004 77 53 12 74 0 0 31 14 7 14 0 0 0 282006 3 0 0 0 0 0 0 0 1 0 0 0 0 4008 1 0 0 0 0 0 1 0 1 1 0 0 0 4009 2 0 2 0 0 0 0 0 0 1 0 0 0 5010 10 12 5 9 0 1 7 4 2 3 0 0 0 53012 3 3 1 1 0 0 5 31 12 3 1 0 0 60013 3 10 3 1 0 0 9 24 11 2 0 0 0 63025 3 1 0 7 0 0 0 0 0 0 0 0 0 11027 0 1 3 0 0 0 0 0 0 0 0 0 0 4031 2 6 2 1 0 0 2 4 1 0 0 0 0 18
TOTAL 302 167 58 227 1 2 111 125 48 49 2 1 0 1093%TAGE 28% 15% 5% 21% <1% <1% 10% 11% 4% 4% <1% <1% 0% 100%

40 NEW YORK CITY DEPARTMENT OF CITYWIDE ADMINISTRATIVE SERVICESOMIS CITYWIDE PERSONNEL PRODUCTION SYSTEMS
PERSONNEL REPORTING AND INFORMATION SYSTEM FOR EMPLOYEES (PRISE)WORKFORCE SUMMARY AS OF DECEMBER 31, 2008
REPORT: PBUTNO31
DEPARTMENT OF INFORMATION TECHNOLOGIES & TELECOMMUNICATIONS (858)
MALE FEMALE
JOB GRP WHITE BLACK HSPN ASIANNATIVE AMER UKWN WHITE BLACK HSPN ASIAN
NATIVE AMER UKWN OTHR TOTAL
001 1 0 0 0 0 0 0 0 0 0 0 0 0 1002 135 27 12 51 0 3 59 25 7 15 0 3 0 337003 17 4 1 1 0 0 10 9 1 3 0 0 0 46004 81 42 11 32 1 2 17 14 4 8 0 1 0 213008 0 0 0 0 0 1 1 0 0 0 0 0 0 2009 6 2 2 0 0 0 2 1 0 3 0 0 0 16010 18 13 10 6 0 2 1 3 1 1 0 0 0 55012 14 29 10 5 0 0 18 45 27 7 0 0 0 155013 14 44 20 4 2 4 22 148 38 6 3 8 1 314031 8 8 2 3 0 0 9 20 14 4 0 1 0 69
TOTAL 294 169 68 102 3 12 139 265 92 47 3 13 1 1208%TAGE 24% 14% 6% 8% <1% 1% 12% 22% 8% 4% 1% 1% <1% 100%

41 NEW YORK CITY DEPARTMENT OF CITYWIDE ADMINISTRATIVE SERVICESOMIS CITYWIDE PERSONNEL PRODUCTION SYSTEMS
PERSONNEL REPORTING AND INFORMATION SYSTEM FOR EMPLOYEES (PRISE)WORKFORCE SUMMARY AS OF DECEMBER 31, 2008
REPORT: PBUTNO31
DEPARTMENT OF RECORDS & INFORMATION SERVICES (860)
MALE FEMALE
JOB GRP WHITE BLACK HSPN ASIANNATIVE AMER UKWN WHITE BLACK HSPN ASIAN
NATIVE AMER UKWN OTHR TOTAL
001 1 0 0 0 0 0 1 0 0 0 0 0 0 2002 4 1 0 0 0 0 1 1 1 0 0 0 0 8003 4 0 1 0 0 0 5 1 0 1 0 0 0 12004 0 0 0 0 0 0 1 2 0 0 0 0 0 3009 1 0 0 0 0 0 0 0 0 0 0 0 0 1012 1 0 0 1 0 0 2 0 0 0 0 0 0 4013 3 7 3 1 0 0 2 1 1 3 0 0 0 21027 0 1 0 0 0 0 0 0 0 0 0 0 0 1028 0 0 0 0 0 0 1 0 0 0 0 0 0 1031 0 3 1 0 0 2 1 7 0 1 0 5 0 20
TOTAL 14 12 5 2 0 2 14 12 2 5 0 5 0 73%TAGE 19% 16% 7% 3% 0% 3% 19% 16% 3% 7% 0% 7% 0% 100%
42 NEW YORK CITY DEPARTMENT OF CITYWIDE ADMINISTRATIVE SERVICESOMIS CITYWIDE PERSONNEL PRODUCTION SYSTEMS
PERSONNEL REPORTING AND INFORMATION SYSTEM FOR EMPLOYEES (PRISE)WORKFORCE SUMMARY AS OF DECEMBER 31, 2008
REPORT: PBUTNO31
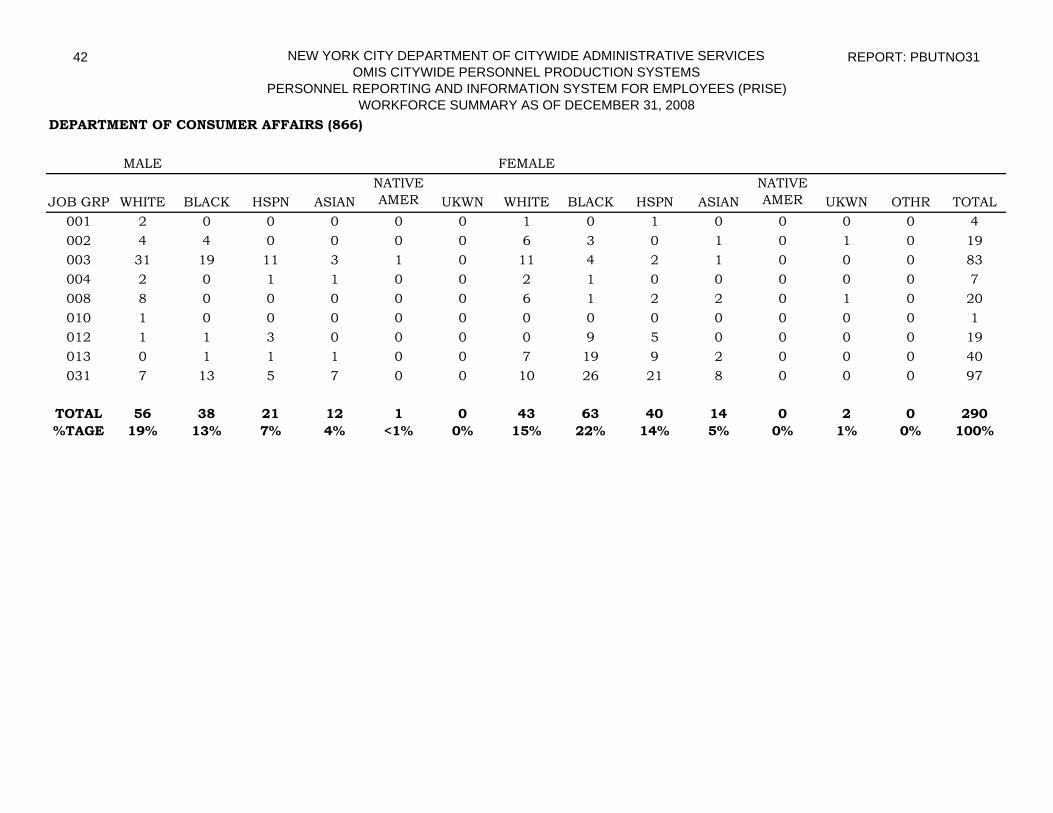
DEPARTMENT OF CONSUMER AFFAIRS (866)
MALE FEMALE
JOB GRP WHITE BLACK HSPN ASIANNATIVE AMER UKWN WHITE BLACK HSPN ASIAN
NATIVE AMER UKWN OTHR TOTAL
001 2 0 0 0 0 0 1 0 1 0 0 0 0 4002 4 4 0 0 0 0 6 3 0 1 0 1 0 19003 31 19 11 3 1 0 11 4 2 1 0 0 0 83004 2 0 1 1 0 0 2 1 0 0 0 0 0 7008 8 0 0 0 0 0 6 1 2 2 0 1 0 20010 1 0 0 0 0 0 0 0 0 0 0 0 0 1012 1 1 3 0 0 0 0 9 5 0 0 0 0 19013 0 1 1 1 0 0 7 19 9 2 0 0 0 40031 7 13 5 7 0 0 10 26 21 8 0 0 0 97
TOTAL 56 38 21 12 1 0 43 63 40 14 0 2 0 290%TAGE 19% 13% 7% 4% <1% 0% 15% 22% 14% 5% 0% 1% 0% 100%
43 NEW YORK CITY DEPARTMENT OF CITYWIDE ADMINISTRATIVE SERVICESOMIS CITYWIDE PERSONNEL PRODUCTION SYSTEMS
PERSONNEL REPORTING AND INFORMATION SYSTEM FOR EMPLOYEES (PRISE)WORKFORCE SUMMARY AS OF DECEMBER 31, 2008
REPORT: PBUTNO31
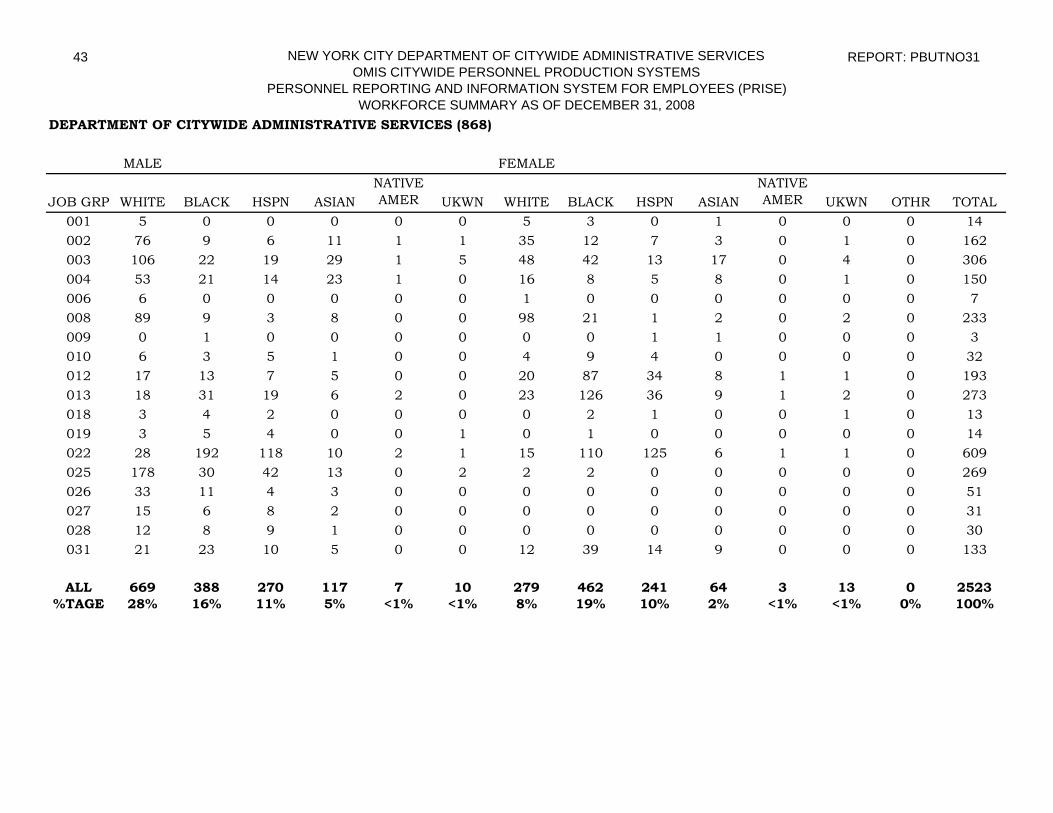
DEPARTMENT OF CITYWIDE ADMINISTRATIVE SERVICES (868)
MALE FEMALE
JOB GRP WHITE BLACK HSPN ASIANNATIVE AMER UKWN WHITE BLACK HSPN ASIAN
NATIVE AMER UKWN OTHR TOTAL
001 5 0 0 0 0 0 5 3 0 1 0 0 0 14002 76 9 6 11 1 1 35 12 7 3 0 1 0 162003 106 22 19 29 1 5 48 42 13 17 0 4 0 306004 53 21 14 23 1 0 16 8 5 8 0 1 0 150006 6 0 0 0 0 0 1 0 0 0 0 0 0 7008 89 9 3 8 0 0 98 21 1 2 0 2 0 233009 0 1 0 0 0 0 0 0 1 1 0 0 0 3010 6 3 5 1 0 0 4 9 4 0 0 0 0 32012 17 13 7 5 0 0 20 87 34 8 1 1 0 193013 18 31 19 6 2 0 23 126 36 9 1 2 0 273018 3 4 2 0 0 0 0 2 1 0 0 1 0 13019 3 5 4 0 0 1 0 1 0 0 0 0 0 14022 28 192 118 10 2 1 15 110 125 6 1 1 0 609025 178 30 42 13 0 2 2 2 0 0 0 0 0 269026 33 11 4 3 0 0 0 0 0 0 0 0 0 51027 15 6 8 2 0 0 0 0 0 0 0 0 0 31028 12 8 9 1 0 0 0 0 0 0 0 0 0 30031 21 23 10 5 0 0 12 39 14 9 0 0 0 133
ALL 669 388 270 117 7 10 279 462 241 64 3 13 0 2523%TAGE 28% 16% 11% 5% <1% <1% 8% 19% 10% 2% <1% <1% 0% 100%
44 NEW YORK CITY DEPARTMENT OF CITYWIDE ADMINISTRATIVE SERVICESOMIS CITYWIDE PERSONNEL PRODUCTION SYSTEMS
PERSONNEL REPORTING AND INFORMATION SYSTEM FOR EMPLOYEES (PRISE)WORKFORCE SUMMARY AS OF DECEMBER 31, 2008
REPORT: PBUTNO31
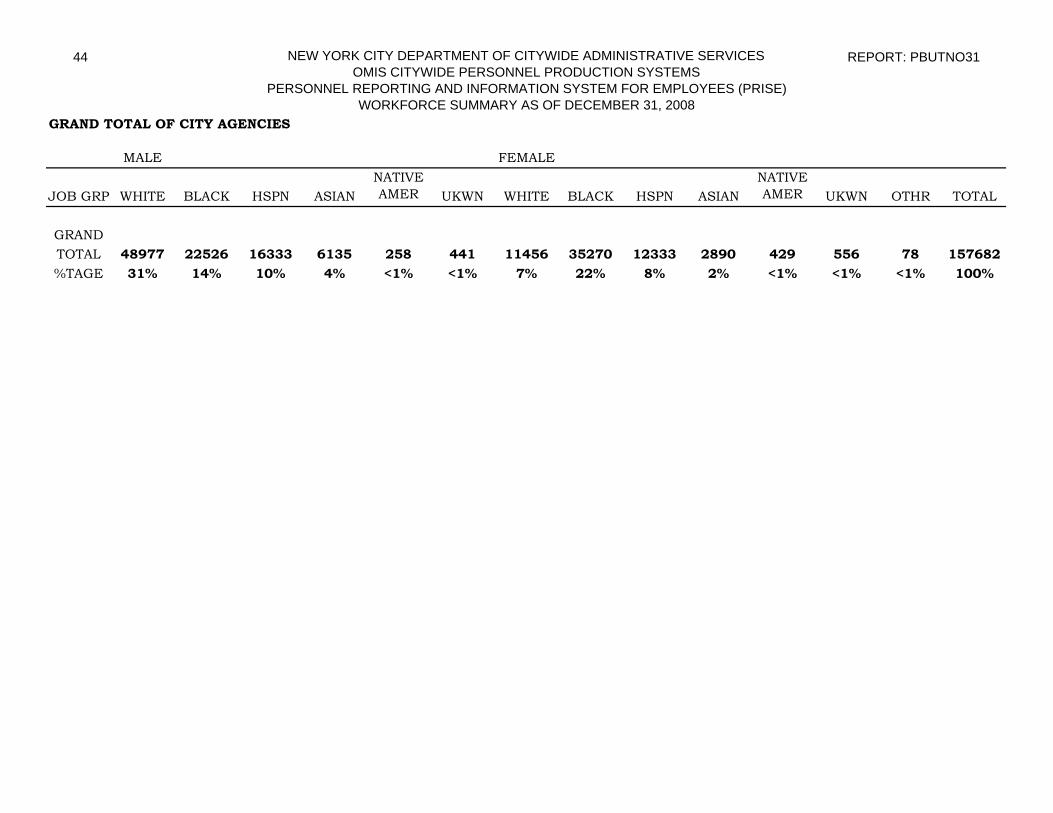
GRAND TOTAL OF CITY AGENCIES
MALE FEMALE
JOB GRP WHITE BLACK HSPN ASIANNATIVE AMER UKWN WHITE BLACK HSPN ASIAN
NATIVE AMER UKWN OTHR TOTAL
GRANDTOTAL 48977 22526 16333 6135 258 441 11456 35270 12333 2890 429 556 78 157682%TAGE 31% 14% 10% 4% <1% <1% 7% 22% 8% 2% <1% <1% <1% 100%

WORKFORCE SUMMARY OF MAYORAL AGENCIES BY JOB GROUP, RACE AND GENDER, 2008

New York City Job Groups by Race and GenderCALENDAR YEAR 2008
WHITE MALE
BLACK MALE
HISPANIC MALE
ASIAN MALE
NATIVE AMERICAN
MALEUNKNOWN
MALEWHITE
FEMALEBLACK
FEMALEHISPANIC FEMALE
ASIAN FEMALE
NATIVE AMERICAN
FEMALEUNKNOWN
FEMALE OTHER TOTAL
TOTAL 112 15 10 5 0 2 46 17 6 5 0 0 0 217
PERCENTAGE 52% 7% 5% 2% 0% 1% 21% 8% 3% 2% 0% 0% 0% 100%
ADMINISTRATORS (JOB GROUP 001)
Source: New York City Department of Citywide Administrative ServicesPercentages have been rounded to the nearest whole number

New York City Job Groups by Race and GenderCALENDAR YEAR 2008
ADMINISTRATORS (001)
WHITEMALE51%
BLACKMALE
7%
HISPANICMALE
4%
ASIANMALE
2%
WHITEFEMALE
23%
ASIANFEMALE
2%
HISPANICFEMALE
2%BLACKFEMALE
7%
Source: New York City Department of Citywide Administrative ServicesPercentages have been rounded to the nearest whole number

New York City Job Groups by Race and GenderCALENDAR YEAR 2008
WHITE MALE
BLACK MALE
HISPANIC MALE
ASIAN MALE
NATIVE AMERICAN
MALEUNKNOWN
MALEWHITE
FEMALEBLACK
FEMALEHISPANIC FEMALE
ASIAN FEMALE
NATIVE AMERICAN
FEMALEUNKNOWN
FEMALE OTHER TOTAL
TOTAL 2272 705 319 492 4 33 1219 838 252 193 1 25 1 6354
PERCENTAGE 36% 11% 5% 8% <1% <1% 19% 13% 4% 3% <1% <1% <1% 100%
MANAGERS (JOB GROUP 002)
Source: New York City Department of Citywide Administrative ServicesPercentages have been rounded to the nearest whole number

New York City Job Groups by Race and GenderCALENDAR YEAR 2008
MANAGERS (002)
ASIANMALE
7%
HISPANICMALE
5%
BLACKMALE12%
WHITEMALE39%
ASIANFEMALE
3%
WHITEFEMALE
19%
HISPANICFEMALE
4%
BLACKFEMALE
12%
Source: New York City Department of Citywide Administrative ServicesPercentages have been rounded to the nearest whole number

New York City Job Groups by Race and GenderCALENDAR YEAR 2008
WHITE MALE
BLACK MALE
HISPANIC MALE
ASIAN MALE
NATIVE AMERICAN
MALEUNKNOWN
MALEWHITE
FEMALEBLACK
FEMALEHISPANIC FEMALE
ASIAN FEMALE
NATIVE AMERICAN
FEMALEUNKNOWN
FEMALE OTHER TOTAL
TOTAL 1966 1421 554 647 11 23 1081 1877 605 401 10 63 3 8662
PERCENTAGE 23% 16% 6% 7% <1% <1% 12% 22% 7% 5% <1% <1% <1% 100%
MANAGEMENT SPECIALISTS (JOB GROUP 003)
Source: New York City Department of Citywide Administrative ServicesPercentages have been rounded to the nearest whole number

New York City Job Groups by Race and GenderCALENDAR YEAR 2008
MANAGEMENT SPECIALISTS (003)
HISPANICMALE
6%
ASIANMALE
7%
WHITEFEMALE
13%
BLACKFEMALE
21%
BLACKMALE17%
WHITEMALE23%
ASIANFEMALE
5%HISPANICFEMALE
7%
Source: New York City Department of Citywide Administrative ServicesPercentages have been rounded to the nearest whole number

New York City Job Groups by Race and GenderCALENDAR YEAR 2008
WHITE MALE
BLACK MALE
HISPANIC MALE
ASIAN MALE
NATIVE AMERICAN
MALEUNKNOWN
MALEWHITE
FEMALEBLACK
FEMALEHISPANIC FEMALE
ASIAN FEMALE
NATIVE AMERICAN
FEMALEUNKNOWN
FEMALE OTHER TOTAL
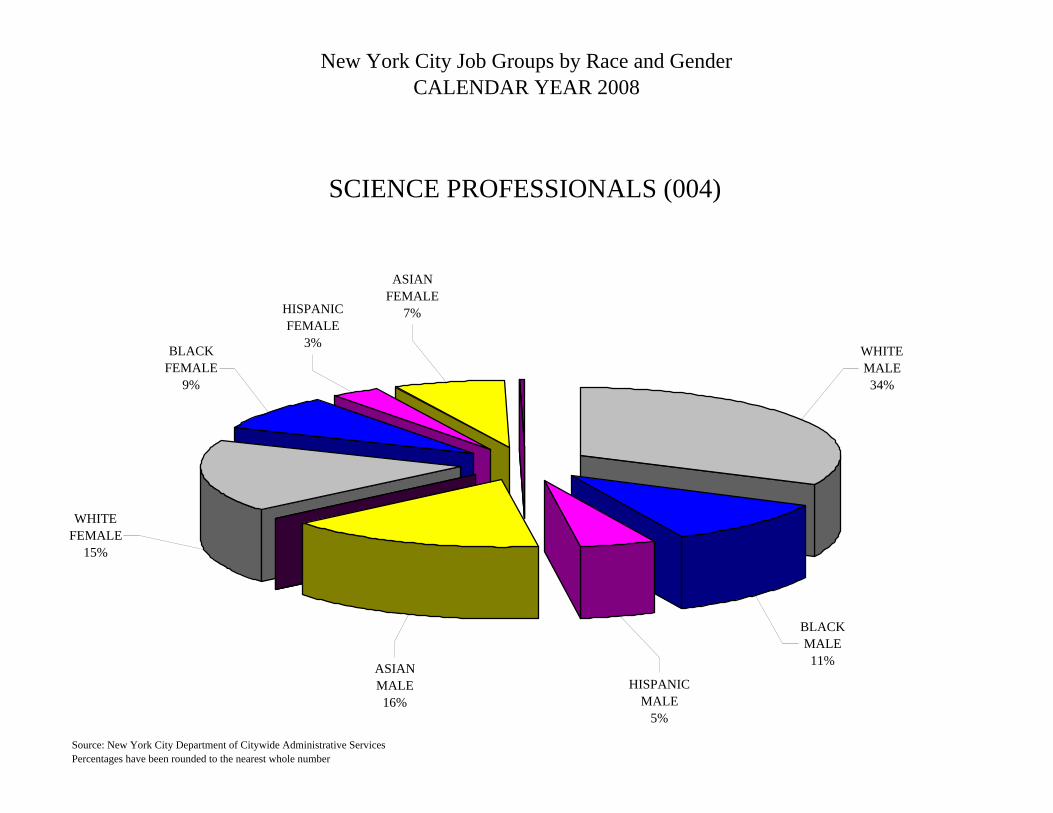
TOTAL 1634 544 243 818 10 15 875 427 149 362 1 37 8 5119
PERCENTAGE 32% 11% 5% 16% <1% <1% 17% 8% 3% 7% <1% <1% 0% 100%
SCIENCE PROFESSIONALS (JOB GROUP 004)
Source: New York City Department of Citywide Administrative ServicesPercentages have been rounded to the nearest whole number
New York City Job Groups by Race and GenderCALENDAR YEAR 2008
SCIENCE PROFESSIONALS (004)
ASIANMALE16%
HISPANICMALE
5%
BLACKMALE11%
WHITEMALE34%
WHITEFEMALE
15%
BLACKFEMALE
9%
ASIANFEMALE
7%HISPANICFEMALE
3%
Source: New York City Department of Citywide Administrative ServicesPercentages have been rounded to the nearest whole number
New York City Job Groups by Race and GenderCALENDAR YEAR 2008
WHITE MALE
BLACK MALE
HISPANIC MALE
ASIAN MALE
NATIVE AMERICAN
MALEUNKNOWN
MALEWHITE
FEMALEBLACK
FEMALEHISPANIC FEMALE
ASIAN FEMALE
NATIVE AMERICAN
FEMALEUNKNOWN
FEMALE OTHER TOTAL
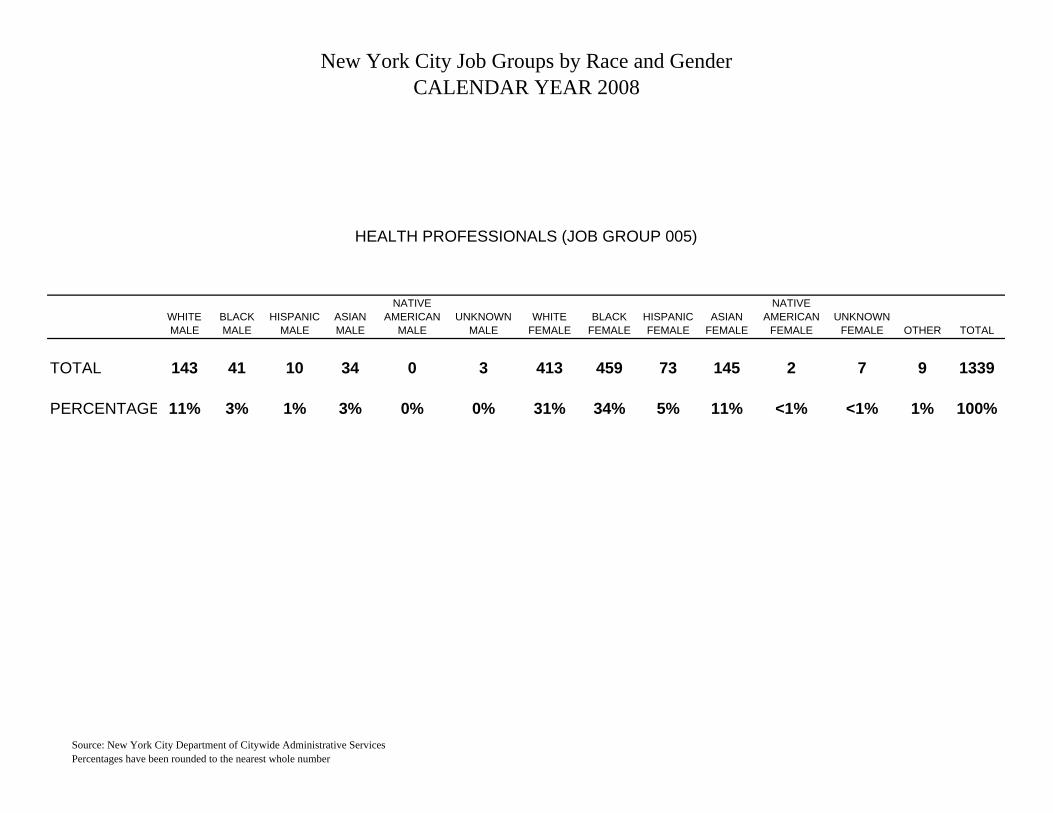
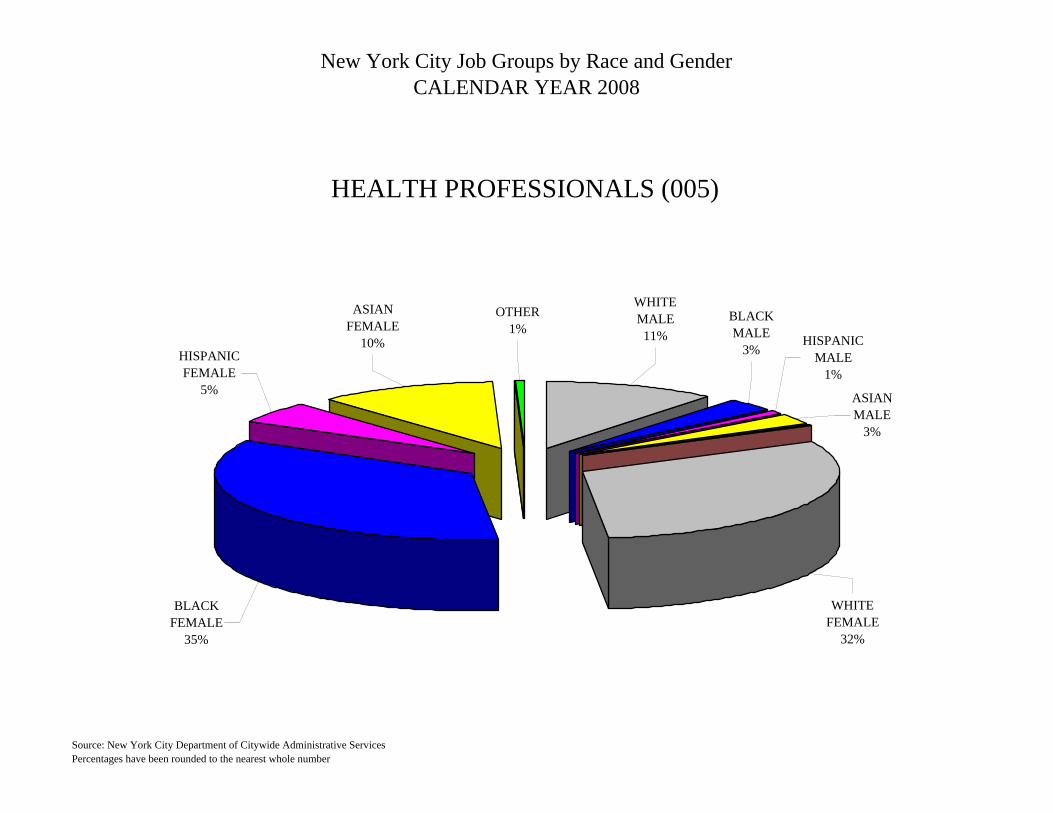
TOTAL 143 41 10 34 0 3 413 459 73 145 2 7 9 1339
PERCENTAGE 11% 3% 1% 3% 0% 0% 31% 34% 5% 11% <1% <1% 1% 100%
HEALTH PROFESSIONALS (JOB GROUP 005)
Source: New York City Department of Citywide Administrative ServicesPercentages have been rounded to the nearest whole number
New York City Job Groups by Race and GenderCALENDAR YEAR 2008
HEALTH PROFESSIONALS (005)
OTHER1%
ASIANFEMALE
10%
WHITEFEMALE
32%
ASIANMALE
3%
HISPANICMALE
1%
BLACKMALE
3%
WHITEMALE11%
BLACKFEMALE
35%
HISPANICFEMALE
5%
Source: New York City Department of Citywide Administrative ServicesPercentages have been rounded to the nearest whole number

New York City Job Groups by Race and GenderCALENDAR YEAR 2008
WHITE MALE
BLACK MALE
HISPANIC MALE
ASIAN MALE
NATIVE AMERICAN
MALEUNKNOWN
MALEWHITE
FEMALEBLACK
FEMALEHISPANIC FEMALE
ASIAN FEMALE
NATIVE AMERICAN
FEMALEUNKNOWN
FEMALE OTHER TOTAL
TOTAL 183 51 30 28 1 3 130 67 25 29 0 12 1 560
PERCENTAGE 33% 9% 5% 5% 0% 1% 23% 12% 4% 5% <1% 2% <1% 100%
SOCIAL SCIENTISTS (JOB GROUP 006)
Source: New York City Department of Citywide Administrative ServicesPercentages have been rounded to the nearest whole number

New York City Job Groups by Race and GenderCALENDAR YEAR 2008
SOCIAL SCIENTISTS (006)
BLACKMALE10%HISPANIC
MALE5%
ASIANMALE
6%
WHITEFEMALE
26%
BLACKFEMALE
14%
WHITEMALE31%
ASIANFEMALE
4%HISPANICFEMALE
4%
Source: New York City Department of Citywide Administrative ServicesPercentages have been rounded to the nearest whole number

New York City Job Groups by Race and GenderCALENDAR YEAR 2008
WHITE MALE
BLACK MALE
HISPANIC MALE
ASIAN MALE
NATIVE AMERICAN
MALEUNKNOWN
MALEWHITE
FEMALEBLACK
FEMALEHISPANIC FEMALE
ASIAN FEMALE
NATIVE AMERICAN
FEMALEUNKNOWN
FEMALE OTHER TOTAL
TOTAL 528 2307 554 219 6 5 867 6631 1878 278 24 9 1 13307
PERCENTAGE 4% 17% 4% 2% <1% <1% 7% 50% 14% 2% <1% <1% <1% 100%
SOCIAL WORKERS (JOB GROUP 007)
Source: New York City Department of Citywide Administrative ServicesPercentages have been rounded to the nearest whole number

New York City Job Groups by Race and GenderCALENDAR YEAR 2008
SOCIAL WORKERS (007)
BLACKFEMALE
50%
ASIANMALE
2%WHITE
FEMALE7%
HISPANICMALE
4%
BLACKMALE18%
WHITEMALE
4%
ASIANFEMALE
2%HISPANICFEMALE
13%
Source: New York City Department of Citywide Administrative ServicesPercentages have been rounded to the nearest whole number
New York City Job Groups by Race and GenderCALENDAR YEAR 2008
WHITE MALE
BLACK MALE
HISPANIC MALE
ASIAN MALE
NATIVE AMERICAN
MALEUNKNOWN
MALEWHITE
FEMALEBLACK
FEMALEHISPANIC FEMALE
ASIAN FEMALE
NATIVE AMERICAN
FEMALEUNKNOWN
FEMALE OTHER TOTAL
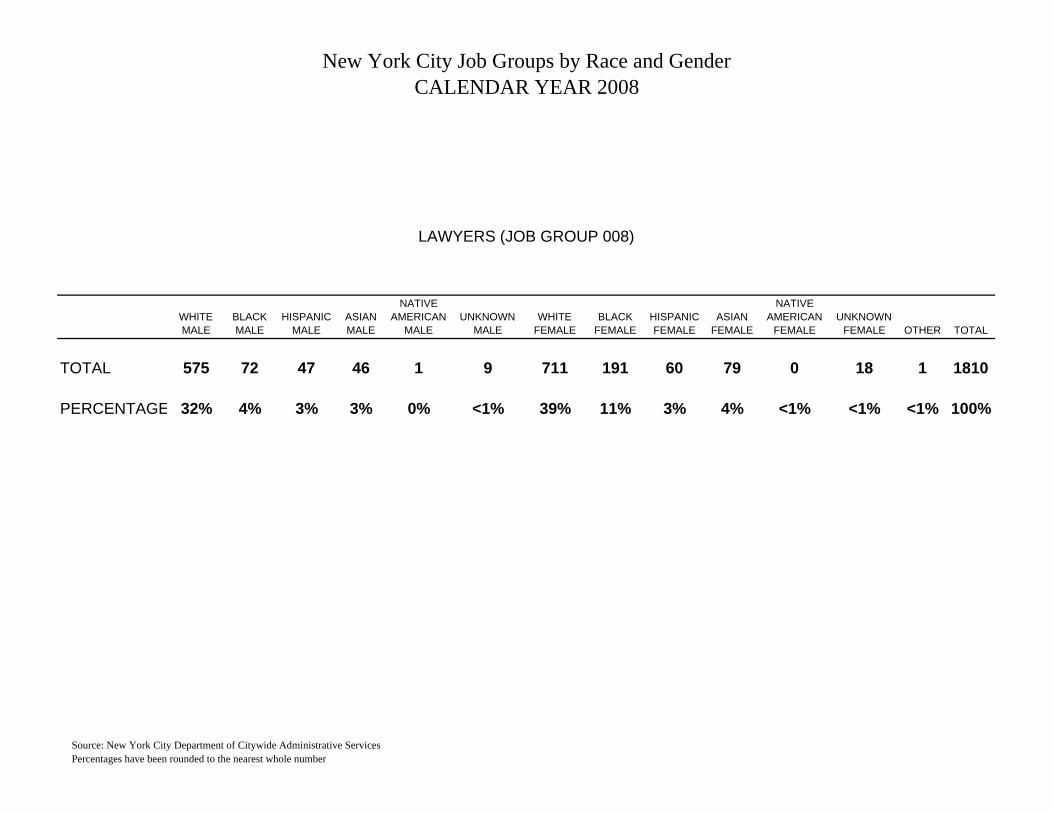
TOTAL 575 72 47 46 1 9 711 191 60 79 0 18 1 1810
PERCENTAGE 32% 4% 3% 3% 0% <1% 39% 11% 3% 4% <1% <1% <1% 100%
LAWYERS (JOB GROUP 008)
Source: New York City Department of Citywide Administrative ServicesPercentages have been rounded to the nearest whole number
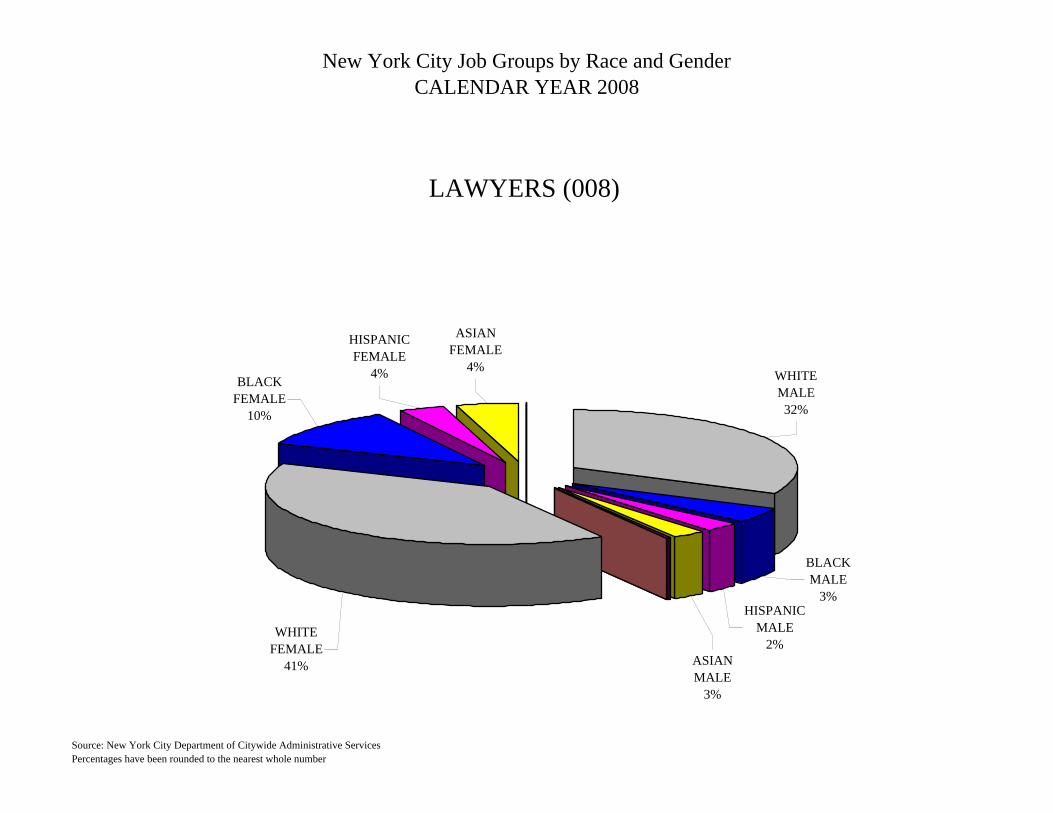
New York City Job Groups by Race and GenderCALENDAR YEAR 2008
LAWYERS (008)
HISPANICFEMALE
4%BLACKFEMALE
10%
WHITEFEMALE
41%
ASIANFEMALE
4%WHITEMALE32%
HISPANICMALE
2%ASIANMALE
3%
BLACKMALE
3%
Source: New York City Department of Citywide Administrative ServicesPercentages have been rounded to the nearest whole number
New York City Job Groups by Race and GenderCALENDAR YEAR 2008
WHITE MALE
BLACK MALE
HISPANIC MALE
ASIAN MALE
NATIVE AMERICAN
MALEUNKNOWN
MALEWHITE
FEMALEBLACK
FEMALEHISPANIC FEMALE
ASIAN FEMALE
NATIVE AMERICAN
FEMALEUNKNOWN
FEMALE OTHER TOTAL
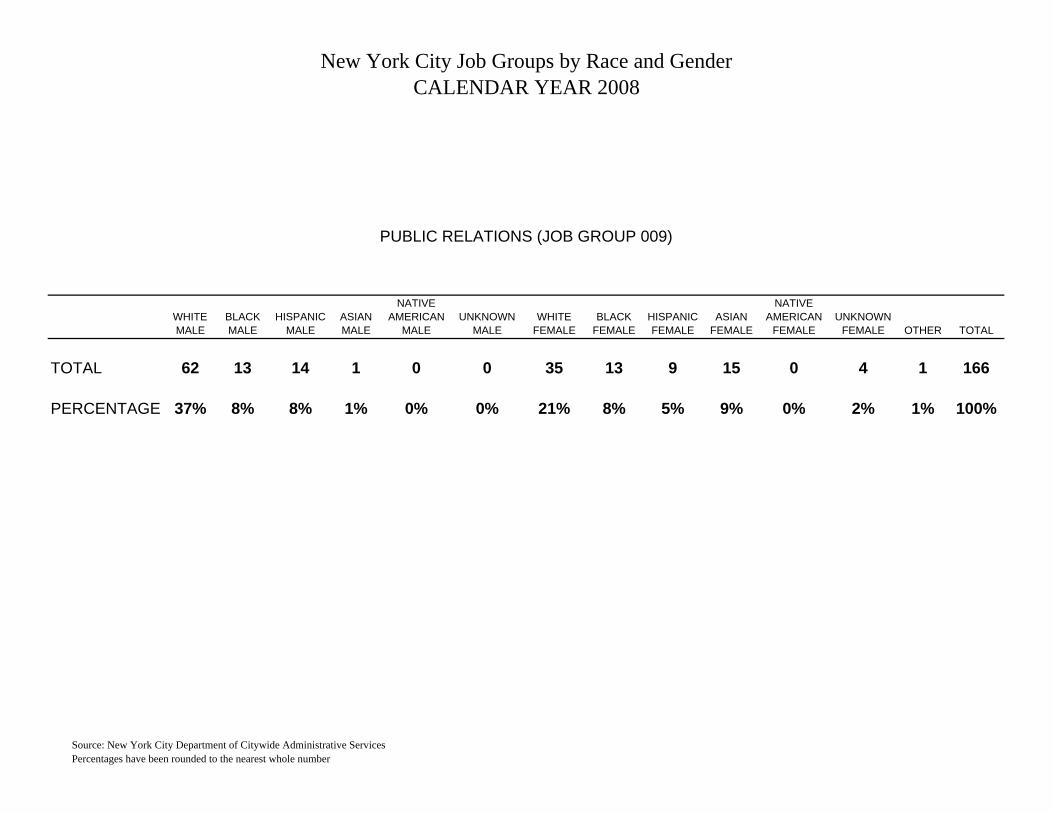
TOTAL 62 13 14 1 0 0 35 13 9 15 0 4 1 166
PERCENTAGE 37% 8% 8% 1% 0% 0% 21% 8% 5% 9% 0% 2% 1% 100%
PUBLIC RELATIONS (JOB GROUP 009)
Source: New York City Department of Citywide Administrative ServicesPercentages have been rounded to the nearest whole number
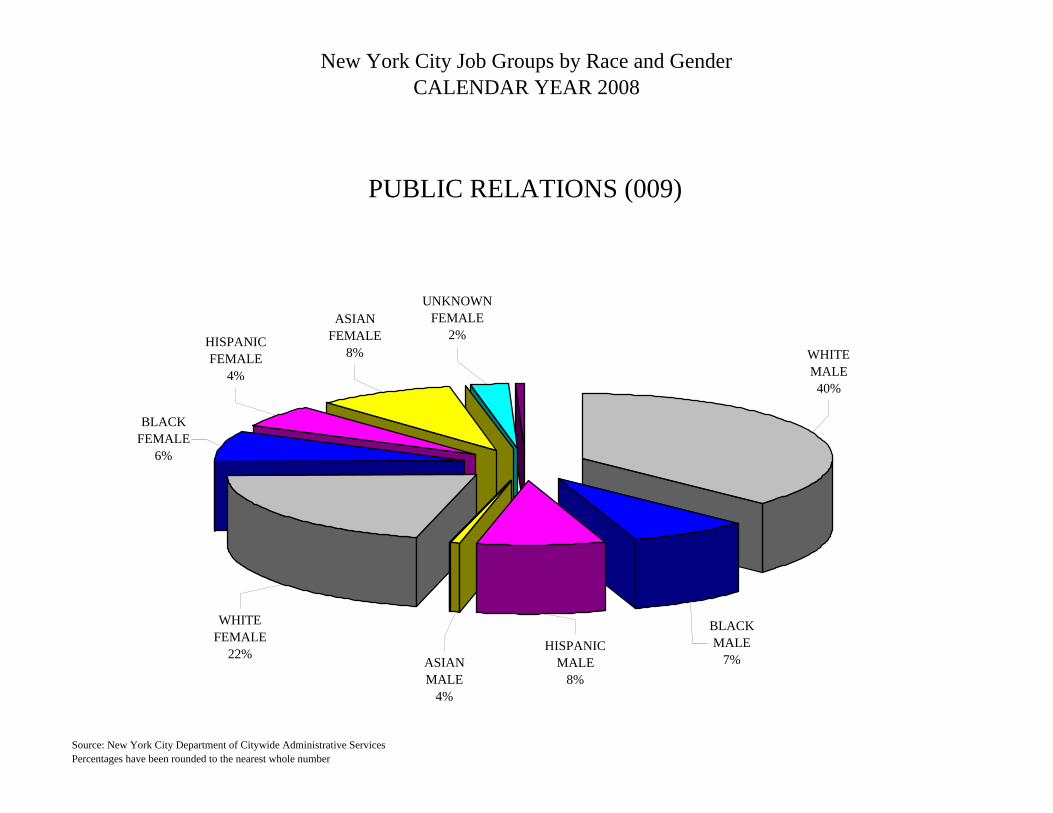
New York City Job Groups by Race and GenderCALENDAR YEAR 2008
PUBLIC RELATIONS (009)
WHITEMALE40%
BLACKMALE
7%HISPANIC
MALE8%
ASIANMALE
4%
WHITEFEMALE
22%
BLACKFEMALE
6%
ASIANFEMALE
8%HISPANICFEMALE
4%
UNKNOWNFEMALE
2%
Source: New York City Department of Citywide Administrative ServicesPercentages have been rounded to the nearest whole number
New York City Job Groups by Race and GenderCALENDAR YEAR 2008
WHITE MALE
BLACK MALE
HISPANIC MALE
ASIAN MALE
NATIVE AMERICAN
MALEUNKNOWN
MALEWHITE
FEMALEBLACK
FEMALEHISPANIC FEMALE
ASIAN FEMALE
NATIVE AMERICAN
FEMALEUNKNOWN
FEMALE OTHER TOTAL
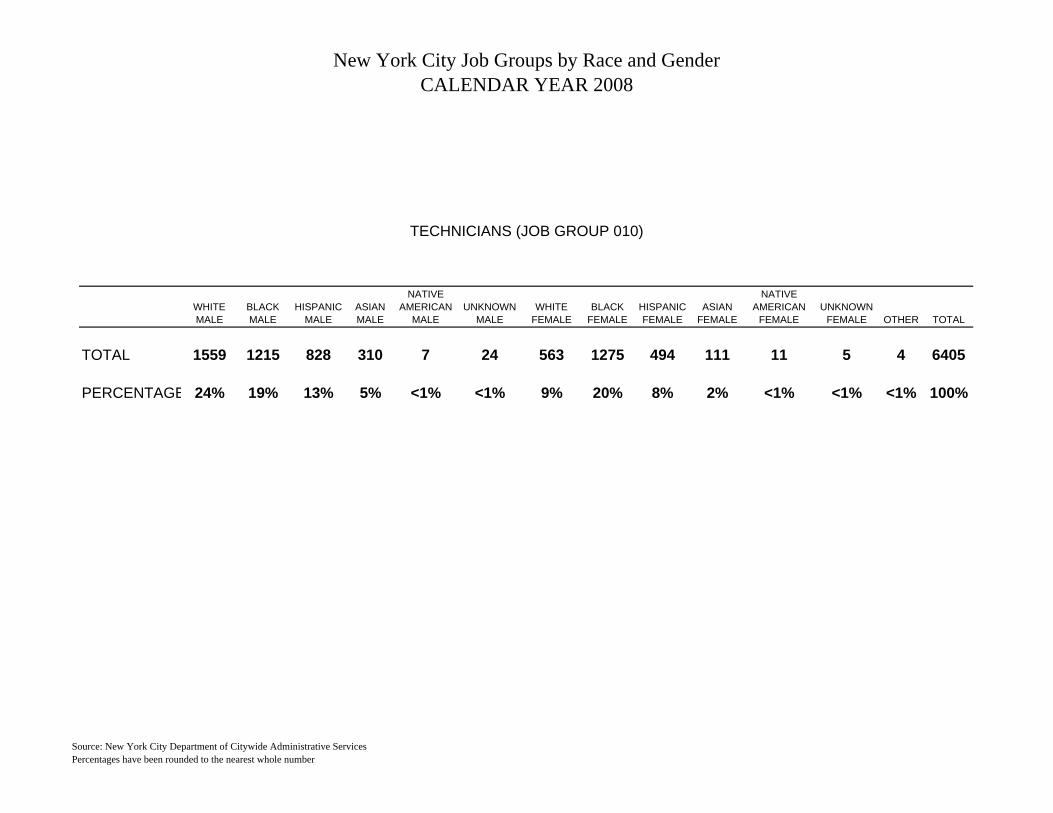
TOTAL 1559 1215 828 310 7 24 563 1275 494 111 11 5 4 6405
PERCENTAGE 24% 19% 13% 5% <1% <1% 9% 20% 8% 2% <1% <1% <1% 100%
TECHNICIANS (JOB GROUP 010)
Source: New York City Department of Citywide Administrative ServicesPercentages have been rounded to the nearest whole number

New York City Job Groups by Race and GenderCALENDAR YEAR 2008
TECHNICIANS (010)
HISPANICMALE12%
ASIANMALE
4%
WHITEFEMALE
9%
BLACKFEMALE
20%
BLACKMALE20%
WHITEMALE25%
ASIANFEMALE
1%HISPANICFEMALE
8%
Source: New York City Department of Citywide Administrative ServicesPercentages have been rounded to the nearest whole number

New York City Job Groups by Race and GenderCALENDAR YEAR 2008
WHITE MALE
BLACK MALE
HISPANIC MALE
ASIAN MALE
NATIVE AMERICAN
MALEUNKNOWN
MALEWHITE
FEMALEBLACK
FEMALEHISPANIC FEMALE
ASIAN FEMALE
NATIVE AMERICAN
FEMALEUNKNOWN
FEMALE OTHER TOTAL
TOTAL 294 492 220 129 3 2 868 3531 864 217 33 11 1 6650
PERCENTAGE 4% 7% 3% 2% <1% 0% 13% 53% 13% 3% 0% <1% <1% 100%
CLERICAL SUPERVISORS (JOB GROUP 012)
Source: New York City Department of Citywide Administrative ServicesPercentages have been rounded to the nearest whole number

New York City Job Groups by Race and GenderCALENDAR YEAR 2008
CLERICAL SUPERVISORS (012)
HISPANICFEMALE
12%
BLACKFEMALE
54%
ASIANFEMALE
3%
WHITEMALE
5%BLACKMALE
7%
HISPANICMALE
3%ASIANMALE
2%
WHITEFEMALE
13%
Source: New York City Department of Citywide Administrative ServicesPercentages have been rounded to the nearest whole number

New York City Job Groups by Race and GenderCALENDAR YEAR 2008
WHITE MALE
BLACK MALE
HISPANIC MALE
ASIAN MALE
NATIVE AMERICAN
MALEUNKNOWN
MALEWHITE
FEMALEBLACK
FEMALEHISPANIC FEMALE
ASIAN FEMALE
NATIVE AMERICAN
FEMALEUNKNOWN
FEMALE OTHER TOTAL
TOTAL 530 1084 423 207 11 7 969 5941 1530 328 40 32 8 11110
PERCENTAGE 5% 10% 4% 2% <1% <1% 9% 53% 14% 3% <1% <1% <1% 100%
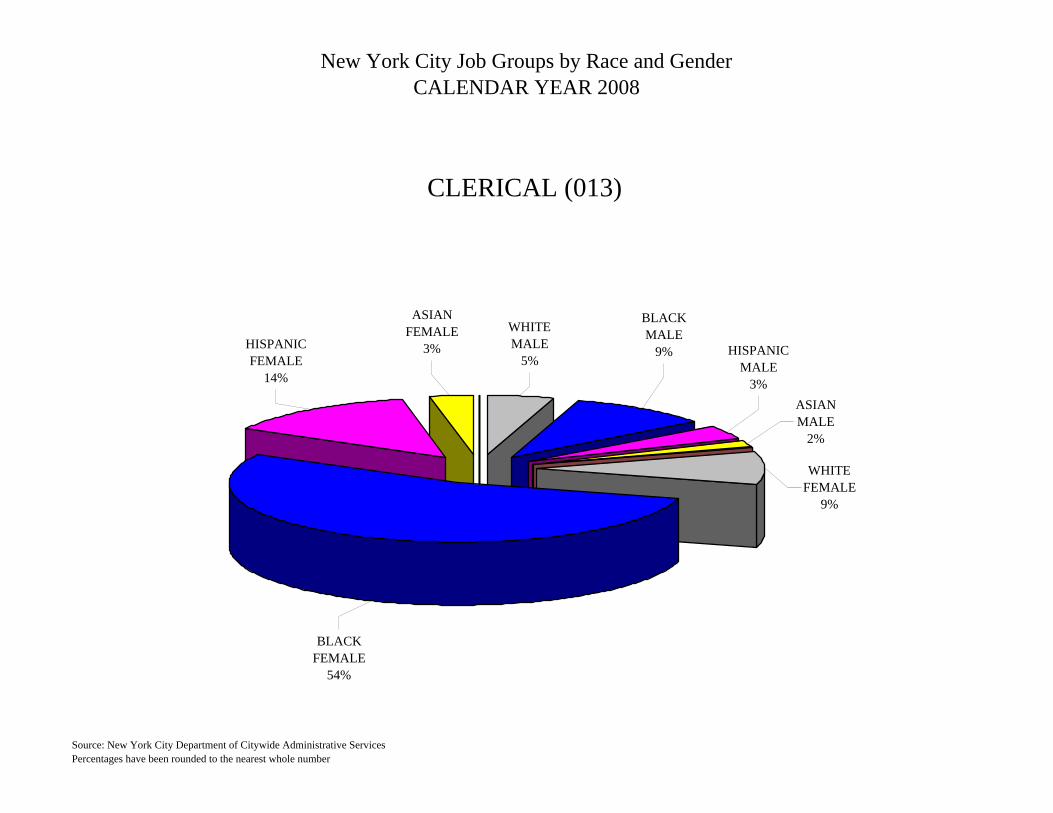
CLERICAL (JOB GROUP 013)
Source: New York City Department of Citywide Administrative ServicesPercentages have been rounded to the nearest whole number
New York City Job Groups by Race and GenderCALENDAR YEAR 2008
CLERICAL (013)
BLACKFEMALE
54%
WHITEFEMALE
9%
ASIANMALE
2%
HISPANICMALE
3%
BLACKMALE
9%
WHITEMALE
5%
ASIANFEMALE
3%HISPANICFEMALE
14%
Source: New York City Department of Citywide Administrative ServicesPercentages have been rounded to the nearest whole number

New York City Job Groups by Race and GenderCALENDAR YEAR 2008
WHITE MALE
BLACK MALE
HISPANIC MALE
ASIAN MALE
NATIVE AMERICAN
MALEUNKNOWN
MALEWHITE
FEMALEBLACK
FEMALEHISPANIC FEMALE
ASIAN FEMALE
NATIVE AMERICAN
FEMALEUNKNOWN
FEMALE OTHER TOTAL
TOTAL 4583 825 998 211 13 10 390 663 272 27 15 6 3 8016
PERCENTAGE 57% 10% 12% 3% <1% <1% 5% 8% 3% <1% <1% <1% <1% 100%
POLICE SUPERVISORS (JOB GROUP 015)
Source: New York City Department of Citywide Administrative ServicesPercentages have been rounded to the nearest whole number

New York City Job Groups by Race and GenderCALENDAR YEAR 2008
POLICE SUPERVISORS (015)
BLACKFEMALE
7%
WHITEMALE61%
HISPANICFEMALE
3%
BLACKMALE10%
HISPANICMALE12%
ASIANMALE
2%
WHITEFEMALE
5%
Source: New York City Department of Citywide Administrative ServicesPercentages have been rounded to the nearest whole number
New York City Job Groups by Race and GenderCALENDAR YEAR 2008
WHITE MALE
BLACK MALE
HISPANIC MALE
ASIAN MALE
NATIVE AMERICAN
MALEUNKNOWN
MALEWHITE
FEMALEBLACK
FEMALEHISPANIC FEMALE
ASIAN FEMALE
NATIVE AMERICAN
FEMALEUNKNOWN
FEMALE OTHER TOTAL
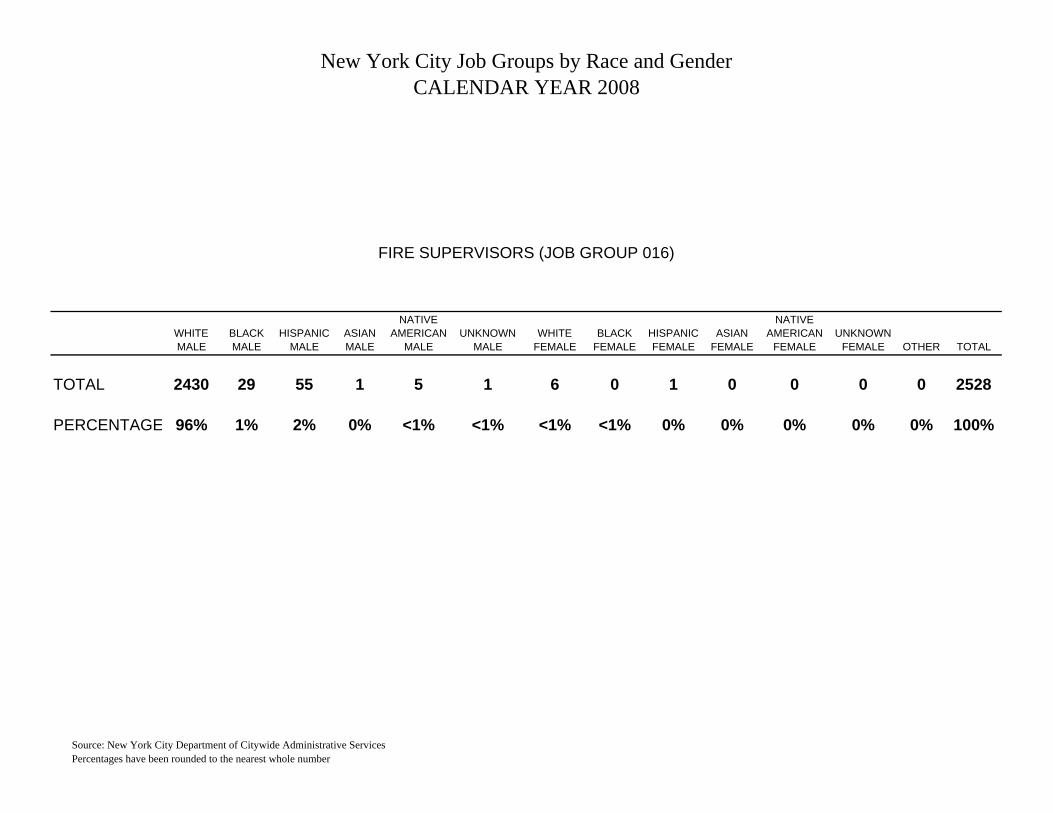
TOTAL 2430 29 55 1 5 1 6 0 1 0 0 0 0 2528
PERCENTAGE 96% 1% 2% 0% <1% <1% <1% <1% 0% 0% 0% 0% 0% 100%
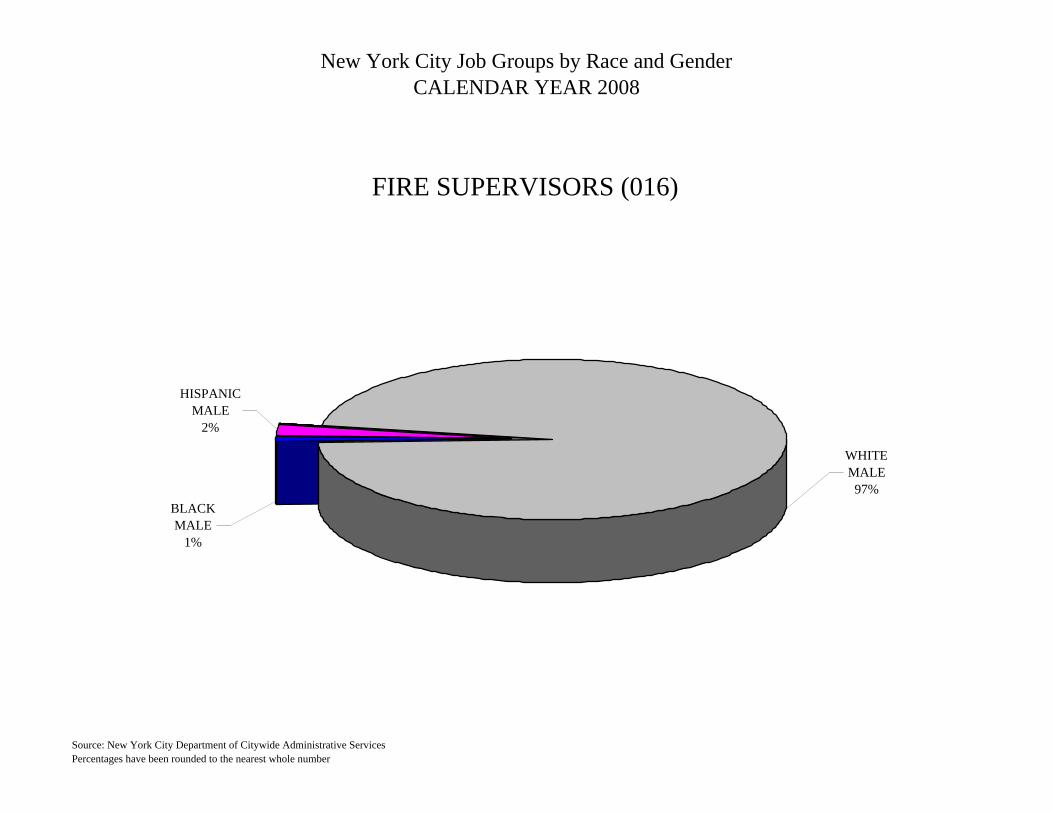
FIRE SUPERVISORS (JOB GROUP 016)
Source: New York City Department of Citywide Administrative ServicesPercentages have been rounded to the nearest whole number
New York City Job Groups by Race and GenderCALENDAR YEAR 2008
FIRE SUPERVISORS (016)
WHITEMALE97%
BLACKMALE
1%
HISPANICMALE
2%
Source: New York City Department of Citywide Administrative ServicesPercentages have been rounded to the nearest whole number

New York City Job Groups by Race and GenderCALENDAR YEAR 2008
WHITE MALE
BLACK MALE
HISPANIC MALE
ASIAN MALE
NATIVE AMERICAN
MALEUNKNOWN
MALEWHITE
FEMALEBLACK
FEMALEHISPANIC FEMALE
ASIAN FEMALE
NATIVE AMERICAN
FEMALEUNKNOWN
FEMALE OTHER TOTAL
TOTAL 8032 418 688 109 9 6 17 9 10 1 0 0 1 9300
PERCENTAGE 86% 4% 7% 1% <1% <1% <1% <1% <1% <1% <1% 0% <1% 100%
FIREFIGHTERS (JOB GROUP 017)
Source: New York City Department of Citywide Administrative ServicesPercentages have been rounded to the nearest whole number

New York City Job Groups by Race and GenderCALENDAR YEAR 2008
FIREFIGHTERS (017)
WHITEMALE88%
ASIANMALE
1%HISPANIC
MALE6%
BLACKMALE
4%
Source: New York City Department of Citywide Administrative ServicesPercentages have been rounded to the nearest whole number

New York City Job Groups by Race and GenderCALENDAR YEAR 2008
WHITE MALE
BLACK MALE
HISPANIC MALE
ASIAN MALE
NATIVE AMERICAN
MALEUNKNOWN
MALEWHITE
FEMALEBLACK
FEMALEHISPANIC FEMALE
ASIAN FEMALE
NATIVE AMERICAN
FEMALEUNKNOWN
FEMALE OTHER TOTAL
TOTAL 13877 6908 7456 1934 54 36 1742 5812 2788 179 101 18 11 40916
PERCENTAGE 34% 17% 18% 5% <1% <1% 4% 14% 7% <1% <1% <1% <1% 100%
POLICE AND DETECTIVES (JOB GROUP 018)
Source: New York City Department of Citywide Administrative ServicesPercentages have been rounded to the nearest whole number

New York City Job Groups by Race and GenderCALENDAR YEAR 2008
POLICE AND DETECTIVES (018)
WHITEFEMALE
4%
ASIANMALE
4%
HISPANICMALE18%
BLACKMALE17%
WHITEMALE35%
HISPANICFEMALE
6%
BLACKFEMALE
14%
Source: New York City Department of Citywide Administrative ServicesPercentages have been rounded to the nearest whole number

New York City Job Groups by Race and GenderCALENDAR YEAR 2008
WHITE MALE
BLACK MALE
HISPANIC MALE
ASIAN MALE
NATIVE AMERICAN
MALEUNKNOWN
MALEWHITE
FEMALEBLACK
FEMALEHISPANIC FEMALE
ASIAN FEMALE
NATIVE AMERICAN
FEMALEUNKNOWN
FEMALE OTHER TOTAL
TOTAL 119 748 418 147 72 182 799 2968 1362 214 145 231 3 7408
PERCENTAGE 2% 10% 6% 2% 1% 2% 11% 40% 18% 3% 2% 3% <1% 100%
GUARDS (JOB GROUP 019)
Source: New York City Department of Citywide Administrative ServicesPercentages have been rounded to the nearest whole number

New York City Job Groups by Race and GenderCALENDAR YEAR 2008
GUARDS (019)
UNKNOWNMALE
3%
ASIANFEMALE
3%
HISPANICFEMALE
18%
BLACKFEMALE
39%
WHITEFEMALE
11%
NATIVE AMERICANMALE
1%
ASIANMALE
2%
HISPANICMALE
6%
BLACKMALE10%
UNKNOWNFEMALE
4%
WHITEMALE
2%
NATIVE AMERICANFEMALE
2%
Source: New York City Department of Citywide Administrative ServicesPercentages have been rounded to the nearest whole number
New York City Job Groups by Race and GenderCALENDAR YEAR 2008
WHITE MALE
BLACK MALE
HISPANIC MALE
ASIAN MALE
NATIVE AMERICAN
MALEUNKNOWN
MALEWHITE
FEMALEBLACK
FEMALEHISPANIC FEMALE
ASIAN FEMALE
NATIVE AMERICAN
FEMALEUNKNOWN
FEMALE OTHER TOTAL
TOTAL 5 86 21 2 0 0 2 60 7 3 1 0 2 189
PERCENTAGE 3% 46% 11% <1% 0% 0% 1% 32% 4% 2% <1% 0% 1% 100%
FOOD PREPARATION (JOB GROUP 020)
Source: New York City Department of Citywide Administrative ServicesPercentages have been rounded to the nearest whole number

New York City Job Groups by Race and GenderCALENDAR YEAR 2008
FOOD PREPARATION (020)
BLACKMALE37%
HISPANICMALE
7%
ASIANMALE<1%
WHITEFEMALE
1%
BLACKFEMALE
27%
HISPANICFEMALE
8%
ASIANFEMALE
3%WHITEMALE
3%
OTHER1%
Source: New York City Department of Citywide Administrative ServicesPercentages have been rounded to the nearest whole number

New York City Job Groups by Race and GenderCALENDAR YEAR 2008
WHITE MALE
BLACK MALE
HISPANIC MALE
ASIAN MALE
NATIVE AMERICAN
MALEUNKNOWN
MALEWHITE
FEMALEBLACK
FEMALEHISPANIC FEMALE
ASIAN FEMALE
NATIVE AMERICAN
FEMALEUNKNOWN
FEMALE OTHER TOTAL
TOTAL 4 48 18 8 0 1 38 137 51 8 1 0 0 314
PERCENTAGE 1% 15% 6% 3% 0% <1% 12% 44% 16% 3% 0% <1% 0% 100%
HEALTH SERVICES (JOB GROUP 021)
Source: New York City Department of Citywide Administrative ServicesPercentages have been rounded to the nearest whole number

New York City Job Groups by Race and GenderCALENDAR YEAR 2008
HEALTH SERVICES (021)
HISPANICFEMALE
15%
ASIANFEMALE
2% OTHER0%
WHITEMALE
1%BLACKMALE14%
HISPANICMALE
6%
ASIANMALE
2%
WHITEFEMALE
12%
BLACKFEMALE
45%
Source: New York City Department of Citywide Administrative ServicesPercentages have been rounded to the nearest whole number

New York City Job Groups by Race and GenderCALENDAR YEAR 2008
WHITE MALE
BLACK MALE
HISPANIC MALE
ASIAN MALE
NATIVE AMERICAN
MALEUNKNOWN
MALEWHITE
FEMALEBLACK
FEMALEHISPANIC FEMALE
ASIAN FEMALE
NATIVE AMERICAN
FEMALEUNKNOWN
FEMALE OTHER TOTAL
TOTAL 83 489 250 28 5 2 30 270 236 11 2 1 0 1407
PERCENTAGE 6% 35% 18% 2% 0% 0% 2% 19% 17% 1% 0% 0% 0% 100%
BUILDING SERVICES (JOB GROUP 022)
Source: New York City Department of Citywide Administrative ServicesPercentages have been rounded to the nearest whole number

New York City Job Groups by Race and GenderCALENDAR YEAR 2008
BUILDING SERVICES (022)
HISPANICFEMALE
16%
BLACKFEMALE
20%
ASIAN MALE2%
WHITEFEMALE
2%HISPANIC
MALE17%
BLACKMALE35%
WHITEMALE
7%
ASIANFEMALE
1%
Source: New York City Department of Citywide Administrative ServicesPercentages have been rounded to the nearest whole number
New York City Job Groups by Race and GenderCALENDAR YEAR 2008
WHITE MALE
BLACK MALE
HISPANIC MALE
ASIAN MALE
NATIVE AMERICAN
MALEUNKNOWN
MALEWHITE
FEMALEBLACK
FEMALEHISPANIC FEMALE
ASIAN FEMALE
NATIVE AMERICAN
FEMALEUNKNOWN
FEMALE OTHER TOTAL
TOTAL 14 70 28 2 0 0 9 44 26 1 1 1 0 196
PERCENTAGE 7% 36% 14% <1% 0% 0% 5% 22% 13% <1% 1% <1% 0% 100%
PERSONAL SERVICES (JOB GROUP 023)
Source: New York City Department of Citywide Administrative ServicesPercentages have been rounded to the nearest whole number
New York City Job Groups by Race and GenderCALENDAR YEAR 2008
PERSONAL SERVICES (023)
BLACKFEMALE
23%
WHITEFEMALE
6%
HISPANICMALE14%
BLACKMALE34%
WHITEMALE
8%HISPANICFEMALE
14%
Source: New York City Department of Citywide Administrative ServicesPercentages have been rounded to the nearest whole number
New York City Job Groups by Race and GenderCALENDAR YEAR 2008
WHITE MALE
BLACK MALE
HISPANIC MALE
ASIAN MALE
NATIVE AMERICAN
MALEUNKNOWN
MALEWHITE
FEMALEBLACK
FEMALEHISPANIC FEMALE
ASIAN FEMALE
NATIVE AMERICAN
FEMALEUNKNOWN
FEMALE OTHER TOTAL
TOTAL 528 484 347 30 6 1 91 143 71 5 2 0 0 1708
PERCENTAGE 31% 28% 20% 2% 0% 0% 5% 8% 4% 0% 0% 0% 0% 100%
FARMING (JOB GROUP 024)
Source: New York City Department of Citywide Administrative ServicesPercentages have been rounded to the nearest whole number

New York City Job Groups by Race and GenderCALENDAR YEAR 2008
FARMING (024)
ASIANMALE
2%
HISPANICMALE20%
BLACKMALE27%
WHITEMALE33%
WHITEFEMALE
7%
BLACKFEMALE
7%
HISPANICFEMALE
4%
Source: New York City Department of Citywide Administrative ServicesPercentages have been rounded to the nearest whole number

New York City Job Groups by Race and GenderCALENDAR YEAR 2008
WHITE MALE
BLACK MALE
HISPANIC MALE
ASIAN MALE
NATIVE AMERICAN
MALEUNKNOWN
MALEWHITE
FEMALEBLACK
FEMALEHISPANIC FEMALE
ASIAN FEMALE
NATIVE AMERICAN
FEMALEUNKNOWN
FEMALE OTHER TOTAL
TOTAL 4453 1027 721 377 16 42 48 62 26 6 0 1 5 6784
PERCENTAGE 66% 15% 11% 6% <1% 1% 1% 1% <1% <1% 0% <1% <1% 100%
CRAFT (JOB GROUP 025)
Source: New York City Department of Citywide Administrative ServicesPercentages have been rounded to the nearest whole number

New York City Job Groups by Race and GenderCALENDAR YEAR 2008
CRAFT (025)
WHITEMALE67%
BLACKMALE15%
HISPANICMALE10%
ASIANMALE
5%
UNKNOWNMALE
1%
WHITEFEMALE
1%BLACK
FEMALE1%
Source: New York City Department of Citywide Administrative ServicesPercentages have been rounded to the nearest whole number

New York City Job Groups by Race and GenderCALENDAR YEAR 2008
WHITE MALE
BLACK MALE
HISPANIC MALE
ASIAN MALE
NATIVE AMERICAN
MALEUNKNOWN
MALEWHITE
FEMALEBLACK
FEMALEHISPANIC FEMALE
ASIAN FEMALE
NATIVE AMERICAN
FEMALEUNKNOWN
FEMALE OTHER TOTAL
TOTAL 91 52 16 11 0 2 1 3 0 0 0 0 0 176
PERCENTAGE 52% 30% 9% 6% 0% 1% 1% 2% 0% 0% 0% 0% 0% 100%
OPERATORS (JOB GROUP 026)
Source: New York City Department of Citywide Administrative ServicesPercentages have been rounded to the nearest whole number
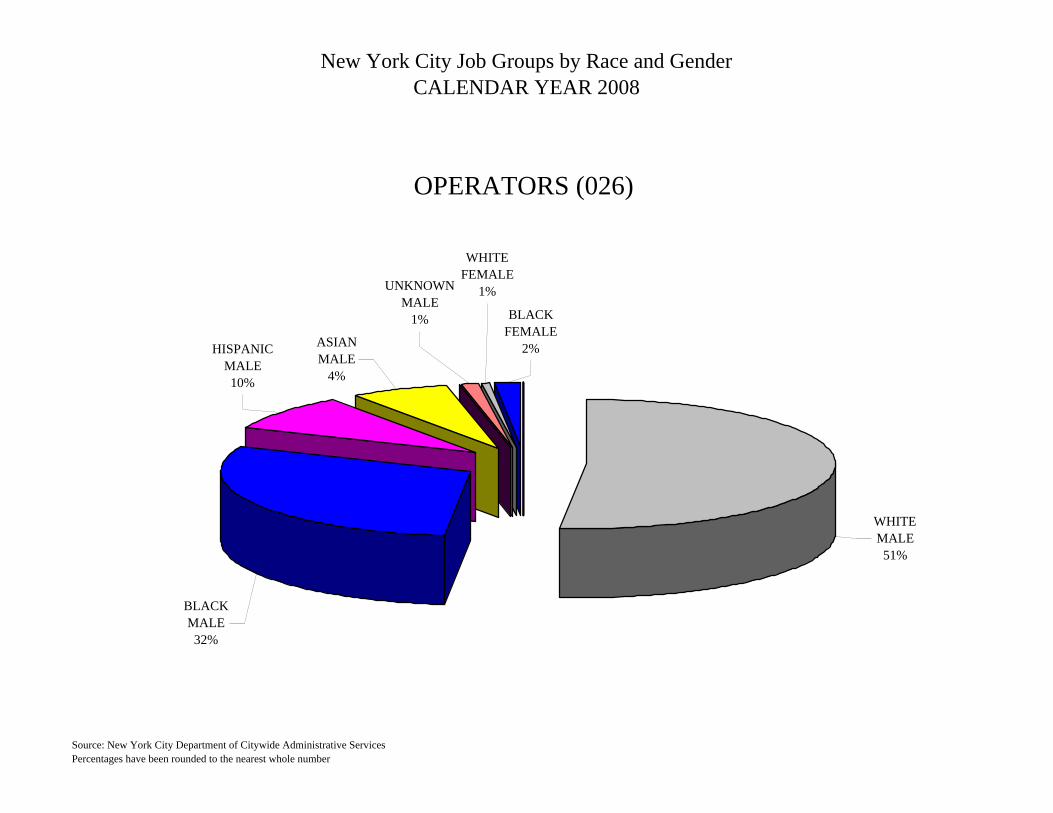
New York City Job Groups by Race and GenderCALENDAR YEAR 2008
OPERATORS (026)
WHITEMALE51%
BLACKFEMALE
2%
WHITEFEMALE
1%UNKNOWNMALE
1%
ASIANMALE
4%
HISPANICMALE10%
BLACKMALE32%
Source: New York City Department of Citywide Administrative ServicesPercentages have been rounded to the nearest whole number

New York City Job Groups by Race and GenderCALENDAR YEAR 2008
WHITE MALE
BLACK MALE
HISPANIC MALE
ASIAN MALE
NATIVE AMERICAN
MALEUNKNOWN
MALEWHITE
FEMALEBLACK
FEMALEHISPANIC FEMALE
ASIAN FEMALE
NATIVE AMERICAN
FEMALEUNKNOWN
FEMALE OTHER TOTAL
TOTAL 86 190 77 23 1 0 6 25 10 0 0 0 0 418
PERCENTAGE 21% 45% 18% 6% 0% 0% 1% 6% 2% 0% 0% 0% 0% 100%
TRANSPORTATION (JOB GROUP 027)
Source: New York City Department of Citywide Administrative ServicesPercentages have been rounded to the nearest whole number

New York City Job Groups by Race and GenderCALENDAR YEAR 2008
TRANSPORTATION (027)
BLACKFEMALE
6%
ASIANMALE
5%
HISPANICMALE18%
BLACKMALE48%
WHITEMALE22%
HISPANICFEMALE
1%WHITE
FEMALE1%
Source: New York City Department of Citywide Administrative ServicesPercentages have been rounded to the nearest whole number

New York City Job Groups by Race and GenderCALENDAR YEAR 2008
WHITE MALE
BLACK MALE
HISPANIC MALE
ASIAN MALE
NATIVE AMERICAN
MALEUNKNOWN
MALEWHITE
FEMALEBLACK
FEMALEHISPANIC FEMALE
ASIAN FEMALE
NATIVE AMERICAN
FEMALEUNKNOWN
FEMALE OTHER TOTAL
TOTAL 527 966 414 46 4 6 69 2083 832 17 20 32 5 5021
PERCENTAGE 10% 19% 8% 1% <1% <1% 1% 41% 17% <1% <1% <1% <1% 100%
LABORERS (JOB GROUP 028)
Source: New York City Department of Citywide Administrative ServicesPercentages have been rounded to the nearest whole number

New York City Job Groups by Race and GenderCALENDAR YEAR 2008
LABORERS (028)
ASIANMALE
1%
HISPANICMALE
8%
WHITEFEMALE
2%
BLACKFEMALE
43%
BLACKMALE20%
WHITEMALE12%
HISPANICFEMALE
13%
Source: New York City Department of Citywide Administrative ServicesPercentages have been rounded to the nearest whole number

New York City Job Groups by Race and GenderCALENDAR YEAR 2008
WHITE MALE
BLACK MALE
HISPANIC MALE
ASIAN MALE
NATIVE AMERICAN
MALEUNKNOWN
MALEWHITE
FEMALEBLACK
FEMALEHISPANIC FEMALE
ASIAN FEMALE
NATIVE AMERICAN
FEMALEUNKNOWN
FEMALE OTHER TOTAL
TOTAL 4008 1622 1275 90 13 6 31 113 36 0 4 0 2 7200
PERCENTAGE 56% 23% 18% 1% <1% <1% 0% 2% 1% 0% <1% 0% <1% 100%
SANITATION WORKERS (JOB GROUP 029)
Source: New York City Department of Citywide Administrative ServicesPercentages have been rounded to the nearest whole number

New York City Job Groups by Race and GenderCALENDAR YEAR 2008
SANITATION WORKERS (029)
HISPANICFEMALE
1%BLACK
FEMALE2%
ASIANMALE
1%
WHITEMALE56%
BLACKMALE22%
HISPANICMALE17%
Source: New York City Department of Citywide Administrative ServicesPercentages have been rounded to the nearest whole number

New York City Job Groups by Race and GenderCALENDAR YEAR 2008
WHITE MALE
BLACK MALE
HISPANIC MALE
ASIAN MALE
NATIVE AMERICAN
MALEUNKNOWN
MALEWHITE
FEMALEBLACK
FEMALEHISPANIC FEMALE
ASIAN FEMALE
NATIVE AMERICAN
FEMALEUNKNOWN
FEMALE OTHER TOTAL
TOTAL 10 9 5 3 0 0 14 83 23 11 0 0 1 159
PERCENTAGE 6% 6% 3% 2% 0% 0% 9% 52% 14% 7% 0% 0% 1% 100%
TEACHERS (JOB GROUP 030)
Source: New York City Department of Citywide Administrative ServicesPercentages have been rounded to the nearest whole number
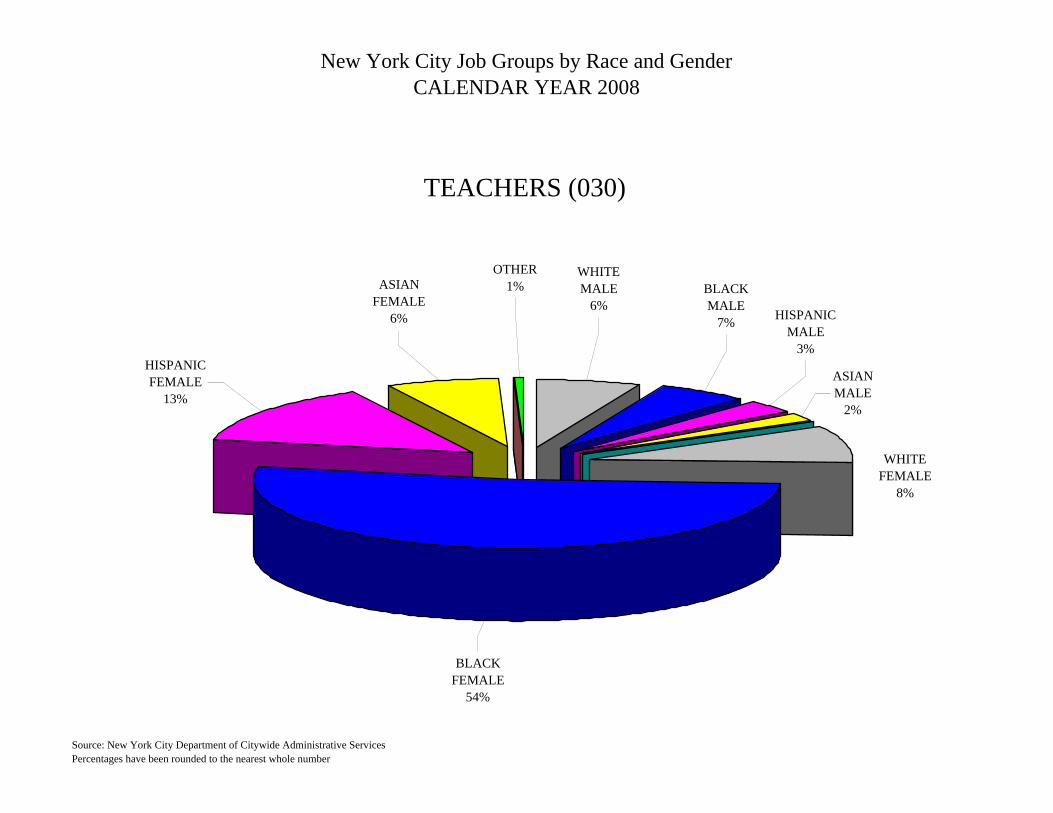
New York City Job Groups by Race and GenderCALENDAR YEAR 2008
TEACHERS (030)
OTHER1%ASIAN
FEMALE6%
WHITEMALE
6%BLACKMALE
7% HISPANICMALE
3%HISPANICFEMALE
13%
BLACKFEMALE
54%
WHITEFEMALE
8%
ASIANMALE
2%
Source: New York City Department of Citywide Administrative ServicesPercentages have been rounded to the nearest whole number

New York City Job Groups by Race and GenderCALENDAR YEAR 2008
WHITE MALE
BLACK MALE
HISPANIC MALE
ASIAN MALE
NATIVE AMERICAN
MALEUNKNOWN
MALEWHITE
FEMALEBLACK
FEMALEHISPANIC FEMALE
ASIAN FEMALE
NATIVE AMERICAN
FEMALEUNKNOWN
FEMALE OTHER TOTAL
TOTAL 271 594 286 171 5 37 426 1508 638 215 16 48 13 4244
PERCENTAGE 6% 14% 7% 4% <1% <1% 10% 36% 15% 5% <1% <1% <1% 100%
PARAPROFESSIONALS (JOB GROUP 031)
Source: New York City Department of Citywide Administrative ServicesPercentages have been rounded to the nearest whole number
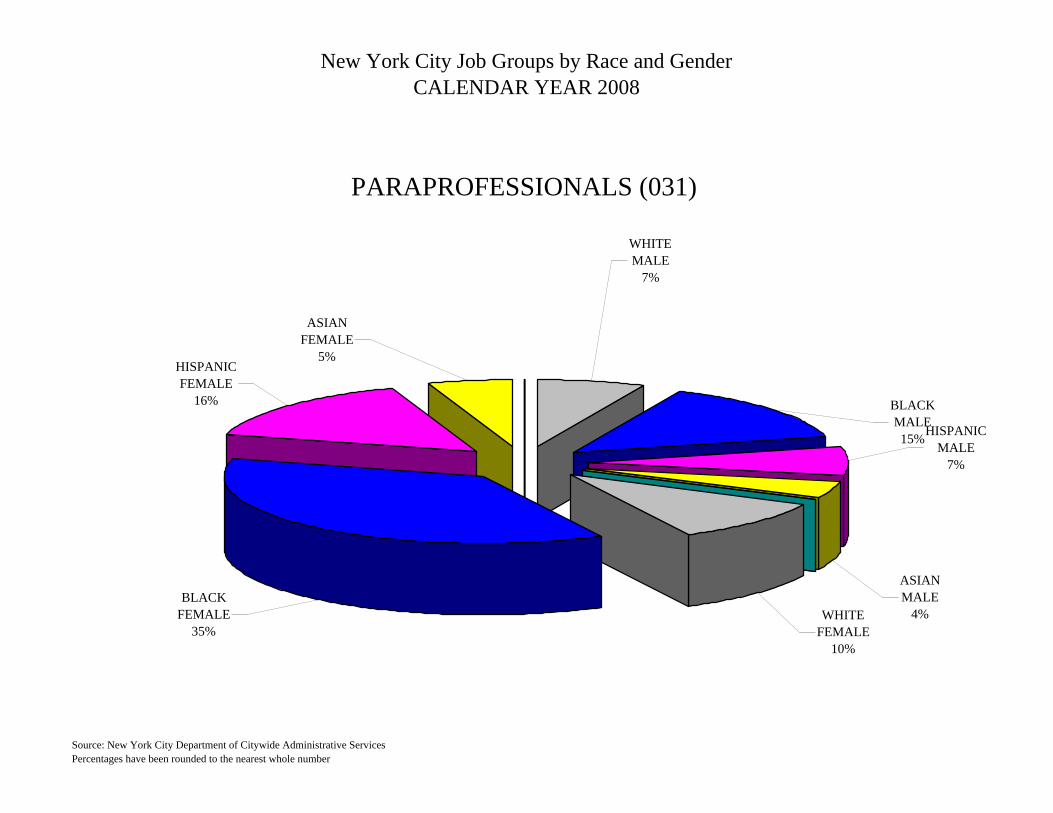
New York City Job Groups by Race and GenderCALENDAR YEAR 2008
PARAPROFESSIONALS (031)
ASIANMALE
4%
WHITEMALE
7%
ASIANFEMALE
5%
BLACKMALE15%HISPANIC
MALE7%
BLACKFEMALE
35%
HISPANICFEMALE
16%
WHITEFEMALE
10%
Source: New York City Department of Citywide Administrative ServicesPercentages have been rounded to the nearest whole number
Related Documents