Supplementary Information for: Resolving the Three-dimensional Micro-structure of Polymer Electrolyte Fuel Cell Electrodes using Nano-scale X-ray Computed Tomography William K. Epting a , Jeff Gelb b , and Shawn Litster a a Dept. of Mechanical Engineering, Carnegie Mellon University, Pittsburgh, PA, 15213, USA b Xradia Inc., Pleasanton, CA, 94588, USA Sample preparation To prepare Electrode 1 (E1), a catalyst suspension was prepared with 20 wt% Pt/Vulcan XC-72R (Electrochem, Woburn, MA), 5 wt% Nafion ® DE-521 suspension (Ion Power, New Castle, DE), and de-ionized water. The Nafion was loading was 35% wt. The mixture was agitated by a dip ultrasound mixer (Cole-Parmer, Vernon Hills, IL) for 10 minutes and stirred by magnetic stir bar overnight. It was then painted onto a 3 x 4 cm piece of 50 μm thick Kapton HN film (DuPont, Wilmington, DE). Kapton was chosen over a Nafion ® membrane for these ex-situ studies because humidity-driven Nafion ® expansion and contraction hindered high-resolution imaging in our preliminary work. Xie et al.[1] demonstrated that painting electrodes onto Kapton has no discernable impact on the electrode structure because of Kapton’s good wettability to catalyst suspensions. Repeated painting continued, with 30 minutes in a 110ºC oven between coats, until the gravimetrically determined platinum loading reached 0.9 mg/cm 2 . The high loading was chosen to increase the electrode volume for more accurate MIP. A second electrode (E2) was prepared having the same volumetric composition of Pt, carbon, and Nafion as E1. However, the catalyst ink suspension was prepared such that the finished electrode featured a large pore and agglomerate structure. This catalyst ink suspension was ion-exchanged with tetrabutylammonim hydroxide (TBAOH) following Wilson et al.’s [2]

Welcome message from author
This document is posted to help you gain knowledge. Please leave a comment to let me know what you think about it! Share it to your friends and learn new things together.
Transcript

Supplementary Information for: Resolving the Three-dimensional Micro-structure of Polymer Electrolyte Fuel
Cell Electrodes using Nano-scale X-ray Computed Tomography
William K. Eptinga, Jeff Gelbb, and Shawn Litstera
aDept. of Mechanical Engineering, Carnegie Mellon University, Pittsburgh, PA, 15213, USA
bXradia Inc., Pleasanton, CA, 94588, USA
Sample preparation
To prepare Electrode 1 (E1), a catalyst suspension was prepared with 20 wt% Pt/Vulcan XC-72R
(Electrochem, Woburn, MA), 5 wt% Nafion® DE-521 suspension (Ion Power, New Castle, DE),
and de-ionized water. The Nafion was loading was 35% wt. The mixture was agitated by a dip
ultrasound mixer (Cole-Parmer, Vernon Hills, IL) for 10 minutes and stirred by magnetic stir bar
overnight. It was then painted onto a 3 x 4 cm piece of 50 µm thick Kapton HN film (DuPont,
Wilmington, DE). Kapton was chosen over a Nafion® membrane for these ex-situ studies
because humidity-driven Nafion® expansion and contraction hindered high-resolution imaging in
our preliminary work. Xie et al.[1] demonstrated that painting electrodes onto Kapton has no
discernable impact on the electrode structure because of Kapton’s good wettability to catalyst
suspensions. Repeated painting continued, with 30 minutes in a 110ºC oven between coats, until
the gravimetrically determined platinum loading reached 0.9 mg/cm2. The high loading was
chosen to increase the electrode volume for more accurate MIP.
A second electrode (E2) was prepared having the same volumetric composition of Pt,
carbon, and Nafion as E1. However, the catalyst ink suspension was prepared such that the
finished electrode featured a large pore and agglomerate structure. This catalyst ink suspension
was ion-exchanged with tetrabutylammonim hydroxide (TBAOH) following Wilson et al.’s [2]
method and featured glycerol as an additional solvent, and a shorter duration of ultrasonication
(ca. 30 s).
A 3 x 3 cm section of the finished E1 electrode with Kapton backing was characterized
by MIP to obtain pore size distributions; the MIP was performed by Porous Materials, Inc.
(Ithaca, NY). TEM samples from the same piece of E1 were embedded in epoxy and examined
in an ultra-microtome 100 nm thick.
A different small piece (ca. 5 mm equilateral triangle) from the same preparation of E1
with Kapton backing was cloven from the larger piece and placed in an UltraXRM-L200
(Xradia, Pleasanton, CA) for nanoXCT. The resolution of this instrument is 50 nm and the 3D
reconstructions of this study have 32.5 nm cubic voxels. To stabilize the thin sample in a
standing position during nanoXCT imaging, a triangular piece was bent with the electrode
outward and the two free ends clipped together to create a loop. The radius of curvature was ca. 1
mm, which is two orders of magnitude greater than electrode thickness and thus insignificant.
Transmission Electron Microscopy
TEM samples from the same electrode were embedded in epoxy (EPON-Araldite®, Huntsman
Advanced Materials, Everburg, Belgium) for 4 days at 35ºC to prevent sample bending, and then
for an additional night at 55ºC. An ultramicrotome slice was cut with a thickness of 100 nm and
mounted in a Hitachi 7100 TEM. An accelerating voltage of 75 keV was used for imaging.
Image processing
The raw X-ray data was processed by proprietary software (Xradia, Inc.) to generate the
unprocessed 3D reconstructions [3]. Subsequent analysis was performed using MATLAB
(Mathworks, Natick, MA). First, MATLAB’s image equalization function redistributed the raw
grayscale histogram intensities over the entire intensity range to aid in visualizing the data. Then,
a thresholding operation split the data into binary values representing solid (agglomerate phase)
and void (pore phase). In processing TEM data, we used a similar thresholding technique to split
the image into binary solid- and pore-phase data. Using the thresholded data, we characterized
the solid agglomerate and pore phase size distributions based on the fitting of inscribed spheres
of different diameter within the volume of each phase.
MIP simulation
MIP measurements serve as valuable data for verifying nanoXCT reconstructions. However, due
to the pore throat effect, the pore size distribution obtained from inscribed spheres cannot be
directly compared with MIP data. To facilitate comparison with MIP, we developed a
morphological computational simulation in MATLAB for generating virtual MIP data using an
established approach [4]. For each iteration of decreasing pore size, an intrusion sphere diameter
D was specified, which corresponds to a certain pressure in MIP. The difference in diameter
between each iteration was limited to the 32.5 nm voxel side length. Starting from one face of
the cubic 3D reconstruction space, inscribed sphere fitting determined where a sphere of
diameter D could intrude into the sample volume – these sites were designated as “seed” sites.
From these seeds, inscribed spheres of the same diameter were placed in every possible inward
direction and checked for overlap with the solid phase. If there was no solid phase overlap, the
program continued to intrude spheres into adjacent unoccupied volumes. When spheres could
proceed in more than one direction, a new sphere seed site and path were initialized. A sphere
intrusion branch became “dead” when no more spheres could be placed in any new direction
without solid overlap, which could be due to a dead-end pore or a pore throat with a diameter
less than the sphere radius. After all sphere paths became dead for a given radius, the volume
corresponding to that radius was computed and inserted to the pore size distribution. With this
simulation, the XCT data was made to yield the pore volume representative of that measured by
MIP. To statistically account for variations due to intrusion direction and starting faces, six
simulations were performed starting from each face of the sample cube, from which the mean
values and standard deviations were calculated.
Verification of X-ray Images
Figure 1 presents 2D virtual slice images from the nanoXCT for the two electrodes prepared.
Figure 1a shows E1 and Figure 1b shows E2. Figures 1c and 1d show magnified images of those
in Figures 1a and 1b, respectively, for regions within the air and electrode. The thresholded
electrode images are also shown. High frequency noise is evident in the air. However, this noise
is not present in the pores of the electrode. This is primarily because the negative Zenike phase
contrast generates a bright/dark halo next to objects with higher attenuation. Thus, the apparent
intensity within the pores is lower. This halo is also clearly evident at the air|electrode interface
in Figure 1a. This significantly increases the visibility of the pores and improves the signal to
noise ratio (SNR) that is discussed next. This effect is the same as the bright halos observed in
optical Zernike phase contrast imaging.

Figure 1 X-ray images. a, 2D X-ray slice of E1. The image includes the interface
between the electrode and air. b, 2D X-ray slice of E2. c, A magnified image of the air
and electrode regions of the electrode in a as well as the thresholded image of the
electrode. d, A magnified image of the air and electrode regions of the electrode in b as
well as the thresholded image of the electrode.
The SNR in the 2D nanoXCT slices is calculated by the ratio of signal variance in the
electrode region to that in the air. The variance in the electrode is a modified variance, *Var , that
uses the mean from the air region. We calculate the SNR with the following expression:
2 2* 1 1 1 11 1
e a a aN N N Ne a a aei j i j
i j i je a a aa
Var ISNR I I I I
N N N NVar I
(1)
where N is the number of pixels used calculated the variance and e aN N N . The SNR is
estimated to be 2.05 ( 7237N or 7.64 µm2) for E1. In contrast, for E2, the estimated SNR is
3.54 ( 9864N or 10.42 µm2). The SNR is lower in E1 because there is greater interfacial area
with smaller agglomerates, which entails more intermediate intensity values and reduces the
variance relative to the second electrode.
To further ensure that the signal in the electrode region was not corrupted by the noise
evident in the air, we performed a power spectrum analysis comparing the air and electrode
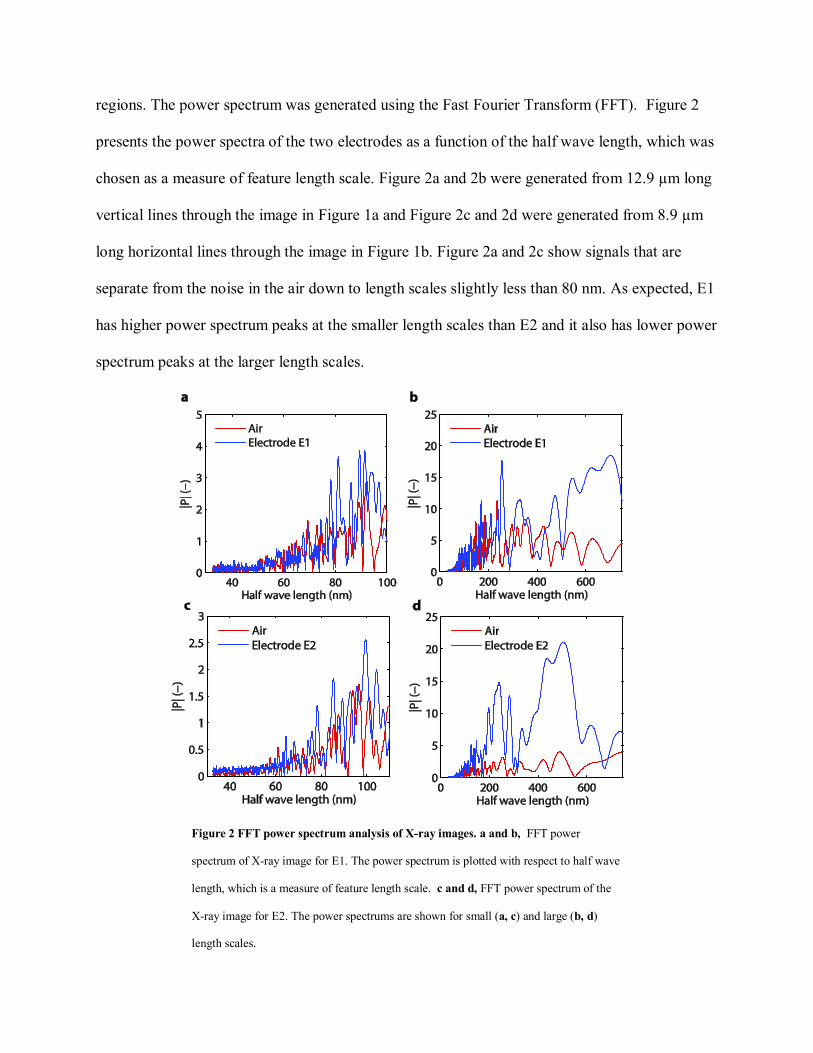
regions. The power spectrum was generated using the Fast Fourier Transform (FFT). Figure 2
presents the power spectra of the two electrodes as a function of the half wave length, which was
chosen as a measure of feature length scale. Figure 2a and 2b were generated from 12.9 µm long
vertical lines through the image in Figure 1a and Figure 2c and 2d were generated from 8.9 µm
long horizontal lines through the image in Figure 1b. Figure 2a and 2c show signals that are
separate from the noise in the air down to length scales slightly less than 80 nm. As expected, E1
has higher power spectrum peaks at the smaller length scales than E2 and it also has lower power
spectrum peaks at the larger length scales.
Figure 2 FFT power spectrum analysis of X-ray images. a and b, FFT power
spectrum of X-ray image for E1. The power spectrum is plotted with respect to half wave
length, which is a measure of feature length scale. c and d, FFT power spectrum of the
X-ray image for E2. The power spectrums are shown for small (a, c) and large (b, d)
length scales.
Agglomerate diameter calculation
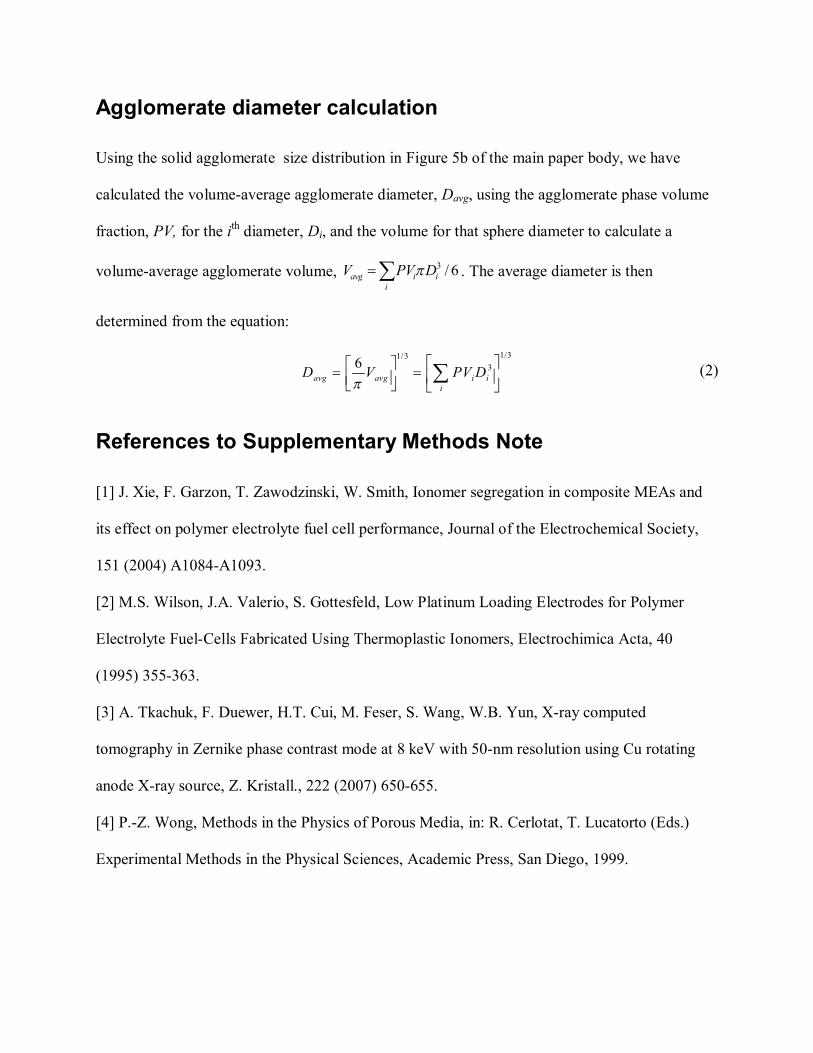
Using the solid agglomerate size distribution in Figure 5b of the main paper body, we have
calculated the volume-average agglomerate diameter, Davg, using the agglomerate phase volume
fraction, PV, for the ith diameter, Di, and the volume for that sphere diameter to calculate a
volume-average agglomerate volume, 3 / 6avg i ii
V PV D . The average diameter is then
determined from the equation:
1/31/3
36avg avg i i
iD V PV D
(2)
References to Supplementary Methods Note
[1] J. Xie, F. Garzon, T. Zawodzinski, W. Smith, Ionomer segregation in composite MEAs and
its effect on polymer electrolyte fuel cell performance, Journal of the Electrochemical Society,
151 (2004) A1084-A1093.
[2] M.S. Wilson, J.A. Valerio, S. Gottesfeld, Low Platinum Loading Electrodes for Polymer
Electrolyte Fuel-Cells Fabricated Using Thermoplastic Ionomers, Electrochimica Acta, 40
(1995) 355-363.
[3] A. Tkachuk, F. Duewer, H.T. Cui, M. Feser, S. Wang, W.B. Yun, X-ray computed
tomography in Zernike phase contrast mode at 8 keV with 50-nm resolution using Cu rotating
anode X-ray source, Z. Kristall., 222 (2007) 650-655.
[4] P.-Z. Wong, Methods in the Physics of Porous Media, in: R. Cerlotat, T. Lucatorto (Eds.)
Experimental Methods in the Physical Sciences, Academic Press, San Diego, 1999.
Related Documents