EPSL, 2004, 229/1-2 pp. 31-43. Maxime LE GOFF and Yves GALLET A new three-axis vibrating sample magnetometer for continuous high-temperature magnetization measurements : Applications to paleo- and archeointensity determinations

EPSL, 2004, 229/1-2 pp. 31-43 .
Mar 16, 2016
A new three-axis vibrating sample magnetometer for continuous high-temperature magnetization measurements : Applications to paleo- and archeointensity determinations. Maxime LE GOFF and Yves GALLET. EPSL, 2004, 229/1-2 pp. 31-43. - PowerPoint PPT Presentation
Welcome message from author
This document is posted to help you gain knowledge. Please leave a comment to let me know what you think about it! Share it to your friends and learn new things together.
Transcript

EPSL, 2004, 229/1-2 pp. 31-43.
Maxime LE GOFF and Yves GALLET
A new three-axis vibrating sample magnetometer for continuous high-temperaturemagnetization measurements :
Applications to paleo- and archeointensity determinations

Paleo- and archeointensity studiesare fastidious and often unproductive
due to poor data quality
It is possible to make them fasterby measuring the magnetization
at high temperatures

TRIAXE SENSOR


must take into account the thermal dependence of the spontaneous
magnetization
High-temperature version of the Thellier and Thellier method revised by Coe
0
100
200
300
400
500
600
700
800
900
0 50 100 150 200 250 300 350 400 450 500
Temperature (°C)
Mto
tal (
10-8
Am
²)
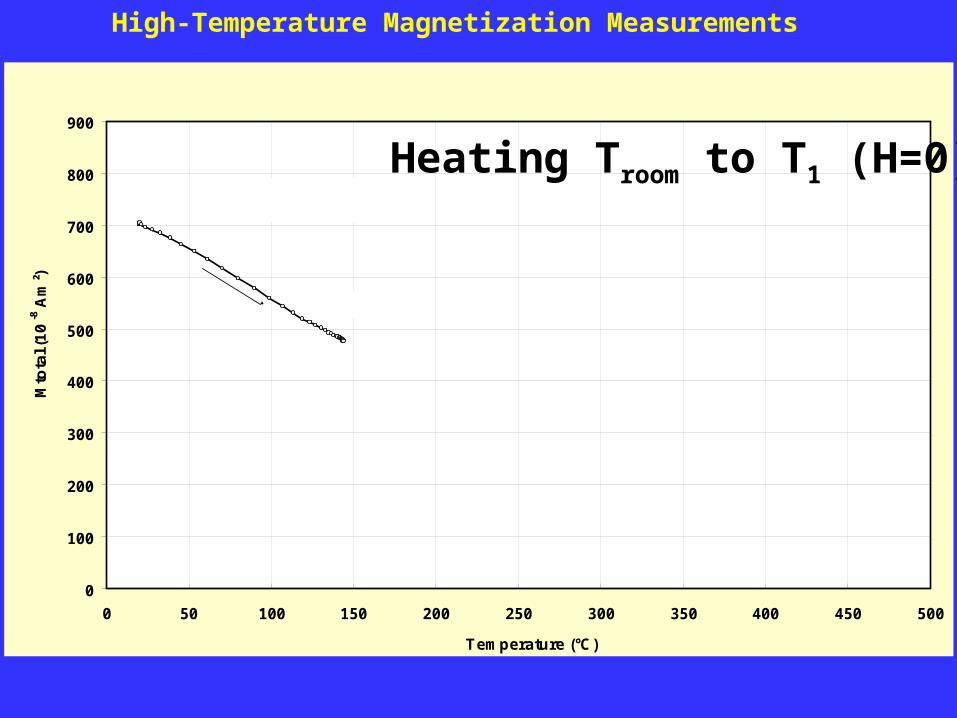
NRM
T1 = 148°C
H = 0
High-Temperature Magnetization Measurements
Heating Troom to T1 (H=0)

0
100
200
300
400
500
600
700
800
900
0 50 100 150 200 250 300 350 400 450 500
Temperature (°C)
Mto
tal (
10-8
Am
²)
H = 0NRM
T1 = 148°C
T2 = 448°CCurve #1
High-Temperature Magnetization Measurements
Heating T1 to T2 (H=0)

0
100
200
300
400
500
600
700
800
900
0 50 100 150 200 250 300 350 400 450 500
Temperature (°C)
Mto
tal (
10-8
Am
²)
H = 0NRM
T1 = 148°C
T2 = 448°C
Curve #1
Curve #2
Curve #3
High-Temperature Magnetization Measurements
Cooling to T1 andHeating T1 to T2 (H=0)

0
100
200
300
400
500
600
700
800
900
0 50 100 150 200 250 300 350 400 450 500
Temperature (°C)
Mto
tal (
10-8
Am
²)
H = 70µT
H = 70 µTNRM
T1 = 148°C
T2 = 448°CCurve #1
Curve #2
Curve #3
High-Temperature Magnetization Measurements
Applying Hlab = 70µT

0
100
200
300
400
500
600
700
800
900
0 50 100 150 200 250 300 350 400 450 500
Temperature (°C)
Mto
tal (
10-8
Am
²)
NRM
T1 = 148°C
T2 = 448°C
Curve #1
Curve #2
Curve #3
Curve #4
High-Temperature Magnetization Measurements
Cooling T2 to T1 (H = 70µT)

0
100
200
300
400
500
600
700
800
900
0 50 100 150 200 250 300 350 400 450 500
Temperature (°C)
Mto
tal (
10-8
Am
²)
H = 0NRM
T1 = 148°C
T2 = 448°C
Curve #1
Curve #2
Curve #3
Curve #4
High-Temperature Magnetization Measurements
Hlab = 0µT

0
100
200
300
400
500
600
700
800
900
0 50 100 150 200 250 300 350 400 450 500
Temperature (°C)
Mto
tal (
10-8
Am
²)
NRM
T1 = 148°C
T2 = 448°C
Curve #1
Curve #2
Curve #3
Curve #4Curve #5
High-Temperature Magnetization Measurements
Heating T1 to T2 (H=0)

R(Ti) = Hlab * 1(Ti) / 5(Ti)
R’(Ti) = Hlab * 1’(Ti) / 5’(Ti)
Remaining NRM (1) and TRM (5) fractions between Ti and T2
R ratio
Lost NRM (1’) and TRM (5’) fractions between T1 and Ti
R’ ratio
0
50
100
150
200
250
300
350
400
100 150 200 250 300 350 400 450
TiT1 = 150°C
T2 = 450°C
Two possibilities to derive intensity data
NRM
TRM

20
30
40
50
60
70
80
150 200 250 300 350 400 450
Temperature (°C)
R, R
' (µT
)
R
R'
Test on a pseudo NRM acquired in a field of 50µT in the same conditions as the laboratory TRM (Hlab=50 µT)

0
10
20
30
40
50
60
70
80
150 200 250 300 350 400 450
R
R'
Ancient NRM : R increasing, R’ much more constant
Ti, (°C)
R, R’ (µT)

45
50
55
60
65
150 200 250 300 350 400 450
Temperature (°C)
R, R
' (µT
)
NRM 0.5°/mn; TRM 25°/mn
NRM 0.5°/mn, TRM 6°/mn
NRM 0.5°/mn, TRM 2°/mn
Cooling rate effect
R’ must be considered

Correction for the TRM anisotropy

Comparison between archeointensity
data obtained from the Thellier and
Thellier method revised by Coe and
from the Triaxe
(Samples from Mesopotamia previously studied by Genevey et al., JGR, 2003)

0
10
20
30
40
50
60
70
80
150 200 250 300 350 400 450
R
R'
0
50
100
150
200
250
150 250 350 450
Selection criteria
• A large NRM fraction must be involved
• Expected behaviour of R and R’ curves

0
20
40
60
80
100
120
140
200 250 300 350 400 450 500
Temperature (°C)
R
R'
Example of rejected sample
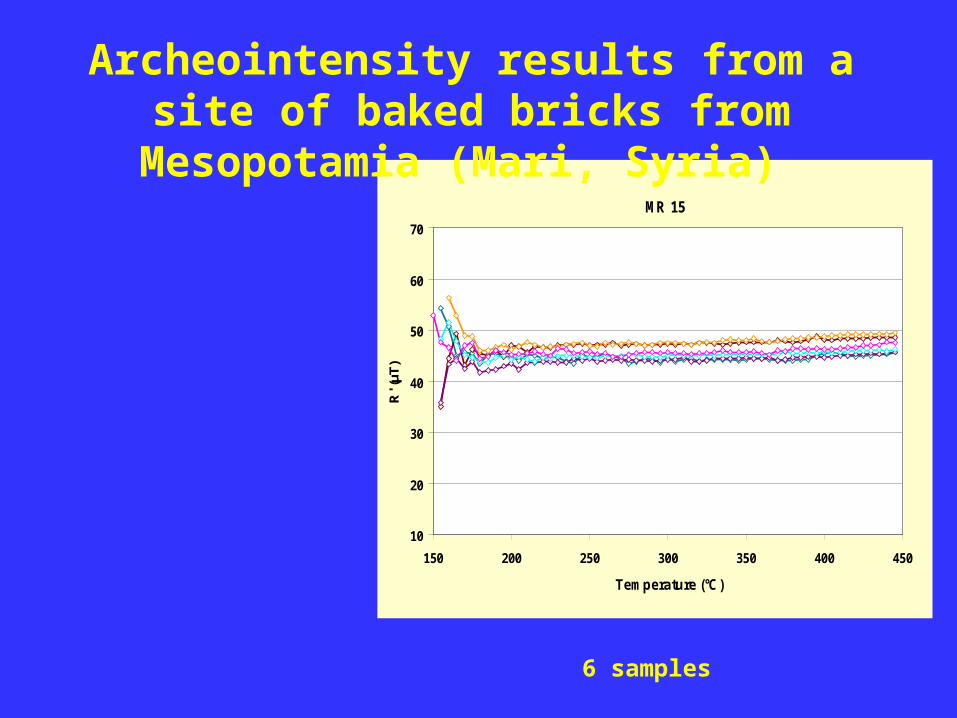
MR 15
10
20
30
40
50
60
70
150 200 250 300 350 400 450
Temperature (°C)
R' (
µT)
Archeointensity results from a site of baked bricks from Mesopotamia (Mari, Syria)
6 samples

0
10
20
30
40
50
60
70
80
-4000 -3000 -2000 -1000 0
Thellier Thellier - CoeTriaxe Same SiteTriaxe New Site
Comparison between archeointensity results obtained from the Thellier and Thellier and Triaxe methods
H (µT)
Age (BC)
CONCLUSIONS
• The experimental procedure was successfully tested with archeological baked materials. We need now to work on volcanic samples.
• Other applications of the Triaxe :- Viscosity at high temperature.- Alteration.- Coupling between different magnetic phases.- etc.

Related Documents


![LA LEY APLICABLE A LOS CONTRATOS … · 229 Revista Chilena de Derecho, vol. 41 Nº 1, pp. 229 - 265 [2014] LA LEY APLICABLE A LOS CONTRATOS INTERNACIONALES EN AUSENCIA DE ELECCIÓN](https://static.cupdf.com/doc/110x72/5b0d75ed7f8b9a6a6b8dea0e/la-ley-aplicable-a-los-contratos-revista-chilena-de-derecho-vol-41-n-1-pp-229.jpg)

![[Originale: Fibeln – pp. 229-284]...1 [Originale: Fibeln – pp. 229-284] Fibule La maggior parte delle fibule deposte nelle sepolture di Bazzano sono in ferro e in parte decorate](https://static.cupdf.com/doc/110x72/60750f530ad95938f76452b7/originale-fibeln-a-pp-229-284-1-originale-fibeln-a-pp-229-284-fibule.jpg)