EPR-dosimetry, harmonization of techniques Biological dosimetry in Atomic bomb survivors Yoshiaki Kodama Cytogenetics, Department of Genetics Radiation Effects Research Foundation (RERF) Hiroshima, Japan Kodama Y., IAEA Training Meeting, June 10-14, 2013, Hiroshima 1

Welcome message from author
This document is posted to help you gain knowledge. Please leave a comment to let me know what you think about it! Share it to your friends and learn new things together.
Transcript

EPR-dosimetry, harmonization of techniques
Biological dosimetry inAtomic bomb survivors
Yoshiaki KodamaCytogenetics, Department of Genetics
Radiation Effects Research Foundation (RERF)Hiroshima, Japan
Kodama Y., IAEA Training Meeting, June 10-14, 2013, Hiroshima 1

Biological dosimetry in A-bomb survivors
Purpose: to provide information to confirm or improve our current estimates of individual doses, which are usedto evaluate both cancer and non-cancer risks of A-bomb radiation exposures.
- Fluorescence in situ hybridization(FISH) study (1994- )
Chromosome study- Conventional Giemsa staining study
(1968-1993)
Electron paramagnetic resonance (EPR) study (1992- )
Chromosome study
2Kodama Y., IAEA Training Meeting, June 10-14, 2013, Hiroshima

Conventional Giemsa staining
Most basic staining method
Homogeneous stainingAppropriate for the analysis of numberand shape of the chromosome
Biodosimetric study(detection of dic chromosome)
dic
r
Kodama Y., IAEA Training Meeting, June 10-14, 2013, Hiroshima
Chromosome specific DNA probes
Quick and accurate detection of translocations
Retrospective biodosimetry(detection of t chromosome)
t(1), t(1), t(2)
FISH technique
3

- Chromosome study of A-bomb survivors had initiated at 1968.
- Most of unstable type aberrations disappeared from thelymphocytes of survivors and only stable type aberrations remained.
Exchanges
Intra-chromosomal Inter-chromosomal
Ring+fragment( r + ace)
Dicentric+fragment( dic + ace)
Remarks
Pericentricinversion
(inv)
Reciprocal translocation
( t )
Easy to detectbut unstable
Over time
Difficult to detectbut stableover time
Unstable type
Stable type
4Kodama Y., IAEA Training Meeting, June 10-14, 2013, Hiroshima
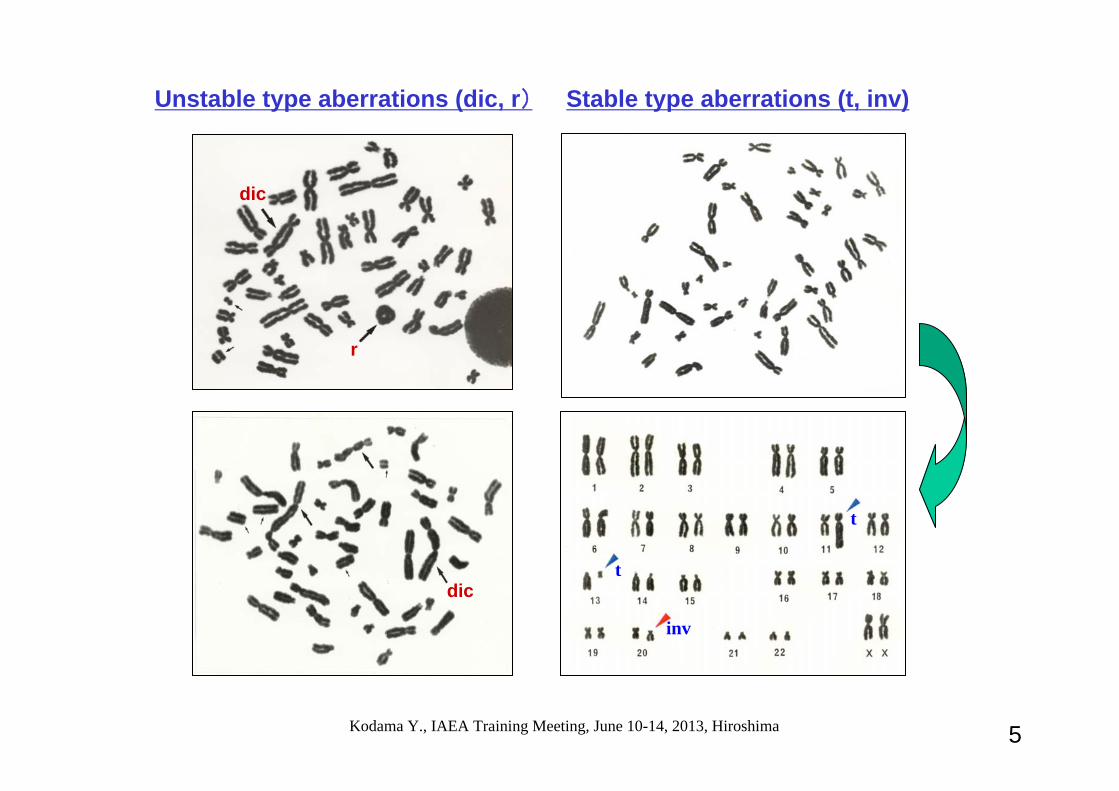
Unstable type aberrations (dic, r) Stable type aberrations (t, inv)
t
t
inv
dic
r
dic
5Kodama Y., IAEA Training Meeting, June 10-14, 2013, Hiroshima

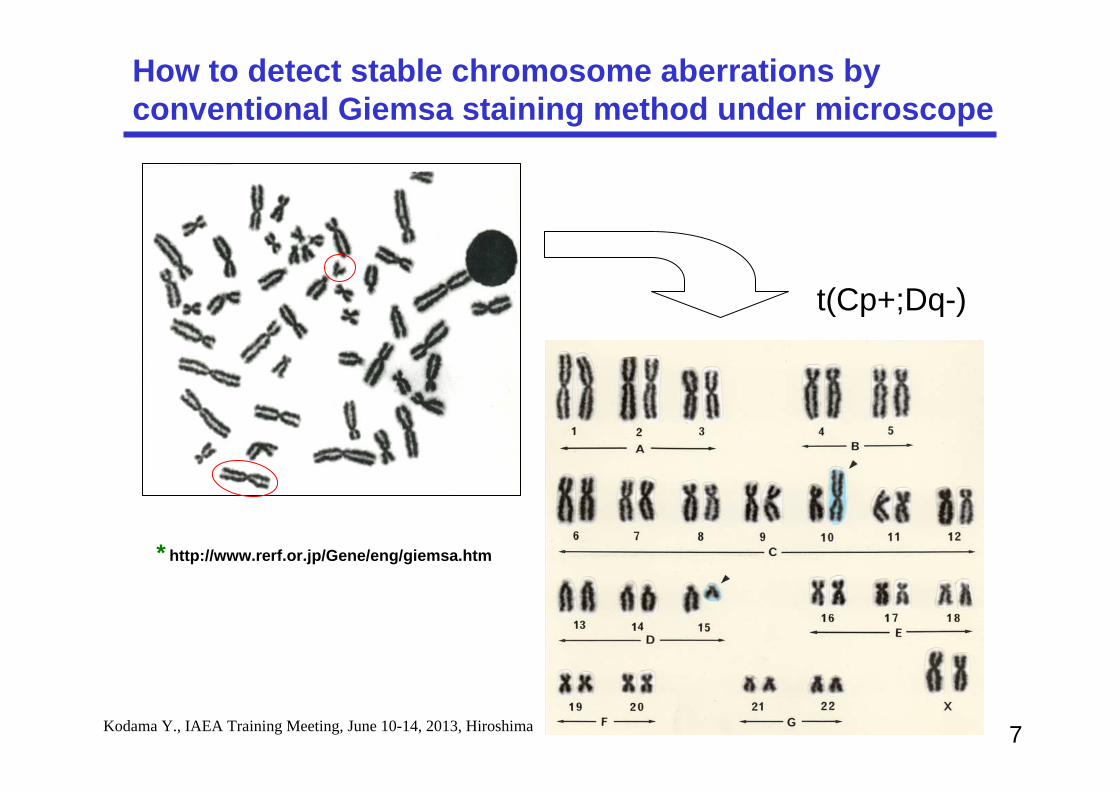
How to detect stable chromosome aberrations by conventional Giemsa staining method under microscope
46
G G
G GG
+GD
D
DD
D
F
- D
F
F
F
16
16
17
1718
18
1
1
2
2
3
3
3
+3
B
B B
B
C
C
C
CC
C
C
CC
C
CC
C
C
C
- C
Dq-
Cp+ t(Cp+;Dq-)
6Kodama Y., IAEA Training Meeting, June 10-14, 2013, Hiroshima
t(Cp+;Dq-)
How to detect stable chromosome aberrations by conventional Giemsa staining method under microscope
* http://www.rerf.or.jp/Gene/eng/giemsa.htm
7Kodama Y., IAEA Training Meeting, June 10-14, 2013, Hiroshima

“It has already been stressed that Cs cells can only be detected with very low efficiency” UNSCEAR Report (1969)
“Obvious symmetrical interchange can be recorded but theanalysis is time consuming and it not recommended.”“Reciprocal translocations are particularly difficult to observe in conventionally stained preparations….. There issomewhat increase in resolution when banded…. but eventhen the efficiency …. is around 50%….” IAEA TechnicalReport No. 260 (1986)
8Kodama Y., IAEA Training Meeting, June 10-14, 2013, Hiroshima

Conventional method; 46,XX, Normal
G-banding method; 46,XX,t(2q-;6p+)
9Kodama Y., IAEA Training Meeting, June 10-14, 2013, Hiroshima

Reproducibility of conventional chromosome analysis for stable-type aberrations (Cs cells)
First examination (1984-86)
% Cs
% Cs
S ec o
nd e
xam
inat
ion
( 19 8
8-)
10Kodama Y., IAEA Training Meeting, June 10-14, 2013, Hiroshima
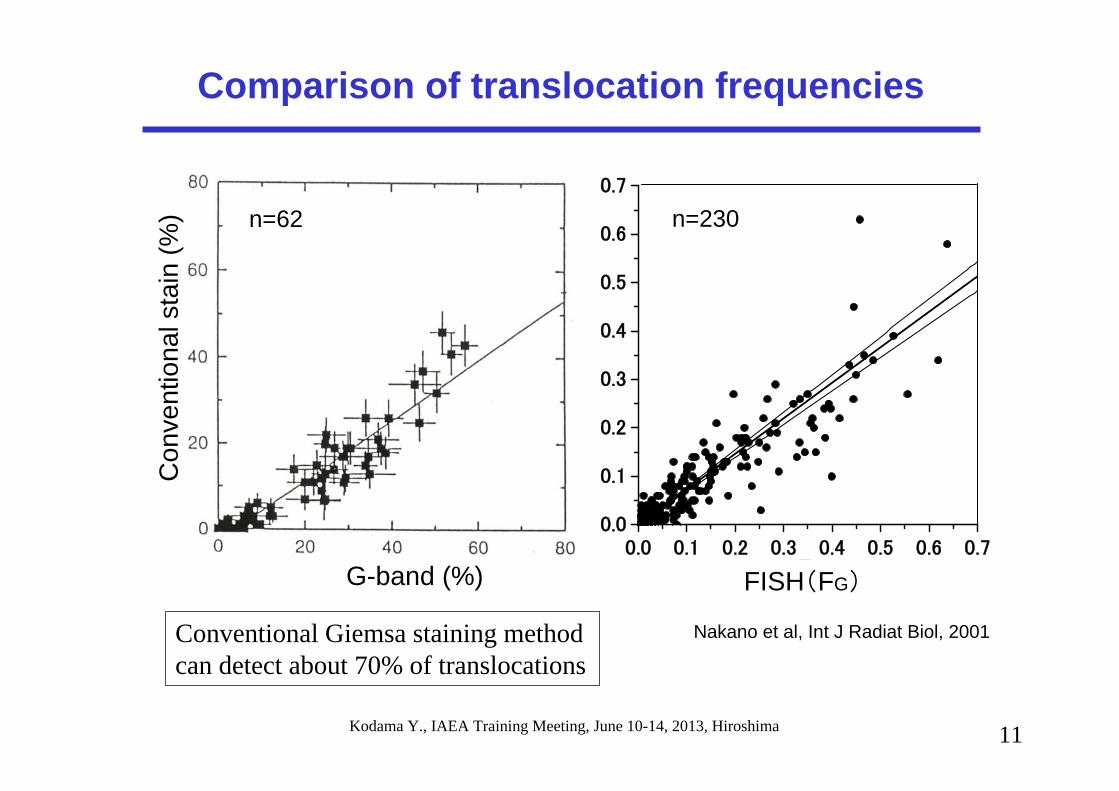
0.0 0.1 0.2 0.3 0.4 0.5 0.6 0.70.0
0.1
0.2
0.3
0.4
0.5
0.6
0.7a)
Tran
sloc
atio
nsFGFISH(FG)
n=230
Comparison of translocation frequencies
11
Nakano et al, Int J Radiat Biol, 2001Conventional Giemsa staining method can detect about 70% of translocations
G-band (%)
Con
vent
iona
l sta
in (%
) n=62
Kodama Y., IAEA Training Meeting, June 10-14, 2013, Hiroshima

Chromosome study by Giemsa staining
Kodama et al, Radiat Res 2001
Weighted marrow dose (Gy)
a) Hiroshima b) Nagasaki
Prop
ortio
n w
ith a
berr
atio
ns
12
95% prediction limits of sampling error
Sampling error + 50% CV in dose estimation
- Why the distribution is so wide?- City difference is real?
Kodama Y., IAEA Training Meeting, June 10-14, 2013, Hiroshima

FISH can detect translocationrapidly and objectively (1994-)
t
t
inv
Cytogenetic techniquesTranslocation analysis by Giemsastaining method (1968-1993)
Painted chromosomes: #1, #2, #4No of cells scored: 500*
*All measurements were done in Hiroshima laboratory.
1
1
2
2
4
t(4)
13Kodama Y., IAEA Training Meeting, June 10-14, 2013, Hiroshima
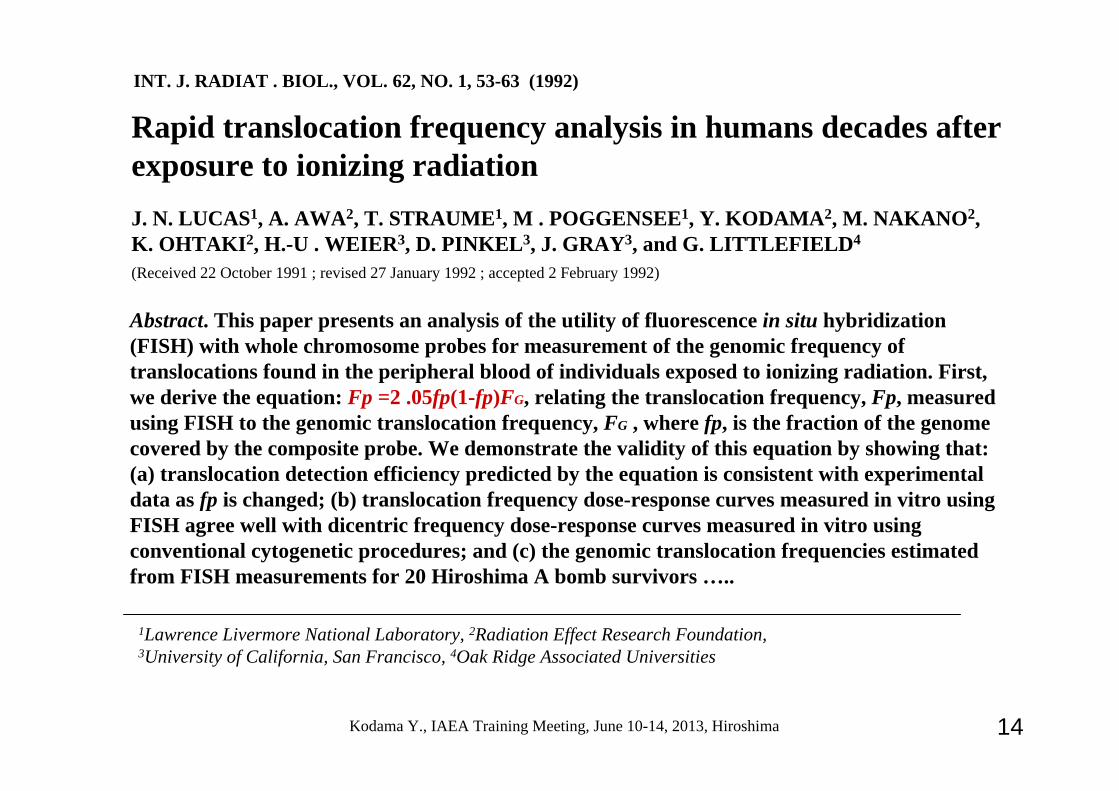
(Received 22 October 1991 ; revised 27 January 1992 ; accepted 2 February 1992)
INT. J. RADIAT . BIOL., VOL. 62, NO. 1, 53-63 (1992)
Rapid translocation frequency analysis in humans decades afterexposure to ionizing radiationJ. N. LUCAS1, A. AWA2, T. STRAUME1, M . POGGENSEE1, Y. KODAMA2, M. NAKANO2,K. OHTAKI2, H.-U . WEIER3, D. PINKEL3, J. GRAY3, and G. LITTLEFIELD4
Abstract. This paper presents an analysis of the utility of fluorescence in situ hybridization (FISH) with whole chromosome probes for measurement of the genomic frequency of translocations found in the peripheral blood of individuals exposed to ionizing radiation. First, we derive the equation: Fp =2 .05fp(1-fp)FG, relating the translocation frequency, Fp, measured using FISH to the genomic translocation frequency, FG , where fp, is the fraction of the genome covered by the composite probe. We demonstrate the validity of this equation by showing that: (a) translocation detection efficiency predicted by the equation is consistent with experimental data as fp is changed; (b) translocation frequency dose-response curves measured in vitro using FISH agree well with dicentric frequency dose-response curves measured in vitro using conventional cytogenetic procedures; and (c) the genomic translocation frequencies estimated from FISH measurements for 20 Hiroshima A bomb survivors …..
1Lawrence Livermore National Laboratory, 2Radiation Effect Research Foundation,3University of California, San Francisco, 4Oak Ridge Associated Universities
14Kodama Y., IAEA Training Meeting, June 10-14, 2013, Hiroshima

Estimation of translocation frequency by FISH (1)
FG: full genome aberration frequencyFP: translocation frequency measured by FISHfp: fraction of genome painted2.05: coefficient excluding exchanges within the
same chromosome
FG = FP/ 2.05 fp (1- fp)
Chromosomes 1+2+4
FG = 2.81 x FP (female)Chromosomes 1+2+4 = 22%
*Cytogenetic dosimetry: Applications in preparedness for and response to radiation emergencies, pp87-89, IAEA, 2011
2.77 x FP (male)
15
(Lucas et al, IJRB 62:53-63, 1992)
500 cells= 178 cell equivalent
Kodama Y., IAEA Training Meeting, June 10-14, 2013, Hiroshima

3 color FISH
FG= FP(1+2+4) / 2.05 [f1(1-f1)+f2(1-f2)+f4(1-f4) – (f1f2+f1f4+f2f4)]
#1:red、 #2:green、 #4:white (DAPI:blue)
(Lucas et al, Cytogenet Cell Genet 62:11-12, 1993)(IAEA manual 2011, Cytogenetic Dosimetry, pp 87-)
FG = FP x 2.567 (female, fp=0.2234*)
FG = FP x 2.533 (male, fp=0.2271*)
(*IAEA manual 2011, Table 2)
500 cells =196 cell equivalent
Estimation of translocation frequency by FISH (2)
16Kodama Y., IAEA Training Meeting, June 10-14, 2013, Hiroshima

Two way
One wayType 1 (70%~)
Type 2 (20%~) Type 3 (~5%)
paint non-paint
Type of translocations by FISH
Translocated segment is too small to detect
17Kodama Y., IAEA Training Meeting, June 10-14, 2013, Hiroshima

t(4p+;Cq+) : Type 1 t(1p-;Bp+): Type 1t(1q+): Type 3t(2p-;Cp+): Type 1
Number of color Junctions= 5
3 translocations*
Detection of translocations by FISH
or
*PAINT system(Tucker et al, Cytogenet Cell Genet 68:211-221,1995)
18

0.0
0.5
1.0
1.5
2.0
2.5
0 5 10 15 20 25 30 35 40 45 50 55 60 65 70 75 80 85Age in years
Linear with loglinar curvature term
Age in categories
Translocation frequencies in control population by FISHSigurdson et al, Mutat Res, 652:112-121, 2008, Fig. 2.
19Kodama Y., IAEA Training Meeting, June 10-14, 2013, Hiroshima

0.0
0.5
1.0
1.5
2.0
2.5
3.0
3.5
0 5 10 15 20 25 30 35 40 45 50 55 60 65 70 75 80 85Age in years
North America (N=861)
Asia (N=172)
Central and Eastern Europe (N=391)
Western Europe (N=509)
Sigurdson et al, Mutat Res, 652:112-121, 2008, Fig. 4.
Translocation frequencies in control population by FISH
20Kodama Y., IAEA Training Meeting, June 10-14, 2013, Hiroshima

*Dose to bone marrow assuming DS86 dosimetry and a neutron RBE of 10.
H6549 2.22 490 31 (10,7,14) 0.179 100 10 0.10H6550 0 2027 5 (4,0,1) 0.007 100 0 0.00H6551 1.63 824 49 (20,14,15) 0.168 100 16 0.16H6770 0.62 455 16 (8,2,6) 0.099 100 5 0.05H6579 1.06 284 19 (4,6,9) 0.189 100 15 0.15H6580 2.61 178 19 (4,8,7) 0.302 100 37 0.37H6584 0.66 687 15 (6,4,5) 0.062 100 6 0.06H6585 1.32 343 17 (7,6,4) 0.140 97 15 0.15H6615 2.31 141 29 (11,8,10) 0.582 100 72 0.72H6616 1.94 743 16 (6,7,3) 0.061 100 6 0.06H6617 4.82 216 23 (8,10,5) 0.301 100 44 0.44H6688 1.46 375 16 (4,9,3) 0.121 100 7 0.07H6690 1.86 146 39 (14,11,14) 0.756 97 90 0.93H6708 0 813 4 (2,1,1) 0.014 100 1 0.01H6718 2.22 178 26 (6,12,8) 0.413 100 46 0.46H6722 1.84 205 18 (9,4,5) 0.248 100 29 0.29H6723 0.96 416 16 (9,1,6) 0.109 100 17 0.17H6725 1.42 378 33 (10,13,10) 0.247 100 41 0.41H6728 0.86 530 14 (8,4,2) 0.075 100 14 0.14H6731 1.30 105 16 (10,3,3) 0.431 100 44 0.44
Dose* Translocations Trans/cellSubjects (Sv) Cells total(#1,#2,#4) (genomic) Cells Translocations Trans/cell
Table 1a. Translocation frequencies in A-bomb survivors measured by FISH for chromosomes 1, 2 and 4 and by G-banding (Lucas et al., 1992)
FISH (LLNL) G-banding (RERF)
21Kodama Y., IAEA Training Meeting, June 10-14, 2013, Hiroshima

Comparison of genomic translocation frequencies
G-banding (RERF)
FIS
H (L
LNL)
0 0.2 0.4 0.6 0.8 1.0
1.0
0.8
0.6
0.4
0.2
0
FISH results fit well with G-banding results22Kodama Y., IAEA Training Meeting, June 10-14, 2013, Hiroshima
To examine the difference in translocation dose responses between Hiroshima and Nagasaki survivors under different shielding categories
Purpose of FISH study in RERF
23Kodama Y., IAEA Training Meeting, June 10-14, 2013, Hiroshima
SummaryHighly significant and nonlinear dose responses were observed inboth Hiroshima and Nagasaki.
A wide scatter of individual translocation frequencies against physical dose was observed as seen in the previous Giemsa staining study. This suggests the dose errors in DS02 dose estimates in some survivors.
Difference between Hiroshima and Nagasaki was much reduced suggesting the large city difference in the past study was mainly due to different aberration detection rates between Hiroshima and Nagasaki laboratories.
Both people exposed outside but shielded by houses and Nagasaki factory workers had significantly lower dose responses than people who were exposed inside Japanese houses.
28Kodama Y., IAEA Training Meeting, June 10-14, 2013, Hiroshima

Why physical dose does not fit well with chromosome data?
Observer biases in chromosome study?Different radiation sensitivity?Dosimetry errors?Errors in interview records?
Estimate the radiation dose by a methodtotally independent from cytogenetic measurement.
29Kodama Y., IAEA Training Meeting, June 10-14, 2013, Hiroshima

- Fluorescence in situ hybridization(FISH) study (1994- )
Biological dosimetry
Chromosome study- Conventional Giemsa staining study
(1968-1993)
30
Electron paramagnetic resonance (EPR) study (1992- )
Purpose: to clarify the variation of cytogenetic data against physical dose
Kodama Y., IAEA Training Meeting, June 10-14, 2013, Hiroshima
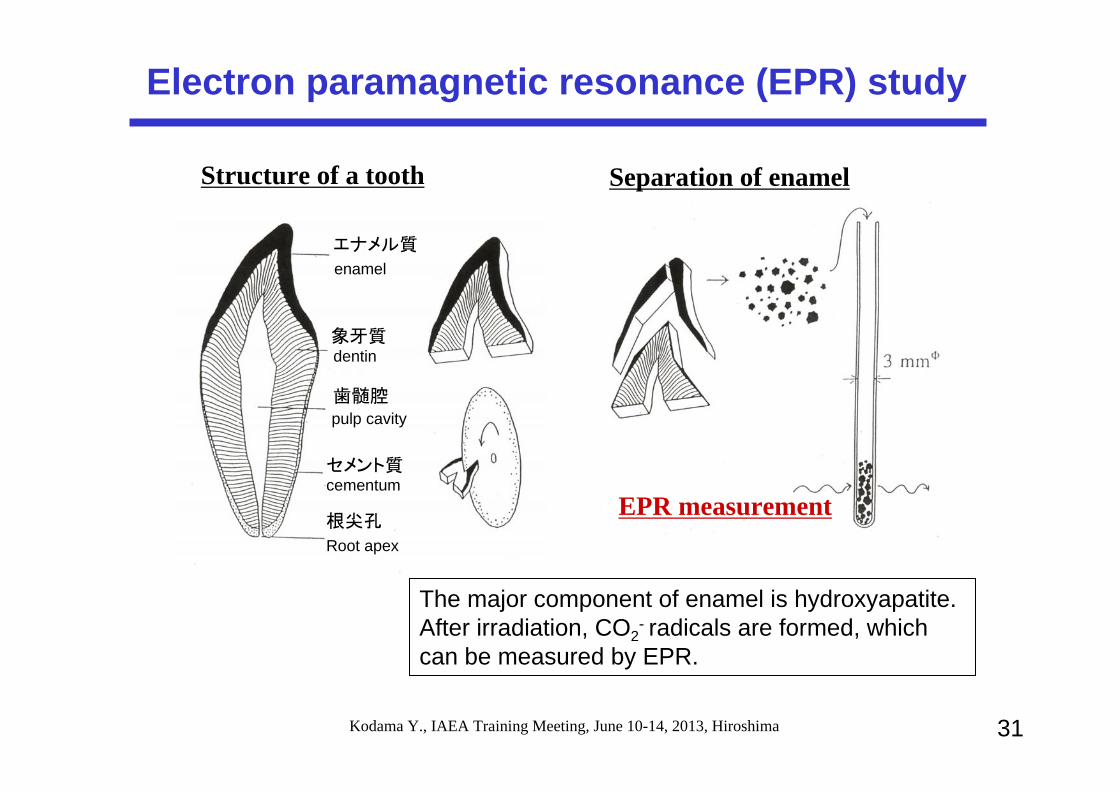
Structure of a tooth
EPR measurement
Separation of enamel
Electron paramagnetic resonance (EPR) study
エナメル質
象牙質
歯髄腔
セメント質
根尖孔
enamel
dentin
pulp cavity
cementum
Root apex
31
The major component of enamel is hydroxyapatite. After irradiation, CO2
- radicals are formed, which can be measured by EPR.
Kodama Y., IAEA Training Meeting, June 10-14, 2013, Hiroshima

EPR signal looks like this
Internal signal of Mn
0.4 MW
16 MW
Internal signal of Mn
EPR signal intensity(16MW0.4MW)
Selective saturation method is used for subtraction of the background signal from EPR spectrum of tooth enamel.
Kodama Y., IAEA Training Meeting, June 10-14, 2013, Hiroshima 32

A calibration curve was done by preparing pooled enamel from 20 molars donated by residents of Fukushima prefecture (located in northern Japan). This pooled sample was then divided into 20 aliquots, and each aliquot was irradiated with a defined dose of 60Co gamma radiation to construct a calibration curve.
Calibration curve
0 1 2 3 40
40
80
120
160
200
EP
R s
ignal
inte
nsi
ty
Gamma Dose (Gy)
0.5
Y=A+BX
33

0.0
0.2
0.4
0.6
0.8
1.0
1.2
1.4
1.6
Buccal
First incisor
Secondincisor
Canine First bicuspid
Secondbicuspid
Molar
Lingual
Mea
n±SD
of E
SR-e
stim
ated
dos
e (G
y)
EPR- estimated doses in types of teeth
(N. Nakamura, Radiat. Res., 2006)
n= 96 teeth from 53 survivors (control group with doses <5 mGy)
Kodama Y., IAEA Training Meeting, June 10-14, 2013, Hiroshima 34

Preparation of enamel
Donor age at the time of bomb were 10.
Donors who received radiotherapy were excluded.
Molars were used.
Each tooth was divided in two halves (buccal and lingual portions).
Enamel from two sites was separated independently.
Enamel was ground (about 500mm), and measured by EPR.
EPR machine
Kodama Y., IAEA Training Meeting, June 10-14, 2013, Hiroshima 35
Evaluation of individual radiation doses of tooth enamel from Hiroshima atomic
bomb survivors by EPR
36
SummaryComparison of the EPR dose with Chromosome dose of the same survivors confirmed their close association.
The results turned out to validate the chromosome aberration data to be useful for individual dose estimation.
Wide distribution of individual chromosome dose against DS02 dose seems to be related dose errors rather than individual difference in radiosensitivity of lymphocytes.
Both EPR and chromosome doses deviated substantially from individual DS02 doses. This suggests the dose errors from physical estimates in a fraction of survivors.
Kodama Y., IAEA Training Meeting, June 10-14, 2013, Hiroshima 40
Related Documents