UNIVERSITÀ DEGLI STUDI DI NAPOLI “FEDERICO II” FACOLTÀ DI INGEGNERIA Dipartimento di Ingegneria dei Materiali e della Produzione DOTTORATO DI RICERCA IN INGEGNERIA DEI MATERIALI E DELLE STRUTTURE XXIII CICLO EPOXY-BASED ORGANIC-INORGANIC HYBRID MATERIALS BY SOL-GEL METHOD: CHEMICAL TAILORING AND MULTI-SCALE CHARACTERIZATION. Ph.D. dissertation by Filomena Piscitelli Tutor: Ch.mo Prof. Giuseppe Mensitieri Egr. Dr. Marino Lavorgna Coordinatore: Ch.mo Prof. Domenico Acierno TRIENNIO 2007/2010

Welcome message from author
This document is posted to help you gain knowledge. Please leave a comment to let me know what you think about it! Share it to your friends and learn new things together.
Transcript

UNIVERSITÀ DEGLI STUDI DI NAPOLI “FEDERICO II”
FACOLTÀ DI INGEGNERIA
Dipartimento di Ingegneria dei Materiali e della Produzione
DOTTORATO DI RICERCA IN
INGEGNERIA DEI MATERIALI E DELLE STRUTTURE
XXIII CICLO
EPOXY-BASED ORGANIC-INORGANIC HYBRID MATERIALS BY SOL-GEL METHOD: CHEMICAL
TAILORING AND MULTI-SCALE CHARACTERIZATION.
Ph.D. dissertation by
Filomena Piscitelli
Tutor: Ch.mo Prof. Giuseppe Mensitieri
Egr. Dr. Marino Lavorgna
Coordinatore: Ch.mo Prof. Domenico Acierno
TRIENNIO 2007/2010

1
Per te mamma
2
Contents
CHAPTER 1: EPOXY RESINS 21
1.1 PROPERTIES AND APPLICATIONS 21
1.2 HARDENERS 23
1.3 TYPES OF EPOXY RESINS 31
1.4 REFERENCES 35
CHAPTER 2: SOL-GEL CHEMISTRY AND PROCESS BACKGROUND 38
2.1 INTRODUCTION 38
2.2 HYDROLYSIS AND CONDENSATION MECHANISM 42
2.3 FACTORS AFFECTING HYDROLYSIS/CONDENSATION REACTIONS 45
2.3.1 Nature of catalyst 45
2.3.2 pH of solution 46
2.3.3 Water 47
2.3.4 Solvent 47
2.3.5 Alkoxide typology 48
2.4 AGGREGATION AND GROWTH OF POLYALKOXYSILANES 49
2.5 GELATION 52
2.6 TRANSITION OF SOL TO GEL: RHEOLOGY ASPECTS 53
2.7 AGEING AND DRYING OF GELS 54
2.8 DENSIFICATION 57
2.9 REFERENCES 60
CHAPTER 3: ORGANIC-INORGANIC HYBRID MATERIALS 63
3.1 INTRODUCTION 63
3.2 TYPES OF ORGANIC-INORGANIC HYBRIDS 65
3.3 INTERPENETRATING POLYMER NETWORKS: PHASE SEPARATION 68
3.4 USE OF COUPLING AGENTS TO MAKE COMPATIBLE ORGANIC AND INORGANIC MOIETIES 72
3.5 STRUCTURE-PROPERTY RELATIONSHIP FOR IPN MATERIALS 75
3.6 EPOXY-BASED HYBRIDS AND NANOCOMPOSITES 79

3
3.7 EPOXY/SILICA HYBRIDS 81
3.8 EPOXY/MMT COMPOSITES 84
3.8.1 Structure of layered silicates 84
3.8.2 Morphologies of Polymer/Silicate Nanocomposites 86
3.8.3 Epoxy–Clay composites 88
3.9 REFERENCES 93
CHAPTER 4: EXPERIMENTAL 98
4.1 MATERIALS 98
4.1.1 Organic components 98
4.1.1.1 Diglycidyl ether of bisphenol-A (DGEBA) 98
4.1.1.2 1,6 hexanediol Diglycidyl ether 98
4.1.2 Siloxane precursors 99
4.1.2.1 Silane Coupling agents 99
4.1.2.2 Tetraethoxysilane (TEOS) 99
4.1.3 Catalyst: Dibutyltin Dilaurate (DBTDL) 99
4.1.4 Inorganic components: Montmorillonite 100
4.1.5 Solvents 10 0
4.1.6 Hardeners 1 00
4.2 SILYLATION REATION OF NA-MMT 100
4.2.1 Powders 100
4.3 PREPARATION OF THE MMT COMPOSITES EPOXY-BASED 102
4.3.1 Sonication mixing (S) 103
4.3.2 Sonication and High Energy Ball-milling (HEBM) mixing (SB) 103
4.4 PREPARATION OF EPOXY-SILICA HYBRIDS 105
4.4.1 Preparation of “Ep-xAP-zSolv-Siy-Sh” hybrids 106
4.4.2 Preparation of “Ep-xAP-ySi-Ol” hybrids 107
4.4.3 Sol-gel in-situ (Ep- xAP-Siy-IS) 108
4.4.4 Preparation of Ep-Siy-Mx hybrids 108
4.4.5 Preparation of Ep-Siy-Je hybrids 110
4.5 CHARACTERIZATION TECHNIQUES 111
4.5.1 Fourier Transform Infrared (FT-IR) analysis 111

4
4.5.2 Gel permeation and chromatography 113
4.5.3 Viscosity measures 114
4.5.4 Differential Scanning Calorimetry (DSC) 115
4.5.5 Dynamic Mechanical Thermal Analysis (DMA) 115
4.5.6 Thermogravimetric Analysis (TGA) 116
4.5.7 Cone calorimeter test 116
4.5.8 Physical and mechanical properties testing (tensile test) 117
4.5.9 Nanoindentation measures 119
4.5.10 Scanning electronic Microscopy (SEM) and Energy Dispersive Scanning
(EDS) 1 20
4.5.11 Wide (WAXS) and Small Angle X-ray Scattering (SAXS) 120
4.5.12 Nuclear Magnetic Resonance (NMR) characterization 123
4.5.13 Molecular Dynamics (MD) analysis 126
4.6 REFERENCES 131
CHAPTER 5: EPOXY/MMT COMPOSITES 134
5.1 SILYLATION REACTION: PRELIMINARY STUDY TO EVALUATE THE EFFECT OF
AMINOSILANES AND PROCESS PARAMETERS ON THE BASAL SPACING OF NA-MMT. 135
5.1.1 Fourier Transform Infrared analysis 135
5.1.2 Thermogravimetric analysis 136
5.1.3 Wide Angle X-ray Diffraction results and Molecular Dynamics predictions 141
5.1.4 Conclusions 14 9
5.2 SILYLATED-MMT EPOXY-BASED NANOCOMPOSITES 150
5.2.1 Wide Angle X-ray Diffraction characterization of both silylated MMT and epoxy-
clay composite. 150
5.2.2 Dynamic Mechanical Analysis of cured Epoxy/MMT Composites 155
5.2.3 Tensile test 160
5.2.4 SEM analysis 167
5.2.5 Nanoindentation analysis 168
5.2.6 Thermogravimetric Analysis 172
5.2.7 Cone calorimeter test 173
5.2.8 Conclusion 17 6

5
5.3 REFERENCES 177
CHAPTER 6: EPOXY/SILICA HYBRIDS 180
6.1 FUNCTIONALIZATION OF EPOXY RESIN WITH APTES 180
6.2 SOL-GEL SHORT HYDROLYSIS (EP-XAP-ZSOLV-YSI-SH) 185
6.2.1 Effect of aminosilane content 185
6.2.2 Effect of 1,6 hexanediol diglycidyl ether 187
6.2.3 Effect of APTES as coupling agent 188
6.2.4 Small Angle X-ray Scattering characterization 188
6.3 SOL-GEL LONG HYDROLYSIS (EP-XAP-SIY-OL) 190
6.3.1 Dynamic Mechanical Analyses (DMA) 192
6.3.2 Small Angle X-ray Scattering (SAXS) 193
6.3.3 Scanning electronic Microscopy (SEM) and Energy Dispersive Scanning (EDS)
19 5
6.3.4 Conclusions 19 5
6.4 SOL-GEL “IN-SITU” (EP-XAP-SIY-IS) 196
6.4.1 Dynamic Mechanical Analyses (DMA) 198
6.4.2 Small Angle X-ray Scattering (SAXS) 200
6.4.3 Scanning electronic Microscopy (SEM) and Energy Dispersive Scanning (EDS)
20 1
6.4.4 Conclusion 20 3
6.5 SOL-GEL PRE-HYDROLYSIS MXDA-BASED HYBRIDS (EP-SIY-MX) 205
6.5.1 Characterization by WAXS analyses 207
6.5.2 Characterization by 29Si-NMR Spectroscopy 209
6.5.3 Characterization by Small Angle X-ray Scattering (SAXS) 212
6.5.4 Scanning Electronic Microscopy (SEM) and Energy Dispersive Scanning (EDS)
21 4
6.5.5 Thermo-gravimetric Analysis (TGA) in air flow. 215
6.5.6 Dynamic Mechanical Analysis (DMA) 216
6.5.7 Nanoindentation experiments 220
6.5.8 Conclusions 22 2
6.6 SOL-GEL PRE-HYDROLYSIS D230--BASED HYBRIDS (EP-SIY-JE) 223

6
6.6.1 Characterization of siloxane precursors solution. 224
6.6.1.1 Nuclear Magnetic Resonance (NMR) 225
6.6.1.2 Gel Permeation Chromatography (GPC) of siloxane precursors mixture 228
6.6.2 Cross-linking reaction of hybrid mixture without the addition of hardener. 229
6.6.2.1 Differential Scanning Calorimetry (DCS) 230
6.6.2.2 Gel Permeation and Cromatography (GPC) 231
6.6.2.3 Fourier Transform-Infrared (FT-IR) 232
6.6.2.4 Conclusions 233
6.6.3 Addition of hardener and characterization during the curing cycle 235
6.6.3.1 Effect of siloxane amount on the crosslinking rate (FT-IR) 235
6.6.3.2 Effect of hardener amine (MXDA and D230) on the crosslinking rate (DSC)
238
6.6.4 Characterization of cured hybrid samples (Ep-Siy-Je) 241
6.6.4.1 Morphology of hybrids (WAXS/SAXS, 29Si-NMR and molecular dynamics
simulations) 241
6.6.4.1.1 29Si-NMR spectroscopy 241
6.6.4.1.2 Wide Angle X-ray Scattering (WAXS) characterization 242
6.6.4.1.3 Small Angle X-ray Scattering (SAXS) characterization and Molecular
Dynamics Simulations 245
6.6.4.2 Flame resistance properties (Pyrolysis/SEM, TGA air and nitrogen flow) 253
6.6.4.3 Mechanical properties (DMA, fracture toughness/SEM) 258
6.6.4.3.1 Dynamic Mechanical Analysis (DMA) 258
6.6.4.3.2 Mechanical test 260
6.6.5 Conclusions 26 2
6.7 EP-SIY-MX AND EP-SIY-JE HYBRIDS: EFFECT OF AMINE HARDENER ON THE HYBRID
STRUCTURE. 264
6.8 REFERENCES 266
CHAPTER 7: CONCLUSIONS AND PERSPECTIVES 271
7.1 EPOXY/MMT COMPOSITES 271
7.1.1 Silylation reaction of Na-MMT. 271
7.1.2 Silylated-MMT epoxy-based nanocomposites 272

7
7.2 EPOXY/SILICA HYBRIDS MXDA BASED (EP-SIY-MX HYBRIDS) 273
7.3 EPOXY/SILICA HYBRIDS JEFFAMINE D230 BASED (EP-SIY-JE HYBRIDS) 274
7.4 COMPARISON BETWEEN EPOXY/SILICA HYBRIDS PREPARED WITH JEFFAMINE D230 AND
MXDA 274

8
List of Figures
Figure 1 - Mechanism of base-catalysed hydrolysis by nucleophilic substitution (R = H, Et or
Si(OR)3) 43
Figure 2 - Mechanism of acid-catalysed hydrolysis by electrophilic reaction 44
Figure 3 - Mechanism of condensation by nucleophilic substitution. 44
Figure 4 - Mechanism of condensation by electrophilic substitution. 44
Figure 5 - Schematic representation of polymerization behavior of silica by sol-gel method [11]
51
Figure 6 - Gel formation in acid (on the left) and basic catalysed systems (on the right) [2] 53
Figure 7 - Drying process. a) the network deforms so easily that little stress is needed to keep it
submerged. b) as the network stiffens the pressure increase and the radius of the pores r
decrease until it is equal to the radius of the meniscus. c) after this 55
Figure 8 - Representation of desiccation of a) acid b) basic–catalysed [2] 56
Figure 9 –Shrinkage and weight loss in a gel during the thermal treatment. 58
Figure 10 - Schematic representation of the several hybrids typologies. The gray circles represent
the monomer of the organic phase while the by-pyramids represent the building blocks of
the inorganic phase. 66
Figure 11 - UCST (Upper Critical Solution Temperature)-type phase diagram 69
Figure 12 - Nucleation and Growth and Spinodal Decomposition mechanisms [3]. 70
Figure 13 - Binodal curve shifting in reacting systems. The molecular weight increases moving
from 1 towards 3. 71
Figure 14 - Schematic representation of the morphology of a co-continuous interpenetrating
network hybrid material. (The shadow area represents the inorganic phase while the
continuous lines represent the polymer molecules) [18] 77
Figure 15 - Morphology model of PPO/SiO2 hybrid where the silica domains are dispersed in the
polymer matrix [18]. 78
Figure 16 - Structure of the 2:1 layered silicates. 85
Figure 17 - Schematic representation of different polymer/silicate hybrid structures. 87
Figure 18 - Schematic working picture of packed column in GPC technique. 113

9
Figure 19 – SAXSess instrument, 2-D SAXS (in the middle) and 1-D SAXS profile (on the
right). 123
Figure 20 - Structure units in terms of Ti and Qi for GOTMS and TEOS, respectively. 125
Figure 21 - Infrared spectra of: (a) A1100; (b) pristine Na-MMT; (c) A1100-MMT obtained from
Procedure 1; (d) A1100-MMT obtained from Procedure 2 135
Figure 22 - DTA curves of pristine Na-MMT, functionalized Na-MMT powders, and Na-
MMT/water and Na-MMT/glycerol pastes 137
Figure 23 - Thermogravimetric analysis of Na-MMT before and after silylation reaction using
two different process parameters: (A) weight losses curve; (B) first derivative of weight
losses curve. The inset shows the peak deconvolutions: (a) pristine Na-MMT; (b) A1100-
MMT obtained from Procedure 1; (c) A1100-MMT obtained from Procedure 2. 140
Figure 24 - X-ray diffraction patterns of Na-MMT before and after silylation reaction with
different aminosilanes. 141
Figure 25 - Equilibrated MD snapshot of the A1100-MMT/option C system (see Scheme 4). 144
Figure 26 - Equilibrated MD snapshot of (A) A1100-MMT/option A, reaction Procedure 1, (B)
A1120-MMT/option A, and (C) A1100-MMT/option A, reaction Procedure 2 systems (see
Scheme 4). 147
Figure 27 - XRD analyses performed on the Na-MMT before and after silylation reaction carried
out using two different process conditions. (a) pristine Na-MMT; (b) A1100-MMT
obtained with Procedure 1; (c) A1100-MMT obtained with Procedure 2. 148
Figure 28 - X-ray diffraction patterns of the pristine and by silylation reaction functionalised Na-
MMT powders. 151
Figure 29 - X-ray diffraction spectra of the uncured pastes A1120-MMT obtained by sonication
and sonication/ball-milling mixing procedure compared with the spectra of A1120-MMT
powder and A1120-MMT 3% SB composite. 152
Figure 30 - Storage modulus and Tan δ versus temperature for epoxy resin and composite with
1% wt of MMT-A1120 obtained by sonication (a) and sonication and ball-milling (b). 156
Figure 31 - Stress-Strain curves of pristine epoxy matrix and of Epoxy/MMT composites a) with
1% wt and b) 3% wt (silicate basis) of various clays: 1) pristine epoxy resin, 2) Na-MMT
S, 3) MMT-A1120 S, 4) MMT-A1100 S, 5) MMT-A1120 SB, 6) Na-MMT SB and 7)
MMT-A1100 SB. S stands for sonication method and SB for sonication-ball milling

10
method. (In the Figures are reported only the stress-strain curves for the samples more
comparable with the average values reported in Table 9) 161
Figure 32 - Elastic modulus of the epoxy-clay composites at various clay content: a) 1% wt and
b) 3% wt (silicate basis). 163
Figure 33 - Tensile strength of the epoxy-clay composites at various clay content: a) 1% wt and
b) 3% wt (silicate basis). 164
Figure 34 - Typical fracture surfaces of epoxy resin (a), MMT-A1120 3% SB (b) and MMT-
A1120 3% S (c) samples at 800 x magnification. 168
Figure 35 - Load–displacement relation of neat epoxy and epoxy-clay composite prepared by
sonication method (method S). 171
Figure 36 - TGA curve in air of pristine epoxy resin and composites with 1% wt (a-b) and 3%wt
(c-d) of Na-MMT, MMT-A1100 and MMT-A1120 prepared with the S and SB method.173
Figure 37 - Heat Release Rate from Cone Calorimeter test for pristine epoxy and composites
materials prepared by sonication method. 174
Figure 38 - FT-IR absorbance peak of epoxide groups during the functionalization reaction at
70°C with APTES. 182
Figure 39 - Epoxide conversion degree with APTES as function of reaction time at 70°C. 183
Figure 40 - Viscosity of epoxy resin during the functionalization reaction at 70°C as function of
reaction time. 183
Figure 41 - : DSC analyses of Ep-5AP-Si5-IS samples obtained varying the functionalization
reaction time at 70°C. 184
Figure 42 - DSC analyses of Ep-5AP-Si5-IS samples obtained varying the functionalization
reaction time at 70°C. 185
Figure 43 - DSC curves of Ep-5AP-10Solv-ySi-Sh, and Ep-10AP-10Solv-ySi-Sh and Ep-30AP-
10Solv-ySi-Sh. 186
Figure 44 - DSC curves of Ep-5AP-0Solv-ySi-Sh and Ep-5AP-10Solv-ySi-Sh. 187
Figure 45 - SEM image of Ep-5AP-10Solv-5Si-Sh hybrid sample. 188
Figure 46 - Log-log plot of Ep-5AP-0Solv-3Si-Sh SAXS profile subtracted of the neat epoxy
scattering contribute. 189
Figure 47 - Dynamic mechanical curves of Ep-5AP-3Si-Sh and Ep-Mx versus the temperature.
193

11
Figure 48 - Log-log plot of Ep-5AP--3Si-Ol SAXS profile subtracted of the neat epoxy scattering
contribute. 194
Figure 49 - SEM image of the Ep-5AP--3Si-Ol hybrid sample. 195
Figure 50 - Dynamic mechanical curves of Ep-5AP-3Si-IS and Ep-Mx versus the temperature.
200
Figure 51 - Log-log plot of Ep-5AP-3Si-IS SAXS profile subtracted of the neat epoxy scattering
contribute. 201
Figure 52 - SEM image of the Ep-5AP--3Si-IS hybrid sample. 202
Figure 53 - Loss factor tanδ curves of Ep-5AP--3Si-IS and Ep-5AP--3Si-Ol versus temperature.
The Ep-Mx curve is shown for comparison. 205
Figure 54 - Ep-Si12-Mx sample picture. 207
Figure 55 - WAXS analyses of Ep-Siy-Mx hybrid samples. In the inset an enlargement of the
lowest q values is reported. 208
Figure 56 -29Si-NMR spectra of Ep-Si12-Mx and Ep-Si20-Mx hybrid samples. 210
Figure 57 - Deconvolution of Ep-Si20-Mx 29Si-NMR spectrum. 210
Figure 58 - SAXS scattering profiles for the Ep-Siy-Mx hybrid samples 213
Figure 59 - SEM images of Ep-Siy-Mx with several siloxane content, namely y=3, 12 and 20. On
the right of each micrograph, the silicium distribution mapping has shown as red spots. 215
Figure 60 - Thermo-gravimetric analyses performed in air flow of both the hybrid samples Ep-
Si12-Mx and Ep-Si20-Mx, and the neat epoxy Ep-Mx. In the inset the derivative curves
with respect to the temperature has been reported. 216
Figure 61 - Dynamic Mechanical properties of Ep-Siy-Mx hybrid and neat epoxy Ep-Mx samples
as Storage Modulus E’ and loss factor tanδ as a function of temperatures. 219
Figure 62 - Glass transition temperature of Ep-Siy-Mx hybrid and neat epoxy Ep-Mx samples as
function of siloxane content. 219
Figure 63 - Typical load-displacement curves of the hybrid Ep-Si12-Mx (a) and pure epoxy resin
(b). 220
Figure 64 - Influence of siloxane content on the hardness and reduced elastic modulus of the Ep-
Siy-Mx samples. 221
Figure 65 – 29 Si-NMR of reaction mixing before 4h at 60 °C. 226
Figure 66 – 1H NMR of reaction mixing after 4h at 60 °C 226
Figure 67 - 29Si NMR of precursors mixing after the hydrolysis reaction at 60°C. 227

12
Figure 68 - GPC results of precursors mixing before and after the hydrolysis reaction at 60°C.
229
Figure 69 - DSC of hybrid mixtures without the addition of the hardener during the curing cycle.
230
Figure 70 - GPC chromatograms related to the hybrid mixture at several step of the curing cycle
without the addition of the hardener. 231
Figure 71 - FT-IR spectra of hybrid mixture (actual silica content 22 wt%) during the curing
cycle at 80°C (a) and the post-curing at 180°C (b). 232
Figure 72 - Conversion degree of epoxide groups belonging to the hybrid mixture (without the
addition of hardener) after the curing cycle at 80 and 180°C. 233
Figure 73 - FT-IR absorption spectra in the range 880-965 cm-1 of Ep-Je sample during the
curing cycle. 237
Figure 74 - Conversion degree of epoxide groups during the curing cycle with Jeffamine D230 of
Ep-Je, EP-Si12-Je and Ep-Si22-Je samples. 237
Figure 75 - DSC thermograms of both the neat epoxy resins and the hybrid samples upon the
addition of the hardener (MXDA and Jeffamine D230). 238
Figure 76 - 29Si-NMR spectra for Ep-Si12-Je and Ep-Si22-Je hybrid samples. 242
Figure 77 - WAXS spectra of Ep-Siy-Je hybrids and Ep-Je neat epoxy. 243
Figure 78 - WAXS spectra of Ep-Je neat epoxy acquired during the curing cycle. 244
Figure 79 - WAXS spectra of Ep-Si22-Je hybrid acquired during the curing cycle. 244
Figure 80 - Structure of a cubic octamer POSS 247
Figure 81 - SAXS spectra of Ep-Si12-Je hybrid acquired during the curing cycle. 248
Figure 82 - SAXS spectra of Ep-Si22-Je hybrid acquired during the curing cycle. 249
Figure 83 - Snapshots extracted from MD calculation of the POSS-epoxy resin systems, when
x=3. (Top) Complete atomistic simulation box; (bottom) zoomed view; (left) different
ammines; (right) same ammine. Color legend: cages are represented in stick and ball style;
oxygen, red; silicon, orange; glycidoxy groups, purple; Jeffamine D230, blue; DGEBA,
green. 252
Figure 84 - Thermo-gravimetric Analyses in nitrogen flow of both the neat epoxy resin Ep-Je and
hybrids samples Ep-Sit-Je. 255
Figure 85 - Thermo-gravimetric Analyses in air flow of both the neat epoxy resin Ep-Je and
hybrids samples Ep-Siy-Je. 255

13
Figure 86 - A) photograph picture; B) optical microscope image and C) SEM image of burned
hybrid sample after the pyrolysis cycle. 257
Figure 87 - Weight losses of several hybrid samples during the pyrolysis experiment. The straight
line of the corresponding colour is related to the expected silica content values. 257
Figure 88 - Dynamic mechanical properties of Ep-Siy-Je hybrid samples, in terms of elastic
moduli and tanδ as a function of temperatures. 260
Figure 89 - Critical stress intensity factor, Kc, and critical strain energy release rate, Gc, as a
function of the silica content. 262
Figure 90 - SEM pictures of fractured surface: a) pure epoxy resin Ep-Je; b) hybrid Ep-12-Je. 262

14
Abstract
The epoxy resins are organic matrices with excellent heat, moisture, and
chemical resistance and good adhesion to many substrates, therefore they are
mostly applied in the field of coatings, adhesives, casting, composites, laminates
and encapsulation of semiconductor devises. However, due to their low
mechanical properties and high coefficient of thermal expansion value compared
with inorganic materials, the epoxy resins cannot meet all the requirements,
especially for the electrical and structural applications such as epoxy molding
compounds. Thus organic/inorganic materials are frequently employed in order
to overcome this limitation. Two separated routes can be followed in order to
prepare these hybrid/nanocomposite materials, either the addition of preformed
inorganic particles, i.e. layered silicates montmorillonite (MMT), or the in situ
growth of siloxane clusters, since both MMT and silica particles are commonly
used for the reinforcement of epoxy matrix to lower shrinkage on curing, to
decrease coefficient of thermal expansion, to improve thermal conductivity and
barrier properties, and to meet mechanical requirements. In order to prepare
epoxy based hybrids/nanocomposites materials, the sol-gel method is widely
used either to modify preformed nanoparticles (i.e. MMT) or to synthesize
siloxane clusters. Therefore, in this study, both organo-siloxane clusters and
silylated MMT by sol-gel method were used to prepare epoxy-based
hybrids/(nano)composites. Considerable attention was given to the use of
coupling agents to make compatible the organic matrix and the inorganic
particles and improve the interfacial interactions providing chemical bonds
between them. In details the surface modification of Na-MMT was done by the
silylation reaction with three different aminosilanes, namely:
15
3-aminopropyltriethoxysilane (A1100);
N-(2-aminoethyl)-3-aminopropyltrimethoxysilane (A1120);
3-[2-(2-aminoethylamino)ethylamino]-propyl-trimethoxysilane (A1130).
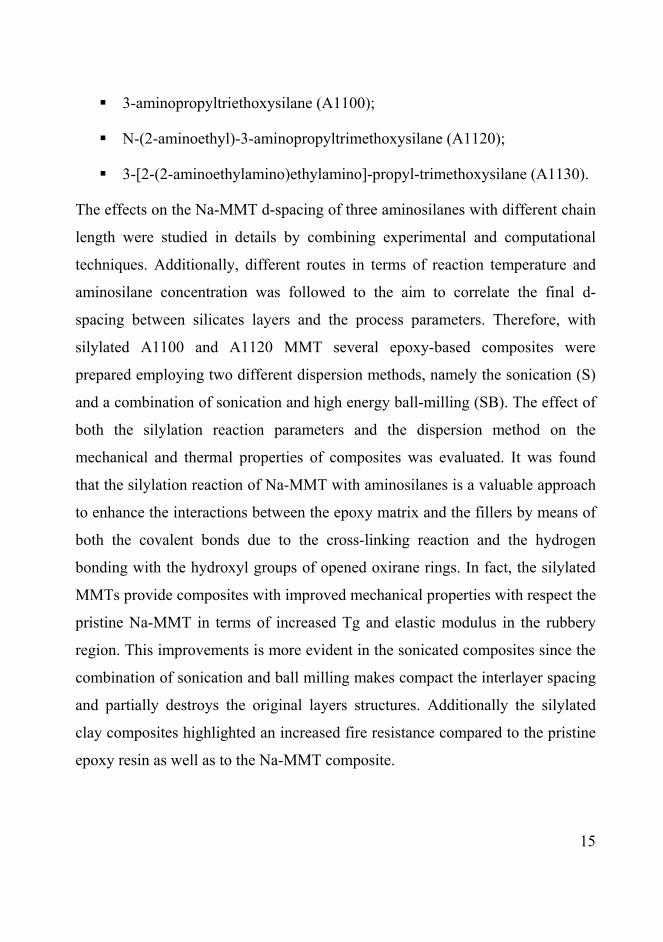
The effects on the Na-MMT d-spacing of three aminosilanes with different chain
length were studied in details by combining experimental and computational
techniques. Additionally, different routes in terms of reaction temperature and
aminosilane concentration was followed to the aim to correlate the final d-
spacing between silicates layers and the process parameters. Therefore, with
silylated A1100 and A1120 MMT several epoxy-based composites were
prepared employing two different dispersion methods, namely the sonication (S)
and a combination of sonication and high energy ball-milling (SB). The effect of
both the silylation reaction parameters and the dispersion method on the
mechanical and thermal properties of composites was evaluated. It was found
that the silylation reaction of Na-MMT with aminosilanes is a valuable approach
to enhance the interactions between the epoxy matrix and the fillers by means of
both the covalent bonds due to the cross-linking reaction and the hydrogen
bonding with the hydroxyl groups of opened oxirane rings. In fact, the silylated
MMTs provide composites with improved mechanical properties with respect the
pristine Na-MMT in terms of increased Tg and elastic modulus in the rubbery
region. This improvements is more evident in the sonicated composites since the
combination of sonication and ball milling makes compact the interlayer spacing
and partially destroys the original layers structures. Additionally the silylated
clay composites highlighted an increased fire resistance compared to the pristine
epoxy resin as well as to the Na-MMT composite.

16
The effect of both the coupling agent and sol-gel process parameters on the
organo-siloxane domains morphology and mechanical properties of epoxy-based
hybrids was evaluated. It was found that the use of large amount of γ-
Glycidoxypropyltrimethoxysilane (GOTMS) as coupling agent represents an
available route to tailor the mechanical and thermal properties of epoxy-based
hybrids samples. In details, we demonstrated that a suitable choice of
functionalized siloxane monomers, amine hardener and reaction conditions leads
to the formation of nano-heterogeneous networks with well-organized cage-like
structures, up to nearly homogeneous bicontinuous systems. In fact under
particular process parameters GOTMS molecules are able to spontaneously
arrange to form structures similar to polyhedral oligomeric silsesquioxane POSS
units with well established architecture. Therefore, as the siloxane amount
increases the number of cages become high enough to make them bonded with
the amine hardener Jeffamine D230. Thus the distance between two
neighbouring cages will be determined only by the length of the amine hardener
which links them. This ordered arrangement highlighted as distance correlation
peak in the SAXS patterns profile of hybrids samples at high siloxane content
becomes responsible of the improved thermal and mechanical properties of
hybrids samples. In particular, the co-continuous organic-inorganic structure is
demonstrated with the achievement of films instead of powders in the pyrolysis
experiments. It also affects the viscous-elastic behaviour causing both the Tg and
the elastic modulus to increase. Moreover the symmetric shape of the loss factor
peak speaks in favour of siloxane structure homogenously dispersed throughout
the organic matrix. Whereas the increase of the Tg’s value highlights the strong
evidence of hindrance the polymeric chains movements during the glass

17
transition. Hence, only the high siloxane content assures the clusters to be
bonded highlighting the improved mechanical properties.
To the best of our knowledge it is the first time such cage-like clusters bonded by
Jeffamine D230 molecules could be detected assuring the Tg to increase without
any phase separation.
Moreover, the effect of two amine hardeners, namely MXDA and Jeffamine
D230 on the inorganic network morphology and then on the mechanical and
thermal properties of hybrid samples was also evaluated. It was found that
MXDA is an organic cross-linker faster than the Jeffamine D230, therefore in the
MXDA-based hybrids the organic grows more rapidly than the inorganic
network, leaving out the GOTMS siloxanes monomers, as the high content of T0
units in MXDA-based hybrids proved. The presence of T0 units is detrimental in
the cured hybrids samples, since it causes a dramatic reduction in Tg values. On
the contrary, in the Jeffamine-based samples the Tg is markedly increased with
respect to the neat epoxy due to their particular organic-inorganic morphology.
In fact the Jeffamine is able to bond two neighbouring siloxane cages building up
a co-continuous organic-inorganic structure, as the siloxane amount increases.

18
Keywords
Sol-gel, organic-inorganic hybrids, MMT-silylation, coupling agent, epoxy-
based nanocomposites, siloxane structures, SAXS, GOTMS, aminosilanes.

19
Acknowledgements
First of all, I would like to sincerely thank the persons who supervised this work,
Dr. Marino Lavorgna and Prof. Giuseppe Mensitieri, for their friendship,
availability and constructive guidance.
I would like to thank Prof. Jocelyne Galy (INSA de Lyon, Ingènierie des
Matériaux Polymère, Laboratoire des Matériaux Macromolèculaires,
Villeurbanne, France ) who hosted me in her laboratory, for her friendship and
precious help during my stage in France.
Moreover, I would like to thank Prof. Sabrina Pricl and Dr. Paola Posocco
(Università di Trieste, Italy) for the dynamic molecular simulations.
I express my deep sense of gratitude to Dr. Fernande Boisson (INSA de Lyon,
Ingènierie des Matériaux Polymère) and Riccardo Spaccini (Università di
Agraria Portici (Na)) for their NMR spectral measurements and valuable
discussions.
I would also like to thank Dr. Giuseppina Barra, Dr. Valentina Romeo and Ms.
Anna Aliberti, for their assistance in the experimental work. I am very grateful.
I wish to express my sincere gratitude to all my friends of laboratory (in Portici
and in Lyon), for the enjoyable time spent together and the interesting scientific
discussions.
Finally, a special thanks to my parents, to Gianluca, Lisa and Chiara, for their
lovely supporting.

20
Epoxy-based Organic-Inorganic Hybrid materials by sol-gel
method: chemical tailoring and multi-scale characterization.
Aims and objectives of the study
Hybrid materials, that include organic and inorganic components intimately
dispersed, have been widely studied in the past but both the in-situ growth and
the chemical modification of the inorganic component to improve the interfacial
interactions are very recent techniques. The primary aim of this project is to
provide the basis for the development of hybrids/nanocomposites epoxy-based,
by using the sol-gel method, giving considerable attention to the use of coupling
agents in both the modification of preformed filler and the in situ synthesis of
siloxane clusters. The ultimate objective is to develop epoxy-based
hybrids/nanocomposites with improved thermal and mechanical properties with
respect to the neat epoxy system.
The interfacial interaction between the organic matrix and the inorganic filler
was allowed by following two routes:
1) Silylation reaction of Na-MMT with different aminosilanes.
2) In situ preparation of siloxane clusters by using TEOS and GOTMS as
precursors.

21
Chapter 1: Epoxy resins
1.1 Properties and Applications
In the field of the organic chemistry, the term “epoxy” is referred generally to
molecule’s functional groups consisting of oxirane rings:
These chemical groups are very reactive. The bond angles C-O-C, O-C-C and H-
C-H in ethylene oxide, for example, have been calculated by electron diffraction
and by microwave spectroscopy to be ~61°, ~59° and ~116°. The former two
values are far below the theoretical bond angles (120°). These strained bond
angles in the ring cause the three-membered ring to be unstable, giving rise to the
high reactivity of these functional groups. The capability of the oxirane group to
undergo a large variety of addition and polymerisation reactions has been
exploited for the production of many different thermoplastic and thermosetting
epoxy resins. Epoxy resins are compounds containing a minimum of two
functional groups so that they can be converted into hard and infusible products
through the formation of networks. In order to convert epoxy resins into hard,
infusible thermoset networks it is necessary to use crosslinking agents, also
referred to as hardeners or curing agents. They may either initiate the curing
reactions through their catalytic activity (catalytic hardeners) or may react with
the epoxy monomer via a polyaddition/copolymerization reaction. The reactivity

22
of the epoxy functionality, due to the strained ring, makes possible the use of a
wide variety of curing agents. These can have a considerable effect on the
properties of the crosslinked products. Epoxy resins were first offered
commercially in 1946 and are now used in a wide variety of industries. What
makes epoxies superior to other resins, are their mechanical and electrical
properties as well as thermal and chemical resistance. These characteristics are
responsible for a large range of applications of epoxy resins as protective
coatings or in structural applications, such as laminates and composites, tooling,
moulding, casting, adhesives and others. In addition to the curing agent in an
epoxy resin formulation, other substances may be employed to modify the
properties of the polymer. Fillers, for example, are the most common additives
used in epoxy formulations to improve mechanical properties, such as modulus
and strength. Solvents, diluents, plasticizers and accelerators, sometimes are
included in the formulation. One of the most important applications of epoxy
resins is for protective coatings, although a decorative function may also be
required in some products. Protective coatings account for nearly 50% of the
total consumption of the epoxy resins in the USA. These products are durable
and provide outstanding adhesion to many substrates (glass, metals, wood). They
may also have a very specialised function, such as corrosion prevention or anti-
fouling properties. Solvent-resistant and corrosion-resistant films can be
obtained, for example, by curing low molecular weight epoxies with aliphatic
polyamines. These products are best suited for marine and maintenance coatings
where corrosion resistance is required. Higher molecular weight, solid epoxy
resins are used in industrial coatings when maximum resistance to solvents and
corrosive agents is required, as for example, in appliances, coil primers and in
automotive body panels. Powder coatings also represent an important segment of

23
the market, which continues to increase at a considerable rate. The need to
develop more specialised coatings for highly aggressive environments such as
nuclear waste management, oil recovery pipes, pulp and paper mills and others,
will provide opportunities to sustain the growth pattern of epoxy resins and
research in this area. The fastest growth over the past decade has been in
laminates and composites. The rapid expansion of the electronics industry has
stimulated the demand for high performance thermosetting resins. In this context
epoxy reins constitute the workhorse encapsulant and underfill agent in the
mounting of chip assemblies to printed circuit boards. Furthermore, the printed
circuit itself is generally an epoxy/glass fibre composite. Composites based on
advanced epoxy matrices find increasing usage in the transportation industry,
particularly in very specialised areas such as in military and commercial aircraft
industry, in aerospace applications, in the marine and automotive sectors, that is
whenever high strength-to-weight ratio and outstanding resistance to extreme
service conditions are required. For instance, epoxy-based composites are the
materials of choice in airframe construction: approximately 60 % of the total
external surface area, or 19 % of the total weight of the US Navy aircrafts
consists of an epoxy- carbon fibre composite [1] The presence of epoxy resin, in
these restricted but highly profitable segments of the market, is growing at a
steady rate, and is expected to increase further in the near future.
1.2 Hardeners
Among the wide variety of hardeners available nowadays, the main types are: a)
aliphatic amines, b) aromatic amines, c) acids and anhydrides.

24
A) The first group includes PACM (para-aminecycloexanemethane), EDA
(ethylenediamine), diethylene triamine (DETA), triethylenetetramine (TETA),
the Jeffamine D230 and Metaxylilene diamine (MXDA).
The structures of the mentioned curing agents are shown below.
The Jeffamine D230 is a polyetheramine characterized by repeating
oxypropylene units in the backbone. As shown, the Jeffamine D230 is a
bifunctional primary amine with an average molecular weight of about 230.

25
The MXDA is widely used as epoxy resin curing agent for civil engineering
adhesives, industrial maintenance coatings for metal, coating for self-leveling
industrial flooring and so on.
It is argued that the reaction rate of primary and secondary aliphatic amines is
faster than cycloaliphatic and aromatic poly-amines, particularly at room
temperature [2].
The simplified reaction between amine and epoxy resins is shown below.
When the epoxy and the amine compounds are multifunctional, the resulting
product is a three-dimensional network, as shown below.

26
It is well known that the presence of hydroxyl-containing compounds
considerably promotes the interactions of epoxy groups with amines and other
nucleophilic reagents [3-6]. The reaction proceeds through a trimolecular
transition state initially suggested by Smith [7-8].

27
Hence, the hydroxyl groups generated during cure accelerate the reaction, which
accounts for the autocatalytic nature of the curing process. Hydroxylic
accelerators or hydrogen donors capable of catalyzing the amine epoxy reaction
in decreasing order of efficiency are: -OH (Ar » PhCH2 > RCH2 > H); - CO2H;
-SO3H; - CONH2; - SO2NH2. Ethylenediamines are highly reactive due to their
unhindered polyfunctional nature [3, 9-12], and give rise to tightly cross-linked
networks owing to the short distance between the active sites. For this reason, the
cured resins exhibit excellent solvent resistance and mechanical strength, but
limited flexibility. The low molecular weight of these hardeners is responsible
for low viscosity, high vapor pressures, making these compounds corrosive,
irritant to the skin and generally toxicologically dangerous. These products are
also hygroscopic and have poor miscibility with epoxy resins [11-12]. A
technique to overcome these limitations, consists in reacting the ethylenediamine
with carboxylic acids. Condensation of the higher homologues of the
ethylenediamine series with dimerised or polymerised unsaturated fatty acids,
leads to the widely used family of curing agents known as polyamides [14-15].
They exhibit different molecular weights, physical form, amine content and
reactivity, but all have low volatility. By adjusting the system's stoichiometry,
the final properties of the cured resins may be varied from hard and rigid at
below stoichiometry to flexible and soft around or above stoichiometry. The
disadvantage of these curing agents is their reduced reactivity, particularly at
room temperature, and their tendency to give rise to greasy products because of
their exudation to the surface. Addition of tertiary amines, phenolic amines or
co-curing agents can help to reduce the severity of these effects [14].
B) To the second group, the aromatic polyamines [16-17], belong a very
important class of hardeners for epoxy resin. Examples are shown below:

28
These are less basic than aliphatic or cycloaliphatic polyamines and react slowly
with the oxirane ring. Therefore they are used for curing processes at elevated
temperatures (heat-cured hardeners) and, even in these conditions, require long
periods to obtain the best results [3, 18-19]. However, all resin systems cured in
this way provide excellent resistance to a wide variety of chemicals, including
organic and inorganic acids, coupled with an outstanding temperature stability,
due to the high values of the glass transition temperature. Therefore these
hardeners are preferred whenever the materials are subjected to severe conditions

29
during their service life. Most of the aromatic amines are solids at room
temperature and, are transformed to liquid substances by melting or by the
formation of eutectic mixtures or less frequently, by blending with liquid
cycloaliphatic polyamines [3, 10-12, 16, 20]. In this class of hardeners, MPD
provides the highest cross-link density and the best solvent resistance [16]. The
low polarity of DDM makes it an excellent curing agent for electrical and
electronic applications. In fact it imparts to the resin elevated electrical insulation
properties, combined with high retention of mechanical properties, even under
conditions of high humidity [17]. DDM is still the most widely used of the
aromatic amines, but it has been recently identified as an animal carcinogen and
potential human carcinogen [21] and, for many applications is being replaced by
other types of curing agents. 4,4'-DDS has the main advantage of providing the
highest temperature stability, it has become the standard curing agent for
specialised epoxy resins in high temperature tooling and high performance
military and aerospace laminating applications [10-11, 22-23]. 3,3'-DDS, despite
its reduced heat resistance compared with its 4,4', analogue, has been adopted in
certain aerospace laminating applications because of its enhanced honeycomb
peel strength [3, 12].
C) Another class of curing agents for epoxy resin consists of carboxylic acids
and their anhydrides. They react at high temperatures and require prolonged
periods to reach completion, but provide resins with good dimensional stability
and insulating and optical properties [11-12, 24-26]. The curing mechanism is
more complex than that of the amines, since a number of competing side
reactions may occur, especially in the presence of accelerators. The uncatalysed
reaction mechanism is initiated by the opening of the anhydride ring by a

30
hydroxyl group present on the epoxy backbone, with the formation of a half-ester
carboxylic acid group. This functionality reacts with an epoxy group to form a
di-ester alcohol, which can continue the polymerization process either by
esterification with another anhydride group or by etherification with an epoxy
ring. The latter reaction is favored and, indeed, in normal conditions only 0.85
equivalents of anhydride are required to provide optimum cross-link densities
and properties. Lewis bases such as tertiary amines and imidazoles are widely
used as anhydride accelerators [27-28]. The mechanism involves the anhydride
ring opening with the formation of internal salts (betaines), which initiate the
curing process. The resulting carboxylate ions react with an epoxy group to form
alkoxide ester, which in turn react with further anhydride molecules to form
carboxylate anion functional esters. Iteration of this sequence leads to the
formation of a cross-linked polyester [29-31].No etherification reactions are
involved in this mechanism. Lewis acids such as BF3-amine complexes, are also
catalysts for the epoxyanhydride reaction, although a fully satisfactory
mechanism remains to be proposed. The most important dicarboxylic acid
anhydrides used as epoxy hardeners are cycloaliphatic, with the notable
exception of phthalic anhydride (PA). PA is the least expensive but has the
disadvantage of being difficult to handle due to its tendency to sublime; its
hydrogenated derivatives hexahydrophthalic anhydride (HHPA) and
tetrahydrophthalic anhydride (THPA) are used extensively for electrical
applications [3, 11-12, 20].

31
HHPA, is a low melting point liquid which does not sublime and forms low
viscosity liquid eutectic mixtures with the epoxy resins. THPA, gives products
with properties very similar to HHPA, but darker in color. The methyl
derivatives of the above compounds also find applications in filament wounding
pipe manufacture, electrical casting, encapsulation and impregnation.
1.3 Types of epoxy resins
This very important class of materials was first discovered by P. Castan [9] in
Switzerland and, independently, by S. Greenlee [32] in the United States in the
early 1940s. The new materials immediately showed very interesting
characteristics and soon after their discovery were patented and commercialised.
The earliest epoxy resins introduced on the market were the reaction products of
bisphenol A and epichlorohydrin and this is still the major route for the
manufacture of the resins, represented by the formula below, available today:

32
A very large number of hydroxyl compounds have been reacted with
epichloridrin to synthesise new epoxy resins but, the most important phenol used
today remains bisphenol A, originally studied by Castan. The more important
precursors currently in use are reported below. Particularly interesting are the
halogenated phenolic compounds that provide improved flame resistance.
1. Bisphenol-A (BPA)
2. Bisphenol-F
3. Bisphenol-S

33
4. Resorcinol
5. Methylolated phenol
6. Novolacs
7. Brominated and fluorinated phenols
34
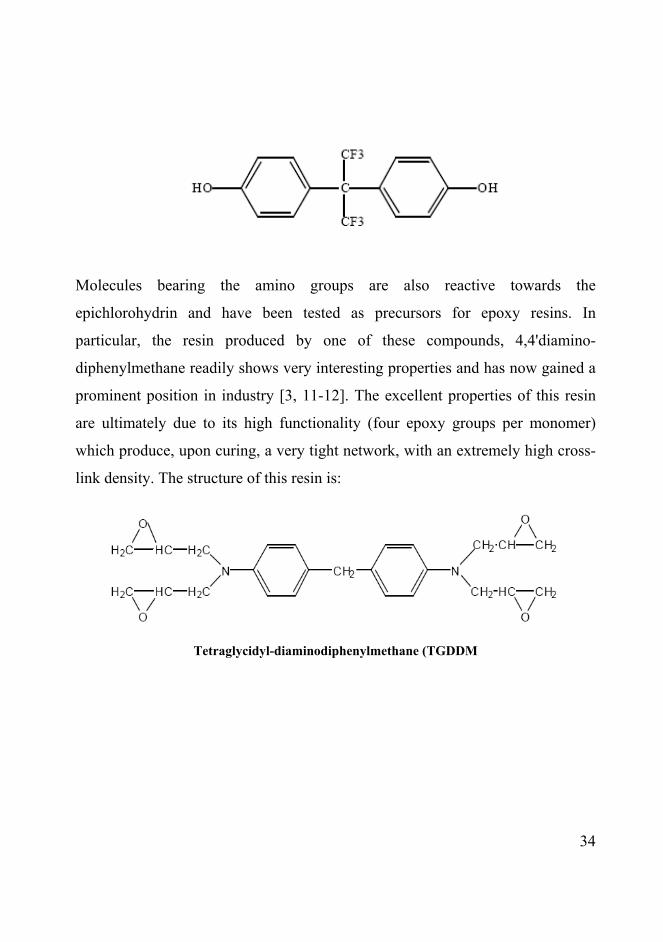
Molecules bearing the amino groups are also reactive towards the
epichlorohydrin and have been tested as precursors for epoxy resins. In
particular, the resin produced by one of these compounds, 4,4'diamino-
diphenylmethane readily shows very interesting properties and has now gained a
prominent position in industry [3, 11-12]. The excellent properties of this resin
are ultimately due to its high functionality (four epoxy groups per monomer)
which produce, upon curing, a very tight network, with an extremely high cross-
link density. The structure of this resin is:
Tetraglycidyl-diaminodiphenylmethane (TGDDM

35
1.4 References
[1] J. P. Halpin; P. P. Pandolfini; P. J. Bierman; T. J. Kistenmaker; L. W.
Hunter; J. S. O'Connor; D. Jablonski; APL Tech. Dig., 18, 1997, 33.
[2] B.A. Rozenberg; "Kinetics, T hermodynamics and Mechanism of
Reactions of Epoxy Oligomers with Amines" in Epoxy Resins, Advances
in Polym. Sci. Ser., K. Dusek Ed., Springer-Verlag, Berlin, 1986.
[3] H. Lee; K. Neville; Handbook of Epoxy Resins, McGraw-Hill, New
York, 1990.
[4] B. A. Rozenberg; N. S. Enikolopyan; Polymer, 25, 1959, 215.
[5] C. A. May; Y. Tanaka; Epoxy Resins. Chemistry and Technology,
Decker, NewYork, 1973.
[6] R. E. Parker; N. S. Isaacs; Chem. Rev., 59, 1959, 737.
[7] I. T. Smith; Polymer, 2, 1961, 95.
[8] L. J. Gough; I. T. Smith; J. Appl. Polym. Sci., 5, 1961, 86.
[9] P. Castan; Swiss Patent 211, 116, 1940.
[10] J. K. Gillham; Encyclopaedia of Polymer Science and Technology,
2nd edn., John Wiley, New York, 1986, pp. 519-524.
[11] C. A. May; Ed., Epoxy Resins, Chemistry and Technology, 2nd. edn.,
Marcel Dekker Inc., New York, 1988.
[12] B. Ellis; Ed., Chemistry and Technology of Epoxy Resins, Blackie
Academic and Professional, Glasgow 1993.
[13] J. C. Cowan; US Patent 2, 450, 940, 1948.

36
[14] V. J. Brytus; Coatings Technology, 58, 1986, 44.
[15] F. Richardson; Pigment and Resin Technology, May 41-43, 1973.
[16] J. Philipson; US Patent 2, 891, 927, 1959.
[17] N. V. Seeger; E. E. Fauser; US Patent 2, 683, 730, 1954.
[18] N. St. John; A. G. George; Polymer, 33, 1992, 2679.
[19] L. Xu; J. R. Schlup; Appl. Spectrosc., 50, 1996, 109.
[20] Ciba-Geigy; Araldite for Surface Coatings, Laboratory Manual,
Ciba-Geigy Plastics, Cambridge, 1988.
[21] Aldrich Catalog of Chemicals, 1997.
[22] R. J. Morgan; E. T. Mones; J. Appl. Polym. Sci., 33, 1987, 999.
[23] J. Mijovic; J. Kim; J. Slaby; J. Appl. Polym. Sci, 29, 1984, 1449.
[24] J. Bàrtova; K. Bily; P. Marek; Crosslinked Epoxies, Sedlacek, B.,
Kahovec, J., Eds., pp.557-562, de Gruyter, Berlin 1987.
[25] W. Fisch; W. Hofmann; J. Koskikallio; J. Appl. Chem., 6, 1956, 429.
[26] W. Fisch; W. Hofmann; Makromol. Chem., 44, 1961, 8.
[27] R. F. Fischer; J. Polym. Sci., 44, 1960, 155.
[28] Y. Tanaka; H. Kakiuchi; J. Polym. Sci., A2, 1964, 3405.
[29] Y. Tanaka; H. Kakiuchi; J. Appl. Polym. Sci., 7, 1963, 1063.
[30] J. Luston; Z. Manasek; M. Kulickova; J. Macromol. Sci., Chem. Ed.,
12, 1978, 995.
[31] M. K. Antoon; J. L. Koenig; J. Polym. Sci., 19, 1981, 549.

37
[32] S.O. Greenlee; US Patent, 2, 717, 885, 1955.

38
Chapter 2: Sol-Gel Chemistry and Process
background
2.1 Introduction
Sol-gel materials encompass a wide range of inorganic and organic-inorganic
hybrid materials which share a common preparation strategy: the sol-gel process.
It involves the generation of colloidal suspensions, “sols”, which are
subsequently converted to viscous gels and then to solid materials. In details, a
sol is a dispersion of colloidal particles suspended in Brownian motion within a
liquid, whose dimensions, ranging between 1 and 1000 nm, are small enough to
ignore the gravity force. The interactions between the particles are dominated by
short-range forces (i.e. Van der Waals and superficial charges). Through the
polycondensation the sol is converted into a gel, which is a continuous solid
structure containing liquid phase. Sol-gel process represents a valid and
environmentally sustainable technology to produce bulk glasses or ceramics at
low costs without melting of the inorganic precursor phases. It is similar to an
organic polymerization in which small molecules form polymeric structures by
the loss of substituents. The fact that small molecules are used as precursors for
the formation of the crosslinked materials implies several advantages, for
example a high control of the purity and composition of the final materials and
the use of a solvent based chemistry which offers many advantages for the
processing of the materials formed. Contrary to many other procedures used in
the production of inorganic materials this is one of the first processes where
ambient conditions were applied to produce ceramics. The control over the

39
preparation of multicomponent systems by a mild reaction method also led to
industrial interest in that process [1].
The sol-gel reaction proceeds by two fundamental chemical reactions: the
hydrolysis of the alkoxides precursors to introduce a reactive hydroxyl group on
the metal and their condensation to form Si-O-Si bonds. These two reactions can
be catalysed by acids or basics. In details, the hydrolysis reaction of metal
alkoxides M(OR)m where M represent Si, Zr,…etc atoms involves the
replacement of alkoxy groups with hydroxyl groups:
M(OR)m M(OH)m-x(OR)x(m-x)H2O .(m-x)R(OH)+ +
For network formation it is necessary that the hydroxyl groups condense with
each other eliminating water according to the scheme:
M OH M OH M O M+ + H2O
The previous two reactions occur simultaneously. Furthermore the presence of
partially hydrolyzed molecules allows the reactions between ≡MOH and ROM≡
groups, releasing alcohol instead of water, according to the following scheme:
M OH M OR M O M+ + ROH
Since alkoxides M(OR)m are not miscible with water, the hydrolysis reaction is
allowed to occur by using a common solvent, usually the parent alcohol ROH.
Then the oxo-metallic network progressively grows from the solution, leading to
the formation of oligomers, oxopolymers, colloids (sols or gels), and a solid
phase. These reactions can be described as SN2 nucleophilic substitutions and
the chemical reactivity of metal alkoxides towards hydrolysis and condensation
depends mainly on the electronegativity of the metal ion and the ability to
increase its coordination number [2-3]. Silicon has a low electrophilicity and

40
remains four-coordinated in the monomeric Si(OR)4 alkoxide precursors as well
as in silica. Thus, silicon alkoxides are not very reactive. Hydrolysis-
condensation reaction rates must be increased using catalyst (acidic, basic or
nucleophilic activation). On the other hand, non-silicate metal alkoxides,
including transition metals, lanthanides and aluminium are much more reactive
than silicon towards nucleophilic reactions. This high chemical reactivity is due
to lower electronegativity of the metal as compared to the silicon, and the metal
atom’s ability to exhibit several coordination states [4]. The coordination
expansion spontaneously occurs when the metal alkoxide reacts with water and
direct addition of water to transition metal alkoxide leads to uncontrolled
precipitation of polydispersed oxide powders. An appropriate choice of the
alkoxide, especially the steric hindrance of the alkoxy groups, and of the solvent
allows the control of the reactivity towards hydrolysis condensation reactions of
M(OR)4 alkoxides. Indeed, the coordination expansion of the metal occurs by
solvation or alkoxy bridging leading to less reactive oligomeric species when the
steric hindrance effects are limited and when the solvent such as the parent
alcohol can solvate the metal [4-5].
The silicon-based sol–gel process is probably the one that has been most
investigated; therefore the fundamental reaction principles are discussed using
this process as a model system. There are several silicon alkoxides
(alkoxysilanes) commercially available, but the most frequently used is
tetraethoxysilane (TEOS). The starting sol-gel mixtures of TEOS typically
consist of the alkoxide, water and a solvent, often ethanol. To the aim to control
the hydrolysis and condensation reactions rates, either an acid or a base must be
used as catalyst [2]. The silicon-based sol–gel processes are the predominant
process also in the formation of hybrid materials, because of the simple

41
incorporation of organic groups into the inorganic network using organically
modified silanes. Si—C bonds have enhanced stability against hydrolysis in the
aqueous media usually used, which is not the case for many metal–carbon bonds,
so it is possible to easily incorporate a large variety of organic groups in the
network formed. Therefore, in addition to tetralkoxysilanes, other categories of
sol-gel precursors include organofunctional alkoxysilanes. Alkyl-substituted
alkoxysilanes or organoalkoxysilanes [2] are useful to modify the polymer
network because of the presence of the non-hydrolysable groups. They are also
used when the introduction of organic matter within the inorganic network is
required. These silanes, known as coupling agents, were originally introduced as
connectors between organic resin matrices and mineral reinforcement, namely
fibres and particulates, to improve bond strength and chemical resistance [6].
The polymer-substrate bond is achieved on one side via the alkoxy component,
which attaches the molecule to the mineral surface through condensation with
pendant silanols and, on the other side, through interactions of the
organofunctional group with the polymer. The occurrence of copolymerisation
reactions at the interphase leads to the formation of interpenetrating networks
(IPNs) [6-7]. To enable the coupling agent to exert its function, the nature of the
organofunctional group is varied according to the chemical nature of the matrix
and the service conditions. For example, an epoxy functionalised silane can be
used in combination with epoxy resins, while a methacrylate silane is suitable for
use with an unsaturated polyester resin [8]. Versatile coupling agents, such as
aminosilanes, on the other hand, can be used with several polymers including
epoxy resins.
Therefore, a large number of variables influence the amount of hydrolyzed and
condensed species and then the structural evolution of silicate polymers: water

42
content, reaction time, nature of the alkoxide, solvent, pH and thermal history.
As a matter of fact, the choice of process parameters affects the microstructure of
the produced gels. Moreover, the sol-gel process involves several stages:
Hydrolysis of the precursors with the formation of hydroxide species;
Condensation with the formation of oxide species;
Gelation with the formation of a “spanning cluster” yielding a
network which entraps the remaining solution;
Ageing with the formation of further crosslinks which change the
structure in pore sizes and pore wall strengths;
Drying with the loss of solvent and the associated development of
capillary stress;
Densification with the collapse of the open structure and formation of
a dense material.
Any of these phases has a great influence on the properties of the resulting
material and the great number of variables involved makes the control of the
whole process still very empirical. Therefore a detailed knowledge of the
chemical mechanisms, which permits the control of the properties of the final
amorphous material at a molecular scale and to synthesize defined structures, is a
great challenge for the material scientists.
2.2 Hydrolysis and condensation mechanism
The hydrolysis reaction involves a nucleophilic attack of the water molecule to
the central silicon atom of the alkoxysilane, followed by a proton transfer from
H2O to an alkoxy group OR, and the exit of an alcohol molecule which is

43
substituted by the OH group. Often acid or basic catalysis is necessary because
of the slow reaction rate of the hydrolysis process.
The hydrolysis mechanisms related to the action of acidic and basic catalysts for
tetraethoxysilane were suggested by Aelion et al [9] and successively elaborated
by Keefer [10].
In the basic mechanism, the reaction proceeds through a nucleophilic
substitution.
OR
RO
Si
RORO-OH + OR
OR
HO
OR
Si
OROR+ -ORHO Si
ORRO-
Figure 1 - Mechanism of base-catalysed hydrolysis by nucleophilic substitution (R = H, Et
or Si(OR)3)
The hydroxide nucleophile coordinates with the silicon, forming a transient
trigonal-bipyramid intermediate; the alkoxide group positioned at the opposite
site leaves the intermediate and reacting with water leads to the renewal of the
catalyst.
In the acidic catalyzed mechanism the hydrolysis reaction takes place as an
electrophilic reaction. The hydronium ion approaches the alkoxysilane molecule
to form an activated complex. Afterwards the water molecule becomes the
entering specie while one alkoxide group positioned at the opposite side becomes
the leaving groups as alcohol.

44
OR
RO
Si
RORO
O
OR
Si
OROR+ HORO+R
RO
Si
RORO
H
H2O:
H
H2O HO
OR
Si
OROR+ H3O+H2O +
H
+
H
+
Figure 2 - Mechanism of acid-catalysed hydrolysis by electrophilic reaction
The condensation reaction takes place as soon as some hydrolyzed precursor
molecules are present in the solution and it occurs at the same time and with the
same reaction path as the hydrolysis, depending on the quantity of water and
catalyst present in solution.
O-
RO
Si
ROROOH
RO
Si
RORO
RO
Si
RORO
OR
Si
RO OR
+ O OH + -OHO
RO
Si
RORO
Si
OROR
OR
_
Figure 3 - Mechanism of condensation by nucleophilic substitution.
Condensation in the pH range 3-12 firstly proposed by Iler [11] is a nucleophilic
substitution reaction, where a protonated silanol is attacked by a deprotonated
silanol (the nucleophile), forming a ≡Si-O-Si≡ bond and displacing a hydroxyl in
the process.
O+H
RO
Si
ROROHO
OR
Si
OROR
+ O + +OH 3
H RO
Si
RORO
Si
OROR
OR
Figure 4 - Mechanism of condensation by electrophilic substitution.
In acid conditions (pH<3), the mechanism of condensation changes from
nucleophilic to electrophilic. The SiOH group available is protonated and
becomes the electrophile.

45
All the hydrolysis and condensation reaction showed are reversible.
2.3 Factors affecting hydrolysis/condensation reactions
2.3.1 Nature of catalyst
The nature of the catalyst determines the relative rates of hydrolysis and
condensation reactions and therefore it affects the typology of gel in terms of
open network structure or dense network structure.
Aelion et al [9] reported that the rate and extent of alkoxide hydrolysis are
greatly influenced by the dissociation constant and concentration of the acid or
base catalyst. In the presence of HCl the hydrolysis rate is proportional to the
concentration of the acid. On the contrary, they found very low rates of reaction
with weak acids.
Regarding the hydrolysis under basic conditions with NaOH catalyst, Aelion et
al.[9] reported a first order kinetics with respect to TEOS in dilute solution,
although at higher concentrations of monomer the reaction was complicated by
the formation of insoluble polysilicates. Weaker bases such as NH4OH and
pyridine were only effective as catalysts at higher concentrations. Also, in
comparison to acid catalyzed hydrolysis, their results revealed a more
pronounced dependence of the base catalyzed hydrolysis on solvent nature.
Matejka et al. [12] have studied the effect of catalysts belonging to three
different classes of catalysts: acid, neutral and basic, TSA (p-toluensulphonic
acid monohydrate), DBTDL (dibutyltindilaurate) and BDMA
(benzyldimethylamine) on the condensation of silanes. The catalyzed TEOS
polymeric structures were studied with SAXS. Basic catalysts lead to typical

46
compact structures, while catalysis by TSA and DBTDL (pH neutral) lead to
more homogeneous structures and more optically transparent gels, similar to
those produced under acid catalysis. This effect is a result of a relatively slower
hydrolysis and monomer consumption with respect to the condensation. The
monomer is available for condensation even at a late stage, in contrast to the acid
catalysis where it is consumed very quickly.
2.3.2 pH of solution
In reactions under basic conditions the hydrolysis steps successive to the first one
are faster, since the silanols ((OR)3SiOH) obtained replacing the alkoxy groups
on the silicon with hydroxyl group are more acidic and so more prone to be
attacked by hydroxide ions [13]. The overall kinetics of the basic catalyzed
process are ruled by the formation of the first silanol because this is the slower
step. The silanols just generated are immediately used up by fast condensation,
leaving no intermediates in the reaction medium [14]. The result of basic
catalysis is an aggregation (monomer-cluster) of highly crosslinked sol particles
to form gels with large pores between the interconnected particles.
Under acid-catalyzed conditions the hydrolysis reaction is speeded up more
efficiently than the condensation reaction producing weakly cross-linked or
linear polymers. Condensation involves the attack of silicon atoms carrying
protonated silanol species by neutral SiOH nucleophiles. The most basic silanol
species are those contained in monomers or weakly branched oligomers so
condensation is limited and a bushy network of weakly branched polymers can
be obtained.

47
2.3.3 Water
According to the theoretical models proposed by Bechtold et al. [15] the
minimum molar ratio water/alkoxide (r) required for hydrolysis to go to
completion is 2. This ratio assures the formation of silicate network Si(O4)1/2,
completely void of hydroxyl groups. Otherwise Yoldas [16] showed that with r
equal to 4 orthosilicic acid is formed, which has a very large intermolecular
separation, and therefore is unable to polymerize.
In practical terms, excess of water (r > 2) is expected to cause an increase in the
rate of hydrolysis compared to condensation [17]. In acidic conditions,
hydrolysis predominates and goes to completion, leading to a decrease in the
content of intermediates and to the development of a more cross linked polymer
[18]. This behaviour justifies the formation of chain-like aggregates because
under low water conditions the condensation of hydrolyzed monomer (whose
product is water) is inhibited by a shift of the condensation equilibrium in favour
of the reverse reaction, consequently encouraging further hydrolysis [19].
The effects of water in basic conditions are not dissimilar to those for acidic
conditions. An excess of water affects hydrolysis more than condensation.
2.3.4 Solvent
An important factor in sol-gel reactions is the type of solvent used. It affects the
rates of hydrolysis and condensation and, consequently, also the structural
development of the polysiloxane domains. Several types of solvents have also
been used such as polar protic, (H2O, methanol and formamide), polar aprotic,
(DMF, THF and acetonitrile), and non-polar aprotic, (dioxane).

48
The polar aprotic solvents inhibit the condensation reactions by deactivating the
nucleophile through H-bonding and salvation [20]. Non-polar aprotic solvents,
on the other hand, cannot impede the condensation process because they offer no
possibilities of either H-bonding or solvation on the negatively charged ions.
Alcoholic solvents, such as ethanol (EtOH) and propanol (PrOH) form
azeotropic mixtures with water. The azeotrope, which has a higher vapour
pressure than each single component, evaporates first and leaves behind either
water or alcohol (depending on their initial amount). If the alcohol is in excess,
silanols re-esterify and the water produced is readily removed as part of the
azeotrope, thus driving the reverse alkoxylation reaction to completion.
Therefore, because the hydrolysis reaction is thermodynamically favourable, the
composition of the sol-gel solution should be optimized in order to ensure that
water (and not the alcohol) evaporates last [21].
2.3.5 Alkoxide typology
Aelion et al. [9] determined that the rate of hydrolysis decreases with the
increasing of the length of the alkyl radical explaining the result as an increase of
steric impediment of the longer alkoxy. Condensation is also affected by the
nature of the alkyl radical, since the mobility of intermediate species having long
non-hydrolysed groups attached to them, is reduced.
The network structure depends strongly on the functionality of the monomer.
This parameter represents the number of alkoxide groups which are potentially
leaving groups. If, indeed, the functionality is equal to 2 such as in structures like
R’2Si(OR)2 only linear or ring aggregates are formed. When the functionality is
equal to 1 as in structure like R’3SiOR it is impossible to produce chain
aggregates because the monomers behaves as chain terminators. To obtain high

49
density network it is important to have monomers with functionality equal to 3 or
4. In this case through the condensation process it is possible to connect densely
the monomers and generate colloidal aggregates.
2.4 Aggregation and growth of polyalkoxysilanes
In the reports of Keefer [13], the silicates formed under either basic or acid
conditions, are described as fractal in nature. Fractals are structures resulting
from random growth processes. They have dilational symmetry and because of
this, their appearance remains unchanged after magnification. In mass fractals,
the volume occupied grows faster than the mass that generates it. Surface
fractals, on the other hand, are highly complex structures with a surface area that
increases with mass at a faster rate than normal (Euclidean) objects. Fractal
dimensions, in silicate systems, may be determined by X-ray, neutron or light
scattering measurements, while the growth of domains can only be simulated by
computer models. Typically, fractal geometry describes silica structures on the
basis of the relative rates of hydrolysis and condensation [13]. For base-catalyzed
reactions, using the poisoned Eden model (a reaction-limited monomer-cluster
aggregation model), structures range from non-fractal (at high water
concentrations), to colloidal (with fractally rough surfaces), to true fractal
(polymeric) (at lower water concentrations). In acid-catalyzed systems, where
the small particles involved tend to form branched polymers that grow by
polymer-polymer interactions, the resultant structures are shown to be true
fractal by the RLCA (Reaction Limited Cluster-cluster Aggregation) model. The
idea that silicic acid monomer can polymerize into siloxane similarly to organic
polymers, is rejected by Iler [11]. His classical theory of polymerization of silica
[11] involves polymerization of the monomer to first form particles, which then

50
grow and coalesce with other particles to form weak-lace type of structures. At
concentrations above the solubility limit of silica (100-200ppm), Si(OH)4
polymerizes by condensation at rates controlled by either the concentrations of
OH- or H+ ions in the way discussed previously. The tendency to form ≡Si-O-Si≡
bonds at the expense of silanol groups, leads to the formation of cyclic structures
and their subsequent growth by addition of monomer into large three-
dimensional polymers. These internal condensation reactions produce compact
entities with pendant silanol groups for subsequent growth. Particle size at this
point is important because it determines the radius of curvature of the surface
that controls the solubility of the particle. Solubility is also determined by the
degree of condensation within the particles. The largest and most condensed
particles, survive and continue to grow by the Ostwald ripening mechanism. At
pH > 7, where silica dissolution and redeposition rates are high, this activity
leads to particles of colloidal dimensions. At high pH up to 10.5 and moderate
solution concentrations, negative charges on particles cause mutual repulsion and
growth without aggregation. This is in agreement with results of Aelion et al. [9].
High temperature has a similar effect, since accelerated growth leads to a small
number of larger-sized particles [11, 22]. Charges may be reduced by the
addition of a coagulant (for example, Na+ ion of a salt such as Na2SO4 or NaCl)
in which case aggregation can occur. At too high salt concentrations,
precipitation is observed. At low pH, where the rate of polymerisation (and
depolymerisation) is slow, particles are very small in size and further growth is
discouraged. Under these conditions, the tendency to form networks rather than
oversized particles is more pronounced. This effect is due to the low ionic charge
on particle surfaces, which allows higher rates of interparticle collisions.
Therefore, at a 'high' concentration of SiO2 >1%, aggregation of very small

51
particles is possible. At pH levels ranging from 5 to 6, there is a rapid
simultaneous formation and aggregation of particles, so that the networks formed
contain both oligomeric and polymeric species [11]. The above processes and the
effects of pH are shown in Figure 5.
Figure 5 - Schematic representation of polymerization behavior of silica by sol-gel method
[11]
Aggregate particles attach to each other through siloxane bonds. These bonds
result from the condensation of surface silanol groups and Si-O- ions at the point
of contact between the particles. The negative curvature at the point of
interparticle contact accounts for the very low local solubility. This pushes the
process of further bonding through fast monomer deposition [11]. The hydrogen
bond plays an important role because of its link between silanol and siloxane
groups of the particle surfaces, directly or through water molecules. H-bonding
will be present even up to advanced stages of aging and desiccation [23]. The

52
process of chain and branch forming is only present in those systems that prevent
excessive growth by keeping repulsive charges to low levels. At pH 2, the
overall net charge is zero (due to the occurrence of the isoelectric point of silica),
but the polymerization is still possible. It is hypothesized by Iler [11] that the
negative charge on Si-O- ions, presumably involved in the initial reactions
between surface species, is counterbalanced by the positive charge on H+ ions
present in the polymerising medium.
2.5 Gelation
The gelation occurs when the repulsive charges located on the surface of
siloxane aggregates are low enough to allow aggregation and growth. This
condition depends on the pH level. As a result of aggregation into three-
dimensional networks, an increasing fraction of the sol becomes occupied by
micro gel regions [11]. These regions have the same refractive index and density
as the surrounding sol, which explains the transparency of the system.
Before the gelation point and under acidic conditions, the precursor of the gel
consists of linear or randomly branched polymers, while, under basic conditions
this is made up of individual highly branched clusters. At the gelation point,
linear chains become entangled while branched clusters impinge on each other
[24]. (see Figure 6). The viscosity at this stage increases asymptotically and a
transparent gel is formed.

53
Figure 6 - Gel formation in acid (on the left) and basic catalysed systems (on the right) [2]
2.6 Transition of sol to gel: rheology aspects
Several approaches have been taken to define the gel point. Arbitrary parameters
such as the point of no fluidity [11, 25] are useful measures of gel time, but are
not very accurate, and therefore, they cannot give information about viscosity
changes taking place. This information, on the other hand, can be accurately
provided by rheological measurements. Several authors have reported that the
sol-gel transition of acid-catalyzed TEOS solutions takes place in three stages
[26-27]. In the first stage, the sol exhibits Newtonian behaviour, so that the
viscosity is independent of the shear rate imposed by the measuring instrument.
Although the monomer is polymerizing, the formation of aggregate is not
dominant and therefore the increase in viscosity is small. During the second
stage, a steady increase in viscosity is observed due to the formation of linear

54
polymers, and at the third stage, a more pronounced increase in viscosity occurs
as a result of the formation of three-dimensional networks.
2.7 Ageing and drying of gels
Although the increase in viscosity which accompanies the gelation freezes the
systems in a particular structure, after the gel point this frozen-in structure may
change appreciably with time depending on the temperature, solvent and pH
conditions. The effect of this process, known as ageing [16], consists of
shrinkage and stiffening of the material.
The changes in gel structure which can originate from the early stages of its
formation are:
Gel separation into regions of high and low density because, as the
gel point is approached, fluctuations in density grow larger and
larger throughout the system;
Promotion of additional crosslinking as un-reacted terminal groups
(OH and OR) come in contact in regions of higher density;
Acceleration of the phase separation process and creation of liquid-
solid interfaces (syneresis);
Starting with polymer gels it is expected that the removal of solvent brings
shrinkage due to additional cross-linking as un-reacted hydroxyl and alkoxy
groups come in contact. The drying process is very important and many of the
structural properties of the resulting solid material (i.e. density, elastic
properties) depend on the evolution of the system during this phase.

55
Considering a gel as a network that include a liquid phase (see Figure 7), it is
obvious that there is a high interfacial area with a great free energy associated.
The decreasing of this energy is the driving force that leads the system to the
shrinkage phenomenon.
Figure 7 - Drying process. a) the network deforms so easily that little stress is needed to keep it submerged. b) as the network stiffens the pressure increase and the radius of the
pores r decrease until it is equal to the radius of the meniscus. c) after this
The evaporation of the liquid from the gel surface, in fact, increases the
vapour/solid interface, which has even a greater energy. For this reason the liquid
flows from the bulk of the gel to the surface, to cover the dried surface. Because
of the evaporation the liquid cannot cover the whole surface without the creation
of a meniscus on the pore surface.

56
The capillary force exerted by the liquid causes the contraction of the solid
phase, until the radius of the meniscus is equal to the radius of the pore. At this
stage the shrinkage proceeds at a constant rate, and the contraction of the solid
phase is equivalent to the volume of the evaporated liquid. After this point the
evaporation of the liquid continues moving the liquid-vapour interface towards
the bulk of the solid phase leaving a dry solid. This results in an irreversible
contraction, because of the further condensation of the un-reacted hydroxyl or
alkoxy groups that proceeds during the shrinkage process.
The drying of the gel also produces a pressure gradient in the liquid phase, which
leads to differential shrinkage of the network. If the external part shrinks faster
than the internal one, tensile stresses arise that tend to fracture the network. The
formation of cracks is energetically favourable because at either side of the crack
the material can contract more freely. To avoid this phenomenon, a slow
evaporation rate of the solvent is required.
Figure 8 - Representation of desiccation of a) acid b) basic–catalysed [2]

57
Gels characterized by high density and low pore volume can be formed in
weakly crosslinked systems when the rate of condensation is low compared to
the rate of solvent removal. Under these conditions the gel’s structure can be
highly compacted before it is sufficiently crosslinked to be resistant to the
densification process. Therefore, as a principle, low pH and low water contents
produce dense gels whereas high pH (6 - 10) and high water contents produce
gels of high porosity (see Figure 8).
Since large pores lead to lower surface extension and provide wider paths for the
evaporation of volatile molecules, the systems obtained through basic catalysis
develop lower drying stresses and are less susceptible to fracture [28].
The function of substances such as dimethylformamide [29] as drying control
chemical additives is to regulate the relative rates of hydrolysis and
condensation, so that larger particles of uniform size are formed. During ageing,
a tight size distribution of large pores is achieved that facilitates the expulsion of
volatiles, keeping capillary stresses at a safe level [30].
2.8 Densification
The last part of the sol-gel process involves the densification of the dry gel
structure to give a glassy material or polycrystalline solid. This evolution of the
system occurs under high temperature, and both time and temperature of the
thermal treatment can influence the characteristics of the resulting solid material.
The transformations involved in this phase of the process are:
capillary shrinkage;
condensation;

58
structural relaxation;
viscous sintering.
The fast evaporation of water and other organics during the thermal treatment
causes often the presence of cracks and other structural imperfections. The
weight loss and the shrinkage in this phase are not linear and behave differently
depending on the temperature, as it is reported on the graph below (Figure 9).
Figure 9 –Shrinkage and weight loss in a gel during the thermal treatment.
In the first region a small contraction is observed for a great weight loss. The
weight loss is due to the evaporation of the water and alcohol still present inside
the gel network. The small contraction is due to the increase of the surface
energy owing to desorption of the liquids. In the second region the contraction
Figure 1 - Shrinkage and weight loss in a gel during the thermal treatment7.

59
and the weight loss occur with similar rates. The weight loss is due to the water
formed as by-products of the condensation and to the removal of organics, while
the contraction is due to a further condensation and to the structural relaxation
due to the temperature. In the third region there is contraction without further
weight loss, because of the material moves by viscous flow or diffusion to
eliminate porosity. The sintering of gels, because of their great interfacial area,
can be conducted at temperatures exceptionally low compared to those used for
the sintering of ceramic materials. This aspect can be exceptionally interesting
with respect to the production of hybrid materials where the presence of an
organic phase prevents the utilization of very high temperatures [2].

60
2.9 References
[1] Hybrid Materials. Synthesis, Characterization, and Applications .
Edited by Guido Kickelbick Copyright © 2007 Wiley-VCH Verlag
GmbH & Co. KGaA, Weinheim.
[2] J. Brinker; G. W. Scherrer; Sol-gel Science. The Physics and
Chemistry of Sol-Gel Processing, Academic Press, San Diego, CA. 1990.
[3] J. Livage; M. Henry; C. Sanchez; Prog. Solid State Chem., 18, 1988,
259-431.
[4] C. Sanchez; F. Ribot; New J. Chem., 18, 1994, 1007-1047.
[5] M. Nabavi; S. Doeuff; C. Sanchez; J. Livage; J. Non-Cryst. Solids ,
121, 1990, 31-34.
[6] E. P. Plueddemann; Silanes and Other Coupling Agents , K.L. Mittal
(eds.), VSP, Utrecht, 1992, pp.3-19.
[7] G. Tesoro; Y. Wu; Silanes and Other Coupling Agents , K.L. Mittal
(eds.), VSP, Utrecht, 1992, pp.215-228.
[8] P. G. Pape; E. P. Plueddemann; Silanes and Other Coupling Agents,
K.L. Mittal (eds.), VSP, Utrecht, 1992, pp.105-116.
[9] R. Aelion; A. Loebel; F. Firich; J. Am. Chem. Soc., 72, 1950, 5705.
[10] K. D. Keefer; Better ceramics through chemis try, Mat. Res. Soc.
Symp., Vol. 32 (Eds.: C. J. Brinker, D. E. Clark, D. R. Ulrich), Elsevier,
Pennsylvania, pp. 15, 1984.

61
[11] R. K. Iler; The chemistry of s ilica, Wiley, New York, 1979. Chapter
2, 3.
[12] L. Matejka; K. Dusek; J. Plestil; J. Kriz; F. Ledniky; Polymer, 40,
1998, 171-181.
[13] K. D. Keefer; Advances in Chemistry Ser ies, Vol. 224 (Eds.: J. M.
Ziegier, F. W. G. Fearon), Am. Chem. Soc., Washington DC, pp. 227-
240, 1990.
[14] R. A. Assink; B. D. Kay; Polym. Preprints, 32, 1991, 506.
[15] M. F. Bechtold; R. D. Vest; L. J. Plambeck; J. Am. Chem. Soc. , 90,
1968, 4590.
[16] B. E. Yoldas; J. Non-Crystalline Solids,, 83, 1986, 375.
[17] C. J. Brinker; K. D. Keefer; D. W. Schaefer; J. Non-Crystallin e
Solids, 48, 1982, 47.
[18] J. Sanchez; McConnick; Chem. Proc. of Adv. Mater. , Wiley, New
York, pp. 43, 1992.
[19] S. Sakka; H. Kozuka; S. Kim; Ultrastructure. Proc. of Adv. Cer.
(Eds.: J. D. McKenzie, D. R. Ulrich), Wiley, New York, pp. 159, 1988.
[20] I. Atraki; T. W. Zerda; J. Jonas; J. Non-Crystalline Solids, 81, 1986,
381.
[21] J. Cihlar; Colloids and Surfaces A, Phys. Eng. Asp. 70, 1993, 239.
[22] R. K. Iler; J. Col. Interf. Sci., 75, 1980, 138.
[23] K. Nassau; K. Raghavachad; J. Non-Crystalline Solids, 104, 1988,
181.

62
[24] C. J. Brinker; G. W. Scherer; J. of Non-Crystalline Solids, 70, 1985,
301.
[25] M.F. Bechtold; W. Mahier; R.A. Schunn; J. Poly m. Sci. Polym.
Chem. Ed., 18, 1980 2823.
[26] R. Xu; J.A. Pope; J.D. Mackenzie; J. Nan-Crystalline Solids, 106,
1988, 242.
[27] M. D. Sacks; R. S. Sheu; J. Non-Crystalline Solids, 92, 1987, 383.
[28] M. Yamane; S. Aso; T. Sakaino; J. Mat. Sci., 13, 1978, 865.
[29] T. Adachi; S. Sakka; J. Mat. Sci., 22, 1987, 4407.
[30] L. L. Hench; G. Orcel; J. Non-Crystalline Solids, 82, 1986, 1.

63
Chapter 3: Organic-Inorganic Hybrid
Materials
3.1 Introduction
It is well known that organic polymers usually have some superior characteristics
with respect to their toughness, flexibility and processability. On the other hand,
inorganic materials have high heat resistance and good mechanical and optical
properties. Since many of the well-established materials, i.e. metals, ceramics or
plastics, cannot fulfill all technological desires, a new class of materials had to be
tailored. In regards to projecting new materials, scientists and engineers realized
early that mixtures of materials could show superior properties compared with
their of pure counterparts. The simplest way to realize such a composite is to
incorporate, for instance, inorganic particles into a polymeric matrix, the
resulting materials showing improved properties if compared to the neat organic
ones. They combine the advantages of the inorganic material (e.g. rigidity,
thermal stability) and the organic polymer (e.g., flexibility, dielectric, ductility,
and processability). Nowadays, the organic-inorganic materials are regularly
used for lightweight materials with advanced mechanical properties, for example
in the construction of vehicles of all types or sports equipment. Soon it became
evident that decreasing the size of the inorganic units to the same level as the
organic building blocks could lead to more homogeneous materials that allow a
further fine tuning of materials’ properties on the molecular and nanoscale level,
generating novel materials that either show characteristics in between the two
original phases or even new properties. However, it is worth noting that the

64
origin of hybrid materials did not take place in a chemical laboratory but in
nature. In fact, many natural materials consist of inorganic and organic building
blocks distributed on the (macro)molecular or nanoscale. Furthermore, a
complex hierarchical order of construction from the nanometer to the millimeter
level is regularly found in nature, where every size level of the specific material
has its function which benefits the whole performance of the material.
Furthermore these different levels of complexity are reached by soft chemical
self-assembly mechanisms over a large dimension, which is one of the major
challenges of modern materials chemistry. Therefore, hybrid materials or even
nanotechnology is not an invention of the last decade but was developed a long
time ago. Talking about nanotechnology and nanomaterials, it is necessary first
of all to make clear the terms “hybrids” and “nanocomposites”. Commonly the
term “hybrids” is more often used if the inorganic units are formed in situ , for
instance by the sol-gel process [1]. According to this approach both the organic
and the inorganic phases are formed together through the simultaneous
polymerization of an organic monomer and sol-gel precursors of the inorganic
domains. Meanwhile, use of the word “nanocomposites” implies that materials
consist of various phases with different compositions, and at least one
constituent phase has one dimension less than 100 nm, i.e. nanotubes, layered
silicates as montmorillonite (MMT), nanoparticles of metals or metal oxides, and
so forth [1]. A gradual transition is implied by the fact that there is no clear
borderline between “hybrids” and “nanocomposites”. There are several routes to
prepare organic-inorganic hybrids/nanocomposites including intercalation,
electrocrystallization, dispersion of preformed particles, sol-gel process, etc. In
particular, the sol-gel process with its unique mild processing characteristics and
easiness of control is the most common method for preparing hybrid materials.

65
This process is similar to an organic polymerization starting from molecular
precursors resulting in a bulk material. Contrary to many other procedures used
in the production of inorganic materials, this is one of the first processes where
ambient conditions, i.e. low reaction temperature, were applied to produce
ceramics. The control over the preparation of multicomponent systems by a mild
reaction method also led to industrial interest in that process. In particular the
silicon based sol–gel process was one of the major driving forces what has
become the broad field of inorganic–organic hybrid materials. The reason for the
special role of silicon was its good processability and the stability of the Si—C
bond during the formation of a silica network which allowed the production of
organic-modified inorganic networks in one step.
3.2 Types of organic-inorganic hybrids
Depending on the strength or level of interaction two kinds of organic-inorganic
hybrid materials can be obtained. In particular Class I hybrid materials are
characterized by weak interactions between the two phases (i.e. van der Waals or
hydrogen bonds), whereas Class II hybrids evidence strong chemical interactions
(i.e. covalent bonds) between the components.
Blends are formed if no strong chemical interactions exist between the inorganic
and organic building blocks (see Figure 10 (a)). If an inorganic and an organic
network interpenetrate each other without strong chemical interactions,
interpenetrating networks (IPNs) are formed (Figure 10 (b)) which is for
example the case if the sol-gel material is formed in presence of an organic
polymer or vice versa. Both materials described belong the Class I hybrids.

66
Class II hybrids are formed when the discrete inorganic building blocks, e.g.
clusters, are covalently bonded to the organic polymers (Figure 10 (c)) or
inorganic and organic polymers are covalently connected with each other (Figure
10 (d)).
Blends Interpenetrating networks
Buildings blocks covalently connected
Covalently connected polymers
Class I
Class II
Figure 10 - Schematic representation of the several hybrids typologies. The gray circles represent the monomer of the organic phase while the by-pyramids represent the building
blocks of the inorganic phase.

67
Because of the gradual change in the strength of chemical interactions it becomes
clear that there is a steady transition between weak and strong interactions
(Scheme 1).
Scheme 1 - Selected interactions typically applied in hybrid materials and their relative strength.
According to the previous classification in this work only epoxy based
hybrid/nanocomposite materials of Class II were prepared.

68
3.3 Interpenetrating Polymer Networks: Phase
separation
The morphologies and the properties of the hybrid materials depend on the
mechanism and the kinetic of separation between organic and inorganic phases.
In particular this effect is much more pronounced for the systems where the
inorganic phase is produced starting from a precursor solution (hybrids). In this
case the formation of the hybrids involves the formation of the inorganic matrix
in presence of the preformed polymer or a mixture of reacting monomers and the
resulting morphology can be strongly affected by eventual mechanism of phase
separation.
The thermodynamics of a solution containing polymerizing species tells us that
mutual solubility among the constituents becomes lower as the average
molecular weight of the polymerizing species increases. This is mainly due to the
loss of entropy of mixing among the constituents, which leads to the increase of
the free energy of mixing:
STHG Δ−Δ=Δ
The reduction in mutual solubility caused by polymerization can be contrasted
by cooling the system. The free energy of mixing is increased by lowering the
temperature. A multicomponent system becomes less stable as the absolute value
of the TΔS term decreases. In some cases, changes in the polarity of oligomers
with the generation and/or consumption of silanol groups may contribute to
increase the ΔH term, which will also destabilize the system against

69
homogeneous mixing. However when the sign of free energy of mixing of the
system becomes positive, the thermodynamic driving force for phase separation
is generated.
It has often been suggested that phase separation in hybrids takes place by
spinodal decomposition [2].
Figure 11 - UCST (Upper Critical Solution Temperature)-type phase diagram
The scheme in the Figure 11 represents a UCST (Upper Critical Solution
Temperature)-type phase diagram. The solid curve is known as the binodal and it
denotes the border between the thermodynamically stable, single-phase region,
from the two-phase region. The dashed curve is known as the spinodal curve and
it separates the unstable from the metastable phase-separated region. Two–phase
morphologies result by bringing the solution from the single phase region into

70
the two-phase region by a quenching process equal to a temperature drop of T0-
T. The solution de-mixes, separating into two distinct equilibrium phases of
composition φI and φII. With time, the initial co-continuous phase will be lost to
produce a particulate structure where the particles formed are small and uniform
in size. Phase continuity may be preserved by rapid cooling, which freezes the
morphological features, before the formation of macroscopic domains occurs.
A quenching process into the metastable region (line iii in the Figure 11), brings
about phase separation by a mechanism known as Nucleation and Growth (NG),
where isolated particles having the equilibrium compositions, appear
spontaneously and grow to yield an irregular particle dispersed morphology with
a wide distribution of the domain size.
Figure 12 shows a schematic representation of the two phase separation
mechanisms: Nucleation and Growth and Spinodal decomposition, as reported
by Nakanishi [3].
Figure 12 - Nucleation and Growth and Spinodal Decomposition mechanisms [3].

71
Phase separation between the two components can also take place by a reaction-
induced mechanism. In this case the driving force for phase separation arises
above a certain molecular weight limit, due to the loss of miscibility between the
components. Despite the process goes on isothermally, the quench depth (the
difference between T0 and T) decreases with the molecular weight as a result of a
progressive shift of the binodal, as shown in the Figure 13.
Figure 13 - Binodal curve shifting in reacting systems. The molecular weight increases moving from 1 towards 3.
The diagrams in Figure 11 and Figure 13 can be also used to describe the de-
mixing process when the hybrid materials are obtained by casting procedure. In
this case the process proceeds isothermally so it is important verify that the
casting temperature is above the UCST (upper critical solution temperature) line
to avoid phase separation. In reacting systems such as sol-gel systems where
silica is growing according the hydrolysis and condensation reactions it is
important the upper shift of the UCST line does not cross the isotherm casting

72
temperature. This represents the necessary condition to produce an
Interpenetrating Network Polymer with co-continuous phases. Furthermore the
phase separation between organic and inorganic components can be also tailored
by using compatibilizating molecules, usually known as coupling agents.
3.4 Use of coupling agents to make compatible organic
and inorganic moieties
The transition from the macroscopic world to microscopic, nanoscopic and
molecular objects leads, beside the change of physical properties of the material
itself, i.e. the so called quantum size effects, to the change of the surface area of
the objects. While in macroscopic materials the majority of the atoms is hidden
in the bulk of the material it becomes vice versa in very small objects, hence the
surface becomes really important when objects become very small. In small
nanoparticles (<10nm) nearly every atom is a surface atom that can interact with
the environment. One predominant feature of hybrid materials or
nanocomposites is their inner interface, which has a direct impact on the
materials’ properties. A strong interaction between the inorganic nanoparticles
and the organic matrix can avoid possible phase separations, which would reach
several hundred nanometer length scale leading to materials often opaque.
Effects like this are avoided if the reaction parameters are controlled in such a
way that the speed of network formation is kept faster than the phase separation
reactions. To reduce the tendency of macroscopic phase separation, often caused
by the thermodynamic incompatibility of the components, the existence of
covalent bonds between organic and inorganic components or strong
intermolecular interactions like extensively hydrogen bondings is essential.
Therefore, one or both the organic and the inorganic components have to be

73
modified, in order to render them compatible with each other. This modification
consists of adding to either the organic or the inorganic component, functional
groups similar in nature of the other constituent. Such modifiers are also known
as coupling agents. In the silica-based hybrid materials silane coupling agents are
the most used type of modifier agents. They generally have hydrolyzable and
organofunctional ends. The general structure of the coupling agents can be
represented as RSiX3, where the X represents the hydrolyzable groups, which are
typically chloro, ethoxy, or methoxy groups. The organo, R, group can have a
variety of functionalities chosen to meet the requirements of the polymer. The
functional group X reacts for instance with hydroxyl groups on the SiO2 surface,
in preformed silica particles, while the alkyl chain may react with the polymer.
Hydrophobic silica can thus be obtained.
Mascia and Kioul [4], used GOTMS (γ-glicidoxypropyl-trimethoxysilane) in
their work with polyamic acid solutions in NMP and hydrolyzed solutions of
TEOS. Transparency in film cast in solutions with enough GOTMS was found to
be a function of mixing time and temperature. The authors attributed the
transition of the films from a cloudy to a transparent appearance to the
compatibilisation of the polymer and the developing siloxane by trimethoxyl
functionalities grafted to the polyamic acid backbone by the coupling agent use.
These functionalities are involved in the formation of the inorganic network.
Besides above-described chemical method, grafting of polymers to nanoparticles
can also be realized by irradiation. Zhang and co-workers [5-8] have published a
series of studies on irradiation-grafted nanosilica-filled nanocomposites. It was
found that modification of nanoparticles through graft polymerization was very
effective to construct nanocomposites because of (i) an increase in
hydrophobicity of the nanoparticles that is beneficial to the filler/matrix

74
miscibility, (ii) an improved interfacial interaction yielded by the molecular
entanglement between the grafting polymer on the nanoparticles and the matrix
polymer, and (iii) tailorable structure-properties relationship of the
nanocomposites provided by changing the species of the grafting monomers and
the grafting conditions since different grafting polymers might bring about
different interfacial characteristics.
A different approach to the production of IPN is denoted as the SIPNs
(Simultaneous Interpenetrating Polymer Networks) process. In this case the
material is produced by performing the sol gel process in combination with free
radical polymerization reactions of the polymeric phase. This approach allows
the in-situ formation and thus the homogeneous incorporation of polymers that
normally would not be miscible. Generally the polymeric phase in these
materials is polymethylmethacrylate, PMMA obtained through in situ
polymerization starting from the monomer (methylmethacrylate, MMA). In the
same cases, whether the sol gel process is performed by using alkoxysilanes
bringing at least one polymerizable group, the inorganic phase becomes
covalently bounded to polymeric phase. These materials display an improvement
of the mechanical behaviour along with better thermomechanical stability [9].
The use of coupling agents allowed to observe the same beneficial effect also in
thermoset, i.e. epoxy resin, matrices. In fact in hybrids materials obtained by sol-
gel method the simultaneous growth of the organic and inorganic networks by
the epoxide cross-linking and silica condensation reactions, respectively,
enhance the production of nano structured co-continuous domains, if appropriate
coupling agents, which prevent phase separation and allow morphological
control, were used [10].
75
Ochi et al. [11] highlighted the fundamental role of GOTMS to make compatible
the two organic and inorganic phase in order to improve the mechanical
properties of silica epoxy hybrid materials. In details, they found that in the
DGEBA/GOTMS hybrids the storage modulus in the rubbery region increased
and the peak area of tanδ curves in the glass transition region decreased,
respectively, with the hybridization with small amounts of silica. Moreover, at
highest silica content, the tanδ peak in the glass transition region completely
disappeared and no other tanδ peaks appeared. Therefore, due to the presence of
GOTMS coupling agent strong interactions at the organic/inorganic interface
took place and then the silica network was homogeneously dispersed in the
epoxy network in a molecular order and consequently the motion of network
chains was strongly restricted. Observation using Transmission Electron
Microscopy (TEM) revealed that the silica networks are uniformly dispersed in
the hybrid samples. These phenomena are also observed in other hybrids [12-13].
3.5 Structure-property relationship for IPN materials
In IPN hybrid materials there is a separate phase known as “interphase” [14]
(between the organic and the inorganic phases), which contributes substantially
to the overall properties. As the molecular scale morphology plays an important
role in achieving macroscopic properties of molecular and supermolecular
assemblies, many efforts have been focused on the correlation between structure
and property, to the aim to prepare multiphase micro- and nano-heterogeneous
systems with desired and tuneable properties.
Wilkes et al. [15] studied PDMS (poly-dimethyl-siloxane)/TEOS hybrids. They
were among the first to report the synthesis of hybrids based on PDMS (poly-

76
dimethyl siloxane) oligomers and silica from TEOS. The embedded inorganic
phase conferred rigidity to these materials with a corresponding decrease in
ductility. The properties were found to be substantially influenced by the amount
of acid catalyst added, leading to a better inter-dispersion of the two phases. The
use of a larger amount of TEOS and water, as well as additional thermal
treatment [16] gave rise to a more highly cross-linked silica structure, leading to
an increase in dynamic modulus.
The variables affecting the structure and properties of hybrids have been
discussed by Landry et al. [17] who have examined by Small Angle X-Ray
Scattering (SAXS) two different samples of organic-inorganic silica composites,
and proposed morphological models to describe them. Triethoxysilane-end
capped bisphenol-A epoxy resin (EAS) was reacted with TEOS under slightly
basic conditions, and a random copolymer trimethoxysilane-methylmethacrylate
(MMA- TMS based hybrid, on the other hand, was better described by co-
continuous organic and inorganic phases with a periodic fluctuation of about
4nm. This difference in morphology could be probably examined in the
following terms. In the acid catalyzed MMA hybrid the TMOS was expected to
form a branched polymer structure. Once most of the solvent was removed,
phase separation was likely to occur to form a co-continuous interpenetrating
network between the organic polymer and the inorganic polymer phases. A
tentative of schematic representation of the morphology is shown in Figure 14.

77
Figure 14 - Schematic representation of the morphology of a co-continuous interpenetrating network hybrid material. (The shadow area represents the inorganic
phase while the continuous lines represent the polymer molecules) [18]
Yano et al. [18] prepared organic-inorganic silica hybrids following two different
approaches. One method involved the mixing of organic polymer HPC
(hydroxypropyl-cellulose), PVA (poly-vinyl-alcohol) or PVDF (poly-vinylidene-
fluoride) with TEOS. For the first two polymers, during the sol-gel process
inorganic domains were deposited in the organic matrix due to hydrogen
bonding. These bonds are able to avoid the separation between the two phases.
The other route followed by these authors, was to introduce triethoxysilyl groups
into the organic polymer prior to the sol gel reaction with TEOS involving
covalent bonds between the two phases. This time the polymer used was PPO
(poly-propylene-oxide end-capped with triethoxysilane).
The experiments conducted on the first type of hybrid material showed that with
the increasing amount of TEOS content there was an increase of dynamic
modulus. But no change in tanδ was observed, apart from a decrease of the
intensity of its peak, because the molecular motions of the organic polymer are
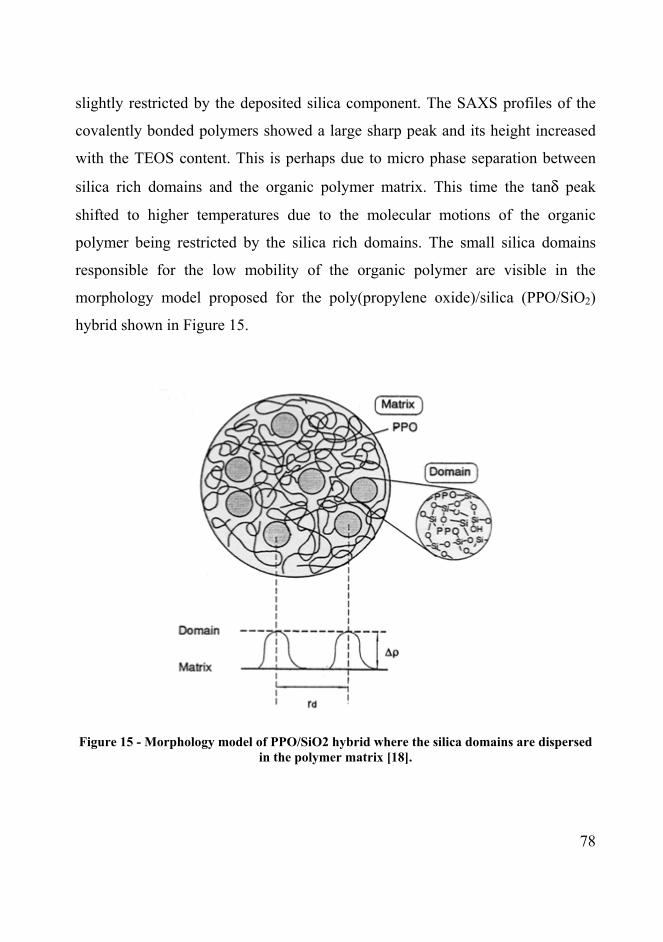
78
slightly restricted by the deposited silica component. The SAXS profiles of the
covalently bonded polymers showed a large sharp peak and its height increased
with the TEOS content. This is perhaps due to micro phase separation between
silica rich domains and the organic polymer matrix. This time the tanδ peak
shifted to higher temperatures due to the molecular motions of the organic
polymer being restricted by the silica rich domains. The small silica domains
responsible for the low mobility of the organic polymer are visible in the
morphology model proposed for the poly(propylene oxide)/silica (PPO/SiO2)
hybrid shown in Figure 15.
Figure 15 - Morphology model of PPO/SiO2 hybrid where the silica domains are dispersed in the polymer matrix [18].

79
Recently Mascia et al [19] have prepared nano-composites by casting solutions
of both epoxy resin and silica precursors generated both by sol-gel using TEOS
and as pre-formed dispersions of 7nm diameter silica particles. For systems
obtained from sol-gel, a particulate morphology of the inorganic domains in the
resulting films was obtained unless a coupling agent was used. According to this
evidence they studied the effect of several coupling agents on the morphology
and other properties of the hybrids. In particular, was investigated the effect of
the end-chain (mercapto- and amine- type coupling agents) and middle-chain
(isocyanate- type coupling agent) functionalisation of the organic matrix (bis-
phenol-A type epoxy resin), the chemical nature of the coupling agent and the
number of alkoxysilane functionalities. The comparison of the mechanical
properties and morphology data of the hybrid systems with respect to the system
obtained by mixing the colloidal silica with the polymer has helped in the
understanding of the structure of the epoxy-silica hybrids and, also to quantify
the interactions between the organic and inorganic phases of the two systems.
3.6 Epoxy-based hybrids and nanocomposites
Since epoxy resins as organic matrix have excellent heat, moisture, and chemical
resistance and good adhesion to many substrates, they are mostly applied in the
field of coatings, adhesives, casting, potting, composites, laminates and
encapsulation of semiconductor devises [20-21]. However, due to their low
mechanical properties and high coefficient of thermal expansion (CTE) value
compared with inorganic materials, the epoxy resins cannot meet all the
requirements of applications, especially for the applications of electrical and
structural such as epoxy molding compounds (EMC). Thus organic/inorganic
materials are frequently employed in order to overcome this limitation. Two

80
separated routes can be followed in order to prepare these
hybrid/(nano)composite materials, either the addition of preformed inorganic
particles, i.e. layered silicates montmorillonite (MMT), or the in situ growth of
siloxane clusters, since both MMT and silica particles are commonly used for the
reinforcement of epoxy matrix to lower shrinkage on curing, to decrease
coefficient of thermal expansion, to improve thermal conductivity and barrier
properties, and to meet mechanical requirements. As previously discussed, the
intrinsic properties of each component, the shape of fillers, the nature of the
interface, and so forth largely affect the properties of hybrid materials [22-23]. It
is well known that the load applying on the composites is mainly transferred to
the fillers by the interface. Therefore, for excellent properties, strong interfaces
between components are needed. Another important factor of fillers for affecting
composite properties are their content and size. To enhance the properties,
smaller size and larger amount of fillers are required. It has been already reported
that the increase of specific surface and fillers contents enhance the mechanical
and impact properties of composite [24].
However, when the size of fillers becomes smaller and the fillers content higher,
the viscosity of composite resin will be too high to process. In that case, the
interfacial strength will be more important factor due to their increasing surface
area of fillers. One of the most promising solutions for enhancing processability
at high filler-loading system is suggested to be the surface modification of fillers
[25]. In general sol-gel method is widely applied either to modify preformed
nanoparticles (i.e. MMT) or to synthesize siloxane clusters in order to prepare
epoxy based hybrids/nanocomposites materials. Therefore, in this study, to
investigate the effect of surface modification on hybrid/nanocomposites
properties, especially dynamic mechanical and thermal stability, organo-siloxane

81
clusters and silylated MMT obtained by sol-gel method were used to prepare
epoxy-based hybrid materials.
3.7 Epoxy/silica Hybrids
Ochi et al. [11, 26-27] found that the epoxy/silica nano-hybrids materials, can be
prepared by using Biphenol-A type epoxy resin and alkoxysilane as organic and
inorganic sources, respectively, and by progressing the sol-gel reaction of the
alkoxysilanes during the progress of epoxy curing. By following this route of
hybrid preparation, a contemporaneous growth of the two networks are allowed.
The epoxy-based hybrid materials exhibited good thermal stability and
mechanical properties in the high temperature region even with low silica
content (<10wt%). Moreover, the use of GOTMS coupling agent in the epoxy-
grafted silicone oligomer hybrid samples [27] showed to enhance the
morphological control, since the TEM images highlighted fine silica-rich
domains of about 5nm in diameter uniformly dispersed in the cured epoxy
matrix. Additionally, the storage modulus in the rubbery region and the peak area
of the tanδ curve at the glass transition region increased and decreased,
respectively, with the hybridization of organic network. Therefore, the mobility
of the epoxy network chains should be considerably suppressed by the
hybridization with siloxane structures. Moreover, the introduction of inorganic
components in the epoxy resin allowed the coefficient of thermal expansion
(CTE) to markedly increase with respect to the neat epoxy system. The thermal
decomposition behavior shifted to the high-temperature region with the
incorporation of silica network.
Mascia et al. [28] studied the influence of the geometrical configurations of the
inorganic phase within an organic matrix on the physical properties of hybrids

82
materials. To the aim to build up interconnected and chemically bonded organic-
inorganic hybrids, two kind of coupling agents were used, namely GOTMS and
aminosilanes. In particular, GOTMS was used to functionalize the inorganic
particles obtained by TEOS during the sol-gel process, whereas several kinds of
aminosilanes, namely Bis-(γ-propyltrimethoxysilane)amine A1170, and
Mercapto γ-propyltrimethoxysilane MPTMS, were reacted with Diglycidylether
of Bisphenol A (DGEBA) aimed creating siloxanes pendants on the organic
chains. They found that the twice functionalization, that is the introduction of
coupling agent for both the organic and inorganic components enhance the
dispersion of the silica-organosols in the epoxy matrix. Regardless the coupling
agent used in the organic component, the hybrid samples exhibit a bicontinuous
phase morphology. This comprises three components, respectively an epoxy
matrix network, a diffused silica phase and epoxy-silica interphase domains
containing a prevalence of alkoxysilane components from the coupling agents
used.
Moreover, Matejka et al. [29-31] described the formation, structure and
properties of DGEBA-JeffamineD2000-TEOS hybrid materials. They studied the
effect of both the catalyst and the synthesis procedure used for the preparation of
hybrids materials. In particular they prepared hybrids by using two method, the
one-step polymerization, in which all the organic and inorganic component are
obliged to react altogether, and the two step polymerization of silica, which
consists of prehydrolysis of TEOS in acid medium in the first stage, followed by
the build-up of a network in the presence of the amine hardener. The morphology
of the network synthesized by the one-step base-catalyzed simultaneous
polymerization is the most heterogeneous one, since large siloxane aggregates
with a size of about 100-300nm, composed of smaller clusters of 20-70nm in

83
diameter can be detected. Whereas the two step acid-base polymerization shows
smaller siloxane clusters, and then a fine dispersion of inorganic domains.
Regardless the preparation procedure, all the hybrid samples highlighted
improved dynamic mechanical behavior with respect to the neat epoxy network,
in terms of decreased and broadened loss factor tanδ. Furthermore, in the DMA
curves of the two-step polymerization hybrids, a new relaxation peak at higher
temperature can be observed. This provides evidence of such a phase separation
in the epoxy-silica hybrids. In particular, the new relaxation corresponds to the
network chains immobilized by interaction with glassy silica domains.
The sol-gel polymerization of organo-trialkoxysilanes RSi(OR’)3 under
particular reaction parameters results in the formation of polysilsesquioxane
POSS cage-like structures. Therefore, Matejka et al. [32] also studied the
structural evolution of siloxane cage-like clusters and correlated their
morphology to the mechanical behavior of hybrids materials. They found that
evolution of the POSS structure is controlled by the competition between
intermolecular polycondensation and cyclization. Moreover, because of the
incompatibly of the polyhedral POSS framework and pendant organic chains,
microphase separation takes place and spontaneous self-organization in cage-like
structures occurs. The interphase interaction may contribute to an increase in the
glass transition temperature by creating a confined interface layer. The effect,
however, is much lower, compared to the interpenetrating networks [29-31]. In
fact, the interaction, if any, between the polymeric matrix and the POSS
junctions is quite weak. Therefore, the interface interaction is affected by the
internal structure of POSS domains, which is determined by the catalysis.
Finally, Matejka found that hybrids prepared by silane modified with
poly(oxypropylene) acid TSA catalyzed and containing the 64wt% of TEOS

84
leads to a significant increase both in modulus and Tg. Broadening of the
relaxation band corresponds to a broad distribution of immobilized chains. The
strength of the interaction and the fraction of confined chains increases with the
TEOS content.
3.8 Epoxy/MMT Composites
Because of their unique structure, layered silicates are largely employed in the
production of polymer nanocomposites with improved physical properties with
respect to the pristine polymeric matrix [33-35]. Enhanced mechanical, thermal
and gas-barrier properties can indeed be achieved by adding small amounts of
clay (< 5% by weight) to a given polymer, and this in fact opens new avenues in
the design and synthesis of a plethora of new, high-performance materials for
which an array of advance applications can easily be envisaged.
3.8.1 Structure of layered silicates
The layered silicates used in the nanocomposites belong to the same structural
family as the better known minerals talc and mica [36] (i.e. 2:1 phyllosilicates).
Montmorillonite (MMT) is one of the layered silicates currently most widely
employed in the production of polymer-clay nanocomposites [33-35]. The
crystalline structure of MMT is based on a regular arrangement of silicon
tetrahedra (SiO44-) and aluminum octahedra (Al(OH)6
3-), the unit cell containing
two tetrahedral and one octahedral layers (Figure 16). MMT layer has permanent
negative charge on the surface of its layers because of isomorphous substitutions
of Mg2+ for Al3+ or, rarely, Al3+ for Si4+ [35]. These negative charges are
counterbalanced by the presence of first-group cations such as sodium or
potassium, which locate in the proximity of the clay platelets within the gallery

85
space [33]. Stacking of the layers leads to a regular van der Waals gap between
them called the interlayer or gallery.
Figure 16 - Structure of the 2:1 layered silicates.
Details on the structure and chemistry for these layered silicates are provided in
Figure 16.
All layered silicates are characterized by a large active surface area (700 – 800 m
2 /g in the case of MMT), a moderate negative surface charge (cation exchange
capacity) (CEC) and layer morphology, and are regarded as hydrophobic colloids
of the constant-charge type. The layer charge indicated by the chemical formula
is only to be regarded as an average over the whole crystal because the charge
varies from layer to layer (within certain bounds). Only a small proportion of the
charge balancing cations are located at the external crystal surface with the
majority being present in the interlayer space. The cations are exchangeable for
86
others in solution. Upon replacing the hydrated metal cation from the interlayers
in the pristine layered silicates with organic cations such as an alkylammonium
or an alkylphosphonium, the layered silicate attains a hydrophobic/organophillic
character and typically results in a larger interlayer spacing. Because the negative
charge originates in the silicate layer, the cationic head group of the
alkylammonium molecule preferentially resides at the layer surface and the
aliphatic tail will radiate away from the surface. The equilibrium layer spacing
for an organically modified layered silicate depends both on the cation exchange
capacity of the layered silicate, as well as on the chain length of the organic
cation.
3.8.2 Morphologies of Polymer/Silicate Nanocomposites
Layered silicates are some examples of layered solids capable of intercalation.
Therefore the local and global conformations of the polymers within the host
galleries are expected to be dramatically different from those observed in the
bulk not only due to the confinement of the polymer chains but also due to
specific polymer-surface interactions, normally not observed in the bulk. Hence
it is also expected that the local and chain dynamics would be greatly affected by
the confinement as well as the polymer-surface interactions.
The structure and properties of the resulting nanostructure can be conveniently
mediated by controlling subtle guest–host interactions. Beyond the conventional
phase separated polymer/silicate composites, for which the polymer and the
inorganic host remain immiscible, two types of hybrids are possible (Figure 17):
intercalated and exfoliated or delaminated structures. In the intercalated
morphology a single, extended polymer chain is intercalated between the host
layers resulting in a well ordered multilayer with alternating polymer/inorganic

87
layers and a repeat distance of a few nanometers. Hence the clay sheets retain a
periodic and stacked structure. The intercalation process can be monitored by
tracking the increasing long spacing from X-ray scattering, since the galleries
must expand to accommodate larger molecules. Whereas in the exfoliated or
delaminated morphology the silicate layers (1 nm thick) are exfoliated and
dispersed in a continuous polymer matrix [37-38].
Phase separated Intercalated Exfoliated
Figure 17 - Schematic representation of different polymer/silicate hybrid structures.
Here the clay sheets are ideally well dispersed and randomized (in orientation)
within a matrix of the “coil-like” polymer chains. They have lost their original
stacked orientation, and if the structure is truly random then no distinct long
spacing should be observable by X-ray scattering. However, literature in the field
has a less strict definition of a delaminated hybrid. In most cases in the literature
involving delaminated hybrids the clay sheets maintain a considerable amount of
order as they tend to remain in a “stacked” structure. Hence it is difficult to
distinguish between intercalated and delaminated nanocomposites. In some cases
in the literature the only factor which allows distinction between the intercalated
and delaminated structure is the spacing between clay sheets (or long period), as
both possess stacked–layer structures. In the author’s opinion there is a blatant

88
misuse of the term delaminated (exfoliated) when it is employed to describe a
hybrid that displays a clear X-ray peak corresponding to the long spacing of an
ordered material. Some researchers improperly utilize wide angle X-ray
scattering to monitor the nanocomposite formation, and what they conclude as a
disappearance of a correlation peak (evidence of delamination) is really just a
convergence of the peak with the main beam. The proper tool to employ, in the
author’s opinion, is small angle X-ray scattering (SAXS). In fact, this has proven
to be an excellent tool to monitor the structure of nanocomposites formed
between montmorillonite and epoxies.
3.8.3 Epoxy–Clay composites
As previously discussed, the presence of cations located in the proximity of the
clay platelets within the gallery space confers to the pristine structure of, i.e.,
sodium MMT (Na-MMT) a highly polar nature, and this, in turn, renders this
silicate quite incompatible with the vast majority of organic polymers [34-35].
Accordingly, a simple dispersion of Na-MMT in a polymeric matrix will not
produce a composite with improved properties compared to the neat
macromolecule, because of the poor interfacial interactions between the Na-
MMT hydrophilic reaction sites and the highly hydrophobic polymeric chains.
Therefore, chemical modification of internal and external Na-MMT platelets
plays a crucial role in polymer/clay nanocomposite formation. Several efforts
have been done in order to reduce the hydrophilicity of the Na-MMT internal
platelets; in particular the cation exchange reaction with a quaternary ammonium
salt (see for example the case of Cloisite 30B) represents the most commonly
used method to modify clay surface. This modification increases the interlayer
spacing and creates a more favourable organophilic environment. However, the

89
thermal instability of conventional ammonium ion-modified clay is a strong
limitation for melt-compounding of polymer/organoclay composites. In fact,
most of the alkyl ammonium surfactants are known to undergo a degradation
process at temperature at which the plastics are commonly processed [39]. For
this reason, the silylation approach involving direct grafting reaction by using a
coupling agent has recently attracted much attention, and represents a viable
method to make compatible inorganic platelets and organic matrix [40-45]. The
presence of broken bonds on the platelet edges are common for layered silicates,
and leads to the formation of hydroxyl groups, which can be utilized for
chemical modification by silylation reaction. By using an organosilane, it is then
possible to covalently bond the organic functional groups onto the layer surface.
Importantly, the functionalization of clay minerals with organosilanes can take
place at three different sites: at the interlayer space, at the external surface and at
the edges [46-47].
In terms of performances of silane-modified MMT nanocomposites, Zhao et al.
[48] found that the use of chlorosilane modified clay allowed the improvement of
the mechanical behavior of polyethylene (PE)-based nanocomposites
determining an increase of both glass transition temperature and elastic modulus
in the glassy region. In particular, after trimethylchlorosilane (TMSCl)
modification, the OH groups at the edge of clay platelets were reacted and the
wetting ability between PE and organoclay was subsequently improved.
Moreover, the loss of hydroxyl groups resulted in a decrease of cation exchange
capacity (CEC), which caused a reduction in the strength of interaction between
the platelets. Both these effects favorably concurred to improve the intercalation
of PE into interlayers.

90
So far the silylation reaction has been widely performed using (3-
aminopropyl)trimethoxysilane (A1100), TMSCl and Glycidyl-propyl-
triethoxysilane (GPTS) [47] as coupling agents. Among several investigations, it
is here mentioned the work of Wang et al. [49], which found that Na-MMT
modified by a small amount of A1100 as coupling agent is able to promote a
high extent of exfoliation for epoxy/clay nanocomposites. However, to the best
of our knowledge, the effects of other aminosilanes on the MMT final basal
spacing have not been evaluated yet.
The interfacial interaction between the filler and the epoxy matrix strongly
affects the filler morphology within the polymeric network and then the final
properties of nanocomposites. In most cases, uniform dispersion [50] or
controlled mesoscale association [51] of the nanoparticle is believed to be critical
to maximize the epoxy properties improvements. In fact, it is generally believed
that the improvement in properties of the clay nanocomposites is directly related
to the complete exfoliation of silicate layers in the polymer.
Moreover, depending on the nature of components, namely clay and polymer, the
method of preparation (melt, solution or in-situ polymerization) and the
processing techniques used, various clay-polymer morphologies as follows phase
separated, intercalated or exfoliated structure can be obtained [52].
Koerner et al. [53] found that irrespective of the organically modified MMT (O-
MMT) used to prepare the epoxy nanocomposites, conventional processing
methodologies as sonication, result in an inhomogeneous distribution of OMMT
on the micron scale. Even though alkylammonium which allows the intragallery
reactivity to enhance, this only results in extensive swelling of tactoids
(interlayer distance of about 10-20nm) and thus retention of layer-layer

91
correlations, leading to composite micron-scale reinforcing particles, not nano-
scale dispersion of individual layers. In contrast, the authors findings highlighted
that sub-ambient temperature (cryo) compounding had substantial impact on the
ability to reduce tactoid and agglomerate size and increase homogeneity of MMT
dispersion. They stated that contrary to the thermal coefficient of thermal
expansion and the hardness, the glass transition temperature strongly depends on
the extent of OMMT dispersion and interfacial chemistry.
Perrin-Sarazin et al. [54] studied the Ball Milling technique to achieve final clay
exfoliation in PP/MMT composites. In details, Ball Milling is a high-energy
grinding technique widely used to prepare composites from powders. It is well
known to induce several mechanic-chemical changes and structural
modifications in clays, leading to great changes in their surface and colloidal
properties [55-56]. In the literature, it is recognized that high-energy Ball Milling
affects the clay structure by inducing predominant delamination of the platelets
at the earlier stages of degradation, breaking the platelets, and finally crushing
the structure in the later stages thus leading to the structure amorphization [57-
59]. The clay delamination is a crucial issue in the preparation of polymer
nanocomposites and as it happens during the early stage of the milling process
without even drastic clay structure alteration, it makes the milling a very
attractive technique to prepare clay nanocomposites.
In spite of what observed, Giannelis et al. [60] stated that in the MMT polymer
composites the edge interactions play a more significant role than degree of
exfoliation, a result unique in the field of polymer nanocomposites. They
demonstrated that even a combination of polymer/nanofiller compatibility and
thermodynamically stable nanofiller dispersion levels may not give rise to
reinforcement. These findings provide an important caveat when attempting to

92
connect structure and properties in polymer nanocomposites, and useful guidance
in the design of optimized polymer/layered silicate nanocomposites in particular.
In general, the inter-relationships between mechanical processing, OMMT
surface chemistry and the desired property enhancements are not linear and thus
must be considered in light of the final application to evaluate the optimal
nanocomposite fabrication methodology to achieve maximal benefit.

93
3.9 References
[1] G. Kickelbick; Hybrid Materials. Synthe sis, Characterization, and
Applications; Wiley-VCH: Weinheim, Germany, 2007; Chapter 1.
[2] T. Inoue; Prog. Polym. Sci., 20, 1995, 119.
[3] K. Nakanishi; Bull. Chem. Soc. Jpn., 79, 2006, 673–691.
[4] A. Kioul; L. Mascia; J. of Non Crystalline Solids, 175, 1994, 169.
[5] C. L. Wu; M. Q. Zhang; M. Z. Rong; K. Friedrich; Compos. Sci.
Technol., 65, 2005, 635.
[6] M. Z. Rong; M. Q. Zhang; Y. X. Zheng; H. M. Zeng; R. Walter; K.
Friedrich; J. Mater. Sci. Lett., 19, 2000, 1159.
[7] M. Z. Rong; M. Q. Zhang; S. L. Pan; B. Lehmann; K. Friedrich;
Polym. Int., 53, 2004, 176.
[8] M. Z. Rong; M. Q. Zhang; S. L. Pan; K. Friedrich; J. Appl. Polym.
Sci., 92, 2004, 1771.
[9] A. Schwegler; M. Möller; Macromol. Chem. Phys., 199 (9), 1998,
1859-1864.
[10] L. Prezzi; L. Mascia; Advances in Polymer Technology , 24, 2005,
91-102.
[11] M. Ochi; R. Takahashi; A. Terauchi; Polymer, 42, 2001, 5151-5158.
[12] Q. Hu; E. Marand; Polymer, 40, 1999, 4833.

94
[13] Z. Ahmad; M. I. Sarwar; S. Wang; J. E. Mark; Polymer, 38, 1997,
4523.
[14] M. S. Whittingham; Science, 192, 1976, 1126.
[15] H. H. Huang; B. Orler; G. L. Wilkes; Macromolecules, 20, 1987,
1322.
[16] G. L. Wilkes; B. Orler; H. H. Huang; Polym. Preprints, 26, 1985,
300.
[17] M. R. Landry; B. K. Coltrain; C. J. T. Landry; J. Polym. Sci. , 33,
1995, 637.
[18] S. Yano; K. Iwata; K. Kurita; Mater. Sci. and Engin., 6, 1998, 75.
[19] L. Mascia; L. Prezzi; M. Lavorgna; Polymer Engineering and
Science 48, 2005, 1039-1048.
[20] J. C. Salomone; Encyclopedia of polymeric materia ls, vol.3 , New
York: CRC Press, 1996.
[21] W.G. Potter; Epoxy resins, New York: Springer, 1970.
[22] L.E. Nielsen; Mechanical properties of polymers and composites,
vol. 2, New York: Marcel Dekker, 1974.
[23] Y. Nakamura; M. Yamaguchi; K. Iko; M. Okubo; T. Matsumoto;
Polymer, 31, 1990, 2066.
[24] Y. Nakamura; M. Yamaguchi; M. Okubo; T, Matssummoto; Journal
of Applied Polymer Science 45, 1992, 1281.
[25] E.P. Plueddemann; Silane coupling agents , New York: Plenum
Press, 1982.

95
[26] M. Ochi; R. Takahashi; Journal of P olymer Science: Part B:
Polymer Physics 39, 2001, 1071.
[27] M. Ochi; T. Matsumura; Journal of Polymer Science: Part B:
Polymer Physics 43, 2005, 1631-1639.
[28] L. Mascia; L. Prezzi; B. Haworth; Journal of Material Science 41,
2006, 1145-1155.
[29] L. Matejka; K. Dusek; J. Plestil; J. Kriz; F. Lednicky; Polymer 40,
1999, 171.
[30] L. Matejka; J. Plestil; K. Dusek; Journal of Non-Crystalline Solids
226, 1998, 114.
[31] L. Matejka; O. Dukh; J. Kolarik; Polymer, 41, 2000, 1449.
[32] L. Matejka; O. Dukh; H. Drahomira; B. Meissner; J. Brus;
Macromolecules 34, 2001, 6904-6914
[33] J. Zhang; R. K. Gupta; C. A. Wilkie; Polymer, 47, 2006, 4537.
[34] H. Shi; T. Lan; T. J. Pinnavaia; Chem. Mater., 8, 1996, 1584.
[35] S. Yariv; H. Cross; in: Dekker M, (Eds), Clays and Clay Minerals ,
New York, 2002. pp 463-566.
[36] S.D. Burnside; E. P. Giannelis; Chem Mater, 7, 1995, 1597.
[37] R. K. Krishnamoorti, R. A. Vaia, E. P. Giannelis; Chem Mater , 8,
1996 29.
[38] E. P. Giannelis; Advanced Materials, 8, 1996, 29.
[39] L. A. Utracki; Clay-Containing Polymeric Nanocomposites , Rapra
Technology Limited Press, Shrewsbury, 2004.

96
[40] A. Wheeler; J. Wang; J. Baker; L. J. Mathias; Chem. Mater. , 17,
2005, 3012.
[41] N. N. Herrera; J. M. Letoffe; J. L. Putaux; L. David; E. Bourgeat-
Lami; Langmuir, 20, 2004, 1564.
[42] A. Y. Park; H. Kwon; A. J. Woo; S. J. Kim; Adv. Mater., 17, 2005,
106.
[43] N. Herrera; J. Letoffe; J. Reymondc; E. Bourgeat-Lami; J. Mater.
Chem., 15, 2005, 863.
[44] H. He; J. Duchet; J. Galy; J. Gerard; Colloid. Interface Sci. , 288,
2005, 171.
[45] M. Park; I. K. Shim; E. Y. Jung; J. H. Choy; J. Phys. Chem. Solids ,
65, 2004, 499.
[46] A. M. Shanmugharaj; K. Y. Rhee; S. H. Ryu; J. Colloid Inter face
Sci., 298, 2006, 854.
[47] A. Di Gianni; E. Amerio; O. Monticelli; R. Bongiovanni; Appl. Clay
Sci., 42, 2008, 116.
[48] C. Zhao; M. Feng; F. Gong; H. Qin; M. Yang; J. Appl. Polym. Sci. ,
93, 2004, 676.
[49] K. Wang; L. Wang; J. Wu; L. Chen; C. He; Langmuir, 21, 2005,
3613.
[50] S. J. Park; D. I. Seo; J. R. Lee; D. S. Kim; Synthesis and
characterization of epoxy/clay nanocomposites, Kongop Hwahak, 12 (2),
2001, 181-185.

97
[51] T. D. Fornes; D. R. Paul; Polymer, 44, 2003, 4993-5013.
[52] M. Alexandre; P. Dubois; Mater. Sci. Eng., R 28, 2000, 1.
[53] H. Koerner; D. Misra; A. Tan; L. Drummy; P. Mirau; R. Vaia;
Polymer, 47, 2006, 3426-3435.
[54] F. Perrin-Sarazin; M. Sepehr; S. Bouaricha; J. Denault; Polymer
Engineering and Science, 2009, 651-665.
[55] S. Yariv; I. Lapides; Journal of Mater Synth Process, 8, 2000, 223.
[56] E. Kasai; H. Mimura; K. Sugiyama; F. Saito; K. Akiba; Y. Waseda;
Adv. Powder Technol., 5, 1994, 189.
[57] B. Cicel; G. Kranz; Clay Miner., 16, 1981, 151.
[58] I. Sondi; M. Stubicar; V. Pravdic; Colloids Surf. A Physicochem.
Eng. Asp., 127, 1997, 141.
[59] F. Dellisanti; G. Valdré; Appl. Clay Sci., 28, 2005, 233.
[60] D. F. Schmidt; E. P. Giannelis; Chemistry of Ma terials, 22, 2010,
167-174.

98
Chapter 4: Experimental
4.1 Materials
4.1.1 Organic components
4.1.1.1 Diglycidyl ether of bisphenol-A (DGEBA)
A commercially available Diglycidyl ether of bisphenol-A (DGEBA) has been
used as main epoxide component, commercially known as Epikote828 obtained
from Shell chemicals. These have a number average molecular weight of 370
and 5000 atomic mass units respectively, corresponding to an average degree of
polymerisation of 0.1 and 16 expressed in terms of central CH2CHOHCH2 units
per molecule. The Epoxide Equivalent Weight (EEW), the weight of resin in
grams which contains one gram-equivalent of epoxy, is 187 g/mol equiv. The
general structure is as shown below:
4.1.1.2 1,6 hexanediol Diglycidyl ether
The 1,6 hexanediol Diglycidyl ether is a bifunctional epoxide reactive diluent at
EEW = 165 g/mol equiv obtained from Shell chemicals.

99
4.1.2 Siloxane precursors
4.1.2.1 Silane Coupling agents
Compatibility between the inorganic and the epoxy components is required to
obtain a hybrid material with co-continuous phases. To achieve this goal silane
coupling agents, namely γ-Glycidoxypropyltrimethoxysilane (GOTMS) and
three aminosilanes, 3-aminopropyltriethoxysilane (APTES or A1100), N-(2-
aminoethyl)-3-aminopropyltrimethoxysilane (A1120), and 3-[2-(2-
aminoethylamino)ethylamino]-propyl-trimethoxysilane (A1130), obtained from
GE Advanced Materials, were used. All trifunctional silylating agents had a
purity of 98%.
4.1.2.2 Tetraethoxysilane (TEOS)
TEOS was used as silica precursors to generate the siloxane network in the
hybrid systems. It was parched from Aldrich, at 98% purity.
4.1.3 Catalyst: Dibutyltin Dilaurate (DBTDL)
DBTDL was used as condensation catalyst in the alkoxysilane solution. It was
obtained from Aldrich chemicals with a purity > 95%.

100
4.1.4 Inorganic components: Montmorillonite
Sodium montmorillonite (Na-MMT) with cationic exchange capacity (CEC) of
92 meq/100g was purchased from Southern Clay Products Inc., USA. Prior to its
use, the Na-MMT was dried over night at 90°C in vacuum conditions.
4.1.5 Solvents
The solvents used in the hydrolysis and condensation of the silica precursor were
distilled water, ethanol and 2-propanol, obtained from Sigma Aldrich. For the
silylation reaction of MMT Glycerol purchased from Fluka was used.
4.1.6 Hardeners
The Metaxylilene diamine (MXDA) hardener (obtained by Fluka) has an AEW
of 35.56 g/mol equiv.
Jeffamine D230 obtained from Aldrich with a AEW of 54.83 g /mol equiv., with
the following structure:
4.2 Silylation reation of Na-MMT
4.2.1 Powders
To perform the silylation reaction of Na-MMT by aminosilanes, three different
reaction conditions were used, in which both the reaction temperature and the

101
amount of the aminosilane were varied, respectively. These experimental routes,
referred to, in the following as Procedure 1, 2 or 3, are summarized in Table 1.
Procedure Amount of Na-MMT in 100 ml of glycerol
(g)
Amount of aminosilane in 100 ml of glycerol (g)
Reaction temperature
(°C)
1 1 1 80
2 5 20 130
3 5 5 80
Table 1 - Reaction conditions adopted during the silylation process.
1 or 5 grams of dried Na-MMT were added to 100 ml of glycerol, and the
resulting suspension was stirred at 60°C for 30’ in nitrogen atmosphere. The
same procedure was used to dissolve the aminosilane in glycerol. In this work
glycerol was selected as the solvent, since, recently, Shanmugharaj et al. [1]
verified that, using high surface energy solvents, the interaction between
aminosilanes and the edges of the clay platelets is reduced due to low wetting
phenomena and, hence, the silane molecules can diffuse and react more
efficiently in the mineral galleries.
The resulting Na-MMT dispersion and aminosilane solutions were then mixed,
and the grafting reactions were carried out at 80 or 130°C, under constant stirring
for 3 h under nitrogen. After cooling, the reaction product was recovered by
centrifugation at 13000 rpm, and stabilized at 100°C for 5 h in vacuum condition.
Excess glycerol was removed by washing each reaction product with water under
stirring at 60°C for 1.5 h followed by centrifugation. This washing procedure
was repeated three times, and the quantitative elimination of the solvent was
confirmed by thermogravimetric analysis. Each resultant product was dried at

102
80°C under vacuum and then ground to a powder. Procedure 1 was performed on
all three aminosilanes, whereas Procedure 2 was carried out only in the case of
A1100. In order to study the effect of the two silylation conditions on the final
products, the interlayer spacings of the A1100-modified Na-MMTs obtained
from the different procedures, i.e. 1 and 2, were compared.
Additionally, in order to determine the degradation temperatures of the silylated
Na-MMT, two pastes with water and glycerol as dispersing agents were prepared
to be tested by thermogravimetric analysis. In details, the Na-MMT/water paste
(Na-MMT-H2O) was obtained by dispersing Na-MMT powder in glycerol at
60°C and then following the same procedure illustrated previously for the
silylation reaction but without the addition of the aminosilane. The paste with
glycerol (Na-MMT-Gly) was prepared by dispersing Na-MMT in glycerol at
60°C. After centrifugation, the paste was kept in the oven for 22 h at 60°C in
vacuum condition.
Once optimized the parameter process the silylation reaction has been carried out
following the Procedure 3 and finally the obtained powders were used to prepare
Epoxy/MMT composites.
4.3 Preparation of the MMT composites epoxy-based
The epoxy composites were prepared through two different procedures namely
sonication mixing (S) and a combination of sonication and high energy ball-
milling (SB) which are schematized in Scheme 2.

103
4.3.1 Sonication mixing (S)
The modified and unmodified clay was first mixed with DGEBA by using the
Thinky planetary vacuum mixer for 2 minutes at 2000 rpm. The mixture was
then sonicated for 30 minutes (instrument details). Afterwards the hardener
MXDA in stoichiometric amount was added and the resulting mixture was
degassed for 4 minutes in the planetary vacuum mixer and then poured in special
moulds and cured according to the following thermal program: 30°C for 1h,
60°C for 1h, 90°C for 1h, 100°C for 1h, 120°C for 1h and 150°C for 1h. This
curing cycle allows the complete conversion of the epoxy groups as confirmed
by FTIR analysis (data not reported for sake of brevity). An epoxy control matrix
was obtained with this procedure without adding any clays.
4.3.2 Sonication and High Energy Ball-milling (HEBM) mixing
(SB)
In this method, the mixture of DGEBA and modified and unmodified clays was
first processed by sonication mixing followed by an additional high shear my
using a HEBM for 1h at 580 rpm. After that the hardener MXDA was added in
stoichiometric amount at the mixture was submitted to the same treatment and
thermal curing previously described for sonication mixing procedure. An epoxy
control matrix was obtained with this procedure without adding any clays.
In the following the composite materials obtained by including unmodified Na-
MMT are simply abbreviated as Na-MMT/DGEBA. The composite materials
obtained by using silylated MMT are labeled as MMT-A1100 and MMT-A1120
for samples including clay functionalized respectively with 3-
aminopropyltriethoxysilane and N-(3-(trimethoxysilyl)propyl)ethylene-diamine.

104
Composites with 1 and 3% in weight of inorganic clay content (silicate basis)
were prepared. The actual content of inorganic phase (i.e. MMT without the
organic moieties) has been calculated by taking into account the organic content
due to the moieties introduced by silylation [1]. The percentage of organic
amminosilane moieties with respect to the total inorganic mass is 8.1% and 8.8%
wt/wt for MMT functionalized respectively with A1100 and A1120 [2-3].
Scheme 2 - Processing methods of epoxy/MMT nanocomposites.
Therefore, since the powders are mentioned as “MMT-x” with x= aminosilane
used to functionalize the filler, the corresponding composites were named
“MMT-x y% S” or “MMT-x y% SB”, for the sonicated or sonicated-ball-milled
samples, respectively, y indicating the powders content.

105
4.4 Preparation of Epoxy-silica Hybrids
To the aim to study the sol-gel parameters process, several approaches have been
attempted. In particular, by using the same hardener (MXDA) the effect of the
coupling agent, the solvents and the hydrolysis procedure have been evaluated.
In fact, according to the standard sol-gel method the first approach (Ep-xAP-
zSolv-Siy-Sh) contemplated the pre-hydrolysis procedure in acidic ambient of
sol-gel precursors. The APTES coupling agent has been used to functionalize the
organic moieties versus the inorganic structures. This approach leads to hybrids
with large inorganic particles not well interacting with the organic network.
Additionally, the sol-gel procedure solvents retain in the hybrid samples. In order
to improve the interfacial interactions between the organic and inorganic
moieties, the functionalization of the inorganic structures has been performed by
using a second coupling agent GOTMS. Moreover, to eliminate the sol-gel
solvents, namely ethyl alcohol and water, the precursors solution has been dried
before the addition to the reacting system. In these samples, named Ep-xAP-Siy-
Ol, large inorganic particles, even if well bonded to the organic network are
present. Hence, to the aim to reduce the inorganic structures dimensions, the Ep-
xAP-Siy-IS approach has been followed. In fact, the so-called “one-step
polymerization” [4-6] all the organic and inorganic component are obliged to
react altogether, constrains the siloxane structures to be small and well dispersed,
with enhanced interfacial interactions due to the GOTMS presence. By using this
approach, the siloxane structures become well dispersed in the organic matrix
and the extraction of sol-gel pre-hydrolysis solvents has been overcome.
However, in spite of the fine inorganic structures the viscous-elastic properties of
hybrid samples got worse with respect to the neat epoxy. These results could be
ascribed to the retention of developed sol-gel solvents into the reacting system

106
and to the too opened siloxane structure. Hence the further approach has been
attempted, producing the Ep-Siy-Mx samples. The pre-hydrolysis solvents have
been eliminate after mixing with the epoxy resin and an increased amount of
GOTMS has been used. This approach assured all sol-gel solvents to be
eliminated and enhanced a good dispersion of inorganic structures. This
preliminary study was necessary to define both the kind and amount of coupling
agent, and the sol-gel process parameters to use. Finally, the effect of the
hardener has been evaluated producing the Ep-Siy-Je samples. Depending on the
particular kind of sol-gel procedure and hardener taken into account, different
curing cycles have been performed.
4.4.1 Preparation of “Ep-xAP-zSolv-Siy-Sh” hybrids
A three step method has been used. The epoxy resin DGEBA (or a mixing of
DGEBA and 1,6 hexanediol diglycidyl ether) has been functionalized with
APTES at 70°C in nitrogen atmosphere to avoid the influence of water in the
nucleophilic attach of epoxy ring by amine group. The mixture has been allowed
to react for 10’ after that the reacting mixture has been cooled in ice water in
order to avoid the reaction to continue. Meanwhile the siloxane precursors
solution has been prepared by mixing at room temperature for 10’
Tetraethylorthosilane (TEOS), acidic water (HCl/H2O 2wt%) water and ethyl
alcohol as solvent. In detail, the molar ratio between TEOS and water was:
TEOS : H2O = 1 : 3
Whereas ethyl alcohol has been added by keeping a weighting ratio twice with
respect to the water amount. The pre-hydrolysis solution has been added to the
functionalised epoxy resin in order to produce nominal silica content ranging
from 2.5 to 15wt%. Finally, a stoichiometric amount of MXDA hardener has
107
been added taking into account the amount of epoxide groups functionalized
before with APTES. The samples have been post-cured for 2h at 150°C after 18h
at 23°C. The samples were named Ep-xAP-zSolv-Siy-sh, where x indicates the
weight percentage of epoxide groups functionalised with APTES and y the
nominal silica content. Finally z represents the weight percentage of 1,6
hexanediol diglycidyl ether added.
4.4.2 Preparation of “Ep-xAP-ySi-Ol” hybrids
The epoxy resin DGEBA has been functionalized in 10’ with APTES at 70°C in
nitrogen atmosphere and immediately cooled in ice water. The siloxane mixture
has been prepared to the aim to produce siloxane oligomers according to Soucek
approach [7]. The siloxane precursors solution has been prepared by stirring at
25°C for 24 hours in acidic catalysis TEOS and GOTMS in molar ratio equal to
10. The water and ethyl alcohol (EtOH) have been added in the following molar
ratio:
TEOS : H2O = 1 : 2 and TEOS : EtOH = 1 : 4
By using 0.24 mol of TEOS, 0.1ml of chloride acid at 37wt% has been added.
The extraction of solvents has been carried out in a oven at 50°C in vacuum for
5h. Then the siloxane mixture (oligomers) has been added to the functionalised
epoxy resin to produce nominal silica content ranging from 5 to 15wt%. Finally,
a stoichiometric amount of MXDA hardener has been added taking into account
the amount of epoxide groups APTES-functionalized. A post-curing at 150°C
after 18h at 23°C has been performed. The samples were named Ep-xAP-Siy-Ol,
where x indicates the weight percentage of epoxide groups functionalised with
APTES and y the nominal silica content.

108
4.4.3 Sol-gel in-situ (Ep- xAP-Siy-IS)
DGEBA has been functionalized with APTES at 70°C in nitrogen atmosphere
for 10’ and then cooled in ice water to immediately stop the functionalization
reaction. A siloxane precursors solution has been prepared by mixing at room
temperature for 10’ TEOS and GOTMS in molar ratio of 10 and the catalyst
DBTDL (0.5 wt%) and then added to the functionalized epoxy resin, the final
mixture being transparent. Finally, a mixture of water (HCl/H2O 2wt%) in molar
ratio [TEOS:H2O = 1:3] and MXDA in stoichiometric amount has been added.
The hybrid samples have been post-cured at 150°C after 18h at room
temperature. The samples were named Ep-xAP-Siy-IS, where x indicates the
weight percentage of epoxide groups functionalised with APTES and y the
nominal silica content.
The sol-gel process in the Ep-xAP-Siy-IS approach is base catalyzed because of
the presence of MXDA amine hardener. It corresponds to the one-step
polymerization carried out by Matejka et al. [4-6] in which all the organic and
inorganic component are obliged to react altogether.
4.4.4 Preparation of Ep-Siy-Mx hybrids
A two steps method has been used in order to produce these hybrids, namely the
pre-hydrolysis of silica precursors followed by the synthesis of hybrids
themselves by mixing the siloxane precursors with epoxy resin DGEBA. In
details, a mixture of TEOS and GOTMS in molar ratio of 0.67 have been
employed. The hydrolysis reaction has been carried out at 60°C for 4 hours in 2-
propanol by using DBTDL as catalyst and the following molar ratio for the water
content:

109
TEOS : H2O = 1 : 3 and GOTMS : H2O = 1 : 1.5
A HCl/H2O solution at 2wt% has been employed. The pH of the resulting
mixture was about 6-7. Then the reaction products have been mixed at room
temperature with the epoxy resin DGEBA, in order to obtain the desired amount
of siloxane content. The reaction mixture was concentrated by removing the sol-
gel solvents, namely ethanol, 2-propanol and water, by using a rotavapor in
vacuum. The extraction has been carried out for 15’ at 75°C and 30’ at 90°C.
During the first step at 75°C for three times, a mixture of water and 2-propanol
(i.e. 1 ml of H2O + 0.8 ml of 2-Propanol) has been added to the extracting
mixture to make complete the hydrolysis and condensation of siloxane moieties.
The hybrid mixture was then cooled at room temperature and the hardener
MXDA in stoichiometric amount with respect to the overall epoxide content
(namely from DGEBA and GOTMS) has been added. The mixture was
mechanically stirred and degassed in vacuum . The hybrids samples have been
cured on aluminium dish to form film with a thickness ranging from 1-3 mm, at
30, 60, 80, 100, 120 and 150°C for 1h during each curing step. The hybrids are
labelled as Ep-Siy-Mx, y indicating the actual silica content (i.e. the residual
value at 750°C of TGA in air flow thermograms), ranging from 3 to about 20
(Table 2).

110
Samples Siloxane content (wt %)
Ep-Mx -
Ep-Si3- Mx 3.4
Ep-Si7-Mx 7.6
Ep-Si12-Mx 11.7
Ep-Si15-Mx 14.8
Ep-Si20-Mx 21
Table 2 - Ep-Siy-Mx hybrids samples. The corresponding actual siloxane content is listed.
4.4.5 Preparation of Ep-Siy-Je hybrids
TEOS and GOTMS in molar ratio of 0.67 are partly hydrolyzed in 2-propanol by
using DBTDL as catalyst, and the following molar ratio for the water content:
TEOS : H2O = 1 : 3 (mol/mol) and GOTMS : H2O = 1 : 1.5 (mol/mol)
A solution at 2wt% of HCl in H2O has been employed. The precursors mixture
has been stirred at 60°C for 4 hours and then cooled at room temperature.
DGEBA has been added and then the solvents has been removed by rotavapor
extraction at 40°C for 15’. The hybrid mixture was cooled at room temperature
and then the hardener Jeffamine D230 has been added in stoichiometric amount
with respect to the both DGEBA and GOTMS epoxide content. The hybrids
samples have been cured on aluminium dish to form film with a thickness
ranging from 1-3 mm for 4h at 80°C and 12h at 180°C. The hybrids are named
Ep-Siy-Je, y indicating the actual silica content (i.e. the residual value at 750°C
of TGA in air flow thermograms), ranging from 7 to 22wt% (Table 3).

111
Samples Siloxane content (wt %)
Ep-Je 0
Ep-Si7-Je 6.6
Ep-Si12-Je 12.3
Ep-Si18-Je 17.8
Ep-Si22-Je 21.5
Ep-Je 0
Table 3 - Ep-Siy-Je hybrids samples. The corresponding actual siloxane content is listed.
4.5 Characterization Techniques
In this section there is a brief description of the several techniques and
experimental conditions adopted in the research to perform a complete
understanding of the chemical, physical and thermo-mechanical behaviour of the
hybrid/nanocomposites epoxy-based. For a few techniques, generally not usual
in the polymer field, the basic principles are also reported.
4.5.1 Fourier Transform Infrared (FT-IR) analysis
Fourier transform infrared (FT-IR) spectra were performed by using a Nicolet
FT-IR Fourier transform infrared spectrometer. FTIR spectra were collected over
the range 400-4000 cm-1 with a resolution of 4 cm-1.
Infrared spectroscopy was used to monitor the aminosilanes grafting process, in
the silylation reaction of Na-MMT, on KBr pressed disks containing 1% w/w of
inorganic powders. The spectra were acquired in transmission mode.
Moreover, to the aim to follow the epoxide cross-linking reaction, the FT-IR
spectra was acquired in transmission mode by leaving a thin film of either the

112
epoxy matrix or hybrid mixture on a KBr dish. The epoxide groups reduction has
been monitored in real time during the samples heating. In order to estimate the
conversion degree, α, of epoxide groups with respect to their initial
concentration, the following relationship has been applied:
00
0 1CC
CCC tt −=−=α
where C represents the concentration of epoxide groups and the subscripts 0 and
t denote, the initial and the generic reaction time t, respectively. According to the
Lambert-Beer law, the relation between the conversion degree and the
absorbance A (at 916 cm-1 for the epoxide group) can be obtained. Furthermore,
because of the reduction of film thickness during the curing cycle, a correction of
the absorbance area has be done. To this end, the area corresponding to the
absorbance of epoxide group must be normalized by using the area of an internal
reference. To this end, the stretching of aromatic CH groups at 1509 cm-1 has
been used, so that the epoxide conversion degree can be assessed according to
the following relationship:
where
Additionally, for the Ep-Siy-Je hybrid samples, due to the high reactivity of the
hybrid mixture at 80°C, the relative absorbance area at 25°C has been considered
as the first point, i.e. the A0916.
9160
9169160
AAA t−
=α1509
916916
AAA =

113
4.5.2 Gel permeation and chromatography
Gel permeation chromatography (GPC) also known as size exclusion
chromatography (SEC) is a chromatographic method in which molecules are
separated based on their size. In SEC, a column is packed with a porous
materials (typically silica or crosslinked polystyrene) and solvent is forced
through the column at rate typically 1ml/min and pressure of 50 to 200 bar. A
sample is dissolved in the same solvent that is running through the column and is
then introduced into the solvent stream going through the column.
Figure 18 - Schematic working picture of packed column in GPC technique.
A detector monitors the concentration of sample exiting the end of the column.
Inside the column, molecules are separated based on their hydrodynamic volume,
namely the volume the molecule occupies in a dilute solution. For polymers this
can vary greatly with the particular solvent and temperature. By studying the
properties of polymers in particular solvents and by calibrating each column
setup with samples of known molecular weight, it is possible to get a relative
distribution of molecular weights for a given polymer sample. Inside the column,
molecules are separated by whether or not they can fit within the pore size of the

114
packing materials. As a molecule flows through the column it passes by several
porous beads. If the molecule can fit inside the pore then it is drawn in by the
force of diffusion. There it stays a short while and then moves on. If a molecule
cannot fit into a pore then it continues following the solvent flow. For this
reason, in GPC column, molecules with larger size will reach the end on the
column before molecules with smaller size. The effective range of the column is
determined by the pore size of the packing. Any molecules larger than all the
pores in a column will be eluted together regardless of their size. Conversely, the
smaller molecules can enter the pores more easily and therefore spend more time
in these pores, increasing their retention time. Finally, for polymer separations
the pore sizes should be on the order of the polymers being analyzed.
According to Matejka, [8] the GPC measures were carried out filling the column
with polystyrene-divinylbenzene gel and using THF as eluent. They were used in
the Ep-Siy-Je procedure both to assess the inorganic network growth during the
sol-gel reaction at 60°C and to follow the cross-linking reactions of
DGEBA/siloxane hybrid mixture without the addition of the hardener.
4.5.3 Viscosity measures
The viscosity of reacting epoxy resin with APTES coupling agent was measured
at 22°C in a Plexiglas beaker with a static Vibro Viscosimeter A&D model SV-
100. The Vibro Viscosimeter measures the viscosity, in real time, by controlling
the amplitude of the sensor plates immersed in a sample, specifically the value of
viscosity is directly proportional to the driving electrical current needed to
vibrate two sensors at a constant frequency of 30 Hz.

115
4.5.4 Differential Scanning Calorimetry (DSC)
Differential Scanning Calorimetry (DSC) is commonly used to detect transitions
and sub-transitions such as melting point and glass transition temperature (Tg) of
the polymeric materials.
The DSC measures on solid samples have been performed on a TA Instruments
model Q1000. The samples (about 10mg in weight) have been heated in hermetic
aluminum pans from -40 to 250°C at a heating rate of 10°C/min. Whereas liquid
samples have been analyzed by carrying out the measure suddenly after addition
of amine hardener on a TA Instruments model Q20 in the temperature range -120
to 250°C. A second scan, if does, has been done by using the same heating rate.
4.5.5 Dynamic Mechanical Thermal Analysis (DMA)
Dynamic-mechanical measurements were performed on a DMA Q800 of TA
Instruments.
For the Epoxy/MMT Composites the single cantilever method at a frequency of 1
Hz and 25 µm strain amplitude has been used. Heating of the specimens was
performed at 3°C/min in the temperature range from 0°C to 180°C. The samples
were dried at 80°C for 24h before testing.
The measure on the Epoxy/silica Hybrids have been carried out using a
sinusoidal tensional deformation. The samples were heated from -50 to 250°C at
a constant hating rate of 3°C/min. The frequency and amplitude of the vibration
were adjusted to 1 Hz and ±5µm, respectively.

116
4.5.6 Thermogravimetric Analysis (TGA)
Thermogravimetric analysis (TGA) was carrying out on a TGA 2950
thermobalance (TA Instruments). Samples were heated from 30 to 750°C at a
heating rate of 10°C/min under either nitrogen or air flow. Some results were
displayed in terms of first derivative mass loss (DTA).
To the aim to assess the grafting degree of aminosilanes after the silylation
reaction on MMT powders, the thermogravimetric analysis in nitrogen flow has
been used and the amount of grafted and intercalated aminosilanes was
calculated using the following relationship [9]:
( )[ ] MWWgmequivamountgraftedsilane
×−×=
−
−
600200
6002003
100
10)/(
where W200-600 corresponds to the mass loss between 200 and 600°C and M
(g/mol) is the molecular weight of the grafted silane molecules. The percentage
of grafted amount, which corresponds to the percentage of organic aminosilane
moieties with respect the total inorganic mass, was calculated as follows:
600200
600200
100
100(%)
−
−
−×=
WWamountgraftedsilane
4.5.7 Cone calorimeter test
Combustion studies were performed by using an oxygen consumption
calorimeter (Fire testing technology Limited FFT dual cone calorimeter model)
in the vertical orientation mode. The rectangular samples 10x10x5 mm3 were
irradiated with a Heat Flux equal to 35 kW/m2. Heat release rate (HRR) were
measured in triplicate and the results are shown as the average of the curves. It is
worth mentioning that usually the HRR measurements with Cone calorimeter are

117
performed by adopting the horizontal orientation mode. That is the sample is
orientated horizontally with respect the irradiating metal jackets. However for
epoxy resins, which are characterized by a microstructure intrinsically
inhomogeneous, this configuration provides not reliable results. The vertical
orientation mode allowing a heat boundary layer to be established around the
sample, results a method more reliable and offers the advantage of more
reproducible results.
4.5.8 Physical and mechanical properties testing (tensile test)
The tensile properties (tensile strength at break, strain at break and elastic
modulus) of the neat epoxy sample and the Epoxy/MMT Composites were
measured with a SANS CMT universal testing machine in accordance with the
ASTM-D638-03 by using a load cell of 1 kN, a crosshead speed of 1 mm/min
and an initial pre-load of 0.2 N. The measurements were carried out at room
temperature and an average value of five samples was determined.
Mechanical tests on Epoxy/Silica Hybrids were performed using a universal
testing machine (Instron model 4505), equipped with a temperature control
chamber. Values for the Young’s modulus were obtained from the tangent of the
force/deflection curve using 3-point bending tests, (ASTM D790 method), using
rectangular specimens, 60.0x6.0x4.0 mm, and a span/width ratio of 8:1. The
measurements were carried out at a cross-head speed of 1 mm/min, at
temperatures varying from ambient temperature to 180 °C.
The yield strength was measured in compression on specimens, 60.0x6.0x4.0
mm, loaded along the length. The tests were carried out at different cross-head
speeds and in the same temperature range employed for modulus measurements.
Due to the absence of a definite maximum in the load/deformation curves the

118
yield strength was estimated as the stress corresponding to the 5% offset strain
from the elastic strain.
Fracture mechanics tests were carried out according to the ASTM D5045-99
standard method. A multiple crack length procedure was used in which single
edge notch (SEN) specimens, 60.0x6.0x4.0 mm, with notch length varying from
1.5 to 4.5 mm, extended by 0.2 mm by a razor blade fixed to a micrometer
apparatus, were fractured in a three point bending mode at room temperature. At
least three samples for each notch length were used. The final length of the notch
was measured using an optical microscope after fracturing the specimens.
The critical stress intensity factor, Kc, was calculated according to the following
equation:
aYKc σ=
where σ is the stress calculated as the outer skin stress for a rectangular beam in
3-point bending, Y is the compliance calibration factor obtained from the tables
quoted in the literature [10] and a in the notch length.
The critical strain energy release rate, Gc, was estimated through the equation,
φBWUGc =
where U is the energy at fracture initiation, B and W are the thickness and the
width of the specimens, respectively, and φ is the correction factor that takes into
account the rate of change of compliance (C) with crack length.
1
)/(
−
=
WaddCCφ
The values of φ were obtained from the tables reported in literature [11].

119
4.5.9 Nanoindentation measures
The indentation experiment was performed with a NanoTestTM Platform made by
Micro Materials Ltd to evaluate the material’s mechanical properties including
modulus, hardness and creep behavior. A Berkovich diamond tip with three-side
pyramidal geometry is driven to indent the surface of sample. The nano-
indentation tests was conducted at a maximum load of 100 mN, with an initial
load of 0.02 mN. The load was then held at maximum value for 60 s in order to
monitor the creep behavior of neat epoxy and composite samples. Finally the
indenter was withdrawn from the sample with the same rate as in the loading
cycle until 10mN was reached. At least 20 indents were performed on each
sample and the distance between the indentations was about 100 nm to avoid an
interaction effect. The Hardness has been evaluated as the indentation maximum
load (i.e. 100mN in this experiment) divided by the projected contact area which
for a perfectly sharp Berkovich indenter is calculated as:
256.24 chA =
where hc is the contact depth.
The elastic modulus has been calculated from the reduced elastic modulus by
using the following formula:
i
i
r EEE
22 111 νν −+−=
where E and ν are the elastic modulus and the Poisson’s ratio for the sample
respectively, and Ei and νi are the same for the indenter. For the case at hand ν
has been set equal to 0.35 [12] while for diamond Ei has been set equal to
1140GPa and νi to 0.07 [13].

120
4.5.10 Scanning electronic Microscopy (SEM) and Energy
Dispersive Scanning (EDS)
In scanning electron microscopy (SEM) the radiation that interacts with the
specimen is a beam of high energy electrons, produced from a filament and
accelerated by a high voltage. Three imaging signals can be used back scattered
electrons, secondary electrons and X-rays. Characteristic X-rays have well
defined energies from different atoms. Thus analytical information can be
obtained from an X-ray spectrum. This technique is well known as Energy
Dispersive Scanning (EDS). Back scattered electrons are primary beam electrons
that have been elastically scattered by the nuclei in the sample and escape from
the surface. Thus they can be used to obtain compositional contrast in the
sample. Secondary electrons are emitted with low energy from the top few
nanometers of the materials. This technique yields topographic images of the
sample surface.
Scanning electron microscope (SEM, type Leica S440) was used to observe the
morphology of the fracture surface of the samples submitted to tensile tests. A
thin layer of gold was sputtered on the fracture surface of specimens, prior to
SEM investigation, for providing electrical conductivity.
4.5.11 Wide (WAXS) and Small Angle X-ray Scattering (SAXS)
Macromolecular scale structure is investigated by SAXS method. As known, in
addition to the size of the polymers or heterogeneity domains, the SAXS method
also gives a geometrical description of the structures using the concept of fractal
geometry, because random processes of polymerization or aggregation usually
lead to the formation of fractal objects. The fractal structure is characterized by

121
mass fractal dimension Dm, which is a measure of the compactness or the shape
of the fractal object. Dm describes volume distribution of a mass, m, as m ~rDm,
where r is the radius of the fractal object.
The internal structure of the siloxane domains could be extracted by assuming
the Multiple Structural Level Model of Beaucage et al [14] which is capable
describing scattering functions containing multiple length scales (Guinier
regimes) separated by power low scaling regimes (Porod regimes). This
approach has been widely applied to scattering data from in situ produced
silica/siloxane domains. In particular the Guinier regimes account for the several
length scales which constitute the hierarchical structure of the inorganic domain
while the power regimes give information about the fractal surface or the fractal
mass of the fractal object. A log–log plot of SAXS data, called Porod plot, could
give an indication of the fractal nature of inorganic domains, specifically if the
system displayed a mass or surface fractal behaviour [15]. The most important
parameters extracted from the log-log diagram and used to determine the internal
structure of the inorganic domains are either the fractal dimension Dm, or the
fractal surface Ds, estimated from the slope of the curve in SAXS profiles and
the q values where a discontinuity is observed in the linear behaviour of the
SAXS diagram [16]. In detail, if the slope of the scattering curve ranging from 0
to -3, a fractal dimension Dm of the fractal object is extracted. Dm is a measure of
the compactness of the inorganic domains and describes volume distribution on
the mass fractal [5]; the higher the Dm absolute value, the higher the compactness
of the fractal object. On the contrary, if the slope ranging from -3 and -4,
information about the fractal surface Ds, as the shape of inorganic domains,
could be extracted. Dense smooth particles give a slope of -4. Moreover, the
inorganic structure size, L, could be estimated by using the following equation:
122
L=2π/qi
where qi represents the value of the scattering vector in correspondence of the i-
change in the slope of the log-log diagram. Whereas, when the SAXS profiles
showed the knee shape characteristic of Guinier regime, the gyration radius (Rg),
which gives a measure of the mean square distance of the scattering centres
within inorganic domains from the centre of gravity [16] was determined. In
detail, Rg is related to sizes of inorganic siloxane domains, and was calculated
from the slope in the linear region of a plot of ln(I(q)) versus q2, according to
Guinier’s relation [17]:
)3/exp()( 22gRqqI −∝
Therefore, SAXS measures allowed to estimate both the internal structure and
dimension of the siloxane domains of Epoxy/Silica Hybrids
X-ray diffraction experiments were carried out to evaluate the shift of the (001)
basal spacing of Na-MMT after the silylation reaction. The intergallery space
between the clay platelets is defined as the basal spacing, and is usually denoted
as d001 since it is derived from the (001) diffraction peak by using Bragg
equation. The displacement of the (001) diffraction peak upon silylation was
followed by WAXS measurements.
Wide (WAXS) and Small Angle X-ray Scattering (SAXS) were performed using
an Anton Paar SAXSess camera equipped with a 2D imaging plate detector.
1.5418Å wavelengths CuKα X-Rays were generated by a Philips PW3830 sealed
tube generator source (40kV, 50mA) and slit collimated. All scattering data were
dark current and background subtracted, and normalized for the primary beam
intensity. Figure 19 shows the image of the apparatus SAXSess by Anton Paar
with an example of 2-D SAXS and 1-D SAXS results.

123
Figure 19 – SAXSess instrument, 2-D SAXS (in the middle) and 1-D SAXS profile (on the
right).
4.5.12 Nuclear Magnetic Resonance (NMR) characterization 29Si, 13C, and 1H-NMR spectroscopy are excellent tools for studying local
structure at the atomic scale. In the case of epoxy-siloxane hybrids materials, the 29Si-NMR spectroscopy allows to determine the conversion degree of siloxane
domains, also during the inorganic condensation. The NMR analysis provides
fractions of the structural units Qij, corresponding to Si atoms with j hydrolyzed
groups (Si-OH) and i siloxane bridges (Si-O-Si), as pictured in Figure 20.
Distribution of these structure units characterizes the structure topology of silica.
The condensation conversion is defined as:
4= i
Si
iQα
In the case of trialkoxysilanes GOTMS, the formed siloxane structure is
described by the distribution of Ti units, i.e. the structural units with I siloxane
bonds –O-Si- attached to the central atom. The conversion is defined as:
3= i
Si
iTα
Therefore the total siloxane conversion degree is defined as:

124
4
432
3
32 4321321 QQQQTTTq ++++++=
The assignment of the NMR bands is as follows: T0 from -41 to -43 ppm, T1
from -50 to -52 ppm, T2 from -59 to -61 ppm, T3 from -66 to -69 ppm [18], Q4 at
about -109 ppm, Q3 from -101 ppm, Q2 from -90 ppm and so on by decreasing
of about 10 units meanwhile the siloxane structure become less bridged [19].
The 1H, 13C and 29Si NMR provided information on both the hydrolysis and
condensation degree of siloxane precursors and the stability of GOTMS epoxy
ring during the pre-hydrolysis reaction mixture at 60°C. To achieve this goal, 29Si, 13C, and 1H-NMR measures on liquid reacting mixture were performed on
the un-dilute reaction solutions, by using a glass coaxial tube with the neat
solution and deuterated water in two different sites in order to avoid any solvent
influence. The 29Si and 13C-NMR spectra were measured in 54-mm at 25°C
using a NMR spectrometer at frequencies of 75.4 and 50.6 MHz, respectively.
An external standard, HMDS (hexamethyldisoloxane) was used for calibration of
the 13C and 29Si scale, the chemical shift of 13C and 29Si having the value of and
6 ppm, respectively, referred to TMS (tetramethylsilane). For measurement of 29Si spectra of isolated fractions, the DEPT pulse sequence was used to increase
sensitivity of the measurement. Deuterated water was used as the solvent (in the
external site of the coaxial tube) for an internal deuterium block.
Solid-state 29Si-NMR spectroscopy (29Si-CPMAS-NMR) was performed on a
Bruker AV-300. NMR spectra were obtained by applying the following
parameters: 5000 Hz of rotor spin rate; 5 s of recycle time; 5 ms of contact time;
33 ms of acquisition time; 12500 scans. Samples were packed in 4mm zirconia
rotors with KelF caps. The pulse sequence was applied with a 1H ramp to
account for the non-homogeneity of the Hartmann-Hahn condition at high spin

125
rotor rates.Chemical shifts are relative to tetramethylsilane, using an external
sample of tetrakis-trimethylsilyl-silane (TTMSS; up-field signal -135.4 ppm) as
secondary reference.
Si
OHOH
OH
T0
Si
OHOH
OH
Si
OHOH
OH
T0
Si
OOH
OH
SiT1
Si
OOH
OH
SiT1
Si
OO
OH
SiT2
Si
Si
OO
OH
SiT2
Si
Si
OO
O
SiT3
SiSi
Si
OO
O
SiT3
SiSi
SiOH
OHOH
Q0
OH
SiOH
OHOH
Q0
OH
SiOH
OOH
Q1
OH
Si
SiOH
OOH
Q1
OH
Si
SiOH
OO
Q2
OH
SiSi
SiOH
OO
Q2
OH
SiSi
SiO
OO
Q3
OH
SiSi Si
SiO
OO
Q3
OH
SiSi Si
SiO
OO
Q4
O
SiSi Si
Si
SiO
OO
Q4
O
SiSi Si
Si
Figure 20 - Structure units in terms of Ti and Qi for GOTMS and TEOS, respectively.

126
4.5.13 Molecular Dynamics (MD) analysis
All molecular dynamics (MD) simulations were performed using Materials
Studio (v.4.4, Accelrys, San Diego, USA). The starting structure of Na-MMT
was taken from previous work [20-24]. The main object of the computational
part of this study was the prediction of the basal spacing in the aminosilane
functionalized MMT. Since the quantities affecting the MMT basal spacing are
highly sensitive to the non-bonded components of the force field (FF) employed
(e.g., atomic charges and van der Waals parameters), the ad hoc FF developed by
Heinz and coworkers [25-26] was adopted for the optimization of the initial
MMT structure and in all subsequent calculations. As demonstrated by Heinz et
al. [25-26] for Na-MMT and other phyllosilicates, this accurately derived FF is
able to describe, among many other properties, the thermodynamics of surface
processes more reliably by reducing deviations of 50-500% in surface and
interface energies to less that 10%, thus constituting a fundamental step towards
a quantitative modeling of interface processes involving layered silicates.
Accordingly, the resulting lattice of the optimized MMT model was monoclinic,
with space group C2/m, and characterized by the following lattice parameters: a
= 5.20 Å, b = 9.20 Å, c = 10.13 Å, and α = 90°, β = 99°, γ = 90°, in excellent
agreement with the available literature [26-29].
According to the computational recipe adopted, the molecular models of the
aminosilane compounds considered (see Scheme 3) were built and geometry-
optimized following a well-validated MD-based protocol [20-24, 30].

127
A1100 A1120
A1130
Scheme 3 - Chemical structures of the considered aminosilanes and crystallographic unit cell of MMT. The atom color code is as follows: gray, C; light gray, Si; blue, N; red, O,
white, H; purple, Na; green, Al; pink, Mg.
The optimized MMT unit cell model was then modified by grafting the layers
with a suitable number of aminosilane molecules [20]. For each aminosilane,
three possible options were considered for creating covalent bonds between the

128
silicon (Si) atoms of the aminosilane and the MMT surface oxygen (O) atoms, as
illustrated in Scheme 4.
Scheme 4 - Schematic representation of possible covalent bonds formation between the Si atoms of the aminosilane molecules and the MMT surface O atoms. A: two covalent bonds
on the same MMT surface; B: three covalent bonds on the same MMT surface; C: two covalent bonds bridging two MMT layers.
The new equilibrium position of the Na+ counterions on the aminosilane-
modified MMT sheets were determined following the procedure suggested by
Heinz et al. [26]. Accordingly, half of them were placed 1 nm away on one side,
and the remaining half 1 nm from the other side of the MMT layer in 10 different
arrangements. Molecular mechanics energy minimizations were then performed
to convergence, keeping all other MMT atoms fixed, and the structure with the
lowest energy was finally selected for further simulations. In this configuration,
the Na+ ions were found at about 1.8 Å from the center of the surface oxygen
atoms, or about 4.8 Å from the central plane of the metal atoms, in excellent
agreement with previous simulations [31] and experimental NMR data [32].
Lastly, each aminosilane-MMT unit cell was replicated four times in the a
direction, and three times in the b direction, thus yielding a final simulation

129
supercell for each aminosilane modifier with the following lattice parameters: a
= 20.80 Å, b = 27.60 Å, and α = 90°, β = 99°, γ = 90°. The c values in the initial
model of aminosilane-MMT supercells were prolonged according to a bi-layer
arrangement of each aminosilane molecules.
Molecular mechanics (MM) and molecular dynamics (MD) simulation protocols
were then applied, consisting of a preliminary cell energy minimization
procedure followed by isobaric-isothermal (NPT) MD runs at 300 K. To avoid
crystal structure deformation during minimization, initially both MMT layers
were treated as rigid bodies by fixing all cell dimensions except the c axis, whilst
all atoms in the interlayer space including the cations were allowed to move
without any constraint. Then, in a second minimization round, also movement
along the c axis was allowed, leading to a suitable starting interlayer distance for
each model. Subsequently, 1 ns NPT MD experiments were performed at 300 K
for each system, using the Verlet algorithm and an integration step of 1 fs.
Again, both MMT layers were treated as rigid bodies by fixing all cell
dimensions except the c axis, leaving all remaining atoms in the interlayer space
free to move without any constraint. The Ewald summation method [33] was
applied for treating both van der Waals and electrostatic interactions, while
temperature was controlled using the Nosé thermostat [34].
The final basal spacing values for each aminosilane-MMT system were extracted
from the final part (0.5 ns) of the equilibrated MD trajectory.
Additionally the molecular dynamics (MD) simulation was used to make a
theoretical estimation of the length between two neighbouring siloxane cages
bonded with Jeffamine D230 in Ep-Siy-Je hybrids samples. Here average size
oxypropylene monomer unit is introduced (x=2 and x=3) for Jeffamine D230

130
[35] and two different atomistic models are built chemically linking two alkyl
POSS cages and using one Jeffamine D230 molecule, viz. the cages react with
two opposite –NH2 groups, namely head-tail attach, or with the same –NH2
group, i.e. head-head attach. Furthermore, with the aim of creating more realistic
models, each glycidoxy group is considered reacted with a Jeffamine D230
molecule and, in turn, with a DGEBA chain. These model systems are simulated
at 80°C.
131
4.6 References
[1] A. M. Shanmugharaj; K. Y. Rhee; S. H. Ryu; J. Colloid Interface Sci. ,
298, 2006, 854.
[2] F. Piscitelli; G. Callegaro; M. Lavorgna; E. Amendola; Proceedings of
the 4th International Conference on Times of Polymers (TOP) and
Composites, Ischia, Italy, September 21-24, 2008.
[3] D. Acierno; A. D’Amore; L. Grassia, Eds.; University of Naples
Federico II: Naples, IT, 2008; pp. 181-183)]
[4] L. Matejka; K. Dusek; J. Plestil; J. Kriz; F. Lednicky; Polymer 40,
1999, 171.
[5] L. Matejka; J. Plestil; K. Dusek; Journal of Non-Crystalline Solids 226,
1998, 114.
[6] L. Matejka; O. Dukh; J. Kolarik; Polymer, 41, 2000, 1449.
[7] K. Zou; M. D. Soucek; Macromol. Chem. Phys, 205, 2004, 2032–2039.
[8] L. Matejka; Journal of Non-Crystalline Solids, 270, 2000, 34-47.
[9] N. N. Herrera; J. M. Letoffe; J. L. Putaux; L. David; E. Bourgeat-Lami;
Langmuir, 20, 2004, 1564.
[10] F. Brow; J. Srawley; ASTM Spec Tech, 510, 1996, 13.
[11] E. Plati; J. G. Williams; Polymer Engineering and Science , 15, 1975,
470.

132
[12] M. Krumova; A. Flores; F.J. Balta Calleja; S. Fakirov; Colloid
Polymer Science, 280, 2002, 591.
[13] L. Shen; L. Wang; T. Liu; C. He; Macr. Materials and Engineering ,
291, 2006, 1358-1366.
[14] G. Beaucage; T.A. Ukibarri; E.P. Black; D.W. Schaefer; Multiple Size
Scale Structures in Silica-Siloxane Composites Studied by Small-Angle
Scattering, in Hybrid Organic-Inorganic Composites edited by J.E. Mark,
CYCLee and PA Bianconi, America Chemical Society, Washington, DC
1995.
[15] C. S. Betrabet, G. L. Wilkes, Chem Mater, 7, 1995, 535.
[16] M. Xiong; S. Zhou; L. Wu; B. Wang; L. Yang; Polymer, 45, 2004,
8127.
[17] S. Yano; K. Iwata; K. Kurita; Mater. Sci. Eng. C, 6, 1998, 75.
[18] L. Matejka; O. Dukh; J. Brus; W. J. Simonsick; B. Meissner; Journal
of Non-Crystalline Solids, 270, 2000, 34-47.
[19] Colloidal silica, Fundamentals and Applications , Ed. Martin J.
Schick.
[20] M. Fermeglia; M. Ferrone; S. Pricl; Fluid Phase Equilib. , 212, 2003,
315.
[21] R. Toth; A. Coslanich; M. Ferrone; M. Fermeglia; S. Pricl; S. Miertus;
E. Chiellini; Polymer, 45, 2004, 8075.
[22] G. Scocchi; P. Posocco; A. Danani; S. Pricl; M. Fermeglia; Fluid
Phase Equilib., 261, 2007, 366.

133
[23] M. Fermeglia; M. Ferrone; S. Pricl; Mol. Simul., 30, 2004, 289.
[24] G. Scocchi; P. Posocco; J. W. Handgraaf; J. G. E. M. Fraaije; M.
Fermeglia; S. Pricl; Chem. Eur. J., 15, 2009, 7586.
[25] H. Heinz; U. W. Suter; J. Phys. Chem. B, 108, 2004, 18341.
[26] H. Heinz; H. Koerner; K. L. Anderson; R. A. Vaia; B. L. Farmer;
Chem. Mater., 17, 2005, 5658.
[27] G. Brown; The X-ray Identification and Crystal Structures of Clay
Minerals, Mineralogical Society Press, London, 1961.
[28] S. W. Bayley; Reviews in Minera logy, Mineralogical Society of
America Press, Chelsea, Michigan, 1988.
[29] S. I. Tsipurski; V. A. Drits; Clay Miner., 19, 1984, 177.
[30] R. Toth; D. J. Voorn; J. W. Handgraaf; J. G. E. M. Fraaije; M.
Fermeglia; S. Pricl; P. Posocco; Macromolecules, 42, 2009, 8260.
[31] E. Hackett; E. Manias; E. P. Giannelis; Chem. Mater., 12, 2000, 2161.
[32] D. K. Yang; D. B. Zax; J. Chem. Phys., 110, 1999, 5325.
[33] P. P. Ewald; Ann. Phys., 64, 1921, 253.
[34] S. Nosé; Prog. Theor. Phys., Suppl. 103, 1991, 1-46.
[35] J. Brus; M. Spirkova; D. Hlavata; A. Strachota; Macromolecules, 37,
2004, 1346-1357.

134
Chapter 5: Epoxy/MMT Composites
This chapter is concerned with the main aspects of the Epoxy/MMT Composites
research and the related experimental results, including their interpretation and
evaluation in relation to the objectives.
At first the silylation reaction of sodium montmorillonite (Na-MMT) using
3-aminopropyltriethoxysilane (A1100)
N-(2-aminoethyl)-3-aminopropyltrimethoxysilane (A1120)
3-[2-(2-aminoethylamino)ethylamino]-propyl-trimethoxysilane (A1130)
has been described. The effects on the Na-MMT d-spacing of three aminosilanes
of different chain length were studied in details by combining experimental and
computational techniques.
Therefore, the silylated A1100 and A1120 MMT have been dispersed in DGEBA
to prepare several composites. The Metaxylilene diamine (MXDA) has been
used as hardener. The effect of both the silylation reaction and the dispersion
method on the mechanical and thermal properties of nanocomposites has been
evaluated.

135
5.1 Silylation reaction: preliminary study to evaluate
the effect of aminosilanes and process parameters on the
basal spacing of Na-MMT.
5.1.1 Fourier Transform Infrared analysis
Infrared spectroscopy was performed in order to identify the presence of the
organic moieties on the Na-MMT platelets due to silylation. As pointed out by
Zhao et al. [1], the main evidence for the successful intercalation/silylation of the
aminoalkylsilanes in the Na-MMT galleries is the presence of C-H and N-H
absorbance peaks in the corresponding IR spectra. Figure 21 shows an
enlargement of the IR between 3800 and 2500 cm-1 for the A1100-MMT sample
using the Procedures 1 and 2. In the same Figure, the spectra of the A1100 silane
molecule and the pristine Na-MMT are also shown for comparison.
Figure 21 - Infrared spectra of: (a) A1100; (b) pristine Na-MMT; (c) A1100-MMT obtained
from Procedure 1; (d) A1100-MMT obtained from Procedure 2

136
Compared to the neat Na-MMT spectrum, the two functionalized powders show
additional peaks which can be attributed to the asymmetric and symmetric
stretching vibrations of the methylene groups at 2936 and 2885 cm-1,
respectively, thus confirming the presence of the organic moieties on the Na-
MMT surface [2-4]. A shoulder at ~3290 cm-1 in Figure 21 may be assigned to
the stretching of the NH2 group [5]. It is worth noting that, by increasing the
aminosilane concentration and the reaction temperature, both methylene and NH2
adsorption peaks in Figure 21 become progressively more pronounced,
suggesting the presence of a larger amount of intercalated/grafted silane
modifiers. No evaluation was performed on the relative intensity of the peaks
related to the stretching vibration of isolated or hydrogen bonded OH groups (at
3620 cm-1 and 3440 cm-1, respectively), because the possible presence of
adsorbed water cannot be ruled out [6].
5.1.2 Thermogravimetric analysis
Thermogravimetric analysis (data not shown) was carried out on the Na-MMT
powders prior and after the silylation reaction performed by Procedure 1. The
mass losses in the range between 200 and 600°C were used as entry parameters
in the following equations:
( )[ ] MWWgmequivamountgraftedsilane
×−×=
−
−
600200
6002003
100
10)/( (1)
600200
600200
100
100(%)
−
−
−×=
WWamountgraftedsilane (2)

137
to evaluate the grafted aminosilane amounts, and the corresponding results are
displayed in Table 4. Interestingly, by the application of Procedure 1 the grafted
aminosilane amounts increase with increasing of the aminosilane alkyl chain.
Mass loss(a)
(%) Grafted amount
(mequiv/g)(b)
Grafting amount (%)(c)
A1100-MMTProcedure 1 8.8 0.4 (I=68%; S=32%) 9.6
Procedure 2 11.4 0.6 (O=21%; I=38%;
S=41%) 12.8
A1120-MMT 14.6 0.8 17.1 A1130-MMT 18.8 0.9 23.2
Table 4 - Thermogravimetric analysis of functionalized MMT ((a)Mass loss between 200 and 600°C. (b)Determined by using Eq. (1). (c)Determined by using Eq. (2).).
In order to identify the degraded species, two pastes obtained by dispersing the
Na-MMT in water and glycerol, respectively, were analyzed. The results are
displayed in terms of first derivative mass loss in Figure 22.
Figure 22 - DTA curves of pristine Na-MMT, functionalized Na-MMT powders, and Na-
MMT/water and Na-MMT/glycerol pastes

138
The pristine Na-MMT shows two peaks at 50 and 630°C corresponding to the
physically adsorbed water and the dehydroxylation of the clay, respectively [7-
8]. The curve related to the Na-MMT-H2O paste shows a peak at 50°C related to
the loss of physically adsorbed water, whereas the two other peaks at 270 and
358°C (Figure 22) can be sensibly ascribed to the loss of intercalated water. By
analogy, the intense peak at 215°C in the Na-MMT-Gly curve could be assigned
to the loss of physically adsorbed glycerol, whilst the weak peak at ~350°C could
refer to the intercalated glycerol. As for the Na-MMT-H2O paste, the peak at
higher temperature is due to MMT dehydroxylation. The DTG curves of the
A1100-MMT system shows the mass loss of physically adsorbed water at 50°C,
and other two peaks at 418 and 540°C, respectively. The first one is ascribable to
the intercalated aminosilanes, whereas the broad peak at 540°C could be linked
to the decomposition of the chemically bound aminosilanes [9]. Due to the
consumption of hydroxyl groups belonging to the platelet edges, the Na-MMT
dehydroxylation peak at 630°C nearly vanishes for this system. Lastly, the
absence of the peak at 215°C related to the physically adsorbed glycerol speaks
in favour of the reliability of the applied washing procedure.
With the goal of evaluating the effect of the reaction parameters (i.e. temperature
and aminosilane concentration) on the silylation process, the amount of
intercalated and grafted aminosilane was assessed by performing TGA analysis
on the A1100-MMT systems obtained by using two different reaction routes
summarized in Table 1 as Procedure 1 and 2. To eliminate the different
contributes due to dissimilar adsorbed amounts of water, the curves shown in
Figure 23 A were normalized assigning to each curve the value of 100 to the
mass achieved at 150°C. It is worth noting that, as we will discuss later, by
increasing both temperature and aminosilane concentration, the quantity of

139
aminosilanes able to penetrate into the Na-MMT gallery platelets slightly
increases. Moreover, the grafted aminosilane amount increased by using the
Procedure 2 compared to Procedure 1 (see Table 4). The DTG analysis
performed on the A1100-MMT product obtained by Procedure 1 (Figure 23 B))
shows the presence of two peaks at 418 and 540°C, ascribed to the intercalated
aminosilanes and chemically bounded aminosilanes, respectively [9].
Interestingly, the A1100-MMT product prepared following Procedure 2 displays
a third peak at 310°C, which could be attributed to the aminosilane interacting
with the outer surfaces of the clay platelets (see Figure 23 B).
200 300 400 500 600 70086
88
90
92
94
96
98
100
a
c
b
Mas
s (%
)
Temperature (°C)
A)

140
200 300 400 500 600 700
0.00
0.02
0.04
0.06
0.08
b
c
a
200 300 400 500 600 700
540°C
418°C
310°CB)
630
540
418
Der
iv. M
ass
(%/°
C)
Temperature (°C)
310
Figure 23 - Thermogravimetric analysis of Na-MMT before and after silylation reaction using two different process parameters: (A) weight losses curve; (B) first derivative of
weight losses curve. The inset shows the peak deconvolutions: (a) pristine Na-MMT; (b) A1100-MMT obtained from Procedure 1; (c) A1100-MMT obtained from Procedure 2.
With these peaks assignments in mind, it was possible to quantify each degraded
moieties using the deconvolution method of the Origin program. The results of
these deconvolutions are summarized in Table 4, where O indicates the
aminosilane interacting with the outside platelets, and I and S are the intercalated
and chemically bonded aminosilanes, respectively. The results show that higher
temperature and aminosilane concentration values lead to an increased amount of
chemically bonded silanes with respect to the intercalated species. Moreover, and

141
perhaps more interestingly, only the A1100-MMT obtained by Procedure 2
displays aminosilanes interacting with the outside platelets.
5.1.3 Wide Angle X-ray Diffraction results and Molecular
Dynamics predictions
To quantify the effect of the length of the aminosilane alkyl substituents on the
Na-MMT basal spacing, silylation reactions were performed using the three
different aminosilanes A1100, A1120 and A1130, and adopting Procedure 1. The
X-ray diffraction patterns related to the (001) basal spacing, displayed in Figure
24, show that the introduction of any aminosilane type into the Na-MMT gallery
shifts the peak at lower 2θ values compared to the pristine Na-MMT.
3 4 5 6 7 8 9
5.9
5.7
5.3
7.5
Inte
nsity
2θ (DEG)
Na-MMT A1100-MMT A1120-MMT A1130-MMT
Figure 24 - X-ray diffraction patterns of Na-MMT before and after silylation reaction with
different aminosilanes.

142
This increase of basal spacing is a clear signal that each aminosilane species has
been grafted/intercalated in the inter-platelets space of Na-MMT. In detail, the
neat Na-MMT shows a peak at 2θ equal to 7.5°, corresponding to a d-spacing
value of 11.7Å, whereas the aminosilane-modified MMTs show diffraction
peaks at 2θ values between 5.3 and 5.9° (Table 5). Concerning the effect of the
alkyl chain length, the A1120-MMT and A1130-MMT systems show lower basal
spacing values, 15.3 and 15.0Å, respectively, compared to the A1100-MMT, for
which d001= 16.7Å. A major, important conclusion which can be drawn from the
analysis of data shown in Table 5 is that the longer the organic chain on the
aminosilane molecules, the smaller the d-spacing in the relevant modified MMT,
when the process parameters owing to the Procedure 1 have been used to carry
out the silylation reaction.
System 2θ (deg) d-spacing (Å)
Pristine Na-MMT 7.5 11.7
A1100-MMT Procedure 1 5.3 16.7
Procedure 2 4.0 22.2
A1120-MMT 5.7 15.3
A1130-MMT 5.9 15.0
Table 5 - d-spacing values for aminosilane-modified MMT estimated by XRD analysis.
To try to find a molecular rationale for the somewhat counterintuitive behavior
reported above, molecular dynamics (MD) simulations have been performed on
model systems.
Table 6 shows the values of estimated aminosilane-MMT interlayer spacing for
all model systems considered (see Scheme 4) as obtained from 1 ns NPT MD
143
simulations. From these values, and the inspection of the relevant MD
trajectories, we can draw some useful considerations.
First of all, independently of the aminosilane chain length, aminosilane
molecules bridging two MMT layers (i.e., option C in Scheme 4) result in the
lowest d-spacing values (see Table 6). From the viewpoint of further
employment of aminosilane-MMT systems for polymer intercalation and/or
exfoliation, this is the worst case possible, as the distance between MMT sheets
is not only practically coincident with that of unmodified MMT (i.e., 11.7 Å),
but also the aminosilane molecules act as ‘anchoring points”, counteracting any
eventual macromolecular intercalation/exfoliation. Figure 25 shows an
equilibrated MD snapshot of the A1100-MMT/option C system as an example.
System d-spacing (Å)
Option Aa Option Ba Average A and B Option Ca
A1100-MMT
Procedure 1
17.0 16.2 16.6 11.7
A1100-MMT
Procedure 2
21.9 21.7 21.8 11.7
A1120-MMT 15.9 15.3 15.6 11.9
A1130-MMT 15.1 14.8 14.9 11.9
Table 6 - d-spacing values for aminosilane-modified MMT estimated by MD simulations (aFor the meaning of Options A, B and C, please refer to Scheme 4.).

144
Figure 25 - Equilibrated MD snapshot of the A1100-MMT/option C system (see Scheme 4).
The results obtained for the two alternative bonding options (i.e., A and B in
Scheme 4), expressed as average d-spacing values (see 3rd column in Table 6),
are in excellent agreement with the experimental evidences discussed above.
Notably, however, in contrast to common observations during the intercalation of
small molecules between the silicate layers, where longer organic chains
normally result in higher interlayer spacing, for aminosilane-MMT systems a
reverse trend is observed. Indeed, longer aminosilane molecules yield lower d-
spacing if the silylation reaction has been carried out by using the process
parameters of Procedure 1.
A sensible explanation for this coupled experimental/simulation evidence could
be hypothesized, keeping in mind that the organic tail of each aminosilane
molecule features not only -CH2 groups, which are hydrophobic, but also one or
more -NH2/NH- groups, which are endowed with hydrophilic character, and
capable to originate both intra- and intermolecular hydrogen bonds (see Scheme
3).

145
Following these lines of reasoning, for the smaller aminosilane molecule A1100,
characterized by the presence of a short chain and only one terminal –NH2 group,
a mechanism quite similar to that observed for quaternary ammonium salt-
modified MMT can be envisaged. Accordingly, the A1100 aminosilane chains
are attracted by the surface of clay and, while flattening onto it, provide a
screening between the charges of the MMT layers ultimately favoring the
weakening of interlayer attraction and, hence, a larger d-spacing value.
On the other hand, the other two aminosilane molecules (A1120 and A1130),
featuring longer, more mobile chains with one and two –NH groups,
respectively, have a strong tendency to interact among themselves (via both
intermolecular hydrogen bonding and hydrophobic interactions). As a result,
their flattening onto the MMT surface is reduced, the charge distribution on the
MMT surface is less screened, and the clay sheets do not tend to separate as
much as in the case of A1100 chains. Figure 26 (A) and (B) show a comparison
between two equilibrated MD snapshots for A1100-MMT and A1120-MMT,
respectively, in which the different degree of interactions between the
aminosilane chains, resulting in a smaller d-spacing, is well evident.

146
(A)
(B)

147
(C)
Figure 26 - Equilibrated MD snapshot of (A) A1100-MMT/option A, reaction Procedure 1, (B) A1120-MMT/option A, and (C) A1100-MMT/option A, reaction Procedure 2 systems
(see Scheme 4).
The A1100-MMT system was further selected to check the effect of the
preparation procedure adopted. Figure 27 shows the diffraction patterns related
to the A1100-MMT obtained by using the Procedures 1 and 2 summarized in
Table 4.
For the sake of comparison, the diffraction pattern of the pristine Na-MMT is
also reported. In details, the silylation reaction with A1100 by Procedure 2
resulted in a further shift of the (001) diffraction peak up to 2θ = 4.0°,
corresponding to a d-spacing value of 22.2 Å, with respect to that obtained with
the silylation by Procedure 1 (16.7 Å). It is worth noting that the highest reaction
temperature and aminosilane concentration (i.e. Procedure 2) allowed obtaining a
higher enlargement of the basal spacing. Moreover, the broader (001) diffraction
148
peak reflects the variety of platelets gallery heights due to the
grafted/intercalated products.
2 3 4 5 6 7 8 9
c
b
Inte
nsit
y
2θ (DEG)
a
Figure 27 - XRD analyses performed on the Na-MMT before and after silylation reaction carried out using two different process conditions. (a) pristine Na-MMT; (b) A1100-MMT
obtained with Procedure 1; (c) A1100-MMT obtained with Procedure 2.
In harmony with the experimental findings, the MD simulations reveal that, upon
increasing the number of aminosilane molecules within the clay galleries indeed
results in a larger value of the estimated d-spacing, which, in turn, is in excellent
agreement with the corresponding experimental evidence (see values in Table 5
and Table 6). Figure 26(C) yields pictorial evidence in support to the numerical
value. As can be easily seen by comparing Figure 26(A) and 26(C), when more
aminosilane molecules are grafted/intercalated into the clay galleries the surface
of the MMT layers is better screened by the silane hydrocarbon chains.
Accordingly, the attraction forces among the layers are weakened, and the
149
resultant distance between them is higher. Not only, but, in the presence of
higher silane concentration, the hydrocarbon chains of neighbouring molecules
grafted/physical bounded to the same clay layer tend to interact more among
themselves than with those laying on the opposite sheet. And this factor further
concurs to lessen the overall attraction between facing sheets and, hence, a
higher d001 value.
5.1.4 Conclusions
Three aminosilanes (A1100, A1120 and A1130) characterized by different
lengths of the alkyl chains are used to functionalize the Na-MMT, by following
two different routes in terms of reaction temperature and aminosilane
concentration (summarized in Table 1 as Procedure 1 and 2). The appearance in
the FT-IR spectra of additional peaks at 2936 and 2885 cm-1, attributed to the
asymmetric and symmetric stretching vibrations of the methylene groups,
respectively, and a shoulder at ~3290 cm-1 assigned to the stretching of the NH2
group, confirm the presence of the organic moieties on the Na-MMT surface.
The WAXD analyses show that the introduction of any aminosilane type into the
Na-MMT gallery allows the basal spacing to increase with respect to the pristine
Na-MMT, which is a clear signal that each aminosilane species has been
grafted/intercalated in the inter-platelets space. Moreover, the WAXD analyses
highlight the surprising result that by using the process parameters of Procedure
1 the longer the organic chain on the aminosilane molecules, the smaller the d-
spacing in the relevant modified MMT. The molecular dynamics simulation
explains this result in light of the strong tendency of A1120 and A1130
aminosilanes to interact among themselves by both intermolecular hydrogen
bonding and hydrophobic interactions because of the presence of one or two –

150
NH groups in their organic chains. On the other hand the A1100 molecules,
owing only one –NH2 group, provide a better screening between the MMT layers
ultimately favouring the weakening of interlayer attraction and, hence, a larger d-
spacing value. Furthermore the thermogravimetric analyses show that higher
temperature and aminosilane concentration values lead to an increased amount of
both chemically bonded silanes with respect to the intercalated species and
aminosilanes interacting with the outside platelets.
5.2 Silylated-MMT epoxy-based nanocomposites
Keeping in mind the effects caused by the reaction temperature and aminosilane
concentration on the actual basal spacing of Na-MMT, the process parameters
have been changed in order to give rise a new procedure (listed as Procedure 3 in
Table 1), with the goal to increase the Na-MMT basal spacing with the organic
chain length of the aminosilane. Therefore, the Procedure 3 has been used to
functionalise Na-MMT with A1100 and A1120 aminosilanes, and again the
organic chain length has been correlated to the MMT d-spacing. The
functionalised powders have been employed to prepare several Epoxy/MMT
Composites.
5.2.1 Wide Angle X-ray Diffraction characterization of both
silylated MMT and epoxy-clay composite.
The WAXS spectra of the silylated MMT with A1100 and A1120 aminosilanes
by using the process parameters of the Procedure 3 are reported in Figure 28 as
intensity versus the scattering vector, q equal to θλπ senq /2= where λ is the
wavelength of the X-ray beam and θ is the scattering angle. As far as the

151
silylated powder spectra are concerned, the peak associated to the interlayer
spacing shifts to lower scattering vectors with respect to the pristine Na-MMT,
indicating an enlargement of the MMT gallery between the silicate layers. In fact
the MMT-A1100 powder shows a diffraction (001) peak shifted to 4.10 nm-1,
which corresponds to a interlayer spacing of 15.3Å. The average spacing
between the clay layers for MMT-A1120 increases to 18.9 Å. It is worth noting
that in the latter instance, a second reflection peak at a basal spacing value of 9.3
Å appears, probably corresponding to the (002) diffraction peak [10]. Clearly the
interlayer spacing of MMT increases with the length of aminosilanes. These
results indicate that aminosilanes have been grafted/intercalated onto the silicate
layer surface and in the silicate gallery of Na-MMT.
1 2 3 4 5 6 7 8
0,1
1
d=1.53 nm
d=1.27 nm
Inte
nsity
q, nm-1
NaMMT MMT-A1100 MMT-A1120
d=1.89 nm
Figure 28 - X-ray diffraction patterns of the pristine and by silylation reaction
functionalised Na-MMT powders.

152
Since the experimental procedures for the preparation of epoxy based composite
materials was an in situ polymerization achieved through a preliminary mixing
step carried out by sonication (S) or a combination of sonication and ball-milling
(SB) and a subsequent curing step, it is worth to investigate the morphology of
the materials at the two stages of the synthesis, namely before and after curing.
In Figure 29 the spectra of the epoxy pastes obtained by dispersing A1120-MMT
powders through both sonication (S) and sonication/ball millng (SB), the
spectrum of A1120-MMT powder and the spectrum of the composite A1120-
MMT 3% wt/wt SB completely cured are shown.
2 4 6
d = 1.89 nm
d = 1.54 nm
Inte
nsity
q, nm-1
A1120-MMT 3% wt in epoxy S A1120-MMT 3% wt in epoxy S B A1120-MMT A1120-MMT 3% wt S B
d = 1.89 nm
Figure 29 - X-ray diffraction spectra of the uncured pastes A1120-MMT obtained by sonication and sonication/ball-milling mixing procedure compared with the spectra of
A1120-MMT powder and A1120-MMT 3% SB composite.

153
It is worth noting that the sonication mixing procedure does not affect the
interlayer spacing of the silylated MMT, whereas the combination of sonication
and ball-milling tends to reduce the interlayer spacing, probably through a
compactness of the silicate layers.
Similar WAXS spectra have been collected for the pastes obtained by dispersing
modified and unmodified MMT in epoxy resin through S and SB mixing
procedures and also for cured composites (they are omitted for sake of brevity).
The characteristic interlayer spacing for the several materials containing 3%
wt/wt of modified and functionalized MMT are reported in Table 7.
Interlayer Spacing (Å)
Powder Paste Composite
S SB S SB
Na-MMT 12.7 12.9 13.0 12.6 15.1
A1100-MMT 15.3 17.1 15.7 17.0 14.5
A1120-MMT 18.9 18.9 15.4 18.9 14.8
Table 7 - Interlayer spacing for modified and unmodified clay, pastes and composite materials.
Taking into account that the Van der Waals dimensions of the epoxy monomer
are 1.46x0.44x0.35nm [11], it is reasonable to expect that no intercalation occurs
in the Na-MMT. In fact by subtracting the layer thickness, equal to 9.6Å, from
the interlayer spacing, the remaining separation of 3.1Å is too small to be
accessible to the molecular size of epoxy monomer. On the other side, although
the silylated clays do not show marked increase of the interlayer spacing upon
mixing with DGEBA resins, the remaining separation are compatible with the
intercalation of the epoxy monomers between the silicate layers. In particular for

154
the A1120-MMT clay the remaining separation is 9.3Å which is large enough to
host the epoxy monomers [12-13].
Moreover, as reported in Table 7, the sonication mixing procedure allows the
penetration of epoxy monomers into MMT gallery only for the clay
functionalised with A1100. Thus the interlayer spacing increases from 15.3Å to
17.1Å. Probably in the case of clay modified with A1120 the intermolecular
interactions which take place between the amine groups of grafted and
intercalated organic moieties prevent the epoxy monomers to enter the silicate
galleries [14]. The mixing procedure based on the combination of sonication and
ball milling compacts the silicate layers probably due to the pressure extended by
the metal balls. The interlayer spacing value decreases without reaching the
original value corresponding to the unmodified MMT.
The morphology of Epoxy/MMT composite depends on the competition between
intragallery and extragallery cross-linking reactions. Intercalated composites are
formed if the curing conditions enhance the intergallery reaction with respect to
the extragallery reaction. In fact the higher is the rate of the intergallery reaction
the higher is the diffusion of DGEBA monomers into the gallery. This effects is
strengthen by the presence of polar moieties inside the galleries which
accelerated the cross-linking reaction through a catalytic effect [15].
The interlayer spacing exhibited by the unmodified and functionalized MMTs in
the composites are quite comparable with the ones of the epoxy pastes before the
curing process. The difficulty in achieving further increase of the interlayer
spacing can be ascribed to the sonication mixing which probably promotes the
reaction between the amine groups grafted to the edge and the surface of the
silicate layers and the epoxy monomers. This cross-linking reaction which

155
preferentially happens at the exterior of the silicate galleries allows the epoxy
gelation time to be locally decreased, the viscosity increased and the silicate
layers to be aggregated behaving as compact particles inside the shear field.
In summery the results obtained by the X-Ray diffraction characterization
performed on the powders, pastes and composite can be resumed as following:
by using the process parameters of the Procedure 3 the interlayer spacing
of the modified Na-MMT increases with the length of aminosilanes used
for the silylation reaction;
during dispersion of modified clays in epoxy resin, the sonication mixing
procedure allows the interlayer spacing to increase only for the A1100-
MMT clay whereas the ball-milling dispersion method compacts the
layered structure of the clays;
the cross-linking reaction which takes place during the dispersion of
modified MMT in the resin, prevents the intercalation of epoxy
monomers in the silicate galleries. Thus retention of layer-layer
correlations leads to micron scale reinforcing particles, not nano scale of
individual layers;
the modified and unmodified MMT clay tactoides result slightly
intercalated but well compatibilised with the epoxy matrix.
5.2.2 Dynamic Mechanical Analysis of cured Epoxy/MMT
Composites
Typical dynamic-mechanical plots for neat epoxy resin and Epoxy/MMT
composite containing 1% wt of unmodified and modified clay, prepared both
with S and SB methods, are presented as example in Figure 30 a) and b). The

156
elastic modulus at 25°C, the modulus at 150°C and the Tg values calculated as
maximum of tanδ curves are showed in Table 8.
a)
b)
Figure 30 - Storage modulus and Tan δ versus temperature for epoxy resin and composite with 1% wt of MMT-A1120 obtained by sonication (a) and sonication and ball-milling (b).
The storage modulus at 25°C of nanocomposites with both the modified and
unmodified clays decreases of about 10-20% if compared to the neat epoxy,
except for the pristine Na-MMT-based composite, whose modulus are quite

157
similar to that of relative neat epoxy matrix. This results is comparable with that
reported by Triantafyllidis et al [16] for rubbery epoxy matrix filled with
inorganic and organo-modified clays. They attributed that mechanical behaviour
to the high organic modifier content and the negative effect of the modifier’s
dangling chains on the interfacial adhesion between clay and organic matrix. The
interfacial interactions of polymer chains to the clay layer affect mainly the
properties of epoxy polymer in the glassy region. In our case, the crosslinking
reaction between the amino groups of silylated clays and epoxy monomers,
which probably takes place during the sonication mixing, affects negatively the
optimal stoichiometric ratio between monomers and hardeners. As a matter of
fact the epoxide network exhibits a reduced cross-linking density and
consequently the elastic modulus of composites in the rubbery region reduced
with respect to that of the neat epoxy resin (Figure 30).
As far as the Tg’s and the elastic modulus at 150°C values are concerned, the
Epoxy/MMT composites filled with 1% and 3% wt/wt of pristine Na-MMT clay
exhibit a marked reduction of both the characteristics compared to those ascribed
to the epoxy matrix. The same properties increase for the Epoxy/MMT
composite obtained with silylated clays, approaching the values of the neat
epoxy matrix. In particular the enhancement in terms of Tg and elastic modulus
is quite evident for the epoxy-clay composite prepared through the sonication
procedure (S method). Here, as WAXS analysis showed, the extent of epoxy
monomers intercalation in the silicate galleries is more pronounced and then the
presence of amine groups grafted on the silicate layers act as coupling agents to
improve the compatibility between the inorganic and the epoxy network. The
elastic modulus at 150°C represents a key property very sensible to the
interactions between inorganic filler and organic matrix. The higher the elastic

158
modulus at 150°C the better the interaction between polymeric matrix and the
inorganic filler.
The results confirm that the silylation reaction of Na-MMT with aminosilanes is
a valuable approach to enhance the interactions between the epoxy matrix and
the fillers. This enhancement could be ascribed to the interaction established
between amine groups and epoxy resin by means of both the covalent bonds due
to the cross-linking reaction and the hydrogen bonding with the hydroxyl groups
of opened oxirane rings. The reduction of the epoxy-clay composite Tg with
respect to the pristine epoxy matrix may be ascribed to a poor interfacial
compatibility in the case of unmodified Na-MMT and to the interfacial
plasticization and/or disrupting of the polymeric network arising from the
alteration of the competitive reactions, i.e. homopolymerization of epoxy rings
and cross-linking, during the curing process [17]. The sonication process likely
enhances the base catalyzed homopolymerization reaction due to the catalytic
role of the silicate layers [18], leading to the formation of a network with greater
chain mobility. In fact a portion of epoxy groups could be reacted during
sonication and consequently an excess of curing agent (MXDA) remains
unreacted to form free ends which causes the increase of free volume and
consequently makes the Tg lower [19]. Finally cannot be excluded the possibility
that the effects observed for Epoxy/MMT composites can be attributed to
organic molecules (i.e. amino silanes) released from the clay to the matrix and
plasticizing the systems which would off-set the effect of the improved
compatibility between epoxy matrix and clay particles.
In the case of epoxy-clay composites prepared through the combination of
sonication and ball-milling procedures, the amine groups grafted onto the surface
of the silicate layers are not able to markedly improve the materials’ properties

159
with respect to the composite realized with unmodified Na-MMT. Probably the
compacting effect of the silicate layers due to the ball-milling process as well as
the aggregation of the tactoides counteract the improved interfacial
compatibility, and they result detrimental on the mechanism of loading transfer
between the filler and the polymeric matrix. Finally the Tg reduction with
increased amount of clays, more evident for the Epoxy/MMT composite
prepared through sonication and ball-milling procedure, can be explained in
terms of increased free volume. As the clay concentration is increased a larger
amount of tactoids-tactoids aggregates form, creating additional free volume for
the mobilization of the epoxy resins.
Similar results in terms of reduction of both Tg values and elastic modulus at
150°C, were obtained by RA Pethrick et al [18] for epoxy matrix filled with
Cloisite 6A, a dimethyldehydrogenated tallow, quaternary ammonium chloride
modified clay. In that case the discussed detrimental effect was associated to the
organic moieties present inside the modified clay which in view of the authors
resulted chemically not compatible with the epoxy resins and easily released,
plasticizing the epoxy network.

160
Samples
Tg
[°C]
(S)
Bending
Elastic
modulus
[GPa]
(S)
Elastic
modulus
at 150°C
[MPa]
(S)
Tg [°C]
(SB)
Bending
Elastic
modulus
[GPa]
(SB)
Elastic
modulus
at 150°C
[MPa]
(SB)
Epoxy resin 124 2.6 28.1 124 2.6 28.1
Na-MMT 1% 117 2.3 15.3 110 2.5 16.9
MMT-A1100 1% 123 2.4 21.4 108 2.3 11.6
MMT-A1120 1% 127 2.3 26.0 111 2.3 16.6
Na-MMT 3% 104 2.6 11.6 91 3.3 3.0
MMT-A1100 3% 117 2.3 23.4 98 2.9 11.0
MMT-A1120 3% 122 2.3 23.1 99 2.1 5.7
Table 8 - Bending elastic modulus at 25°C and 150°C and Tg for neat epoxy and epoxy-clay composites.
5.2.3 Tensile test
Figure 31 a) and b) show the stress–strain curves of pristine epoxy resin and
Epoxy/MMT composites filled with 1% and 3% wt of modified and unmodified
clay. The shown curves are the most representative, namely those whose average
values in terms of elastic modulus, ultimate tensile strength and elongation at
break approach the values reported in Table 9.
The elastic modulus was determined by measuring the slope in the beginning of
the linear region in the stress-strain curve. The ultimate tensile strength and the
strain at break were determined as the values at breaking point of the sample.

161
0,00 0,02 0,04 0,06 0,080
20
40
60
80
100(6) (5) (4)
(3)(2)
Stre
ss, M
Pa
Strain, (%)
(1)
a)
0,00 0,02 0,04 0,06 0,080
20
40
60
80
100(5) (7)
(6)
Stre
ss, M
Pa
Strain, (%)
(1)
b)
Figure 31 - Stress-Strain curves of pristine epoxy matrix and of Epoxy/MMT composites a)
with 1% wt and b) 3% wt (silicate basis) of various clays: 1) pristine epoxy resin, 2) Na-MMT S, 3) MMT-A1120 S, 4) MMT-A1100 S, 5) MMT-A1120 SB, 6) Na-MMT SB and 7)
MMT-A1100 SB. S stands for sonication method and SB for sonication-ball milling method. (In the Figures are reported only the stress-strain curves for the samples more comparable
with the average values reported in Table 9)

162
Samples Tensile strength [MPa]
(S)
Elastic modulus [MPa]
(S)
Strain at break
[%] (S)
Tensile strength [MPa] (SB)
Elastic modulus [MPa]
(SB)
Strain at break [%] (SB)
Epoxy resin 76.5 (2.3)*
1670 (20)
7 (0.5) 76.5 (2.3)
1670 (20)
7 (0.5)
Na-MMT 1% 87.0 (2.5)
1760 (20)
7.7 (0.6) 87.4 (4.4)
1710 (20)
6.6 (0.5)
MMT-A1100 1% 84.3 (4.5)
1800 (20)
7.9 (0.3) 87.5 (5.2)
1780 (20)
7.2 (0.5)
MMT-A1120 1% 83.2 (2.5)
1850 (20)
7.8 (0.6) 88.0 (4.0)
1805 (20)
7.5 (0.6)
Na-MMT 3% 77.7 (1.5)
1785 (20)
6.3 (0.5) 84,5 (1.9)
1825 (20)
6.3 (0.8)
MMT-A1100 3% 80.5 (4.5)
1930 (20)
6.0 (0.3) 90.0 (2.6)
1842 (20)
6.7 (0.5)
MMT-A1120 3% 79.0 (2.4)
1935 (20)
6.5 (0.3) 89.0 (2.5)
1866 (20)
6.5 (0.5)
Table 9 - Tensile properties of pristine epoxy resin and epoxy-clay composites (*In the brackets are reported the error range).
It is worth noting that the Epoxy/MMT composites prepared with 1% and 3% wt
(silicate basis) of modified and unmodified clays exhibit improved tensile
strength and elastic modulus compared to the pristine epoxy matrix. The strain at
break decreases for all the samples containing 3% wt of clay whereas it slightly
increases for composites at 1% wt in comparison to the epoxy resin. Moreover it
is evident that since the inorganic layers are poorly intercalated with epoxy resins
(as showed by WAXS analysis), the slight improvements in mechanical
properties derive mainly from the better interfacial interactions between the
epoxy matrix and the clays grafted with organic moieties. In fact the
Epoxy/MMT composites filled with silylated clays show a further enhancement
of the mechanical properties compared to the composite filled with unmodified
clays, for which the reinforcing effect is due mainly to the presence of stiffer
inorganic particles. Similar results were obtained by Rhee et al. [20] for epoxy

163
nanocomposite where the clays was modified by silylation with 3-
aminopropyltriethoxysilanes (A1100). The simultaneous increase of elastic
modulus and ultimate tensile strength with the clay loadings was ascribed to the
better dispersion of the filler and the improved interfacial strength, which
restrained the epoxy matrix cracking.
Figure 32 - Elastic modulus of the epoxy-clay composites at various clay content: a) 1% wt
and b) 3% wt (silicate basis).

164
Figure 33 - Tensile strength of the epoxy-clay composites at various clay content: a) 1% wt
and b) 3% wt (silicate basis).
The variation of the elastic modulus and tensile stress as a function of nature of
the organic moieties grafted on the surface of the clay layers are reported in

165
Figure 32 a) and b) and Figure 33 a) and b) respectively for composite filled with
1 and 3wt% (silicate basis).
The results show that the elastic tensile modulus of the epoxy-clay composites
increases with the clay content in either processing procedures (i.e. S or SB
method). This response is characteristic of composite materials reinforced with
particles stiffer than the neat matrix. Furthermore the elastic modulus of
composites containing 1wt% of clays increases with increasing the chain length
of organic molecules used for the silylation reaction. Regardless the
aminosilanes used to functionalize the MMT, improvements of about 10% and
15% are observed respectively with the addition of 1 and 3wt% of organo-
modified fillers. This behaviour is superior to that exhibited by conventional
composites, where low concentrations (i.e. lower than 10%) of the inorganic
filler induces no or negative effects to the tensile mechanical properties [21]. An
improvement of the elastic modulus of 10% with respect to the pristine epoxy
resin has been obtained by Triantafyllidis et al [16] only through the complete
exfoliation of the inorganic layered filler. This result confirms the advantage in
using the silylation approach to improve the interfacial polymer/filler
interactions respect to both the simple dispersion of microsized fillers and the
intercalation/exfoliation of organo-modified clays. Recently Giannelis et al [22]
showed that in polysiloxane/layered silicate nanocomposites the edges
interactions between the ended OH groups of polysiloxane and the oxydrilic
groups present onto layers, affect the reinforcement of composites more than the
exfoliation. These edge-interactions can also contribute to restrict the mobility of
polymer chains during the mechanical tests [23]. The ultimate tensile strength of
epoxy-clay composites is higher than that of the pristine epoxy matrix. In
particular, the dispersion procedure seems to not affect the ultimate tensile

166
strength values in samples at 1%wt of filler, whereas it is in the case of 3%wt
Epoxy/MMT composites. In fact, in the 3wt% samples the combination of
sonication and ball-milling assures the highest ultimate tensile strength.
The stress-strain curves in Figure 31 were also used to estimate the toughness of
the pristine epoxy resin and the Epoxy/MMT composites, since the area under
the curves corresponds to the toughness of the materials in kJ/m3 units. The
toughness estimated for the pristine epoxy matrix is equal approximately to 3300
kJ/m3, whereas it increases markedly (around 4000kJ/m3) for the 1%wt
composites. In fact, the 1wt% Epoxy/MMT composites exhibit higher ultimate
tensile strength and similar or slightly increased strain at break compared to the
pristine epoxy matrix. On the other side the composites containing 3%wt of
filler, exhibit reduced toughness (around 3000kJ/m3) since the strain at break is
lower compared to that one of pristine epoxy resin.
Therefore, the above results suggest that the presence of reactive organic
moieties (i.e. grafted amine groups) at the edges or onto the surface of the layers
could represent a feasible approach to overcome the negative effect of the
presence of micro-sized inorganic particles, i.e. tactoides or aggregates of
tactoides.

167
5.2.4 SEM analysis
Figure 34 shows the fracture surface of MMT-A1120 3% S and MMT-A1120
3% SB composites. For clarity the micrograph image related to the neat epoxy
resin has also shown.
The pristine epoxy system shows a wrinkled fracture surface typical of a slightly
ductile behaviour. Each composites materials shows a smoother fracture surface
than that of pristine epoxy evidencing a fragile fracture behaviour. Probably the
presence of clay aggregates, which are well detectable as light spots in the SEM
images, act as a crack initiation sites and cause the failure of the samples at lower
strain at break compared to the epoxy resin (as shown in the stress-strain curves
of Figure 31 b)). Comparing the fracture surfaces of the epoxy-clay composites,
it is evident that composite sample MMT-A1120 3% SB prepared by the
combination of sonication and ball-milling method shows considerable less
roughness than the sample MMT-A1120 3% S prepared by sonication method.
The more brittle behaviour of SB sample can be tentatively ascribed to the
presence of larger tactoides aggregates.

168
a) b)
c)
Figure 34 - Typical fracture surfaces of epoxy resin (a), MMT-A1120 3% SB (b) and MMT-A1120 3% S (c) samples at 800 x magnification.
5.2.5 Nanoindentation analysis
Although the fracture and mechanical behaviour of the epoxy-clay composites
and nanocomposites materials has been extensively investigated over the past
years, less attention has been spent to the study of stress transfer mechanism
between clay interacting with epoxy polymer. In this respect Shen et al. [24]
verified the ability of the nanoindentation technique to evaluate the time
dependent mechanical properties of epoxy nanocomposites. In particular they
showed that a clay content of about 2.5wt% maximized the creep resistance. At

169
higher clay loadings, the creep resistance decreases because of the plasticization
effect of the alkyl ammonium chains, which reduces the cross-linking density
near the silicate layers.
Typical loading-hold-unloading profiles under a maximum load of 100mN, are
showed in Figure 35 for pristine epoxy and composite containing 3wt% of clay,
prepared by sonication method. Similar profiles have been obtained for the
composite prepared through the combination of sonication and ball-milling
procedure. Pristine epoxy resins possesses the lowest resistance to indentation
force and the highest maximum indentation depth, respectively, before and after
the holding segment. For the Epoxy/MMT composites an higher force has been
necessary to indent and consequently the load-displacement curves result shifted
upward. Additionally the MMT-A1120 based composites highlights the highest
indentation load at depths higher than 2000nm. It is noticed that the slope of the
load-displacement curve at the initial unloading portion, related to the material’s
elastic modulus, increases only slightly for the composites in comparison to the
pristine epoxy system. This result shows that at the nanometer scale the elastic
modulus of Epoxy/MMT composites is not significantly modified by the
presence of functionalized clay.
The holding load segment in the load-hold-unload cycle has been used to explore
the creep behavior of the pristine epoxy and epoxy-clay composites. The increase
in the creep resistance observed for the composites obtained through sonication
method, could be ascribed to the presence of grafted organic moieties onto the
clay surface and at the layer edges as well as to the extent of epoxy monomer
intercalation which, as confirmed previously, reduce the molecular mobility of
the segments in the epoxy network [24]. The composites obtained by the
combination of sonication and ball-milling dispersion procedure, exhibit a lower

170
creep resistance which can be related to the worse dispersion of clay tactoides
and to the dramatic reduction of the Tg values due to the lowering of the cross-
linking density.
In Table 10 are reported the elastic modulus, the creep displacement at 60 s and
the hardness values measured from indentation tests for pristine epoxy and
Epoxy/MMT composites. It is worth noting that the composites hardness
increases with respect to the pristine epoxy resin, and it seems to depend on (i)
the adopted dispersion procedures, (ii) the clay content as well as (iii) the clay
silylation. In particular the composites prepared through sonication method show
an increase of the hardness of about 35 and 50% with respect to the pristine
epoxy, for the composite filled with MMT-A1100 and MMT-A1120,
respectively. This is probably due to the sonication method through which the
clay tactoides are better dispersed within the matrix and better interacting with
the epoxy resin. In the opposite case, the combination of sonication and ball-
milling increases the agglomeration of clay tactoides additionally causing a poor
interaction between tactoides and epoxy matrix in spite of the silylation.

171
0 2000 4000 60000
20
40
60
80
100
120Lo
ad, m
N
Displacement into surface, nm
Epoxy Na-MMT 3% (S) MMT-A1100 3% (S) MMT-A1120 3% (S)
Figure 35 - Load–displacement relation of neat epoxy and epoxy-clay composite prepared
by sonication method (method S).
Samples Elastic Modulus
[GPa]
Creep displacement at 60 s [nm]
Hardness
[GPa]
Epoxy resin 4.01 ± 0.33 348.90 ± 12.40 0.145 ± 0.05
Na-MMT 3% (S) 4.10 ± 0.19 297.18 ± 15.46 0.162 ±0.02
MMT-A1100 3% (S) 4.30 ± 0.34 298.83 ± 13.73 0.195 ± 0.06
MMT-A1120 3% (S) 4.34 ± 0.23 336.65 ± 11.67 0.220 ±0.05
Na-MMT 3% (SB) 3.70 ± 0.32 352.53 ± 15.88 0.169 ±0.03
MMT-A1100 3% (SB) 4.20 ± 0.39 363.10 ± 16.07 0.178 ±0.04
MMT-A1120 3% (SB) 4.29 ± 0.15 347.91± 18.02 0.157 ±0.05
Table 10 - Mechanical parameters from indentation test.
It is worth noting that the values of elastic modulus obtained by nanoindentation
tests are different from the values obtained by tensile measurements, although
either techniques show that the modified or unmodified clays effectively stiffen
the matrix. The difference in terms of absolute values can be ascribed to the
different experimental conditions, i.e. applied loading rate [25].

172
5.2.6 Thermogravimetric Analysis
Thermal properties of pristine epoxy resin and Epoxy/MMT composites have
been investigated by thermogravimetric analysis. In Figure 36 are reported the
TGA curves of pristine epoxy resin and epoxy-clay composite obtained through
the sonication and the combination of sonication and ball-milling dispersion
methods.
Pristine epoxy resin shows a thermally oxidative degradation which occurs
through a three step process with maximum rate at around 300, 410 and 520°C
due respectively to the thermal degradation of the epoxy network, the charring
formation and the complete oxidation of the char. The epoxy-clay composites
undergo to an oxidative mechanism similar to that exhibited by the pristine
epoxy suggesting that the presence of the clay filler does not significantly affect
the thermal oxidative degradation mechanism of the matrix. This behaviour can
be attributed to the relatively low clay loadings investigated which are not
enough to affect significantly the thermal oxidative degradation of the epoxy
matrix The temperatures of degradation were taken as the onset temperatures at
which 3% wt mass loss occurs and are listed in Table 11.
Samples Tid (3% weight loss)[°C]
S dispersion method SB dispersion method Epoxy resin 321 321
Na-MMT 1% 306 311 MMT-A1100 1% 316 316 MMT-A1120 1% 328 324
Na-MMT 3% 308 326 MMT-A1100 3% 309 324 MMT-A1120 3% 303 302
Table 11 - Initial decomposition temperatures from TGA test.

173
0 100 200 300 400 500 600 700 8000
102030405060708090
100
100 200 300 40092
94
96
98
100
Weig
th L
oss,
%Temperature, °C
Epoxy 1% Na-MMT (S) 1% MMT-A1100 (S) 1% MMT-A1120 (S)
Epoxy 1% Na-MMT (S) 1% MMT-A1100 (S) 1% MMT-A1120 (S)
Wei
gth
Loss
, %
Temperature, °C100 200 300 400
90
92
94
96
98
100
102
Wei
ght
loss
[%
]
Temperature [°C]
Epoxy 1% Na-MMT (SB) 1% MMT-A1100 (SB) 1% MMT-A1120 (SB)
100 200 300 40090
92
94
96
98
100
102
Epoxy 3% Na-MMT (S) 3% MMT-A1100 (S) 3% MMT-A1120 (S)
Wei
ght
loss
[%
]
Temperature [°C]100 200 300 400
90
92
94
96
98
100
102
Wie
ght
Los
s [%
]
Temperature [°C]
Epoxy 3% Na-MMT (SB) 3% MMT-A1100 (SB) 3% MMT-A1120 (SB)
a) b)
c) d)
Figure 36 - TGA curve in air of pristine epoxy resin and composites with 1% wt (a-b) and 3%wt (c-d) of Na-MMT, MMT-A1100 and MMT-A1120 prepared with the S and SB
method.
5.2.7 Cone calorimeter test
Flame retardant properties of the pristine resin and the Epoxy/MMT composites
have been investigated by cone calorimetry. Figure 37 shows the average trend
of the heat release rate as function of the time both for pristine epoxy resin and
epoxy-clay composites.

174
Figure 37 - Heat Release Rate from Cone Calorimeter test for pristine epoxy and
composites materials prepared by sonication method.
Fundamental parameters in controlling flame propagation in a fire scenario are
the maximum value of the HRR and the time corresponding to the peak. These
parameters, together with the ignition time, are shown in Table 12.
The ignition time, tig slightly increases for the composites prepared by using
silylated clays. Moreover the inclusion of 3%wt of clay in the epoxy resin causes
a marked delay of the HRR peak and also a reduction of the intensity at
maximum of HRR peak for both unmodified and silylated clays. The silylation
of the clays with different aminosilanes slightly affects the mechanisms with
which the material burns even though it does not cause significant changes in the
fire properties.

175
tig HRR (peak)
Sample (s) Time (s) HRR (max)
kW/m2
Percentage
(%)
Epoxy resin 80 191 990 100
Na-MMT 3% (S) 80 226 720 73
MMT-A1100 3% (S) 83 216 683 69
MMT-A1120 3% (S) 83 253 742 75
Table 12 - Comparison of time to ignition, tig and HRR of pristine epoxy and epoxy-clay composites.
The addition of clay modified with A1100 and A1120 aminosilanes produces
two different effects in comparison to the Na-MMT filler:
1) the good dispersion of MMT-A1100 tactoides causes a further reduction of the
HRR peak,
2) the presence of MMT-A1120 clays increases the necessary time to reach the
HHR peak.
The slightly reduced flammability of composites with silylated clays compared
to the pristine epoxy resin as well as to the Na-MMT composite can be explained
through a more effective enrichment of layered silicates at the surface, which act
as barrier for gases and heat. This is due probably to the cross-linking reaction
between grafted amine groups and epoxy monomers. It is also worth noting that
the HRR profiles of composite materials obtained by using silylated clays before
the HRR peak are well superimposed to that one of pristine epoxy resin. This is
an important results because in most of the epoxy composite with organo
modified clays (i.e. clays modified with alkyl ammonium salts), which
intercalate the epoxy resin or exfoliate during composite preparation, it is

176
possible to observe a faster degradation of the organic modifiers of the clay,
which compromises the thermal and fire stability of the materials [12]. In this
case the presence of silylated filler and the enhancement of the interfacial
compatibility between the filler and the resin, increases the mechanical
properties of the composites without affecting the fire resistance.
5.2.8 Conclusion
Nanocomposites with silylated MMT with aminosilanes were prepared
employing two different dispersion methods, namely the sonication (S) and a
combination of sonication and high energy ball-milling (SB). It can be found that
contrary to what observed for the combination of sonication and ball-milling, the
sonication technique alone allows to increase the basal spacing for organically
modified clay. This result can be tentatively ascribed to the combined effect of
ultrasound and mechanical movement, which probably make compact the
interlayer spacing and destroy the original structural layer. This fact affects
negatively the Tg values of composites that decrease about 20° C compared with
neat epoxy. Moreover, the composites obtained by silylation reaction appear to
be more resistant but brittle, according to tensile test too.
Finally, the hardness values of nanocomposites increase with the aminosilanes
length.
In conclusion the results show that the sonication technique is a good method to
obtain a well dispersed intercalated composites, without destructing the layer
structure.

177
5.3 References
[1] C. Zhao; M. Feng; F. Gong; H. Qin; M. Yang; J. Appl. Polym. Sci., 93,
2004, 676.
[2] K. Endo; Y. Sugahara; K. Kuroda; Bull. Chem. Soc. Jpn. , 67, 1994,
3352.
[3] T. Yankgisawa; K. Kurodo; C. Kato; React. Solids, 5, 1988, 167.
[4] S. Okutomo; K. Kuroda; M. Ogawa; Appl. Clay Sci., 15, 1999, 253.
[5] I. K. Tonle; E. Ngameni; D. Njopwouo; C. Carteret; A. Walcarius;
Phys. Chem. Chem. Phys., 5, 2003, 4951.
[6] E. Ruiz-Hitzky; J. M. Rojo; G. Lagaly; Colloid. Polym. Sci., 263, 1985,
1025.
[7] C. Wan; X. Bao; F. Zhao; B. Kandasubramanian; M. P. Duggan; J.
Appl. Polym. Sci., 110, 2008, 550.
[8] S. Yariv; Appl. Clay Sci., 24, 2004, 225.
[9] H. He; J. Duchet; J. Galy; J. Gerard; Colloid. Interface Sci., 288, 2005,
171.
[10] Galimberti; Polym. Adv. Technol., 20, 2009, 135–142.
[11] T. Lan; P. D. Kaviratna; T. J. Pinnavaia; Chem Mater, 7, 1995, 2144-
50.
[12] G. Camino; G. Tartaglione; A. Frache; C. Manferti; G. Costa; Poly
Degrad and Stab, 90, 2005, 354-362.

178
[13] C. Kaynak; G. Ipek Nakas; N. A. Isitman; Applied Clay Science , 46,
2009, 319-324.
[14] F. Piscitelli; P. Posocco; R. Toth; M. Fermeglia; S. Pricl; G.
Mensitieri; M. Lavorgna; J of Colloid and Interface Science , 351, 2010,
108-115.
[15] C. Zilg; R. Mulhaupt; J. Finter; Macrom Chem Phys, 200, 1999, 661-
70.
[16] P. I. Xidas; K. S. Triantafyllidis; European Polymer Journal , 46,
2010, 404-417.
[17] H. Koerner; D. Misra; A. Tan; L. Drummy; P. Mirau; R. Vaia;
Polymer, 47, 2006, 3426-3435.
[18] J. Brawn; I. Rhoney; R. A. Pethrick; Polym International , 53, 2004,
2130-2137.
[19] H. Liu; W. Zhang; S. Zheng; Polymer, 46, 2005, 157-165.
[20] S. R. Ha; S. H. Ryu; S. J. Park; K. Y. Rhee; Materials Science and
Engineering A, 448, 2007, 264-268.
[21] O. Becker; G. P. Simon; K. Dusek; Epoxy layered silicate
nanocomposites. In: Inorganic polymer nanocomposites and membranes .
Berlin: Springer, 2005, 29-82.
[22] D. F. Schimidt; A. P. Giannelis; Chem Mater, 22, 2010, 167-174.
[23] C. L. Wei; M. Q. Zhang; M. Z. Rong; Comp. Sci Teech., 62, 2002,
1327-40.

179
[24] L. Shen; L. Wang; T. Liu; C. He; Macromolecular Materials and
Engineering, 291, 2006, 1358-1366.
[25] H. Lee; S. Mall; P. He; Composite Part B: Eng., 38, 2007, 58.

180
Chapter 6: Epoxy/silica Hybrids
This chapter is concerned with the main aspects of the siloxane epoxy hybrids
research and the related experimental results, including their interpretation and
evaluation in relation to the objectives. In particular, several efforts have been
done to optimize the sol-gel process parameters and the amount of specific
coupling agent to the aim to prepare Epoxy/silica Hybrids. Then the effect of the
amine hardener on the hybrids final properties has been evaluated.
6.1 Functionalization of epoxy resin with APTES
Compatibility between silica and epoxy components is required in order to
obtain hybrid materials with co-continuous phases. To the aim to improve the
interactions between organic network and inorganic structures the aminosilane
APTES was used as coupling agent and the functionalization reaction was
carried out at 70°C in nitrogen flux.
During the functionalization reaction, in fact, it is essential to avoid the water to
hydrolyze the SiOEt groups of the APTES molecules, because if the hydrolysis
takes place, the SiOH groups could react with the C-OH epoxide groups of the
opened epoxy ring and then condensate, by reducing the gelation time of the
system [1-3]. Furthermore, according to the Scheme 5 [1] the amino groups of
APTES molecules are able to react with the epoxide rings, forming secondary
and then tertiary amines. Since only a portion of epoxide groups has to be
functionalized with the aminosilane molecules, the tertiary amines can further
react with the epoxide groups allowing the homopolymerization reaction to occur
(Scheme 5).

181
Scheme 5 - Possible reactions of epoxy groups with amines (primary, secondary and
tertiary).
The functionalization reaction was monitored by FT-IR analysis and viscosity
measures. In particular, the decrease of the absorption peak area of the reacting
epoxide groups at 916cm-1 (see Figure 38) was used as index for the extent of
functionalization reaction. The peak area has been measured at certain stages of
the reaction and the degree of conversion (α) has been calculated as function of
reaction time at 70°C. Since it does not change during the curing process the
stretching of the aromatic rings at 1509 cm-1 has been used as internal reference,
then the epoxide conversion degree has been calculated as:

182
Figure 38 - FT-IR absorbance peak of epoxide groups during the functionalization reaction
at 70°C with APTES.
In Figure 39 the epoxide conversion degree has been reported as function of
reaction time at 70°C. In spite of the theoretical values of aminosilane used to
functionalize, namely 5 or 10wt% pictured as straight-line in Figure 39, the 12
and 18 wt% of epoxide groups reacted, respectively. The higher value of
conversion degree could be ascribed to the homopolymerization reaction which
took place.
As previously mentioned, the evolution of functionalization reaction with
APTES has been followed measuring the viscosity during the reaction at 70°C.
The results highlight that the molecular weight increases with the reaction time
since an increase of the viscosity can be observed (Figure 40), regardless the
amount of aminosilane used to functionalize. Moreover, as the APTES content
where
9160
9169160
AAA t−=α 1509
916916
AAA =

183
increases, i.e. the 10wt% APTES reacting mixture, the viscosity reaches the
plateau value early.
0 25 50 75 100 125 150 175 2000.000
0.025
0.050
0.075
0.100
0.125
0.150
0.175
0.200α
time (min)
5wt% APTES 10wt% APTES
Figure 39 - Epoxide conversion degree with APTES as function of reaction time at 70°C.
0 25 50 75 100 125 150 175 2000
200
400
600
η (P
oise
)
Time (min)
5wt% APTES 10wt% APTES
Figure 40 - Viscosity of epoxy resin during the functionalization reaction at 70°C as
function of reaction time.

184
In order to study the homopolymerization effect on the final properties of the
hybrid materials, films have been prepared by using the “sol-gel in-situ”
procedure (Ep-5AP-Siy-IS sample), at different reaction time extends at 70°C.
The cured samples have been characterized by DSC and DMA techniques
(Figure 41 and Figure 42).
As shown in Figure 41 the Tg of samples decreases of about 16°C as the reaction
time at 70°C increases from 5 to 90 minutes. Additionally, the DMA analysis
(Figure 42) shows that the increase of the reaction time causes an increase in the
loss factor ascribed to the increased viscous component of the modulus.
Therefore a reduced number of cross-links caused by the homopolymerization
reaction can be supposed. In fact, the increasing of the reaction time at 70°C in
presence of tertiary amine formed during the functionalization reaction allows
two synergic effect to happen.
50 60 70 80 90 100 110 120 130 140
Tg decreases
5 wt% APTES 5 wt% SiO2
Hea
t Flo
w (
W/g
))
Temperature (°C)
5 min 15 min 90 min
Reaction time at 70°C
Figure 41 - : DSC analyses of Ep-5AP-Si5-IS samples obtained varying the
functionalization reaction time at 70°C.

185
Figure 42 - DSC analyses of Ep-5AP-Si5-IS samples obtained varying the functionalization
reaction time at 70°C.
On the one hand the homopolymerization reaction produces linear polymeric
chains instead of a cross-linked network, which alone is sufficient to reduce the
Tg. Otherwise the stoichiometric amount of hardener added becomes excessive if
the homopolymerization reaction occurred, plasticizing the whole system.
Taking into account the results obtained, the functionalization reaction of epoxy
monomers was performed for 10 minutes at 70°C.
6.2 Sol-gel short hydrolysis (Ep-xAP-zSolv-ySi-Sh)
The effect of APTES and 1,6 hexanediol diglycidyl ether has been evaluated.
6.2.1 Effect of aminosilane content
In order to study the effect of the coupling agent APTES several samples namely
Ep-xAP-10Solv-ySi-Sh with x ranging from 5 to 30, have been prepared. The

186
DSC results (Figure 43) show that the Tg increases with the APTES content,
probably because of the improved interfacial interactions between the organic
and inorganic moieties. So by increasing the aminosilane content a further
improvement of the hybrid properties would be observed. Since the aminosilane
molecules partially cross-link the epoxide groups they cause an increased
viscosity of the epoxy mixture reducing its processability, hence the higher the
aminosilane content the higher the viscosity of functionalized resin. To the end
to reduce the viscosity of the functionalized epoxy resin, 1,6 hexanediol
diglycidyl ether has been added and its effect on the final properties of hybrids
systems has been studied.
50 100 150 200
Hea
t Flo
w
Temperature (°C)
Ep-5AP-10Solv-ySi-Sh Ep-10AP-10Solv-ySi-Sh Ep-30AP-10Solv-ySi-Sh
Figure 43 - DSC curves of Ep-5AP-10Solv-ySi-Sh, and Ep-10AP-10Solv-ySi-Sh and Ep-
30AP-10Solv-ySi-Sh.

187
6.2.2 Effect of 1,6 hexanediol diglycidyl ether
In order to study the effect of 1,6 hexanediol diglycidyl ether content, two
samples, namely Ep-5AP-0Solv-ySi-Sh and Ep-5AP-10Solv-ySi-Sh, have been
prepared. The DSC results, shown in Figure 44, pointed out that the presence of
10wt% of 1,6 hexanediol diglycidyl ether causes the Tg to decrease of about
20°C, probably ascribed to the more flexible epoxide component inside the
epoxide network.
In conclusion, in order to improve the interfacial interaction between the organic
and inorganic moieties a large amount of coupling agent APTES has to be added.
However, the increase of the reacting mixture viscosity requires the addition of
the 1,6 hexanediol diglycidyl ether, which in turn reduces the Tg.
50 100 150 200
Hea
t Flo
w
Temperature (°C)
Ep-5AP-10Solv-ySi-Sh Ep-30AP-0Solv-ySi-Sh
Figure 44 - DSC curves of Ep-5AP-0Solv-ySi-Sh and Ep-5AP-10Solv-ySi-Sh.

188
6.2.3 Effect of APTES as coupling agent
In the Ep-5AP-10Solv-5Si-Sh SEM image (Figure 45) several big aggregates of
silica particles reaching micro-sized dimensions too, can be observed over the
entire area of the hybrid materials. Furthermore, in spite of the functionalization
with the aminosilane coupling agent, a poor interfacial interactions between the
silica particles and the epoxy network can be observed since there is not
continuity between organic and inorganic moieties. Furthermore, in spite of the
functionalization with aminosilane APTES all the samples are not transparent.
Figure 45 - SEM image of Ep-5AP-10Solv-5Si-Sh hybrid sample.
6.2.4 Small Angle X-ray Scattering characterization
Macromolecular scale structure is investigated by Small Angle X-ray Scattering
method. As known, in addition to the size of the polymers or heterogeneity
domains, the SAXS method also gives a geometrical description of the structures
using the concept of fractal geometry, because random processes of
polymerization or aggregation usually lead to the formation of fractal objects. In

189
Figure 46 the Ep-5AP-0Solv-3Si-Sh scattering plot, subtracted of the neat epoxy
SAXS profile, is shown. It is well evident that siloxane domains isolated from
SAXS spectra of hybrids show two discontinuities and three linear regions which
account for an inorganic internal structure where smaller particles aggregate to
produce larger fractal particles.
Figure 46 - Log-log plot of Ep-5AP-0Solv-3Si-Sh SAXS profile subtracted of the neat epoxy scattering contribute.
The presence of two discontinuities enables us to identify at least two structural
length sizes which contribute to form the inorganic domains. At high q value the
SAXS data are highly scattered because of the subtraction of the epoxy matrix
scattering. However at q values of around 2.7nm-1 the first discontinuity can be
observed, ascribed to small silica particle of 2-3nm sized. At lower q value it is
well evident a linear segment whose fractal dimension Dm is equal to 1.5. This
dimension corresponds to the presence of inorganic fractal domains characterised
by a ramified structure due to the diffusion limited cluster-cluster aggregation
0,1 1
0,1
1
10
100
TEOS/GOTMS = 3 : 2
Ds = 3.6
Dm = 1.5
Short pre-hydrolysis under acid catalysis
Inte
nsity
Scattering vector, q (nm-1)
Dm = 2.2
28 nm
2.3 nm

190
mechanism (DLCA) [4]. At q values of about 0.2nm-1 it is possible to observe
another discontinuity which allows to determine the second characteristic size
(28nm) of the multiple hierarchical siloxane structure. At lower q value the slope
of the linear segment is 2.2 meaning that the corresponding inorganic domains,
whose dimension are not determined because of the SAXS resolution, are
characterized by an opened fractal structure. The SAXS analysis pointed out that
the inorganic domains produced by the Ep-5AP-10Solv-ySi-Sh approach present
a hierarchical structure characterised by a smaller siloxane units which aggregate
to produce largest fractal domains. The latter are further aggregate to produce
inorganic domains on the microscopic scale. A schematic picture of the
hierarchical siloxane structure is proposed and reported in Figure 46.
In conclusion this approach pointed out the following issues:
the preparation procedure does not allow the solvents (water and ethyl alcohol;
data not shown) to be eliminate;
the increased viscosity in epoxy systems with high content of APTES requires
the addition of 1,6 hexanediol diglycidyl ether which in turn makes the Tg value
lower;
since some big siloxane aggregates not bonded with the organic network can be
detected, the functionalization of the organic moieties alone showed to be not
enough to improve the siloxane domains dispersion.
6.3 Sol-gel long hydrolysis (Ep-xAP-Siy-Ol)
In order to improve the interfacial interactions between the two phases a second
coupling agent, the GOTMS, has been used together with the APTES, by
pursuing the idea to build-up a co-continuous organic-inorganic structure. A
picture of final structure craved by using two coupling agents, namely the

191
APTES for the organic moieties and the GOTMS for the inorganic ones, has
shown in Scheme 6. Moreover, to the aim to avoid the plasticizing effect due to
the solvents of sol-gel process, their partial elimination in vacuum conditions at
50°C has been performed. According to Soucek approach [5] since an acidic
catalyst has been used for the hydrolysis reaction, oligomers of linear siloxane
backbone would be formed. In fact, as known, under acid catalysis, the terminal
groups react preferably and the chain grows at the end to form linear sequences.
As a consequence, an open network structure initially results. When the amine
hardener for epoxy monomers is added to the mixture the ambient becomes
sudden basic. Since the siloxane condensation reactions are favourites under
basic catalysis the neighbouring SiOH groups sudden condensate by elimination
of water molecules. A possible structure has been proposed in Scheme 7.
Scheme 6 - Role of coupling agents APTES and GOTMS in the hybrid formation.

192
Scheme 7 - Schematic picture of the siloxane oligomers obtained in acidic catalysis (on the left) and their sudden condensation after the addition of the amine hardener (on the right).
6.3.1 Dynamic Mechanical Analyses (DMA)
The Dynamic Mechanical Analysis (DMA) has been performed to identify the
glass transition temperature Tg of samples as maximum value of the loss factor
tanδ, since usually, its position and intensity allows characterizing the reduction
in mobility of the epoxide network [1]. Figure 47 shows, as example, the tan δ
curves of Ep-5AP-3Si-Ol and the neat epoxy system (Ep-Mx). It is worth noting
that the hybrid sample’s Tg decreases with respect to the neat epoxy (Figure 47).
Additionally, the hybrid sample curve broads and weakens with respect to that of
the neat epoxy. The changing in the Tg value could be ascribed to the modified
network arisen from the hybridization of epoxide samples, since the use of the
two coupling agents probably modifies the fundamental structure of the organic
network. Moreover, the glass transition temperature range related to the hybrid
sample become larger than that of the neat epoxy. This means that the cross-
linked network becomes poorly homogeneous when the hybridization occurs,
causing the molecular relaxations to broad on a larger temperature range.
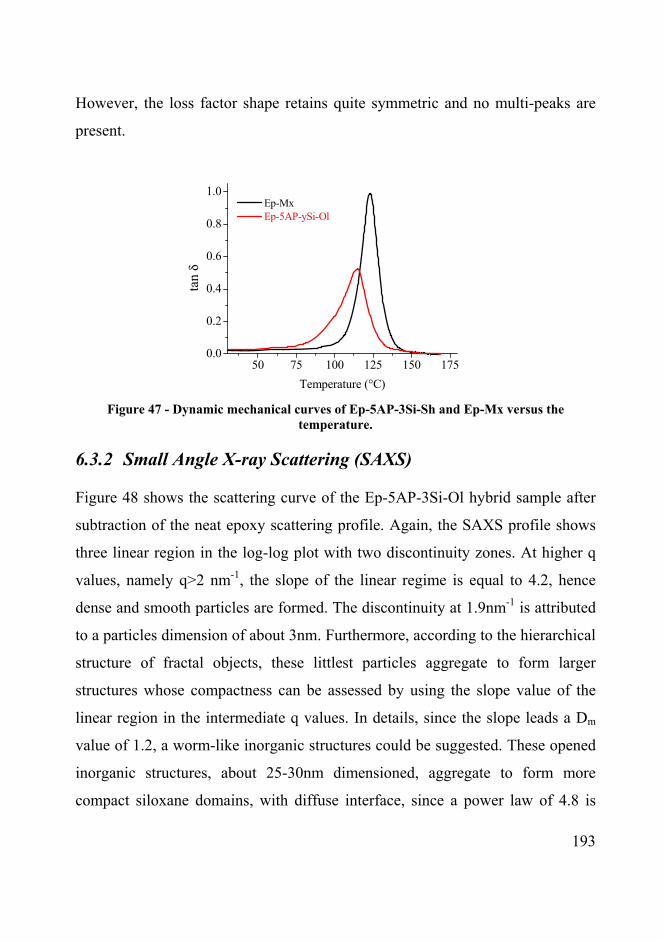
193
However, the loss factor shape retains quite symmetric and no multi-peaks are
present.
50 75 100 125 150 1750.0
0.2
0.4
0.6
0.8
1.0 Ep-Mx Ep-5AP-ySi-Ol
tan
δ
Temperature (°C) Figure 47 - Dynamic mechanical curves of Ep-5AP-3Si-Sh and Ep-Mx versus the
temperature.
6.3.2 Small Angle X-ray Scattering (SAXS)
Figure 48 shows the scattering curve of the Ep-5AP-3Si-Ol hybrid sample after
subtraction of the neat epoxy scattering profile. Again, the SAXS profile shows
three linear region in the log-log plot with two discontinuity zones. At higher q
values, namely q>2 nm-1, the slope of the linear regime is equal to 4.2, hence
dense and smooth particles are formed. The discontinuity at 1.9nm-1 is attributed
to a particles dimension of about 3nm. Furthermore, according to the hierarchical
structure of fractal objects, these littlest particles aggregate to form larger
structures whose compactness can be assessed by using the slope value of the
linear region in the intermediate q values. In details, since the slope leads a Dm
value of 1.2, a worm-like inorganic structures could be suggested. These opened
inorganic structures, about 25-30nm dimensioned, aggregate to form more
compact siloxane domains, with diffuse interface, since a power law of 4.8 is

194
detected at lowest q values. The proposed siloxane structures are pictured in
Figure 48 for the sake of clarity.
The SAXS analysis has evidenced that the oligomeric inorganic domains
produced according the Soucek method [5] present again a hierarchical structure
characterised by a smaller siloxane units which aggregate to produce largest
fractal domains.
Figure 48 - Log-log plot of Ep-5AP--3Si-Ol SAXS profile subtracted of the neat epoxy
scattering contribute.

195
6.3.3 Scanning electronic Microscopy (SEM) and Energy
Dispersive Scanning (EDS)
In Figure 49 the cross-section micrograph of the Ep-5AP-3Si-Ol hybrid has
shown. It is worth noting that some micro-sized aggregates, rich in silicium,
embedded in the organic network can be detected. Analyzing the interface
between the organic network and the inorganic aggregates, the absence of the
free volume and a continuity between the two phases are evident. This continuity
could be ascribed to the simultaneous use of the two coupling agent, namely
APTES and GOTMS.
Figure 49 - SEM image of the Ep-5AP--3Si-Ol hybrid sample.
6.3.4 Conclusions
The dynamic mechanical analyses of Ep-xAP-Siy-Ol samples pointed out that
the presence of the inorganic structures modifies the organic network producing
a new structure with decreased Tg value. Furthermore, the broadening of the
molecular relaxation attributed to the glass transition emphasizes the poor

196
homogeneity of the hybrid system. The tendency of the siloxanes structures to
aggregate has been highlighted in the SAXS measurements too, since dense
siloxanes structures larger than 20-30 nm in dimension are detected.
Furthermore, the simultaneous presence of the two coupling agents for the two
organic and inorganic network, respectively, allows the siloxanes structure to be
inter-diffuse. The slope value of 4.2 in the lowest q range, in fact, speaks in
favour of such a co-continuity between the two phases. This behaviour in the
nanometer level is projected in a larger scale by the hierarchical structure. In
fact, the co-continuity between the two phases and the absence of the free
volume are evident in micro-size scale by the SEM micrograph. Hence, the use
of the second coupling agent is essential to improve the interfacial interactions.
Furthermore, too large siloxane aggregates are present. The aggregation in large
separated domains could be ascribed to the particular procedure used to obtain
the inorganic structure. In fact, the long pre-hydrolysis reaction in acidic ambient
could be responsible of well hydrolyzed siloxane structures, hence numerous
SiOH groups are present. However, the condensation is slow, and only oligomer
products are formed at room temperature during 24h [6-8]. The sudden addition
of the amine hardener causes the pH to abruptly increase and the hydrolysed Si-
OH groups can easily condense to form large siloxane aggregates. In conclusion,
this approach allows to obtain large siloxanes domains separated from the
organic network, but having a good interface separation.
6.4 Sol-gel “in-situ” (Ep-xAP-Siy-IS)
To the aim to reduce the inorganic domains dimensions a so-called “one-step
polymerization” [6-8] or “in situ” approach, in which all the organic and
inorganic component are obliged to react altogether, has been attempted. In

197
detail, both the inorganic precursor TEOS and its coupling agent GOTMS, were
directly added to the epoxy resin functionalized with APTES, forming an
homogeneous mixture. Moreover, in order to allow the hydrolysis reactions to
start, the water and catalyst (basic in this approach, being the amine hardener)
were added at the end of the hybrid preparation. This procedure allowed to study
the effect on the final siloxanes structures of both the procedure and the catalyst.
As known, the latter governs the relative rates of hydrolysis and condensation,
gelation of the system, and final morphology of the silica gels, including a
possible phase separation. The acid promotes a fast hydrolysis, leading to
oligomeric linear products, whereas in base catalysed reactions the rate and
extent of hydrolysis is lower compared to acidic catalysis, and less hydrolyzed
product prevail. Hence, highly cross-linked sol particles are obtained because of
the tendency of hydrolysed SiOH groups to sudden condensate. Since in basic
condition the condensation is faster than the hydrolysis reaction, a siloxane
network schematically pictured in Scheme 8 could be obtained. Here, some Si-
OR groups are not hydrolyzed and could retain as not reacted dangles in the
hybrid system.

198
Scheme 8 - Schematic picture of the siloxane structures obtained by the “in situ“ approach.
Furthermore, in the Ep-xAP-Siy-IS approach, the addition of the water and
amine hardener together allows the two independent reaction mechanism to be
simultaneously operative, i.e. the reaction of the epoxy and amine monomers to
form the organic network, and the hydrolysis and condensation of
TEOS/GOTMS to form the siloxane phase. Differently to previous approaches,
here the hydrolysis of siloxane mixture occurs under basic condition and
throughout the growth of the epoxy network. Hence, the two organic and
inorganic networks are expected to be totally interpenetrated.
6.4.1 Dynamic Mechanical Analyses (DMA)
Figure 50 shows the tanδ curves related to the Ep-5AP-3Si-IS hybrid sample and
the neat epoxy system (Ep-Mx). Again, the hybridization causes the Tg to
decrease, and the loss factor curve to reduce and broaden, highlighting at least
two different contributes, at about 90 and 107°C, respectively. Broadening of the
loss factor peak evidences the wide spectrum of relaxation times typical of
composite materials, whereas the separation in two contributes provides evidence

199
of a phase separation in the epoxy-silica hybrids, since several molecular
relaxations could be detected. Phase separations which cause multi-peaks in the
loss factor curves are frequently observed [6]. In fact, Matejka et al. [6] found
that the neat epoxy system owns a narrow distribution of the molecular
relaxation attributed to the glass transition, whereas in the epoxy-silica
nanocomposites a new relaxation peak at higher temperature with respect to the
neat epoxy system appears. The presence of two relaxation peaks is attributed to
the phase separation between the epoxide and siloxane networks typical of
composite materials. Furthermore, they attributed the new relaxation to the
network chains immobilized by interaction with glassy silica domains, due to the
strong interaction between the two phases caused by the use of coupling agents.
Conversely what Matejka et al. [6] pointed out, even if the phase separation takes
place, in the actual hybrid systems the maximum position occurs at lower
temperature value with respect to that of the neat epoxy. However, as Yang et al.
[9] pointed out silica nanostructures can play two different kinds of role in the
epoxy matrix. If the interaction between the two phase is weak, the siloxane
domains deteriorate thermal properties of epoxide system because they reduce its
cross-linking degree. On the other hand, if a sufficient amount of coupling agent
has been used, the interfacial interactions between the epoxide and siloxane
domains can immobilize the polymer chains to some extent, and improve the
thermo mechanical properties by increasing the storage modulus and the glass
transition temperature. By taking into account those considerations, the DMA
results (Figure 50) could be explained by considering that the amount of
coupling agent is probably not enough to improve the interfacial interactions. In
fact, the lowering of the epoxide Tg could be ascribed to the introduction of the
siloxane domains poorly interacting with the epoxide network which in turn

200
partially destroy and make weaker the organic network. This could be the reason
why the molecular transitions attributed to those of the epoxy network occurs at
lower temperature values. Additionally, the presence of an additional peak at
lowest temperature could be due to the interphase zone between organic and
inorganic moieties. Again, in conclusion the approach Ep-5AP-3Si-IS leads to
hybrid materials with poor viscous-elastic properties with respect to the neat
epoxy system.
50 75 100 125 150 1750,0
0,2
0,4
0,6
0,8
1,0 Ep-Mx Ep-5AP-3Si-IS
tan
δ
Temperature (°C) Figure 50 - Dynamic mechanical curves of Ep-5AP-3Si-IS and Ep-Mx versus the
temperature.
6.4.2 Small Angle X-ray Scattering (SAXS)
The scattering profile of Ep-5AP-3Si-IS hybrid sample, subtracted of the epoxide
contribute is shown in Figure 51. Again, the SAXS profile is characterized by
three linear regions, in between two discontinuity zone can be detected.
According to a hierarchical structure of siloxane domains, little spherical
particles of 1.7nm dimensioned are supposed to interact forming open and

201
branched structures, since the fractal dimension in the middle q range is 1.6. The
discontinuity at about 0.2nm-1 speaks in favour of a siloxane structure of
intermediate dimension of 25-30nm, which in turn aggregates to form large
siloxane domains with inter-diffuse morphology of inorganic chains in organic
network.
Figure 51 - Log-log plot of Ep-5AP-3Si-IS SAXS profile subtracted of the neat epoxy
scattering contribute.
6.4.3 Scanning electronic Microscopy (SEM) and Energy
Dispersive Scanning (EDS)
The morphology of the network synthesized by the Ep-xAP-Siy-IS method is the
most homogeneous one obtained so far. In fact, as the Figure 52 shows, the

202
siloxane domains do not aggregate to form large inorganic phases as previously
reported, but they are homogeneously distributed on the overall hybrid area. In
fact, EDS analyses highlighted the presence of the silicium element everywhere.
This morphology is probably due to the simultaneous growth of the two
networks which avoided the siloxane structures to aggregate in inorganic
domains, since the epoxy cross-linking and gelation reactions hindered it. Then
opened and homogeneously distributed siloxane structures resulted (Figure 52)
on the overall hybrid area.
Figure 52 - SEM image of the Ep-5AP--3Si-IS hybrid sample.
The presence of gold is due to the metallization procedure used to make the
measurement. This result appears to be in contrast with what Matejka et al
reported [6]. In fact, the Matejka one-step procedure leads to the most
heterogeneous morphology, involving large siloxane-silica aggregates 100-
300nm sized, composed of smaller particles of 20-70nm in diameter.

203
6.4.4 Conclusion
By comparing the DMA curves of the Ep-5AP-3Si-Ol and Ep-5AP-3Si-IS hybrid
samples (Figure 53) , and by taking into account their morphological features, it
is worth noting that in spite of the same nanometric structure arising by the
SAXS profiles, the dynamic mechanical behaviour and the final morphology are
quite different. In fact, although both hybrids show a reduced Tg value with
respect to the neat epoxy, the shape of loss factor curve changes markedly by
modifying the synthesis approach. In fact, a further broadening and phase
separation is observed in the Ep-5AP-3Si-IS sample with respect to the Ep-5AP-
3Si-Ol ones.
The different behaviour of the hybrids could be explained by taking into account
three effects which act in a synergistic way:
The amount of coupling agents.
The same coupling agent amounts has been used to prepare the two hybrid
samples. However, in the Ep-5AP-3Si-Ol approach the coupling agent amount
seems to be enough to make compatible the two phase, since the inorganic phase
is concentrated in some large domains. On the other hand, in the Ep-5AP-3Si-IS,
the siloxane branched structures are homogeneously distributed in the organic
network, making the coupling agent not enough to allow good interfacial
interactions.
The interaction between the siloxane structures and the epoxide network.
The more symmetric shape of the Ep-5AP-3Si-Ol loss factor could be due to the
presence of a large amount of Si-OH groups which can interact with the OH
groups of epoxide network. Whereas, in the Ep-5AP-3Si-IS approach probably

204
due to the presence of not hydrolyzed Si-OR groups, a poor interaction between
the two phases is evidenced. The presence of Si-OH groups in the siloxane
structure formed under acidic catalysis leads to a chemical grafting between
phases by the reaction with C-OH of the epoxide network [1, 6, 10].
In both cases good interfacial interactions seems to be responsible of the higher
Tg value of Ep-5AP-3Si-Ol sample and its more symmetric loss factor shape.
The presence of developed solvents.
By using the Ep-5AP-3Si-IS approach, even if the addition of sol-gel solvents
are avoided, little amount of solvents will be produced during the hydrolysis and
condensation reactions, retaining into the reactive system. In the Ep-5AP-3Si-Ol
procedure most solvents are subtracted during the treatment in the oven. The
presence of these solvents could have a plasticizing affect, lowering further the
Tg value of hybrids.
Finally, this approach pointed out that:
the “in situ” approach for the production of hybrids weaken the epoxide
network;
the amount of coupling agent should be increased to further improve the
interfacial properties;
the solvents produced by the hydrolysis and condensation reactions retain
into the reactive system, probably making a plasticizing affect.

205
50 75 100 125 150 1750,0
0,2
0,4
0,6
0,8
1,0
107°C
114°C
Ep-Mx Ep-5AP-3Si-IS Ep-5AP-3Si-Ol
tan
δ
Temperature (°C)
123°C
Figure 53 - Loss factor tanδ curves of Ep-5AP--3Si-IS and Ep-5AP--3Si-Ol versus
temperature. The Ep-Mx curve is shown for comparison.
6.5 Sol-gel pre-hydrolysis MXDA-based hybrids (Ep-
Siy-MX)
Hence, the pre-hydrolysis reaction under acidic catalysis has to be performed, in
order to obtain structured inorganic domains and avoid the organic network to
weaken. Previously attempts demonstrated that the properties of organic-
inorganic hybrids depend to a great extent on both the interphase interaction and
inorganic domains sizes. Aimed to reduce the inorganic size and make
interactions stronger, the amount of coupling agent has to be increased.
Moreover, in order to avoid an initial consumption of epoxy rings from APTES
molecules, only GOTMS has been used from now on. The hybrid materials
epoxy-silica obtained starting by GOTMS and epoxy resin, have been widely
studied, since they can lead to materials with improved mechanical properties. In

206
fact, the GOTMS can undergo both the sol-gel polymerization of the alkoxy
groups and curing of the epoxy functionality to form a hybrid network with
covalent bonds between organic and inorganic phases. As Matejka et al. [11]
demonstrated by size exclusion chromatography and 29SI-NMR, GOTMS
molecules are able to form epoxy functionalized cages, which in turn can further
react by both the inorganic and the epoxy functionality. The self-assembling
capacity of GOTMS molecules should produce numerous and nanometer sized
cages chemically bonded to the organic network by the epoxide functionalities.
Moreover, the excess of GOTMS coupling agent with respect to the TEOS
amount, would assure the strong interactions between the two phases. But,
though GOTMS is the most widely employed coupling agent [11-12] its slight
negative effect has to be taken into account. GOTMS, in fact, is a monoepoxide
agent, and its incorporation in the epoxy-amine network results in a decrease in
organic cross-linking density worsening the polymeric mechanical properties, if
some reactions involving either the organic or inorganic functionality did not
occur. Consequently, it will be essential to obtain quite totally hydrolyzed Si-OH
groups owing to the GOTMS molecules. Furthermore, to achieve this, the sol-gel
co-solvent has been changed from ethyl in isopropyl alcohol. In fact, as known,
the hydrolysis reaction become faster if the co-solvent used is not the same of
that generated by hydrolysis of the alkoxide. Thus, to avoid the plasticizing
effect of the sol-gel solvents, their extraction has been performed by using a
rotavapor in vacuum condition. The new hybrids samples are named Ep-Siy-Mx.
By using this protocol several formulations were prepared, as detailed in Table
13, to the aim to evaluate the siloxane content effect on the final properties of
hybrid samples. The actual siloxane content has been evaluated as thermo-
oxidative residual at 750°C by TGA analyses.

207
Samples Siloxane content (wt%)
Ep-Mx -
Ep-Si3-Mx 3.4
Ep-Si7-Mx 7.6
Ep-Si12-Mx 11.7
Ep-Si15-Mx 14.8
Ep-Si20-Mx 21
Table 13 - siloxane content of Ep-Siy-MX hybrid samples.
All hybrid samples also 2-3 mm in thickness dimensioned are transparent
indicating that the larger dimension of inorganic inclusions is smaller than
~450nm, as shown for the Ep-Si12-Mx hybrid in Figure 54.
This appearance must be attributed to both the nanosized siloxane domains and
the good interaction between them and the epoxide network, because of the high
amount of coupling agent GOTMS.
6.5.1 Characterization by WAXS analyses
In order to investigate the modification of epoxide network caused by the
introduction of siloxane structures, WAXS analysis has been performed. Figure
55 shows the scattering profiles of Ep-Si7-Mx and Ep-Si20-Mx hybrid samples.
Figure 54 - Ep-Si12-Mx sample picture.

208
The spectrum of the neat epoxy system Ep-Mx is also presented (Figure 55) for
comparison. It is worth noting that the neat epoxy resin shows two characteristic
broad bands with maximum located around 4.6 and 12 nm-1, respectively,
attributed to local density fluctuations of epoxy matrix [13]. The intensity of
WAXD scattering profiles at low q values is attributed to the electronic density
contrast between the siloxane and the organic phase [14], since the higher the
siloxane content the higher the scattering intensity. It is worth noting that the
siloxane domains affect the structure of the epoxide network, therefore a shift
and intensity reduction of the broad band at 12nm-1 attributed to the epoxy
network can be highlighted. Moreover, the band at 4.6nm-1 seems to disappear
because of the superimposed siloxane scattering. The absence of peaks in the
hybrids profiles demonstrated that no ordered organic-inorganic structures are
formed [15].
0 5 10 15 20 25 30
Ep-Mx Ep-Si7-Mx Ep-Si20-MxIn
tens
ity
q (nm-1)
0 1 2 3 4 5 6
0.1
1
Figure 55 - WAXS analyses of Ep-Siy-Mx hybrid samples. In the inset an enlargement of
the lowest q values is reported.

209
6.5.2 Characterization by 29Si-NMR Spectroscopy
In Figure 56 the 29SI-NMR spectra of Ep-Si12-Mx and Ep-Si20-Mx are shown,
highlighting that the architecture of the inorganic domains in terms of Q and T
arrangements changes with the siloxane content. In fact, in the Ep-Si12-Mx
hybrid spectrum only T2 and T3 species can be observed, whereas in the Ep-Si20-
Mx spectrum it is worth noting the presence of T0 and T1 peaks too. Hence, the
siloxane amount affects the GOTMS condensation reactions since the inorganic
structures originated from the trialkoxysilane change in terms of Ti species. In
details, since the T0 species are detected in the Ep-Si20-Mx spectrum, it seems
that no-bridged GOTMS molecules appears when the siloxane content increases.
Moreover, the siloxane content seems not affect the inorganic structure arising
from the TEOS molecules, since in both samples only Q4 and Q3 units are
present. Furthermore, the higher the siloxane amount the higher the Q4/Q3 ratio,
probably because of a higher siloxane content. By the knowledge of the peaks
positions the percentages of T and Q species can be assessed by applying a
deconvolution method of multi-peaks, as shown in Figure 57for the Ep-Si20-Mx
spectrum.
Origin program has been used to perform the peaks deconvolution and calculate
their area values. Since for the TEOS molecules only Q4 and Q3 units are present,
the conversion degree of siloxane units can be assessed by the following
formula:
4
43
3
32 43321 QQTTTq ++++=

210
Figure 56 -29Si-NMR spectra of Ep-Si12-Mx and Ep-Si20-Mx hybrid samples.
Figure 57 - Deconvolution of Ep-Si20-Mx 29Si-NMR spectrum.

211
The results, summarized in Table 14, show that as the siloxane content increases
the q conversion decreases.
Table 15: q conversion degree of siloxane structures in the Ep-Siy-Mx hybrid samples..
Samples q conversion (%)
Ep-Si7-Mx 88.5
Ep-Si12-Mx 85.6
Ep-Si20-Mx 77.3
Table 14 - q conversion degree of siloxane structures in the Ep-Siy-Mx hybrid samples.
These results could be tentatively explained by considering that the growth of
both the orgabnic and inorganic networks can be mutually influenced. In fact, the
amine hardener increases with the polysiloxane content, because of the higher
content of GOTMS molecules to be cross-linked. The more basic conditions due
to the higher amount of amine hardener allows the organic network to form more
rapidly. Hence, the fast growth of the epoxide organic network could hinder the
formation of the inorganic structure, limiting its extent probably because of the
rapid gelation of the epoxide network. This is an interesting feature evidenced
also by Davis et al. [16]. According to the authors [16], in fact, the inorganic
network formation has proceeded to a greater extent in the materials that have a
lower concentration of amine. This is contrary to what might be expected since
the more basic conditions normally accelerate the inorganic condensation.
Finally, the NMR analysis points out that by using the Ep-xAP-Mx protocol, the
formation of the two networks can be mutually influenced by the other one.
212
6.5.3 Characterization by Small Angle X-ray Scattering (SAXS)
In order to investigate the nanostructure of epoxy-siloxane hybrids and give
information regarding hierarchical structures and particle size distribution the
SAXS was employed [17-18]. Contrary to SAXS analyses performed previously,
here the Ep-Siy-Mx spectra are not subtracted for the neat epoxy profile, because
of the modification in the epoxide structure caused by its hybridization, as
WAXS highlighted (Figure 55). Figure 58 shows the SAXS patterns on log-log
plot for the hybrid samples as a function of siloxane content. The spectrum of the
neat epoxy is also presented. It is worth noting that at low siloxane content, i.e.
Ep-Si3-Mx, the typical epoxide broad band at 4.6nm-1 can be still observed,
pointing out that the siloxane amount is not enough to modify entirely the
organic structure. Whereas at higher siloxane content, the inorganic scattering
superimposes that of the epoxide broad band. Moreover, the higher the siloxane
content the higher the scattering intensity. Additionally, the Ep-Six-Mx spectra
with x>3, exhibit typical Guinier plateau revealing the existence of a “diluted”
hybrid system consisting of a few number of siloxane nanostructures dispersed in
the epoxy matrix [19-20]. This behaviour is retained in hybrids at high siloxane
content, i.e. Ep-Si20-Mx sample, which in turns does not show any correlation
peak, underlining the dilution of siloxane structures embedded in polymeric
matrix. The structure of siloxane phase in Ep-Six-Mx hybrids has been
determined calculating their gyration radius (Rg), which gives a measure of the
mean square distance of the scattering centers within inorganic domains from the
center of gravity [21]. Therefore, Rg is related to sizes of inorganic siloxane
domains, and could be calculated from the slope in the linear region of a plot of
ln(I(q)) versus q2, according to Guinier’s relation [22]:

213
)3/exp()( 22gRqqI −∝
Moreover, as done for the other hybrid samples, the slope in the log-log plot in
the Porod region has been used to assess the fractal dimension Dm of the siloxane
structures.
Samples Rg (nm) Dm
Ep-Si7-Mx 0.388 1.3
Ep-Si12-Mx 0.299 -
Ep-Si15-Mx 0.287 0.6
Ep-Si20-Mx 0.664 -
Table 15 - Rg and Dm values extracted from the SAXS patterns shown in Figure 58.
Figure 58 - SAXS scattering profiles for the Ep-Siy-Mx hybrid samples
In Table 15 the values of Rg and Dm have been reported. It is worth noting that
the fractal dimension is quite low, if compared with those previously reported.
214
Thus due to the high GOTMS content the inorganic structures are finely
dispersed in the organic matrix. Moreover, the size of the inorganic structures
reduces slightly as the siloxane content increases up to 15wt%. However, the
sample at highest siloxane content (i.e.Ep-Si20-Mx) exhibits a really high
inorganic size, namely 0.664. Again this sample does not follow the trend.
6.5.4 Scanning Electronic Microscopy (SEM) and Energy
Dispersive Scanning (EDS)
Fracture surfaces of the hybrid samples observed with Scanning Electron
Microscopy, and silicium distribution mapping taken from an energy-dispersive
analysis on the overall surface of the exposed surface, show how siloxane
structures are dispersed in the epoxide matrix (Figure 59). In Figure 59 it is
worth noting that the inorganic structure is quite homogeneous also at highest
siloxane content, i.e. Ep-Si20-Mx and no silica aggregations are evident. This
behaviour can be easily ascribed to the high percentage of GOTMS which can
provide chemical bonds between epoxide network and inorganic structures,
making better the compatibility between the two organic and inorganic phases.
Additionally, the silicium is homogenously distributed on the overall area
analysed. Furthermore, in the Ep-Si3-Mx hybrid sample, the appearance of black
spots is due to the polymeric matrix.

215
Ep-Si20-Mx
Ep-Si12-Mx
Ep-Si3-Mx
Figure 59 - SEM images of Ep-Siy-Mx with several siloxane content, namely y=3, 12 and 20. On the right of each micrograph, the silicium distribution mapping has shown as red spots.
6.5.5 Thermo-gravimetric Analysis (TGA) in air flow.
In Figure 60 the thermogravimetric analyses in air flow of hybrid samples Ep-
Si12-Mx and Ep-Si20-Mx and neat epoxy Ep-Mx have been reported. In the
inset, the temperature derivative curves DTA have been shown. It is worth noting
that the thermo-oxidative stability of hybrid samples at temperature higher then
400°C is greatly improved with respect to the neat epoxy system. In fact, as
evident in the inset of Figure 60, the maximum temperature of the second
decomposition process increases of about 40°C in the hybrid samples. Moreover,
as observed in other polymer silica nanocomposites [8, 23-26] the improvement
efficiency in the thermal stability of the epoxy-silica hybrids increases with
increasing the silica content. While being heated, the silica migrates on the
surface of the hybrid materials, because of its relatively low surface potential

216
energy. Then the siloxane domains act as a heat barrier to protect the inner layer
of polymer since they prevent the oxidation and thermal degradation of epoxide
network. Furthermore, in spite of performed curing cycle at high temperature, it
is worth noting a loss of sol-gel solvents at temperatures lower then 350°C. This
behavior is found to be common in the epoxy-silica hybrid materials [27-28],
probably because of solvents development at temperatures higher than of the
curing cycle.
Figure 60 - Thermo-gravimetric analyses performed in air flow of both the hybrid samples Ep-Si12-Mx and Ep-Si20-Mx, and the neat epoxy Ep-Mx. In the inset the derivative curves
with respect to the temperature has been reported.
6.5.6 Dynamic Mechanical Analysis (DMA)
Figure 61 shows the tensile storage modulus E’ and loss factor tanδ (=E’’/E’) of
both Ep-Siy-Mx hybrid and neat epoxy Ep-Mx systems as function of
temperatures. The results pointed out that the introduction of siloxane structures
into the epoxide network causes the glass transition temperatures to reduce with

217
respect to the neat epoxy system. The Tg values are shown in Figure 62 as a
function of siloxane content. It is worth noting that its values retain quite
constant when the siloxane content is lower than 15wt%, whereas it decreases
drastically for the Ep-Si20-Mx hybrid sample.
As also Habsuda et al. [29] found changes in the glass transition temperatures of
the hybrids are correlated with the siloxanes structures, in terms of T e Q values
by 29SI-NMR spectroscopy, and then with the molecular weight of the inorganic
clusters. They found that condensed but brunched structures like Q3 could be
expected to lead to better molecular interactions and miscibility with respect to
Q4, resulting in greater chain constraint and thus higher glass transition values.
Hence, an increase in Q3 leads to better organic-inorganic molecular mixing and
higher Tg values. In our case, the Q4/Q3 ratio increases with the siloxane content,
as the Figure 56 showed, thus in the Ep-Si20-Mx sample the high Q4 value could
be responsible of the observed Tg value dramatically reduced with respect to the
other hybrid systems. Additionally, the structural study by 29SI-NMR
spectroscopy highlighted that in the Ep-Si20-MX the T0 content is extremely
higher than that expected. Thus the contemporary presence of high Q4 and T0
siloxane structures act in synergistic way to cause a large decrease in Tg values
at highest siloxane content. In fact, if the Q4 structures can reduce the Tg because
of the poor interaction between the two phase with respect to other more open
siloxane structures, i.e. Q3, on the other hand the no-bridged T0 structures can
cause a plasticizing effect reducing the cross-link density. All these effects could
act together causing the low Tg value in the Ep-Si20-Mx sample.
In addition, it has been observed that the loss factor tanδ shape changes with the
siloxane content, becoming weaker and broader as the siloxane content increases.
As known [30], this is a typical behaviour of nanocomposites materials.

218
Moreover, the Ep-Si20-Mx shows a new damping peak which gives evidence of
a phase separation in the epoxy-siloxane systems. Again the viscous-elastic
behaviour could be explained by considering the inorganic structure distribution
pointed out by the 29SI-NMR spectroscopy. In fact, in the Ep-Si20-Mx sample
the loss factor shape could be due to the simultaneous presence of T0 and Q4
siloxane structures. The broad siloxane species distribution could affect the
molecular constraints and thus make large the region of molecular motion [9,
29].
Finally, as shown in Figure 61, the dynamic mechanical analyses pointed out that
the elastic modulus E’ of hybrid samples in the rubbery state increases with the
siloxane content, meaning that the crosslinking density of elastically effective
network νe increases, according to the equation [31]:
νe = E’/3RT
This beneficial effect can be due to the coupling agent effect of high GOTMS
content, which improves the interfacial interactions between the two organic and
inorganic phases providing chemical bonds between them, and then increasing
the cross-linkers number. Also Yang et al. [9] found that the modulus in the
rubbery region increases with the GOTMS content. Moreover, they demonstrated
that the introduction of GOTMS in the silica-epoxy hybrid materials can enhance
the interfacial interactions between silica and epoxy matrix and moreover it
increases the cross-linking density of the final system. Additionally, according to
our findings their results pointed out that the area of the tanδ peak decreased with
an increase of the GOTMS content. Conversely, they found that the glass
transition behaviour became indistinct as the GOTMS content increased.
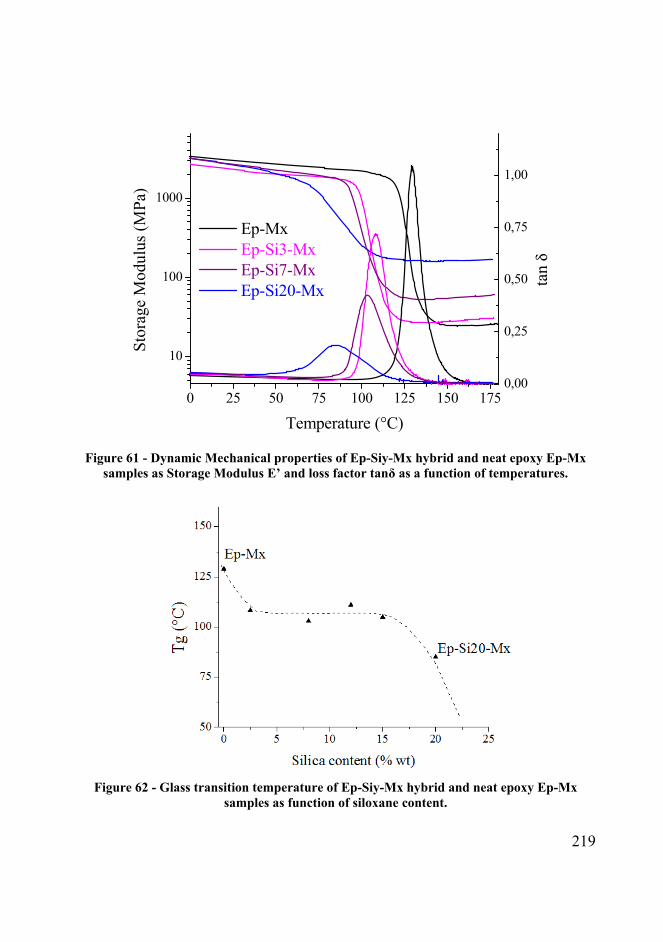
219
0 25 50 75 100 125 150 175
10
100
1000
0,00
0,25
0,50
0,75
1,00
Sto
rage
Mod
ulus
(M
Pa)
Temperature (°C)
Ep-Mx Ep-Si3-Mx Ep-Si7-Mx Ep-Si20-Mx
tan
δ
Figure 61 - Dynamic Mechanical properties of Ep-Siy-Mx hybrid and neat epoxy Ep-Mx
samples as Storage Modulus E’ and loss factor tanδ as a function of temperatures.
Figure 62 - Glass transition temperature of Ep-Siy-Mx hybrid and neat epoxy Ep-Mx
samples as function of siloxane content.

220
6.5.7 Nanoindentation experiments
The mechanical properties of the hybrid materials are obtained by
nanoindentation technique. Figure 63 shows the typical load-unload cycle for the
pure epoxy resin (Ep-Mx) and the Ep-Si12-Mx hybrid sample.
Figure 63 - Typical load-displacement curves of the hybrid Ep-Si12-Mx (a) and pure epoxy
resin (b).
The hardness and the elastic modulus obtained by the nanoindentation
measurements are shown in Figure 64 as a function of the siloxane content. It is
worth noting that except the sample Ep-Si12-Mx, both the hardness and the
elastic modulus decrease as the siloxane content increases. These results are in
evident contrast to what previously reported. In fact, as known, [21, 32], the
introduction of inorganic nanoparticles into a polymeric matrix usually allows
the hardness and elastic modulus to enhance. Indeed, for instance, the silica
addition by sol-gel method from TEOS in (γ-methacrylpropyl)trimethoxysilane
(MPMS) results in harder structures containing silica SiO2, which causes an

221
increase in the rigidity of the system [32]. However, the authors reported that if
the TEOS content is higher than 20wt%, its introduction causes the hardness to
reduce, because of the incomplete cross-linking and a looser final structure of the
organic-inorganic hybrid. Together with the hardness, the elastic modulus
decreases consequently. Additionally Xiong et al. [21] found that the process
parameters of the sol-gel reaction drastically affect the hardness of the hybrid
samples. They showed that the open and chain-like structures, the phase
separation with a small size and the decrease in the cross-linking density cause
the reduction of hardness and elastic modulus. Hence, the nanoindentation results
suggest that in the Ep-Siy-Mx samples the siloxane structures are quite open, and
the crosslinking density is lower than that of the neat epoxy system. Thus, as the
siloxane content increases the epoxide network become more soft, since both the
hardness and the elastic modulus decreases.
Figure 64 - Influence of siloxane content on the hardness and reduced elastic modulus of
the Ep-Siy-Mx samples.

222
6.5.8 Conclusions
The Ep-Siy-Mx protocol provides samples transparent in appearance and whose
morphology is homogeneous also at highest siloxane content. The absence of
large inorganic aggregation can be easily ascribed to the high amount of coupling
agent GOTMS, which displayed to be better than APTES to make compatible the
two phases in the organic-inorganic hybrid materials production. Its use, in fact,
allows to affect the intimate epoxide structure, as pointed out from the WAXS
analyses, and produce nanosized inorganic clusters, as highlighted from the
SAXS results. Therefore, in the last Ep-Siy-Je protocol, to the aim to study only
the hardener amine effect, both the hybrid preparation procedure and the
GOTMS amount have been retained the same of the Ep-Siy-Mx approach.
Nevertheless, in spite of their good appearance and the little inorganic structures,
the Ep-Siy-Mx samples show poor mechanical properties because their Tg’s
reduced with respect to that of the neat epoxy system. The 29Si-NMR results
pointed out that in our case, conversely to what Hsiue et al. [27] found, the total
amount of siloxane bridges, namely the q conversion, decreases with the siloxane
content, implying that as the amount of precursors increases a more open and
poor siloxane structures are formed. It follows that when the siloxane content
increases, more soft materials are obtained, as the decreasing hardness revealed
from the nanoindentation measurements. Then the siloxane chain-like structure
and the presence of the T0 moieties in the Ep-Si20-Mx become responsible of the
reduced value of hardness and Tg’s in the hybrid materials, since the mobility of
the epoxy chain is greatly enhanced by their plasticizing effect. In fact, as known
[27], the silica is able to enhance the final mechanical properties of hybrid
materials, only if complete silica network can be formed [33], causing a reduced

223
mobility of the epoxy chains and then producing relatively high Tg’s [8, 24, 27,
34].
Therefore, to the aim to prepare hybrid materials with improved mechanical
properties and to study the effect of the amine hardener on the inorganic
structure formation, the Jeffamine D230 has been used instead of the MXDA in
order to prepare the Ep-Siy-Je samples.
6.6 Sol-gel pre-hydrolysis D230--based hybrids (Ep-
Siy-Je)
With the Ep-Siy-Je protocol several formulations were prepared, as listed in
Table 16 The actual siloxane content has been evaluated as thermo-oxidative
residual at 750°C by TGA analyses.
Sample Siloxane content (wt%)
Ep-Je 0
Ep-Si7-Je 6.6
Ep-Si12-Je 12.3
Ep-Si18-Je 17.8
Ep-Si22-Je 21.5
Table 16 - Ep-Siy-Je hybrid samples. The actual siloxane contents are indicated.
These systems have been exhaustively characterized by following all the
processes and modifications in the chemistry and morphology which happen
during the preparation steps (see Scheme 9).

224
6.6.1 Characterization of siloxane precursors solution.
As previously discussed, the GOTMS/TEOS molar ratio and the sol-gel process
parameters own to Ep-Siy-Mx approach provide hybrid samples with the desired
final inorganic morphology. Therefore, a study of the inorganic network
evolution during the sol-gel reaction has been done. To achieve this goal, the
precursor solution has been characterized by using NMR and GPC techniques
before and after the pre-hydrolysis reaction at 60°C.
Scheme 9 - Schematic drawing of characterizations performed on the Ep-Siy-Je hybrids.

225
6.6.1.1 Nuclear Magnetic Resonance (NMR)
The 1H, 13C and 29Si NMR provided information on both the hydrolysis and
condensation degree of siloxane precursors and the stability of GOTMS epoxy
ring during the pre-hydrolysis reaction at 60°C. As a matter of fact, as Matejka et
al. [11] suggested, during the pre-hydrolysis step, a reaction of the GOTMS
epoxy group could also occur. In particular, in our system, two kind of
nucleophilic attach could theoretically take place, namely from OH of both H2O
and SiOH silanols groups. Since Hsu et al [35] found that H2O does not appear
to participate in epoxy ring opening reaction, in this work the OH attach from
water molecules has not been considered. In Figure 65, the 29Si NMR spectrum
between -40 and -60ppm has been shown. According to what Hook et al found
[36-39], assignments for the hydrolysis/condensation species formed during the
pre-hydrolysis reaction have been done. Hence all the partially or totally
hydrolyzed Si(OH)m(OCH3)n GOTMS peaks have been assignment, as indicated
in Figure 65.

226
[ppm]- 40 - 45 - 50 - 55
0.43
130.
2944
0.25
680.
3391
0.11
80
1.47
58
0.47
11
[ppm]- 40 - 45 - 50 - 55
0.43
130.
2944
0.25
680.
3391
0.11
80
1.47
58
0.47
11
----Si (OH)3
----Si (OCH3)(OH)2
----Si (OCH3)2(OH)----Si (OCH3)3
T0 T1T2
----Si (OCH3)2- O- CH2-CH(OH)CH2----
[ppm]- 40 - 45 - 50 - 55
0.43
130.
2944
0.25
680.
3391
0.11
80
1.47
58
0.47
11
[ppm]- 40 - 45 - 50 - 55
0.43
130.
2944
0.25
680.
3391
0.11
80
1.47
58
0.47
11
----Si (OH)3
----Si (OCH3)(OH)2
----Si (OCH3)2(OH)----Si (OCH3)3
T0 T1T2
[ppm]- 40 - 45 - 50 - 55
0.43
130.
2944
0.25
680.
3391
0.11
80
1.47
58
0.47
11
[ppm]- 40 - 45 - 50 - 55
0.43
130.
2944
0.25
680.
3391
0.11
80
1.47
58
0.47
11
[ppm]- 40 - 45 - 50 - 55
0.43
130.
2944
0.25
680.
3391
0.11
80
1.47
58
0.47
11
[ppm]- 40 - 45 - 50 - 55
0.43
130.
2944
0.25
680.
3391
0.11
80
1.47
58
0.47
11
----Si (OH)3
----Si (OCH3)(OH)2
----Si (OCH3)2(OH)----Si (OCH3)3
T0 T1T2
----Si (OCH3)2- O- CH2-CH(OH)CH2----
Figure 65 – 29 Si-NMR of reaction mixing before 4h at 60 °C.
[ppm]3.5 3.0 2.5 2.0 1.5
8.64
36
0.99
85
0.99
29
1.00
00
2.18
45
2.14
10
[ppm]3.5 3.0 2.5 2.0 1.5
8.64
36
0.99
85
0.99
29
1.00
00
2.18
45
2.14
10
Si – CH2 – CH2 – CH2 – O – CH2 – CH – CH2
OCH 3
OCH 3
H3CO
O
1 2 3 4 5 6
7
[ppm]3.5 3.0 2.5 2.0 1.5
8.64
36
0.99
85
0.99
29
1.00
00
2.18
45
2.14
10
[ppm]3.5 3.0 2.5 2.0 1.5
8.64
36
0.99
85
0.99
29
1.00
00
2.18
45
2.14
10
[ppm]3.5 3.0 2.5 2.0 1.5
8.64
36
0.99
85
0.99
29
1.00
00
2.18
45
2.14
10
[ppm]3.5 3.0 2.5 2.0 1.5
8.64
36
0.99
85
0.99
29
1.00
00
2.18
45
2.14
10
Si – CH2 – CH2 – CH2 – O – CH2 – CH – CH2
OCH 3
OCH 3
H3CO
O
Si – CH2 – CH2 – CH2 – O – CH2 – CH – CH2
OCH 3
OCH 3
H3CO Si – CH2 – CH2 – CH2 – O – CH2 – CH – CH2
OCH 3
OCH 3
H3CO Si – CH2 – CH2 – CH2 – O – CH2 – CH – CH2
OCH 3
OCH 3
H3CO
OCH 3
OCH 3
H3CO
O
1 2 3 4 5 6
7
6 61
[ppm]3.5 3.0 2.5 2.0 1.5
8.64
36
0.99
85
0.99
29
1.00
00
2.18
45
2.14
10
[ppm]3.5 3.0 2.5 2.0 1.5
8.64
36
0.99
85
0.99
29
1.00
00
2.18
45
2.14
10
Si – CH2 – CH2 – CH2 – O – CH2 – CH – CH2
OCH 3
OCH 3
H3CO
O
1 2 3 4 5 6
7
[ppm]3.5 3.0 2.5 2.0 1.5
8.64
36
0.99
85
0.99
29
1.00
00
2.18
45
2.14
10
[ppm]3.5 3.0 2.5 2.0 1.5
8.64
36
0.99
85
0.99
29
1.00
00
2.18
45
2.14
10
[ppm]3.5 3.0 2.5 2.0 1.5
8.64
36
0.99
85
0.99
29
1.00
00
2.18
45
2.14
10
[ppm]3.5 3.0 2.5 2.0 1.5
8.64
36
0.99
85
0.99
29
1.00
00
2.18
45
2.14
10
Si – CH2 – CH2 – CH2 – O – CH2 – CH – CH2
OCH 3
OCH 3
H3CO
O
Si – CH2 – CH2 – CH2 – O – CH2 – CH – CH2
OCH 3
OCH 3
H3CO Si – CH2 – CH2 – CH2 – O – CH2 – CH – CH2
OCH 3
OCH 3
H3CO Si – CH2 – CH2 – CH2 – O – CH2 – CH – CH2
OCH 3
OCH 3
H3CO
OCH 3
OCH 3
H3CO
O
1 2 3 4 5 6
7
6 61
Figure 66 – 1H NMR of reaction mixing after 4h at 60 °C
The peak at -43ppm could be tentatively ascribed to the –Si(OCH3)-O-CH2-
CH(OH)CH2- group, coming from the reaction between the Si-OH and the

227
GOTMS epoxy ring. This unexpected result highlights that the epoxy ring
belonging to the GOTMS molecules is not quite stable, since the SiOH group is
able to open it. Moreover, to the aim to quantify the extent of the GOTMS epoxy
ring reacted, the evaluation of the ratio between the intensity of two H in position
6 and that in 1 has been done (see Figure 66). Since its value is 0.93 (see 1H-
NMR spectrum in Figure 66), [40] , the GOTMS epoxy ring has been considered
to be stable versus the SiOH nucleophilic reaction.
Figure 67 - 29Si NMR of precursors mixing after the hydrolysis reaction at 60°C.
In Figure 67 the 29Si NMR spectrum of the siloxane mixture after 4h at 60°C has
been showed. It is worth noting that all the hydrolyzed and condensed moieties
belonging to the GOTMS molecules are present, whereas the TEOS
condensation seems to be negligible. 29Si NMR spectrum (Figure 67) has been
used to determine siloxane conversion degree in Si-O-Si groups defined as:
43
32 1321 QTTTq +++
=
since here only Ti and Q1 species could be detected.
In spite of the DBTDL catalyst, after 4h at 60°C the siloxanes conversion degree
q reaches a value of about 40%, hence open and poorly condensed siloxane

228
structures form after the pre-hydrolysis step. This is in contrast to what Matejka
et al. found [11]. They stated, in fact, that no hydrolysed T0 units are observed in
a DBTDL-catalysed system because of their immediate condensation to
branched T2 and T3 units, which rapidly form, becoming soon the dominant
structures.
6.6.1.2 Gel Permeation Chromatography (GPC) of siloxane precursors
mixture
In Figure 68 the GPC results related to the unreacted and hydrolyzed precursors
mixture (after 4h at
60°C) has been shown. The two profiles (Figure 68) differ only for the presence
of a broad peak at lower values of retention volumes for the reacted mixture.
Since in GPC techniques molecules with larger size reach the end of the column
before molecules with smaller size, hence the higher the molecular weight the
lower the retention volume. Keeping in mind this statement, the appearance of
the broad peak at lower retention volume value is a clear evidence of the slightly
increased molecular weight during the pre-hydrolysis reaction at 60°C. These
results confirm what the NMR analyses highlighted, that is the low tendency of
siloxanes structure to condensate during the reaction at 60°C.

229
Figure 68 - GPC results of precursors mixing before and after the hydrolysis reaction at 60°C.
6.6.2 Cross-linking reaction of hybrid mixture without the addition
of hardener.
As previously demonstrated by the 29SI-NMR spectroscopy, the reaction between
the GOTMS epoxy ring and silanols groups SiOH is possible to occur.
Therefore, in order to evaluate the extent of the reaction between epoxy
monomers and silanols groups, the hydrolyzed precursors and the DGEBA
oligomers have been mixed to obtain an actual siloxane content of 22 wt% (Ep-
Si22). The hybrid mixture (organic/inorganic moieties) has been heated by
following the usual curing cycle (namely 4h at 80°C and 12h at 180°C), but in
absence of the amine hardener. During the pseudo-curing cycle in several steps,
i.e. after both 2 and 4h at 80°C, and after both 2 and 12h of post-curing at 180°C
the samples have been analyzed by DSC, FT-IR and GPC.

230
Figure 69 - DSC of hybrid mixtures without the addition of the hardener during the curing
cycle.
6.6.2.1 Differential Scanning Calorimetry (DCS)
The DSC thermograms of the hybrid mixture at different curing cycle steps have
been plotted in Figure 69. It is worth noting that after 4 hours at 80°C the Tg
slightly increases from -71 to -66°C, whereas after the post-curing at 180°C the
Tg increases visibly up to -35°C. The increase of the Tg during the curing cycle
at 180°C without the addition of the hardener speaks in favour of an appreciable
increased molecular weight, probably due to the effect of Si-OH groups as cross-
linkers of epoxide groups. Moreover, it cannot be excluded the possibility that
the Tg increasing could be due to the condensation reaction of siloxane which
takes place at high temperature.

231
t = 0
t = 4h@80°C+12h @180°C
t = 4h@80°C
t = 4h@80°C + 2h @180°C
DGEBA
TEOS/GOTMS
Figure 70 - GPC chromatograms related to the hybrid mixture at several step of the curing
cycle without the addition of the hardener.
6.6.2.2 Gel Permeation and Cromatography (GPC)
The GPC chromatograms (Figure 70) show the presence of TEOS and GOTMS
traces after 4h at 80°C, as the presence of the negative peaks at a retention
volume value of about 20mL (red and blue curves) attests. Furthermore, the
broad peak (ranging from 19 to 22mL) shits at lower retention volume values
after the first step at 80°C. Since the lower the retention volume the higher the
molecular weight, the shift of the broad peak suggests a slight increase of the
molecular weight. Finally, after 2h at 180°C a disappearance of the broad peak at
low retention volume values can be observed, pointing out the complete absence
of soluble moieties in THF solvent. Additionally, from the intense peak at about

232
25.5mL the relative amount of unreacted DGEBA can be assessed. The results
pointed out that after 12 hours at 180°C about the 30wt% of DGEBA has
reacted.
b)a)
Figure 71 - FT-IR spectra of hybrid mixture (actual silica content 22 wt%) during the
curing cycle at 80°C (a) and the post-curing at 180°C (b).
6.6.2.3 Fourier Transform-Infrared (FT-IR)
The Figure 71 shows the FT-IR spectra of the hybrid mixture thin film during the
curing cycle at 80 (a) and 180°C (b), the arrows indicating the time evolution of
the spectra. By using the following relationship (see chap 4)
(1) where
the conversion degree of epoxide groups has been assessed, and the resulting
trend has been shown in Figure 72. The α estimation has been repeated twice.
From the curves reported in Figure 71, it is worth noting that the cross-linking
reaction at 80°C slightly allows the epoxide groups to react (Figure 71 a),
whereas the post-curing at 180°C exhausts all the epoxide groups (Figure 71 b).
In fact, according to the equation (1), the conversion degree reaches a value of
9160
9169160
AAA t−
=α 1509
916916
AAA =

233
about 0.3-0.4 during the heating at 80°C, and become equal to 1 after few hours
at 180°C (as showed in Figure 72). Furthermore, a possible catalytic effect of
KBr on the cross-linking reaction of epoxy groups has to be considered. The first
experimental data were not considered because of their apparent reduction,
probably ascribed to the choice of the first absorbance value at 25°C. Anyway,
after the curing at 180°C the overall consumption of epoxy ring is quite evident.
Figure 72 - Conversion degree of epoxide groups belonging to the hybrid mixture (without
the addition of hardener) after the curing cycle at 80 and 180°C.
6.6.2.4 Conclusions
All the experimental results (GPC, FT-IT and DSC) suggest that in absence of
the amine hardener the cross-link reaction of epoxide from SiOH groups starts at
80°C and becomes quite complete after the post-curing at 180°C. In particular, at
80°C the epoxide rings could be opened by the Si-OH groups causing the Tg to
increase slightly. Instead the prominent increase of the Tg at 180°C could be
explained with the concurrence of two phenomena, i.e. the cross-linking of both

234
the organic and inorganic species enhanced by the increased temperature.
Concerning this, the cross-linking reaction of the organic moieties could be
promoted by the silanols Si-OH groups which are able to open the epoxide rings.
Furthermore, the reaction of nucleophilic addition of silanols on the epoxide
groups would generate other hydroxyl groups, which could in turn act as catalyst
of the epoxy cross-linking [41] and then form the tree-dimensional organic
network. The increasing of Tg to -35°C and the unitary conversion degree
strongly suggested that. Beside the increase of the temperature could enhance the
condensation reaction involving the silanols groups to form the siloxane
domains. Moreover, due to the high content of organosilanes GOTMS, the two
reaction mechanism would act together to form a global organic-inorganic three-
dimensional network. The reaction promoted by the silanols groups in the
opening of epoxide rings could become competitive to that involving the diamine
hardener.
Finally, it is worth noting the different estimation of conversion degree arising
from the GPC and FT-IR results. This apparent mismatch could be explained by
considering the different approach of the two techniques, that means by the GPC
analyses only an estimation of the molecular weight could be done, whereas the
FT-IR approach takes into account the consumption of functional groups, i.e.
epoxide groups belonging to the both GOTMS and DGEBA species. In fact, if
the heating at 80°C promotes the opening of the epoxide rings by Si-OH groups,
without any other cross-linking reactions, then the FT-IR spectrum would show a
consumption of epoxide groups, whereas the GPC analysis would not.
Secondary, while the GOTMS molecules presence concurs to the absorbance of
epoxide functional groups in the FT-IR analysis, the same ones are not
considered in the estimation of conversion degree of DGEBA in GPC method.

235
6.6.3 Addition of hardener and characterization during the curing
cycle
The influence of both the siloxane presence and the kind of amine hardener on
the epoxide cross-linking reaction rate have been evaluated by FT-IR and DSC
measurements.
6.6.3.1 Effect of siloxane amount on the crosslinking rate (FT-IR)
The Figure 73 shows the FT-IR absorption spectra in the range 880-970 cm-1 of
the Ep-Je sample during the curing cycle. The arrow indicates the decreasing of
the epoxy peak centred at 916cm-1 during the cross-linking reaction. By using the
equation (1) the conversion degree α has been evaluated for both the neat epoxy
system Ep-Je and two hybrids, namely Ep-Si12-Je and Ep-Si22-Je, in order to
study the effect of Si-OH groups on the cross-linking reaction when the hardener
amine is present. The α values as function of curing time are shown in Figure 74.
It is worth noting that the presence of Si-OH groups make the epoxy cross-link
reaction faster, since the reaction rate dα/dt for the hybrids is higher than that of
the neat epoxy. As previously shown, at 80°C the SiOH groups affect slightly the
cross-link reaction of epoxy groups, promoting even if weakly the cross-link
reaction. Moreover, the Si-OH group is able to catalyze the cross-link reaction of
epoxy ring from the amine hardener [41]. These two effects contribute in a
synergistic way to allow the hybrid samples gel faster than the neat epoxy. The
same beneficial effect from SiOH groups on the cross-linking epoxy reaction has
been found by Altmann et al [42]. They observed a catalytic effect in presence of
high contents of micro-sized crystalline silica fluor in the cross-linking reaction
of an epoxy matrix. In particular in presence of the filler, the reaction rate

236
increased rapidly especially at the beginning of the process and the gelation and
vitrification times decreased [42]. Moreover, the high specific surface on nano-
dimensioned siloxane structures is expected to influence significantly more the
kinetics of the process due to the high content in silanols groups. In fact, it is
well known that epoxy-amine reactions can be accelerated by compounds that
stabilize the alkoxide ion intermediates, as OH belonging to silanols groups [43-
44]. After the gelation time the cross-link reaction rate of hybrids slows down.
As a consequence the hybrids reach α conversion degrees lower than the neat
epoxy, because of the higher viscosity of reacting mixture due to faster gelation.
Furthermore, it is possible noting that the higher the siloxane content the higher
the plateau value of α conversion degree in the hybrid samples. This behaviour
could be due to the higher amount of siloxane mixture which causes the viscosity
to be longer low. The curing step at 180°C promotes the epoxide groups to cross-
link quite completely in the Ep-Je and Ep-Si22-Je samples, whereas the
conversion degree of EP-Si12-Je sample retains still lowest probably due to the
vitrification which took place at 80°C.

237
900 920 940 960
DGEBA+D230
Wavenumbers (cm-1)
Increasing reactiontime
Figure 73 - FT-IR absorption spectra in the range 880-965 cm-1 of Ep-Je sample during the
curing cycle.
Figure 74 - Conversion degree of epoxide groups during the curing cycle with Jeffamine
D230 of Ep-Je, EP-Si12-Je and Ep-Si22-Je samples.
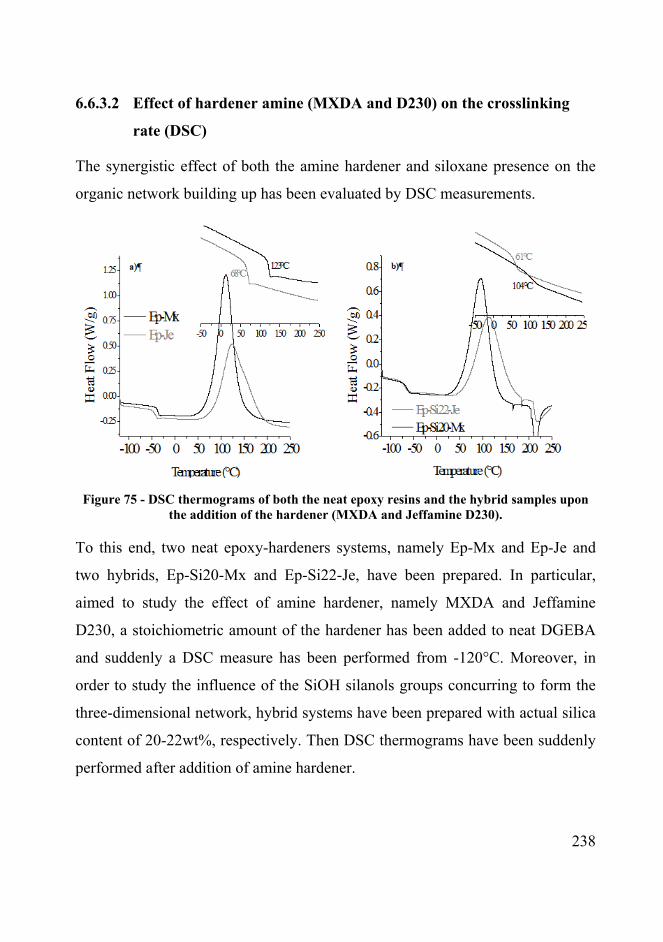
238
6.6.3.2 Effect of hardener amine (MXDA and D230) on the crosslinking
rate (DSC)
The synergistic effect of both the amine hardener and siloxane presence on the
organic network building up has been evaluated by DSC measurements.
Figure 75 - DSC thermograms of both the neat epoxy resins and the hybrid samples upon
the addition of the hardener (MXDA and Jeffamine D230).
To this end, two neat epoxy-hardeners systems, namely Ep-Mx and Ep-Je and
two hybrids, Ep-Si20-Mx and Ep-Si22-Je, have been prepared. In particular,
aimed to study the effect of amine hardener, namely MXDA and Jeffamine
D230, a stoichiometric amount of the hardener has been added to neat DGEBA
and suddenly a DSC measure has been performed from -120°C. Moreover, in
order to study the influence of the SiOH silanols groups concurring to form the
three-dimensional network, hybrid systems have been prepared with actual silica
content of 20-22wt%, respectively. Then DSC thermograms have been suddenly
performed after addition of amine hardener.

239
The Figure 75 a) shows the two thermograms related to the two neat epoxy
systems prepared by using the two hardeners (MXDA and Jeffamine D230). In
Figure 75 b) the curves related to the hybrid samples have been reported. The
second DSC scan has been shown in the inset of Figure 75 a) and b). The shape
of the thermogram and the position of the maximum would provide some
knowledge about the amine reactivity, whereas the comparison with the
corresponding hybrid provides information about the effect of silanols groups on
the cross-linking reaction. The parameters extrapolated by the thermograms of
Figure 75 a) and b) are reported in Table 17, where Tg1 and Tg2 are the glass
transition temperature related to the first and second heating scan, respectively;
Tt is the temperature value corresponding to the tangent to the exothermal curve
in its increasing step (providing a measure of the cross-linking reaction
beginning); Tmax the temperature value corresponding to the maximum of the
exothermal curve and finally ΔH is the total heat of cross-linking reaction,
corresponding to the area under the exothermal peak. The results highlighted that
the thermograms of both neat and hybrid systems MXDA-based are more
reactive than those Jeffamine D230-based, because of the lower temperature Tt
and Tmax values. In practice, the overall curves of MXDA-based systems are
shifted at lower temperature values if compared to those of D230-based ones.
According to our results, Mijovic et al. [45] found that in the MXDA the
electron-donating group enhances the reaction rate of attaching the epoxide
groups and then lowers the relative activation energy. Additionally, the hybrid
samples seem to be more reactive then the relative neat systems because of the
lower values of both the Tt and Tmax. This behaviour could be ascribed again to
the catalytic effect of the SiOH silanols groups on the cross-link reaction of
epoxy rings [43-44]. The SiOH groups affect the organic network building up

240
because they are able on the one hand to stabilize the epoxide intermediates
during the cross-linking reaction and on the other hand they could contribute
themselves to react with the epoxy rings, as previously demonstrated.
Moreover, the ΔH of hybrid samples is always lower than that of the
corresponding neat epoxy system DGEBA-hardener, probably due to the
occurrence of the inorganic endothermic condensation involving the siloxane
groups overlapping to the exothermal cross-linking reaction. In conclusion, it is
worth noting that not only the siloxane presence but also the kind of hardener
could affect the crosslinking reaction rate leading probably to different hybrid
properties.
Table 17 - Calorimetric parameters obtained by the DSC measures.
In conclusion the DSC and FT-IR measurements were useful to understand that:
SiOH has a catalytic effect of on the cross-linking reaction especially at
the beginning of the reaction;
MXDA is faster than Jeffamine D230 in building up the organic network;
Tg1 Tg2 Tt Tmax ΔH (J/g)
D230
Neat Epoxy -41.97 69.55 83.55 124.64 290.6
Hybrid 60/40
-70.82 60.24 62.36 113.96 248.3
MXDA
Neat Epoxy -37.31 122.61 76.10 110.89 370.7
Hybrid 60/40
-63.42 104.66 53.65 95.66 286.8

241
Silanols and hardener effects can act in synergistic way to make the
reaction rate faster.
6.6.4 Characterization of cured hybrid samples (Ep-Siy-Je)
After addition of Jeffamine D230 in stoichiometric amount, the hybrid samples
have been cured and then characterized in morphology, flame resistance and
mechanical properties.
6.6.4.1 Morphology of hybrids (WAXS/SAXS, 29Si-NMR and molecular
dynamics simulations)
6.6.4.1.1 29Si-NMR spectroscopy
The structural features of the siloxane moieties are characterized by 29Si solid
state NMR spectroscopy. Figure 76 illustrates typical 29Si-NMR spectra of the
hybrid compounds, here represented by the samples Ep-Si12-Je and Ep-Si22-Je.
The results pointed out that the inorganic structure, in terms of Ti and Qi does
not change with the siloxane content, but, as shown in Figure 76, all hybrids
possess only T3, Q3 and Q4 units. A little shoulder at about -55ppm can be
assigned to not completely condensed T2 units. Therefore since silicon by
GOTMS has completely condensed as T3 units and silicon by TEOS appears as
Q3 and Q4 units, it follows that GOTMS and TEOS are completely condensed to
form rigid cage-like clusters [46]. Therefore, contrary to what happened for the
MXDA, the Jeffamine D230 causes the silicon to condensate also at highest
siloxane amount, i.e. 20wt%.

242
Ep-Si12-Je
ppm) -125-100-75-50-25025
-65.4
-105.2
Ep-Si12-Je
ppm) -125-100-75-50-25025
-65.4
-105.2
ppm) -125-100-75-50-25025
-65.4
-105.2
ppm -175-150-125-100-75-50-250255075
-93.7
-104.6 -108.2
Ep-Si22-Je
ppm -175-150-125-100-75-50-250255075
-93.7
-104.6 -108.2
Ep-Si22-Je
Figure 76 - 29Si-NMR spectra for Ep-Si12-Je and Ep-Si22-Je hybrid samples.
6.6.4.1.2 Wide Angle X-ray Scattering (WAXS) characterization
The log-log WAXS spectra of Ep-Siy-Je hybrid samples and the corresponding
neat epoxy system are shown in Figure 77. The spectra of the Ep-Siy-Je were not
subtracted for the corresponding neat epoxy system spectrum.
Similarly to the Ep-Mx also the Ep-Je sample highlights two characteristic broad
bands attributed to local density fluctuations of epoxy matrix centred at about 4
and 12nm-1 [13]. These two bands are characteristic of the epoxy component
DGEBA, since their position, shape and intensity do not change by using
different hardener, namely MXDA and Jeffamine D230. Therefore, the short
range order of the epoxy resins is not changed with the amine cross-linker. On
the other hand, it is worth noting that the introduction of the siloxane structures

243
modifies the inner structure of the epoxide network, since a modification in
shape, intensity and position of the broad band at 12nm-1 have been observed.
Finally, the epoxy band at about 4nm-1 seems to disappear under the high
scattering intensity at low q values due to the siloxane domains [14]. The WAXS
structural investigation points out that the inner structure of the epoxide network
changes with the introduction of siloxane domains to form the Ep-Siy-Je
samples, in the same way happened for the Ep-Siy-Mx hybrids. Therefore, this
result strengthens the idea that it is the high content of GOTMS in the siloxane
mixture to be responsible of the deep structural modification in epoxide network.
To better understand the role of the GOTMS and siloxanes on the modification
of epoxide network, WAXS measurements have been done on the neat Ep-Je and
hybrid Ep-Si22-Je samples during the curing cycle.
Figure 77 - WAXS spectra of Ep-Siy-Je hybrids and Ep-Je neat epoxy.

244
Figure 78 - WAXS spectra of Ep-Je neat epoxy acquired during the curing cycle.
Figure 79 - WAXS spectra of Ep-Si22-Je hybrid acquired during the curing cycle.

245
Figure 78 shows the WAXS spectra related to the neat epoxy system Ep-Je
acquired during the curing cycle. Here it is worth noting that the short range
order of the epoxy resin has not been changing during the curing cycle, since the
peaks centred at about 4 and 12nm-1 and attributed to local density fluctuations
of epoxy matrix do not modify in position, shape and intensity during the organic
cross-linking reactions. This important statement confirm that since these two
peaks appear at the beginning of the cross-linking reaction, before the formation
of the tridimensional network they are effectively due to very short range of
density fluctuations and not to the whole epoxide network. This is the reason
why the position, shape and intensity of these two peaks do not change by
changing the amine hardener from MXDA to Jeffamine D230. Figure 79 shows
the same sequences of scattering spectra during the curing cycle related to the
Ep-Si22-Je hybrid. It is worth noting that the broad band at about 12nm-1
characteristic of epoxy short range fluctuation results to be modified just at the
beginning of the cross-linking reaction. As a matter of fact, this peak is shifted to
higher q values and highlights a lower scattering intensity if compared to the
corresponding spectrum of the neat epoxy Ep-Je. Therefore, it follows that it is
the simply introduction of siloxane molecules into the organic mixture to cause
changing’s in the local density fluctuation of epoxy oligomers.
6.6.4.1.3 Small Angle X-ray Scattering (SAXS) characterization and
Molecular Dynamics Simulations
In order to study the siloxane structure the scattering at low q values in the log-
log plot has to be considered. In Figure 77 the high scattering intensity al low q
values is ascribed to the inorganic siloxane structures, since it does not appear in
the neat epoxy Ep-Je spectrum. Moreover, the shape of the scattering intensity in

246
this region changes with the siloxane content, showing typical Guinier behaviour
for the Ep-Si7-Je and Ep-Si12-Je samples and an overlapped peak at 2.33 nm-
1for the Ep-Si18-Je and Ep-Si22-Je spectra. The presence of a typical Guinier
knee reveals the existence of a “diluted” hybrid system consisting of a few
number of siloxane nanostructures dispersed in the epoxy matrix [19-20]. It is
possible to assess the gyration radius Rg [21] as the slope in the linear region of
the plot ln(I(q)) vs q2, in either Ep-Si7-Je or Ep-Si12-Je spectra, according to
Guinier’s relation [22]:
)3/exp()( 22gRqqI −∝
The Rg has been evaluated to be 0.36nm. In the samples at high inorganic
content, namely Ep-Si18-Je and Ep-Si22-Je, the correlation peak can be imaged
overlapped to the characteristic knee shape of Guinier regime. Therefore, the
same value of gyration radius has been attributed to the inorganic structures in
the Ep-Si18-Je and Ep-Si22-Je hybrids. Matejka et al. [11] found that under
particular reaction conditions the GOTMS polymerization could lead to
formation of cage-like structures, the polyhedral oligomeric silsesquioxane
POSS units with well established architecture. The tendency to build up the
cage-like structures and their content depends on the catalyst used for the sol-gel
process. In particular, cyclization is preferred under basic or neutral catalysis,
namely with DBTDL [47]. This behaviour can be easily ascribed to the tendency
of GOTMS to form condensate T3 structures, which result preferred under basic
reaction condition. This behaviour is evident in the 29Si-NMR spectra (Figure 76)
where the T3 condensed units result to be the predominant structure, together to
Q3 and Q4 units. In fact, it cannot be excluded the possibility for TEOS to
participate in building up the POSS cages, as for Q3 could replace the T3 units,

247
whereas Q4 units could tie two neighbouring cages. Additionally the length of a
Si-O-Si edge in the cubic octamer POSS structure is about 0.3 nm (Figure 80), in
agreement with the Rg value of 0.36 pointed out for the Ep-Siy-Je samples.
~0.3nm
Cubic octamer T8
Figure 80 - Structure of a cubic octamer POSS
Therefore, in conclusion the SAXS results highlight the tendency of GOTMS
molecules to form cage-like inorganic structures, whose dimension are about 0.3-
0.4nm.
Moreover, the correlation peak in the Ep-Si18-Je and Ep-Si22-Je hybrids has to
be ascribed to the distance between neighbouring inorganic domains or
heterogeneity. These two systems are not diluted, but a great number of siloxane
domains are present, since a peak correlation can be detected. As known [7, 21,
47], the position of the scattering peak can be used to estimate the average
distance between the siloxane rich regions, by calculating the interdomain
distance as d=2π/qmax, where qmax is the scattering vector at the peak maximum

248
[7, 21, 47]. Since qmax is 2.33nm-1, the average distance between two siloxane
domains is about 2.7nm. To the aim to investigate the nature of the interdomain
distance peak and then to study the evolution of the inorganic structures, SAXS
measurements of Ep-Si22-Je have been done during the curing cycle. The spectra
are shown in Figure 82. Moreover, the same procedure has been followed by
testing the Ep-Si12-Je sample, which did not show the correlation peak. The
SAXS spectra have been shown in Figure 81.
Figure 81 - SAXS spectra of Ep-Si12-Je hybrid acquired during the curing cycle.

249
Figure 82 - SAXS spectra of Ep-Si22-Je hybrid acquired during the curing cycle.
The SAXS spectra of the Ep-Si12Je hybrid point out that the shape of the
scattering curves does not change during the curing cycle and the characteristic
Guinier knee shape appears at the beginning of the cross-linking reaction and
retain up to complete the sample curing. Therefore in the Ep-Si12-Je sample, the
final morphology, consisting of few number of siloxane domains dispersed in the
epoxide matrix to form a diluted system, corresponds to that present at the
beginning of the cross-linking reaction. On the contrary, in the Ep-Si22-Je
sample, the correlation peak appears during the structural evolution at 80°C and
become gradually more evident during the curing cycle. The comparison
between the two hybrid having different behaviour demonstrated that the
appearance of this correlation peak may be ascribed to the high siloxane content
in the Ep-Si22-Je hybrid, which allows the formation of a higher number of
particular kind of inorganic arrangement during the structural evolution of the
organic/inorganic growth. As known the presence of such a peak speaks in
250
favour of some ordered organic-inorganic structures formed during the curing
cycle [15]. Therefore, the results can be interpreted as follows: as Matejka et al
[47] also suggested, hydrolysis and condensation of GOTMS molecules leads to
a spontaneous self-organization to form cage-like inorganic structures, whose
dimensions are determined by Rg value. Furthermore, since the dimension of
these cages does not change, the number of cage-like inorganic structures
increases with the siloxane content. Hence, at highest inorganic content, namely
18 and 22wt%, the distance between two neighbouring cages become little
enough to be seen by using SAXS experiments, and consequently the correlation
peak appears. Additionally, the distance between two neighbouring cages has
been found to be about 2.7nm in both the Ep-Si18-Je and Ep-Si22-Je hybrids.
Furthermore, since GOTMS molecules have been used as trifunctional siloxane,
each edge of the cage-like structure has a γ-(glycidoxy)propyl organic pendant,
which is able to further react with the amine hardener. Therefore, 2.7nm could be
thought as the distance between the heterogeneity domains cages separated by
pendant organic substituent γ-(glycidoxy)propyl group bonded by amine
Jeffamine D230. Since the NMR results pointed out that the GOTMS
preferentially form condensed cage-like structures, because of the high content
of condensed T3 units, hence the siloxane moieties of GOTMS react before the
epoxy ring functionality, allowing the building up of cages which can tie later to
give an interconnected organic-inorganic tridimensional network. A theoretical
estimation of the length between two neighbouring cages bonded with Jeffamine
D230 has been done by using molecular dynamics (MD) simulations. As known,
the hardener Jeffamine owns two –NH2 groups, on the opposite site of molecule,
hence it is able to bond the epoxy ring by using either the same (head-head
attach) or the opposite (head-tail attach) –NH2 group. Moreover, average size
251
oxypropylene monomer unit is introduced (x=2 and x=3) for Jeffamine D230
[46]. Therefore, two different atomistic models are built chemically linking two
alkyl POSS cages and using one Jeffamine D230 molecule; in the first scenario,
the cages react with two opposite –NH2 groups, namely head-tail attach, in the
second with the same –NH2 group, i.e. head-head attach. Furthermore, with the
aim of creating more realistic models, each glycidoxy group is considered
reacted with a Jeffamine D230 molecule and, in turn, with a DGEBA chain
(green structures in Figure 83). These model systems are simulated at 80°C,
when the correlation peak appears. From molecular dynamics (MD) calculation,
it has been found that the average distance between two neighboring cages is
equal to 3.1nm, if x=3 and 2.8 nm if x=2, when two cages are connected using
head-tail –NH2 groups; consequently, we can assume an average value of 2.9
nm; whereas the average distance between two neighboring cages is equal to
1.8nm, when two cages are bound through the same –NH2 group, i.e. head-head
attach. In Figure 83, snapshots extracted from Molecular Dynamics calculation
of the POSS-epoxy resin systems, when x=3 have been shown. In particular, on
the left two cages have been bonded by a head-tail attach, whereas on the left a
head-head attach has been considered.
Hence the theoretical estimation of distance between two neighbouring POSS
cages bonded by head-tail attach to the same Jeffamine D230 molecule is in
agreement with the experimental result of 2.7nm by SAXS measurements.
Therefore, as the siloxane amount increases the number of cages become high
enough to make them bonded with the amine hardener. Thus the distance
between two neighbouring cages will be determined only by the length of the
amine hardener which links them.

252
Figure 83 - Snapshots extracted from MD calculation of the POSS-epoxy resin systems,
when x=3. (Top) Complete atomistic simulation box; (bottom) zoomed view; (left) different ammines; (right) same ammine. Color legend: cages are represented in stick and ball style;
oxygen, red; silicon, orange; glycidoxy groups, purple; Jeffamine D230, blue; DGEBA, green.
Moreover, the results point out that the bonding between two neighbouring cages
takes place after the complete formation of POSS inorganic structures, since the
correlation peak appears only during the curing cycle whereas the Guinier knee
is present also at the beginning of the epoxide cross-linking reaction. Therefore,
as also Brus et al. [46] observed, no cleavage of oxirane rings occurs before
thermal curing, and thus the whole process results to be well controlled.
In conclusion, the morphology study of Ep-Siy-Je hybrids revealed that highly
condensed isolated polycyclic cage-like clusters are formed during the sol-gel
reaction before their aggregation. The process parameters, i.e. DBTDL catalyst
and the particular curing cycle associated to the Jeffamine D230 amine hardener,

253
promote cyclization of siloxanes and thus formation of highly condensed and
rigid cage-like clusters. Subsequently, during thermal curing these star-like
epoxy-functionalized building blocks react with Jeffamine D230, providing
inorganic structures with high degree of regularity and self-ordering throughout
the epoxide network.
The strong tendency of GOTMS molecules to arrange in POSS ordered cake-like
clusters has been widely studied [46-47]. According to Matejka et al [47] the
structural evolution of organo-trialkoxysilanes to build up POSS is controlled by
the competition between intermolecular polycondensation and cyclization. They
found that the tendency of organo-trialkoxysilanes to build up the polyhedral
cyclic oligomers, mainly octamer cages and larger cage-like structures increases
with the size of substituent R. As a result, long substituents prevent gelation of
the trifunctional system and increase stability of POSS. Because of the
incompatibility of the polyhedral POSS framework and pendant organic chains,
microphase separation takes place and spontaneous self-organization occurs.
Therefore, a micellar arrangement of compact POSS domains with correlation
distance corresponding to the size of the substituent is formed, and the ordering
is promoted by increasing length of the organic chain. Later, Brus et al. [46]
found that the oxypropylene chains of hardener amine form phase which
separates organic tails of siloxane cage-like clusters, uniformly dispersed in the
polymeric matrix; the average distance between clusters being 1.8nm.
6.6.4.2 Flame resistance properties (Pyrolysis/SEM, TGA air and nitrogen
flow)
The TGA curves performed in nitrogen flow (Figure 84) show that the thermal
stability of the hybrids materials is improved compared to the neat epoxy resin at

254
temperature higher than 400°C, as far the char residual increases with the silica
content. As observed in other polymer-silica nanocomposites [8, 24-26, 48-49]
the higher the silica content in the epoxy-silica hybrids the higher the thermal
stability, therefore the thermal stability of hybrids is enhanced proportional to the
inorganic content. The protecting behaviour of siloxane domains can be observed
in the air flow TGA curves at temperatures higher then 650°C (Figure 85). Here,
it is evident that the higher the siloxane content the higher the thermo-oxidative
stability of hybrids, since the TGA curves shift to higher temperatures (Figure
85).
In details, the thermo-oxidative curves of Ep-Siy-Je hybrids (Figure 85) show the
typical three stage weight-loss behaviour, observed also for the Ep-Siy-Mx
samples. It is worth noting that again the thermal decomposition onset
temperature in the first decomposition process of the hybrids samples is slightly
higher than that of neat epoxy, highlighting the improved thermal stability of
hybrids. However, the maximum temperature of the second decomposition
process changes a lot with the amount of siloxane and retains with the increasing
amount of inorganic content, as previously observed for the Ep-Siy-Mx hybrids.
The second process of weight loss could be due to the thermal oxidative
degradation of the formed residuals which is inside the silica-rich domain. Thus,
the thermal protection of the organic network occurs again with the formation of
silica rich domains within the epoxide matrix, and the further degradation of
epoxy network are prevented. These results demonstrate that the introduction of
siloxane from GOTMS and TEOS into the epoxide network can definitively
improve the thermal stability of the resulting hybrids, regardless the amine
hardener used. Therefore, as Weng et al. [28] point out this enhanced behaviour

255
has to be ascribed to the coupling agent GOTMS, which could provide covalent
bonding between the two phases and then improving the thermal resistance.
Figure 84 - Thermo-gravimetric Analyses in nitrogen flow of both the neat epoxy resin Ep-
Je and hybrids samples Ep-Sit-Je.
Figure 85 - Thermo-gravimetric Analyses in air flow of both the neat epoxy resin Ep-Je and
hybrids samples Ep-Siy-Je.
In the air flow TGA curves (Figure 85) it is worth noting that at about 400°C an
abruptly drop in the weight losses can be detected in the thermo-oxidative

256
degradation of hybrid with highest siloxane content, namely 18 and 22wt%. To
the aim to explain this thermo-oxidative behaviour, a correlation between the
shape of siloxane structures and the degradation of organic components must be
done. In fact, at highest silica content, a cage-like structures of inorganic
moieties bonded by means of GOTMS cross-linked epoxy groups, could be
supposed. When the temperature increases the supposed cages condense in the
outer sides of samples, protecting the inner organic components. At about 400°C,
the cross-linkers between two cages could partially decompose, allowing the
organic moieties to be directly exposed to oxidative environment and then
abruptly degraded. Additionally, as expected, the thermo-oxidative residual
increases with the siloxane content. To the aim to investigate the continuity of
the siloxane structure, several hybrid samples in films shape were undergone to a
step by step degradation in an oven at two fixed temperature (i.e. 300 and 400°C,
respectively) in order to remove the organic moieties without destroy the
inorganic network. In fact a continuous inorganic network provides a continuous
film after the organic degradation. Therefore, the samples were left in the oven at
a fixed temperature up to a constant weight value was reached. As shown in
Figure 87, the samples were heated for 43h at 300°C, after that the weight losses
were constant, then the temperature was arisen to 400°C and then left for 48h. At
this point all the organic moieties was burned, as the thermo-gravimetric
analyses in air flow pointed out (data not shown). The final weight value reached
after the pyrolysis has been compared to that of the expected, i.e. the thermo-
oxidative residual at 750°C obtained in air flow at a heating rate of 10°C/min,
pictured with the corresponding colour straight line in Figure 87. The differences
in siloxane contents obtained by heating in static (pyrolysis) or dynamic (TGA)
conditions, could be tentatively ascribed to the different way to burn the sample.

257
Figure 86 - A) photograph picture; B) optical microscope image and C) SEM image of
burned hybrid sample after the pyrolysis cycle.
Figure 87 - Weight losses of several hybrid samples during the pyrolysis experiment. The straight line of the corresponding colour is related to the expected silica content values.
Finally, it is worth noting that after slow pyrolysis of the organic component, the
inorganic residual appears as a film rather than a powder, highlighting the
presence of a continuous and compact inorganic network (Figure 86). Since the
micrograph SEM images of burned hybrid sample (Figure 86 b) and c)) shows

258
the formation of a foam structure, a co-continuous structure between the organic
and inorganic moieties has to be supposed.
6.6.4.3 Mechanical properties (DMA, fracture toughness/SEM)
6.6.4.3.1 Dynamic Mechanical Analysis (DMA)
As known, valuable information on morphology and mainly on interface of the
hybrid systems can be obtained from DMA analyses [8]. Figure 88 shows tensile
Storage Modulus E’(T) and loss factor tanδ (=E’’/E’) as function of temperature
for studied Ep-Siy-Je hybrids, containing silica ranging from 7 to 22wt%. A
significant reinforcement of hybrid samples with respect to the neat epoxy resin
is evident, since the storage modulus E’ increases with the hybridization of
epoxide network, in both the glassy and rubbery regions. In particular, in the
latter region the higher the siloxane content the higher the storage modulus
probably because of an increased cross-linkers number due to the siloxane
network formation. Moreover, it is well known [50] that the decrease in the
modulus during the glass transition region is due to the micro-Brownian motion
of the network chains. Therefore, the observed increased value of storage
modulus in the rubbery regions points out that the micro-Brownian motion of the
epoxy network is strongly restricted by the hybridization with siloxanes
precursors [50]. The increasing in the storage modulus is accompanied by
changes in the loss factor tanδ (Figure 88). In fact, the tanδ peak, which
corresponds to the epoxy glass transition, decreases and broadens in the hybrid
samples. This behaviour is typical of most nanocomposite systems and it is
pointed out for the Ep-Siy-Mx hybrids too. Moreover, the decrease of the
maximum height is proportional to the siloxane content, since it decreases as the
siloxane amount increases. This behaviour could be explained taking into

259
account the presence of strong interactions between organic and inorganic
components, which causes a loss in mobility of the macromolecules, according
to what found by Landry et al. [51]. Furthermore, since all the tan δ peak do not
show two separate transition region, the silica distribution into the samples can
be supposed homogeneous [8]. Matejka et al. [8] stated that the absence of the
high temperature new peak in the loss factor can give a proof of the absence of
the immobilized interphase layer of epoxide network with the siloxane
structures. But in our case, as the morphological study demonstrated, the
siloxane cage-like clusters are homogenously dispersed within the epoxide
matrix, hence neither separation phase nor discernable inorganic particles can be
detected. Therefore, probably due to the high content of coupling agent GOTMS
and then the particular siloxane structure formed within the epoxy matrix, the
organic and inorganic moieties are intimately and covalently bonded. To this
particular morphology and to the homogeneity of inorganic clusters distribution
could be reasonably ascribed the narrow temperature range of the glass
transition.
Additionally, the tan δ curves in Figure 88 highlight the important results that in
the hybrid samples with highest siloxane content, i.e. Ep-Si18-Je and Ep-Si22-Je,
the Tg increases if compared to the neat epoxy, since the tan δ peak shifts to
higher temperatures.
In conclusion, as Ochi et al. found, [50] the dynamic-mechanical results show
that the molecular motion of the epoxy network is effectively constrained by the
presence of siloxanes structures dispersed and intimately and covalently bonded
to the organic moieties. Moreover, at highest siloxane content, namely 18 and
22wt%, a neat increase on the glass transition temperature can be observed.

260
Figure 88 - Dynamic mechanical properties of Ep-Siy-Je hybrid samples, in terms of elastic
moduli and tanδ as a function of temperatures.
Sample Tg (°C) Loss Factor E’ at 150°C
(MPa)
SiO2 (wt%)
Ep-Je 95.6 1.23 12.5 0
Ep-Si7-Je 95.5 0.64 31.4 6.6
Ep-Si12-Je 95.5 0.44 61.3 12.3
Ep-Si18-Je 112.6 0.26 160.0 17.8
Ep-Si22-Je 111.0 0.17 255.4 21.5
Table 18 - DMA extrapolated properties of Ep-Siy-Je samples.
6.6.4.3.2 Mechanical test
From the load-displacement curves the critical stress intensity factor (Kc) is
evaluated as aYKc σ= a, where a is the indentation depth, σ the flexural stress
and Y a parameter which accounts for the sample geometry [52]. The values of
Kc and Gc so determined are reported in Figure 89 as a function of the siloxane
content. These plots show that both Kc and Gc decrease significantly with the

261
addition of the siloxane structures. In other words the toughness reduces as the
inorganic cluster content increases, according to Ragosta et al finding’s [53]
about mechanical performances of OctaGlycidyldimethylsilyl-POSS in DGEBA.
To further investigate the fracture behavior, the surface of fractured samples are
examined by Scanning Electronic Microscopy (SEM). The Figure 90 shows the
SEM micrographs taken near the crack tip of fractured surfaces for the neat
epoxy system Ep-Je and the hybrid Ep-Si12-Je sample. No silica particles are
discernible on the fractured surfaces of the specimens, even at very high
magnification, confirming the absence of inorganic aggregates particles. The
micrographs show two distinct regions of crack growth: a slow propagating
crack area ahead the crack tip, and a fast fracture region (from right to left). The
slow crack region is usually taken as a measure of the facture toughness because
it represents the resistance of the material against crack propagation [52]. In
Figure 90 the crack area is indicated with a red straight-line. It is worth noting
that for the hybrid Ep-Si12-Je sample this region is markedly smaller with
respect to the neat epoxy resin Ep-Je. This reduction in the propagating crack
area ahead the crack tip is contrary to what previously observed [52]. Ragosta et
al. [52], in fact, found that in epoxy-silica nanocomposites, the crack region
increases with the silica content.

262
Figure 89 - Critical stress intensity factor, Kc, and critical strain energy release rate, Gc, as
a function of the silica content.
Figure 90 - SEM pictures of fractured surface: a) pure epoxy resin Ep-Je; b) hybrid Ep-12-Je.
6.6.5 Conclusions
We demonstrated that a suitable choice of functionalized siloxane monomers and
reaction conditions leads to the formation of nano-heterogeneous networks with

263
well-organized cage-like structures, up to nearly homogeneous bicontinuous
systems. In fact, the experimental results showed that under reaction conditions
defined by the Ep-Siy-Je approach, GOTMS molecules are able to spontaneously
arrange to form structures similar to polyhedral oligomeric silsesquioxane POSS
units with well established architecture. Therefore, as the siloxane amount
increases the number of cages become high enough to make them bonded with
the amine hardener. Thus the distance between two neighbouring cages will be
determined only by the length of the amine hardener which links them. This
ordered arrangement highlights as distance correlation peak in the SAXS patterns
profile of hybrids samples at high siloxane content becoming responsible of the
improved thermal and mechanical properties. In particular, the co-continuous
organic-inorganic structure is demonstrated with the achievement of films
instead of powders in the pyrolysis experiments. It also affects the viscous-elastic
behaviour causing both the Tg and the elastic modulus to increase. Moreover the
symmetric shape of the loss factor peak speaks in favour of siloxane structure
homogenously dispersed throughout the organic matrix. Whereas the increase of
the Tg’s value highlights the strong evidence of hindrance the polymeric chains
movements during the glass transition. Hence, only the high siloxane content
assures the clusters to be bonded highlighting the improved mechanical
properties.
To the best of our knowledge it is the first time such cage-like clusters bonded by
Jeffamine D230 molecules could be detected assuring the Tg to increase without
any phase separation.
264
6.7 Ep-Siy-Mx and Ep-Siy-Je hybrids: effect of amine
hardener on the hybrid structure.
The comparison between the Ep-Siy-Mx and Ep-Siy-Je hybrids allowed to state
that:
1) The MXDA causes the high GOTMS content to not condensed, since high
amount of T0 units are present in the Ep-Si20-Mx hybrid. On the contrary the
Jeffamine D230 assures the GOTMS to condensate at whatever siloxane
contents.
2) Since the GOTMS molecules are not condensed at high siloxane content, the
SAXS profiles appears as Guinier dilute system regardless the siloxane content.
Moreover, the cluster dimensions change with the siloxane content. On the other
hand, in the Ep-Siy-Je samples the Rg does not change with the siloxane content,
but the number of defined size clusters increases as the siloxane content, up to
the appearance of a correlation peak at highest siloxane content.
3) The Jeffamine D230 is able to bond two neighbouring siloxane cages, then
building up a co-continuous organic-inorganic structure.
4) The presence of high T0 units in the Ep-Siy-Mx samples is really detrimental
causing a dramatic reduction of Tg value in the Ep-Si20-Mx hybrid. On the
contrary, in the Ep-Si22-Je sample the Tg is markedly increased with respect to
the neat epoxy due to its particular organic-inorganic morphology.
5) MXDA is an organic cross-linker faster than the Jeffamine D230, therefore in
the MXDA-based hybrids the organic grows more rapidly than the inorganic

265
network, leaving out the GOTMS siloxanes monomers. A proof is the high
content of T0 units in MXDA-based hybrids.

266
6.8 References
[1] M. Ochi; R. Takahashi; Journal of Polymer Science: Part B: Polymer
Physics, 39, 2001, 1071.
[2] D. P. Fasce; R. J. J. Williams; F. Mechin; J. P. Pascault; M. F. Liauro;
R. Petiaud; Macromolecules, 32, 1999, 4757.
[3] I. E. dell Erba; D. P. Fasce; R. J. J. Williams; R. Erra-Balsells; Y.
Fukuyama; H. Nonami; Journal of Organometal Chemistry , 686, 2003,
42.
[4] L. Rozes; G. Fornasieri; S. Trabelsi; C. Creton; N. E. Zafeiropoulos;
M. Stamm; C. Sanchez; Progress in Solid State Chemistry , 33, 2005,
127-135.
[5] K. Zou; M. D. Soucek; Macromol. Chem. Phys , 205, 2004, 2032–
2039.
[6] L. Matejka; K. Dusek; J. Plestil; J. Kriz; F. Lednicky; Polymer 40,
1999, 171.
[7] L. Matejka; J. Plestil; K. Dusek; Journal of Non-Crystalline Solids
226, 1998, 114.
[8] L. Matejka; O. Dukh; J. Kolarik; Polymer, 41, 2000, 1449.
[9] P. Yang; G. Wang; X. Xia; Y. Takezawa; H. Wang; S. Yamada;
Polymer Engineering and Science, 2008, 1214-1221.
[10] B. J. Bauer; D. W. Liu; C. L. Jackson; J. D. Barnes; Polymer
Advanced Technology, 7, 1996, 333.
[11] L. Matejka; O. Dukh; J. Brus; W. J. S. Simonsick; B. Meissner;
Journal of Non-Crystalline Solids, 270, 2000, 34-47.

267
[12] L. Prezzi; L. Mascia; Advances in Polymer Technology , 24, (2)
2005, 91-102.
[13] L. A. S. A. Prado; M. Cascione; M. H. G. Wichmann; F. H. Gojny;
B. Fiedler; K. Schulte; G. Goerigk; Hasylab Annual Report, 2005, 945.
[14] K. Dahmouche; C. V. Santilli; S. H. Pulcinelli; A. F. Craievich;
Journal of Physical Chemistry B, 11, 2001, 3249.
[15] M. Spirkova; J. Brus; D. Hlavata; H. Kamisova; L. Matejka; Journal
of Applied Polymer Science, 92, 2004, 937-950.
[16] S. R. Davis; A. R. Brough; A. Atkinson; Journal of Non-Crystalline
Solids, 315, 2003, 197-205.
[17] A. Guinier; G. Fournet; Small Angle Scattering of X-rays , John
Wiley & Sons, New York 1955, p 268.
[18] O. Glatter; O. Kratky; Small Angle Scattering of X-rays , Academic
Press, New York 1982.
[19] S. Zaioncz; K. Dahmouche; B. G. Soares; Macromolecular
Materials and Engineering, 295, 2010, 243-255.
[20] G. Beaucage; Journal of Applied Crystallography , 29, 1996, 134-
146.
[21] M. Xiong; S. Zhou; L. Wu; B. Wang; L. Yang; Polymer, 45, 2004,
8127-8138.
[22] S. Yano; K. Iwata; K. Kurita; Mater. Sci. Eng., C 6, 1998, 75.
[23] Y. Iami; H. Itoh; K. Naka; Y. Chujo; Macromolecules, 33, 2000,
4343.
[24] A. Lee; J. D. Lichtenhan; Journal of Applied Polymer Science , 73,
1999, 1993.

268
[25] Z. Wang; T. Lan; T. Pinnavaia; Journal of Chemistry Materials , 8,
1996, 2200.
[26] J. B. Bauer; D. W. Liu; C. L. Jackson; J. D. Barnes;. Polymer of
Advanced Technology, 7, 1995, 1996.
[27] G. G. Hsiue; Y. L. Liu; H. H. Liao; Journal of Polymer Science:
Part A: Polymer Chemistry, 39, 2001, 986-996.
[28] W. H. Weng; C. C. Chang; H. Chen; Composite Interface, 11, n°8-9,
2005, 631-641.
[29] J. Habsuda; G. P. Simon; Y. B. Cheng; D. G. Hewitt; D. R. Diggins;
H. Toh; F. Cser; Polymer, 43, 2002, 4627-4638.
[30] L. E. Nielsen; R. F. Landel; Mechanical properties of polymers and
composites, New York: Marcel Dekker, 1994.
[31] Polymer, 45, 2004, 2967-2976.
[32] X. Zhang; L. Hu; D. Sun; Acta Materialia, 54, 2006, 5469-5476.
[33] A. Morikawa; Y. Iyoku; M. Kamimoto; Y. Imrai; Polymer Journal,
24, 1992, 107.
[34] W. Zhou; J. H. Dong; K. Y. Qiu; Y. Wei; Journal of Polym er
Science: Part A: Polymer Chemistry, 36, 1998, 1607.
[35] Y. G. Hsu; J. H. Huang; Journal of Non-Crystalline Solids , 208,
1996, 259-266.
[36] R. J. Hook; Journal of Non-Crystalline Solids, 195, 1996, 1-15.
[37] C. A. Fyfe; P. P. J. Aroca; Phys. Chem. B, 101, 1997, 9504-9509.
[38] J. C. Pouxviel; J. P. Boilot; J. C. Beloeil; Lallemand; J. Non-
Crystalline Solids, 89, 1987, 345.

269
[39] L. Malier; F. Devreux; F. Chaput; J. P. Boilot; Chemical Processing
of Advanced Materials, ed. L. L. Hench and J.K.West (Wiley, New York,
1992), Chapter 6.
[40] B. Alonso; D. Massiot; M. Valentini; T. Kidchob; P. Innocenzi;
Journal of Non-Crystalline Solids, 354, 2008, 1615-1626.
[41] R. Mezzenga; L. Boogh; J. E. Månson; B. Pettersson;
Macromolecules, 33, 2000, 4373-4379.
[42] N. Altmann; P. Halley; J. Cooper; Macromolecular Simposia, 169,
2001, 171-177.
[43] B. Ellis; Chemistry and technology of epoxy resins , Blackie
Academic and Professional, London: Chapman and Hall, 1993, 328p.
[44] E. Bugnicourt; J. Galy; J. F. Gerard; H. Barthel; Polymer 48, 2007,
1596-1605.
[45] J. Mijovic; J. Wijaya; Macromolecules, 27, 1994, 7589-7600.
[46] J. Brus; M. Spirkova; D. Hlavata; A. Strachota; Macromolecules, 37,
2004, 1346-1357.
[47] L. Matejka; O. Dukh; D. Hlavata; B. Meissner; J. Brus;
Macromolecules, 34, 2001, 6904-6914.
[48] Y. Iami; H. Itoh; K. Naka; Y. Chujo; Macromolecules, 33, 2000,
4343.
[49] G. H. Hsiue; J. K. Chen; Y. L. Liu; J. Appl. Polym. Sci. , 76, 2000,
1609.
[50] M. Ochi; R. Takahashi; A. Terauchi; Polymer, 42, 2001, 5151-5158.
[51] C. J. T. Landry; B. K. Coltrain; J. A. Wesson; N. Zambulyadis;
Polymer, 33, 1992, 1486-1495.

270
[52] G. Ragostra; M. Abbate; P. Musto; G. Scarinzi; L. Mascia; Polymer,
46, 2005, 10506-10516.
[53] G. Ragosta; P. Musto; M. Abbate; G. Scarinzi; Polymer, 50, 2009,
5518-5532.

271
Chapter 7: Conclusions and perspectives
The following conclusions can be drawn from the analyses of the experimental
data.
7.1 Epoxy/MMT Composites
7.1.1 Silylation reaction of Na-MMT.
The silylation reaction allows the aminosilanes molecules to be bonded
on the Na-MMT surface, as proved by the presence of the organic
moieties in the FT-IR spectra of silylated MMT.
Regardless the aminosilanes and the process parameters, the silylation
reaction causes the basal spacing between silicates layers to increase with
respect to the pristine Na-MMT.
The higher temperature and aminosilane concentration values lead to an
increased amount of both chemically bonded silanes with respect to the
intercalated species and aminosilanes interacting with the outside
platelets.
The process parameters affects not only the relative amount of
aminosilanes interacting with the inside or outside platelets, but also the
correlation between the aminosilane chain length and the basal spacing of
MMT.

272
7.1.2 Silylated-MMT epoxy-based nanocomposites
The sonication mixing procedure allows the interlayer spacing to increase
(for the A1100-MMT clay) whereas the ball-milling dispersion method
compacts the layered structure of the clays.
The cross-linking reaction which probably takes place during the
dispersion of modified MMT in the resin, prevents the intercalation of
epoxy monomers in the silicate galleries. Thus retention of layer-layer
correlations leads to micron scale reinforcing particles, not nano scale of
individual layers.
Silylated MMTs provide composites with improved mechanical
properties with respect the pristine Na-MMT in terms of increased Tg
and elastic modulus in the rubbery region. This improvements is more
evident in the sonicated composites since the combination of sonication
and ball milling makes compact the interlayer spacing and partially
destroys the original layers structures.
The Epoxy/MMT composites prepared with 1 and 3wt% of modified and
unmodified clays exhibit improved tensile strength and elastic modulus
compared to the pristine epoxy matrix. The strain at break decreases for
all the samples containing 3wt% of clay whereas it slightly increases for
composites at 1wt% in comparison to the epoxy resin. The elastic tensile
modulus of the Epoxy/MMT composites increases with the clay content
in either processing procedures (i.e. S or SB method). Moreover, in the
composites at 1wt% it increases with increasing the chain length of
aminosilanes.

273
The hardness of composites increases with respect to the neat epoxy
resin, and in the silylated MMT composites it increases with the
aminosilanes length.
The silylated clay composites highlight an increased fire resistance
compared to the pristine epoxy resin as well as to the Na-MMT
composite.
7.2 Epoxy/silica Hybrids MXDA based (Ep-Siy-Mx
hybrids)
The siloxane amount affects the GOTMS condensation reactions since
the T0 species are detected in the Ep-Si20-Mx hybrid spectrum; in fact,
the Si-O-Si condensed siloxane structures decreases as the siloxane
amount increases.
Regardless the siloxane amount, the morphology of hybrids can be
ascribed to a dilute system of siloxane clusters embedded in the epoxide
matrix.
The Ep-Siy-Mx samples show poor mechanical properties because their
Tg’s reduced with respect to that of the neat epoxy system. Moreover, the
hardness of hybrids decreases with the siloxane content. Additionally, as
the siloxane content increases the loss factor tanδ shape changes,
becoming weaker and broader, whereas the elastic modulus in the
rubbery region increases.

274
7.3 Epoxy/silica Hybrids Jeffamine D230 based (Ep-
Siy-Je hybrids)
The inorganic structure, in terms of Ti and Qi does not change with the
siloxane content, but, on the contrary all hybrids possess only T3, Q3 and
Q4 units.
GOTMS molecules are able to spontaneously arrange to form structures
similar to polyhedral oligomeric silsesquioxane POSS units with well
established architecture. As the siloxane amount increases the number of
cages become high enough to make them bonded with the amine
hardener.
A correlation between an ordered arrangement of cage-like clusters and
improved mechanical properties was found; the bonding between cage-
like siloxane clusters causes improved mechanical properties, in terms of
higher elastic modulus and glass transition temperature with respect to
the neat epoxy resin. Moreover, the symmetric shape of the loss factor
peak speaks in favour of siloxane structure homogenously dispersed
throughout the organic matrix.
The organic-inorganic structure is co-continuous, as demonstrated by the
achievement of films instead of powders in the pyrolysis experiments.
7.4 Comparison between Epoxy/silica Hybrids
prepared with Jeffamine D230 and MXDA
The effect of the amine hardeners MXDA and Jeffamine was studied
highlighting the following:

275
MXDA is an organic cross-linker faster than the Jeffamine D230,
therefore in the MXDA-based hybrids the organic grows more rapidly
than the inorganic network, leaving out the GOTMS siloxanes
monomers, as the high content of T0 units in MXDA-based hybrids
proved.
The presence of T0 units is detrimental in the cured hybrids samples,
since it causes a dramatic reduction in Tg values. On the contrary, in the
Jeffamine-based samples the Tg is markedly increased with respect to the
neat epoxy due to their particular organic-inorganic morphology.
The Jeffamine is able to bond two neighbouring siloxane cages, then
building up a co-continuous organic-inorganic structure, as the siloxane
amount increases.
This research opens wide the doors to further studies on the correlation between
the cage-like siloxane structures and the macroscopic properties of hybrids
samples, enabling to tailor the siloxane inorganic morphology and then obtain
nano-heterogeneous systems with desired and tunable properties.

276
Curriculum Vitae
Filomena Piscitelli was born in Caserta, Italy, on the 9th December 1976.
She received her master degree in Industrial Chemistry in 2004 with 110/110.
Since 2004 she has been collaborating with Italian National Council, at Institute
for Composite and Biomedical Materials (IMCB) working on epoxy based
hybrids and composites.
Her main research interest field is the sol-gel process and SAXS characterization.
Selected publications
F. Piscitelli, G. Barra, L. Mascia, G. Mensitieri, M. Lavorgna, “Hybrid-
nanocomposite materials: Effects of Nature of Epoxy resins and Siloxane
Component”, Special Topics on materials Science and Technology-The Italian
Panorama, BRILL Leiden Boston 2009, ISBN 9789004172241, 329-338, 2009.
M.Lavorgna, L.Fusco, F.Piscitelli, G.Mensitieri, P.Agoretti, A.Borriello,
L.Mascia “Control of morphology of sulfonated syndio-polystyrene membranes
through constraints imposed by siloxane networks”, Polymer Engineering and
Science, 48(12), 2008, p 2389-2399.
G. Faiella, F. Piscitelli, M. Lavorgna, V. Antonucci, M. Giordano, “Tuning the
insulator to conductor transition in a multi walled carbon nanotubes/epoxy
matrix composite at sub statistical percolation threshold”, Applied Physics
Letters, 95, 153106, 2009.

277
M.Lavorgna, F.Piscitelli, P.Mangiacapra, G.G. Buonocore “Study of the
combined effect of both clay and 1 glycerol plasticizer on the properties of
chitosan films” Carbohydrate Polymers .82(2), 291-298 2010
F.Piscitelli, P.Posocco, R.Toth, M.Fermeglia, S.Pricl, G.Mensitieri, M.Lavorgna
“Sodium Montmorillonite silylation: unexpected effect of the aminosilane chain
length”, Journal of Colloid and Interface Science, 351, 108-115, 2010.
Barra G., Lavorgna M., Mensitieri G., Piscitelli F. “Polimeri rinforzati con fibre,
composizioni polimeriche a base epossidica e loro impiego” patent
Mi2009a001980, 12/11/2009
Y. H. Zhan, R. Patel, M. Lavorgna, F. Piscitelli, A. Khan, H. S. Xia, H.
Benkreira and P. Coates, “Processing of polyurethane/carbon nanotubes
composites using novel minimixer“ Plastics Rubber and Composites, vol 39, n°
9, 400-410, 2010

Author's personal copy
Sodium montmorillonite silylation: Unexpected effect of the aminosilanechain length
Filomena Piscitelli a,b,*, Paola Posocco c, Radovan Toth c, Maurizio Fermeglia c, Sabrina Pricl c,Giuseppe Mensitieri a, Marino Lavorgna b,d
a Department of Materials Engineering and Production, University of Naples Federico II, Piazzale Tecchio 80, 80125 Naples, Italyb National Research Council, Institute for Composite and Biomedical Materials, Piazzale E. Fermi, 1, 80155 Portici, Naples, Italyc Molecular Simulation (MOSE) Engineering Laboratory, DMRN, University of Trieste, Piazzale Europa 1, 34127 Trieste, Italyd IMAST Technological District on Polymeric and Composite Materials Engineering and Structures, Piazzale E. Fermi 1, 80155 Portici, Naples, Italy
a r t i c l e i n f o
Article history:Received 25 May 2010Accepted 24 July 2010Available online 1 August 2010
Keywords:OrganosilaneNa-MMT silylationMolecular dynamics simulations
a b s t r a c t
In this work, the silylation of sodium montmorillonite (Na-MMT) was performed in glycerol using 3-ami-nopropyltriethoxysilane, N-(2-aminoethyl)-3-aminopropyltrimethoxysilane and 3-[2-(2-aminoethylami-no)ethylamino]-propyl-trimethoxysilane. The effects on the d-spacing of sodium montmorillonite (Na-MMT) upon reaction with three aminosilanes of different chain length were studied in details by combin-ing experimental and computational techniques. Infrared spectroscopy was used to monitor the graftingprocess, while the degree of grafting was calculated using thermogravimetric analysis. X-ray diffractionexperiments were carried out to evaluate the shift of the (0 0 1) basal spacing. It was found that thedegree of silylation of Na-MMT increases with increasing the length of the aminosilane organic moieties,the overall aminosilane concentration, and temperature. The same beneficial effects were observed onthe silicate d-spacing, as its value increases with increasing silane concentration and reaction tempera-ture. Remarkably, however, increasing the length of the organic chains in the silane modifiers resultedin decreasing values of the Na-MMT interlayer distance. A rationale for this behavior is proposed onthe basis of atomistic molecular dynamics simulation evidences.
� 2010 Elsevier Inc. All rights reserved.
1. Introduction
Because of their unique structure, layered silicates are largelyemployed in the production of polymer nanocomposites withimproved physical properties with respect to the pristine poly-meric matrix [1–3]. Enhanced mechanical-, thermal- and gas-barrier properties can indeed be achieved by adding smallamounts of clay (<5% by weight) to a given polymer, and thisin fact opens new avenues in the design and synthesis of aplethora of new, high-performance materials for which an arrayof advance applications can easily be envisaged. Montmorillonite(MMT) is one of the layered silicates currently most widely em-ployed in the production of polymer–clay nanocomposites [1–3].The crystalline structure of MMT is based on a regular arrange-ment of silicon tetrahedra (SiO4�
4 ) and aluminum octahedra(AlðOHÞ3�6 ), the unit cell containing two tetrahedral and one octa-hedral layers. MMT layer has permanent negative charge on thesurface of its layers because of isomorphous substitutions of
Mg2+ for Al3+ or, rarely, Al3+ for Si4+ [3]. These negative chargesare counterbalanced by the presence of first-group cations suchas sodium or potassium, which locate in the proximity of the clayplatelets within the gallery space [1]. The presence of these netcharges then confers to the pristine structure of, i.e., sodiumMMT (Na-MMT) a highly polar nature, and this, in turn, rendersthis silicate quite incompatible with the vast majority of organicpolymers [2,3]. Accordingly, a simple dispersion of Na-MMT in apolymeric matrix will not produce a composite with improvedproperties compared to the neat macromolecule, because of thepoor interfacial interactions between the Na-MMT hydrophilicreaction sites and the highly hydrophobic polymeric chains. There-fore, chemical modification of internal and external Na-MMT plate-lets plays a crucial role in polymer/clay nanocomposite formation.Several efforts have been done in order to reduce the hydrophilic-ity of the Na-MMT internal platelets; in particular the cation ex-change reaction with a quaternary ammonium salt (see forexample the case of Cloisite 30B) represents the most commonlyused method to modify clay surface. This modification increasesthe interlayer spacing and creates a more favorable organophilicenvironment. However, the thermal instability of conventionalammonium ion-modified clay is a strong limitation for melt-com-pounding of polymer/organoclay composites. In fact, most of the
0021-9797/$ - see front matter � 2010 Elsevier Inc. All rights reserved.doi:10.1016/j.jcis.2010.07.059
* Corresponding author at: Department of Materials Engineering and Production,University of Naples Federico II, Piazzale Tecchio 80, 80125 Naples, Italy. Fax: +39(0) 81 775 88 50.
E-mail address: [email protected] (F. Piscitelli).
Journal of Colloid and Interface Science 351 (2010) 108–115
Contents lists available at ScienceDirect
Journal of Colloid and Interface Science
www.elsevier .com/locate / jc is

Author's personal copy
alkyl ammonium surfactants are known to undergo a degradationprocess at temperature at which the plastics are commonly pro-cessed [4]. For this reason, the silylation approach involving directgrafting reaction by using a coupling agent has recently attractedmuch attention, and represents a viable method to make compat-ible inorganic platelets and organic matrix [5–10]. The presence ofbroken bonds on the platelet edges are common for layered sili-cates, and leads to the formation of hydroxyl groups, which canbe utilized for chemical modification by silylation reaction. Byusing an organosilane, it is then possible to covalently bond the or-ganic functional groups onto the layer surface. Importantly, thefunctionalization of clay minerals with organosilanes can takeplace at three different sites: at the interlayer space, at the externalsurface and at the edges [11,12].
In terms of performances of silane-modified MMT nanocompos-ites, Zhao et al. [13] found that the use of chlorosilane-modifiedclay allowed the improvement of the mechanical behavior of poly-ethylene (PE)-based nanocomposites determining an increase ofboth glass transition temperature and elastic modulus in the glassyregion. In particular, after trimethylchlorosilane (TMSCl) modifica-tion, the OH groups at the edge of clay platelets were reacted andthe wetting ability between PE and organoclay was subsequentlyimproved. Moreover, the loss of hydroxyl groups resulted in a de-crease of cation exchange capacity (CEC), which caused a reductionin the strength of interaction between the platelets. Both theseeffects favorably concurred to improve the intercalation of PE intointerlayers.
So far the silylation reaction has been widely performed using(3-aminopropyl)trimethoxysilane (A1100), TMSCl and glycidyl-propyl-triethoxysilane (GPTS) [12] as coupling agents. Among sev-eral investigations, it is here mentioned the work of Wang et al.[14], which found that Na-MMT modified by a small amount ofA1100 as coupling agent is able to promote a high extent of exfo-liation for epoxy/clay nanocomposites. However, to the best of ourknowledge, the effects of other aminosilanes on the MMT final ba-sal spacing have not been evaluated yet.
Accordingly, in this paper the silylation reaction of Na-MMTwith three aminosilanes, each bearing three functional groupsbut characterized by different lengths of the alkyl chains, hasbeen studied. The functionalized clay has been characterized byFourier transform infrared spectroscopy (FT-IR), thermogravimet-ric analysis (TGA) and X-ray diffraction. In order to understandthe effect of reaction conditions (e.g., reaction temperature andaminosilane concentration), two different routes were followedin performing the Na-MMT silylation reaction by using theA1100 as a proof-of-concept. The results obtained in terms ofmodified Na-MMT d-spacing were correlated with the corre-sponding values predicted from atomistic molecular dynamicssimulations, and a molecular rationale for these experimental evi-dences has been formulated on the basis of the molecular model-ing results.
2. Experimental
2.1. Materials
Sodium montmorillonite (Na-MMT) with cationic exchange capac-ity (CEC) of 92 mequiv/100 g was purchased from Southern Clay Prod-ucts Inc., USA. Prior to its use, the Na-MMT was dried over night at90 �C in vacuum conditions. 3-aminopropyltriethoxysilane (A1100),N-(2-aminoethyl)-3-aminopropyltrimethoxysilane (A1120), and 3-[2-(2-aminoethylamino)ethylamino]-propyl-trimethoxysilane(A1130) were obtained from GE Advanced Materials. All trifunction-al silylating agents had a purity of 98%. Glycerol was purchased fromFluka. All chemicals were used as received.
2.2. Silylation reaction
To perform the silylation reaction of Na-MMT by aminosilanes,two different reaction conditions were used, in which both thereaction temperature and the amount of the aminosilane werevaried, respectively. These two experimental routes, referred to,in the following as Procedure 1 and Procedure 2, are summarizedin Table 1.
Dried Na-MMT (1 or 5 g) were added to 100 ml of glycerol, andthe resulting suspension was stirred at 60 �C for 30 min in nitrogenatmosphere. The same procedure was used to dissolve the amino-silane in glycerol. In this work glycerol was selected as the solvent,since, recently, Shanmugharaj et al. [11] verified that, using highsurface energy solvents, the interaction between aminosilanesand the edges of the clay platelets is reduced due to low wettingphenomena and, hence, the silane molecules can diffuse and reactmore efficiently in the mineral galleries.
The resulting Na-MMT dispersion and aminosilane solutionswere then mixed, and the grafting reactions were carried out at80 or 130 �C, under constant stirring for 3 h under nitrogen. Aftercooling, the reaction product was recovered by centrifugation at13,000 rpm, and stabilized at 100 �C for 5 h in vacuum condition.Excess glycerol was removed by washing each reaction productwith water under stirring at 60 �C for 1.5 h followed by centrifuga-tion. This washing procedure was repeated three times, and thequantitative elimination of the solvent was confirmed by thermo-gravimetric analysis. Each resultant product was dried at 80 �Cunder vacuum and then ground to a powder. Procedure 1 was per-formed on all three aminosilanes, whereas Procedure 2 was carriedout only in the case of A1100. In order to study the effect of the twosilylation conditions on the final products, the interlayer spacingsof the A1100-modified Na-MMTs obtained from the two proce-dures, were compared.
In order to determine the degradation temperatures of the sily-lated Na-MMT, two pastes with water and glycerol as dispersingagents were prepared to be tested by thermogravimetric analysis.In details, the Na-MMT/water paste (Na-MMT–H2O) was obtainedby dispersing Na-MMT powder in glycerol at 60 �C and then fol-lowing the same procedure illustrated previously for the silylationreaction but without the addition of the aminosilane. The pastewith glycerol (Na-MMT–Gly) was prepared by dispersing Na-MMT in glycerol at 60 �C. After centrifugation, the paste was keptin the oven for 22 h at 60 �C in vacuum condition.
2.3. Instrumental analyses
2.3.1. Fourier transform infrared analysisFourier transform infrared (FT-IR) spectra were performed by
using a Nicolet FT-IR Fourier transform infrared spectrometer onKBr pressed disks containing 1% w/w of inorganic samples. FT-IRspectra were collected over the range 400–4000 cm�1 with a reso-lution of 4 cm�1.
2.3.2. Thermogravimetric analysisThermogravimetric analysis (TGA) was carrying out on a TGA
2950 thermobalance (TA Instruments). Samples were heated from
Table 1Reaction conditions adopted during the silylation process.
Procedure Amount of Na-MMT in100 ml of glycerol (g)
Amount ofaminosilane in100 ml of glycerol (g)
Reactiontemperature(�C)
1 1 1 802 5 20 130
F. Piscitelli et al. / Journal of Colloid and Interface Science 351 (2010) 108–115 109

Author's personal copy
30 to 750 �C at a heating rate of 10 �C/min under nitrogen flow. Theamount of grafted and intercalated aminosilanes was calculatedusing the following relationship [6]:
Silane grafted amount ðmequiv=gÞ ¼ 103 �W200—600
½100� ðW200—600Þ� �Mð1Þ
where W200–600 corresponds to the mass loss between 200� and600 �C and M (g/mol) is the molecular weight of the grafted silanemolecules. The percentage of grafted amount, which correspondsto the percentage of organic aminosilane moieties with respectthe total inorganic mass, was calculated as follows:
Silane grafted amount ð%Þ ¼ 100�W200—600
100�W200—600ð2Þ
2.3.3. Wide angle X-ray diffraction analysisThe intergallery space between the clay platelets is defined as
the basal spacing, and is usually denoted as d001 since it is derivedfrom the (0 0 1) diffraction peak by using Bragg equation. Thedisplacement of the (0 0 1) diffraction peak upon silylation wasfollowed by WAXD measurements. To this end, an Anton Paar SAX-Sess diffractomer operating at 40 kV, 50 mA and equipped with aCu Ka radiation (k = 0.1542 nm) source and an image plate detec-tor was used. The spectra were collected in the transmission mode.The scattering data were dark current and background subtracted,and normalized for the primary beam intensity.
2.3.4. Molecular dynamics analysisAll molecular dynamics (MD) simulations were performed
using Materials Studio (v.4.4, Accelrys, San Diego, USA). The startingstructure of Na-MMT was taken from previous work [15–19]. Themain object of the computational part of this study was the predic-tion of the basal spacing in the aminosilane functionalized MMT.Since the quantities affecting the MMT basal spacing are highlysensitive to the non-bonded components of the force field (FF)
employed (e.g., atomic charges and van der Waals parameters),the ad hoc FF developed by Heinz and coworkers [20,21] wasadopted for the optimization of the initial MMT structure and inall subsequent calculations. As demonstrated by Heinz et al.[20,21] for Na-MMT and other phyllosilicates, this accurately de-rived FF is able to describe, among many other properties, the ther-modynamics of surface processes more reliably by reducingdeviations of 50–500% in surface and interface energies to less that10%, thus constituting a fundamental step towards a quantitativemodeling of interface processes involving layered silicates.
Accordingly, the resulting lattice of the optimized MMT modelwas monoclinic, with space group C2/m, and characterized by thefollowing lattice parameters: a = 5.20 Å, b = 9.20 Å, c = 10.13 Å, anda = 90�, b = 99�, c = 90�, in excellent agreement with the available lit-erature [21–24].
According to the computational recipe adopted, the molecularmodels of the aminosilane compounds considered (see Scheme1) were built and geometry-optimized following a well-validatedMD-based protocol [15–19,32].
The optimized MMT unit cell model was then modified by graft-ing the layers with a suitable number of aminosilane molecules[15]. For each aminosilane, three possible options were consideredfor creating covalent bonds between the silicon (Si) atoms of theaminosilane and the MMT surface oxygen (O) atoms, as illustratedin Scheme 2.
The new equilibrium position of the Na+ counterions on theaminosilane-modified MMT sheets were determined followingthe procedure suggested by Heinz et al. [21]. Accordingly, half ofthem were placed 1 nm away on one side, and the remaining half1 nm from the other side of the MMT layer in 10 different arrange-ments. Molecular mechanics energy minimizations were then per-formed to convergence, keeping all other MMT atoms fixed, andthe structure with the lowest energy was finally selected for fur-ther simulations. In this configuration, the Na+ ions were foundat about 1.8 Å from the center of the surface oxygen atoms, or
Scheme 1. Chemical structures of the considered aminosilanes and crystallographic unit cell of MMT. The atom color code is as follows: gray, C; light gray, Si; blue, N; red, O,white, H; purple, Na; green, Al; pink, Mg. (For interpretation of the references to color in this figure legend, the reader is referred to the web version of this article.)
110 F. Piscitelli et al. / Journal of Colloid and Interface Science 351 (2010) 108–115

Author's personal copy
about 4.8 Å from the central plane of the metal atoms, in excellentagreement with previous simulations [33] and experimental NMRdata [34].
Lastly, each aminosilane-MMT unit cell was replicated fourtimes in the a direction, and three times in the b direction, thusyielding a final simulation supercell for each aminosilane modifierwith the following lattice parameters: a = 20.80 Å, b = 27.60 Å, anda = 90�, b = 99�, c = 90�. The c values in the initial model of amino-silane-MMT supercells were prolonged according to a bi-layerarrangement of each aminosilane molecules.
Molecular mechanics (MM) and molecular dynamics (MD) sim-ulation protocols were then applied, consisting of a preliminarycell energy minimization procedure followed by isobaric-isother-mal (NPT) MD runs at 300 K. To avoid crystal structure deforma-tion during minimization, initially both MMT layers were treatedas rigid bodies by fixing all cell dimensions except the c axis, whilstall atoms in the interlayer space including the cations wereallowed to move without any constraint. Then, in a second minimi-zation round, also movement along the c axis was allowed, leadingto a suitable starting interlayer distance for each model. Subse-quently, 1 ns NPT MD experiments were performed at 300 K foreach system, using the Verlet algorithm and an integration stepof 1 fs. Again, both MMT layers were treated as rigid bodies by fix-ing all cell dimensions except the c axis, leaving all remainingatoms in the interlayer space free to move without any constraint.The Ewald summation method [35] was applied for treating bothvan der Waals and electrostatic interactions, while temperaturewas controlled using the Nosé thermostat [36].
The final basal spacing values for each aminosilane-MMT sys-tem were extracted from the final part (0.5 ns) of the equilibratedMD trajectory.
3. Results and discussion
3.1. Fourier transform infrared analysis
Infrared spectroscopy was performed in order to verify the sily-lation process and to identify the presence of the organic moietieson the Na-MMT platelets due to silylation. As pointed out by Zhaoet al. [13], the main evidence for the successful intercalation/silyla-tion of the aminoalkylsilanes in the Na-MMT galleries is the pres-ence of C–H and N–H absorbance peaks in the corresponding IRspectra. Fig. 1 shows an enlargement of the IR between 3800 and2500 cm�1 for the A1100-MMT sample using the two different pro-cedures described above. In the same figure, the spectra of the
A1100 silane molecule and the pristine Na-MMT are also shownfor comparison.
Compared to the neat Na-MMT spectrum, the two functional-ized powders show additional peaks which can be attributed tothe asymmetric and symmetric stretching vibrations of the meth-ylene groups at 2936 and 2885 cm�1, respectively, thus confirmingthe presence of the organic moieties on the Na-MMT surface [25–27]. A shoulder at �3290 cm�1 in Fig. 1 may be assigned to thestretching of the NH2 group [28]. It is worth noting that, by increas-ing the aminosilane concentration and the reaction temperature,both methylene and NH2 adsorption peaks in Fig. 1 become pro-gressively more pronounced, suggesting the presence of a largeramount of intercalated/grafted silane modifiers. No evaluationwas performed on the relative intensity of the peaks related tothe stretching vibration of isolated or hydrogen bonded OH groups(at 3620 cm�1 and 3440 cm�1, respectively), because the possiblepresence of adsorbed water cannot be ruled out [29].
3.2. Thermogravimetric analysis
Thermogravimetric analysis (data not shown) was carried outon the Na-MMT powders prior and after the silylation reaction per-formed by Procedure 1. The mass losses in the range between 200�and 600 �C were used as entry parameters in Eqs. (1) and (2) toevaluate the grafted aminosilane amounts, and the correspondingresults are displayed in Table 2. Interestingly, by the applicationof Procedure 1 the grafted aminosilane amounts increase withincreasing of the aminosilane alkyl chain.
Scheme 2. Schematic representation of possible covalent bonds formation betweenthe Si atoms of the aminosilane molecules and the MMT surface O atoms. A: twocovalent bonds on the same MMT surface; B: three covalent bonds on the sameMMT surface; C: two covalent bonds bridging two MMT layers.
3800 3600 3400 3200 3000 2800 2600
dc
b
Abs
orba
nce
Wavenumbers, cm-1
a
Fig. 1. Infrared spectra of: (a) A1100; (b) pristine Na-MMT; (c) A1100-MMTobtained from Procedure 1; (d) A1100-MMT obtained from Procedure 2.
Table 2Thermogravimetric analysis of functionalized MMT.
Masslossa (%)
Grafted amountb
(mequiv/g)Graftingamountc (%)
A1100-MMT Procedure 1 8.8 0.4 (I = 68%;S = 32%)
9.6
Procedure 2 11.4 0.6 (O = 21%;I = 38%; S = 41%)
12.8
A1120-MMT 14.6 0.8 17.1A1130-MMT 18.8 0.9 23.2
a Mass loss between 200� and 600 �C.b Determined by using Eq. (1).c Determined by using Eq. (2).
F. Piscitelli et al. / Journal of Colloid and Interface Science 351 (2010) 108–115 111

Author's personal copy
In order to identify the degraded species, two pastes obtainedby dispersing the Na-MMT in water and glycerol, respectively,were analyzed. The results are displayed in terms of first derivativemass loss in Fig. 2.
The pristine Na-MMT shows two Fig. 2 peaks at 50 and 630 �Ccorresponding to the physically adsorbed water and the dehydr-oxylation of the clay, respectively [30,31]. The curve related tothe Na-MMT–H2O paste shows a peak at 50 �C related to the lossof physically adsorbed water, whereas the two other peaks at270 and 358 �C (Fig. 2) can be sensibly ascribed to the loss of inter-calated water. By analogy, the intense Fig. 2 peak at 215 �C in theNa-MMT–Gly curve could be assigned to the loss of physically ad-sorbed glycerol, whilst the weak Fig. 2 peak at �350 �C could referto the intercalated glycerol. As for the Na-MMT–H2O paste, theFig. 2 peak at higher temperature is due to MMT dehydroxylation.The DTG curves of the A1100-MMT system shows the mass loss ofphysically adsorbed water at 50 �C, and other two Fig. 2 peaks at418 and 540 �C, respectively. The first one is ascribable to the inter-calated aminosilanes, whereas the broad Fig. 2 peak at 540 �C couldbe linked to the decomposition of the chemically bound aminosil-anes [9]. Due to the consumption of hydroxyl groups belonging tothe platelet edges, the Na-MMT dehydroxylation Fig. 2 peak at630 �C nearly vanishes for this system. Lastly, the absence of theFig. 2 peak at 215 �C related to the physically adsorbed glycerolspeaks in favor of the reliability of the applied washing procedure.
With the goal of evaluating the effect of the reaction parameters(i.e. temperature and aminosilane concentration) on the silylationprocess, the amount of intercalated and grafted aminosilane wasassessed by performing TGA analysis on the A1100-MMT systemsobtained by using the two different reaction routes summarizedin Table 1. To eliminate the different contributes due to dissimilaradsorbed amounts of water, the curves shown in Fig. 3 A were nor-malized assigning to each curve the value of 100 to the massachieved at 150 �C. It is worth noting that, as we will discuss later,by increasing both temperature and aminosilane concentration,the quantity of aminosilanes able to penetrate into the Na-MMTgallery platelets slightly increases. Moreover, the grafted aminosi-lane amount increased by using the Procedure 2 compared toProcedure 1 (see Table 2). The DTG analysis performed on theA1100-MMT product obtained by Procedure 1 (Fig. 3 B)) showsthe presence of two peaks at 418 and 540 �C, ascribed to the inter-calated aminosilanes and chemically bounded aminosilanes,respectively [9].
Interestingly, the A1100-MMT product prepared following Pro-cedure 2 displays a third Fig. 3B peak at 310 �C, which could be attributed to the aminosilane interacting with the outer surfaces
of the clay platelets.With these peaks assignments in mind, it was possible to quan-
tify each degraded moieties using the deconvolution method of theOrigin program. The results of these deconvolutions are summa-rized in Table 2, where O indicates the aminosilane interactingwith the outside platelets, and I and S are the intercalated andchemically bonded aminosilanes, respectively. The results showthat higher temperature and aminosilane concentration valueslead to an increased amount of chemically bonded silanes with re-spect to the intercalated species. Moreover, and perhaps moreinterestingly, only the A1100-MMT obtained by Procedure 2 dis-plays aminosilanes interacting with the outside platelets.
3.3. Wide angle X-ray diffraction results and molecular dynamicspredictions
To quantify the effect of the length of the aminosilane alkyl sub-stituents on the Na-MMT basal spacing, silylation reactions wereperformed using the three different aminosilanes A1100, A1120and A1130, and adopting Procedure 1. The X-ray diffraction
100 200 300 400 500 600 7000.00
0.05
0.10
0.15
540
630418358
270
215
Der
iv. M
ass
(%/°
C)
Temperature (°C)
Na-MMT A1100-MMT Na-MMT-Gly Na-MMT-H
2O
50
Fig. 2. DTG curves of pristine Na-MMT, functionalized Na-MMT powders, and Na-MMT/water and Na-MMT/glycerol pastes.
200 300 400 500 600 70086
88
90
92
94
96
98
100
a
c
b
Mas
s (%
)
Temperature (°C)
(A)
200 300 400 500 600 700
0.00
0.02
0.04
0.06
0.08
b
c
a
200 300 400 500 600 700
540°C
418°C
310°C(B)
630
540
418
Der
iv. M
ass
(%/°
C)
Temperature (°C)
310
Fig. 3. Thermogravimetric analysis of Na-MMT before and after silylation reactionusing two different process parameters: (A) mass losses curve; (B) first derivative ofmass losses curve. The inset shows the peak deconvolutions: (a) pristine Na-MMT;(b) A1100-MMT obtained from Procedure 1; (c) A1100-MMT obtained fromProcedure 2.
112 F. Piscitelli et al. / Journal of Colloid and Interface Science 351 (2010) 108–115

Author's personal copy
patterns related to the (0 0 1) basal spacing, displayed in Fig. 4,show that the introduction of any aminosilane type into the Na-MMT gallery shifts the peak at lower 2h values compared to thepristine Na-MMT.
This increase of basal spacing is a clear signal that each aminosi-lane species has been grafted/intercalated in the inter-plateletsspace of Na-MMT. In detail, the neat Na-MMT shows a Fig. 4 peakat 2h equal to 7.5�, corresponding to a d-spacing value of 11.7 Å,whereas the aminosilane-modified MMTs show Fig. 4 diffractionpeaks at 2h values between 5.3� and 5.9� (Table 3). Concerning theeffect of the alkyl chain length, the A1120-MMT and A1130-MMTsystems show lower basal spacing values, 15.3 and 15.0 Å, respec-tively, compared to the A1100-MMT, for which d001 = 16.7 Å. Amajor, important conclusion which can be drawn from the analysisof data shown in Table 3 is that the longer the organic chain on theaminosilane molecules, the smaller the d-spacing in the relevantmodified MMT.
To try to find a molecular rationale for the somewhat counter-intuitive behavior reported above, molecular dynamics (MD) sim-ulations have been performed on model systems.
Table 4 shows the values of estimated aminosilane-MMT inter-layer spacing for all model systems considered (see Scheme 1) asobtained from 1 ns NPT MD simulations. From these values, andthe inspection of the relevant MD trajectories, we can draw someuseful considerations.
First of all, independently of the aminosilane chain length, ami-nosilane molecules bridging two MMT layers (i.e., option C inScheme 2) result in the lowest d-spacing values (see Table 4). Fromthe viewpoint of further employment of aminosilane-MMT sys-tems for polymer intercalation and/or exfoliation, this is the worstcase possible, as the distance between MMT sheets is not only
practically coincident with that of unmodified MMT (i.e., 11.7 Å),but also the aminosilane molecules act as ‘anchoring points”, coun-teracting any eventual macromolecular intercalation/exfoliation.Fig. 5 shows an equilibrated MD snapshot of the A1100-MMT/op-tion C system as an example.
The results obtained for the two alternative bonding options(i.e., A and B in Scheme 2), expressed as average d-spacing values(see 3rd column in Table 4), are in excellent agreement with theexperimental evidences discussed above. Notably, however, in con-trast to common observations during the intercalation of smallmolecules between the silicate layers, where longer organic chainsnormally result in higher interlayer spacing, for aminosilane-MMTsystems a reverse trend is observed. Indeed, longer aminosilanemolecules yield lower d-spacing.
A sensible explanation for this coupled experimental/simula-tion evidence could be hypothesized, keeping in mind that the or-ganic tail of each aminosilane molecule features not only –CH2
groups, which are hydrophobic, but also one or more –NH2/NH–groups, which are endowed with hydrophilic character, and capa-ble to originate both intra- and inter-molecular hydrogen bonds(see Scheme 1).
Following these lines of reasoning, for the smaller aminosilanemolecule A1100, characterized by the presence of a short chainand only one terminal –NH2 group, a mechanism quite similar tothat observed for quaternary ammonium salt-modified MMT canbe envisaged. Accordingly, the A1100 aminosilane chains are at-tracted by the surface of clay and, while flattening onto it, providea screening between the charges of the MMT layers ultimatelyfavoring the weakening of interlayer attraction and, hence, a largerd-spacing value.
On the other hand, the other two aminosilane molecules (A1120and A1130), featuring longer, more mobile chains with one andtwo –NH groups, respectively, have a strong tendency to interactamong themselves (via both intermolecular hydrogen bondingand hydrophobic interactions). As a result, their flattening ontothe MMT surface is reduced, the charge distribution on the MMT
3 4 5 6 7 8 9
5.9
5.7
5.3
7.5
Inte
nsity
2θ (DEG)
Na-MMT
A1100-MMT
A1120-MMT
A1130-MMT
Fig. 4. X-ray diffraction patterns of Na-MMT before and after silylation reactionwith different aminosilanes.
Fig. 5. Equilibrated MD snapshot of the A1100-MMT/option C system (seeScheme 2).
Table 3d-Spacing values for aminosilane-modified MMT estimated by XRD analysis.
System 2h (�) d-Spacing (Å)
Pristine Na-MMT Procedure 1 7.5 11.7A1100-MMT Procedure 2 5.3 16.7
4.0 22.2A1120-MMT 5.7 15.3A1130-MMT 5.9 15.0
Table 4d-Spacing values for aminosilane-modified MMT estimated by MD simulations.
System d-Spacing (Å)
Option Aa Option Ba Average A and B Option Ca
A1100-MMT Procedure 1 17.0 16.2 16.6 11.7A1100-MMT Procedure 2 21.9 21.7 21.8 11.7A1120-MMT 15.9 15.3 15.6 11.9A1130-MMT 15.1 14.8 14.9 11.9
a For the meaning of Options A–C, please refer to Scheme 2.
F. Piscitelli et al. / Journal of Colloid and Interface Science 351 (2010) 108–115 113

Author's personal copy
surface is less screened, and the clay sheets do not tend to separateas much as in the case of A1100 chains. Fig. 6a and b show a com-parison between two equilibrated MD snapshots for A1100-MMTand A1120-MMT, respectively, in which the different degree ofinteractions between the aminosilane chains, resulting in a smallerd-spacing, is well evident.
The A1100-MMT system was further selected to check the effectof the preparation procedure adopted. Fig. 7 shows the diffractionpatterns related to the A1100-MMT obtained by using the two pro-cedures summarized in Table 1.
For the sake of comparison, the diffraction pattern of the pris-tine Na-MMT is also reported. In details, the silylation reactionwith A1100 by Procedure 2 resulted in a further shift of the(0 0 1) diffraction peak up to 2h = 4.0�, corresponding to a d-spac-ing value of 22.2 Å, with respect to that obtained with the silylationby Procedure 1 (16.7 Å). It is worth noting that the highest reactiontemperature and aminosilane concentration (i.e. Procedure 2)allowed obtaining a higher enlargement of the basal spacing.Moreover, the broader Fig. 7 (0 0 1) diffraction peak reflects thevariety of platelets gallery heights due to the grafted/intercalatedproducts.
In harmony with the experimental findings, the MD simulationsreveal that, upon increasing the number of aminosilane moleculeswithin the clay galleries indeed results in a larger value of the esti-mated d-spacing, which, in turn, is in excellent agreement with thecorresponding experimental evidence (see values in Tables 2 and3). Fig. 6c yields pictorial evidence in support to the numericalvalue. As can be easily seen by comparing Fig. 6a and c, when moreaminosilane molecules are grafted/intercalated into the claygalleries the surface of the MMT layers is better screened by the si-
lane hydrocarbon chains. Accordingly, the attraction forces amongthe layers are weakened, and the resultant distance between themis higher. Not only, but, in the presence of higher silane concentra-tion, the hydrocarbon chains of neighboring molecules grafted/physical bounded to the same clay layer tend to interact moreamong themselves than with those laying on the opposite sheet.And this factor further concurs to lessen the overall attraction be-tween facing sheets and, hence, a higher d001 value.
Fig. 6. Equilibrated MD snapshot of (a) A1100-MMT/option A, reaction Procedure 1, (b) A1120-MMT/option A, and (c) A1100-MMT/option A, reaction Procedure 2 systems(see Scheme 2).
2 3 4 5 6 7 8 9
c
b
Inte
nsity
2θ (DEG)
a
Fig. 7. XRD analyses performed on the Na-MMT before and after silylation reactioncarried out using two different process conditions. (a) pristine Na-MMT; (b) A1100-MMT obtained with Procedure 1; (c) A1100-MMT obtained with Procedure 2.
114 F. Piscitelli et al. / Journal of Colloid and Interface Science 351 (2010) 108–115

Author's personal copy
4. Conclusions
Three aminosilanes (A1100, A1120 and A1130) characterized bydifferent lengths of the alkyl chains are used to functionalize theNa-MMT, by following two different routes in terms of reactiontemperature and aminosilane concentration. The appearance inthe FT-IR spectra of additional peaks at 2936 and 2885 cm�1,attributed to the asymmetric and symmetric stretching vibrationsof the methylene groups, respectively, and a shoulder at�3290 cm�1 assigned to the stretching of the NH2 group, confirmthe presence of the organic moieties on the Na-MMT surface. Thethermogravimetric analyses show that higher temperature andaminosilane concentration values lead to aminosilanes interactingwith the outside platelets and an increased amount of chemicallybonded silanes with respect to the intercalated species. The WAXDanalyses show that the introduction of any aminosilane type intothe Na-MMT gallery allows the basal spacing to increase with re-spect to the pristine Na-MMT, which is a clear signal that each ami-nosilane species has been grafted/intercalated in the inter-plateletsspace. Moreover, the WAXD analyses highlight the surprising re-sult that the longer the organic chain on the aminosilane mole-cules, the smaller the d-spacing in the relevant modified MMT.The molecular dynamics simulation explains this result in lightof the strong tendency of A1120 and A1130 aminosilanes to inter-act among themselves by both intermolecular hydrogen bondingand hydrophobic interactions because of the presence of one ortwo –NH groups in their organic chains. On the other hand theA1100 molecules, owing only one –NH2 group, provide a betterscreening between the MMT layers ultimately favoring the weak-ening of interlayer attraction and, hence, a larger d-spacing value.
Acknowledgments
The authors thank IMAST and MIUR. This work was supportedby the research project MACE coded MIUR n. DM24442.
References
[1] J. Zhang, R.K. Gupta, C.A. Wilkie, Polymer 47 (2006) 4537.
[2] H. Shi, T. Lan, T.J. Pinnavaia, Chem. Mater. 8 (1996) 1584.[3] S. Yariv, H. Cross, in: Dekker M, (Eds.), Clays and Clay Minerals, New York,
2002. pp. 463–566.[4] L.A. Utracki, Clay-containing Polymeric Nanocomposites, Rapra Technology
Limited Press, Shrewsbury, 2004.[5] P.A. Wheeler, J. Wang, J. Baker, L.J. Mathias, Chem. Mater. 17 (2005) 3012.[6] N.N. Herrera, J.M. Letoffe, J.L. Putaux, L. David, E. Bourgeat-Lami, Langmuir 20
(2004) 1564.[7] A.Y. Park, H. Kwon, A.J. Woo, S.J. Kim, Adv. Mater. 17 (2005) 106.[8] N. Herrera, J. Letoffe, J. Reymondc, E. Bourgeat-Lami, J. Mater. Chem. 15 (2005)
863.[9] H. He, J. Duchet, J. Galy, J. Gerard, Colloid. Interface Sci. 288 (2005) 171.
[10] M. Park, I.K. Shim, E.Y. Jung, J.H. Choy, J. Phys. Chem. Solids 65 (2004) 499.[11] A.M. Shanmugharaj, K.Y. Rhee, S.H. Ryu, J. Colloid Interface Sci. 298 (2006) 854.[12] A. Di Gianni, E. Amerio, O. Monticelli, R. Bongiovanni, Appl. Clay Sci. 42 (2008)
116.[13] C. Zhao, M. Feng, F. Gong, H. Qin, M. Yang, J. Appl. Polym. Sci. 93 (2004) 676.[14] K. Wang, L. Wang, J. Wu, L. Chen, C. He, Langmuir 21 (2005) 3613.[15] M. Fermeglia, M. Ferrone, S. Pricl, Fluid Phase Equilib. 212 (2003) 315.[16] R. Toth, A. Coslanich, M. Ferrone, M. Fermeglia, S. Pricl, S. Miertus, E. Chiellini,
Polymer 45 (2004) 8075.[17] G. Scocchi, P. Posocco, A. Danani, S. Pricl, M. Fermeglia, Fluid Phase Equilib. 261
(2007) 366.[18] M. Fermeglia, M. Ferrone, S. Pricl, Mol. Simul. 30 (2004) 289.[19] G. Scocchi, P. Posocco, J.W. Handgraaf, J.G.E.M. Fraaije, M. Fermeglia, S. Pricl,
Chem. Eur. J. 15 (2009) 7586.[20] H. Heinz, U.W. Suter, J. Phys. Chem. B 108 (2004) 18341.[21] H. Heinz, H. Koerner, K.L. Anderson, R.A. Vaia, B.L. Farmer, Chem. Mater. 17
(2005) 5658.[22] G. Brown, The X-ray Identification and Crystal Structures of Clay Minerals,
Mineralogical Society Press, London, 1961.[23] S.W. Bayley, Reviews in Mineralogy, Mineralogical Society of America Press,
Chelsea, Michigan, 1988. <http://www.webmineral.com>.[24] S.I. Tsipurski, V.A. Drits, Clay Miner. 19 (1984) 177.[25] K. Endo, Y. Sugahara, K. Kuroda, Bull. Chem. Soc. Jpn. 67 (1994) 3352.[26] T. Yankgisawa, K. Kurodo, C. Kato, React. Solids 5 (1988) 167.[27] S. Okutomo, K. Kuroda, M. Ogawa, Appl. Clay Sci. 15 (1999) 253.[28] I.K. Tonle, E. Ngameni, D. Njopwouo, C. Carteret, A. Walcarius, Phys. Chem.
Chem. Phys. 5 (2003) 4951.[29] E. Ruiz-Hitzky, J.M. Rojo, G. Lagaly, Colloid. Polym. Sci. 263 (1985) 1025.[30] C. Wan, X. Bao, F. Zhao, B. Kandasubramanian, M.P. Duggan, J. Appl. Polym. Sci.
110 (2008) 550.[31] S. Yariv, Appl. Clay Sci. 24 (2004) 225.[32] R. Toth, D.J. Voorn, J.W. Handgraaf, J.G.E.M. Fraaije, M. Fermeglia, S. Pricl, P.
Posocco, Macromolecules 42 (2009) 8260.[33] E. Hackett, E. Manias, E.P. Giannelis, Chem. Mater. 12 (2000) 2161.[34] D.K. Yang, D.B. Zax, J. Chem. Phys. 110 (1999) 5325.[35] P.P. Ewald, Ann. Phys. 64 (1921) 253.[36] S. Nosé, Prog. Theor. Phys. Suppl. 103 (1991) 1–46.
F. Piscitelli et al. / Journal of Colloid and Interface Science 351 (2010) 108–115 115
Related Documents