Welcome message from author
This document is posted to help you gain knowledge. Please leave a comment to let me know what you think about it! Share it to your friends and learn new things together.
Transcript


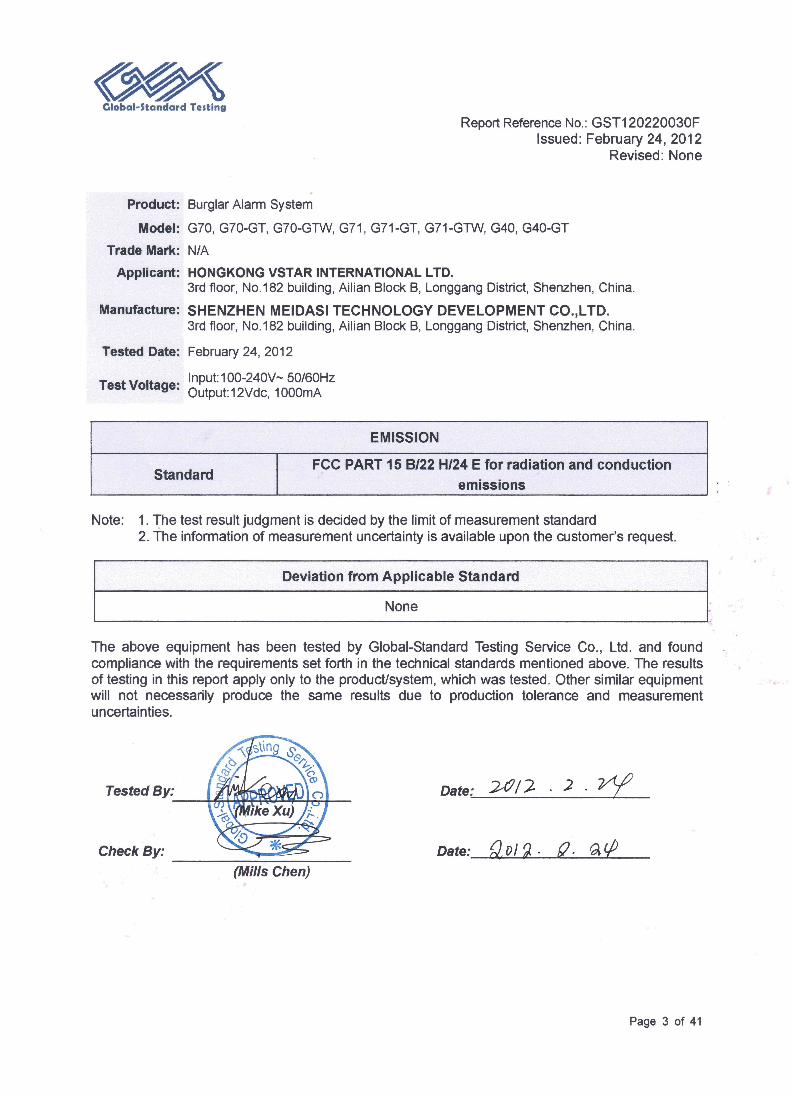
Report Reference No.: GST120220030F
Issued: February 24, 2012 Revised: None
Page 2 of 41
TABLE OF CONTENTS 1. GENERAL INFORMATION....................................................................................................................................4
1.1 PRODUCT DESCRIPTION FOR EQUIPMENT UNDER TEST (EUT) .........................................................................4 1.2 OBJECTIVE............................................................................................................................................................4 1.3 RELATED SUBMITTAL(S)/GRANT(S) .....................................................................................................................4 1.4 TEST METHODOLOGY...........................................................................................................................................4 1.5 TEST FACILITY ......................................................................................................................................................4
2. SYSTEM TEST CONFIGURATION ......................................................................................................................5 2.1 JUSTIFICATION ......................................................................................................................................................5 2.2 EQUIPMENT MODIFICATIONS................................................................................................................................5 2.3 CONFIGURATION OF TEST SETUP ........................................................................................................................5 2.4 TEST EQUIPMENT LIST AND DETAILS...................................................................................................................5
3. CONDUCTED EMISSION MEASUREMENT ......................................................................................................6 3.1 TEST PROCEDURES .......................................................................................................................................6 3.2 TEST SETUP......................................................................................................................................................7 3.4 TEST RESULTS.................................................................................................................................................7
4. RADIATED EMISSION MEASUREMENT ...........................................................................................................8 4.2TEST SETUP ....................................................................................................................................................10 4.3TEST RESULTS ...............................................................................................................................................10
5. RF EXPOSURE......................................................................................................................................................13 5.1 APPLICABLE STANDARD .....................................................................................................................................13 5.2 TEST RESULT .....................................................................................................................................................13
6. MODULATION CHARACTERISTIC ...................................................................................................................13 7. RF OUTPUT POWER ...........................................................................................................................................13
7.1 APPLICABLE STANDARD .....................................................................................................................................13 7.2TEST PROCEDURE ..............................................................................................................................................13 7.3 TEST DATA .........................................................................................................................................................14
8. OCCUPIED BANDWIDTH....................................................................................................................................19 8.1 APPLICABLE STANDARDS ...................................................................................................................................19 8.2 TEST PROCEDURE..............................................................................................................................................19 8.3 TEST DATA .........................................................................................................................................................19
9. SPURIOUS EMISSIONS AT ANTENNA TERMINALS ...................................................................................22 9.1 APPLICABLE STANDARDS ...................................................................................................................................22 9.2 TEST PROCEDURE..............................................................................................................................................22 9.3 TEST DATA .........................................................................................................................................................23
10. SPURIOUS RADIATED EMISSIONS...............................................................................................................26 10.1 APPLICABLE STANDARDS.................................................................................................................................26 10.2 TEST PROCEDURE ...........................................................................................................................................26 10.3 TEST DATA .......................................................................................................................................................26
11. BAND EDGES......................................................................................................................................................28 11.1 APPLICABLE STANDARDS.................................................................................................................................28 11.2 TEST PROCEDURE ...........................................................................................................................................28 11.3 TEST DATA .......................................................................................................................................................29
12. FREQUENCY STABILITY..................................................................................................................................32 12.1 APPLICABLE STANDARD ...................................................................................................................................32 12.2 TEST PROCEDURE ...........................................................................................................................................32 12.3 TEST DATA .......................................................................................................................................................33

Report Reference No.: GST120220030F
Issued: February 24, 2012 Revised: None
Page 4 of 41
1. GENERAL INFORMATION
1.1 Product Description for Equipment Under Test (EUT) The HONGKONG VSTAR INTERNATIONAL LTD. product, model number: G70, G70-GT, G70-GTW, G71, G71-GT, G71-GTW, G40, G40-GT the "EUT" as referred to in this report is a GSM Alarm, rated input voltage: DC 12V by Adapter input AC 100-240V 50/60Hz Frequency Range: Cellular Band: 824-849 MHz (TX), 869-894 MHz (RX) PCS Band: 1850-1910 MHz (TX), 1930-1990 MHz (RX) Modulation Mode: GMSK (GSM/DCS) Transmitter Output Power: Cellular Band: 33±2 dBm PCS Band: 30±2 dBm *Note: The series products, G70, G70-GT, G70-GTW, G71, G71-GT, G71-GTW, G40, G40-GT the difference of these models is in model name, there is no electrical change has been made to the equipment, which was explained in the attached Declaration Letter. 1.2 Objective This type approval report is prepared on behalf of HONGKONG VSTAR INTERNATIONAL LTD. in accordance with Part 2, Subpart J, Part 22 Subpart H, and Part 24 Subpart E of the Federal Communication Commissions rules. The objective is to determine compliance with FCC rules for output power, modulation characteristic, occupied bandwidth, and spurious emission at antenna terminal, spurious radiated emission, frequency stability, band edge and radiated margin. 1.3 Related Submittal(s)/Grant(s) No related submittal(s). 1.4 Test Methodology All tests and measurements indicated in this document were performed in accordance with the Code of Federal Regulations Title 47 Part 2, Sub-part J as well as the following parts: Part 22 Subpart H - Public Mobile Services Part 24 Subpart E - Personal Communication Services Applicable Standards: TIA/EIA 603-C, ANSI C63.4-2003. 1.5 Test Facility All measurement required was performed at laboratory of NTEK Testing Technology Co., Ltd. Fenda Science Park, Sanwei Community, Xixiang Street, Bao'an District, Shenzhen, China

Report Reference No.: GST120220030F
Issued: February 24, 2012 Revised: None
Page 5 of 41
2. SYSTEM TEST CONFIGURATION
2.1 Justification The EUT was configured for testing according to TIA/EIA-603-C. The final qualification test was performed with the EUT operating at normal mode. 2.2 Equipment Modifications No modifications were made to the EUT. 2.3 Configuration of Test Setup 2.4 Test Equipment List and Details
Manufacturer Description Model Serial
Number Calibration
Date Calibration Due Date
Sunol Sciences Horn Antenna DRH-118 A052604 2011-04-25 2012-04-25Sunol Sciences Broadband Antenna JB1 A040904-1 2011-04-25 2012-04-25
Rohde & Schwarz Spectrum Analyzer FSEM30 849720/019 2011-04-25 2012-04-25Sunol Sciences Broadband Antenna JB1 A040904-1 2011-04-25 2012-04-25
HP Preamplifier 8449B 3008A00277 2011-04-25 2012-04-25HP Signal Generator HP8657A 2849U00982 2011-04-25 2012-04-25HP Amplifier HP8447D 2944A09795 2011-04-25 2012-04-25HP Synthesized Sweeper 8341B 2624A00116 2011-04-25 2012-04-25
COM POWER Dipole Antenna AD-100 041000 2011-04-25 2012-04-25
A.H. System Horn Antenna SAS-200/571 135 2011-04-25 2012-04-25
Rohde & Schwarz Universal Radio Communication Tester CMU200 109038 2011-04-25 2012-04-25
Rohde & Schwarz EMI Test Receiver ESCI 100224 2011-04-25 2012-04-25
WUHUAN Temperature & Humidity Chamber HTP205 20021115 2011-04-25 2012-04-25
EUT
MU200 Horn Antenna
Report Reference No.: GST120220030F
Issued: February 24, 2012 Revised: None
Page 6 of 41
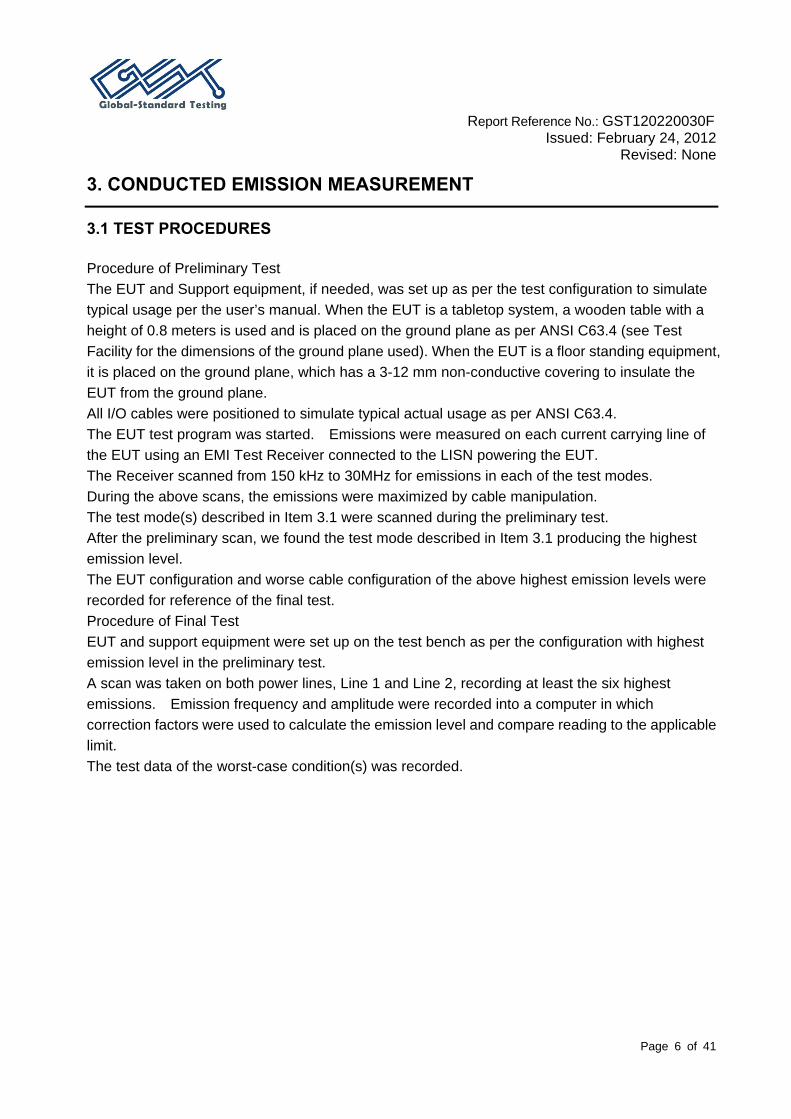
3. CONDUCTED EMISSION MEASUREMENT 3.1 TEST PROCEDURES Procedure of Preliminary Test The EUT and Support equipment, if needed, was set up as per the test configuration to simulate typical usage per the user’s manual. When the EUT is a tabletop system, a wooden table with a height of 0.8 meters is used and is placed on the ground plane as per ANSI C63.4 (see Test Facility for the dimensions of the ground plane used). When the EUT is a floor standing equipment, it is placed on the ground plane, which has a 3-12 mm non-conductive covering to insulate the EUT from the ground plane. All I/O cables were positioned to simulate typical actual usage as per ANSI C63.4. The EUT test program was started. Emissions were measured on each current carrying line of the EUT using an EMI Test Receiver connected to the LISN powering the EUT. The Receiver scanned from 150 kHz to 30MHz for emissions in each of the test modes. During the above scans, the emissions were maximized by cable manipulation. The test mode(s) described in Item 3.1 were scanned during the preliminary test. After the preliminary scan, we found the test mode described in Item 3.1 producing the highest emission level. The EUT configuration and worse cable configuration of the above highest emission levels were recorded for reference of the final test. Procedure of Final Test EUT and support equipment were set up on the test bench as per the configuration with highest emission level in the preliminary test. A scan was taken on both power lines, Line 1 and Line 2, recording at least the six highest emissions. Emission frequency and amplitude were recorded into a computer in which correction factors were used to calculate the emission level and compare reading to the applicable limit. The test data of the worst-case condition(s) was recorded.
Report Reference No.: GST120220030F
Issued: February 24, 2012 Revised: None
Page 7 of 41
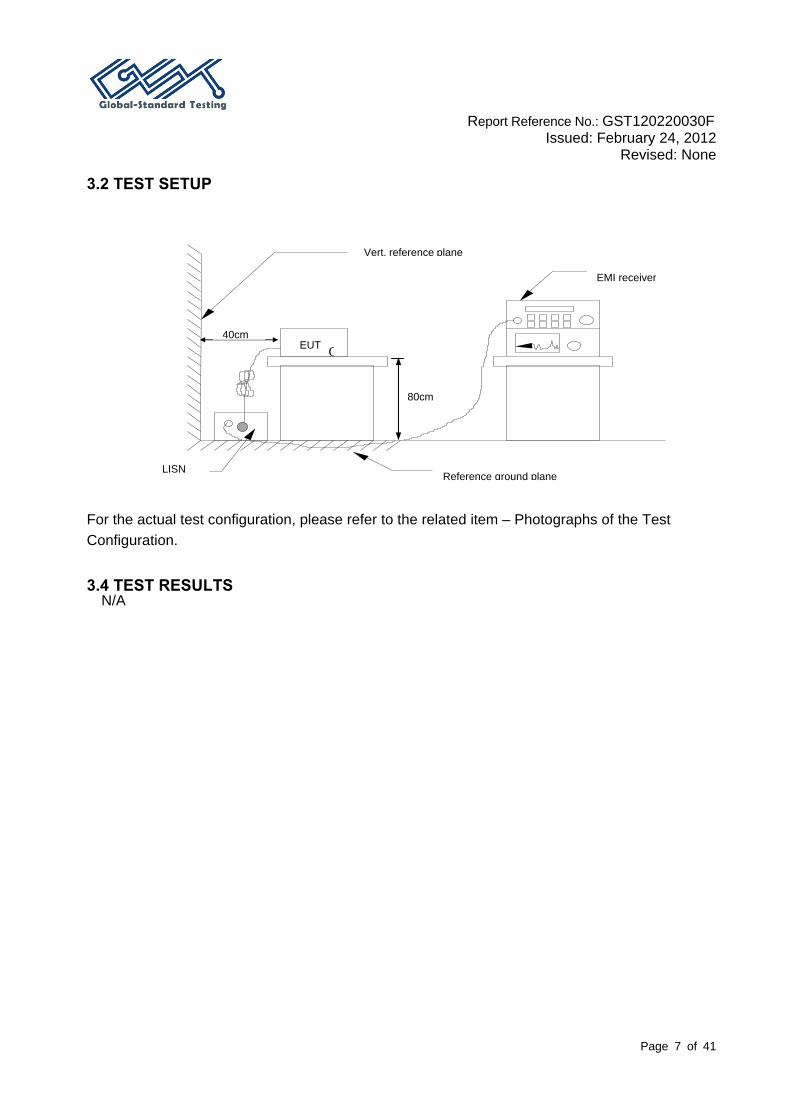
3.2 TEST SETUP
For the actual test configuration, please refer to the related item – Photographs of the Test Configuration.
3.4 TEST RESULTS
N/A
EUT C
LISN
EMI receiver
Reference ground plane
Vert. reference plane
40cm
80cm
Report Reference No.: GST120220030F
Issued: February 24, 2012 Revised: None
Page 8 of 41
4. RADIATED EMISSION MEASUREMENT
4.1TEST PROCEDURES
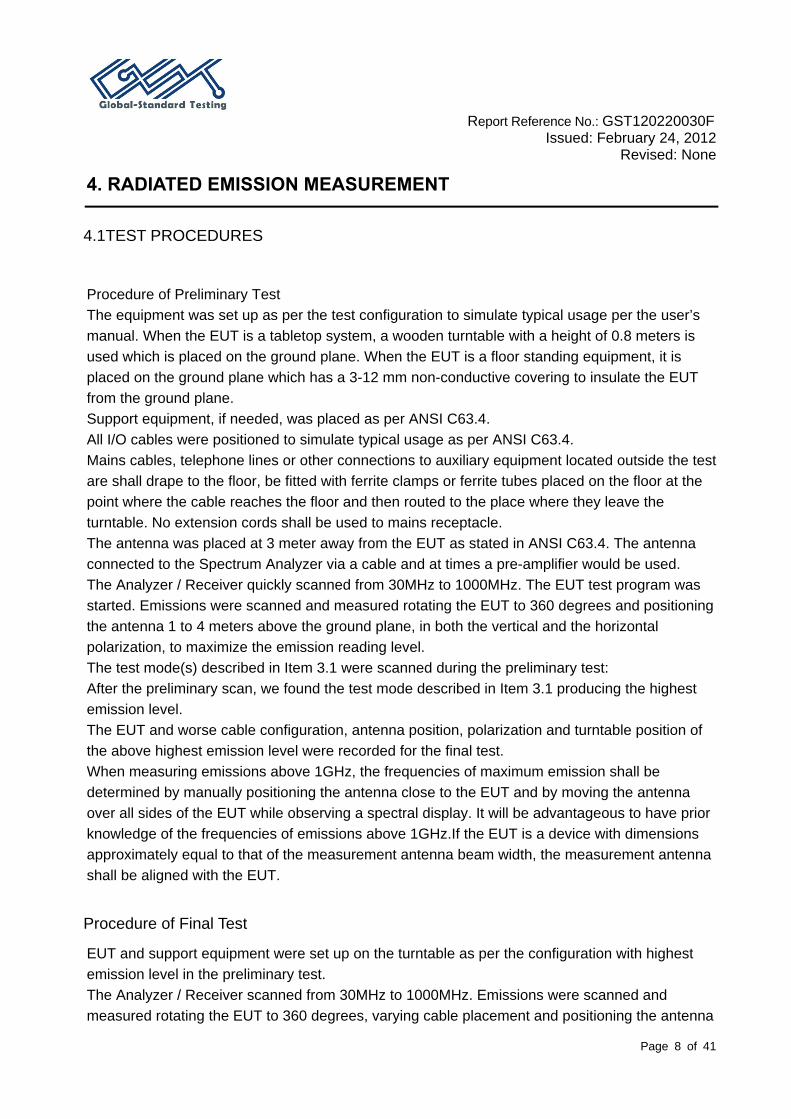
Procedure of Preliminary Test The equipment was set up as per the test configuration to simulate typical usage per the user’s manual. When the EUT is a tabletop system, a wooden turntable with a height of 0.8 meters is used which is placed on the ground plane. When the EUT is a floor standing equipment, it is placed on the ground plane which has a 3-12 mm non-conductive covering to insulate the EUT from the ground plane. Support equipment, if needed, was placed as per ANSI C63.4. All I/O cables were positioned to simulate typical usage as per ANSI C63.4. Mains cables, telephone lines or other connections to auxiliary equipment located outside the test are shall drape to the floor, be fitted with ferrite clamps or ferrite tubes placed on the floor at the point where the cable reaches the floor and then routed to the place where they leave the turntable. No extension cords shall be used to mains receptacle. The antenna was placed at 3 meter away from the EUT as stated in ANSI C63.4. The antenna connected to the Spectrum Analyzer via a cable and at times a pre-amplifier would be used. The Analyzer / Receiver quickly scanned from 30MHz to 1000MHz. The EUT test program was started. Emissions were scanned and measured rotating the EUT to 360 degrees and positioning the antenna 1 to 4 meters above the ground plane, in both the vertical and the horizontal polarization, to maximize the emission reading level. The test mode(s) described in Item 3.1 were scanned during the preliminary test: After the preliminary scan, we found the test mode described in Item 3.1 producing the highest emission level. The EUT and worse cable configuration, antenna position, polarization and turntable position of the above highest emission level were recorded for the final test. When measuring emissions above 1GHz, the frequencies of maximum emission shall be determined by manually positioning the antenna close to the EUT and by moving the antenna over all sides of the EUT while observing a spectral display. It will be advantageous to have prior knowledge of the frequencies of emissions above 1GHz.If the EUT is a device with dimensions approximately equal to that of the measurement antenna beam width, the measurement antenna shall be aligned with the EUT.
Procedure of Final Test
EUT and support equipment were set up on the turntable as per the configuration with highest emission level in the preliminary test. The Analyzer / Receiver scanned from 30MHz to 1000MHz. Emissions were scanned and measured rotating the EUT to 360 degrees, varying cable placement and positioning the antenna
Report Reference No.: GST120220030F
Issued: February 24, 2012 Revised: None
Page 9 of 41
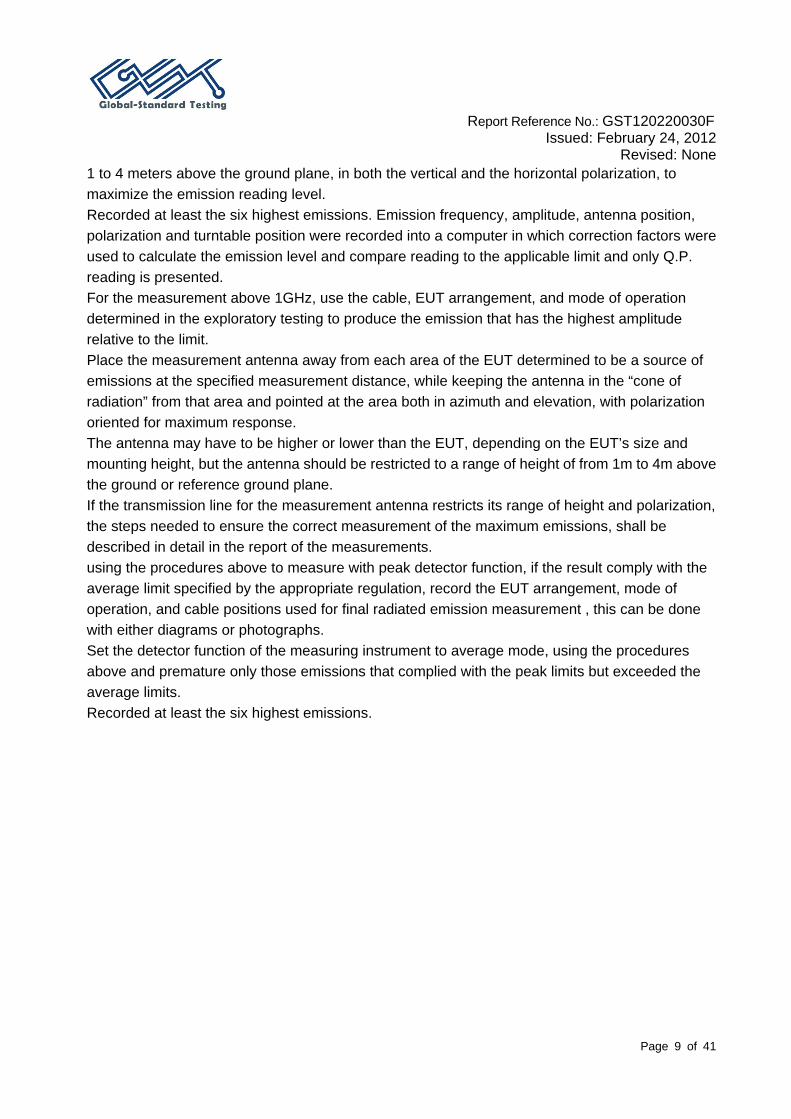
1 to 4 meters above the ground plane, in both the vertical and the horizontal polarization, to maximize the emission reading level. Recorded at least the six highest emissions. Emission frequency, amplitude, antenna position, polarization and turntable position were recorded into a computer in which correction factors were used to calculate the emission level and compare reading to the applicable limit and only Q.P. reading is presented. For the measurement above 1GHz, use the cable, EUT arrangement, and mode of operation determined in the exploratory testing to produce the emission that has the highest amplitude relative to the limit. Place the measurement antenna away from each area of the EUT determined to be a source of emissions at the specified measurement distance, while keeping the antenna in the “cone of radiation” from that area and pointed at the area both in azimuth and elevation, with polarization oriented for maximum response. The antenna may have to be higher or lower than the EUT, depending on the EUT’s size and mounting height, but the antenna should be restricted to a range of height of from 1m to 4m above the ground or reference ground plane. If the transmission line for the measurement antenna restricts its range of height and polarization, the steps needed to ensure the correct measurement of the maximum emissions, shall be described in detail in the report of the measurements. using the procedures above to measure with peak detector function, if the result comply with the average limit specified by the appropriate regulation, record the EUT arrangement, mode of operation, and cable positions used for final radiated emission measurement , this can be done with either diagrams or photographs. Set the detector function of the measuring instrument to average mode, using the procedures above and premature only those emissions that complied with the peak limits but exceeded the average limits. Recorded at least the six highest emissions.

Report Reference No.: GST120220030F
Issued: February 24, 2012 Revised: None
Page 10 of 41
4.2TEST SETUP
EMI
Receiver
3m
4m
1mTurntable
EUT
0.8m
Antenna tower
Reference ground plane
Bi-log antenna
For the actual test configuration, please refer to the related item – Photographs of the Test Configuration.
4.3TEST RESULTS

Report Reference No.: GST120220030F
Issued: February 24, 2012 Revised: None
Page 11 of 41

Report Reference No.: GST120220030F
Issued: February 24, 2012 Revised: None
Page 12 of 41

Report Reference No.: GST120220030F
Issued: February 24, 2012 Revised: None
Page 13 of 41
5. RF EXPOSURE
5.1 Applicable Standard §1.1307 and §2.1093. 5.2 Test Result Compliance
6. MODULATION CHARACTERISTIC
According to FCC § 2.1047(d), Part 22H & 24E there is no specific requirement for digital modulation, therefore modulation characteristic is not presented.
7. RF OUTPUT POWER
7.1 Applicable Standard According to FCC §2.1046 and §22.913 (a), the ERP of mobile transmitters and auxiliary test transmitters must not exceed 7 watts. According to FCC §2.1046 and §24.232 (C), in no case may the peak output power of a base station transmitter exceed 2 watt EIRP. 7.2Test Procedure Conducted method: The RF output of the transmitter was connected to the wireless test set and the spectrum analyzer through sufficient attenuation. Radiated method: TIA 603-C section 2.2.17
EUT Universal Radio
Communication Tester
Report Reference No.: GST120220030F
Issued: February 24, 2012 Revised: None
Page 14 of 41
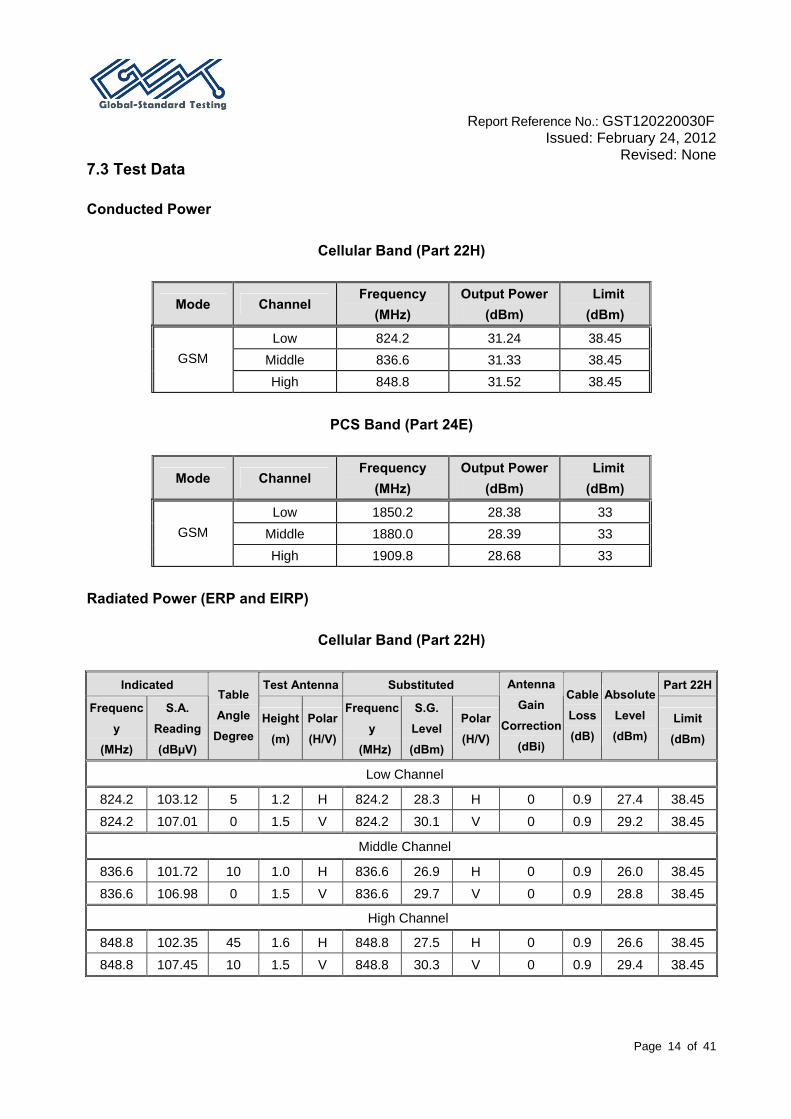
7.3 Test Data Conducted Power
Cellular Band (Part 22H)
Mode Channel Frequency
(MHz) Output Power
(dBm) Limit
(dBm)
Low 824.2 31.24 38.45 Middle 836.6 31.33 38.45 GSM
High 848.8 31.52 38.45
PCS Band (Part 24E)
Mode Channel Frequency
(MHz) Output Power
(dBm) Limit
(dBm)
Low 1850.2 28.38 33 Middle 1880.0 28.39 33 GSM
High 1909.8 28.68 33
Radiated Power (ERP and EIRP)
Cellular Band (Part 22H)
Indicated Test Antenna Substituted Part 22H
Frequenc
y
(MHz)
S.A.
Reading
(dBµV)
Table
Angle
Degree Height
(m)
Polar
(H/V)
Frequenc
y
(MHz)
S.G.
Level
(dBm)
Polar
(H/V)
Antenna
Gain
Correction
(dBi)
Cable
Loss
(dB)
Absolute
Level
(dBm) Limit
(dBm)
Low Channel
824.2 103.12 5 1.2 H 824.2 28.3 H 0 0.9 27.4 38.45
824.2 107.01 0 1.5 V 824.2 30.1 V 0 0.9 29.2 38.45
Middle Channel
836.6 101.72 10 1.0 H 836.6 26.9 H 0 0.9 26.0 38.45
836.6 106.98 0 1.5 V 836.6 29.7 V 0 0.9 28.8 38.45
High Channel
848.8 102.35 45 1.6 H 848.8 27.5 H 0 0.9 26.6 38.45
848.8 107.45 10 1.5 V 848.8 30.3 V 0 0.9 29.4 38.45

Report Reference No.: GST120220030F
Issued: February 24, 2012 Revised: None
Page 15 of 41
PCS Band (Part 24E)
Indicated Test
Antenna Substituted Part 24E
Frequency
(MHz)
S.A. Reading (dBµV)
Table Angle
Degree Height (m)
Polar(H/V)
Frequency
(MHz)
S.G. Level (dBm)
Polar(H/V)
AntennaGain
Correction
(dBi)
Cable Loss (dB)
Absolute
Level (dBm)
Limit (dBm)
Low Channel
1850.2 89.52 180 1.5 H 1850.2 18.9 H 6.2 1.02 24.08 33
1850.2 92.72 175 1.3 V 1850.2 21.8 V 6.2 1.02 26.98 33
Middle Channel
1880 87.25 180 1.9 H 1880 18.5 H 6.2 1.03 23.67 33
1880 91.1 170 1.4 V 1880 19.9 V 6.2 1.03 25.07 33
High Channel
1909.8 87.63 180 1.9 H 1909.8 18.6 H 6.2 1.03 23.77 33
1909.8 91.41 160 1.4 V 1909.8 20.6 V 6.2 1.03 25.77 33

Report Reference No.: GST120220030F
Issued: February 24, 2012 Revised: None
Page 16 of 41
Plots of Conducted Output Power Cellular Band (Part 22H)
Low Channel (GSM)
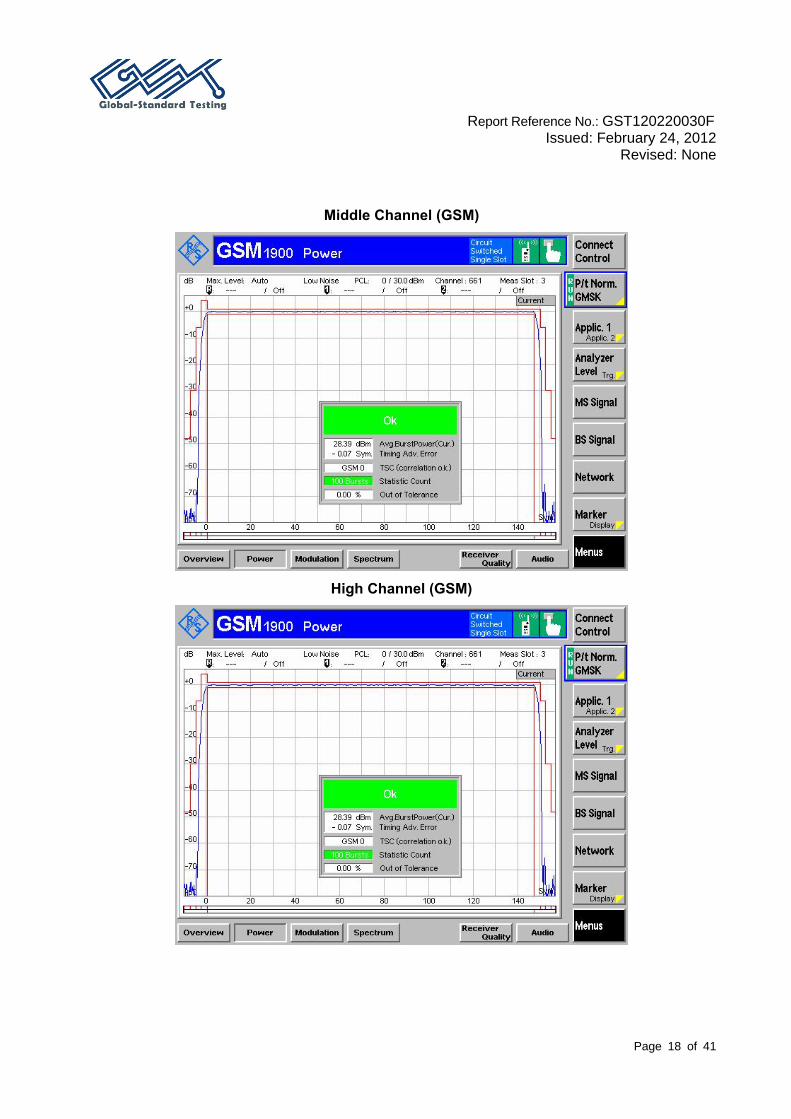
Middle Channel (GSM)

Report Reference No.: GST120220030F
Issued: February 24, 2012 Revised: None
Page 17 of 41
High Channel (GSM)
PCS Band (Part 24E)
Low Channel (GSM)
Report Reference No.: GST120220030F
Issued: February 24, 2012 Revised: None
Page 18 of 41
Middle Channel (GSM)
High Channel (GSM)

Report Reference No.: GST120220030F
Issued: February 24, 2012 Revised: None
Page 19 of 41
8. OCCUPIED BANDWIDTH
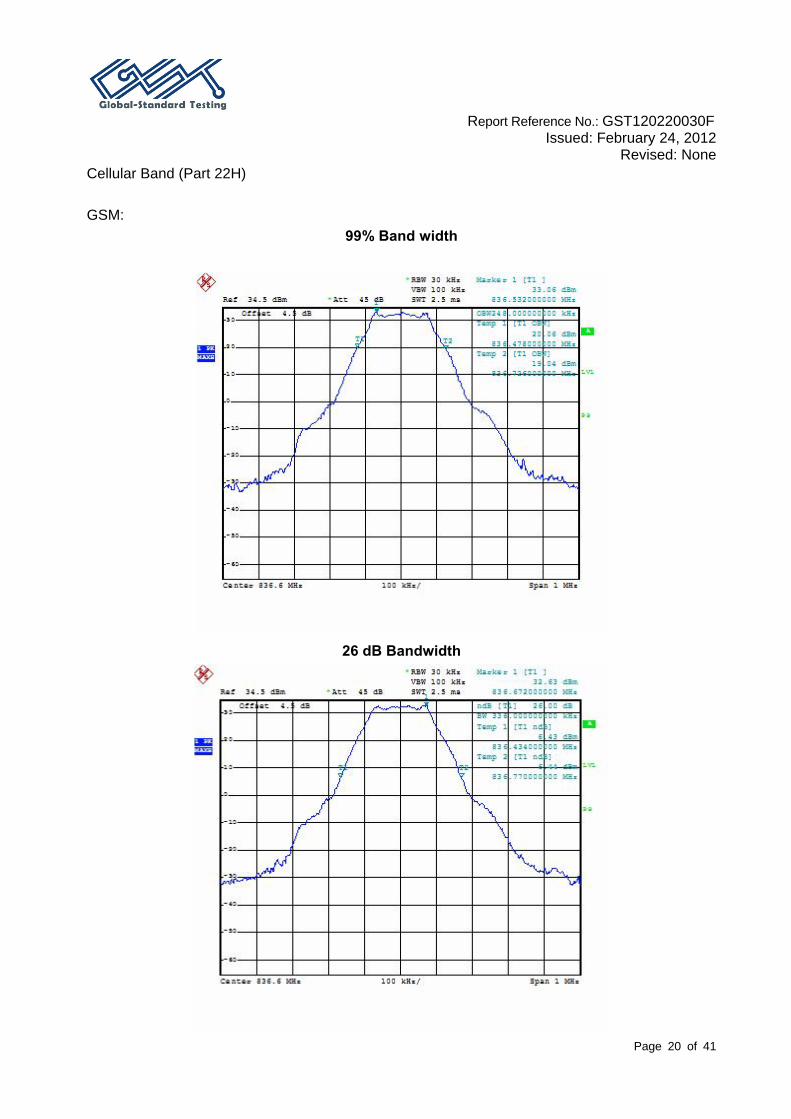
8.1 Applicable Standards CFR 47 §2.1049, §22.917, §22.905 and §24.238. 8.2 Test Procedure The RF output of the transmitter was connected to the simulator and the spectrum analyzer through sufficient attenuation. The resolution bandwidth of the spectrum analyzer was set at 30 kHz (Cellular /PCS) and the 26 dB & 99% bandwidth was recorded. 8.3 Test Data
Cellular Band (Part 22H)
Channel Frequency
(MHz)
99% Power Bandwidth
(kHz)
26 dB Bandwidth (kHz)
190 836.6 248.0000 336.0000
PCS Band (Part 24E)
Channel Frequency
(MHz)
99% Power Bandwidth
(kHz)
26 dB Bandwidth (kHz)
661 1880.0 248.0000 336.0000
Please refer to the following plots.
EUT Spectrum Analyzer Splitter
Universal Radio Communication
Tester
Report Reference No.: GST120220030F
Issued: February 24, 2012 Revised: None
Page 20 of 41
Cellular Band (Part 22H) GSM:
99% Band width
26 dB Bandwidth

Report Reference No.: GST120220030F
Issued: February 24, 2012 Revised: None
Page 21 of 41
PCS Band (Part 24E) GSM:
99% Band width
26 dB Bandwidth
Report Reference No.: GST120220030F
Issued: February 24, 2012 Revised: None
Page 22 of 41
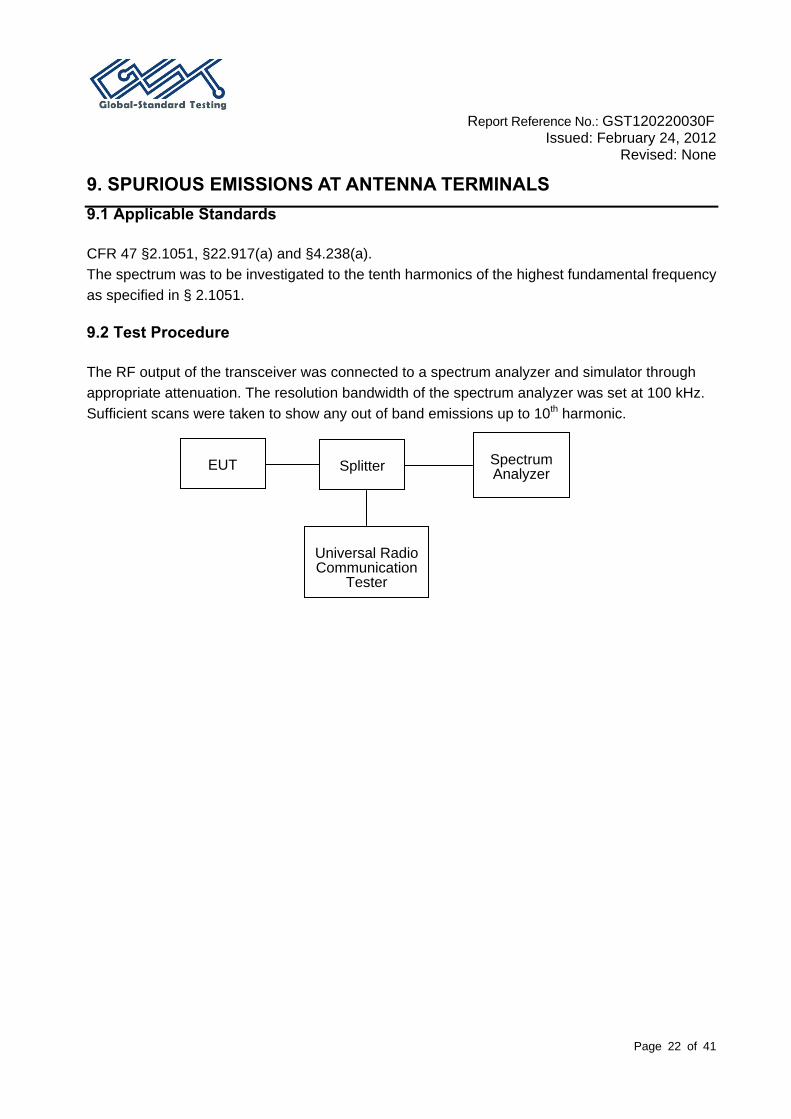
9. SPURIOUS EMISSIONS AT ANTENNA TERMINALS 9.1 Applicable Standards CFR 47 §2.1051, §22.917(a) and §4.238(a). The spectrum was to be investigated to the tenth harmonics of the highest fundamental frequency as specified in § 2.1051. 9.2 Test Procedure The RF output of the transceiver was connected to a spectrum analyzer and simulator through appropriate attenuation. The resolution bandwidth of the spectrum analyzer was set at 100 kHz. Sufficient scans were taken to show any out of band emissions up to 10th harmonic.
EUT Spectrum
Analyzer Splitter
Universal Radio Communication
Tester

Report Reference No.: GST120220030F
Issued: February 24, 2012 Revised: None
Page 23 of 41
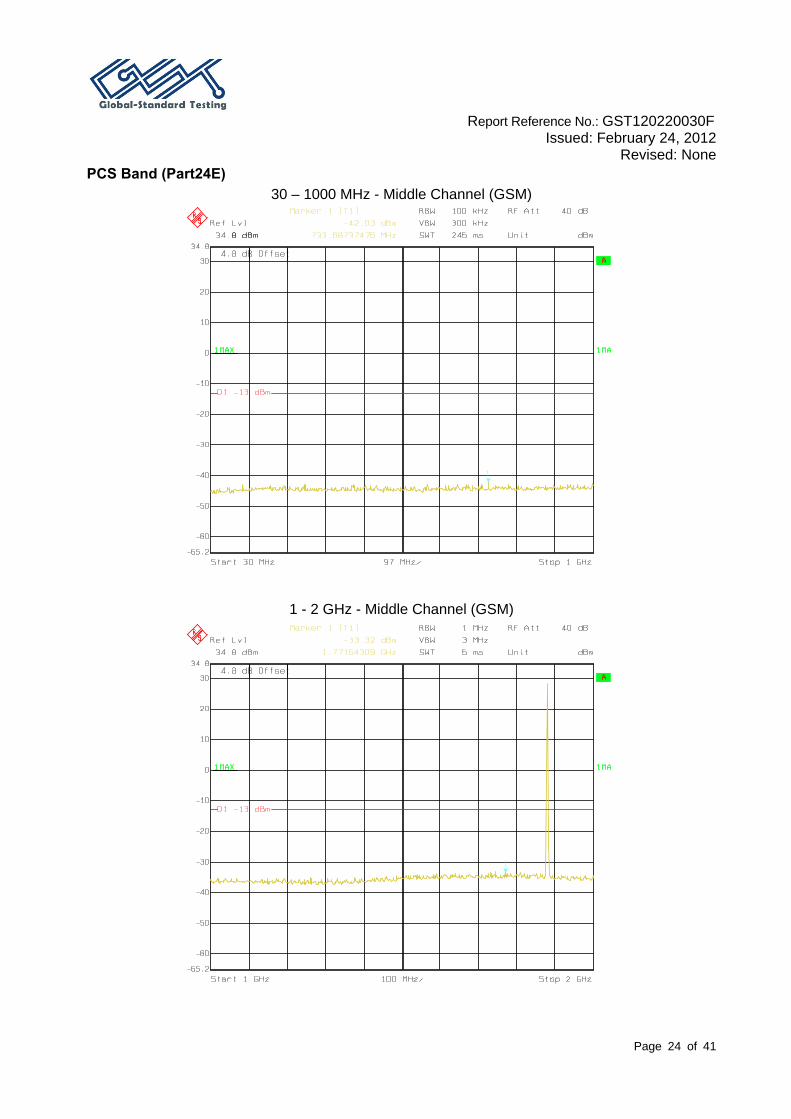
9.3 Test Data Please refer to the following plots.
Cellular Band (Part 22H) 30 – 1000 MHz - Middle Channel (GSM)
1 – 10 GHz - Middle Channel (GSM)
Report Reference No.: GST120220030F
Issued: February 24, 2012 Revised: None
Page 24 of 41
PCS Band (Part24E) 30 – 1000 MHz - Middle Channel (GSM)
1 - 2 GHz - Middle Channel (GSM)
Report Reference No.: GST120220030F
Issued: February 24, 2012 Revised: None
Page 25 of 41
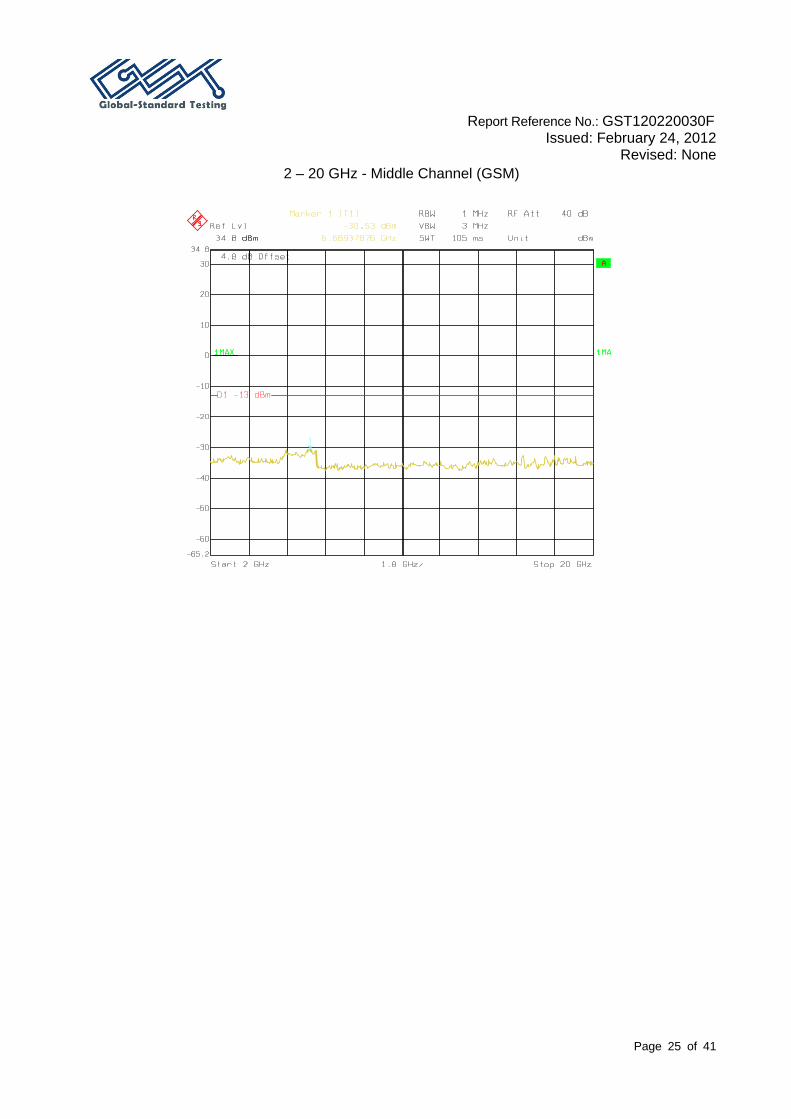
2 – 20 GHz - Middle Channel (GSM)

Report Reference No.: GST120220030F
Issued: February 24, 2012 Revised: None
Page 26 of 41
10. SPURIOUS RADIATED EMISSIONS
10.1 Applicable Standards CFR 47 § 2.1053, §22.917 and § 24.238. 10.2 Test Procedure The transmitter was placed on a wooden turntable, and it was transmitting into a non-radiating load which was also placed on the turntable. The measurement antenna was placed at a distance of 3 meters from the EUT. During the tests, the antenna height and polarization as well as EUT azimuth were varied in order to identify the maximum level of emissions from the EUT. The test was performed by placing the EUT on 3-orthogonal axis. The frequency range up to tenth harmonic of the fundamental frequency was investigated. Remove the EUT and replace it with substitution antenna. A signal generator was connected to the substitution antenna by a non-radiating cable. The absolute levels of the spurious emissions were measured by the substitution. Spurious emissions in dB = 10 lg (TXpwr in Watts/0.001) – the absolute level Spurious attenuation limit in dB = 43 + 10 Log10 (power out in Watts) 10.3 Test Data
Below 1 GHz:
Cellular Band
Indicated Test Antenna Substituted
Frequency
(MHz)
S.A.
Reading
(dBµV)
Table
Angle
Degree Height
(m)
Polar
(H/V)
Frequency
(MHz)
Level
(dBm)
Ant.
Gain
(dBi)
Cable
Loss
(dB)
Absolute
Level
(dBm)
Limit
(dBm)
Margin
(dB)
Middle Channel
979.99 49.42 124 1.5 H 979.99 -48.24 0 0.80 -49.04 -13 36.04
641.65 48.37 205 1.0 H 641.65 -49.51 0 0.77 -50.28 -13 37.28
732.04 47.75 78 1.5 V 732.04 -50.89 0 0.76 -51.65 -13 38.65
550.47 47.71 125 1.2 V 550.47 -51.26 0 0.65 -51.91 -13 38.91

Report Reference No.: GST120220030F
Issued: February 24, 2012 Revised: None
Page 27 of 41
PCS Band
Indicated Test Antenna Substituted
Frequency
(MHz)
S.A.
Reading
(dBµV)
Table
Angle
Degree Height
(m)
Polar
(H/V)
Frequency
(MHz)
Level
(dBm)
Ant.
Gain
(dBi)
Cable
Loss
(dB)
Absolute
Level
(dBm)
Limit
(dBm)
Margin
(dB)
Middle Channel
730.89 50.04 207 1.0 H 720.64 -48.18 0 0.74 -48.92 -13 35.92
527.97 49.12 125 1.5 H 540.22 -48.56 0 0.65 -49.21 -13 36.21
917.13 46.61 241 1.2 V 906.88 -53.14 0 0.76 -53.90 -13 40.90
980.84 44.25 75 1.5 V 992.24 -55.23 0 0.80 -56.03 -13 43.03
Above 1 GHz: Cellular Band
Indicated Test Antenna Substituted
Frequency
(MHz)
S.A.
Reading
(dBµV)
Table
Angle
Degree Height
(m)
Polar
(H/V)
Frequency
(MHz)
Level
(dBm)
Ant.
Gain
(dBi)
Cable
Loss
(dB)
Absolute
Level
(dBm)
Limit
(dBm)
Margin
(dB)
Middle Channel
1134.26 55.44 73 1.5 V 1134.26 -44.6 6.3 0.80 -39.1 -13 26.10
1134.26 50.06 80 1.0 H 1134.26 -50.1 6.3 0.80 -44.6 -13 31.60
2509.80 46.79 80 1.3 V 2509.80 -55.3 7.3 1.19 -49.19 -13 36.19
2509.80 45.86 132 1.5 H 2509.80 -55.8 7.3 1.19 -49.69 -13 36.69
3346.60 42.18 140 1.3 V 3346.60 -61.6 6.7 1.38 -56.28 -13 43.28
3346.60 41.14 117 1.4 H 3346.60 -62.4 6.7 1.38 -57.08 -13 44.08
PCS Band
Indicated Test Antenna Substituted
Frequency
(MHz)
S.A.
Reading
(dBµV)
Table
Angle
Degree Height
(m)
Polar
(H/V)
Frequency
(MHz)
Level
(dBm)
Ant.
Gain
(dBi)
Cable
Loss
(dB)
Absolute
Level
(dBm)
Limit
(dBm)
Margin
(dB)
Middle Channel
5640 45.00 160 1.6 V 5640 -59.2 8.3 1.76 -52.66 -13 39.66
7520 43.83 170 1.5 V 7520 -58.2 7.6 2.09 -52.69 -13 39.69
5640 44.59 70 1.5 H 5640 -59.5 8.3 1.76 -52.96 -13 39.96
7520 43.59 100 1.5 H 7520 -58.5 7.6 2.09 -52.99 -13 39.99
3760 45.54 180 1.9 V 3760 -59.9 6.9 1.47 -54.47 -13 41.47
3760 44.49 140 1.6 H 3760 -61.1 6.9 1.47 -55.67 -13 42.67

Report Reference No.: GST120220030F
Issued: February 24, 2012 Revised: None
Page 28 of 41
11. BAND EDGES
11.1 Applicable Standards According to § 22.917(a), the power of any emissions outside of the authorized operating frequency ranges must be attenuated below the transmitting power (P) by a factor of at least 43 + 10 log(P) dB. According to §24.238(a), the power of any emissions outside of the authorized operating frequency ranges must be attenuated below the transmitting power (P) by a factor of at least 43 + 10 log(P) dB. 11.2 Test Procedure The RF output of the transmitter was connected to the input of the spectrum analyzer through sufficient attenuation. The center of the spectrum analyzer was set to block edge frequency, RBW set to 10 kHz.
EUT Splitter
Universal Radio Communication
Tester
EMI Test Receiver
Report Reference No.: GST120220030F
Issued: February 24, 2012 Revised: None
Page 29 of 41
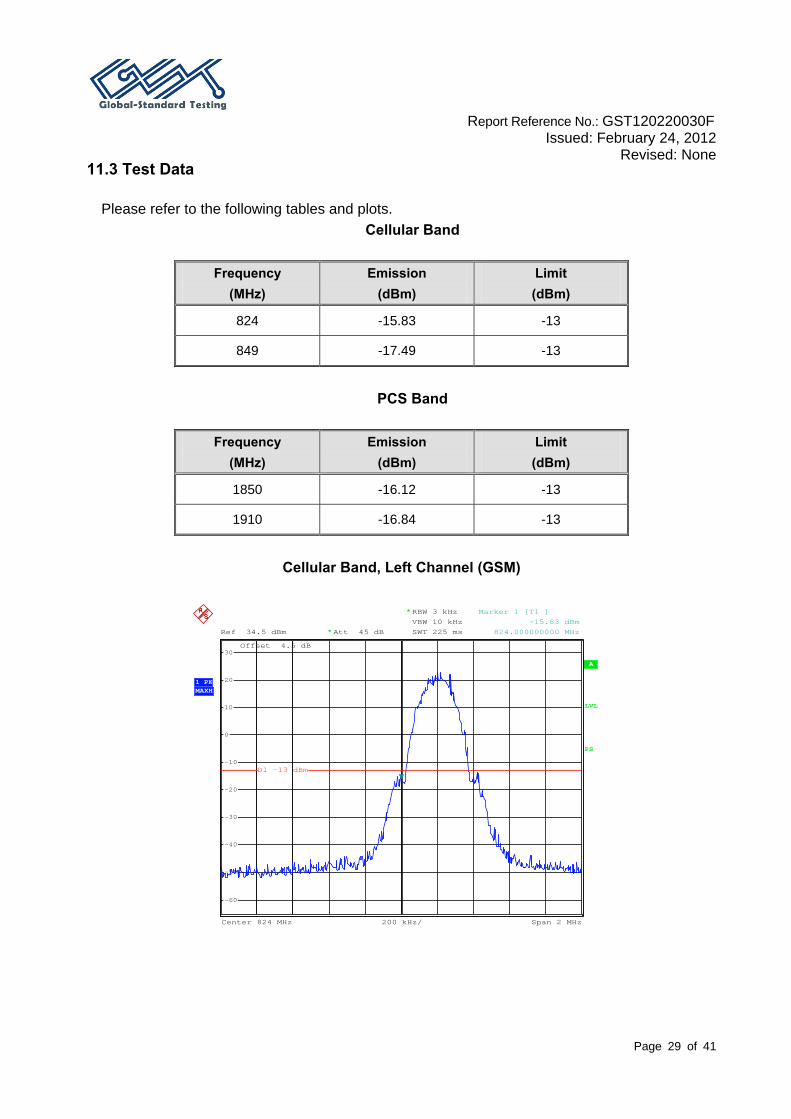
11.3 Test Data
Please refer to the following tables and plots. Cellular Band
Frequency
(MHz) Emission
(dBm) Limit (dBm)
824 -15.83 -13
849 -17.49 -13
PCS Band
Frequency
(MHz) Emission
(dBm) Limit (dBm)
1850 -16.12 -13
1910 -16.84 -13
Cellular Band, Left Channel (GSM)
A
PS
Att 45 dB*Ref 34.5 dBm
Offset 4.5 dB
LVL
200 kHz/Center 824 MHz Span 2 MHz
*RBW 3 kHz
VBW 10 kHz
SWT 225 ms
1 PKMAXH
-60
-50
-40
-30
-20
-10
0
10
20
30
1
Marker 1 [T1 ]
-15.83 dBm
824.000000000 MHz
D1 -13 dBm

Report Reference No.: GST120220030F
Issued: February 24, 2012 Revised: None
Page 30 of 41
Cellular Band, Right Channel (GSM)
A
PS
Att 45 dB*Ref 34.5 dBm
Offset 4.5 dB
LVL
200 kHz/Center 849 MHz Span 2 MHz
*RBW 3 kHz
VBW 10 kHzSWT 225 ms
1 PKMAXH
-60
-50
-40
-30
-20
-10
0
10
20
30
1
Marker 1 [T1 ]
-17.49 dBm 849.000000000 MHz
D1 -13 dBm
PCS Band, Left Channel (GSM)
A
PS
Att 45 dB*Ref 35 dBm
Offset 5 dB
LVL
200 kHz/Center 1.85 GHz Span 2 MHz
*RBW 3 kHz
VBW 10 kHzSWT 225 ms
1 PKMAXH
-60
-50
-40
-30
-20
-10
0
10
20
30
1
Marker 1 [T1 ]
-16.12 dBm 1.850000000 GHz
D1 -13 dBm

Report Reference No.: GST120220030F
Issued: February 24, 2012 Revised: None
Page 31 of 41
PCS Band, Right Channel (GSM)
A
PS
Att 45 dB*Ref 35 dBm
Offset 5 dB
LVL
200 kHz/Center 1.91 GHz Span 2 MHz
*RBW 3 kHzVBW 10 kHz
SWT 225 ms
1 PKMAXH
-60
-50
-40
-30
-20
-10
0
10
20
30
1
Marker 1 [T1 ] -16.84 dBm
1.910000000 GHz
D1 -13 dBm

Report Reference No.: GST120220030F
Issued: February 24, 2012 Revised: None
Page 32 of 41
12. FREQUENCY STABILITY
12.1 Applicable Standard CFR47 § 2.1055 (a), § 2.1055 (d), §22.355, §24.235
According to §22.355, the carrier frequency of each transmitter in the Public Mobile Services must be maintained within the tolerances given in Table below:
Frequency Tolerance for Transmitters in the Public Mobile Services
According to §24.235, the frequency stability shall be sufficient to ensure that the fundamental emissions stays within the authorized frequency block. 12.2 Test Procedure Frequency Stability vs. Temperature: The equipment under test was connected to an external DC power supply and the RF output was connected to communication test set via feed-through attenuators. The EUT was placed inside the temperature chamber. The DC leads and RF output cable exited the chamber through an opening made for the purpose. After the temperature stabilized for approximately 20 minutes, the frequency output was recorded from the communication test set. Frequency Stability vs. Voltage: An external variable DC power supply was connected to the battery terminals of the equipment under test. The voltage was set to 115% of the nominal value and was then decreased until the transmitter light no longer illuminated; i.e., the battery end point. The output frequency was recorded for each battery voltage.
Frequency Range (MHz)
Base, fixed (ppm)
Mobile ≤ 3 watts (ppm)
Mobile ≤ 3 watts (ppm)
25 to 50 20.0 20.0 50.0 50 to 450 5.0 5.0 50.0
450 to 512 2.5 5.0 5.0 821 to 896 1.5 2.5 2.5 928 to 929. 5.0 N/A N/A 929 to 960. 1.5 N/A N/A
2110 to 2220 10.0 N/A N/A

Report Reference No.: GST120220030F
Issued: February 24, 2012 Revised: None
Page 33 of 41
12.3 Test Data
Cellular Band:
Middle Channel, fo = 836.6 MHz
Temperature (OC)
Power Supplied(Vdc)
Frequency Error (Hz)
Frequency Error (ppm)
Limit (ppm)
-20 3.7 8 0.0096 2.5 -10 3.7 7 0.0084 2.5 0 3.7 7 0.0084 2.5
20 3.7 6 0.0072 2.5 40 3.7 7 0.0084 2.5 55 3.7 8 0.0096 2.5 25 3.5 7 0.0084 2.5
PCS Band:
Middle Channel, fo = 1880 MHz
Temperature (OC)
Power Supplied(Vdc)
Frequency Error (Hz)
Frequency Error (ppm)
Limit (ppm)
-20 3.7 -27 -0.0144 2.5 -10 3.7 -25 -0.0133 2.5 0 3.7 -24 -0.0128 2.5
20 3.7 -26 -0.0138 2.5 40 3.7 -28 -0.0149 2.5 55 3.7 -26 -0.0138 2.5 25 3.5 -31 -0.0165 2.5
Temperature
Chamber
Test Equipment EUT
Report Reference No.: GST120220030F
Issued: February 24, 2012 Revised: None
Page 34 of 41
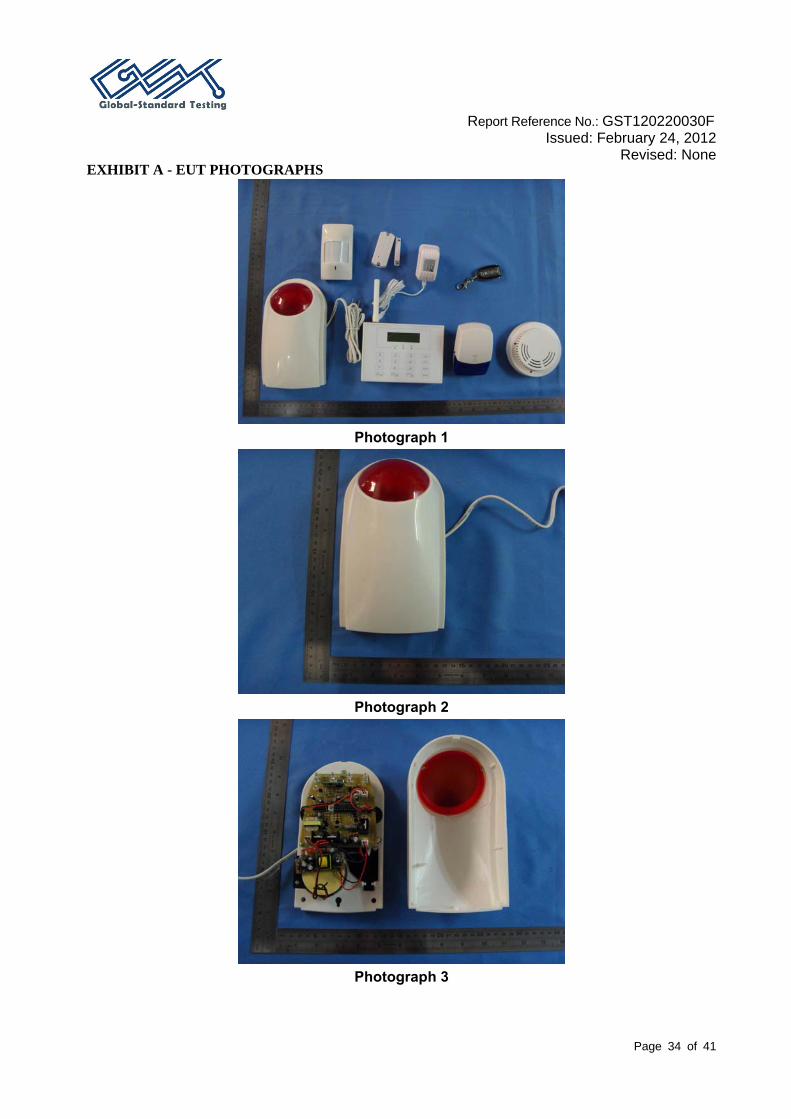
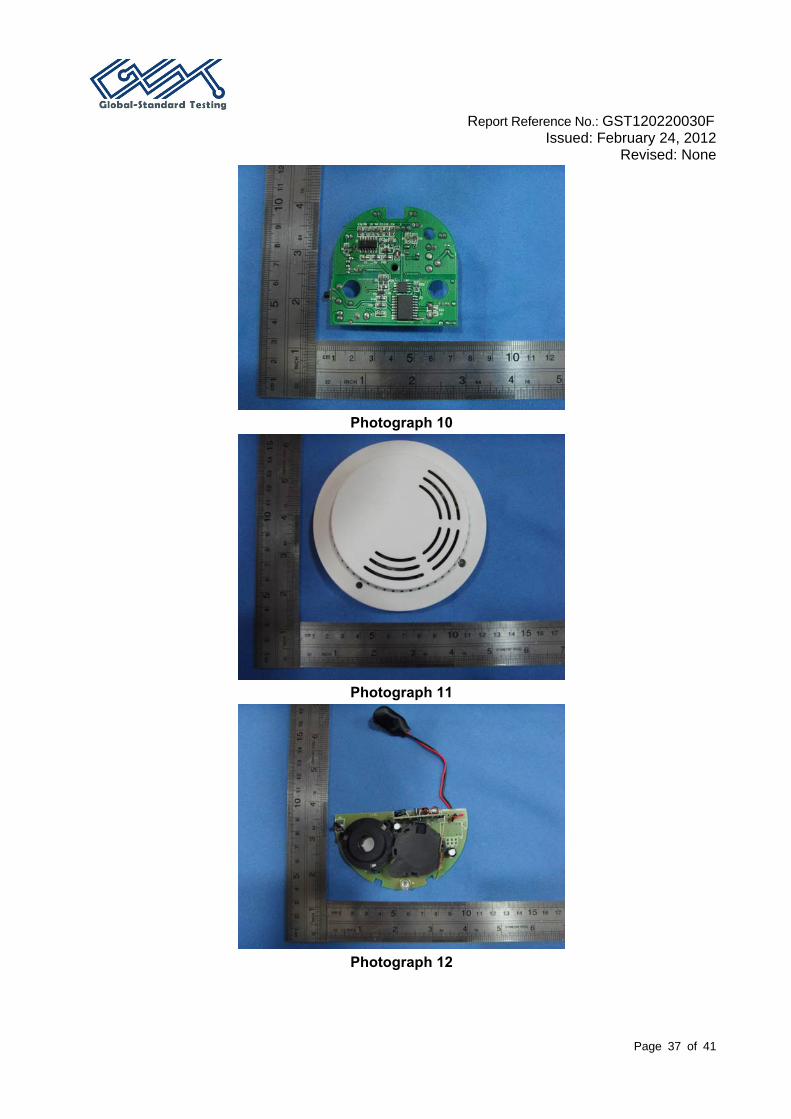
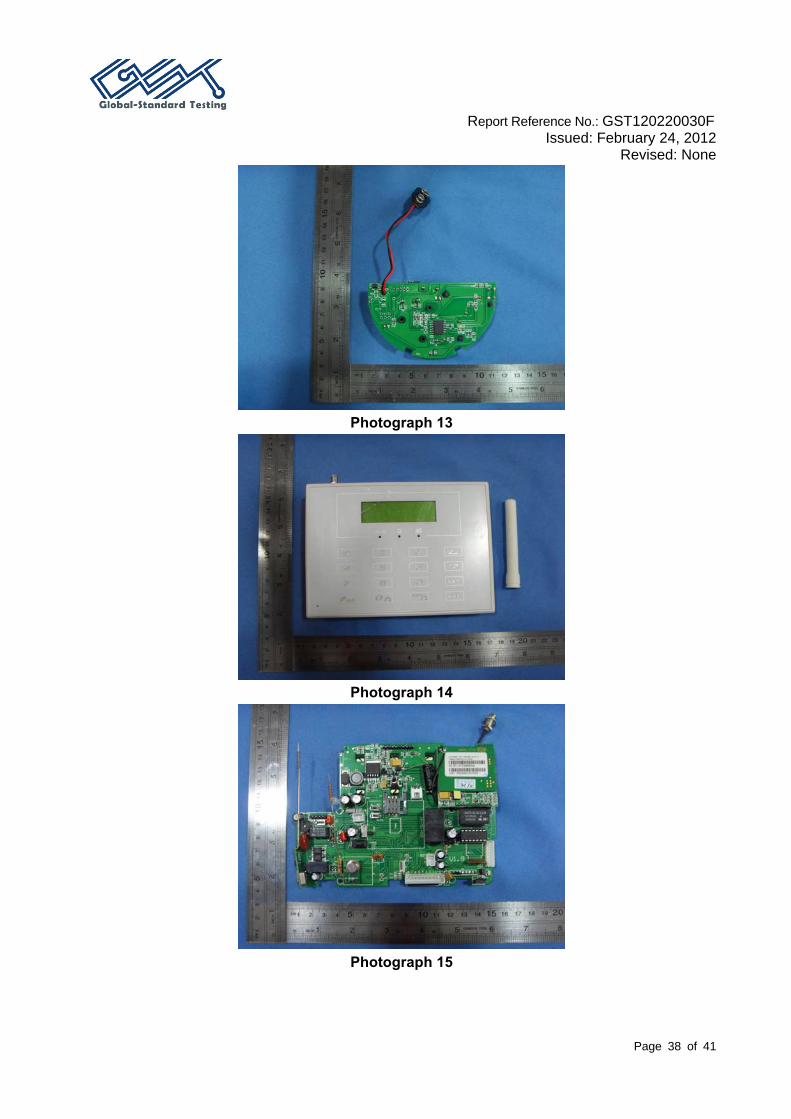
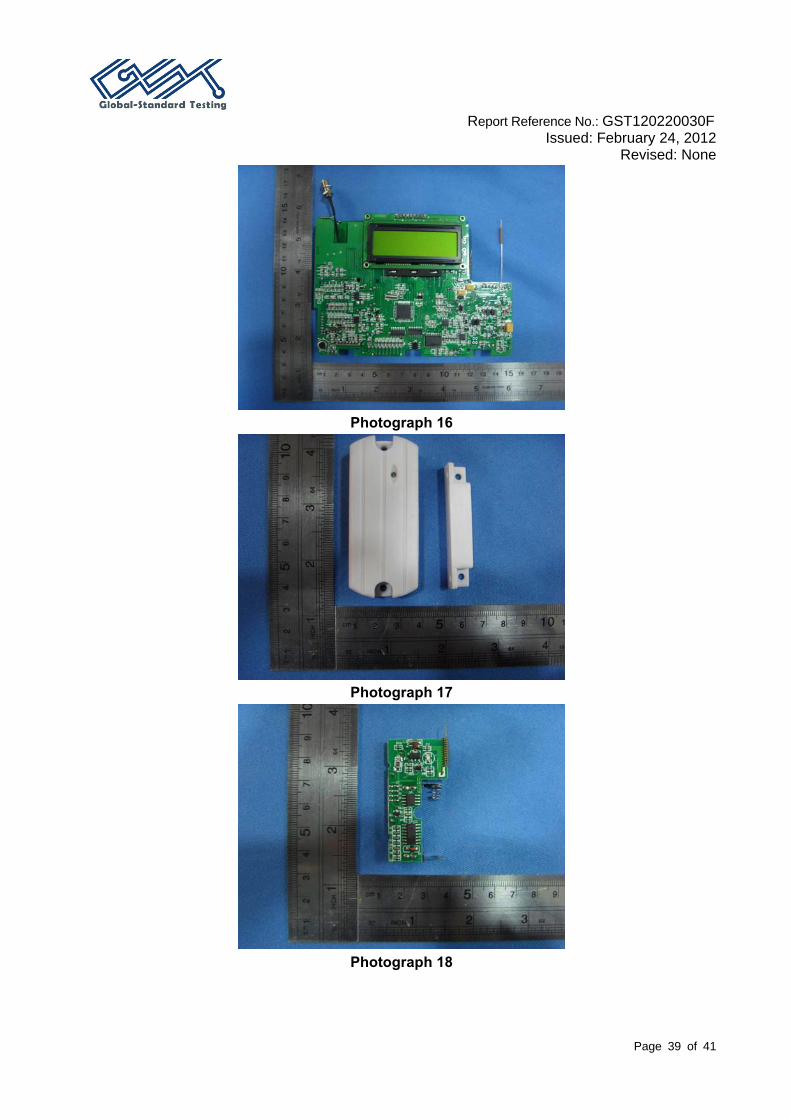
EXHIBIT A - EUT PHOTOGRAPHS
Photograph 1
Photograph 2
Photograph 3
Report Reference No.: GST120220030F
Issued: February 24, 2012 Revised: None
Page 35 of 41
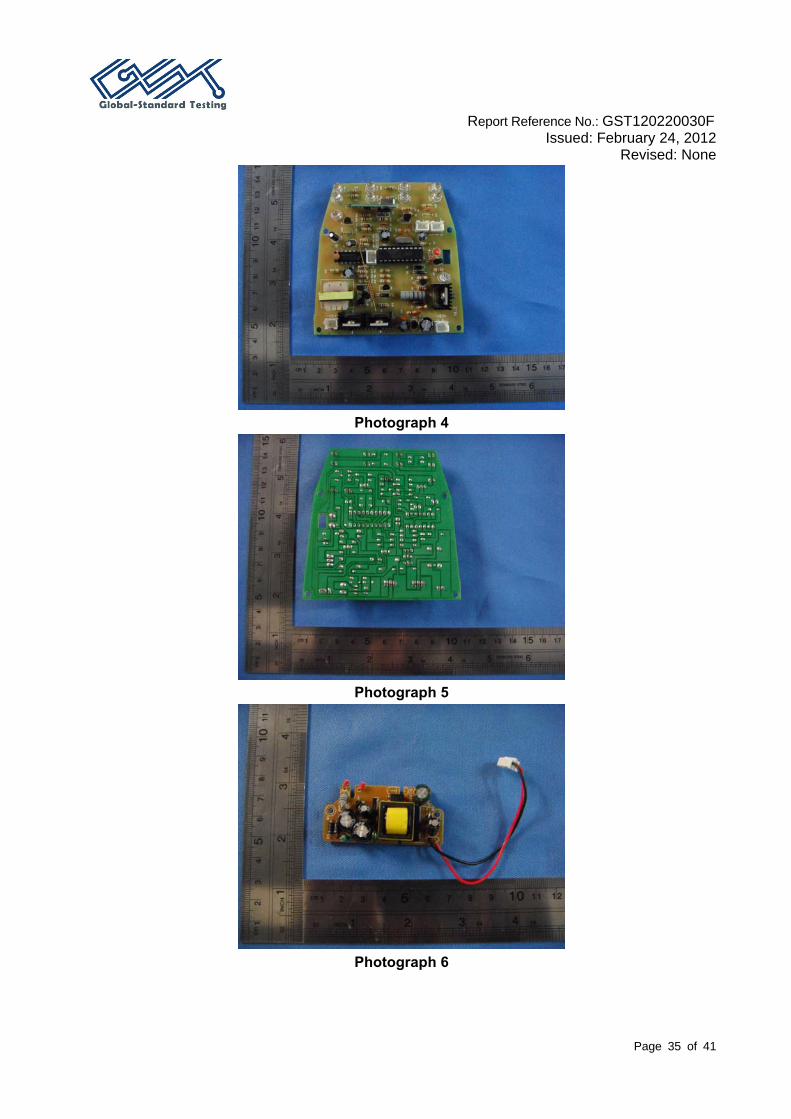
Photograph 4
Photograph 5
Photograph 6
Report Reference No.: GST120220030F
Issued: February 24, 2012 Revised: None
Page 36 of 41
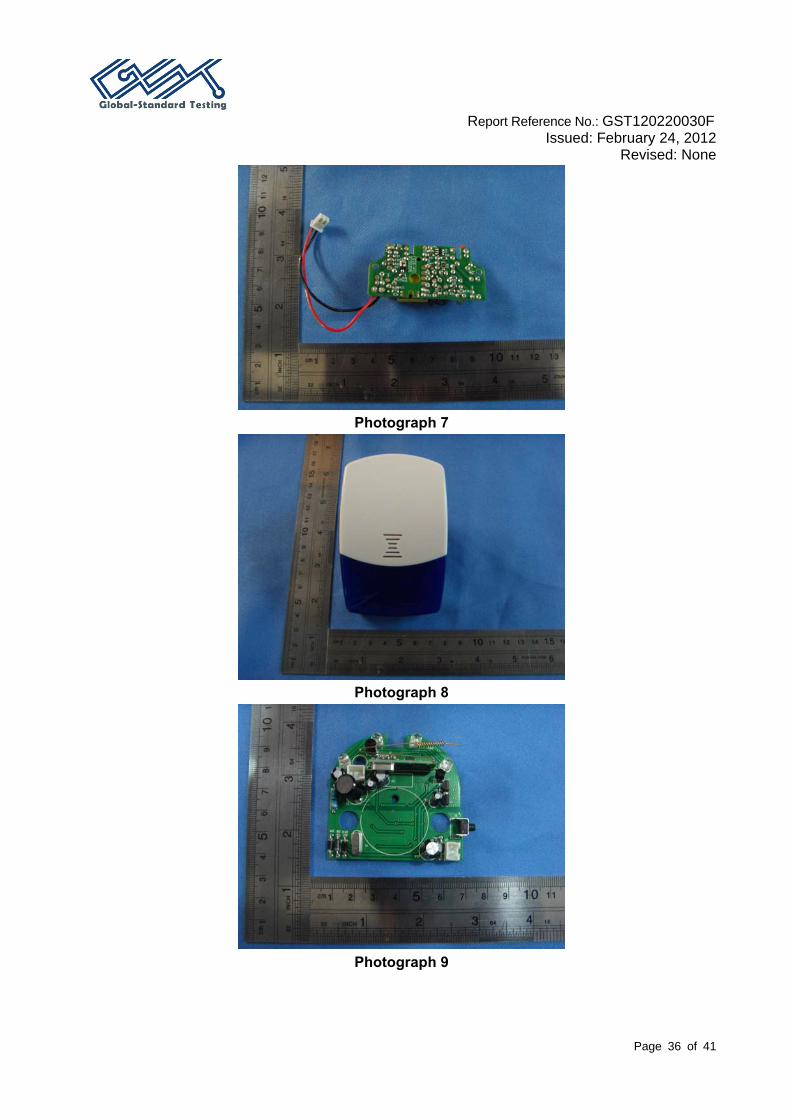
Photograph 7
Photograph 8
Photograph 9
Report Reference No.: GST120220030F
Issued: February 24, 2012 Revised: None
Page 37 of 41
Photograph 10
Photograph 11
Photograph 12
Report Reference No.: GST120220030F
Issued: February 24, 2012 Revised: None
Page 38 of 41
Photograph 13
Photograph 14
Photograph 15
Report Reference No.: GST120220030F
Issued: February 24, 2012 Revised: None
Page 39 of 41
Photograph 16
Photograph 17
Photograph 18

Report Reference No.: GST120220030F
Issued: February 24, 2012 Revised: None
Page 40 of 41
Photograph 19

Report Reference No.: GST120220030F
Issued: February 24, 2012 Revised: None
Page 41 of 41
EXHIBIT B – TEST SETUP PHOTOGRAPHS
Radiated Emissions - below 1 GHz
Radiated Emissions - above 1 GHz
END.
Related Documents