Citation: Jabal-Uriel, C.; Barrios, L.; Bonjour-Dalmon, A.; Caspi-Yona, S.; Chejanovsly, N.; Erez, T.; Henriques, D.; Higes, M.; Le Conte, Y.; Lopes, A.R.; et al. Epidemiology of the Microsporidium Nosema ceranae in Four Mediterranean Countries. Insects 2022, 13, 844. https:// doi.org/10.3390/insects13090844 Received: 9 August 2022 Accepted: 13 September 2022 Published: 16 September 2022 Publisher’s Note: MDPI stays neutral with regard to jurisdictional claims in published maps and institutional affil- iations. Copyright: © 2022 by the authors. Licensee MDPI, Basel, Switzerland. This article is an open access article distributed under the terms and conditions of the Creative Commons Attribution (CC BY) license (https:// creativecommons.org/licenses/by/ 4.0/). insects Article Epidemiology of the Microsporidium Nosema ceranae in Four Mediterranean Countries Clara Jabal-Uriel 1 , Laura Barrios 2 , Anne Bonjour-Dalmon 3 , Shiran Caspi-Yona 4 , Nor Chejanovsly 5 , Tal Erez 5,6 , Dora Henriques 7,8 , Mariano Higes 1 , Yves Le Conte 3 , Ana R. Lopes 7,8 , Aránzazu Meana 9 , Maria Alice Pinto 7,8 , Maritza Reyes-Carreño 3 , Victoria Soroker 5 and Raquel Martín-Hernández 1,10, * 1 Instituto Regional de Investigación y Desarrollo Agroalimentario y Forestal de Castilla La Mancha (IRIAF), CIAPA de Marchamalo (Guadalajara, Spain), 19180 Marchamalo, Spain 2 Unidad de Estadística, Centro Nacional de Investigaciones Científicas, 28006 Madrid, Spain 3 INRAE, Unité de Recherche Abeilles et Environnement, National Institute for Agricultural, Food and Environmental Research, 84000 Avignon, France 4 Mina and Aberhard Gudman Faculty of Life Sciences, Bar Ilan University, Ramat Gan 5290002, Israel 5 Department of Entomology, Agricultural Research Organization, The Volcani Institute, Rishon LeZion 7505101, Israel 6 Department of Environmental Economics and Management, The Robert H. Smith Faculty of Agriculture, Food and Environment, The Hebrew University of Jerusalem, Jerusalem 7610001, Israel 7 Centro de Investigação de Montanha, Instituto Politécnico de Bragança, 5300-253 Bragança, Portugal 8 Laboratório Associado Para a Sustentabilidade e Tecnologia em Regiões de Montanha (SusTEC), Instituto Politécnico de Bragança, Campus de Santa Apolónia, 5300-253 Bragança, Portugal 9 Departamento de Sanidad Animal, Facultad de Veterinaria, Universidad Complutense, 28040 Madrid, Spain 10 Instituto de Recursos Humanos para la Ciencia y la Tecnología, Fundación Parque Científico y Tecnológico de Castilla-La Mancha, 02006 Albacete, Spain * Correspondence: [email protected]; Tel.: +34-949888855 Simple Summary: Nosema ceranae is a highly prevalent intracellular parasite of honey bees’ midgut worldwide. There is a lack of studies addressing the influence of climatic and beekeeping factors on the dynamics of its infection. A long-term study has been carried out in six apiaries in four Mediterranean countries (France, Israel, Portugal, and Spain), monitoring a total of 103 colonies. The lowest prevalence of infection was observed in mainland France, while the highest percentage of infected honey bees per colony was detected in Israel. The location and beekeeping management were shown to influence the infection levels. The percentage of infected honey bees negatively affected the colony strength in the apiaries located in Spain and mainland Portugal, whereas queen replacement had a positive effect on these same apiaries, reducing infection levels. The highest colony losses occurred in mainland France, which had the lowest levels of N. ceranae. It was followed by Spain, an apiary with high levels of N. ceranae, so no correlation between infection and mortality could be established. These results suggest that complementary studies on interactions with other pathogens and honey bee genetics are needed in order to develop management strategies for its control. Abstract: Nosema ceranae is a highly prevalent intracellular parasite of honey bees’ midgut worldwide. This Microsporidium was monitored during a long-term study to evaluate the infection at apiary and intra-colony levels in six apiaries in four Mediterranean countries (France, Israel, Portugal, and Spain). Parameters on colony strength, honey production, beekeeping management, and climate were also recorded. Except for São Miguel (Azores, Portugal), all apiaries were positive for N. ceranae, with the lowest prevalence in mainland France and the highest intra-colony infection in Israel. A negative correlation between intra-colony infection and colony strength was observed in Spain and mainland Portugal. In these two apiaries, the queen replacement also influenced the infection levels. The highest colony losses occurred in mainland France and Spain, although they did not correlate with the Nosema infection levels, as parasitism was low in France and high in Spain. These results suggest that both the effects and the level of N. ceranae infection depends on location and beekeeping conditions. Further studies on host-parasite coevolution, and perhaps the interactions with other pathogens and the role of honey bee genetics, could assist in understanding the difference between nosemosis disease and infection, to develop appropriate strategies for its control. Insects 2022, 13, 844. https://doi.org/10.3390/insects13090844 https://www.mdpi.com/journal/insects

Welcome message from author
This document is posted to help you gain knowledge. Please leave a comment to let me know what you think about it! Share it to your friends and learn new things together.
Transcript

Citation: Jabal-Uriel, C.; Barrios, L.;
Bonjour-Dalmon, A.; Caspi-Yona, S.;
Chejanovsly, N.; Erez, T.; Henriques,
D.; Higes, M.; Le Conte, Y.; Lopes,
A.R.; et al. Epidemiology of the
Microsporidium Nosema ceranae in
Four Mediterranean Countries.
Insects 2022, 13, 844. https://
doi.org/10.3390/insects13090844
Received: 9 August 2022
Accepted: 13 September 2022
Published: 16 September 2022
Publisher’s Note: MDPI stays neutral
with regard to jurisdictional claims in
published maps and institutional affil-
iations.
Copyright: © 2022 by the authors.
Licensee MDPI, Basel, Switzerland.
This article is an open access article
distributed under the terms and
conditions of the Creative Commons
Attribution (CC BY) license (https://
creativecommons.org/licenses/by/
4.0/).
insects
Article
Epidemiology of the Microsporidium Nosema ceranae in FourMediterranean CountriesClara Jabal-Uriel 1, Laura Barrios 2, Anne Bonjour-Dalmon 3 , Shiran Caspi-Yona 4, Nor Chejanovsly 5 ,Tal Erez 5,6, Dora Henriques 7,8, Mariano Higes 1 , Yves Le Conte 3 , Ana R. Lopes 7,8 , Aránzazu Meana 9,Maria Alice Pinto 7,8 , Maritza Reyes-Carreño 3, Victoria Soroker 5 and Raquel Martín-Hernández 1,10,*
1 Instituto Regional de Investigación y Desarrollo Agroalimentario y Forestal de Castilla La Mancha (IRIAF),CIAPA de Marchamalo (Guadalajara, Spain), 19180 Marchamalo, Spain
2 Unidad de Estadística, Centro Nacional de Investigaciones Científicas, 28006 Madrid, Spain3 INRAE, Unité de Recherche Abeilles et Environnement, National Institute for Agricultural, Food and
Environmental Research, 84000 Avignon, France4 Mina and Aberhard Gudman Faculty of Life Sciences, Bar Ilan University, Ramat Gan 5290002, Israel5 Department of Entomology, Agricultural Research Organization, The Volcani Institute,
Rishon LeZion 7505101, Israel6 Department of Environmental Economics and Management, The Robert H. Smith Faculty of Agriculture,
Food and Environment, The Hebrew University of Jerusalem, Jerusalem 7610001, Israel7 Centro de Investigação de Montanha, Instituto Politécnico de Bragança, 5300-253 Bragança, Portugal8 Laboratório Associado Para a Sustentabilidade e Tecnologia em Regiões de Montanha (SusTEC), Instituto
Politécnico de Bragança, Campus de Santa Apolónia, 5300-253 Bragança, Portugal9 Departamento de Sanidad Animal, Facultad de Veterinaria, Universidad Complutense, 28040 Madrid, Spain10 Instituto de Recursos Humanos para la Ciencia y la Tecnología, Fundación Parque Científico y Tecnológico de
Castilla-La Mancha, 02006 Albacete, Spain* Correspondence: [email protected]; Tel.: +34-949888855
Simple Summary: Nosema ceranae is a highly prevalent intracellular parasite of honey bees’ midgutworldwide. There is a lack of studies addressing the influence of climatic and beekeeping factorson the dynamics of its infection. A long-term study has been carried out in six apiaries in fourMediterranean countries (France, Israel, Portugal, and Spain), monitoring a total of 103 colonies. Thelowest prevalence of infection was observed in mainland France, while the highest percentage ofinfected honey bees per colony was detected in Israel. The location and beekeeping management wereshown to influence the infection levels. The percentage of infected honey bees negatively affected thecolony strength in the apiaries located in Spain and mainland Portugal, whereas queen replacementhad a positive effect on these same apiaries, reducing infection levels. The highest colony lossesoccurred in mainland France, which had the lowest levels of N. ceranae. It was followed by Spain,an apiary with high levels of N. ceranae, so no correlation between infection and mortality could beestablished. These results suggest that complementary studies on interactions with other pathogensand honey bee genetics are needed in order to develop management strategies for its control.
Abstract: Nosema ceranae is a highly prevalent intracellular parasite of honey bees’ midgut worldwide.This Microsporidium was monitored during a long-term study to evaluate the infection at apiaryand intra-colony levels in six apiaries in four Mediterranean countries (France, Israel, Portugal, andSpain). Parameters on colony strength, honey production, beekeeping management, and climatewere also recorded. Except for São Miguel (Azores, Portugal), all apiaries were positive for N. ceranae,with the lowest prevalence in mainland France and the highest intra-colony infection in Israel. Anegative correlation between intra-colony infection and colony strength was observed in Spain andmainland Portugal. In these two apiaries, the queen replacement also influenced the infection levels.The highest colony losses occurred in mainland France and Spain, although they did not correlatewith the Nosema infection levels, as parasitism was low in France and high in Spain. These resultssuggest that both the effects and the level of N. ceranae infection depends on location and beekeepingconditions. Further studies on host-parasite coevolution, and perhaps the interactions with otherpathogens and the role of honey bee genetics, could assist in understanding the difference betweennosemosis disease and infection, to develop appropriate strategies for its control.
Insects 2022, 13, 844. https://doi.org/10.3390/insects13090844 https://www.mdpi.com/journal/insects
Insects 2022, 13, 844 2 of 18
Keywords: climate; beekeeping management; honeybee; parasitism; Apis mellifera; colony losses
1. Introduction
The conservation of the abundance and diversity of insect pollinators is a decisiveaction to avoid the negative impact that the lack of these insects can have on agriculture,food production and security, and environmental sustainability. In this regard, managedhoney bees are a suitable species that can easily be located in areas where they serve as acentral pollination structure for a wide range of crops and a variety of wild flowers, which,in their absence, are not sustainable [1,2].
During the last few decades, there has been an alarming increase in honey bee colonylosses where pathogens like Varroa destructor mites, the Microsporidia Nosema spp. andviruses contribute actively [3–6]. Pathogen spread within honey bee colonies is a dynamicprocess and is sometimes the result of the invasion of a new virulent pathogen and/or thecombination with other pathogens and parasites that may be present in the colony [7–9].
Two Nosema species have been identified as honey bee pathogens: Nosema apisand Nosema ceranae, and nowadays, both species infect Apis mellifera colonies worldwide.However, N. ceranae is the species that has become one of the most prevalent honey beepathogens globally [10–12]. This microsporidium is an obligate intracellular parasite ofthe ventricular cells of honey bees [13] and it is implicated in honey bee colony losses insome regions, especially in warm areas [12,14–18], probably due to the higher resistanceof N. ceranae spores to heat and desiccation [19]. In A. mellifera honey bees, infectionby this microsporidium induces damage to the ventriculus (midgut), which is the mainsite of nutrient absorption of the digestive tract and the target tissue of this pathogen.In this tissue, the infection causes degeneration of the epithelial cells, which are full ofmicrosporidia in different stages of development (i.e., meronts, sporonts, sporoblasts, andspores), causing the weakening and death of infected honey bees [13,14]. In fact, theinfection has been reported to shorten the lifespan [20–22], induce oxidative stress andchanges in the metabolism and hormonal regulation of the honey bee host [21,23], orimmune modulation [24–27], among other effects.
The prevalence of N. ceranae varies widely among locations. A common feature isthat this pathogen is widely distributed regardless of the climatic conditions, rangingfrom desert climates [28–30] to very cold ones [31,32]. In some areas, this microsporid-ium is present in more than 50% of the colonies sampled [18,33–39], whereas in othersthe prevalence is lower than that percentage [40,41]. However, most studies consist ofoccasional surveys to determine the prevalence of infected colonies at a specific point intime [18,32,37,38,40,42–46]. Other studies carried out longitudinal surveys to determinethe prevalence in selected apiaries and how it fluctuates across the study period. Thefindings varied among the studies, with countries such as Serbia [35], Germany [47], orNew Zealand [48] showing a higher prevalence in spring and Uruguay showing a higherprevalence from the beginning of the winter until the end of the spring [49].
The prevalence of infection varies among colonies, and it is unclear how climateand beekeeping management affect the development of the pathogen and the resultantdisease. Although variations at colony or apiary level throughout the year have beenreported occasionally [14,50], comparisons among studies are difficult due to the diversesampling and methodology employed, which hinder understanding of the true impact thatclimatic factors and beekeeping management have on the infection. Therefore, long-termresearch conducted using standardized protocols is needed to investigate these issues.To that end, this study aimed to compare Nosema spp. infection and its development inapiaries with very different climates and beekeeping practices during a 2-year period infour Mediterranean countries.

Insects 2022, 13, 844 3 of 18
2. Materials and Methods2.1. Study Design
The study was carried out simultaneously in four Mediterranean countries: Portugal,Spain, France, and Israel. Six apiaries were selected to conduct the survey, namely, fourlocations where V. destructor is present, including CIAPA (Spain), INRAE (France), ARO(Israel), and CIMO (Portugal), and two others where V. destructor was absent, includingthe Ouessant (OUE, France) [51,52] and the São Miguel (SMI, Azores, Portugal) [53,54]islands. The exact locations of the apiaries and the total number of colonies involved in thestudy are shown in Figure 1 and Table 1. All colonies were prescreened to detect N. ceranaeas described later. All the apiaries except São Miguel contained positive colonies at thebeginning of the study. The São Miguel apiary was negative, although there is a history ofN. ceranae presence on the island [55].
Insects 2022, 13, x FOR PEER REVIEW 3 of 19
disease. Although variations at colony or apiary level throughout the year have been re-
ported occasionally [14,50], comparisons among studies are difficult due to the diverse
sampling and methodology employed, which hinder understanding of the true impact
that climatic factors and beekeeping management have on the infection. Therefore, long-
term research conducted using standardized protocols is needed to investigate these is-
sues. To that end, this study aimed to compare Nosema spp. infection and its development
in apiaries with very different climates and beekeeping practices during a 2-year period
in four Mediterranean countries.
2. Materials and Methods
2.1. Study Design
The study was carried out simultaneously in four Mediterranean countries: Portugal,
Spain, France, and Israel. Six apiaries were selected to conduct the survey, namely, four
locations where V. destructor is present, including CIAPA (Spain), INRAE (France), ARO
(Israel), and CIMO (Portugal), and two others where V. destructor was absent, including
the Ouessant (OUE, France) [51,52] and the São Miguel (SMI, Azores, Portugal) [53,54]
islands. The exact locations of the apiaries and the total number of colonies involved in
the study are shown in Figure 1 and Table 1. All colonies were prescreened to detect N.
ceranae as described later. All the apiaries except São Miguel contained positive colonies
at the beginning of the study. The São Miguel apiary was negative, although there is a
history of N. ceranae presence on the island [55].
Figure 1. Apiary locations: Bragança, Portugal (CIMO), Fuente la Higuera, Spain (CIAPA), Avignon,
France (INRAE), Zrifin, Israel (ARO), Ouessant Island, France (OUE), and São Miguel Island,
Azores, Portugal (SMI). Red—V. destructor present, Green—V. destructor absent.
Table 1. Location of the apiaries, number of colonies (N = 103) and mitochondrial DNA (MtDNA)
lineages of honey bees.
Country Apiary Name Coordinates
(Latitude/Longitude) Locality
Total No.
Colonies per Apiary MtDNA Lineages 1 [56]
Spain CIAPA 40.751389/−3.303889 Fuente la Higuera de Al-
batages 22 A and M
France INRAE 43.946941/4.862223 Avignon 21 C
France OUE 48.477008/−5.067211 Cadoran 11 M
Israel ARO 31.966979/34.843588 Zrifin 24 C
Portugal CIMO 41.808791/−6.711865 Bragança 15 A and M
Portugal SMI 37.752648/−25.588381 Ribeira do
Guilherme 10 A
1 A–African lineage; M–western European lineage; C–eastern European lineage.
Figure 1. Apiary locations: Bragança, Portugal (CIMO), Fuente la Higuera, Spain (CIAPA), Avignon,France (INRAE), Zrifin, Israel (ARO), Ouessant Island, France (OUE), and São Miguel Island, Azores,Portugal (SMI). Red—V. destructor present, Green—V. destructor absent.
Table 1. Location of the apiaries, number of colonies (n = 103) and mitochondrial DNA (MtDNA)lineages of honey bees.
Country Apiary Name Coordinates(Latitude/Longitude) Locality Total No.
Colonies per Apiary MtDNA Lineages 1 [56]
Spain CIAPA 40.751389/−3.303889 Fuente la Higuerade Albatages 22 A and M
France INRAE 43.946941/4.862223 Avignon 21 CFrance OUE 48.477008/−5.067211 Cadoran 11 MIsrael ARO 31.966979/34.843588 Zrifin 24 C
Portugal CIMO 41.808791/−6.711865 Bragança 15 A and M
Portugal SMI 37.752648/−25.588381 Ribeira doGuilherme 10 A
1 A–African lineage; M–western European lineage; C–eastern European lineage.
The colonies of the six apiaries were monitored for 20 months. Samplings startedin February 2018 and ended in October 2019. On the islands (OUE and SMI), samplingstarted later in April 2018 due to weather conditions. Samplings were carried out everytwo months, except for December 2018 in most locations, due to the low temperatures.Colonies that died during the 20-month sampling period were replaced by spare coloniesthat were kept in the monitored apiaries under identical conditions (except in ARO) fromthe onset of the study.

Insects 2022, 13, 844 4 of 18
2.2. Detection of N. ceranae Infection
In each sampling, adult workers were collected from each colony by brushing offthe first comb with no brood surface from the brood chamber. This procedure was doneto avoid collecting newborn workers. Samples were taken to the laboratory and kept at−80 ◦C for further analysis. All the apiaries were sampled using the same standardizedprotocol to allow comparisons.
The Nosema spp. infection was determined at apiary and intra-colony levels. At theapiary level, the presence of N. ceranae was determined for each colony from 60 adultworkers that were processed as a pool. The pools prepared from each colony were placedin a sterile container (tubes or bags with a filter) and 15 mL or 6 mL of RNase-free waterwere added, respectively. The pools were homogenized using Stomacher® (Qiagen, Hilden,Germany) and 180 µL of the macerates were transferred to 96-well plates (Qiagen, Hilden,Germany). The plates were shaken two times in a Tissuelyser (Qiagen, Hilden, Germany)for 1 min at 30 Hz, changing position between shacking rounds, followed by a shortcentrifugation. At ARO, the homogenization was performed with 50 mL tubes via Geno-grinderTM at 1550 rpm for 3 min, followed by a spin at 800 rpm 4 ◦C for 2 min. Afterwards,50 µL of each homogenate was transferred to a 96-well plate, mixed with 50 µL TE buffer,and incubated at 95 ◦C for 20 min following the protocol [57] with a slight modificationwithout the addition of Proteinase K [57].
At the intra-colony level, the prevalence of N. ceranae (percentage of bees infected percolony) was determined by individually analyzing 25 workers per colony, as describedpreviously [14], which allowed us to establish the detection threshold at 4% (1 workerpositive out of 25). Each worker was placed in a well of a 96-deep well plate with 500 µL ofnuclease-free water and two steel beads. The plates were homogenized in a Tissuelyser(Qiagen, Hilden, Germany) for 1 min at 30 Hz four times or spun at 800 rpm 4 ◦C for 2 minin ARO. DNA extraction was performed in 50 µL of each homogenate, as explained above.
All PCRs were done as multiplex reactions with primers that allow for the detectionof N. ceranae, N. apis, and an A. mellifera internal control (COI) in the laboratories of CIAPA(Spanish and Portuguese samples), INRAE (French samples), and ARO (Israeli samples)using a harmonized protocol [33]. PCR amplicons were revealed by agarose gels (Frenchand Israeli samples) or by using the QIAxpert system (Spanish and Portuguese samples).Standard controls (Nosema spp. DNA and spores) were prepared by CIAPA and sharedwith INRAE and ARO to assure that the same specificity and sensitivity level were reachedat the different facilities.
2.3. Beekeeping and Climatic Conditions
On every bimonthly visit to the apiary to collect samples, the colonies were inspectedusing the same standardized protocol and forms across countries to allow comparisons.Colony mortality, colony strength, colony management, the presence of pathogens (includ-ing Varroa levels and brood diseases), and control treatments were recorded. Assessmentof colony strength was based on the type of hive, the number of combs covered by bees inthe nest and supers, and the number of combs with brood. The percentage of area coveredby honey bees was recorded on each side of the combs. Data were converted to the numberof honey bees per colony, as indicated in the BEEBOOK [58]. In each brood comb, the area(in percentage) occupied by brood was visually estimated, and the quality of the broodwas inspected for the presence of brood diseases. At every sampling date, the presenceof the queen (color marked) was checked and, when the queen was not observed, thepresence of recently laid eggs was verified. The presence of an unmarked queen in thecolony was interpreted as a new queen born after a natural replacement, which was markedin situ according to the accepted international color code. Colony management consistedof recording any activity done. At the ARO apiary, a specific management of colonies wasconducted in October–November 2018, in which all the queens were replaced by youngmated queens and colonies were balanced through the exchange of brood combs and

Insects 2022, 13, 844 5 of 18
adults among the colonies of the apiary. Consequently, all colonies in 2019 were considerednew ones.
In each apiary, the percentage of V. destructor infestation was determined duringeach sampling by using the sugar powder test, counting mite falls on 300 honeybees(limit of detection 0.3%) [59]. Additionally, V. destructor was controlled following nationalregulations (except in OUE and SMI, which were mite-free). In INRAE, two amitraz strips(Apivar®) as active ingredient (a.i.) per hive were used at the end of September each year. InARO, 2–3 amitraz strips (Galvitraz®) per hive were applied in July and December each year.In CIMO and CIAPA, two amitraz strips (Apivar® in 2018 and Apitraz® in 2019) per hivewere used in March and September 2018 and July 2019 (CIMO) or September 2019 (CIAPA);in March 2019, colonies were treated with thymol as a.i. using ApiLifeVar® (CIMO) orApiguard® (CIAPA).
The presence of other pathogens in the colonies was inspected to detect any clinicalsigns of adult or brood diseases and was recorded in case of detection.
In addition, honey production was recorded annually by differences in the weightof honey combs from supers before and after honey extraction. The weather conditionswere also recorded throughout the study by using meteorological stations in the mainlandapiaries. Parameters recorded were mean, maximum, and minimum temperatures (◦C);mean, maximum, and minimum relative humidity (%); mean wind speed (m/s); days withmean wind speed ≥6.4 m/s; and height of precipitation (mm).
2.4. Statistical Analysis
To determine whether there were any significant differences in the number of coloniesinfected by N. ceranae per apiary, all data from each site were analyzed together (cross-tabs,chi-square, with Monte Carlo correction, p < 0.0001). Differences in the intra-colony preva-lence (percentage of honey bees infected per colony) among apiaries were analyzed byANOVA. Homogeneity of variances was determined with a Levene test, and a post-hocGames Howell or a Bonferroni test (depending on whether the variances were homoge-neous or not) were used to compare among apiaries and/or sampling dates within theapiary. A Rho Spearman test was used to determine the correlation between the intra-colonyinfection level and the Varroa levels, the meteorological data, the colony strength data,and the honey production. The relationship between the levels of N. ceranae intra-colonyinfection in the colonies that replaced the queen or not was assessed using a Mann–WhitneyU test. All p-values < 0.05 were considered significant, and all statistical analyses werecarried out using the IBM SPSS Statistics V24 software by the Statistics Unit of the ScientificComputing Area at the SGAI-CSIC (Madrid, Spain).
3. Results3.1. Nosema spp. Infection at the Apiary Level
Data on Nosema spp. infection was obtained from 103 colonies established at thebeginning of the study (Table 1). The total number of colonies analyzed for each samplinground is shown in Table 2. As stated above, some colonies were added to replace thelosses in order to monitor a sufficient number of colonies. Both N. ceranae and N. apis wereanalyzed in all the apiaries, but the latter was rarely found. Only one colony was positivefor N. apis in April 2018 at the CIAPA, and therefore the following analyses were onlyperformed on N. ceranae.

Insects 2022, 13, 844 6 of 18
Table 2. Percentage of colonies positive for N. ceranae per sampling and apiary and number of positivecolonies out of sampled colonies in parenthesis. SMI had 10 colonies where Nosema spp. were neverdetected. ND: Not detected.
2018 2019
February April June August October February April June August October
CIAPA 100.00(15/15)
100.00(22/22)
95.24(20/21)
100.00(17/17)
100.00(16/16)
100.00(16/16)
100.00(16/16)
100.00(14/14)
100.00(13/13)
100.00(13/13)
INRAE 1 7.69(1/13)
66.67(4/6)
14.29(1/7)
50.00(5/10)
22.22(2/9)
6.67(1/15)
ND(0/14)
20.00(3/15)
60.00(9/15)
20.00(3/15)
OUE - 100.00(10/10)
100.00(10/10)
100.00(10/10)
90.00(9/10) - 30.00
(3/10)100.00
(10/10)80.00
(8/10)40.00
(4/10)
ARO 100.00(14/14)
100.00(14/14)
100.00(13/13) - 100.00
(9/9)100.00
(12/12)91.00
(10/11)100.00
(11/11) - 100.00(10/10)
CIMO 100.00(15/15)
100.00(15/15)
100.00(15/15)
86.67(13/15)
86.67(13/15)
100.00(12/12)
100.00(12/12)
63.64(7/11)
100.00(11/11)
54.55(6/11)
1 Only data from colonies from which it was possible to collect samples are shown. Data not available.
Most colonies were positive for N. ceranae in all apiaries throughout the study excepton SMI, where no colony was positive. When we jointly analyzed all the data of infectedcolonies per apiary, the number of N. ceranae-positive colonies varied significantly amongthe apiaries (chi-square with Monte Carlo correction, p < 0.0001). All the colonies locatedin the CIAPA, ARO, and CIMO apiaries were positive for N. ceranae at the onset of thestudy and remained so nearly across the entire study period (February 2018–October 2019),and only on rare occasions, the microsporidium was not detected (Table 2). In contrast,N. ceranae was not detected in most of the INRAE colonies at the onset of the study, al-though the number of positive colonies increased in the following samplings, up to 66.67%in April 2018. From this moment on, the number of positive colonies was below 23%,except in August in both sampling years (50% and 60%, respectively). In the case of theOUE apiary, an intermediate pattern was observed, as all the colonies were positive atthe beginning of the study and this was maintained during the first year with a low de-crease (90% in October 2018), while in the second year, the number of N. ceranae-negativecolonies decreased.
3.2. N. ceranae Infection at Intra-Colony Level
A total of 13,907 individual honey bees were screened for N. ceranae during the study(Table 3). The percentage of infected honey bees per colony (intra-colony prevalence) wasalso significantly (ANOVA; p < 0.0001) different among apiaries (Figure 2) and it variedacross time (Figure 2), especially in ARO and CIMO. ARO had the highest mean prevalence(Table 3; Figure 2), with 32.39%, and it was significantly different from the other apiaries(Games–Howell test; p < 0.0001). ARO was followed by CIMO (17.17%), CIAPA (13.30%),and OUE (11.11%), and these three apiaries were not significantly different from each other(Games–Howell test; p > 0.05). Finally, INRAE had the significantly (Games–Howell test;p < 0.0001) lowest mean level of intra-colony infection (1.37%).
Table 3. Intra-colony prevalence at each apiary. Percentage of N. ceranae infected honey bees percolony during the study. ND: Not detected (<4%).
CIAPA INRAE OUE ARO CIMO SMI
No. bees analysed 4075 2369 1993 1888 3102 480Mean (%) 13.30 1.37 11.11 32.39 17.17 NDStd. Dev. 14.12 3.58 15.49 24.29 17.93 NDMedian 8.00 0.00 4.00 35.00 12.00 NDMax. 96.00 20.00 70.83 90.00 79.17 NDMin. ND ND ND ND ND ND

Insects 2022, 13, 844 7 of 18
Insects 2022, 13, x FOR PEER REVIEW 7 of 19
Table 3. Intra-colony prevalence at each apiary. Percentage of N. ceranae infected honey bees per
colony during the study. ND: Not detected (<4%).
CIAPA INRAE OUE ARO CIMO SMI
No. bees analysed 4075 2369 1993 1888 3102 480
Mean (%) 13.30 1.37 11.11 32.39 17.17 ND
Std. Dev. 14.12 3.58 15.49 24.29 17.93 ND
Median 8.00 0.00 4.00 35.00 12.00 ND
Max. 96.00 20.00 70.83 90.00 79.17 ND
Min. ND ND ND ND ND ND
Figure 2. N. ceranae intra-colony level of infection. Total data per apiary and data per each apiary
and sampling round. Data shows percentage of infected workers. Black line represents the median,
while the box represents 50% of observations. Outliers are shown as dots and asterisks.
Regarding N. apis, only 14 out of the 13,907 honey bees analyzed were positive (two
honey bees in CIAPA and 12 in CIMO), mostly found in coinfection with N. ceranae (12
honey bees coinfected). Thus, the percentage of infection by this species is not included.
In all apiaries, there were colonies with no infected honey bees at some point in time
(Supplementary Table S1). On the other hand, the highest level of infection was detected
in one colony from CIAPA (96%) in April 2018. In this apiary, April was the month with
the highest mean intra-colony prevalence (27.64%; Figure 2, Supplementary Table S1) and
the mean values kept similar and below 16% from that moment on until the end of the
study (October 2019). The colonies of CIMO showed a similar pattern. The maximum level
Figure 2. N. ceranae intra-colony level of infection. Total data per apiary and data per each apiary andsampling round. Data shows percentage of infected workers. Black line represents the median, whilethe box represents 50% of observations. Outliers are shown as dots and asterisks.
Regarding N. apis, only 14 out of the 13,907 honey bees analyzed were positive(two honey bees in CIAPA and 12 in CIMO), mostly found in coinfection with N. ceranae(12 honey bees coinfected). Thus, the percentage of infection by this species is not included.
In all apiaries, there were colonies with no infected honey bees at some point in time(Supplementary Table S1). On the other hand, the highest level of infection was detectedin one colony from CIAPA (96%) in April 2018. In this apiary, April was the month withthe highest mean intra-colony prevalence (27.64%; Figure 2, Supplementary Table S1) andthe mean values kept similar and below 16% from that moment on until the end of thestudy (October 2019). The colonies of CIMO showed a similar pattern. The maximum levelof infection was also found in April 2018 (50%) and it decreased afterwards, maintainingprevalence values below 20% until February 2019 (24.35%), decreasing again (circa 10%)until the end of the study. The ARO apiary exhibited the highest mean intra-colonyprevalence, which was above 30% in all sampling rounds, except between October 2018and April 2019. From that moment on, the prevalence increased gradually, reaching thehighest levels of infection in October 2019 (56%). The colonies of the OUE apiary startedwith a relatively high percentage of infected honey bees (April and June 2018, >20%),decreasing thereafter to remain at levels below 10% until the end of the study. The intra-colony prevalence in INRAE showed the lowest levels of infection throughout the entirestudy period, with no significant differences among the samplings, as the mean valueswere below 2% in most of the samplings, and only in June and August 2019 did it increaseto 4%. The highest value (20%) was found in one colony in June 2019 and it became underthe detection level in the following sampling round. The SMI was in stark contrast to theremaining apiaries, as no honey bees were detected as positive. The full set of results onthe significant differences in the percentage of infected bees for each sampling round andapiary can be found in the Supplementary Table S2.

Insects 2022, 13, 844 8 of 18
3.3. Varroa Destructor Levels
A Varroa test was performed only in the apiaries of CIMO, CIAPA, INRAE, and AROas the islands of SMI and OUE were mite free. The infestation levels differed amongapiaries, with the highest mean percentage found in CIMO (1.09%) and ARO (0.9%), andthe lowest in CIAPA (0.18%; Table 4). It should be noted that, except for CIAPA, themaximum levels of Varroa were over 9% at INRA, ARO, and CIMO but in just one colonyat each apiary. However, only 36 samples, out of the 419 analyzed, exceeded 2% (11 fromINRA, 12 from ARO, and 13 from CIMO).
Table 4. Statistics for the percentage of Varroa destructor in 300 honey bees per apiary across samplingrounds (n = 419). Islands are not included as they were the mite free.
Apiary CIAPA INRA ARO CIMO
N 132 102 81 104Mean 0.18% 0.71% 0.9% 1.09%
Std. Dev. 0.54 1.58 1.71 1.73Min. 0% 0% 0% 0%Max. 3.7% 9.7% 9.61% 9.61%
There was a positive correlation between the percentage of Varroa in the colony andthe N. ceranae intra-colony infection level (Spearman’s Rho, 2-tailed; p < 0.005), when allthe data were analyzed together. This correlation was maintained in the INRAE and AROapiaries when analyzed separately (Spearman’s Rho, 2-tailed; p < 0.005) whereas in theCIMO and CIAPA apiaries, there was no correlation.
3.4. Climatic Conditions and N. ceranae Infection
The ARO apiary was located in the warmest region with the highest mean temperature(22.16 ◦C) and mean relative humidity (67.17%). The INRAE apiary exhibited the highestmean precipitation (1.82 mm), whereas CIMO showed the highest mean wind speed(6.25 m/s) of all the studied apiaries (Figure 3; Supplementary Table S3).
Insects 2022, 13, x FOR PEER REVIEW 9 of 19
CIMO and INRAE apiaries, and this correlation could not be confirmed at the other loca-
tions.
Figure 3. Representation of N. ceranae infection levels (percentage of infected honey bees) per apiary
and sampling round in relation to the mean temperature (°C) and the mean relative humidity (%).
When the mean temperature and mean relative humidity were represented together
in relation to the N. ceranae infection levels, the highest levels were found at the highest
mean temperature and mean relative humidity of over 65% (Figure 3). These values match
the ARO apiary, which exhibited N. ceranae infection levels significantly higher than in
the other apiaries (Games–Howell test; p < 0.0001) (see Section 3.2: N. ceranae infection at
intra-colony level).
3.5. Colony Strenght and N. ceranae Infection Levels
There was considerable variation in colony strength (number of adult honey bees per
colony) both among and within the apiaries (Figure 4). CIAPA exhibited the highest mean
(23,124.16) of colony strength and INRAE, the lowest (10,453.83; Table 5). ARO was the
first apiary where the population began to increase in spring, reaching maximum values
in April in both years. This pattern contrasted with that of the other apiaries, where colony
strength peaked in the summer (Figure 4).
Table 5. Estimation of colony strength for each apiary. Values represent an estimation of the number
of honey bee adults.
CIAPA INRAE Ouessant ARO CIMO SMI
No. samples
analyzed 1 163 119 80 107 132 80
Mean 23,124.16 10,453.83 11,778.84 13,352.70 18,717.05 15,870.75
Median 17,850 9808.40 12,610.80 13,078.13 16,590.00 16,800.00
Std. Dev. 18,946.79 4609.50 2238.07 4984.24 13,069.74 8216.15
Minimum 1050 2802 7006 5231 2100 6300
Maximum 91,560 32,386 14,012 22,494 60,060 33,600 1 Samples correspond to colonies analyzed across sampling rounds.
Figure 3. Representation of N. ceranae infection levels (percentage of infected honey bees) per apiaryand sampling round in relation to the mean temperature (◦C) and the mean relative humidity (%).
The analysis between the mean percentage of intra-colony infection per apiary acrosssamplings and the climatic conditions (monthly means) did not show significant correla-tions with the recorded parameters (Spearman’s Rho, 2-tailed; p > 0.05). Only the number ofdays with a wind speed higher than 6.4 m/s was positively correlated with N. ceranae levels(Spearman’s Rho, 2-tailed; p < 0.005), which could be related with to number of days thathoney bees are inside the colony. However, these data were only recorded for the CIMOand INRAE apiaries, and this correlation could not be confirmed at the other locations.
Insects 2022, 13, 844 9 of 18
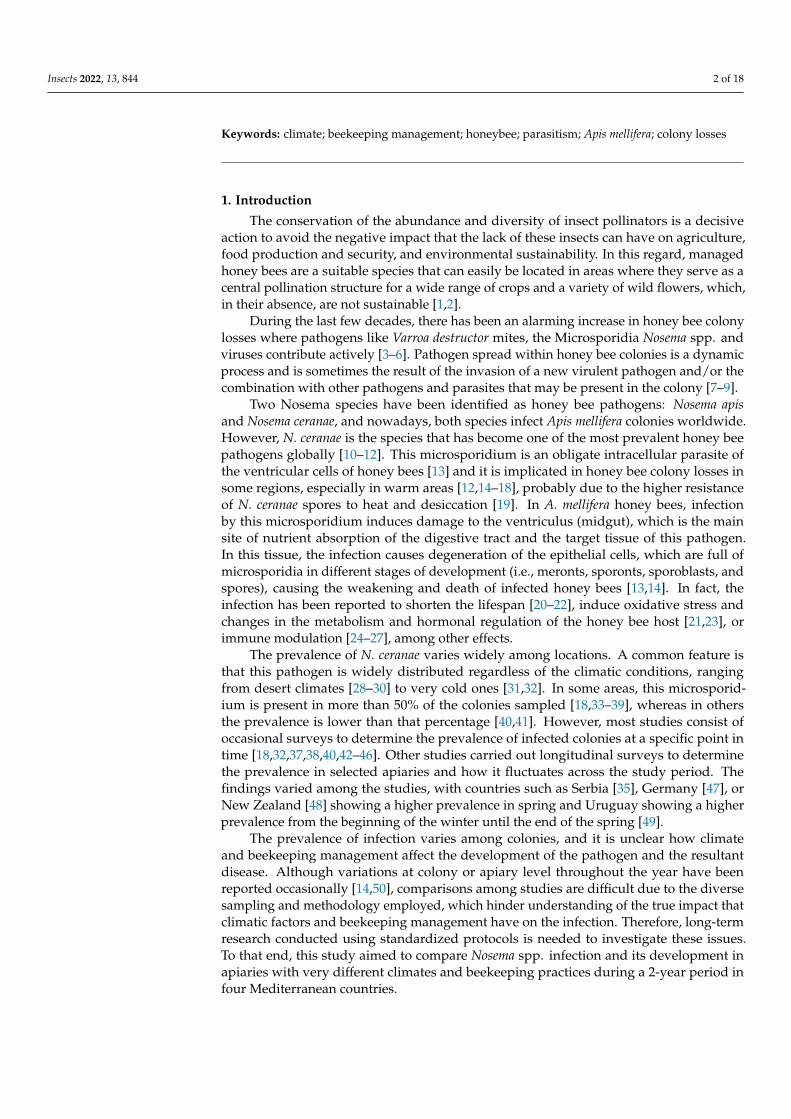
When the mean temperature and mean relative humidity were represented togetherin relation to the N. ceranae infection levels, the highest levels were found at the highestmean temperature and mean relative humidity of over 65% (Figure 3). These values matchthe ARO apiary, which exhibited N. ceranae infection levels significantly higher than inthe other apiaries (Games–Howell test; p < 0.0001) (see Section 3.2: N. ceranae infection atintra-colony level).
3.5. Colony Strenght and N. ceranae Infection Levels
There was considerable variation in colony strength (number of adult honey bees percolony) both among and within the apiaries (Figure 4). CIAPA exhibited the highest mean(23,124.16) of colony strength and INRAE, the lowest (10,453.83; Table 5). ARO was thefirst apiary where the population began to increase in spring, reaching maximum values inApril in both years. This pattern contrasted with that of the other apiaries, where colonystrength peaked in the summer (Figure 4).
Table 5. Estimation of colony strength for each apiary. Values represent an estimation of the numberof honey bee adults.
CIAPA INRAE Ouessant ARO CIMO SMI
No. samples analyzed 1 163 119 80 107 132 80Mean 23,124.16 10,453.83 11,778.84 13,352.70 18,717.05 15,870.75
Median 17,850 9808.40 12,610.80 13,078.13 16,590.00 16,800.00Std. Dev. 18,946.79 4609.50 2238.07 4984.24 13,069.74 8216.15
Minimum 1050 2802 7006 5231 2100 6300Maximum 91,560 32,386 14,012 22,494 60,060 33,600
1 Samples correspond to colonies analyzed across sampling rounds.Insects 2022, 13, x FOR PEER REVIEW 10 of 19
Figure 4. Mean percentage of N. ceranae infection (grey columns) and mean colony strength and
standard deviation (black line) per apiary during the study period. Colony strength is represented
in number of honeybees (thousands). In OUE and ARO, there was no data collection in February
and August, respectively, due to weather conditions.
Colony strength, estimated at each sampling round, was analyzed to determine if
there was a relationship with the percentage of honey bees infected by N. ceranae (Figure
4). When the data generated for each apiary were analyzed altogether, there was a positive
correlation (r = 0.179) between the two variables (Spearman’s Rho; p < 0.0001). However,
when the analysis was done individually for each apiary, a different pattern was ob-
served. While in the CIAPA and CIMO apiaries, a significant negative correlation (r =
−0.299 and r = −0.257, respectively) between the percentage of N. ceranae infection and col-
ony strength was observed (Spearman’s Rho; p < 0.01), and in INRAE and OUE, the cor-
relation was positive (Spearman Rho; r = 0.252 and r = 0.299, respectively; p < 0.01). In
ARO, the correlation was not significant, although the trend was negative as in CIAPA
and CIMO (Spearman’s Rho; p > 0.05). SMI was not included in the analysis because N.
ceranae was not detected in any colony across time.
Figure 4. Mean percentage of N. ceranae infection (grey columns) and mean colony strength and standarddeviation (black line) per apiary during the study period. Colony strength is represented in number of
Insects 2022, 13, 844 10 of 18
honeybees (thousands). In OUE and ARO, there was no data collection in February and August,respectively, due to weather conditions.
Colony strength, estimated at each sampling round, was analyzed to determine ifthere was a relationship with the percentage of honey bees infected by N. ceranae (Figure 4).When the data generated for each apiary were analyzed altogether, there was a positivecorrelation (r = 0.179) between the two variables (Spearman’s Rho; p < 0.0001). However,when the analysis was done individually for each apiary, a different pattern was observed.While in the CIAPA and CIMO apiaries, a significant negative correlation (r = −0.299and r = −0.257, respectively) between the percentage of N. ceranae infection and colonystrength was observed (Spearman’s Rho; p < 0.01), and in INRAE and OUE, the correlationwas positive (Spearman Rho; r = 0.252 and r = 0.299, respectively; p < 0.01). In ARO, thecorrelation was not significant, although the trend was negative as in CIAPA and CIMO(Spearman’s Rho; p > 0.05). SMI was not included in the analysis because N. ceranae wasnot detected in any colony across time.
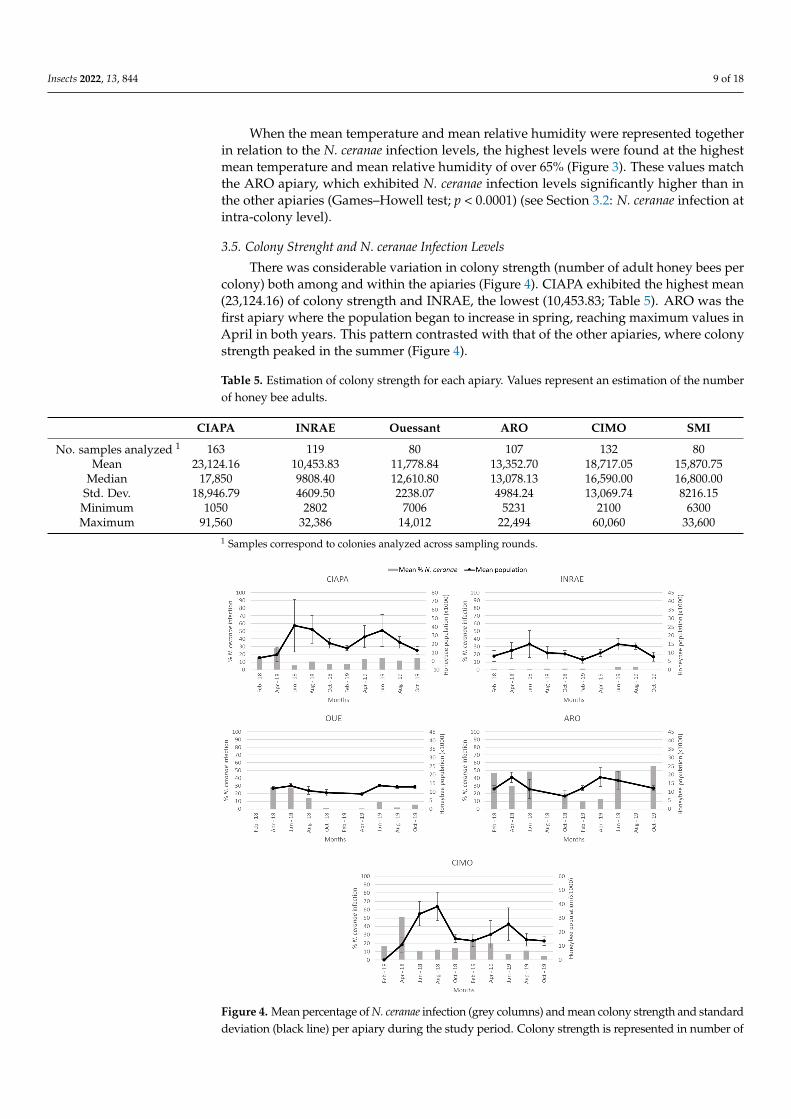
3.6. Honey Production and N. ceranae Infection Levels
The honey production (Kg) per colony was recorded only in the continental apiaries(Table 6). CIMO and CIAPA had the highest mean of honey production (29.30 Kg and27.64 Kg, respectively), followed by ARO (18.15 Kg) and INRAE (9.16 Kg, data availableonly for 2019), which is consistent with colony strength. There was no significant correlationbetween N. ceranae intra-colony infection and honey production (Spearman’s Rho; p > 0.05).
Table 6. Average honey production per colony (in Kg) at each apiary during the study period. Islandsare not included. Data not available.
Apiary No. of Colonies 2018 2019 Total Mean Median Std. Dev. Min. Max.
CIAPA 25 26.7 33.86 29.30 30.03 13.93 6.64 52.94INRAE 15 - 9.16 9.16 9.00 5.78 0.00 17.60ARO 52 17.50 18.93 18.15 18.18 10.62 0.00 35.90
CIMO 29 33.40 21.46 27.64 26.00 18.85 0.00 63.10
3.7. Queen Replacement and N. ceranae Infection Levels
In each sampling round, the presence of the queen was checked. Thus, every queenreplacement was recorded except on the islands, in which those data were not available.
The ARO apiary had a special colony management in autumn in which comb numberwas equalized and the queens were artificially replaced. INRAE only registered one naturalqueen replacement (June 2018), whereas CIMO registered seven (three colonies out of 15 in2018 and four out of 12 in 2019) during the study period. However, in the CIAPA apiary,all the colonies (n = 22) replaced their queen (naturally) at least once between March andSeptember 2018, and two colonies even did it three times. The queen replacement waslower in the following year (five colonies out of 16). Therefore, the relationship between thequeen replacement and the percentage of infected honeybees per colony was analyzed onlyfor the CIAPA and CIMO apiaries (Supplementary Table S4). To do this, the percentage ofhoneybees infected in the sampling previous to the queen replacement (detected in April,August, or October 2018) was compared to the percentage of honey bees infected in thefollowing spring (April 2019). The comparisons were made between two groups: oneincluding the colonies that changed the queen and another group of colonies that did notchange the queen. The only significant (Mann–Whitney test; p < 0.05) difference was foundin the levels of intra-colony infection that were lower in the colonies that had replaced thequeen in the previous summer (detected in August 2018) as opposed to those that had notchanged it (Figure 5).

Insects 2022, 13, 844 11 of 18Insects 2022, 13, x FOR PEER REVIEW 12 of 19
(a) (b) (c)
Figure 5. Percentage of intra-colony infection in CIAPA and CIMO colonies in April 2019. The com-
parison was made between colonies when the queen replacement (QR) was detected in (a) April
2019 (n = 5), (b) August (n = 5), or (c) October (n = 14) versus the colonies that did not replace the
queen (No QR) for the same periods (n = 16; n = 23; n = 14, respectively). * Denotes significant dif-
ferences (p < 0.05).
3.8. Colony Mortality and N. ceranae Infection Levels
The mortality of colonies was recorded across the 20-month period (Table 7). The
highest percentage of losses was observed in INRAE (47.6%) and CIAPA (40.9%), and the
lowest on the islands, with one colony lost in OUE and none in SMI. The level of N. ceranae
infection of a colony could not be correlated with its mortality. Only one colony (in
CIAPA) had 96% of honey bees infected (Supplementary Table S1), which died a month
later after infection assessment. When N. ceranae intra-colony infection in the two months
prior to colony death was analyzed, a large proportion of the dead colonies were found
to have a level of infection greater than or equal to 20% (Supplementary Table S4). Study-
ing all the data together, 46% of the deceased colonies exceeded this value. However, this
condition was not fulfilled in OUE or INRAE, so the data were analyzed by grouping the
dead colonies from CIAPA, ARO, and CIMO. Thus, 76.5% of the colonies had ≥20% of
honey bees infected in the previous two months (CIAPA: 77%, ARO and CIMO: 75%, re-
spectively). Still, some colonies in CIMO or ARO reached over 75% of infection and did
not die, having a remarkable decrease of infected honey bees at the following sampling
round (below 40%; Supplementary Table S4).
Table 7. Total number of colonies studied per apiary and colony mortality.
Apiary No. Colonies in the Study No. of Dead Colonies Percentage of Losses No. of Dead Colonies ≥20%
of Intra-Colony Infection 2
CIAPA 22 9 40.9% 7
INRAE 21 10 47.6% 0
OUE 11 1 9.1% 0
ARO 24 5 1 20.1% 3
CIMO 15 4 26.7% 3
SMI 10 0 0.0% 0 1 One colony with no data of N. ceranae intra-colony infection in the two months prior to death. 2
Data corresponds to two sampling rounds prior to death.
Figure 5. Percentage of intra-colony infection in CIAPA and CIMO colonies in April 2019. Thecomparison was made between colonies when the queen replacement (QR) was detected in (a) April2019 (n = 5), (b) August (n = 5), or (c) October (n = 14) versus the colonies that did not replace thequeen (No QR) for the same periods (n = 16; n = 23; n = 14, respectively). * Denotes significantdifferences (p < 0.05).
3.8. Colony Mortality and N. ceranae Infection Levels
The mortality of colonies was recorded across the 20-month period (Table 7). Thehighest percentage of losses was observed in INRAE (47.6%) and CIAPA (40.9%), and thelowest on the islands, with one colony lost in OUE and none in SMI. The level of N. ceranaeinfection of a colony could not be correlated with its mortality. Only one colony (in CIAPA)had 96% of honey bees infected (Supplementary Table S1), which died a month later afterinfection assessment. When N. ceranae intra-colony infection in the two months prior tocolony death was analyzed, a large proportion of the dead colonies were found to have alevel of infection greater than or equal to 20% (Supplementary Table S4). Studying all thedata together, 46% of the deceased colonies exceeded this value. However, this conditionwas not fulfilled in OUE or INRAE, so the data were analyzed by grouping the deadcolonies from CIAPA, ARO, and CIMO. Thus, 76.5% of the colonies had ≥20% of honeybees infected in the previous two months (CIAPA: 77%, ARO and CIMO: 75%, respectively).Still, some colonies in CIMO or ARO reached over 75% of infection and did not die, havinga remarkable decrease of infected honey bees at the following sampling round (below 40%;Supplementary Table S4).
Table 7. Total number of colonies studied per apiary and colony mortality.
Apiary No. Colonies in the Study No. of Dead Colonies Percentage of LossesNo. of Dead Colonies
≥20% ofIntra-Colony Infection 2
CIAPA 22 9 40.9% 7INRAE 21 10 47.6% 0
OUE 11 1 9.1% 0ARO 24 5 1 20.1% 3
CIMO 15 4 26.7% 3SMI 10 0 0.0% 0
1 One colony with no data of N. ceranae intra-colony infection in the two months prior to death. 2 Data correspondsto two sampling rounds prior to death.

Insects 2022, 13, 844 12 of 18
4. Discussion
The prevalence of N. ceranae infection was determined at the apiary and intra-colonylevels in six apiaries, covering a wide range of Mediterranean environmental and bee-keeping conditions in a long-term study conducted on a large batch of data (103 coloniesacross 20 months; 13,907 individual worker honey bees). This allowed us to determine thedifferences in N. ceranae infection among the different environments, confirming that theepidemiology of the infection by the microsporidium varies geographically and temporally.Nosema ceranae infection was confirmed in all the apiaries studied except in SMI, indicatingthat the microsporidium is widely spread.
The number of colonies infected by N. ceranae in the INRAE (France) apiary wassignificantly lower than that of the other apiaries. In OUE (France), ARO (Israel), CIMO(Portugal), and CIAPA (Spain), a high number of positive colonies were detected in the fourapiaries throughout the sampling rounds, although the intra-colony infection levels variedgreatly among apiaries, with ARO exhibiting the highest percentage of infected honey bees.This finding could be partly explained by the climatic conditions at each site, which weredifferent. However, in our study, there was no correlation between the climatic parametersalone and the infection levels, and just the number of days with high wind speed increasedthe percentage of bees infected per colony. Only a visual and non-significant correlation ofthe combined effect of high mean temperature and high mean relative humidity with higherlevels of infection could be intuited. As opposed to our results, temperature and humiditywere correlated positively with N. ceranae incidence (spore density) but negatively toN. apis incidence in Turkey [60] and the levels of N. ceranae were negatively correlated withhigh temperatures in Serbia, [61]. Another study in China also showed higher N. ceranaeprevalence in the more humid regions (South) when compared with apiaries in dryer areas(North) [45]. Moreover, in a previous study carried out in CIAPA [14], monthly rainfallwas positively correlated with the percentage of interior honey bees infected by N. ceranaeand the percentage of foragers infected was negatively correlated with the mean maximumtemperature. Therefore, our results suggest that other factors than climatic conditions couldplay a role in the prevalence of the N. ceranae infection.
A higher level of N. ceranae infection found in CIAPA, CIMO, and ARO (not statisticallysignificant in the latter) was correlated to a lower adult honey bee population, as opposedto the positive correlation found in INRAE and OUE apiaries. The different relationshipsbetween those two groups in colony strength and the percentage of honey bees infected byN. ceranae could be explained by the low level of infection in INRAE (for all samplings) andOUE (2019). On the other hand, the relationship observed in Iberia (CIAPA and CIMO) andIsrael (ARO) between the N. ceranae infection level and colony strength seem to confirmprevious findings in Spain [14,62,63], where infection has been shown to be detrimental tohoney bee colonies.
Beekeeping management in ARO was different from that of the other apiaries. Giventhat this apiary had the highest levels of infection but had only 20.1% colony mortality, itcould indicate that the management was able to control the mortality associated with thehigh percentage of infected honey bees per colony [64]. Beekeeping management, and, inparticular, queen replacement with a younger queen, has been identified as a biotechnicalmethod to control nosemosis [65,66]. This recommendation is consistent with our resultsas the levels of intra-colony infection in spring were lower in colonies that had replacedthe queen in the previous summer. Other authors found that one-year-old queens are ableto compensate for the effects of Nosema infection, with this ability gradually decreasing insubsequent years [66]. As well, the infection by N. ceranae has been reported to reduce honeyproduction [67], although in this work we could not establish any correlation between theintra-colony infection level and the honey produced.
The highest colony mortality was recorded in INRAE, which had the apiary with thelowest N. ceranae infection levels. It is very likely that the microsporidium infection was notrelated to the mortality in this apiary and that other biotic and abiotic stressors contributedto colony mortality and possibly to the lower honey production. One of these biotic

Insects 2022, 13, 844 13 of 18
stressors could be Varroa. However, this trial was not designed to monitor Varroa levelsbut only to detect high infestations so that control measures could be taken. Moreover,infestation levels were below 2% in most of the cases, so their influence on the colonymortality seems to be limited. Despite this, a significant correlation between the percentageof honey bees infected by N. ceranae and V. destructor levels was found in two apiaries(INRAE and ARO) out of four analyzed. The correlation between the two pathogens isunclear as, such as in this study, there are studies that both confirm [68] and fail to find acorrelation [15,69]. In addition, the Varroa treatments made in each country could have anyinfluence, as oxalic acid has shown an effect on N. ceranae infection [70] and, conversely,infection by Microsporidium could reduce the efficacy of the results [71]. Hence, it ispossible that there are factors yet to be determined that may influence the interactionbetween them. It is well known that V. destructor is an effective vector for Deformed wingvirus (DWV), which was frequently detected in INRAE (unpublished data) and probablyimpacted colony losses in this apiary. On the other hand, the apiaries located on the V.destructor-free islands registered the lowest mortality levels. Thus, the presence of the miteseems to complicate the pathological consequences caused by other pathogens [68,72], asthe intensity of these pathogens (N. ceranae and viruses) seems to increase when they appeartogether [73]. The overall mortality at the CIAPA (40.9%), CIMO (26.7%), and ARO (20.1%)apiaries could be considered high, when compared to the percentage of winter mortalityrate of 10.7% reported in 35 countries for the same time frame (2018–2019) [74], althoughoverall mortality is expected to be higher than during overwintering. In this way, althoughno infection rate could be established as a marker for colony mortality, it is possible that theN. ceranae infection plays a role in the losses, as this microsporidium can cause the death ofthe infected honey bees [14], impacting on the viability of the colonies [14,15,18,29,75–77].High levels of infection have been reported as a cause of colony losses [14,62]. In our study,the 76.5% of dead colonies from CIAPA, ARO, and CIMO had ≥20% of honey bees infectedin the previous two months. These high levels recorded in our study in CIAPA, ARO, andCIMO imply a sustained stress on the colonies. It has been published that an infectiousdisease causing mortality in foraging bees is very dangerous for the survival of a honeybee colony [78]. In addition, Nosema ceranae infection decreases the energy status of honeybees, leading to changes in their foraging behavior, which have a strong adverse effect onenergetic gain efficiency [79]. This will have an effect on food availability and it could leadto colony failure when the forager mortality rate reaches a critical threshold [80].
In addition to the presence of N. ceranae infection, other stressors such as pathogensand pollutants have been shown to impact colony losses [81–84]. In fact, coinfectionof microsporidia with very common viral pathogens might contribute to the death ofthe colony, even for asymptomatic infections [9,85]. Moreover, stress factors affectinghoney bee immunity may trigger latent viral infections to become overt infections. Thus,insecticides [83,86,87] or infestation with other pathogens or parasites like V. destructormay activate dormant virus infections in the colony and even promote selection of virulentstrains, such as in the case of DWV [88–91]. Moreover, the host genetics may influence thedevelopment (or the consequences) of the infection since the levels of N. ceranae infectionhave been noticed to be significantly different between lineages and colonies for bothRussian and Italian honey bees, and in the case of the Russian lineage, the patriline-basedvariance was also found to be significant [92]. Therefore, the differences in the dynamicsand the levels of N. ceranae infection here observed could also be related to the differenthoney bee lineages studied. Nevertheless, it has been suggested that genetic diversitycannot compensate and reduce alone the levels of infection [61].
Our results obtained from apiaries set in several Mediterranean countries confirmthe high variability of N. ceranae prevalence. Nosema ceranae has been shown to be a veryadaptable parasite and the effects of beekeeping management (such as queen replacement)were found to influence the prevalence, probably more linked with the colony biology adap-tations than with the parasite itself. Clinical signs related to N. ceranae’s high prevalenceand climatic conditions, such as lower honey production rate, depopulation, and death,
Insects 2022, 13, 844 14 of 18
were detected in some Mediterranean countries during initial reports [14,15,29,62,93] whenthe epidemic wave was at its highest. The comparison among different countries afterseveral years in similar conditions, together with the fact that some highly infected coloniesdid not die, seems to indicate the initial lethal effect of the new parasite for Apis mellifera isdowngrading, as coevolution contributes to establishing host–parasite equilibrium. Furtherstudies on this topic, including the role of honey bee genetics, could assist in understandingthe difference between nosemosis disease and infection, in a rather similar way to varroosisand Varroa detection.
Supplementary Materials: The following supporting information can be downloaded at: https://www.mdpi.com/article/10.3390/insects13090844/s1, Table S1: Mean levels of infection per monthin each apiary; Table S2: Statistical differences of infected honey bees for each sampling and apiary;Table S3: Climatic conditions recorded per in mainland apiaries; Table S4: Colony losses and queenreplacement per apiary.
Author Contributions: Conceptualization, R.M.-H., A.B.-D., N.C., Y.L.C., M.A.P. and V.S.; method-ology, all authors; formal analysis, C.J.-U., L.B., M.H. and R.M.-H.; investigation, all authors; datacuration, all authors; writing—original draft preparation, C.J.-U. and R.M.-H.; writing—reviewand editing, all authors; visualization, C.J.-U. and R.M.-H.; project administration and supervision,R.M.-H.; funding acquisition, R.M.-H., A.B.-D., N.C., Y.L.C., M.A.P. and V.S. All authors have readand agreed to the published version of the manuscript.
Funding: This research has been developed under the BEEHEAL project. The project was fundedby ARIMNet2 2016 Call by the following funding agencies: INIA (CSIC; Spain), MOARD (Israel),ANR (France), and FCT (Portugal). ARIMNet2 (ERA-NET) has received funding from the EuropeanUnion’s Seventh Framework Programme for research, technological development and demonstrationunder grant agreement number 618127. C.J.-U. contract was funded by the Ministerio de AsuntosEconómicos y Transformación Digital (grant no. BES-2017-080176, RTA-2015-0003-CO3-01). D.H.was supported by the project MEDIBEES—Monitoring the Mediterranean honey bee subspecies andtheir resilience to climate change for the improvement of sustainable agro-ecosystems. MEDIBEESis part of the PRIMA program supported by the European Union. A.R.L. was supported by aPh.D. scholarship (SFRH/BD/143627/2019) from the FCT (Fundação Ciência e Tecnologia). FCTprovided financial support by national funds FCT/MCTES (PIDDAC) to CIMO (UIDB/00690/2020and UIDP/00690/2020) and SusTEC (LA/P/0007/2021). R.M.-H. contract is co-funded by EuropeanSocial funds (EU) by the INCRECYT program.
Data Availability Statement: The data presented in this study are available on request from thecorresponding author.
Acknowledgments: The CIAPA authors wish to thank V. Albendea, J. Almagro, E. Alonso-Prados, M.Benito, C. Botías, T. Corrales, M. Gajero, J. García, C. Uceta, and D. Plaza of the Honey Bee PathologyLaboratory for their technical support. INRAE authors thank beekeepers, Didier Crauser at INRAEand the ACANB in Ouessant (Association Conservatoire de l’Abeille Noire Bretonne).
Conflicts of Interest: The authors declare no conflict of interest. The funders had no role in the designof the study; in the collection, analyses, or interpretation of data; in the writing of the manuscript; orin the decision to publish the results.
References1. FAO; IZSLT; Apimondia; CAAS. Good Beekeeping Practices for Sustainable Apiculture; FAO: Rome, Italy, 2021.2. Bishop, J.; Garratt, M.P.D.; Nakagawa, S. Animal Pollination Increases Stability of Crop Yield across Spatial Scales. Ecol. Lett.
2022, 25, 2034–2047. [CrossRef] [PubMed]3. vanEngelsdorp, D.; Meixner, M.D. A Historical Review of Managed Honey Bee Populations in Europe and the United States and
the Factors That May Affect Them. J. Invertebr. Pathol. 2010, 103, S80–S95. [CrossRef] [PubMed]4. Meixner, M.D.; Costa, C.; Kryger, P.; Hatjina, F.; Bouga, M.; Ivanova, E.; Büchler, R. Conserving Diversity and Vitality for Honey
Bee Breeding. J. Apic. Res. 2010, 49, 85–92. [CrossRef]5. Chauzat, M.P.; Carpentier, P.; Madec, F.; Bougeard, S.; Cougoule, N.; Drajnudel, P.; Clément, M.C.; Aubert, M.; Faucon, J.P. The
Role of Infectious Agents and Parasites in the Health of Honey Bee Colonies in France. J. Apic. Res. 2010, 49, 31–39. [CrossRef]6. Neov, B.; Georgieva, A.; Shumkova, R.; Radoslavov, G.; Hristov, P. Biotic and Abiotic Factors Associated with Colonies Mortalities
of Managed Honey Bee (Apis Mellifera). Diversity 2019, 11, 237. [CrossRef]

Insects 2022, 13, 844 15 of 18
7. Mcmahon, D.P.; Fürst, M.A.; Caspar, J.; Theodorou, P.; Brown, M.J.F.; Paxton, R.J. A Sting in the Spit: Widespread Cross-Infectionof Multiple RNA Viruses across Wild and Managed Bees. J. Anim. Ecol. 2015, 84, 615–624. [CrossRef]
8. Ryabov, E.V.; Childers, A.K.; Lopez, D.; Grubbs, K.; Posada-Florez, F.; Weaver, D.; Girten, W.; vanEngelsdorp, D.; Chen, Y.; Evans,J.D. Dynamic Evolution in the Key Honey Bee Pathogen Deformed Wing Virus: Novel Insights into Virulence and CompetitionUsing Reverse Genetics. PLoS Biol. 2019, 17, e3000502. [CrossRef]
9. Borba, R.S.; Hoover, S.E.; Currie, R.W.; Giovenazzo, P.; Guarna, M.M.; Foster, L.J.; Zayed, A.; Pernal, S.F. Phenomic Analysis ofthe Honey Bee Pathogen-Web and Its Dynamics on Colony Productivity, Health and Social Immunity Behaviors. PLoS ONE 2022,17, e0263273. [CrossRef]
10. Martín-Hernández, R.; Bartolomé, C.; Chejanovsky, N.; Le Conte, Y.; Dalmon, A.; Dussaubat, C.; García-Palencia, P.;Meana, A.; Pinto, M.A.; Soroker, V.; et al. Nosema Ceranae in Apis Mellifera: A 12 Years Postdetection Perspective. Environ.Microbiol. 2018, 20, 1302–1329. [CrossRef]
11. Grupe, A.C.; Alisha Quandt, C. A Growing Pandemic: A Review of Nosema Parasites in Globally Distributed Domesticated andNative Bees. PLoS Pathog. 2020, 16, e1008580. [CrossRef]
12. Marín-García, P.J.; Peyre, Y.; Ahuir-Baraja, A.E.; Garijo, M.M.; Llobat, L. The Role of Nosema Ceranae (Microsporidia: Nosematidae)in Honey Bee Colony Losses and Current Insights on Treatment. Vet. Sci. 2022, 9, 130. [CrossRef] [PubMed]
13. Higes, M.; García-Palencia, P.; Martín-Hernández, R.; Meana, A. Experimental Infection of Apis Mellifera Honeybees with NosemaCeranae (Microsporidia). J. Invertebr. Pathol. 2007, 94, 211–217. [CrossRef] [PubMed]
14. Higes, M.; Martín-Hernández, R.; Botías, C.; Bailón, E.G.; González-Porto, A.V.; Barrios, L.; Del Nozal, M.J.; Bernal, J.L.; Jiménez,J.J.; Palencia, P.G.; et al. How Natural Infection by Nosema Ceranae Causes Honeybee Colony Collapse. Environ. Microbiol. 2008,10, 2659–2669. [CrossRef] [PubMed]
15. Soroker, V.; Hetzroni, A.; Yakobson, B.; David, D.; David, A.; Voet, H.; Slabezki, Y.; Efrat, H.; Levski, S.; Kamer, Y.; et al. Evaluationof Colony Losses in Israel in Relation to the Incidence of Pathogens and Pests. Apidologie 2011, 42, 192–199. [CrossRef]
16. Bacandritsos, N.; Granato, A.; Budge, G.; Papanastasiou, I.; Roinioti, E.; Caldon, M.; Falcaro, C.; Gallina, A.; Mutinelli, F. SuddenDeaths and Colony Population Decline in Greek Honey Bee Colonies. J. Invertebr. Pathol. 2010, 105, 335–340. [CrossRef]
17. Natsopoulou, M.E.; McMahon, D.P.; Doublet, V.; Bryden, J.; Paxton, R.J. Interspecific Competition in Honeybee Intracellular GutParasites Is Asymmetric and Favours the Spread of an Emerging Infectious Disease. Proc. R. Soc. B Biol. Sci. 2015, 282, 20141896.[CrossRef]
18. Moeini, S.; Malekifard, F.; Tavassoli, M. Identification of the Nosema Spp., a Microsporidian Parasite Isolated from the Honey Bees(Apis Mellifera) and Its Association with Honey Bee Colony Losses in Apiaries of Iran. J. Hell. Vet. Med. Soc. 2022, 73, 3667–3672.[CrossRef]
19. Fenoy, S.; Rueda, C.; Higes, M.; Martín-Hernández, R.; Del Aguila, C. High-Level Resistance of Nosema Ceranae, a Parasite of theHoneybee, to Temperature and Desiccation. Appl. Environ. Microbiol. 2009, 75, 6886–6889. [CrossRef]
20. Alaux, C.; Brunet, J.L.; Dussaubat, C.; Mondet, F.; Tchamitchan, S.; Cousin, M.; Brillard, J.; Baldy, A.; Belzunces, L.P.; Le Conte,Y. Interactions between Nosema Microspores and a Neonicotinoid Weaken Honeybees (Apis Mellifera). Environ. Microbiol. 2010,12, 774–782. [CrossRef]
21. Dussaubat, C.; Brunet, J.L.; Higes, M.; Colbourne, J.K.; Lopez, J.; Choi, J.H.; Martín-Hernández, R.; Botías, C.; Cousin, M.;McDonnell, C.; et al. Gut Pathology and Responses to the Microsporidium Nosema Ceranae in the Honey Bee Apis Mellifera. PLoSONE 2012, 7, e37017. [CrossRef]
22. Martín-Hernández, R.; Botías, C.; Barrios, L.; Martínez-Salvador, A.; Meana, A.; Mayack, C.; Higes, M. Comparison of theEnergetic Stress Associated with Experimental Nosema Ceranae and Nosema Apis Infection of Honeybees (Apis Mellifera). Parasitol.Res. 2011, 109, 605–612. [CrossRef] [PubMed]
23. Vidau, C.; Diogon, M.; Aufauvre, J.; Fontbonne, R.; Viguès, B.; Brunet, J.L.; Texier, C.; Biron, D.G.; Blot, N.; Alaoui, H.; et al.Exposure to Sublethal Doses of Fipronil and Thiacloprid Highly Increases Mortality of Honeybees Previously Infected by NosemaCeranae. PLoS ONE 2011, 6, e21550. [CrossRef] [PubMed]
24. Antúnez, K.; Martín-Hernández, R.; Prieto, L.; Meana, A.; Zunino, P.; Higes, M. Immune Suppression in the Honey Bee (ApisMellifera) Following Infection by Nosema Ceranae (Microsporidia). Environ. Microbiol. 2009, 11, 2284–2290. [CrossRef] [PubMed]
25. Chaimanee, V.; Chantawannakul, P.; Chen, Y.; Evans, J.D.; Pettis, J.S. Differential Expression of Immune Genes of Adult HoneyBee (Apis Mellifera) after Inoculated by Nosema Ceranae. J. Insect Physiol. 2012, 58, 1090–1095. [CrossRef] [PubMed]
26. Schwarz, R.S.; Evans, J.D. Single and Mixed-Species Trypanosome and Microsporidia Infections Elicit Distinct, Ephemeral Cellularand Humoral Immune Responses in Honey Bees. Dev. Comp. Immunol. 2013, 40, 300–310. [CrossRef]
27. Lourenço, A.P.; Guidugli-Lazzarini, K.R.; de Freitas, N.H.A.; Message, D.; Bitondi, M.M.G.; Simões, Z.L.P.; Teixeira, É.W.Immunity and Physiological Changes in Adult Honey Bees (Apis Mellifera) Infected with Nosema Ceranae: The Natural ColonyEnvironment. J. Insect Physiol. 2021, 131, 104237. [CrossRef]
28. Haddad, N.J. First Detection of Nosema Ceranae in Jordan. Eur. Sci. J. 2014, 10, 1857–7881.29. Adjlane, N.; Haddad, N. Effect of Some Honeybee Diseases on Seasonal Mortality of Apis Mellifera Intermissa in Algeria Apiaries.
Proc. Zool. Soc. 2016, 71, 83–87. [CrossRef]30. Ansari, M.J.; Al-Ghamdi, A.; Nuru, A.; Khan, K.A.; Alattal, Y. Geographical Distribution and Molecular Detection of Nosema
Ceranae from Indigenous Honey Bees of Saudi Arabia. Saudi J. Biol. Sci. 2017, 24, 983–991. [CrossRef]

Insects 2022, 13, 844 16 of 18
31. Tokarev, Y.S.; Zinatullina, Z.Y.; Ignatieva, A.N.; Zhigileva, O.N.; Malysh, J.M.; Sokolova, Y.Y. Detection of Two MicrosporidiaPathogens of the European Honey Bee Apis Mellifera (Insecta: Apidae) in Western Siberia. Acta Parasitol. 2018, 63, 728–732.[CrossRef]
32. Ostroverkhova, N.V. Prevalence Of Nosema Ceranae (Microsporidia) In The Apis Mellifera Mellifera Bee Colonies From Long TimeIsolated Apiaries Of Siberia. Far East. Entomol. 2020, 407, 8–20. [CrossRef]
33. Martín-Hernández, R.; Botías, C.; Bailón, E.G.; Martínez-Salvador, A.; Prieto, L.; Meana, A.; Higes, M. Microsporidia InfectingApis Mellifera: Coexistence or Competition. Is Nosema Ceranae Replacing Nosema Apis? Environ. Microbiol. 2012, 14, 2127–2138.[CrossRef] [PubMed]
34. Cepero, A.; Martín-Hernández, R.; Bartolomé, C.; Gómez-Moracho, T.; Barrios, L.; Bernal, J.; Teresa Martín, M.; Meana, A.;Higes, M. Passive Laboratory Surveillance in Spain: Pathogens as Risk Factors for Honey Bee Colony Collapse. J. Apic. Res.2015, 54, 525–531. [CrossRef]
35. Stevanovic, J.; Simeunovic, P.; Gajic, B.; Lakic, N.; Radovic, D.; Fries, I.; Stanimirovic, Z. Characteristics of Nosema Ceranae Infectionin Serbian Honey Bee Colonies. Apidologie 2013, 44, 522–536. [CrossRef]
36. Stevanovic, J.; Schwarz, R.S.; Vejnovic, B.; Evans, J.D.; Irwin, R.E.; Glavinic, U.; Stanimirovic, Z. Species-Specific Diagnostics ofApis Mellifera Trypanosomatids: A Nine-Year Survey (2007–2015) for Trypanosomatids and Microsporidians in Serbian HoneyBees. J. Invertebr. Pathol. 2016, 139, 6–11. [CrossRef]
37. Matthijs, S.; Waele, D.; Vandenberge, V.; Evers, J.; Brunain, M.; Saegerman, C.; De Winter, P.J.J.; Roels, S.; Graaf, D.C.; De Regge, N.Nationwide Screening for Bee Viruses and Parasites in Belgian Honey Bees. Viruses 2020, 12, 890. [CrossRef]
38. Lage, V.M.G.B.; Santana, C.D.; Patrocínio, E.; Noronha, R.P.; de Melo, R.L.; de Jesus Barbosa, C.; da Cunha Lima, S.T. Prevalenceof Nosema Ceranae in Apiculture Regions of Bahia State, Brazil. Ciência Rural 2022, 52, e20210473. [CrossRef]
39. Bordin, F.; Zulian, L.; Granato, A.; Caldon, M.; Colamonico, R.; Toson, M.; Trevisan, L.; Biasion, L.; Mutinelli, F. Presence ofKnown and Emerging Honey Bee Pathogens in Apiaries of Veneto Region (Northeast of Italy) during Spring 2020 and 2021. Appl.Sci. 2022, 12, 2134. [CrossRef]
40. Naudi, S.; Šteiselis, J.; Jürison, M.; Raimets, R.; Tummeleht, L.; Praakle, K.; Raie, A.; Karise, R. Variation in the Distribution ofNosema Species in Honeybees (Apis Mellifera Linnaeus) between the Neighboring Countries Estonia and Latvia. Vet. Sci. 2021,8, 58. [CrossRef] [PubMed]
41. Imani Baran, A.; Kalami, H.; Mazaheri, J.; Hamidian, G. Vairimorpha Ceranae Was the Only Detected Microsporidian Species fromIranian Honey Bee Colonies: A Molecular and Phylogenetic Study. Parasitol. Res. 2022, 121, 355–366. [CrossRef] [PubMed]
42. Martín-Hernández, R.; Meana, A.; Prieto, L.; Salvador, A.M.; Garrido-Bailón, E.; Higes, M. Outcome of Colonization of ApisMellifera by Nosema Ceranae. Appl. Environ. Microbiol. 2007, 73, 6331–6338. [CrossRef] [PubMed]
43. Klee, J.; Besana, A.M.; Genersch, E.; Gisder, S.; Nanetti, A.; Tam, D.Q.; Chinh, T.X.; Puerta, F.; Ruz, J.M.; Kryger, P.; et al.Widespread Dispersal of the Microsporidian Nosema Ceranae, an Emergent Pathogen of the Western Honey Bee, Apis Mellifera. J.Invertebr. Pathol. 2007, 96, 1–10. [CrossRef] [PubMed]
44. Mederle, N.; Lobo, M.L.; Morariu, S.; Morariu, F.; Darabus, G.; Mederle, O.; Matos, O. Microscopic and Molecular Detection ofNosema Ceranae in Honeybee Apis Mellifera L. from Romania. Rev. Chim. 2018, 69, 3761–3772. [CrossRef]
45. Wang, Q.; Dai, P.; Guzman-Novoa, E.; Wu, Y.; Hou, C.; Diao, Q. Nosema Ceranae, the Most Common Microsporidium InfectingApis Mellifera in the Main Beekeeping Regions of China since at Least 2005. J. Apic. Res. 2019, 58, 562–566. [CrossRef]
46. Traver, B.E.; Fell, R.D. Prevalence and Infection Intensity of Nosema in Honey Bee (Apis Mellifera L.) Colonies in Virginia. J.Invertebr. Pathol. 2011, 107, 43–49. [CrossRef]
47. Gisder, S.; Schüler, V.; Horchler, L.L.; Groth, D.; Genersch, E. Long-Term Temporal Trends of Nosema Spp. Infection Prevalencein Northeast Germany: Continuous Spread of Nosema Ceranae, an Emerging Pathogen of Honey Bees (Apis Mellifera), but NoGeneral Replacement of Nosema Apis. Front. Cell. Infect. Microbiol. 2017, 7, 301. [CrossRef]
48. Hall, R.J.; Pragert, H.; Phiri, B.J.; Fan, Q.H.; Li, X.; Parnell, A.; Stanislawek, W.L.; McDonald, C.M.; Ha, H.J.; McDonald, W.; et al.Apicultural Practice and Disease Prevalence in Apis Mellifera, New Zealand: A Longitudinal Study. J. Apic. Res. 2021, 60, 644–658.[CrossRef]
49. Antúnez, K.; Anido, M.; Branchiccela, B.; Harriet, J.; Campa, J.; Invernizzi, C.; Santos, E.; Higes, M.; Martín-Hernández, R.;Zunino, P. Seasonal Variation of Honeybee Pathogens and Its Association with Pollen Diversity in Uruguay. Microb. Ecol. 2015,70, 522–533. [CrossRef]
50. Traver, B.E.; Williams, M.R.; Fell, R.D. Comparison of within Hive Sampling and Seasonal Activity of Nosema Ceranae in HoneyBee Colonies. J. Invertebr. Pathol. 2012, 109, 187–193. [CrossRef]
51. Tentcheva, D.; Gauthier, L.; Zappulla, N.; Dainat, B.; Cousserans, F.; Colin, M.E.; Bergoin, M. Prevalence and seasonal variationsof six bee viruses in Apis mellifera L. and Varroa destructor mite populations in France. Appl. Environ. Microbiol. 2004, 70, 7185–7191.[CrossRef]
52. Gauthier, L.; Tentcheva, D.; Tournaire, M.; Dainat, B.; Cousserans, F.; Colin, M.E.; Bergoin, M. Viral load estimation in asymp-tomatic honey bee colonies using the quantitative RT-PCR technique. Apidologie 2007, 38, 426–435. [CrossRef]
53. Direção Regional da Agricultura (DRA). Programa Sanitário Apícola—Região Autónoma dos Açores; Secretaria Regional da Agriculturae Ambiente: Angra do Heroísmo, Portugal, 2022.
54. Direção Regional da Agricultura (DRA). Anexo I—PSA 2021—Situação Epidemiológica (2016–2021); Secretaria Regional da Agricul-tura e Ambiente: Angra Heroísmo, Portugal, 2021.

Insects 2022, 13, 844 17 of 18
55. Lopes, A.R.; Martín-Hernández, R.; Higes, M.; Segura, S.K.; Henriques, D.; Pinto, M.A. Colonisation Patterns of Nosema Ceranaein the Azores Archipelago. Vet. Sci. 2022, 9, 320. [CrossRef] [PubMed]
56. Henriques, D.; Lopes, A.R.; Chejanovsky, N.; Dalmon, A.; Higes, M.; Jabal-Uriel, C.; Le Conte, Y.; Reyes-Carreño, M.; Soroker, V.;Martín-Hernández, R.; et al. Mitochondrial and Nuclear Diversity of Colonies of Varying Origins: Contrasting Patterns Inferredfrom the Intergenic TRNAleu-Cox2 Region and Immune SNPs. J. Apic. Res. 2022, 61, 305–308. [CrossRef]
57. Urbieta-Magro, A.; Higes, M.; Meana, A.; Gómez-Moracho, T.; Rodríguez-García, C.; Barrios, L.; Martín-Hernández, R. The Levelsof Natural Nosema Spp. Infection in Apis Mellifera Iberiensis Brood Stages. Int. J. Parasitol. 2019, 49, 657–667. [CrossRef] [PubMed]
58. Delaplane, K.S.; Van Der Steen, J.; Guzman-Novoa, E. Standard Methods for Estimating Strength Parameters of Apis MelliferaColonies. J. Apic. Res. 2013, 52, 1–12. [CrossRef]
59. Dietemann, V.; Nazzi, F.; Martin, S.J.; Anderson, D.L.; Locke, B.; Delaplane, K.S.; Wauquiez, Q.; Tannahill, C.; Frey, E.; Ziegelmann,B.; et al. Standard Methods for Varroa Research. J. Apic. Res. 2013, 52, 1–54. [CrossRef]
60. Ozgor, E.; Guzerin, E.; Keskin, N. Determination and Comparison of Nosema Apis and Nosema Ceranae in Terms of Geographicand Climatic Factors. Hacet. J. Biol. Chem. 2015, 43, 9–15. [CrossRef]
61. Vejnovic, B.; Stevanovic, J.; Schwarz, R.S.; Aleksic, N.; Mirilovic, M.; Jovanovic, N.M.; Stanimirovic, Z. Quantitative PCRAssessment of Lotmaria Passim in Apis Mellifera Colonies Co-Infected Naturally with Nosema Ceranae. J. Invertebr. Pathol. 2017,151, 76–81. [CrossRef]
62. Botías, C.; Martín-Hernández, R.; Barrios, L.; Meana, A.; Higes, M. Nosema Spp. Infection and Its Negative Effects on Honey Bees(Apis Mellifera Iberiensis) at the Colony Level. Vet. Res. 2013, 44, 25. [CrossRef]
63. Goblirsch, M.; Huang, Z.Y.; Spivak, M. Physiological and Behavioral Changes in Honey Bees (Apis Mellifera) Induced by NosemaCeranae Infection. PLoS ONE 2013, 8, e58165. [CrossRef]
64. Muñoz, I.; Cepero, A.; Pinto, M.A.; Martín-Hernández, R.; Higes, M.; De la Rúa, P. Presence of Nosema Ceranae Associated withHoneybee Queen Introductions. Infect. Genet. Evol. 2014, 23, 161–168. [CrossRef] [PubMed]
65. Botías, C.; Martín-Hernández, R.; Días, J.; García-Palencia, P.; Matabuena, M.; Juarranz, Á.; Barrios, L.; Meana, A.; Nanetti, A.;Higes, M. The Effect of Induced Queen Replacement on Nosema Spp. Infection in Honey Bee (Apis Mellifera Iberiensis) Colonies.Environ. Microbiol. 2012, 14, 845–859. [CrossRef] [PubMed]
66. Simeunovic, P.; Stevanovic, J.; Cirkovic, D.; Radojicic, S.; Lakic, N.; Stanisic, L.; Stanimirovic, Z. Nosema Ceranae and Queen AgeInfluence the Reproduction and Productivity of the Honey Bee Colony. J. Apic. Res. 2014, 53, 545–554. [CrossRef]
67. Botías, C.; Martín-Hernández, R.; Meana, A.; Higes, M. Screening Alternative Therapies to Control Nosemosis Type C in HoneyBee (Apis Mellifera Iberiensis) Colonies. Res. Vet. Sci. 2013, 95, 1041–1045. [CrossRef]
68. Mariani, F.; Maggi, M.; Porrini, M.; Fuselli, S.; Caraballo, G.; Brasesco, C.; Barrios, C.; Principal, J.; Martin, E. Parasitic Interactionsbetween Nosema Spp. and Varroa Destructor in Apis Mellifera Colonies. Zootec. Trop. 2012, 30, 81–90.
69. Flores, J.M.; Gámiz, V.; Jiménez-Marín, Á.; Flores-Cortés, A.; Gil-Lebrero, S.; Garrido, J.J.; Hernando, M.D. Impact of VarroaDestructor and Associated Pathologies on the Colony Collapse Disorder Affecting Honey Bees. Res. Vet. Sci. 2021, 135, 85–95.[CrossRef]
70. Nanetti, A.; Rodriguez-García, C.; Meana, A.; Martín-Hernández, R.; Higes, M. Effect of Oxalic Acid on Nosema Ceranae Infection.Res. Vet. Sci. 2015, 102, 167–172. [CrossRef]
71. Botías, C.; Martín-Hernández, R.; Barrios, L.; Garrido-Bailón, E.; Nanetti, A.; Meana, A.; Higes, M. Nosema Spp. ParasitizationDecreases the Effectiveness of Acaricide Strips (Apivar ®) in Treating Varroosis of Honey Bee (Apis Mellifera Iberiensis) Colonies.Environ. Microbiol. Rep. 2012, 4, 57–65. [CrossRef]
72. Doublet, V.; Natsopoulou, M.E.; Zschiesche, L.; Paxton, R.J. Within-Host Competition among the Honey Bees Pathogens NosemaCeranae and Deformed Wing Virus Is Asymmetric and to the Disadvantage of the Virus. J. Invertebr. Pathol. 2015, 124, 31–34.[CrossRef]
73. Little, C.M.; Shutler, D.; Williams, G.R. Associations among Nosema Spp. Fungi, Varroa Destructor Mites and Chemical Treatmentsin Honey Bees, Apis Mellifera. J. Apic. Res. 2016, 54, 378–385. [CrossRef]
74. Gray, A.; Adjlane, N.; Arab, A.; Ballis, A.; Brusbardis, V.; Charrière, J.D.; Chlebo, R.; Coffey, M.F.; Cornelissen, B.; Amaro da Costa,C.; et al. Honey Bee Colony Winter Loss Rates for 35 Countries Participating in the COLOSS Survey for Winter 2018–2019, andthe Effects of a New Queen on the Risk of Colony Winter Loss. J. Apic. Res. 2020, 59, 744–751. [CrossRef]
75. Villa, J.D.; Bourgeois, A.L.; Danka, R.G. Negative Evidence for Effects of Genetic Origin of Bees on Nosema Ceranae, PositiveEvidence for Effects of Nosema Ceranae on Bees. Apidologie 2013, 44, 511–518. [CrossRef]
76. Bekele, A.Z.; Mor, S.K.; Phelps, N.B.D.; Goyal, S.M.; Armién, A.G. A Case Report of Nosema Ceranae Infection in Honey Bees inMinnesota, USA. Vet. Q. 2015, 35, 48–50. [CrossRef]
77. Hatjina, F.; Tsoktouridis, G.; Bouga, M.; Charistos, L.; Evangelou, V.; Avtzis, D.; Meeus, I.; Brunain, M.; Smagghe, G.; De Graaf,D.C. Polar Tube Protein Gene Diversity among Nosema Ceranae Strains Derived from a Greek Honey Bee Health Study. J. Invertebr.Pathol. 2011, 108, 131–134. [CrossRef] [PubMed]
78. Betti, M.I.; Wahl, L.M.; Zamir, M. Effects of Infection on Honey Bee Population Dynamics: A Model. PLoS ONE 2014, 9, e110237.[CrossRef]
79. Naug, D. Infected Honeybee Foragers Incur a Higher Loss in Efficiency than in the Rate of Energetic Gain. Biol. Lett. 2014,10, 20140731. [CrossRef]

Insects 2022, 13, 844 18 of 18
80. Khoury, D.S.; Barron, A.B.; Myerscough, M.R. Modelling Food and Population Dynamics in Honey Bee Colonies. PLoS ONE 2013,8, e59084. [CrossRef]
81. Dainat, B.; Evans, J.D.; Chen, Y.P.; Gauthier, L.; Neumann, P. Predictive Markers of Honey Bee Colony Collapse. PLoS ONE 2012,7, e32151. [CrossRef]
82. Alonso-Prados, E.; González-Porto, A.V.; Bernal, J.L.; Bernal, J.; Martín-Hernández, R.; Higes, M. A Case Report of Chronic Stressin Honey Bee Colonies Induced by Pathogens and Acaricide Residues. Pathogens 2021, 10, 955. [CrossRef]
83. Aufauvre, J.; Biron, D.G.; Vidau, C.; Fontbonne, R.; Roudel, M.; Diogon, M.; Viguès, B.; Belzunces, L.P.; Delbac, F.; Blot, N.Parasite-Insecticide Interactions: A Case Study of Nosema Ceranae and Fipronil Synergy on Honeybee. Sci. Rep. 2012, 2, 326.[CrossRef]
84. Dussaubat, C.; Maisonnasse, A.; Crauser, D.; Tchamitchian, S.; Bonnet, M.; Cousin, M.; Kretzschmar, A.; Brunet, J.L.; Le Conte, Y.Combined Neonicotinoid Pesticide and Parasite Stress Alter Honeybee Queens’ Physiology and Survival. Sci. Rep. 2016, 6, 31430.[CrossRef] [PubMed]
85. Beaurepaire, A.; Piot, N.; Doublet, V.; Antunez, K.; Campbell, E.; Chantawannakul, P.; Chejanovsky, N.; Gajda, A.; Heerman, M.;Panziera, D.; et al. Diversity and Global Distribution of Viruses of the Western Honey Bee, Apis Mellifera. Insects 2020, 11, 239.[CrossRef]
86. Coulon, M.; Dalmon, A.; Di Prisco, G.; Prado, A.; Arban, F.; Dubois, E.; Ribière-Chabert, M.; Alaux, C.; Thiéry, R.; Le Conte, Y.Interactions Between Thiamethoxam and Deformed Wing Virus Can Drastically Impair Flight Behavior of Honey Bees. Front.Microbiol. 2020, 11, 766. [CrossRef] [PubMed]
87. Di Prisco, G.; Cavaliere, V.; Annoscia, D.; Varricchio, P.; Caprio, E.; Nazzi, F.; Gargiulo, G.; Pennacchio, F. NeonicotinoidClothianidin Adversely Affects Insect Immunity and Promotes Replication of a Viral Pathogen in Honey Bees. Proc. Natl. Acad.Sci. USA 2013, 110, 18466–18471. [CrossRef] [PubMed]
88. Nazzi, F.; Brown, S.P.; Annoscia, D.; Del Piccolo, F.; Di Prisco, G.; Varricchio, P.; Vedova, G.D.; Cattonaro, F.; Caprio, E.; Pennacchio,F. Synergistic Parasite-Pathogen Interactions Mediated by Host Immunity Can Drive the Collapse of Honeybee Colonies. PLoSPathog. 2012, 8, e1002735. [CrossRef]
89. Martin, S.J.; Hardy, J.; Villalobos, E.; Martín-Hernández, R.; Nikaido, S.; Higes, M. Do the Honeybee Pathogens Nosema Ceranaeand Deformed Wing Virus Act Synergistically? Environ. Microbiol. Rep. 2013, 5, 506–510. [CrossRef]
90. Ryabov, E.V.; Wood, G.R.; Fannon, J.M.; Moore, J.D.; Bull, J.C.; Chandler, D.; Mead, A.; Burroughs, N.; Evans, D.J. A Virulent Strainof Deformed Wing Virus (DWV) of Honeybees (Apis Mellifera) Prevails after Varroa Destructor-Mediated, or In Vitro, Transmission.PLoS Pathog. 2014, 10, e1004230. [CrossRef]
91. Moore, J.; Jironkin, A.; Chandler, D.; Burroughs, N.; Evans, D.J.; Ryabov, E.V. Recombinants between Deformed Wing Virus andVarroa Destructor Virus-1 May Prevail in Varroa Destructor-Infested Honeybee Colonies. J. Gen. Virol. 2011, 92, 156–161. [CrossRef]
92. Bourgeois, A.L.; Rinderer, T.E.; Sylvester, H.A.; Holloway, B.; Oldroyd, B.P. Patterns of Apis Mellifera Infestation by NosemaCeranae Support the Parasite Hypothesis for the Evolution of Extreme Polyandry in Eusocial Insects. Apidologie 2012, 43, 539–548.[CrossRef]
93. Lodesani, M.; Costa, C.; Besana, A.; Dall’Olio, R.; Franceschetti, S.; Tesoriero, D.; Vaccari, G. Impact of Control Strategies for VarroaDestructor on Colony Survival and Health in Northern and Central Regions of Italy. J. Apic. Res. 2014, 53, 155–164. [CrossRef]
Related Documents