Epidemiology of Cancer (Environmental Biology of Cancer) Folder Title: Epidemio Updated: January 29, 2013 EpiTitle

Epidemiology of Cancer (Environmental Biology of Cancer) Folder Title: Epidemio Updated: January 29, 2013 EpiTitle.
Dec 16, 2015
Welcome message from author
This document is posted to help you gain knowledge. Please leave a comment to let me know what you think about it! Share it to your friends and learn new things together.
Transcript

Epidemiology of Cancer(Environmental Biology of
Cancer)
Folder Title: Epidemio
Updated: January 29, 2013
EpiTitle

Epidemiology of DiseasesDistribution of patterns of health and disease.Determination of potential causation that leads to the observed
distribution.
Observational vs Experimental Sciences:• Observe episodes of disease appearance (e.g. geographic "hot-spots"
or occupational or familial patterns) • Retrospective analysis of potential causative associations• Prospective trials to determine causative sources
Determine "Relative Risk" or "Odds Ratio"• Small vs large Relative Risk Values
Association or Correlation is not Causation

Complications in Epidemiological Observations Reliable reproducible data and conclusions vs.
firmly held beliefs or "common sense" assumptions.
Problems with acquisition of data and data reliability:• Time patterns of exposure vs appearance of disease• Combinations of causative sources and sequences of exposures• High background appearance (non-rare diseases)• Usually small impact of an agent on an individual or population• Retrospective data: recall bias and data reporting• Prospective trials: Costs, ethical problems, subject cooperation
Deducing Actual Causation from Epidemiological Data

Epidemiological data comparing high and low incidence rates based on different population groups poses the questions:
1.Why is one group presenting high risk for a given type of cancer?
2.Why is another group presenting relatively low risk for that type of cancer?
3.What does that tell us about causation?
4.Does that present possibilities for prevention and diagnosis?

Breast Cancer Relative Risks

Epidemiological data comparing high and low incidence rates based for different types of cancer based on different countries poses the questions:
1.Why is a given cancer (e.g. liver cancer) high in one set of countries?
2.Why is that same cancer very low in other countries?
3.What does that tell us about causation?
4.Does that present possibilities for prevention and diagnosis?


Table 2.5 part 1 of 2 The Biology of Cancer (© Garland Science 2007) p. 44

Table 2.5 part 1 of 2 The Biology of Cancer (© Garland Science 2007) p. 44
Solar exposure & skin pigmentation?
Epstein-Barr Virus Association?
Hepatitis B VirusPapilloma viruses Papilloma viruses
Helicobacter pylori infectionSmoking
??

Please respond to this question as a fill-in-the-blank question using the directions provided in the hand-outs.
Liver cancer is greatly elevated in Hong Kong and in other places in South East Asia. This is due to
0 of 100

There is elevated risk of breast cancer depending on whether a woman has had a baby or not, and depending on how many
babies she has had. What does this suggest as a plausible response to reduce the risk of death from breast cancer?
1. Get pregnant as often as possible.
2. Monitor and control hormonal status.
3. Deny the evidence and don’t worry about it.
4. Eat a low fat diet.
5. Monitor the high risk group more stringently than the lower risk group.
6. Carry out ovariectomy as early in adult life as possible.
0 of 100

Epidemiological Data can also sometimes provide clues about the biological mechanisms
underlying certain types of cancers.
Malignant Melanoma (Solar radiation exposure)
Burkitt’s Lymphoma(Co-infection with virus transmitted by
mosquitos also transmitting malaria)
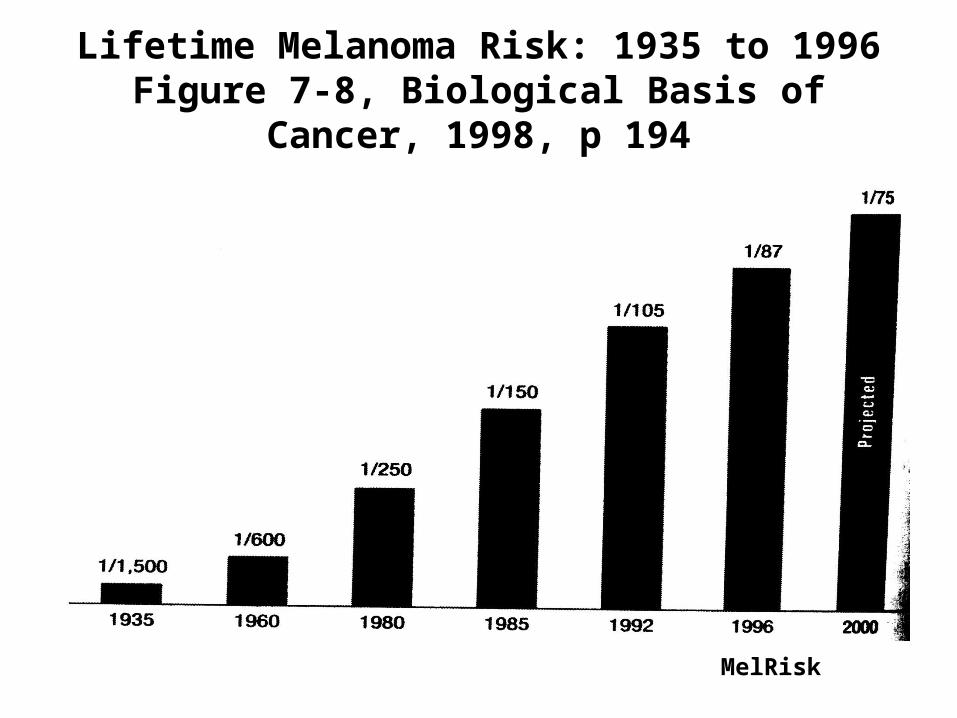
Lifetime Melanoma Risk: 1935 to 1996Figure 7-8, Biological Basis of Cancer, 1998, p 194
MelRisk
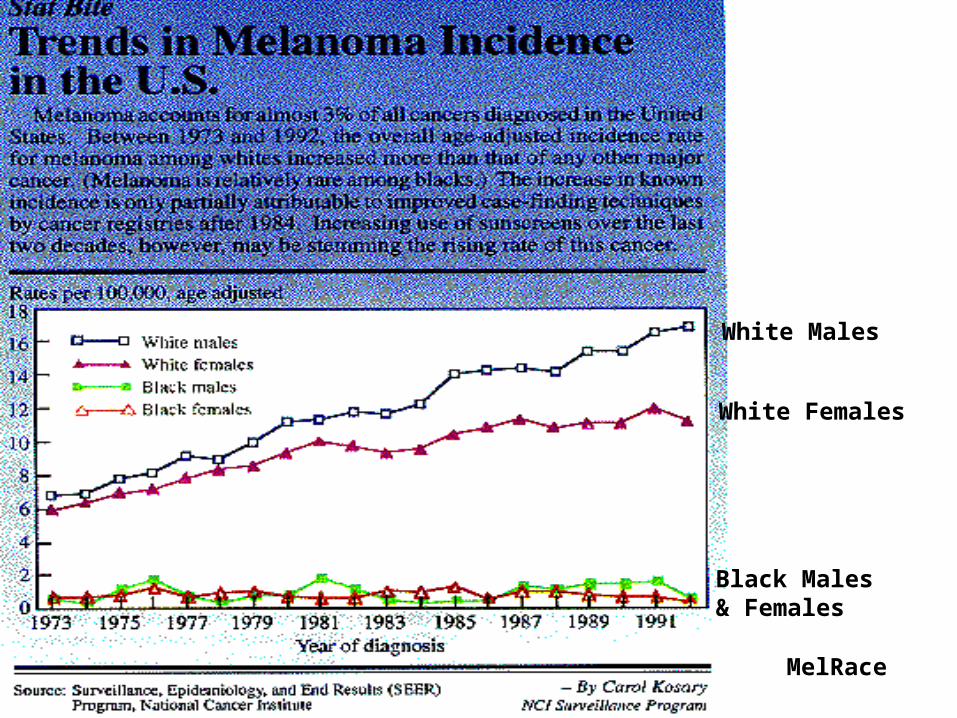
White Males
White Females
Black Males & Females
MelRace


Cancer Incidence and Changes in Gene Expression:
Reciprocal Translocation
9 to 22 Reciprocal Translocation:Chronic Myelogenous Leukemia (CML)
8 to 14 Reciprocal Translocation:Burkitts Lymphoma

Figure 1.11b The Biology of Cancer (© Garland Science 2007)
Fluorescent in situ
hybridization (FISH) of
normal metaphase
human chromosomes
using chromosome specific DNA probes with
different fluorescent dyes

Figure 2.23b The Biology of Cancer (© Garland Science 2007)
Chromosome-specific Probe Analysis of Reciprocal Translocation (9 to 22) in Chronic Myelogenous Leukemia
Chromosome 9 (White); Chromosome 22 (Purple)

Reciprocal translocation between chromosomes 9 and 22 produces fusion of a cancer-inducing gene, the abelson or abl
gene with information on another chromosome and gives fusion protein
involving the abl gene product that is mis-expressed and drives cell division in
leucocytes leading to chronic myelogenous leukemia.
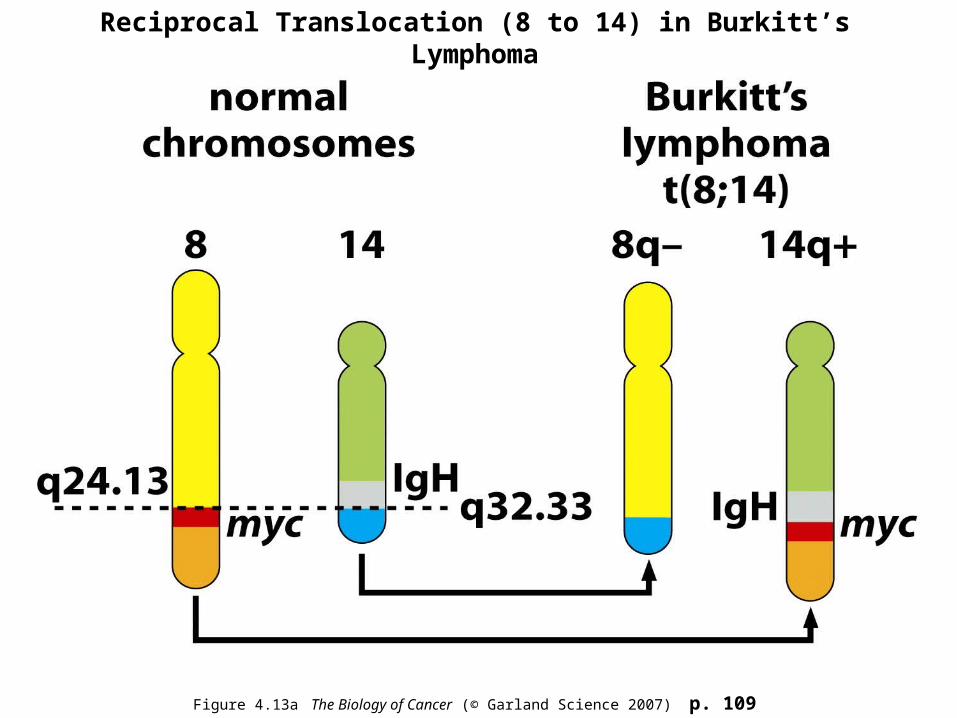
Figure 4.13a The Biology of Cancer (© Garland Science 2007) p. 109
Reciprocal Translocation (8 to 14) in Burkitt’s Lymphoma

Figure 4.12 The Biology of Cancer (© Garland Science 2007)
Incidence of Burkitt’s Lymphoma in Relation to Infectious Disease Etiology:Aedes simpsoni mosquito transmission vector for malaria
and Epstein Barr Virus co-infection


Figure 4.13b The Biology of Cancer (© Garland Science 2007 p. 109)
Myc Oncogene (Chromosome 8) Expression Controlled by Fusion with Immunoglobulin Heavy Chain Gene (Chromosme 14) in Burkitt’s Lymphoma

Burkitt’s Lymphoma is Associated with co-infection with a virus carried by mosquitos. This is because the virus:
Cau
ses p
oint m
...
Acti
vate
s anti.
..
Turn
s off
a ca..
.
Induce
s a h
igh...
Sec
rete
s a p
ot...
0% 0% 0%0%0%
1. Causes point mutations
2. Activates antibody synthesis
3. Turns off a cancer suppressor gene
4. Induces a high fever
5. Secretes a potent chemical carcinogen
0 of 100

What is this slide showing?(Short answer question)
0 of 100

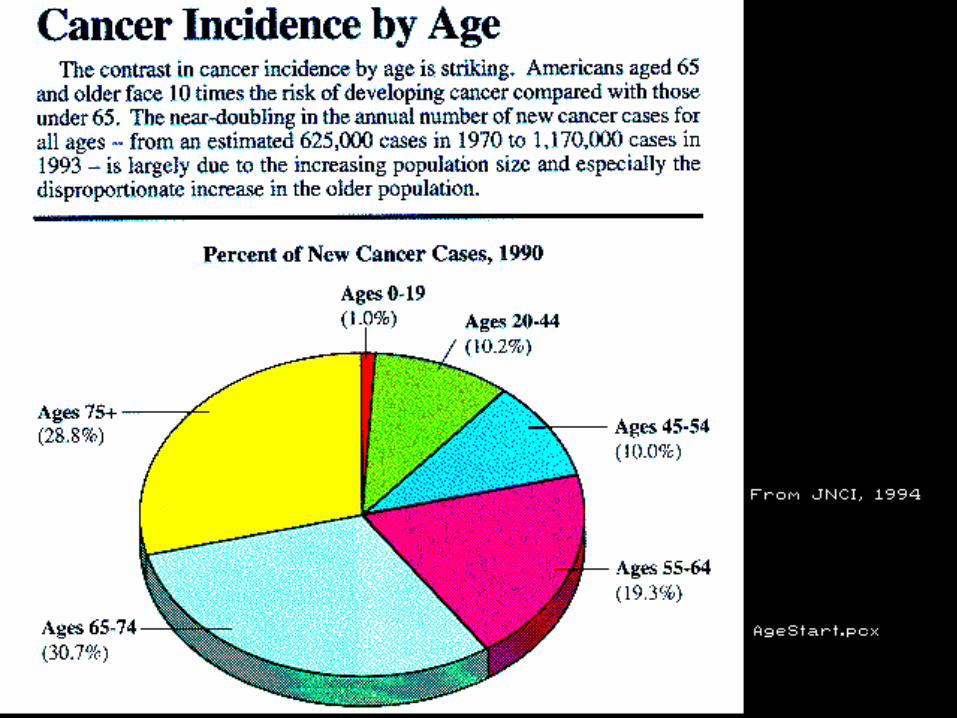
Epidemiology of Cancer Based on Age


AgeEffct
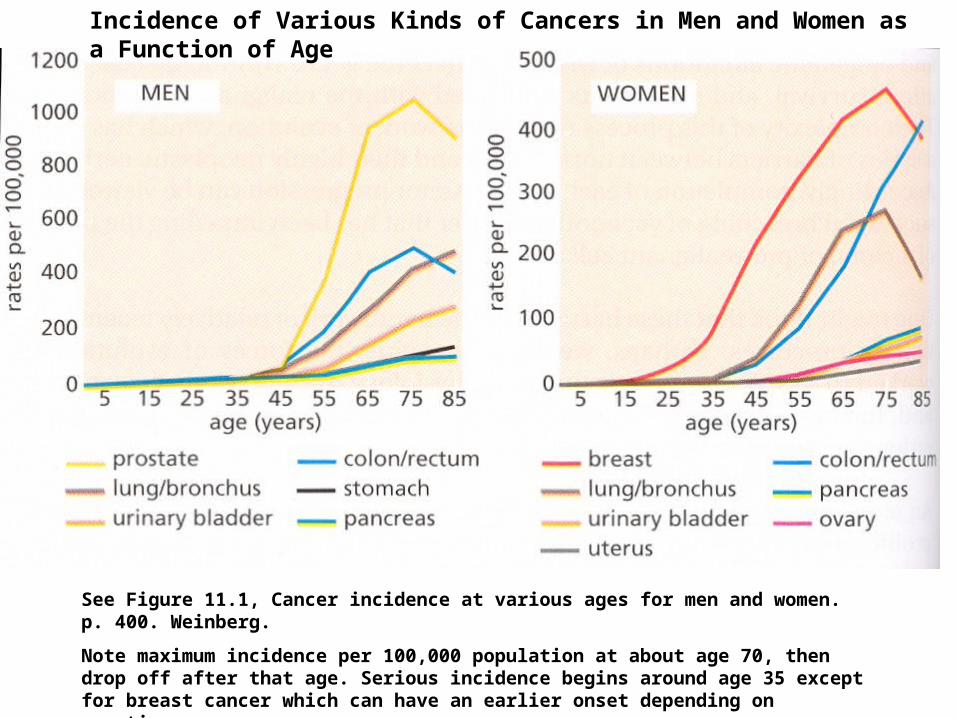
See Figure 11.1, Cancer incidence at various ages for men and women. p. 400. Weinberg.
Note maximum incidence per 100,000 population at about age 70, then drop off after that age. Serious incidence begins around age 35 except for breast cancer which can have an earlier onset depending on genetics.
Incidence of Various Kinds of Cancers in Men and Women as a Function of Age

Cancer in children and younger adults has an incidence rate of 11% of the total cancers, but accounts for only 5% of the total cancer deaths. Why is that the case? What does that difference between incidence and
mortality tell us about cancers in younger persons? (This is a fill-in-the-blank question. Keep it brief. You
can use abbreviations if they are clear).
0 of 100

Specific Cancer Incidence and Migratory Patterns:
Cancers and Environmental Effects

See also Figure 7-6, Biological Basis of Cancer, p 191
EatFat


Figure 2.20 The Biology of Cancer (© Garland Science 2007)
Cancer Incidence Following Migration
p. 45

(When this slide opens you do not have to send in your name under “Send User Data” unless you borrowed a Response Card from us this morning.If you borrowed a Card be sure to remove the previous name and enter
your names.
The two previous slides show patterns of cancer incidence within one or two generations in populations
of persons who have migrated .What do these data tell us about causation of these
cancers?You can abbreviate as long as I reasonably can figure
out your meaning.
0 of 100

Figure 11.2 The Biology of Cancer (© Garland Science 2007)
Cigarette Consumption and Lung Cancer: 1880 to 2000

Carcinogenic Agents and co-Carcinogenic
Agents:Interacting Causations

CigDose

Table 2.6 The Biology of Cancer (© Garland Science 2007)p. 46

CigBooze

Environmental and Occupational
Cancers

CxCauses

WorkCx

Journal of the National CancerInstitute,July, 1996
Kids&Rad
Cultural Associations and Specific Cancers

Journal of the NationalCancer InstituteOctober, 1996
StomCxEthnic

Table 2.7 The Biology of Cancer (© Garland Science 2007) p. 47

Detailed analysis of the epidemiology of cancers is important in cancer medicine because it helps us to
understand __ ___ ___ ___ ___ ___
(or to)
__ __ __ __ __ __ __ some cancers
You only need one response
0 of 100

Cancer in children 0 to 14 years of age occurs in 15 per 100,000 as the incidence rate. Cancers in that same group accounts for 2.5 deaths per 100,000. What does that tell us
about cancers that affect children ages 0 to 14? (This is a fill-in-the-blank question. Keep it brief. You can
use abbreviations if they are clear).
0 of 100

Figure 11.3 The Biology of Cancer (© Garland Science 2007)
Male Cancer Death Rates for Various Carcinomas, 1939 to 1947. Log-Log Plot
Slope of 5 indicates a series of rate limiting steps

Figure 11.4 The Biology of Cancer (© Garland Science 2007)
Squamous cell carcinoma in mice.
Mesothelioma in human insulation workers
Cancer Incidence and Carcinogen Exposure

Understanding the epidemiology of cancers allows us not only to understand the causes of some cancers but
also helps us to design programs for the _ _ _ _ _ _ _ _ _ _ of some cancers.
One word only!
0 of 100
Related Documents