ISG TASK FORCE REPORT Epidemiology and symptom profile of gastroesophageal reflux in the Indian population: Report of the Indian Society of Gastroenterology Task Force Shobna J. Bhatia & D. Nageshwar Reddy & Uday C. Ghoshal & V . Jayanthi & Philip Abraham & Gourdas Choudhuri & S. L. Broor & Vineet Ahuja & Philip Augustine & V . Balakrishnan & D. K. Bhasin & Naresh Bhat & Ashok Chacko & Sunil Dadhich & G. K. Dhali & Pankaj S. Dhawan & Manisha Dwivedi & Mahesh K. Goenka & Abraham Koshy & Ajay Kumar & Sri Prakash Misra & Shrikant Mukewar & E. PedaVeer Raju & K. T. Shenoy & S. P. Singh & Ajit Sood & R. Srinivasan Received: 31 October 2010 /Accepted: 8 July 2011 /Published online: 27 July 2011 # Indian Society of Gastroenterology 2011 Abstract Background Gastroesophageal reflux disease (GERD) and its complications are thought to be infrequent in India; there are no data from India on the prevalence of and risk factors for GERD. The Indian Society of Gastroenterology formed a task force aiming to study: (a) the frequency and profile of GERD in India, (b) factors including diet associated with GERD. Methods In this prospective, multi-center (12 centers) study, data were obtained using a questionnaire from S. J. Bhatia (*) Department of Gastroenterology, Seth G S Medical College and K E M Hospital, Mumbai 400 012, India e-mail: [email protected] M. Dwivedi : S. P. Misra Allahabad, India N. Bhat : A. Koshy Bengaluru, India D. K. Bhasin Chandigarh, India V . Jayanthi : R. Srinivasan Chennai, India S. P. Singh Cuttack, India S. L. Broor : V . Ahuja : A. Kumar Delhi, India D. N. Reddy Hyderabad, India S. Dadhich Jodhpur, India P. Augustine : V . Balakrishnan Kochi, India G. K. Dhali : M. K. Goenka Kolkata, India U. C. Ghoshal : G. Choudhuri Lucknow, India A. Sood Ludhiana, India P. Abraham : P. S. Dhawan Mumbai, India S. Mukewar Nagpur, India K. T. Shenoy Thiruvananthapuram, India A. Chacko Vellore, India E. P. Raju Vishakhapatnam, India Indian J Gastroenterol (May–June 2011) 30(3):118–127 DOI 10.1007/s12664-011-0112-x

Welcome message from author
This document is posted to help you gain knowledge. Please leave a comment to let me know what you think about it! Share it to your friends and learn new things together.
Transcript
ISG TASK FORCE REPORT
Epidemiology and symptom profile of gastroesophagealreflux in the Indian population: Report of the Indian Societyof Gastroenterology Task Force
Shobna J. Bhatia & D. Nageshwar Reddy & Uday C. Ghoshal & V. Jayanthi &Philip Abraham & Gourdas Choudhuri & S. L. Broor & Vineet Ahuja &
Philip Augustine & V. Balakrishnan & D. K. Bhasin & Naresh Bhat & Ashok Chacko &
Sunil Dadhich & G. K. Dhali & Pankaj S. Dhawan & Manisha Dwivedi &Mahesh K. Goenka & Abraham Koshy & Ajay Kumar & Sri Prakash Misra &
Shrikant Mukewar & E. PedaVeer Raju & K. T. Shenoy & S. P. Singh & Ajit Sood &
R. Srinivasan
Received: 31 October 2010 /Accepted: 8 July 2011 /Published online: 27 July 2011# Indian Society of Gastroenterology 2011
AbstractBackground Gastroesophageal reflux disease (GERD)and its complications are thought to be infrequent inIndia; there are no data from India on the prevalence ofand risk factors for GERD. The Indian Society of
Gastroenterology formed a task force aiming to study:(a) the frequency and profile of GERD in India, (b)factors including diet associated with GERD.Methods In this prospective, multi-center (12 centers)study, data were obtained using a questionnaire from
S. J. Bhatia (*)Department of Gastroenterology,Seth G S Medical College and K E M Hospital,Mumbai 400 012, Indiae-mail: [email protected]
M. Dwivedi : S. P. MisraAllahabad, India
N. Bhat :A. KoshyBengaluru, India
D. K. BhasinChandigarh, India
V. Jayanthi :R. SrinivasanChennai, India
S. P. SinghCuttack, India
S. L. Broor :V. Ahuja :A. KumarDelhi, India
D. N. ReddyHyderabad, India
S. DadhichJodhpur, India
P. Augustine :V. BalakrishnanKochi, India
G. K. Dhali :M. K. GoenkaKolkata, India
U. C. Ghoshal :G. ChoudhuriLucknow, India
A. SoodLudhiana, India
P. Abraham : P. S. DhawanMumbai, India
S. MukewarNagpur, India
K. T. ShenoyThiruvananthapuram, India
A. ChackoVellore, India
E. P. RajuVishakhapatnam, India
Indian J Gastroenterol (May–June 2011) 30(3):118–127DOI 10.1007/s12664-011-0112-x
3224 subjects regarding the frequency, severity andduration of heartburn, regurgitation and other symptomsof GERD. Data were also obtained regarding theirdietary habits, addictions, and lifestyle, and whetherany of these were related or had been altered because ofsymptoms. Data were analyzed using univariate andmultivariate methods.Results Two hundred and forty-five (7.6%) of 3224subjects had heartburn and/or regurgitation at least oncea week. On univariate analysis, older age (OR 1.012;95% CI 1.003–1.021), consumption of non-vegetarianand fried foods, aerated drinks, tea/coffee were associatedwith GERD. Frequency of smoking was similar amongsubjects with or without GERD. Body mass index (BMI)was similar in subjects with and without GERD. Onmultivariate analysis, consumption of non-vegetarian foodwas independently associated with GERD symptoms.Overlap with symptoms of irritable bowel syndrome wasnot uncommon; 21% reported difficulty in passage of stooland 9% had mucus in stools. About 25% of patients hadconsulted a doctor previously for their gastrointestinalsymptoms.Conclusion 7.6% of Indian subjects have significant GERDsymptoms. Consumption of non-vegetarian foods was anindependent predictor of GERD. BMI was comparableamong subjects with or without GERD.
Keywords Asia . Epidemiology. Esophagus . Heartburn .
Risk factors
Introduction
Gastroesophageal reflux disease (GERD) is a commonproblem worldwide [1–5]. The frequency and severity ofGERD and its complications such as Barrett’s esophagusand esophageal adenocarcinoma, however, may haveethnic and geographic variations [6]; most studies fromIndia suggest that these might be less in the Indianpopulation [7, 8]. On the other hand, studies in a multi-ethnic population showed that people of Indian origin areat higher risk of GERD than ethnic Malay and Chinese[6]. The high prevalence of H. pylori infection, which isknown to protect from severe GERD and its complica-tions, might be one of the explanations for the lowerfrequency of complications of GERD in the Indianpopulation [9, 10]. The role of dietary and genetic factorsis not clear.
The Indian Society of Gastroenterology (ISG), formed aTask Force on Gastroesophageal Reflux Disease to study:(a) the frequency of GERD in the Indian population, (b) thesymptom profile of GERD, and (c) dietary and lifestylefactors associated with GERD.
Methods
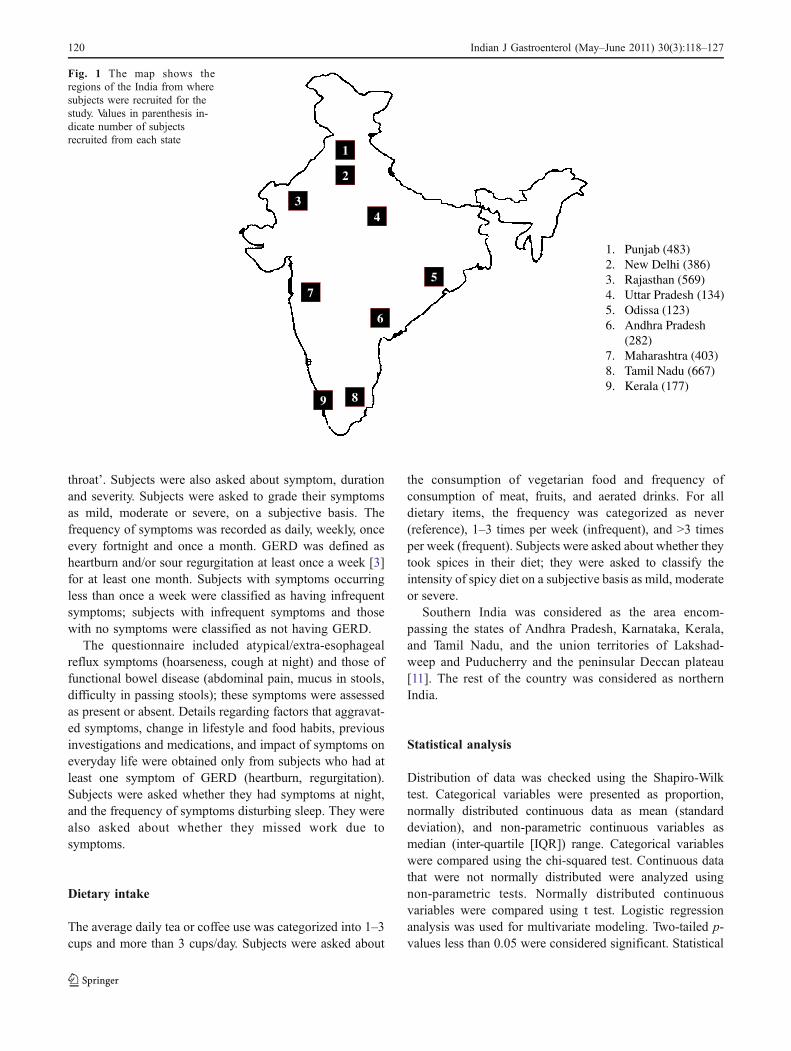
A detailed proforma in English was prepared by the TaskForce members and uploaded on the websites of the ISG(www.isg.org.in) and the (www.indianjgastro.com), andpublished in the March–April 2005 issue of the IndianJournal of Gastroenterology. The Journal is mailed to allmembers of the Society. Members who desired toparticipate in data collection were provided with adequatenumbers of a printed version of the proforma, or down-loaded or photocopied the proforma from any of the abovelocations. Participating centers included academic centers,tertiary care corporate hospitals and community centersfrom both rural and urban areas around these centers.Figure 1 shows the regional distribution of data collectionin the country. Study subjects included volunteers orattendants of patients who visited the hospital, and whowere willing to participate in the study. Pregnant womenand children less than 18 years of age were excluded.Physicians or their nurse assistants administered thequestionnaire. Data obtained from all centers were enteredin a spreadsheet for analysis.
Permission for the study was obtained from the EthicsCommittee of participating centers. Permissions were avail-able from centers in Ludhiana, Vishakhapatnam, Chennai,Jodhpur, Cuttack, and Lucknow. For the rest, a permissionwas obtained from the Ethics Committee at B Y L NairHospital at Mumbai. Informed written consent was obtainedfrom all volunteering subjects.
Questionnaire
Demographic, clinical, dietary and lifestyle factors thatmight be associated with GERD were recorded. Presenceand severity of symptoms of GERD was also recorded.Subjects were asked about symptoms suggestive of func-tional lower gastrointestinal disorder and about previousconsultation with physicians for either gastrointestinal ornon-gastrointestinal symptoms. In case a subject hadundergone upper GI endoscopy, the findings were recordedaccording to the LA classification. In addition, presence ofhiatus hernia, stricture, Barrett’s mucosa, and Schatzki’s ringwas noted.
Symptoms
Subjects were asked about the presence and frequency ofheartburn, sour regurgitation, chest pain and dysphagia. Thequestion for heartburn was ‘Do you feel a sensation ofburning in the chest’, and that for regurgitation was ‘Doyou have a feeling of sour food/liquid coming into your
Indian J Gastroenterol (May–June 2011) 30(3):118–127 119
throat’. Subjects were also asked about symptom, durationand severity. Subjects were asked to grade their symptomsas mild, moderate or severe, on a subjective basis. Thefrequency of symptoms was recorded as daily, weekly, onceevery fortnight and once a month. GERD was defined asheartburn and/or sour regurgitation at least once a week [3]for at least one month. Subjects with symptoms occurringless than once a week were classified as having infrequentsymptoms; subjects with infrequent symptoms and thosewith no symptoms were classified as not having GERD.
The questionnaire included atypical/extra-esophagealreflux symptoms (hoarseness, cough at night) and those offunctional bowel disease (abdominal pain, mucus in stools,difficulty in passing stools); these symptoms were assessedas present or absent. Details regarding factors that aggravat-ed symptoms, change in lifestyle and food habits, previousinvestigations and medications, and impact of symptoms oneveryday life were obtained only from subjects who had atleast one symptom of GERD (heartburn, regurgitation).Subjects were asked whether they had symptoms at night,and the frequency of symptoms disturbing sleep. They werealso asked about whether they missed work due tosymptoms.
Dietary intake
The average daily tea or coffee use was categorized into 1–3cups and more than 3 cups/day. Subjects were asked about
the consumption of vegetarian food and frequency ofconsumption of meat, fruits, and aerated drinks. For alldietary items, the frequency was categorized as never(reference), 1–3 times per week (infrequent), and >3 timesper week (frequent). Subjects were asked about whether theytook spices in their diet; they were asked to classify theintensity of spicy diet on a subjective basis as mild, moderateor severe.
Southern India was considered as the area encom-passing the states of Andhra Pradesh, Karnataka, Kerala,and Tamil Nadu, and the union territories of Lakshad-weep and Puducherry and the peninsular Deccan plateau[11]. The rest of the country was considered as northernIndia.
Statistical analysis
Distribution of data was checked using the Shapiro-Wilktest. Categorical variables were presented as proportion,normally distributed continuous data as mean (standarddeviation), and non-parametric continuous variables asmedian (inter-quartile [IQR]) range. Categorical variableswere compared using the chi-squared test. Continuous datathat were not normally distributed were analyzed usingnon-parametric tests. Normally distributed continuousvariables were compared using t test. Logistic regressionanalysis was used for multivariate modeling. Two-tailed p-values less than 0.05 were considered significant. Statistical
1. Punjab (483) 2. New Delhi (386)3. Rajasthan (569)4. Uttar Pradesh (134)5. Odissa (123)6. Andhra Pradesh
(282)7. Maharashtra (403)8. Tamil Nadu (667)9. Kerala (177)
1
2
34
5
6
7
89
Fig. 1 The map shows theregions of the India from wheresubjects were recruited for thestudy. Values in parenthesis in-dicate number of subjectsrecruited from each state
120 Indian J Gastroenterol (May–June 2011) 30(3):118–127
analysis was done using R and Epicalc software versionR2.9.0 (R development core team, Vienna, Austria).
Results
Demographic, clinical and lifestyle parameters
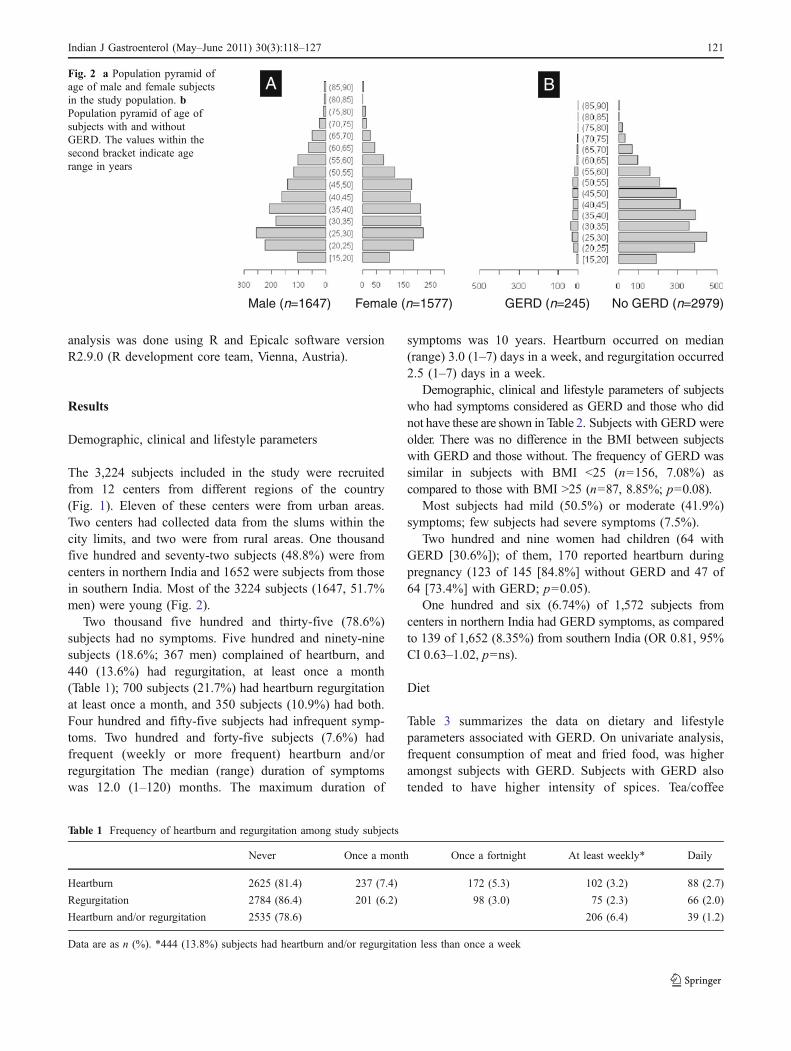
The 3,224 subjects included in the study were recruitedfrom 12 centers from different regions of the country(Fig. 1). Eleven of these centers were from urban areas.Two centers had collected data from the slums within thecity limits, and two were from rural areas. One thousandfive hundred and seventy-two subjects (48.8%) were fromcenters in northern India and 1652 were subjects from thosein southern India. Most of the 3224 subjects (1647, 51.7%men) were young (Fig. 2).
Two thousand five hundred and thirty-five (78.6%)subjects had no symptoms. Five hundred and ninety-ninesubjects (18.6%; 367 men) complained of heartburn, and440 (13.6%) had regurgitation, at least once a month(Table 1); 700 subjects (21.7%) had heartburn regurgitationat least once a month, and 350 subjects (10.9%) had both.Four hundred and fifty-five subjects had infrequent symp-toms. Two hundred and forty-five subjects (7.6%) hadfrequent (weekly or more frequent) heartburn and/orregurgitation The median (range) duration of symptomswas 12.0 (1–120) months. The maximum duration of
symptoms was 10 years. Heartburn occurred on median(range) 3.0 (1–7) days in a week, and regurgitation occurred2.5 (1–7) days in a week.
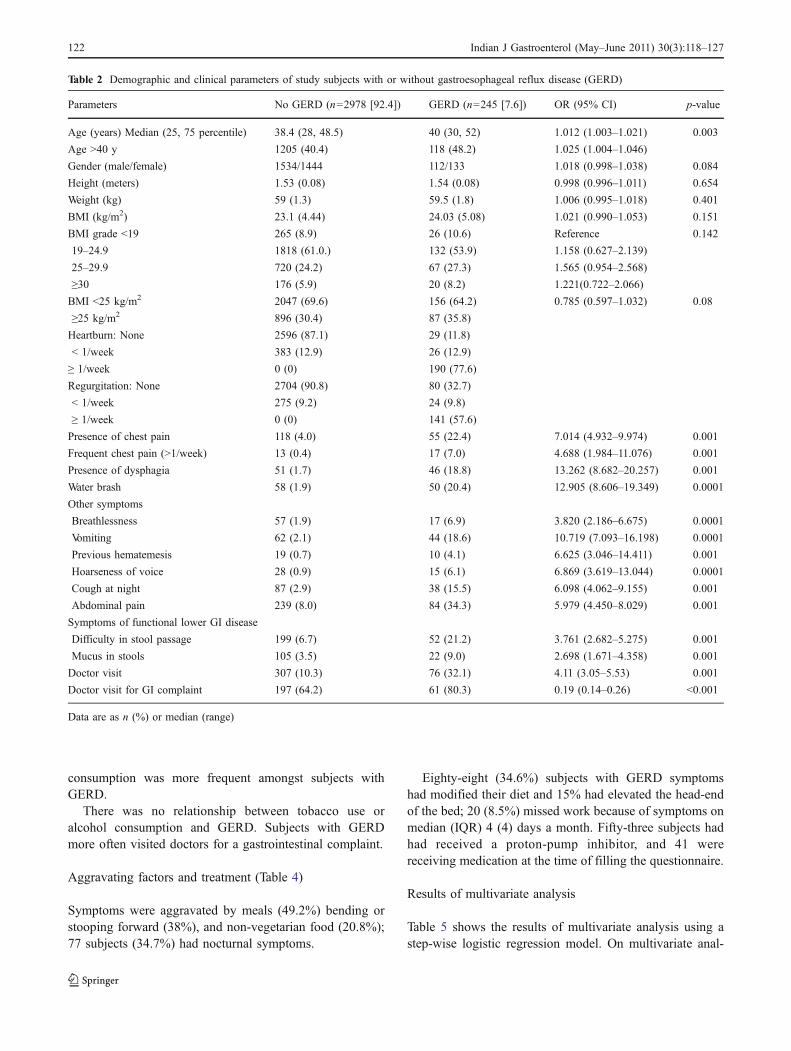
Demographic, clinical and lifestyle parameters of subjectswho had symptoms considered as GERD and those who didnot have these are shown in Table 2. Subjects with GERD wereolder. There was no difference in the BMI between subjectswith GERD and those without. The frequency of GERD wassimilar in subjects with BMI <25 (n=156, 7.08%) ascompared to those with BMI >25 (n=87, 8.85%; p=0.08).
Most subjects had mild (50.5%) or moderate (41.9%)symptoms; few subjects had severe symptoms (7.5%).
Two hundred and nine women had children (64 withGERD [30.6%]); of them, 170 reported heartburn duringpregnancy (123 of 145 [84.8%] without GERD and 47 of64 [73.4%] with GERD; p=0.05).
One hundred and six (6.74%) of 1,572 subjects fromcenters in northern India had GERD symptoms, as comparedto 139 of 1,652 (8.35%) from southern India (OR 0.81, 95%CI 0.63–1.02, p=ns).
Diet
Table 3 summarizes the data on dietary and lifestyleparameters associated with GERD. On univariate analysis,frequent consumption of meat and fried food, was higheramongst subjects with GERD. Subjects with GERD alsotended to have higher intensity of spices. Tea/coffee
Table 1 Frequency of heartburn and regurgitation among study subjects
Never Once a month Once a fortnight At least weekly* Daily
Heartburn 2625 (81.4) 237 (7.4) 172 (5.3) 102 (3.2) 88 (2.7)
Regurgitation 2784 (86.4) 201 (6.2) 98 (3.0) 75 (2.3) 66 (2.0)
Heartburn and/or regurgitation 2535 (78.6) 206 (6.4) 39 (1.2)
Data are as n (%). *444 (13.8%) subjects had heartburn and/or regurgitation less than once a week
GERD (n=245) No GERD (n=2979)Male (n=1647) Female (n=1577)
A BFig. 2 a Population pyramid ofage of male and female subjectsin the study population. bPopulation pyramid of age ofsubjects with and withoutGERD. The values within thesecond bracket indicate agerange in years
Indian J Gastroenterol (May–June 2011) 30(3):118–127 121
consumption was more frequent amongst subjects withGERD.
There was no relationship between tobacco use oralcohol consumption and GERD. Subjects with GERDmore often visited doctors for a gastrointestinal complaint.
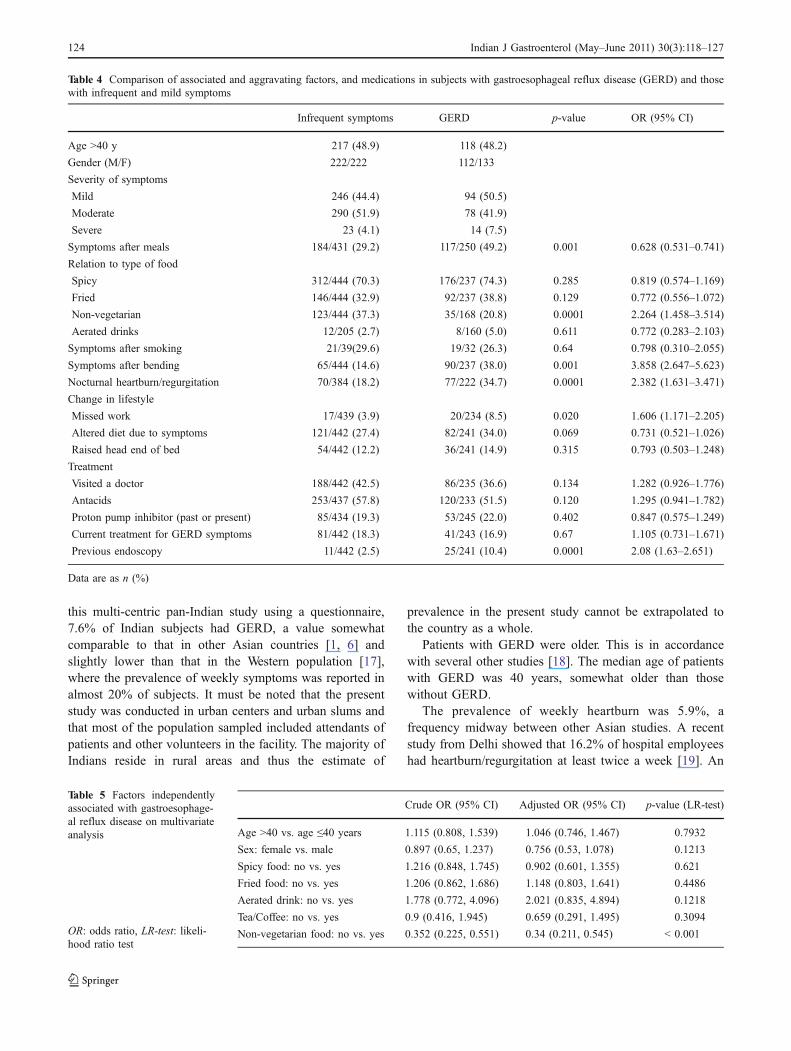
Aggravating factors and treatment (Table 4)
Symptoms were aggravated by meals (49.2%) bending orstooping forward (38%), and non-vegetarian food (20.8%);77 subjects (34.7%) had nocturnal symptoms.
Eighty-eight (34.6%) subjects with GERD symptomshad modified their diet and 15% had elevated the head-endof the bed; 20 (8.5%) missed work because of symptoms onmedian (IQR) 4 (4) days a month. Fifty-three subjects hadhad received a proton-pump inhibitor, and 41 werereceiving medication at the time of filling the questionnaire.
Results of multivariate analysis
Table 5 shows the results of multivariate analysis using astep-wise logistic regression model. On multivariate anal-
Table 2 Demographic and clinical parameters of study subjects with or without gastroesophageal reflux disease (GERD)
Parameters No GERD (n=2978 [92.4]) GERD (n=245 [7.6]) OR (95% CI) p-value
Age (years) Median (25, 75 percentile) 38.4 (28, 48.5) 40 (30, 52) 1.012 (1.003–1.021) 0.003
Age >40 y 1205 (40.4) 118 (48.2) 1.025 (1.004–1.046)
Gender (male/female) 1534/1444 112/133 1.018 (0.998–1.038) 0.084
Height (meters) 1.53 (0.08) 1.54 (0.08) 0.998 (0.996–1.011) 0.654
Weight (kg) 59 (1.3) 59.5 (1.8) 1.006 (0.995–1.018) 0.401
BMI (kg/m2) 23.1 (4.44) 24.03 (5.08) 1.021 (0.990–1.053) 0.151
BMI grade <19 265 (8.9) 26 (10.6) Reference 0.142
19–24.9 1818 (61.0.) 132 (53.9) 1.158 (0.627–2.139)
25–29.9 720 (24.2) 67 (27.3) 1.565 (0.954–2.568)
≥30 176 (5.9) 20 (8.2) 1.221(0.722–2.066)
BMI <25 kg/m2 2047 (69.6) 156 (64.2) 0.785 (0.597–1.032) 0.08
≥25 kg/m2 896 (30.4) 87 (35.8)
Heartburn: None 2596 (87.1) 29 (11.8)
< 1/week 383 (12.9) 26 (12.9)
≥ 1/week 0 (0) 190 (77.6)
Regurgitation: None 2704 (90.8) 80 (32.7)
< 1/week 275 (9.2) 24 (9.8)
≥ 1/week 0 (0) 141 (57.6)
Presence of chest pain 118 (4.0) 55 (22.4) 7.014 (4.932–9.974) 0.001
Frequent chest pain (>1/week) 13 (0.4) 17 (7.0) 4.688 (1.984–11.076) 0.001
Presence of dysphagia 51 (1.7) 46 (18.8) 13.262 (8.682–20.257) 0.001
Water brash 58 (1.9) 50 (20.4) 12.905 (8.606–19.349) 0.0001
Other symptoms
Breathlessness 57 (1.9) 17 (6.9) 3.820 (2.186–6.675) 0.0001
Vomiting 62 (2.1) 44 (18.6) 10.719 (7.093–16.198) 0.0001
Previous hematemesis 19 (0.7) 10 (4.1) 6.625 (3.046–14.411) 0.001
Hoarseness of voice 28 (0.9) 15 (6.1) 6.869 (3.619–13.044) 0.0001
Cough at night 87 (2.9) 38 (15.5) 6.098 (4.062–9.155) 0.001
Abdominal pain 239 (8.0) 84 (34.3) 5.979 (4.450–8.029) 0.001
Symptoms of functional lower GI disease
Difficulty in stool passage 199 (6.7) 52 (21.2) 3.761 (2.682–5.275) 0.001
Mucus in stools 105 (3.5) 22 (9.0) 2.698 (1.671–4.358) 0.001
Doctor visit 307 (10.3) 76 (32.1) 4.11 (3.05–5.53) 0.001
Doctor visit for GI complaint 197 (64.2) 61 (80.3) 0.19 (0.14–0.26) <0.001
Data are as n (%) or median (range)
122 Indian J Gastroenterol (May–June 2011) 30(3):118–127
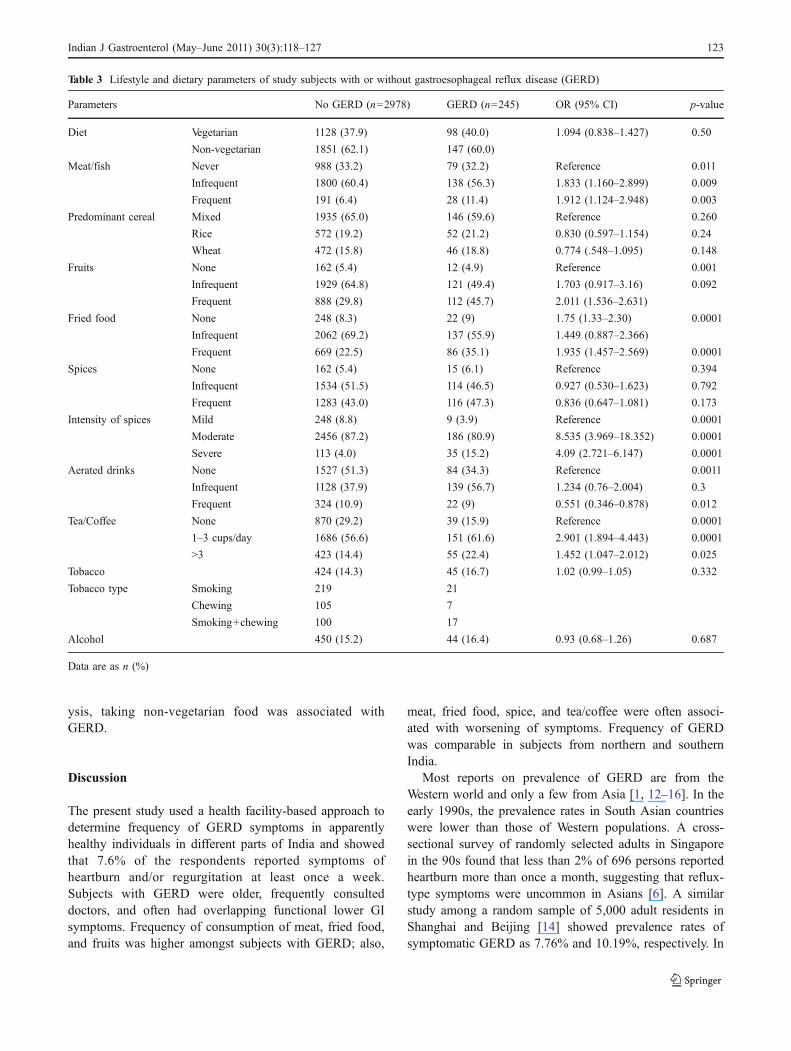
ysis, taking non-vegetarian food was associated withGERD.
Discussion
The present study used a health facility-based approach todetermine frequency of GERD symptoms in apparentlyhealthy individuals in different parts of India and showedthat 7.6% of the respondents reported symptoms ofheartburn and/or regurgitation at least once a week.Subjects with GERD were older, frequently consulteddoctors, and often had overlapping functional lower GIsymptoms. Frequency of consumption of meat, fried food,and fruits was higher amongst subjects with GERD; also,
meat, fried food, spice, and tea/coffee were often associ-ated with worsening of symptoms. Frequency of GERDwas comparable in subjects from northern and southernIndia.
Most reports on prevalence of GERD are from theWestern world and only a few from Asia [1, 12–16]. In theearly 1990s, the prevalence rates in South Asian countrieswere lower than those of Western populations. A cross-sectional survey of randomly selected adults in Singaporein the 90s found that less than 2% of 696 persons reportedheartburn more than once a month, suggesting that reflux-type symptoms were uncommon in Asians [6]. A similarstudy among a random sample of 5,000 adult residents inShanghai and Beijing [14] showed prevalence rates ofsymptomatic GERD as 7.76% and 10.19%, respectively. In
Table 3 Lifestyle and dietary parameters of study subjects with or without gastroesophageal reflux disease (GERD)
Parameters No GERD (n=2978) GERD (n=245) OR (95% CI) p-value
Diet Vegetarian 1128 (37.9) 98 (40.0) 1.094 (0.838–1.427) 0.50
Non-vegetarian 1851 (62.1) 147 (60.0)
Meat/fish Never 988 (33.2) 79 (32.2) Reference 0.011
Infrequent 1800 (60.4) 138 (56.3) 1.833 (1.160–2.899) 0.009
Frequent 191 (6.4) 28 (11.4) 1.912 (1.124–2.948) 0.003
Predominant cereal Mixed 1935 (65.0) 146 (59.6) Reference 0.260
Rice 572 (19.2) 52 (21.2) 0.830 (0.597–1.154) 0.24
Wheat 472 (15.8) 46 (18.8) 0.774 (.548–1.095) 0.148
Fruits None 162 (5.4) 12 (4.9) Reference 0.001
Infrequent 1929 (64.8) 121 (49.4) 1.703 (0.917–3.16) 0.092
Frequent 888 (29.8) 112 (45.7) 2.011 (1.536–2.631)
Fried food None 248 (8.3) 22 (9) 1.75 (1.33–2.30) 0.0001
Infrequent 2062 (69.2) 137 (55.9) 1.449 (0.887–2.366)
Frequent 669 (22.5) 86 (35.1) 1.935 (1.457–2.569) 0.0001
Spices None 162 (5.4) 15 (6.1) Reference 0.394
Infrequent 1534 (51.5) 114 (46.5) 0.927 (0.530–1.623) 0.792
Frequent 1283 (43.0) 116 (47.3) 0.836 (0.647–1.081) 0.173
Intensity of spices Mild 248 (8.8) 9 (3.9) Reference 0.0001
Moderate 2456 (87.2) 186 (80.9) 8.535 (3.969–18.352) 0.0001
Severe 113 (4.0) 35 (15.2) 4.09 (2.721–6.147) 0.0001
Aerated drinks None 1527 (51.3) 84 (34.3) Reference 0.0011
Infrequent 1128 (37.9) 139 (56.7) 1.234 (0.76–2.004) 0.3
Frequent 324 (10.9) 22 (9) 0.551 (0.346–0.878) 0.012
Tea/Coffee None 870 (29.2) 39 (15.9) Reference 0.0001
1–3 cups/day 1686 (56.6) 151 (61.6) 2.901 (1.894–4.443) 0.0001
>3 423 (14.4) 55 (22.4) 1.452 (1.047–2.012) 0.025
Tobacco 424 (14.3) 45 (16.7) 1.02 (0.99–1.05) 0.332
Tobacco type Smoking 219 21
Chewing 105 7
Smoking+chewing 100 17
Alcohol 450 (15.2) 44 (16.4) 0.93 (0.68–1.26) 0.687
Data are as n (%)
Indian J Gastroenterol (May–June 2011) 30(3):118–127 123
this multi-centric pan-Indian study using a questionnaire,7.6% of Indian subjects had GERD, a value somewhatcomparable to that in other Asian countries [1, 6] andslightly lower than that in the Western population [17],where the prevalence of weekly symptoms was reported inalmost 20% of subjects. It must be noted that the presentstudy was conducted in urban centers and urban slums andthat most of the population sampled included attendants ofpatients and other volunteers in the facility. The majority ofIndians reside in rural areas and thus the estimate of
prevalence in the present study cannot be extrapolated tothe country as a whole.
Patients with GERD were older. This is in accordancewith several other studies [18]. The median age of patientswith GERD was 40 years, somewhat older than thosewithout GERD.
The prevalence of weekly heartburn was 5.9%, afrequency midway between other Asian studies. A recentstudy from Delhi showed that 16.2% of hospital employeeshad heartburn/regurgitation at least twice a week [19]. An
Table 4 Comparison of associated and aggravating factors, and medications in subjects with gastroesophageal reflux disease (GERD) and thosewith infrequent and mild symptoms
Infrequent symptoms GERD p-value OR (95% CI)
Age >40 y 217 (48.9) 118 (48.2)
Gender (M/F) 222/222 112/133
Severity of symptoms
Mild 246 (44.4) 94 (50.5)
Moderate 290 (51.9) 78 (41.9)
Severe 23 (4.1) 14 (7.5)
Symptoms after meals 184/431 (29.2) 117/250 (49.2) 0.001 0.628 (0.531–0.741)
Relation to type of food
Spicy 312/444 (70.3) 176/237 (74.3) 0.285 0.819 (0.574–1.169)
Fried 146/444 (32.9) 92/237 (38.8) 0.129 0.772 (0.556–1.072)
Non-vegetarian 123/444 (37.3) 35/168 (20.8) 0.0001 2.264 (1.458–3.514)
Aerated drinks 12/205 (2.7) 8/160 (5.0) 0.611 0.772 (0.283–2.103)
Symptoms after smoking 21/39(29.6) 19/32 (26.3) 0.64 0.798 (0.310–2.055)
Symptoms after bending 65/444 (14.6) 90/237 (38.0) 0.001 3.858 (2.647–5.623)
Nocturnal heartburn/regurgitation 70/384 (18.2) 77/222 (34.7) 0.0001 2.382 (1.631–3.471)
Change in lifestyle
Missed work 17/439 (3.9) 20/234 (8.5) 0.020 1.606 (1.171–2.205)
Altered diet due to symptoms 121/442 (27.4) 82/241 (34.0) 0.069 0.731 (0.521–1.026)
Raised head end of bed 54/442 (12.2) 36/241 (14.9) 0.315 0.793 (0.503–1.248)
Treatment
Visited a doctor 188/442 (42.5) 86/235 (36.6) 0.134 1.282 (0.926–1.776)
Antacids 253/437 (57.8) 120/233 (51.5) 0.120 1.295 (0.941–1.782)
Proton pump inhibitor (past or present) 85/434 (19.3) 53/245 (22.0) 0.402 0.847 (0.575–1.249)
Current treatment for GERD symptoms 81/442 (18.3) 41/243 (16.9) 0.67 1.105 (0.731–1.671)
Previous endoscopy 11/442 (2.5) 25/241 (10.4) 0.0001 2.08 (1.63–2.651)
Data are as n (%)
Crude OR (95% CI) Adjusted OR (95% CI) p-value (LR-test)
Age >40 vs. age ≤40 years 1.115 (0.808, 1.539) 1.046 (0.746, 1.467) 0.7932
Sex: female vs. male 0.897 (0.65, 1.237) 0.756 (0.53, 1.078) 0.1213
Spicy food: no vs. yes 1.216 (0.848, 1.745) 0.902 (0.601, 1.355) 0.621
Fried food: no vs. yes 1.206 (0.862, 1.686) 1.148 (0.803, 1.641) 0.4486
Aerated drink: no vs. yes 1.778 (0.772, 4.096) 2.021 (0.835, 4.894) 0.1218
Tea/Coffee: no vs. yes 0.9 (0.416, 1.945) 0.659 (0.291, 1.495) 0.3094
Non-vegetarian food: no vs. yes 0.352 (0.225, 0.551) 0.34 (0.211, 0.545) < 0.001
Table 5 Factors independentlyassociated with gastroesophage-al reflux disease on multivariateanalysis
OR: odds ratio, LR-test: likeli-hood ratio test
124 Indian J Gastroenterol (May–June 2011) 30(3):118–127
earlier study from Mumbai had shown that 943 of 5,000(18.9%) had heartburn at least once a month, and 210(4.2%) subjects had frequent (≥weekly) heartburn [7]. Thelatter figures are comparable to those reported from China(frequency of weekly heartburn 4%) [20] and fromSingapore (10%) [6], which was lower than those of non-Asian populations, such as the rate of 17.8% in Americans[17], 14.7% in Australians [21], 10.3% in Finlanders [22]and 12% in Belgians [23]. The prevalence of dailyheartburn in our study was 2.7%, and 7.6% had GERDsymptoms. Moayyedi and Axon [24] identified 9 studiesassessing period prevalence of heartburn on a daily basis,and found that 5% (95% CI 4–6%) of 17,006 subjectsreported on the heartburn occurring daily.
The overlap of GERD and IBS was common. This is inaccordance with several other studies. In a communitystudy from northwest China [20], significantly moresubjects with GERD symptoms experienced constipation(22%) and diarrhea (14%) as compared to subjects withoutGERD symptoms (10% and 5%, respectively). In aprevious study from Mumbai [25] the prevalence ofdyspeptic symptoms was 30%, while among subjects withIBS, the prevalence of dyspepsia was 58%. A study froman urban population of Sydney residents in Penrith [21]showed that 36.8% of the dyspeptic subjects had ulcer-likeand reflux-like dyspepsia. In the reflux group, irritablebowel syndrome and dyspepsia were the highest functionaldisorders. In a pan-Indian study on IBS, 37% of 1,301patients reported heartburn [26].
A few studies have implicated foods that may precipitatereflux symptoms including dietary fat, chocolates, coffee,onions, citrus fruits, tomatoes and mints; it has beenpostulated that these foods mediate their effects throughrelaxation of the lower esophageal sphincter. Nandurkar etal. found no association between fat consumption andreflux symptoms [27]. Dietary fat has been postulated to beassociated with higher risk of GERD. As found in ourstudy, Terry et al. in a population-based case-controlledstudy from Sweden failed to detect any association betweenfoods that could potentially relax the lower esophagealsphincter and symptoms of reflux disease [28]. However,high dietary fat may aggravate symptoms leading to areduced fat intake in people with reflux symptoms,accounting for the lack of association observed in thepresent study. In a Swedish study, Nilsson et al. foundnegative associations between the risk of reflux symptomsand exposure to coffee, bread high in dietary fiber content,and frequent physical exercise. Intake of alcohol or tea didnot affect the risk of reflux [29]. We found that severalfoods were associated with GERD on univariate analysis;but on multivariate analysis, only intake of non-vegetarianfood was positively associated with GERD.
We noted that tea/coffee consumption of >3 cups/daywas higher in those with reflux symptoms; however thiswas not significant on multivariate analysis. Boekema et al.found that coffee did not alter postprandial acid reflux timeor number of acid reflux episodes in seven patients withGERD [30].
A strong association between increasing BMI and GERDhas been reported although not uniformly [27, 31]. Nandur-kar et al. reported that when the overall mean BMI was26.6 (5.7), 79 (37%) individuals had infrequent (<weekly)reflux and 16 (8%) reported frequent (≥weekly) reflux [27].Among those with BMI >25, 10% reported frequent refluxcompared to 4% of those with BMI ≤25. A communitystudy in Sweden reported no association between BMI andreflux symptoms in a randomly selected group of middleaged and elderly persons [32]. However, another well-conducted population-based case-control study with refluxesophagitis found a strong association between BMI andseverity of reflux esophagitis in women; a similar associ-ation was not identified in men [33]. Overall, the evidencesupports the findings that BMI is a significant risk factor forsymptomatic GERD. In our study, the BMI was similar insubjects with and those without GERD; this may bebecause only one-third of subjects had BMI >25.
Our study had some limitations. We did not performendoscopy in the community subjects. Our questionnaireincluded various questions on frequency, and severity ofheartburn and regurgitation; we did not use a symptomscore [34]. Also, our questionnaire has not been validatedearlier. However, it contained questions regarding symp-toms, and details of their frequency and severity, which arebasic elements of all validated questionnaires availablecurrently [34]. Moreover, the established questionnaireshave been shown to poorly correlate with pathologic reflux[35]. We did not assess the socioeconomic status of oursubjects. It is known that GERD is a disease of the affluent.
Our study is not truly representative of the Indianpopulation, as the sample was based on volunteers willingto participate in the study. It is likely that subjects withsymptoms were more likely to participate in the study(Berkson’s bias). Given that India is a vast country withheterogeneous populations, an ideal study should includerepresentative population samples from different regions ofthe country. The data we collected was obtained fromcenters located in 9 states; however the eastern states werenot represented.
We did not translate the proforma into various Indianlanguages. Our proforma was made in English, and thenurse assistant or physician administered the questionnaire.This was done to avoid multiple translations, as also tomaintain uniformity of administration of questionnaireuniformly to illiterate subjects.
Indian J Gastroenterol (May–June 2011) 30(3):118–127 125
In conclusion, the present study showed that 7.6% of theIndian reported symptoms of GERD frequent enough todiagnose GERD. Subjects with GERD were older, fre-quently consulted doctors, more often had overlappingfunctional lower GI symptoms. Frequency of consumptionof meat, fried food and spices was higher and fruitconsumption lower amongst subjects with GERD; also,consumption of some of these food items aggravatedsymptoms.
Acknowledgments The ISG Task Force thanks Zydus Alidac,Ahmedabad, India for an unconditional academic financial grant. Wealso wish to thank Mrs Thilaga Murugesh for designing the databaseand Mrs Namrata Shinde for data entry.
Contribution statement S J Bhatia was the co-ordinator of the taskforce, and collated and analyzed the data, and wrote the draftmanuscript and edited it. D N Reddy, PAbraham, G Choudhuri, andS L Broor chaired the Task Force. P Abraham, U C Ghoshal and VJayanthi assisted in the analysis of data and writing the manuscript.The rest of the contributors provided data and valuable inputs. Theirnames of the rest of contributors are listed in alphabetical order in themanuscript.
References
1. Chang CS, Poon SK, Lien HC, Chen GH. The incidence of refluxesophagitis among the Chinese. Am J Gastroenterol.1997;92:668–71.
2. Cheung TK, Wong BC, Lam SK. Gastro-oesophageal refluxdisease in Asia: birth of a ‘new’ disease? Drugs. 2008;68:399–406.
3. Cho YS, Choi MG, Jeong JJ, et al. Prevalence and clinicalspectrum of gastroesophageal reflux: a population-based study inAsan-si, Korea. Am J Gastroenterol. 2005;100:747–53.
4. Dent J, El-Serag HB, Wallander MA, Johansson S. Epidemiologyof gastro-oesophageal reflux disease: a systematic review. Gut.2005;54:710–7.
5. Terano A. The current status of GERD between the west and theeast. J Gastroenterol. 2003;38 Suppl 15:1–2.
6. Ho KY, Kang JY, Seow A. Prevalence of gastrointestinalsymptoms in a multiracial Asian population, with particularreference to reflux-type symptoms. Am J Gastroenterol.1998;93:1816–22.
7. Paranjape AY, Bhatia SJ, Mistry FP, Abraham P. Prevalence ofsymptoms of gastroesophageal reflux disease (GERD) in thegeneral population of Mumbai (Abstract). Indian J Gastroenterol.1996;15 Suppl 1:A5.
8. Somani SK, Ghoshal UC, Saraswat VA, et al. Correlation ofesophageal pH and motor abnormalities with endoscopic severityof reflux esophagitis. Dis Esophagus. 2004;17:58–62.
9. Chourasia D, Misra A, Tripathi S, Krishnani N, Ghoshal UC.Patients with H. pylori infection have less severe gastroesophagealreflux disease (GERD): A study using endoscopy, 24-hour gastricand esophageal pH metry. Indian J Gastroenterol. 2011;30:12–21.
10. Ghoshal UC, Chourasia D. Gastroesophageal reflux disease andHelicobacter pylori: what may be the relationship? J Neuro-gastroenterol Motil. 2010;16:243–50.
11. http://en.wikipedia.org/wiki/Deccan_Plateau. Accessed on Octo-ber 10, 2010.
12. Bayrakci B, Kasap E, Kitapcioglu G, Bor S. Low prevalenceof erosive esophagitis and Barrett esophagus in a tertiaryreferral center in Turkey. Turk J Gastroenterol. 2008;19:145–51.
13. Chen M, Xiong L, Chen H, Xu A, He L, Hu P. Prevalence, riskfactors and impact of gastroesophageal reflux disease symptoms: apopulation-based study in South China. Scand J Gastroenterol.2005;40:759–67.
14. Pan G, Xu G, Ke M, et al. Epidemiological study of symptomaticgastroesophageal reflux disease in China: Beijing and Shanghai.Chin J Dig Dis. 2000;1:2–8.
15. Fujimoto K, Iwakiri R, Okamoto K, et al. Characteristics ofgastroesophageal reflux disease in Japan: increased prevalence inelderly women. J Gastroenterol. 2003;38 Suppl 15:3–6.
16. Fujiwara Y, Higuchi K, Watanabe Y, et al. Prevalence ofgastroesophageal reflux disease and gastroesophageal refluxdisease symptoms in Japan. J Gastroenterol Hepatol.2005;20:26–9.
17. Locke GR 3rd, Talley NJ, Fett SL, Zinsmeister AR, Melton LJ3rd. Prevalence and clinical spectrum of gastroesophageal reflux:a population-based study in Olmsted County, Minnesota. Gastro-enterology. 1997;112:1448–56.
18. Nilsson M, Johnsen R, Ye W, Hveem K, Lagergren J. Prevalenceof gastro-oesophageal reflux symptoms and the influence of ageand sex. Scand J Gastroenterol. 2004;39:1040–5.
19. Sharma PK, Ahuja V, Madan K, Gupta S, Raizada A, Sharma MP.Prevalence, severity, and risk factors of symptomatic gastroesopha-geal reflux disease among employees of a large hospital in NorthernIndia. Indian J Gastroenterol 2010;29: doi:10.1007/s12664-010-0065-5.
20. Wang JH, Luo JY, Dong L, Gong J, Tong M. Epidemiology ofgastroesophageal reflux disease: a general population-based studyin Xi’an of Northwest China. World J Gastroenterol.2004;10:1647–51.
21. Talley NJ, Boyce P, Jones M. Identification of distinct upper andlower gastrointestinal symptom groupings in an urban population.Gut. 1998;42:690–5.
22. Isolauri J, Laippala P. Prevalence of symptoms suggestive ofgastro-oesophageal reflux disease in an adult population. AnnMed. 1995;27:67–70.
23. Louis E, DeLooze D, Deprez P, et al. Heartburn in Belgium:prevalence, impact on daily life, and utilization of medicalresources. Eur J Gastroenterol Hepatol. 2002;14:279–84.
24. Moayyedi P, Axon ATR. Gastro-oesophageal reflux disease—theextent of the problem (Review). Aliment Pharmacol Ther. 2005;22Suppl 1:11–9.
25. Shah SS, Bhatia SJ, Mistry FP. Epidemiology of dyspepsia in thegeneral population in Mumbai. Indian J Gastroenterol.2001;20:103–6.
26. Ghoshal UC, Abraham P, Bhatt C, et al. Epidemiological andclinical profile of irritable bowel syndrome in India: report of theIndian Society of Gastroenterology Task Force. Indian J Gastro-enterol. 2008;27:22–8.
27. Nandurkar S, Locke GR 3rd, Fett S, Zinsmeister AR, CameronAJ, Talley NJ. Relationship between body mass index, diet,exercise and gastro-oesophageal reflux symptoms in a community.Aliment Pharmacol Ther. 2004;20:497–505.
28. Terry P, Lagergren J, Wolk A, Nyren O. Reflux-inducing dietaryfactors and risk of adenocarcinoma of the esophagus and gastriccardia. Nutr Cancer. 2000;38:186–91.
29. Nilsson M, Johnsen R, Ye W, Hveem K, Lagergren J. Lifestylerelated risk factors in the aetiology of gastrooesophageal reflux.Gut. 2004;53:1730–5.
126 Indian J Gastroenterol (May–June 2011) 30(3):118–127
30. Boekema PJ, Samsom M, Smout AJ. Effect of coffee on gastro-oesophageal reflux in patients with reflux disease and healthycontrols. Eur J Gastroenterol Hepatol. 1999;11:1271–6.
31. Ruhl CE, Everhart JE. Overweight, but not high dietary fat intake,increases risk of gastroesophageal reflux disease hospitalization:the NHANES I Epidemiologic Followup Study. First NationalHealth and Nutrition Examination Survey. Ann Epidemiol.1999;9:424–35.
32. Lagergren J. Body measures in relation to gastro-oesophagealreflux. Gut. 2007;56:741–2.
33. Nilsson M, Lagergren J. The relation between body mass andgastro-oesophageal reflux. Best Pract Res Clin Gastroenterol.2004;18:1117–23.
34. Aanen MC, Numans ME, Weusten BL, Smout AJ. Diagnosticvalue of the Reflux Disease Questionnaire in general practice.Digestion. 2006;74:162–8.
35. Chan K, Liu G, Miller L, et al. Lack of correlation between a self-administered subjective GERD questionnaire and pathologic GERDdiagnosed by 24-h esophageal pH monitoring. J Gastrointest Surg.2010;14:427–36.
Indian J Gastroenterol (May–June 2011) 30(3):118–127 127
Related Documents