EPI 809 / Spring 2008 EPI 809 / Spring 2008 Final Review Final Review

EPI 809 / Spring 2008 Final Review EPI 809 / Spring 2008 Ch11 Regression and correlation Linear regression Model, interpretation. Model, interpretation.
Dec 19, 2015
Welcome message from author
This document is posted to help you gain knowledge. Please leave a comment to let me know what you think about it! Share it to your friends and learn new things together.
Transcript

EPI 809 / Spring 2008EPI 809 / Spring 2008
Final ReviewFinal Review

EPI 809 / Spring 2008EPI 809 / Spring 2008
Ch11 Regression and correlationCh11 Regression and correlation
Linear regressionLinear regression Model, interpretation. Model, interpretation. Model Coefficient calculation.Model Coefficient calculation.
• bb = = LLxyxy / L / Lxx xx (slope), b(slope), b00 = Y – b x = Y – b x Assumption, goodness-of-fit, validity. Assumption, goodness-of-fit, validity. Independent error, Gaussian dist. Const. var.Independent error, Gaussian dist. Const. var. Test and inference (t-test).Test and inference (t-test). Multiple regression. F-test vs T-test.Multiple regression. F-test vs T-test.
Pearson correlationPearson correlation Interpretation and inferenceInterpretation and inference T-test and Fisher’s z-test (transformation).T-test and Fisher’s z-test (transformation).
1. t = r (n-2)1. t = r (n-2)1/2 1/2 /(1-r/(1-r22))1/21/2 ~ t ~ t n-2n-2
2. Z = ½ ln [(1+r) / (1-r)] ~ Normal mean=Z(r2. Z = ½ ln [(1+r) / (1-r)] ~ Normal mean=Z(r00) and var =1/(n-3)) and var =1/(n-3)
- -

EPI 809 / Spring 2008EPI 809 / Spring 2008
Learning ObjectivesLearning Objectives
1.1. Describe the Linear Regression ModelDescribe the Linear Regression Model
2.2. State the Regression Modeling StepsState the Regression Modeling Steps
3.3. Explain Ordinary Least SquaresExplain Ordinary Least Squares
4.4. Compute Regression CoefficientsCompute Regression Coefficients
5.5. Understand and check model assumptionsUnderstand and check model assumptions
6.6. Predict Response VariablePredict Response Variable
7.7. Comments of SAS OutputComments of SAS Output

EPI 809 / Spring 2008EPI 809 / Spring 2008
Learning Objectives… Learning Objectives…
8.8. Correlation ModelsCorrelation Models
9.9. Link between a correlation model and a Link between a correlation model and a regression model (one indep. Var): regression model (one indep. Var): b = rSb = rSyy/S/Sxx, , and Sand Syy
22 = = LLyyyy
/(n-1)/(n-1)
10.10. Test of coefficient of CorrelationTest of coefficient of Correlation
EPI 809 / Spring 2008EPI 809 / Spring 2008
ANOVAANOVA
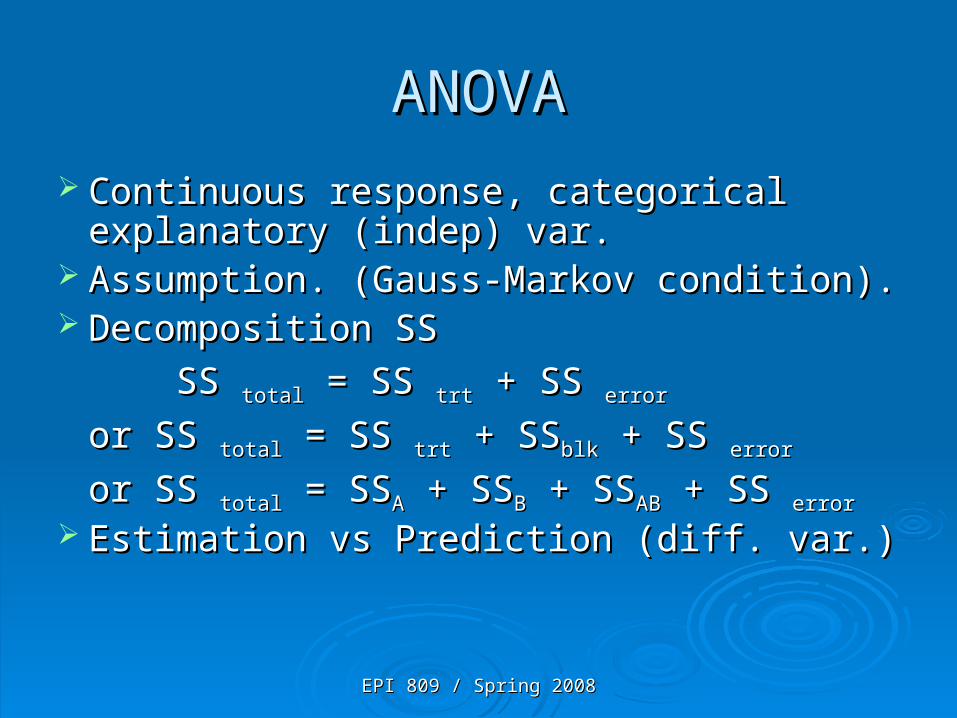
Continuous response, categorical Continuous response, categorical explanatory (indep) var. explanatory (indep) var.
Assumption. (Gauss-Markov condition).Assumption. (Gauss-Markov condition). Decomposition SSDecomposition SS
SS SS totaltotal = SS = SS trttrt + SS + SS errorerror
or SS or SS totaltotal = SS = SS trttrt + SS + SSblkblk + SS + SS errorerror
or SS or SS totaltotal = SS = SSAA + SS + SSBB + SS + SSABAB + SS + SS errorerror
Estimation vs Prediction (diff. var.)Estimation vs Prediction (diff. var.)

EPI 809 / Spring 2008EPI 809 / Spring 2008
Multiple comparisonMultiple comparison
Contrast for multiple levels of var.Contrast for multiple levels of var.
construct contrast according to aim.construct contrast according to aim. Adjustment for multiple comparisonAdjustment for multiple comparison LSD, Bonferroni, Sheffe. LSD, Bonferroni, Sheffe.

EPI 809 / Spring 2008EPI 809 / Spring 2008
Ch 9 Non-parametric testsCh 9 Non-parametric tests
Mainly interested in ranking (distribution)Mainly interested in ranking (distribution)
Normality of data may be violated.Normality of data may be violated. Sign test, rank sum test, signed-rank test, Sign test, rank sum test, signed-rank test,
Kruskal-Wallis testKruskal-Wallis test

EPI 809 / Spring 2008EPI 809 / Spring 2008
SummarySummary
Nonparametric Parametric
Sign Rank test One sample t-test
Wilcoxon Rank – Sum test(Mann-Whitney U test)
Two sample t-test
Wilcoxon Signed-Rank test Two paired sample t-test
Kruskal-Wallis test Multiple sample test.

EPI 809 / Spring 2008EPI 809 / Spring 2008
Ch 10 Categorical Data Ch 10 Categorical Data AnalysisAnalysis

EPI 809 / Spring 2008EPI 809 / Spring 2008
Learning ObjectivesLearning Objectives
1.1. Comparison of binomial proportion using Z and Comparison of binomial proportion using Z and 22 Test. Test.
2.2. Explain Explain 22 Test for Independence of 2 variables Test for Independence of 2 variables
3.3. Explain The Fisher’s test for independenceExplain The Fisher’s test for independence
4.4. McNemar’s tests for correlated dataMcNemar’s tests for correlated data
5.5. Kappa StatisticKappa Statistic
6.6. Use of SAS Proc FREQ Use of SAS Proc FREQ
EPI 809 / Spring 2008EPI 809 / Spring 2008
Z Test for Difference in Two Z Test for Difference in Two ProportionsProportions
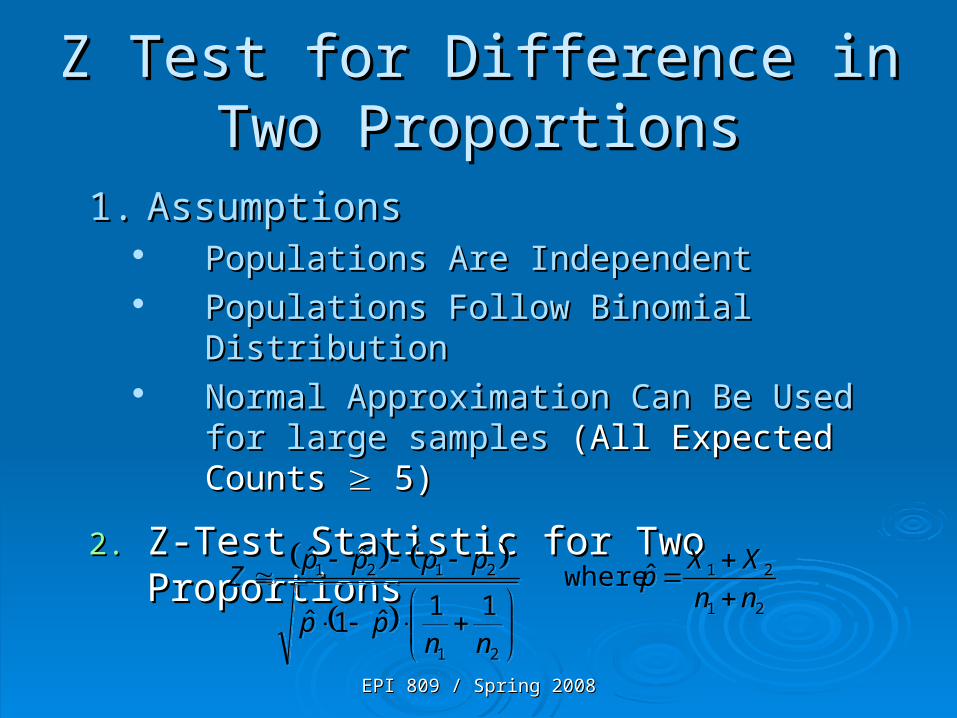
1.1. AssumptionsAssumptions Populations Are IndependentPopulations Are Independent Populations Follow Binomial DistributionPopulations Follow Binomial Distribution Normal Approximation Can Be Used for Normal Approximation Can Be Used for
large samples large samples (All Expected Counts (All Expected Counts 5) 5)
2.2. Z-Test Statistic for Two ProportionsZ-Test Statistic for Two Proportions
21
21
21
2121 ˆ where11
ˆ1ˆ
ˆˆ
nn
XXp
nnpp
ppppZ
21
21
21
2121 ˆ where11
ˆ1ˆ
ˆˆ
nn
XXp
nnpp
ppppZ
EPI 809 / Spring 2008EPI 809 / Spring 2008
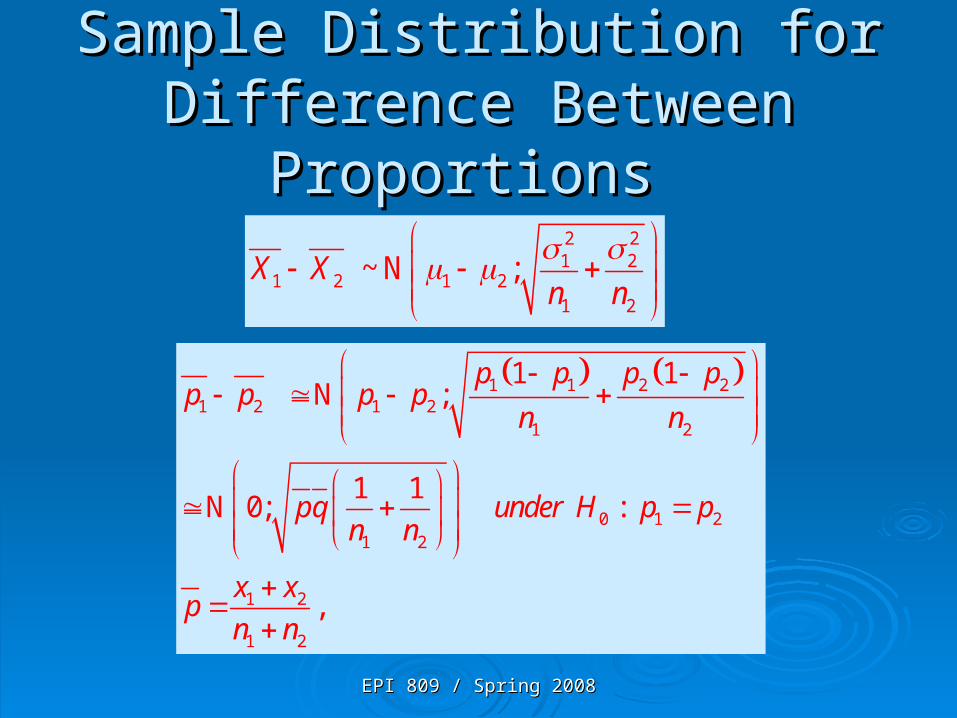
Sample Distribution for Difference Sample Distribution for Difference Between Proportions Between Proportions
1 1 2 21 2 1 2
1 2
0 1 21 2
1 2
1 2
1 1 N ;
1 1N 0; :
,
p p p pp p p p
n n
pq under H p pn n
x xp
n n
2 21 2
1 2 1 21 2
~ N ;X Xn n

EPI 809 / Spring 2008EPI 809 / Spring 2008
22 Test of Independence Test of Independence Hypotheses & StatisticHypotheses & Statistic
1.1. HypothesesHypothesesHH00: Variables Are Independent : Variables Are Independent
HHaa: Variables Are Related (Dependent): Variables Are Related (Dependent)
2.2. Test StatisticTest Statistic
3. Degrees of Freedom: (r - 1)(c - 1)
rr Rows & Rows & CC Columns Columns
O: Observed countO: Observed count
E: Expected countE: Expected count
cells all
2
2
ij
ijij
E
EO

EPI 809 / Spring 2008EPI 809 / Spring 2008
Fisher’s Exact TestFisher’s Exact Test Hypergeometric distributionHypergeometric distribution
Example: 2x2 table (cell counts a, b, c, d).Example: 2x2 table (cell counts a, b, c, d).Assuming fixed marginal totals:Assuming fixed marginal totals:M1 = a+b, M2 = c+d, N1 = a+c, N2 = b+d.M1 = a+b, M2 = c+d, N1 = a+c, N2 = b+d.for convenience assume N1<N2, M1<M2.for convenience assume N1<N2, M1<M2.possible value of a are: 0, 1, …min(M1,N1). possible value of a are: 0, 1, …min(M1,N1).
Probability distribution of cell count a follows a Probability distribution of cell count a follows a hypergeometric distribution:hypergeometric distribution:N = a + b + c + d = N1 + N2 = M1 + M2N = a + b + c + d = N1 + N2 = M1 + M2 Pr (x=a) = N1! N2! M1! M2! / [N! a! b! c! d!]Pr (x=a) = N1! N2! M1! M2! / [N! a! b! c! d!] Mean (x) = M1 N1 / NMean (x) = M1 N1 / N Var (x) = M1 M2 N1 N2 / [NVar (x) = M1 M2 N1 N2 / [N2 2 (N-1)](N-1)]
a b M1
c d M2
N1 N2 N

EPI 809 / Spring 2008EPI 809 / Spring 2008
Fisher’s Exact TestFisher’s Exact Test Fisher exact test is based on hypergeometric distr. Fisher exact test is based on hypergeometric distr. Probability of observing this specific table given Probability of observing this specific table given
fixed marginal totals isfixed marginal totals isPr (a=3,b=7, c=5, d=10) = 10!15!8!17!/[25!3!7!5!10!]Pr (a=3,b=7, c=5, d=10) = 10!15!8!17!/[25!3!7!5!10!]= 0.3332= 0.3332
Note the above is not the p-value. Why?Note the above is not the p-value. Why? Not the accumulative probability, or not the tail Not the accumulative probability, or not the tail
probability. probability. Notice range of Notice range of aa: [0, min(M1, N1)] for M1<M2 and : [0, min(M1, N1)] for M1<M2 and
N1<N2N1<N2 Tail prob = sum of all values (a = 3, 2, 1, 0). Tail prob = sum of all values (a = 3, 2, 1, 0).

EPI 809 / Spring 2008EPI 809 / Spring 2008
Kappa ( Kappa ( ) )Measures of Association Measures of Association
Cohen’s Kappa ( Cohen’s Kappa ( ) ) Cohen’s Cohen’s measures the agreement measures the agreement
between two variables and is defined bybetween two variables and is defined by
=po - pe
1 - pe
Kappa >.75 excellent reproducibility;
[.4, .75] good reproducibility;
<.4 marginal reproducibility.

EPI 809 / Spring 2008EPI 809 / Spring 2008
HH00: : = = : discordant probabilities. : discordant probabilities.
HHaa: : Test Statistic: Chi-squares with df = 1.Test Statistic: Chi-squares with df = 1.
B – C| - 1 }2
2 = B + C
McNemar’s Test for Correlated McNemar’s Test for Correlated (Dependent) Proportions(Dependent) Proportions

EPI 809 / Spring 2008EPI 809 / Spring 2008
Chapter 13Chapter 13
Design and Analysis Techniques Design and Analysis Techniques for Epidemiologic Studiesfor Epidemiologic Studies
EPI 809 / Spring 2008EPI 809 / Spring 2008
Learning ObjectivesLearning Objectives
1.1. Define study designsDefine study designs
2.2. Measures of effects for categorical dataMeasures of effects for categorical data
3.3. Confounders and effects modificationsConfounders and effects modifications
4.4. Stratified analysis (Mantel Haenszel Stratified analysis (Mantel Haenszel statistic, multiple logistic regression)statistic, multiple logistic regression)
5.5. Use of SAS Proc FREQ and Proc Use of SAS Proc FREQ and Proc LogisticLogistic

EPI 809 / Spring 2008EPI 809 / Spring 2008
Experimental StudyExperimental Study
Randomization protects against bias in assignment to groups.
Blinding protects against bias in outcome assessment or measurement.
Control for (major) sources of variability, although not necessarily reflecting real life conditions
Expensive in terms of time and money

EPI 809 / Spring 2008EPI 809 / Spring 2008
Observational Study most likely Observational Study most likely used in Epidemiology used in Epidemiology
Types of study
Cross-sectional study Both expos & outcome random;
Case-control study (retrospective) Random expos, fixed outcome;
Cohort study (Prospective) Fixed expos, random outcome.

EPI 809 / Spring 2008EPI 809 / Spring 2008
Measures of effectsMeasures of effects
Depends on study design Depends on study design Prospective study: Incidence of disease (risk Prospective study: Incidence of disease (risk
difference, relative risk, odds ratio of disease)difference, relative risk, odds ratio of disease)
Cross-sectional: Prevalence of disease (risk Cross-sectional: Prevalence of disease (risk difference, relative risk, odds ratio of disease)difference, relative risk, odds ratio of disease)
Case-cohort: study of exposure (odds ratio of Case-cohort: study of exposure (odds ratio of exposure)exposure)

EPI 809 / Spring 2008EPI 809 / Spring 2008
Only for cross-sectional and cohort studies Measured the attributable risk due to exposureMeasured the attributable risk due to exposure
Risk differenceRisk difference
1 1 2 23 3
1 2 1 2
ˆ ˆ ˆ ˆ(1 ) (1 )ˆ( )p p p p ab cd
se RDn n n n
1 1 2 2
2 1
ˆ ˆ/ /
ˆ ˆ ˆ
p a n p c n
RD p p
| |RD P D E P D E
EPI 809 / Spring 2008EPI 809 / Spring 2008
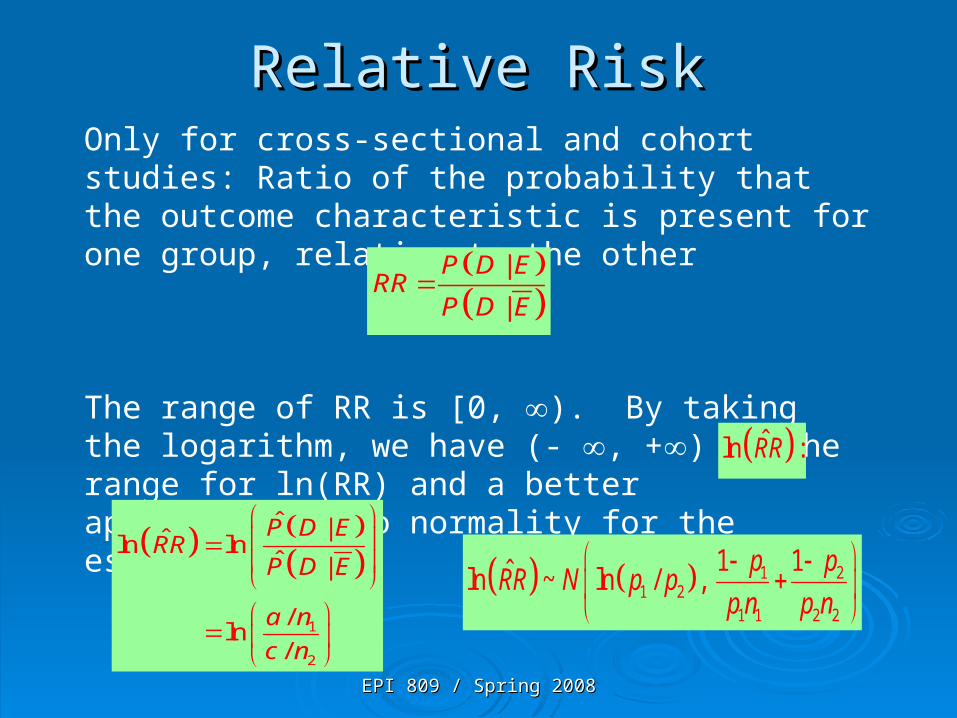
Only for cross-sectional and cohort studies: Ratio of the probability that the outcome characteristic is present for one group, relative to the other
The range of RR is [0, ). By taking the logarithm, we have (- , +) as the range for ln(RR) and a better approximation to normality for the estimated
Relative RiskRelative Risk
|
|
P D ERR
P D E
1
2
ˆ |ˆln lnˆ |
/ln
/
P D ERR
P D E
a n
c n
ˆln :RR
1 21 2
1 1 2 2
1 1ˆln ~ ln / , p p
RR N p pp n p n

EPI 809 / Spring 2008EPI 809 / Spring 2008
Odds Ratio - DiseaseOdds Ratio - Disease
Odds ratio is the odds of the event for exposed Odds ratio is the odds of the event for exposed divided by the odds of the event for unexposeddivided by the odds of the event for unexposed
Sample odds of the outcome for each group:Sample odds of the outcome for each group:
E E
a codds and odds
b d
| / 1 |( )
| / 1 |E
E
P D E P D E odds adOR disease
odds bcP D E P D E

EPI 809 / Spring 2008EPI 809 / Spring 2008
we fixed the number of cases and controls then ascertained exposure status. The relative risk is therefore not estimable from these data alone. Instead of the relative risk we can estimate the exposure OR which Cornfield (1951) showed equivalent to the disease OR:
In other words, the odds ratio can be estimated regardless of the sampling scheme.
Odds Ratio-ExposureOdds Ratio-Exposure
( ) (exp )ad
OR disease OR osurebc
| / 1 | | / 1 |
| / 1 | | / 1 |
P E D P E D P D E P D E
P E D P E D P D E P D E

EPI 809 / Spring 2008EPI 809 / Spring 2008
For rare diseases, the disease odds ratio approximates the relative risk:
Since with case-control data we are able to effectively estimate the exposure odds ratio we are then able to equivalently estimate the disease odds ratio which for rare diseases approximates the relative risk.
Odds Ratio-Relative riskOdds Ratio-Relative risk
| / 1 | |
|| / 1 |
P D E P D E P D E
P D EP D E P D E

EPI 809 / Spring 2008EPI 809 / Spring 2008
The odds ratio has [0, ) as its range. The log odds ratio has (- , +) as its range and the normal approximation is better as an approximation to the estimated log odds ratio.
Confidence intervals are based upon:
Therefore, a (1 - ) confidence interval for the odds ratio is given by exponentiating the lower and upper bounds.
Odds RatioOdds Ratio
12
1 1 1 1ln
adZ
bc a b c d
1 1 1 1 2 2 2 2
1 1 1 1ˆln ~N ln(OR),n n n n
ORp q p q

EPI 809 / Spring 2008EPI 809 / Spring 2008
RD = p1 - p2 = risk difference (null: RD = 0)
• also known as attributable risk or excess risk
• measures absolute effect – the proportion of cases among the exposed that can be attributed to exposure
RR = p1/ p2 = relative risk (null: RR = 1)
• measures relative effect of exposure
• bounded above by 1/p2
OR = [p1(1-p2)]/[ p2 (1-p1)] = odds ratio (null: OR = 1)
• range is 0 to
• approximates RR for rare events
• invariant of switching rows and cols
• key parameter in logistic regression
SummarySummary

EPI 809 / Spring 2008EPI 809 / Spring 2008
• Variation in the magnitude of measure of effect Variation in the magnitude of measure of effect across levels of a third variable.across levels of a third variable.
• Effect modification is not a bias but useful Effect modification is not a bias but useful informationinformation
Effect modifierEffect modifier
Happens when RR or OR is different between strata (subgroups of population)

EPI 809 / Spring 2008EPI 809 / Spring 2008
ConfoundingConfounding
• Distortion of measure of effect because of a Distortion of measure of effect because of a third factorthird factor
• Should be prevented or Needs to be Should be prevented or Needs to be controlled forcontrolled for

EPI 809 / Spring 2008EPI 809 / Spring 2008
ConfoundingConfounding
Exposure Outcome
Third variable
Be associated with exposure - without being the consequence of exposure
Be associated with outcome - independently of exposure

EPI 809 / Spring 2008EPI 809 / Spring 2008
• Positive confounding - positively or negatively related to both the disease and exposure
• Negative confounding- positively related to disease but is negatively related to exposure or the reverse
• Prevention (Design Stage)Prevention (Design Stage) Restriction to one stratum or MatchingRestriction to one stratum or Matching• Control (Analysis Stage)Control (Analysis Stage) Stratified analysis – Mantel HaenszelStratified analysis – Mantel Haenszel MultivariaMultivariableble analysis – logistic regression. analysis – logistic regression.
Confounding and ControlConfounding and Control

EPI 809 / Spring 2008EPI 809 / Spring 2008
(1) The Mantel-Haenszel estimate of the odds ratio assumes there is a common odds ratio:
ORpool = OR1 = OR2 = … = ORK
To estimate the common odds ratio we take a weighted average of the stratum-specific odds ratios:
MH estimate:1
1
ˆ
K
i i iiK
i i ii
a d nOR
b c n
Mantel Haenszel Methods Mantel Haenszel Methods common odds ratiocommon odds ratio

EPI 809 / Spring 2008EPI 809 / Spring 2008
(2) Test of common odds ratio
Ho: common OR is 1.0 vs. Ha: common OR 1.0
- A standard error is available for the MH common odds- Standard CI intervals and test statistics are based on the standard normal distribution.
(3) Test of effect modification (heterogeneity, interaction)
Ho: OR1 = OR2 = … = ORK
Ha: not all stratum-specific OR’s are equal
Breslow-Day (SAS) homogeneity test can be used
Mantel Haenszel MethodsMantel Haenszel Methods

EPI 809 / Spring 2008EPI 809 / Spring 2008
Multiple Logistic RegressionMultiple Logistic Regression
EPI 809 / Spring 2008EPI 809 / Spring 2008
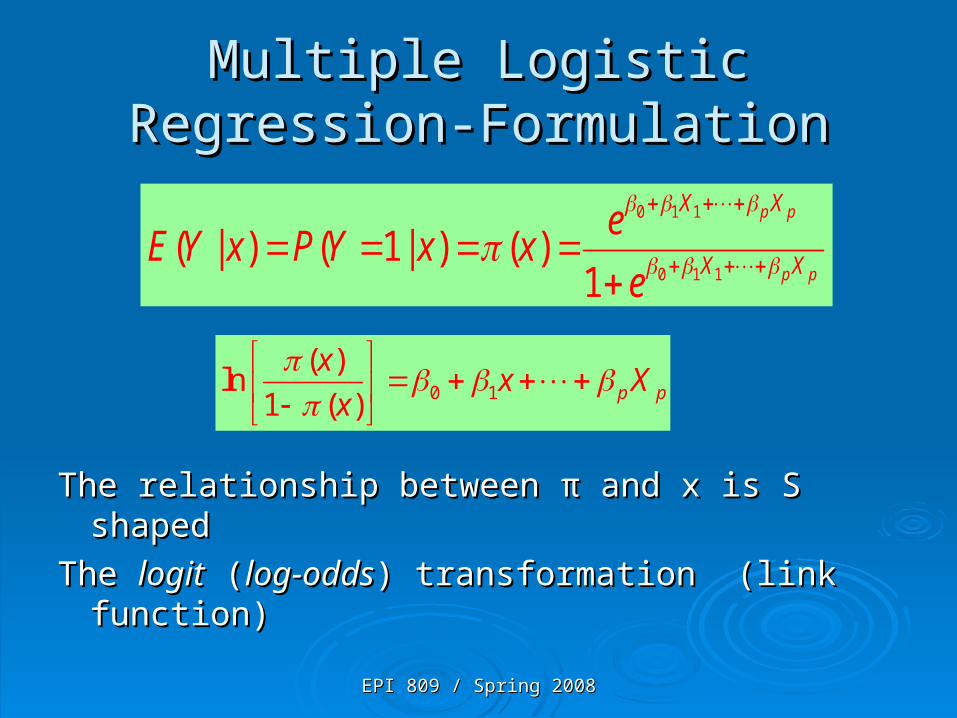
Multiple Logistic Regression-Multiple Logistic Regression-FormulationFormulation
The relationship between The relationship between ππ and x is S shaped and x is S shaped
The The logitlogit ( (log-oddslog-odds) transformation (link function)) transformation (link function)
0 1
( )ln
1 ( ) p p
xx X
x
0 1 1
0 1 1( | ) ( 1| ) ( )
1
p p
p p
X X
X X
eE Y x P Y x x
e
EPI 809 / Spring 2008EPI 809 / Spring 2008
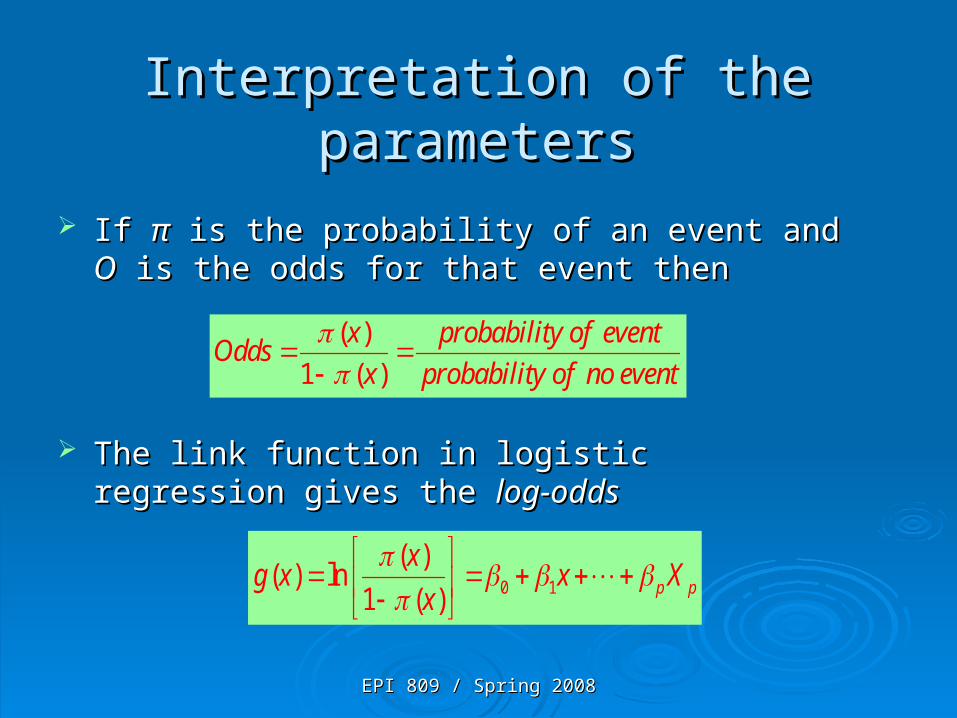
Interpretation of the parametersInterpretation of the parameters
If If ππ is the probability of an event and is the probability of an event and OO is the odds is the odds for that event thenfor that event then
The link function in logistic regression gives the The link function in logistic regression gives the log-log-oddsodds
( )
1 ( )
x probability of eventOdds
x probability of no event
0 1
( )( ) ln
1 ( ) p p
xg x x X
x
Related Documents