PM Fuel Effects Results from EPAct/V2/E-89 Study and Related Work Since Presented by Aron Butler US EPA Office of Transportation & Air Quality December 8, 2016

Welcome message from author
This document is posted to help you gain knowledge. Please leave a comment to let me know what you think about it! Share it to your friends and learn new things together.
Transcript

PM Fuel Effects Results from EPAct/V2/E-89 Study
and Related Work Since
Presented by Aron Butler US EPA Office of Transportation & Air Quality
December 8, 2016

Brief Outline
Three analyses of two test programs: • Original design analysis of EPAct test program • PM Index analysis of EPAct test program • PM Pilot Study and results
2

Energy Policy Act of 2005 gave statutory direction for EPA to produce updated models of fuel property effects on emissions • These models drive inventory and air quality assessments • No data on fuel effects from Tier 2 vehicles with which to assess validity of
existing models
Useful model requires a statistically-designed fuel matrix covering relevant properties across the range of in-use fuels • Need ability to compare present and past years, multiple localities, and
varying regulatory scenarios • Splash blending studies are unable to discern the effects of ethanol’s
presence from changes in other fuel properties, and therefore do not meet EPA’s modeling needs (or the statutory directive)
• Performed literature review to select most relevant parameters and interactions
Background on EPAct Study
3

ETOH, ARO, T50, T90, RVP T502, ETOH2, ETOH*ARO, ETOH*T50, ETOH*T90, ETOH*RVP Brand Model Engine Size
Chevrolet Cobalt 2.2L I4 Chevrolet Impala FFV 3.5L V6
Saturn Outlook 3.6L V6 Chevrolet Silverado FFV 5.3L V8
Toyota Corolla 1.8L I4 Toyota Camry 2.4L I4 Toyota Sienna 3.5L V6 Ford Focus 2.0L I4 Ford Explorer 4.0L V6 Ford F150 FFV 5.4L V8
Dodge Caliber 2.4L I4 Jeep Liberty 3.7L V6
Honda Civic 1.8L I4 Honda Odyssey 3.5L V6 Nissan Altima 2.5L I4
Overview of EPAct Study Design
Design and data collection spanned ~4 years 2006-10 • 27 test fuels carefully blended from refinery streams to represent the range of in-use fuels • 15 high-sales MY 2008 LD vehicles, Tier 2 compliant (all PFI) • LA92 cycle at 75F, 2+ test replicates per vehicle/fuel combination (956 tests) • Detailed procedures for vehicle and fuel handling • Measured several gaseous emissions plus particulate matter (PM)
4

Key steps: • Fuel property values were standardized into z-scores • Emission data were transformed using natural logarithm • Models were fit using maximum likelihood estimation
• Allows inclusion of all tests including those producing “censored” measurements (i.e., below detection limits)
• Bag 1 PM data contains 45 zeros, bag 2 has 47 zeros (out of 955 obs.) • Omission of tests containing zeros from the analysis could bias the
model results • Reduced via backwards elimination based on goodness of fit
using likelihood ratio tests Detailed analysis report and peer review comments available on EPA website (search for “epact study”)
5
Model Fitting Procedures
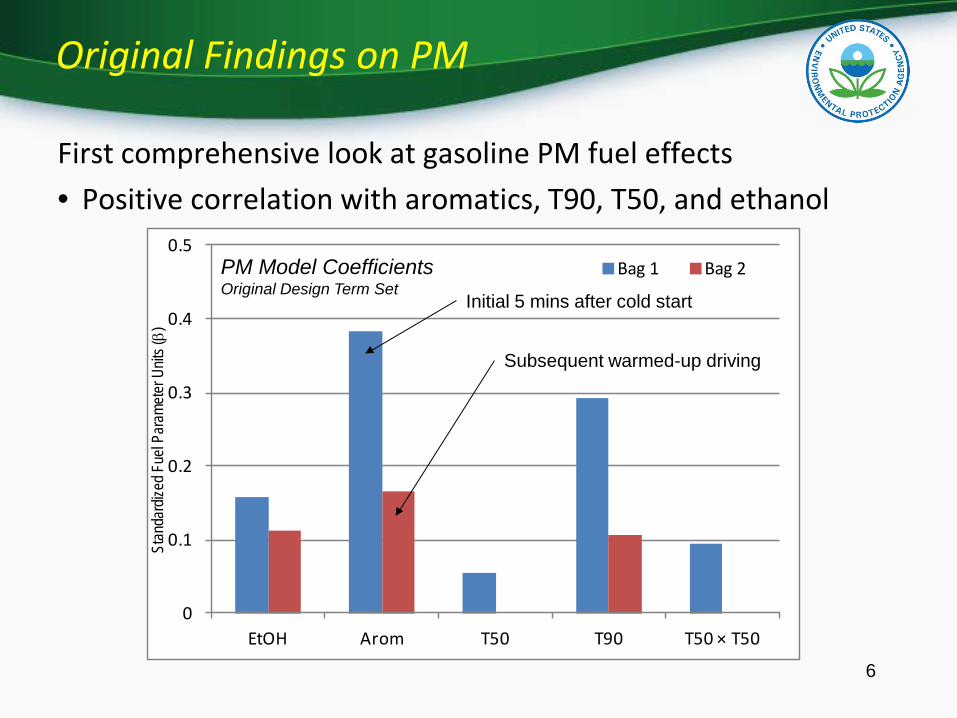
First comprehensive look at gasoline PM fuel effects • Positive correlation with aromatics, T90, T50, and ethanol
6
Original Findings on PM
0
0.1
0.2
0.3
0.4
0.5
EtOH Arom T50 T90 T50 × T50
Bag 1 Bag 2PM Model Coefficients Original Design Term Set
Stan
dard
ized F
uel P
aram
eter U
nits (β)
Initial 5 mins after cold start
Subsequent warmed-up driving

7
Example Model Application
Positive coefficient doesn’t necessarily mean PM goes up for ethanol blends; depends on other fuel properties • Example shows reduced cold-start PM for E10 splash blend
Property Units Range Base Fuel Test FuelEthanol vol.% 0-20% 0.0 10.0
Aromatics vol.% 15-35% 30.0 27.0RVP psi 7-10 psi 9.0 10.0T50 deg.F 150-240F 210 189T90 deg.F 300-340F 325 320
Fuel Properties
From model calculator at https://www.epa.gov/moves/epactv2e-89-tier-2-gasoline-fuel-effects-study
-8%
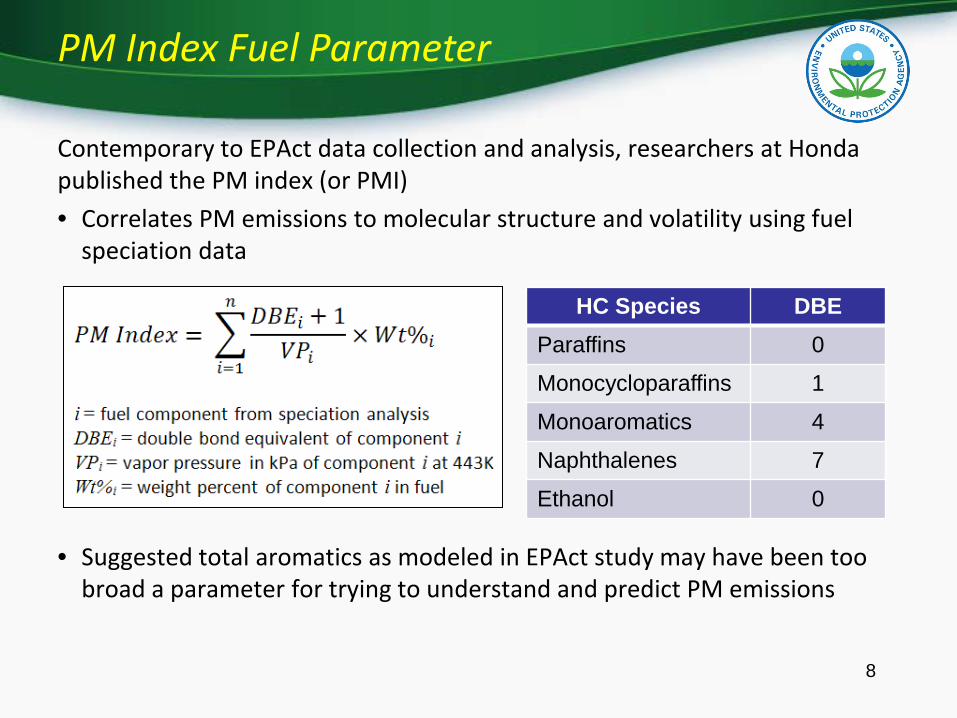
Contemporary to EPAct data collection and analysis, researchers at Honda published the PM index (or PMI) • Correlates PM emissions to molecular structure and volatility using fuel
speciation data
• Suggested total aromatics as modeled in EPAct study may have been too broad a parameter for trying to understand and predict PM emissions
8
HC Species DBE
Paraffins 0
Monocycloparaffins 1
Monoaromatics 4
Naphthalenes 7
Ethanol 0
PM Index Fuel Parameter

Low correlation between PMI and ethanol allowed further analysis • Aromatic content of EPAct test fuels was specified by carbon number to
reflect proportions typical in market fuels
9
PM Index of EPAct Fuels
0.5
1.0
1.5
2.0
2.5
0 5 10 15 20 25
PM In
dex
Ethanol (vol%)
EPAct Test Fuels

10 of 15 vehicles showed a strong correlation between PM emissions and PM Index, and ethanol having a reinforcing effect
10
PM Index and Ethanol – More Sensitive Vehicles
0
0.5
1
1.5
2
2.5
3
0.7 0.9 1.1 1.3 1.5 1.7 1.9 2.1 2.3
ln [P
M (
mg/
mi)]
PM Index
E0 E10 E20
Honda Civic LA92 Bag 1

5 of 15 vehicles showed no clear effect of PM Index or ethanol on emissions
11
PM Index and Ethanol – Less Sensitive Vehicles
-0.5
0
0.5
1
1.5
2
2.5
3
0.7 0.9 1.1 1.3 1.5 1.7 1.9 2.1 2.3
ln [P
M (
mg/
mi)]
PM Index
E0 E10 E20
Ford Explorer LA92 Bag 1

Before fitting models, needed to consider whether PMI is correlated with other terms • Pearson coefficients:
• Total aromatics (0.71) • T90 (0.64) • T50 (-0.07)
12
Model Term Sets
Original Design PMI Term Set EtOH Arom RVP T50 T90
T50 × T50 EtOH × EtOH EtOH × Arom EtOH × T50 EtOH × T90 EtOH × RVP
EtOH RVP T50 PMI
T50 × T50 EtOH × EtOH EtOH × T50 EtOH × RVP PMI × EtOH PMI × RVP PMI × PMI PMI × T50
Used the same procedures as outlined earlier

Table shows reduced model coefficients (statistically significant)
13
Models with PM Index
Original Design PMI Term Set Model Term Bag 1 Bag 2 Bag 1 Bag 2
Arom 0.3833 0.1662 T90 0.2923 0.1072 PMI 0.4815 0.2133
EtOH 0.1582 0.1126 0.2287 0.1300 T50 0.0550 0.1063
T50 × T50 0.0935 PMI × EtOH 0.0836
PMI terms larger than Aro or T90
Ethanol interaction term Ethanol terms persist
Published these results in an SAE paper (2015-01-1072)
Conducted a pilot study to examine PM fuel effects in more detail
Design goals: • Confirm published results on PM Index and aromatic
carbon number with vehicles from EPAct fleet • 3 PFIs with range of sensitivity to fuel properties + 1 GDI
• Create new fuel blends specifically designed to examine ethanol-PM Index interaction
• Use well-characterized refinery streams to produce test fuels representative of what is in the market
14
PM Pilot Study

PM Pilot Fuels
15
Parameter Fuel 7 Fuel 100 Fuel 13 Fuel 26 Fuel 101 Fuel 102 Cert Fuel
DVPE 9.1 8.8 9.0 8.8 7.8 7.7 8.9 T50 204 162 208 164 207 186 223 T60 222 215 248 236 241 224 Not reported
T70 237 235 284 281 265 233 Not reported
T80 253 250 313 309 331 242 Not reported
T90 294 295 341 338 372 275 315 T95 329 332 358 356 381 324 Not reported
Ethanol <0.1 15.7 <0.1 14.7 14.8 14.6 <0.1 Toluene 4.4 5.9 10.4 10.5 5.0 19.2 19.1 C8 Aromatics 4.6 3.9 10.3 10.5 3.3 3.3 0.7 C9 Aromatics 2.8 2.8 9.9 10.1 2.5 2.3 8.9 C10+ Aromatics 2.0 2.1 7.0 7.3 16.9 1.6 1.6 Total Aromatics 14.1 15.2 38.3 39.1 28.1 26.8 30.5 PM Index 0.93 0.92 2.21 2.12 2.72 0.97 1.79
Fuel pairs 7-100 and
13-26 designed to examine interaction between PMI and
ethanol
Fuels 101 and 102 assess the effect of the adding light and heavy aromatic
components to a low-PMI fuel
Certification fuel fills in the gap in the PMI range
of the fuel set and provides a recognizable
reference

PM Pilot Fuel Distillation Curves
16
Very tightly matched distillation curves above T60 between E0 & E15 test fuels

Detailed Fuel Comparison Between Ethanol Levels
17
Negligible changes in high-PMI cmpds

18
PM Pilot Study Results
Fuels 26 & 13
Confirms the conclusions of PMI analysis of EPAct/V2/E-89 data:
• PM index is strongly correlated with PM emissions
• Ethanol has a reinforcing interaction with PM Index

Interaction of ethanol with PMI suggests it exacerbates the propensity of low-volatility fuel components to form PM
Support in recent literature: • Association of ethanol's higher heat of vaporization with a
cooling effect, with potential to hinder fuel vaporization and lead to increased PM emissions (Stone, et al. 2012; Vuk, et al. 2013)
• Experimental and computational studies of droplet behavior showing slower evaporation when ethanol is added to a hydrocarbon base (Kobashi, et al. 2014)
PM Pilot study published as SAE 2015-01-9071
19
Cooling as Potential Mechanism

Range of PM sensitivity to fuel properties suggests important interaction with vehicle-specific characteristics including: • Engine and intake system design • Control algorithms and calibrations
Ethanol blending can show different results depending on PM Index of base fuel and other details of the blending process Small studies of a few splash blends using one or two vehicles are very difficult to interpret
20
Take-Aways for PM Study Design

Fuel property effects on PM likely to continue
21
Direct Injection (2007 BMW 3.0L I6)
Port Injection (2008 Nissan 2.5L I4)
What about GDIs?

General areas • How fuel effects may differ in GDIs • Effect of gasoline components on PM and precursors Goal of larger collaborative PM study (2018+) building on other recent work: • CRC E-94-2 GDI PM study • CRC AVFL-29 development of improved gasoline speciation
method • Environment Canada GDI study • EPA HEARO Pilot with Environment Canada (launching early
2017) will use GDIs and include SVOC speciation
22
Additional Work

Results presented here include the work of many colleagues at EPA including Rafal Sobotowski, James Warila, George Hoffman, Paul Machiele, Zuimdie Guerra, Nick Bies, Dave Bochenek, Bill Courtois, Steve George, Bruce Kolowich, Chris Laroo, John Spieth, Nancy Tschirhart, and Rick Zurel.
The EPAct/V2/E-89 study reports and data are available on the web: https://www.epa.gov/moves/epactv2e-89-tier-2-gasoline-fuel-effects-study
For more information on the PM Pilot study data and publications send me an email ([email protected])
23
Acknowledgements & Further Reading
Related Documents