EOR by Seawater and “Smart Water” Flooding in High Temperature Sandstone Reservoirs by Zahra Aghaeifar Thesis submitted in fulfillment of the requirements for degree of DOCTOR OF PHILOSOPHY (Ph.D.) Faculty of Science and Technology Department of Energy Resources 2019

Welcome message from author
This document is posted to help you gain knowledge. Please leave a comment to let me know what you think about it! Share it to your friends and learn new things together.
Transcript
EOR by Seawater and “Smart Water” Flooding
in High Temperature Sandstone Reservoirs
by
Zahra Aghaeifar
Thesis submitted in fulfillment of
the requirements for degree of
DOCTOR OF PHILOSOPHY
(Ph.D.)
Faculty of Science and Technology
Department of Energy Resources
2019

University of Stavanger
N-4036 Stavanger
NORWAY
www.uis.no
©2019 Zahra Aghaeifar
ISBN: 978-82-7644-915-0
ISSN: 1890-1387
PhD Thesis UiS no. 508

Dedicated to: Who will come and reveal All the treasures of science in the earth and the sky, Who will bring peace and justice to the whole world, A hero to stop this thousand-year-old pain of injustice; and to all who actively waiting for him… and the loving memory of my father… یا ایها العزیز، مسنا و اهلنا الضر، و جئنا ببضاعة مزجاة، فاوف لنا الکیل و
(88)یوسف ...تصدق علینا، ان الله یجزی المتصدقین

i
Abstract
In the last decades, when the first treated injection water has resulted in
incremental oil recovery, the activity to explore this technique has
increased. And today, Smart Water flooding or low salinity flooding in
sandstone reservoirs has been considered among the most promising
choices to be implemented in some oil reservoirs, such as the western
part of Norwegian Continental Shelf. The method has been widely
thought-out considering both economic and environmental issues.
Offshore sandstone reservoirs are typically flooded with the most
available surrounding water, which is seawater. So as main objective of
this PhD it is questioned if seawater can act as a Smart Water? And if it
is the case, what is the potential of low salinity EOR in tertiary mode.
Due to the potential of scale precipitation and formation damage during
seawater flooding, since fifty years ago removal of sulphate from
seawater was considered by oil companies, and today from a Smart
Water EOR perspective, it is also questioned if modified seawater could
behave as Smart Water in the reservoir with incremental oil recovery as
a result? And lastly, what injection strategy could be offered for high
temperature offshore sandstone oil reservoirs?
To answer the oil companies' concerns above, four North Sea sandstone
reservoirs, including the total number of 17 preserved core plugs with
corresponding reservoir formation brine and stabilized reservoir crude
oil, have been studied at each specific reservoir temperature. Reservoirs
have a temperature above 100 °C and are investigated for different Smart
Water EOR potentials. The reservoirs have different formation water
salinity ranging from 23000 ppm up to 195000 ppm, and for each set of
cores, specific injection brine salinities and compositions were tested and
compared.
ii
The optimum injection strategy has been proven to be secondary LS
injection; injection from day one of the reservoir production life.
Moreover, on the contrary, seawater and modified seawater for the
individual study cases did not show any EOR effects and could not
change the wettability of the cores. The potential of tertiary LS EOR after
standard seawater flooding at high reservoir temperature was negligible.
However, the tertiary low salinity EOR effect after modified seawater
flooding gave an average of 11.8 %OOIP extra oil for the studied
reservoir.
A secondary objective of this PhD-work was more theoretical. The
chemical understanding of the low salinity EOR-mechanism in
sandstones has improved significantly during the last ten years by Smart
Water EOR group at the University of Stavanger. It is believed the
incremental oil recovery by Smart Water in sandstones is due to
wettability alteration of clay minerals which involves two main steps:
firstly substitution of Ca2+ and Mg2+ with H+ which results in an alkaline
environment close to the clay surface and secondly is the desorption of
polar organic components from clay by an ordinary acid-base reaction
which is favoured at high pH. Since both initial wetting and wettability
alteration processes towards more water wet conditions have the highest
impact on the prediction of Smart Water EOR potential at high
temperature, thus parametric studies on each specific element are
important to complete our understanding.
This Ph.D. thesis is aimed at investigating the wetting controlling factors
more in detail. To do that, some parametric studies under static and
dynamic conditions have been performed. The dynamic tests performed
using synthetic sand packs with different mineralogy to study the affinity
of active cations towards different minerals at 20 and 130 °C.
Furthermore, the crucial role of polar organic components in crude oil
was investigated by static tests in the presence of different clay minerals,
temperature, and different pHs using quinoline as a basic model.
iii
The fundamental studies carried out showed a negligible reactivity of
quartz surface towards both active cation and quinoline. Both cations and
quinoline showed more tendency to adsorb on the negatively charged
clay active surface. Among active cations, Ca2+ showed higher affinity
towards both illite and kaolinite clays, which is reflected in the higher
retention time during the desorption process. In addition, the batch static
test proved that adsorption of quinoline is strongly pH depended and the
amount of quinoline adsorption is reducing as the temperature increases.
The amount of adsorption was higher on the illite surface compare to the
kaolinite, while the quinoline adsorption towards illite was not fully
reversible, in contrary to fully reversible adsorption on the kaolinite.
Furthermore, the last and most interesting is that the amount of
adsorption is highest when a low salinity brine surrounds the clay,
compared to the high salinity brine. This is evidence against the
expansion of double layer mechanism, which is considered by many
researchers, and modelling programs.

iv
v
List of papers
I. “Smart Water injection strategies for optimized EOR in a
high temperature offshore oil reservoir”, Z. Aghaeifar, S.
Strand, T. Puntervold, T. Austad. Journal of Petroleum Science
and Engineering, June 2018, 165, pp 743-751.
https://doi.org/10.1016/j.petrol.2018.02.021
II. “Significance of Capillary Forces during Low-Rate
Waterflooding”, Z. Aghaeifar, S. Strand, T. Austad, T.
Puntervold. Energy Fuels, 2019, 33 (5), pp 4747–4754.
https://doi.org/10.1021/acs.energyfuels.9b00023
III. “Seawater as a Smart Water in Sandstone reservoirs?”, Iván
D. Piñerez Torrijos, Zahra Aghaeifar, Tina Puntervold and Skule
Strand. Manuscript submitted to SPE Reservoir Evaluation &
Engineering journal, 2019.
IV. “Low Salinity EOR Effects After Seawater Flooding In A
High Temperature And High Salinity Offshore Sandstone
Reservoir”, Z. Aghaeifar, T. Puntervold, S. Strand, T. Austad,
B. Maghsoudi and J. C. Ferreira, SPE-191334-MS, SPE
Norwegian One Day Seminar, Bergen, Norway, 2018.
https://doi.org/10.2118/191334-MS
V. “Influence of Formation Water Salinity/Composition on the
Low- Salinity Enhanced Oil Recovery Effect in High-
Temperature Sandstone Reservoirs”, Z. Aghaeifar, S. Strand,
T. Austad, T. Puntervold, H. Aksulu, K. Navratil, S. Storås, and
D. Håmsø. Energy Fuels, 2015, 29 (8), pp 4747–4754.
https://doi.org/10.1021/acs.energyfuels.5b01621
vi
VI. “The role of kaolinite clay minerals in EOR by low salinity
water injection”, T. Puntervold; A. Mamonov, Z. Aghaeifar, G.
O. Frafjord, G. M. Moldestad, S. Strand, T. Austad. Energy
Fuels, 2018, 32 (7), pp 7374–7382.
https://doi.org/10.1021/acs.energyfuels.8b00790
VII. “Adsorption/desorption of Ca2+ and Mg2+ to/from Kaolinite
Clay in Relation to the Low Salinity EOR Effect”, Z.
Aghaeifar, S. Strand, T. Puntervold, T. Austad, S. Aarnes and
Ch. Aarnes. 18th European Symposium on Improved Oil
Recovery, At Dresden, Germany, April 2015.
https://doi.org/10.3997/2214-4609.201412132
Additional presentations:
I. “Evaluation of sea water (SW) as smart water in North sea
sandstone reservoirs”. 40th annual iea EOR, At September 16-
20, 2019 – Cartagena, Colombia, 2019.
II. “Influence of formation water salinity on the low salinity EOR-
effect in sandstone at high temperature”, 77th EAGE
Conference & Exhibition, Madrid, Spain, May 2015.
III. “Smart Water EOR in Sandstones: Wettability alteration
controlled by desorption of divalent ions from Clays”, First
annual IOR Conference by the National IOR Centre of Norway
28-29, Stavanger, Norway, April 2015.

vii
Acknowledgments
This dissertation was greatly assisted by the kind efforts of individuals that I would acknowledge them. Thanks to the Norway ministry of science and technology for providing me the financial resources and University of Stavanger for all the technical support to pursue and complete my doctoral degree.
Firstly, I would like to express my sincere and highest measure gratitude to my supervisors Dr. Skule Strand ad Dr. Tina Puntervold for the continuous support of my PhD study and research, for their motivation, enthusiasm, patience, and immense knowledge. Skule’s exceptional support in the lab and having answer to all the technical problems and Tina’s constructive discussion and comments on the writing of reports and papers proved monumental towards the success of this study and thus I feel very much honoured to be a PhD student under their supervision. I also acknowledge and appreciate Professor Tor Austad, the first and former head of Smart Water EOR group at UiS. I was very fortunate to benefit from his mentorship and sit behind a desk in his last PVT course lectures at UiS. I would like to recognize the invaluable assistance that he provided during the writing of my first paper.
Besides my supervisors, I would like to thank my thesis assessment committee members, both my examiners: Dr. Patrick V. Brady (Sandia National Laboratories, USA), and Dr. John W. Couves (BP, UK) for their encouragement and insightful comments, and also Dr. Dora Luz Marin Restrepo for administrating the assessment.
I wish to express my special gratitude to the lab assistant Jose D. C. Ferreira for enlightening me the first glance of my research, for all the restless evenings and holidays that we were working together in the laboratory. I thank my fellows in Smart water EOR group at UiS: PhD students Iván D. Piñerez Torrijos, and Paul A. Hopkin, and the research assistants: Hossein A. Akhlaghi Amiri, Aleksandr Mamonov and Alireza Rostaei for all the scientific discussions, and for all the fun we have had in the laboratory. I gratefully acknowledge Ivan for his encouraging attribute not only in the successes, but also in the failures. I am also indebted to Gadiah Albraji who helped me during last months of my pregnancy.
I also appreciate the help of all the technical staff at petroleum engineering department particularly Reidar I. Korsnes, Kim Andre N. Vorland, Jorunn H.
viii
Vrålstad and Inger Johanne M. K Olsen for their technical support in the laboratories. Thanks to the administrative staff of the faculty of science and technology and department of petroleum engineering, particularly Kathrine Molde, Norbert Puttkamer and Nina Ingrid Horve Stava, who are truly the unsung heroes of every doctoral student’s career, and especially mine. They made navigating the endless paperwork.
It is a pleasure to also mention the name of students who had contribution to my experimental work during my PhD research. I convey my gratitude to Farasdaq Muchibbus Sajjad, Abdi H. Wakwaya, Behrouz Maghsoudi, Gadiah Albraji, Gunvor Oline Frafjord, Gyrid Marie Moldestad, Aarnes brothers (Steinar Aarnes and Christian Aarnes), Petter Schøien, Gunnleiv Dahl, and Christer Halvorsen. I must also thank the former lab assistant Hakan Aksulu, and former students Kine Navratil, Silje Storås, and Dagny Håmsø for their extensive work. Unfortunately, Abdi, one of my best co-workers during my PhD, recently has passed away. My God bless his soul.
My pursuit of a doctoral degree in petroleum engineering would not have occurred had I not benefited from the mentorship of Dr. Mohammad Chahardowli and Dr. S. Alireza Tabatabaeinezhad during my undergraduate years at the Sahand University of Technology (SUT).
Alongside the university, I am eternally indebted to all my family whose love, understanding, and unconditional support served as the anchors that kept me grounded. I owe my sincere and earnest thankfulness to my parents for their prayers and for motivating me to pursue my education. I would like to show my gratitude also to my sister, Fatemeh, my brother, Ali, and my parents in-law, brothers in-law and sisters in-law for all their support and encouragements. The last year of my career at UiS were blessed by the arrival of my lovely son, AmirHossein, whose presence has already enriched my life beyond calculation. He serves as both my paramount motivation and the most welcome distraction. Finally, my best friend and better half, my compassionate Husband, Milad Golzar, is to whom I owe the deepest and most enduring gratitude. His boundless love, selflessness, support, encouragement, and patience are the sole reason I was able to survive this doctoral program and complete this work. Thank you, Milad.
Lastly and foremost, praises and thanks to the God, the Almighty, for His showers of blessings throughout my life and specially my PhD research work.
Zahra Aghaeifar
ix
Table of contents
Abstract …………………………………………….…………………..i
List of papers .......................................................................................... v
Acknowledgments ................................................................................ vii
Table of contents ................................................................................... ix
List of figures ...................................................................................... xiii
List of tables ........................................................................................ xix
Nomenclature ...................................................................................... xxi
1 Introduction and objectives ...................................................... 1
1.1 Oil recovery in sandstone ........................................................... 1
1.1.1 Primary oil recovery .............................................................................. 1
1.1.2 Secondary oil recovery .......................................................................... 1
1.1.3 Tertiary oil recovery .............................................................................. 2
1.2 Oil recovery forces in sandstone ................................................. 4
1.2.1 Interfacial tension, IFT .......................................................................... 5
1.2.2 Wettability ............................................................................................ 5
1.2.3 Capillary Forces ..................................................................................... 6
1.2.4 Viscous Forces ....................................................................................... 7
1.2.5 Gravitational Forces .............................................................................. 8
1.2.6 Flow Regime Characterization .............................................................. 8
1.3 LS Smart Water flooding as a low cost environmentally friendly
EOR method ........................................................................................11
1.3.1 Costs of implementing LS EOR ............................................................ 13
1.3.2 Environmental Issues .......................................................................... 14
1.3 LS Smart Water EOR mechanism by wettability alteration ..........14
2 Objective ................................................................................ 19
x
3 Experimental methodology .................................................... 21
3.1 Materials ..................................................................................21
3.1.1 Minerals .............................................................................................. 21
3.1.2 Sand pack ............................................................................................ 24
3.1.3 Reservoir cores ................................................................................... 25
3.1.4 Quinoline ........................................................................................... 27
3.1.5 Crude Oil ............................................................................................. 28
3.1.6 Brines .................................................................................................. 29
3.2 Methodology ............................................................................33
3.2.1 Active cations adsorption/desorption study: ..................................... 33
3.2.2 Quinoline adsorption/desorption study ............................................. 35
3.2.3 Core cleaning ...................................................................................... 36
3.2.4 Core Restoration ................................................................................. 36
3.2.5 Surface reactivity test-pH screening ................................................... 38
3.2.6 Oil recovery test by spontaneous imbibition (SI) ................................ 39
3.2.7 Oil recovery test by forced imbibition (FI) .......................................... 40
3.3 Analysis ....................................................................................42
3.3.1 Ion Chromatography ........................................................................... 42
3.3.2 pH measurements ............................................................................... 43
3.3.3 Quinoline concentration measurement ............................................. 43
3.3.4 BET surface area ................................................................................. 45
3.3.5 viscosity measurements...................................................................... 45
3.3.6 Acid and base number measurement ................................................. 45
4 Main results and discussions .................................................. 47
4.1 Reactivity of divalent ions towards sandstone mineral surface ...48
4.1.1 Reactivity of divalent cations towards quartz ..................................... 49
4.1.2 Reactivity of divalent cations towards clay surfaces .......................... 52
4.1.3 Competitive reactivity of Ca2+ and Mg2+ onto clays ............................ 58
xi
4.2 Adsorption of basic POC towards mineral surfaces .....................62
4.2.1 Adsorption of quinoline to the quartz and Clay surfaces ................... 63
4.2.2 Quinoline adsorption onto kaolinite – Effect of pH, salinity, and
temperature ...................................................................................................... 65
4.2.3 Quinoline adsorption onto Illite – effect of brine salinity ................... 68
4.2.4 Reversibility of Quinoline adsorption onto Illite clay .......................... 69
4.3 EOR by wettability modification of sandstone reservoirs at high
temperature........................................................................................72
4.3.1 Secondary LS EOR at high temperature .............................................. 73
4.3.2 Seawater (SW) as a smart water? ....................................................... 77
4.3.3 LS EOR potential after SW flooding .................................................... 81
4.3.4 Modified SW as smart water?............................................................. 85
4.4 Significance of Capillary Forces ..................................................96
5 Concluding remarks ............................................................. 103
5.1 Conclusions ............................................................................. 103
5.2 Future work ............................................................................ 105
6 References ............................................................................ 107
Paper 1………………………………………………………………115
Paper 2………………………………………………………………127
Paper 3………………………………………………………………139
Paper 4………………………………………………………………161
Paper 5………………………………………………………………179
Paper 6………………………………………………………………189
Paper 7………………………………………………………………201

xii
xiii
List of figures
Figure 1. The amount of produced oil, remaining oil reserves and
residual oil after planned production cessation for the 27 largest
oil fields in NCS at 31 August 2019. (Redrawn data from NPD
(2019) ) ..................................................................................... 3
Figure 2. Technical EOR potential for the 27 largest fields in the NCS.
(Redrawn data from NPD (2017) )........................................... 4
Figure 3. Different kind of wettability in a static system. (a) Water wet,
(b) Neutral wet and (c) Oil wet. ............................................... 6
Figure 4. Illustrating the relationship between Nc, the capillary number,
given in Equation 6 and the residual oil saturation, Sor (Redrawn
with data from Moore and Slobod (1955)) ............................ 11
Figure 5. EOR potential considering the technical potential multiplied by
operational and economic factors, based on the investigations
performed on 27 largest NCS oil fields at the end of 2018.
(Redrawn data from NPD (2019)).......................................... 12
Figure 6. Maximum waterflood oil recovery at neutral to slightly water-
wet conditions. OW=oil-wet, NW=neutral-wet and
WW=water-wet. (Redrawn after Jadhunandan and Morrow
(1995)). ................................................................................... 16
Figure 7. Illustration of chemical reactions involved in wettability
alteration by a LS brine (Redrawn from Austad et al.,(2010).
................................................................................................ 17
Figure 8. (a) Adsorption of crude oil sample onto kaolinite in contact
with brines of varying concentration and pH. (Redrawn with
data from Fogden (2012)), (b) adsorption of Quinoline onto
illite as a function of pH in presence of high and low salinity
brine (Redrawn with data from Aksulu et al. (2012)). ........... 18
Figure 9. SEM image of fine quartz clay provided by PROLABO: (a)
Coarse particles with a magnification of 201 and (b) fine
particles with a magnification of 1000. .................................. 22
xiv
Figure 10. SEM image of kaolinite clay provided by PROLABO with a
magnification of 5000 ............................................................ 23
Figure 11. SEM image of cleaned Illite clay provided by Ward´s Natural
Science Establishment with a magnification of 5000 ............ 24
Figure 12. Illustration of active cations adsorption/desorption study set
up ............................................................................................ 35
Figure 13. Schematic of 100% diluted FWi saturation......................... 38
Figure 14. Schematic spontaneous imbibition (SI) setup. .................... 40
Figure 15. Core flooding setup for oil recovery tests by viscous flooding.
IB = injection brine. O/W = Oil/Water .................................. 41
Figure 16. Protonated, (a), and neutral, (b), form of Quinoline ........... 44
Figure 17. Calibration curves at pH≈3 and T=20 °C ........................... 44
Figure 18. The key parameters to study the smart water EOR effect in
the reservoirs .......................................................................... 47
Figure 19. Cations adsorption/desorption in a sand pack (SP#1)
containing 100% Quartz at T=130 °C. (a) Ca2+
adsorption/desorption, (b) Mg2+ adsorption/desorption. ........ 50
Figure 20. Cations desorption from a sand pack (SP#1) containing 100%
quartz at T=130 °C. (a) Ca2+ desorption, (b) Mg2+ desorption.
................................................................................................ 51
Figure 21. Ca2+desorption from SP#2 surface (containing kaolinite) at
T=130 °C. ............................................................................... 53
Figure 22. Mg2+ desorption from kaolinite surfaces in SP#2 at 130 °C.
................................................................................................ 54
Figure 23. Ca2+desorption from kaolinite surfaces in SP#2 at 20 °C ... 55
Figure 24. Mg2+ desorption from kaolinite surfaces in SP#2 at 20 °C. 56
Figure 25. Desorption of Ca2+ ions from Illite surfaces in SP#3 at 20 °C.
................................................................................................ 57
Figure 26. Competitive adsorption/desorption of Ca2+ and Mg2+ onto
illite surface in SP#4. (a) 20°C and (b) 130°C ....................... 59
xv
Figure 27. Desorption of Ca2+ and Mg2+ from Kaolinite clays in SP#2 at
130°C. .................................................................................... 61
Figure 28. Adsorption of quinoline towards mineral surfaces vs. pH.
10mM Quinoline in LS brine (LSQ) was equilibrated with 10
wt% illite, kaolinite or quartz t at 20°C ................................. 64
Figure 29. Adsorption of quinoline onto 10 wt% kaolinite clay in contact
with LSQ, HSQ and CaQ solutions vs. pH at (a) T=20 °C .... 65
Figure 30. Adsorption of quinoline onto 10 wt% kaolinite clay in contact
with LSQ, HSQ and CaQ solutions vs. pH at T= 130°C. ...... 66
Figure 31. Effect of brine composition and salinity on the adsorption of
quinoline onto illite clay at 23 °C at a constant pH of 5. ....... 69
Figure 32. Reversibility test of adsorption of quinoline from kaolinite
clay at T=20 °C (RezaeiDoust et al., 2011) ........................... 70
Figure 33. Adsorption/desorption of Quinoline onto Illite clay in LSQ
and HSQ at 20°C. Step 1 - initial pH adjusted to 5. Step 2 - pH
increased to 8. Step 3 – final pH reduced back to 5. .............. 71
Figure 34. Schematic of kaolinite and illite layered structure .............. 72
Figure 35. Oil recovery tests at 130 °C by viscous flooding with (left)
FWp on core P41-R1, and (right) LSp on core P41-R2. The
injection rate was 4 PV/D. ..................................................... 74
Figure 36. Oil recovery test at 130 °C by spontaneous imbibition (SI) on
core P41-R4. The core was SI with FWp followed by LSP. ... 75
Figure 37. Oil recovery tests at Tres of 130 °C by viscous flooding of core
P49. The injection rate was 4 PV/D. In the first test, P49-R1, the
injection brine was FWp, while in the second test, P49-R2, the
injection brine was LSp . ........................................................ 76
Figure 38. Secondary oil recovery tests at 130 °C by viscous flooding of
core P#49 by SW with a rate of 4 PV/D after the third
restoration, P#41-R3. ............................................................. 78
Figure 39. Secondary oil recovery tests at 148 °C on cores T1 and T2.
(a) Secondary Oil recovery profile of core T1 after 1st and 2nd
restoration. (b) Secondary Oil recovery profile of core T2 after
1st and 2nd restoration. ............................................................ 80

xvi
Figure 40. Oil recovery tests at 148 °C on cores T1 and T2. (a) PW pH
during secondary oil recovery tests on core T1 and (b) PW pH
during secondary oil recovery tests on core T2. .................... 81
Figure 41. Oil recovery and PW pH on cores T1-R1 at 148° C. The core
was successively flooded with SW–LST with an injection rate
of 4 PV/D. .............................................................................. 82
Figure 42. Oil recovery and PW pH on cores T2-R2 at 148° C. The core
was successively flooded with SW–LST with an injection rate
of 4 PV/D. .............................................................................. 83
Figure 43. Chemical analysis of PW samples during the oil recovery test
for core T1-R1 at 148 °C. The core was successively flooded
with SW – LSt at a rate of 4 PV/D. ........................................ 83
Figure 44. Oil recovery tests at Tres > 130 °C on core C5, with LSm,
mSW, SW, or FWm at a rate of 4 PV/D. ................................ 88
Figure 45. PW pH profiles during different oil recovery tests at Tres >
130 °C on core C5. with LSm, mSW, SW, or FWm at a rate of 4
PV/D ....................................................................................... 88
Figure 46. Chemical analyses of PW samples during the oil recovery test
M5-R1. Ion concentrations are in mM. and they are reported as
a function of PV injected........................................................ 89
Figure 47. Oil recovery test M5-R2 at Tres (> 130 °C). The core was
successively flooded with mSW – LSm at a rate of 4 PV/D. . 91
Figure 48. Inlet pressure (P) and pressure drop (ΔP) during the oil
recovery test at Tres on core M5-R2. The core was succesively
flooded with mSW – LSm at a rate of 4 PV/D ....................... 92
Figure 49. Inlet pressure (P) and pressure drop (ΔP) during oil recovery
test on core M5-R1 by secondary LSm injection. ................... 93
Figure 50. Oil recovery tests at Tres > 130 °C on core M-R2. The core
was flooded with LSM brine in secondary at rate of 4 PV/D. 94
Figure 51. Oil recovery tests at Tres > 130 °C on core M3-R3. The core
was successively flooded with mSW – LSm at rate of 4 PV/D..
................................................................................................ 95

xvii
Figure 52. Oil recovery test at Tres by spontaneous imbibition (SI) on
core M3-R6 using mSW-LS brines, and in comparison, with
spontaneous imbibition of LS in M3-R5 and FW-LS in core
M3-R4. ................................................................................... 97
Figure 53. Oil distribution and displacement efficiency in a
heterogeneous porous network with large, medium and small
pores during FW and Smart Water injection. ...................... 101

xviii

xix
List of tables
Table 1. Sand pack properties for SP#1-4. ........................................... 25
Table 2. Physical core properties ......................................................... 26
Table 3. Mineralogical data of the cores .............................................. 27
Table 4. Physical and chemical properties of stabilized crude oil ....... 28
Table 5. Brines composition and properties used in active cations Ads.
/Des. study .............................................................................. 30
Table 6. Brine compositions and properties used in Quinoline Ads. /Des.
study ....................................................................................... 31
Table 7. 0.01 M quinoline-brine solutions used in the Ads. /Des. study
of quinoline onto illite(Aksulu et al., 2012), kaolinite, and
quartz. ..................................................................................... 31
Table 8. Brines composition and properties used in oil recovery tests 33
Table 9. List of all the experiments performed on the reservoir core .. 42
Table 10. Retention of Ca2+ and Mg2+ relative to tracer, Li+, in contact
with kaolinite and illite clay at room temperature and 130 °C, in
∆PV. ....................................................................................... 57
Table 11. Comparative retention of Ca2+ and Mg2+, in contact with
kaolinite and illite clay at room temperature and 130°C, in ∆PV.
................................................................................................ 61
Table 12. Summary of the oil recovery tests by SI and VF performed on
core M3. ................................................................................. 99

xx

xxi
Nomenclature
List of abbreviations:
AN Acid Number, mg KOH/g
BET Brunauer-Emmett-Teller/Specific surface area, m2/g
BN Base Number, mg KOH/g
CEC Cation-Exchange Capacity, meq/100g
CoBR Crude oil-Brine-Rock
DI Deionized water
EOR Enhanced Oil Recovery
FI Forced Imbibition
FW Formation Water
HS High Salinity
HTHP High-Temperature High-Pressure
IFT Interfacial Tension, mN/m
IS Ionic Strength, M
LFR Limited Fines Release
LS Low Salinity
MIE Multi-ion exchange
NCS Norwegian continental shelf
NPD Norwegian Petroleum Directorate
OOIP Original Oil In Place
PEEK Polyether Ether Ketone
POC Polar Organic Compounds
ppm parts per million
PV Pore Volume
PV/D Pore Volumes per Day
xxii
PW Produced Water
RF Recovery Factor
scm standard cubic metres
SEM Scanning Electron Microscope
SI Spontaneous Imbibition
SW SeaWater
TDS Total Dissolved Solids, mg/l
UV Ultraviolet
WAG Water Alternative Gas
XRD X-Ray powder Diffraction
List of symbols
B Base brine in Ads./Des. study of cations, Pure NaCl brine.
E Displacement efficiency
ED Microscopic displacement efficiency
EV Macroscopic (volumetric sweep) displacement efficiency
FWi Formation water from reservoir i
g Acceleration due to gravity, 9.8 m/s2
gc Conversion factor
h Height of the liquid column, m
k Permeability, mD
kro Relative permeability of oil, mD
krw Relative permeability of water, mD
L Capillary tube length, m
LSi Low salinity brine used for oil recovry of core from reservoir i
mSW Pretreated seawater
Nb Bond number
xxiii
Nc Capillary number
Pc Capillary pressure, Pa
pH A logarithmic scale used to specify the acidity or alkalinity of an
aqueous solution
Po Oil-Phase pressure, Pa
Pw Water-phase pressure, Pa
r Radius of cylindrical pore channel
Swi Initial water saturation, % PV
T Temperature, °C
V Velocity of the displacing phase, m/s
Wd Dry weight of the core
Ws Weight of the 100% saturated core with diluted FWi
WT Target weight of the core at desired Swi
wt% Weight percent
ΔP Differential pressure, bar
∆P Pressure difference across the capillary tube, Pa
∆Pg Pressure difference between oil and water due to gravity, Pa
∆ρ Density difference between oil and water, Kg/m3
µ Viscosity of flowing fluid, N.s/m2
α Acceleration associated with the body force, almost always gravity,
θ Contact angle measured through the wetting phase, degree (°)
ν Average velocity in a capillary tube, m/s
σ Interfacial Tension, N/m
σos Interfacial tension between oil and solid, N/m
σow Interfacial tension between oil and water, N/m
σws Interfacial tension between water and solid, N/m
ϕ Porosity, %

xxiv
Introduction and objectives
1
1 Introduction and objectives
1.1 Oil recovery in sandstone
Siliciclastic reservoirs known as sandstone reservoirs are the major
reservoirs, approximately 74% (Ehrenberg et al., 2009), and about 60%
of the world discovered oil reservoirs are believed to be sandstone. The
recovery factor of these reservoirs varies from 20–30% original oil in
place (OOIP) up to 40–60% OOIP (Bjørlykke and Jahren, 2010). The
oil recovery mechanisms from oil reservoirs have commonly been
classified as primary, secondary and tertiary recovery, which are
chronologically named (Green and Willhite, 1998).
1.1.1 Primary oil recovery
The primary recovery is the first mechanism, which refers to the
production by reservoir natural energy, which is the high pressure
sourced by solution gas, gas cap, water drive, fluid and rock expansion,
gravity drive, or combination of some of them. Recovery factor after
pressure depletion is normally up to 5 %OOIP for heavy oil and up to 25
%OOIP for light oil (Thomas, 2008).
1.1.2 Secondary oil recovery
As the natural drive is reducing by time, when it is insufficient to produce
more oil, the secondary stage could be introduced by gas or water
injection either to increase the reservoir pressure or to displace the oil to
Introduction and objectives
2
the producer. As water is the more available source and more efficient,
especially in the offshore reservoirs, the secondary stage is entitled
“Water flooding”(Green and Willhite, 1998).
1.1.3 Tertiary oil recovery
Tertiary oil recovery, traditionally known as enhanced oil recovery
(EOR), which is the stage of recovering the residual oil remained after
primary and secondary stages (Taber et al., 1997). A miscible or
immiscible injection that could be obtained by gas, water, steam,
polymer, surfactant, nano particles, etc. injection or combination of two
of them can be targeted as a tertiary method to recover more oil. The
mechanism at this stage could be mobility modification, chemical
reactions or thermal processes (Ahmed and McKinney, 2005; Green and
Willhite, 1998). Some EOR methods could be applied in the earlier
stages despite the traditional meaning of EOR as a tertiary method, such
as steam injection, which is suggested to be implemented in the earlier
stages, secondary or even at the same time of primary stage (Fuaadi et
al., 1991; Hanzlik and Mims, 2003).
Babadagli (2019) recently provided a new definition for EOR which
covers any fluid injection with the purpose of increasing the recovery
factor. He stated that EOR is: “injecting a fluid, with or without
additives, to the reservoir to displace oil while changing the oil and/or
interfacial properties and providing extra pressure at the secondary,
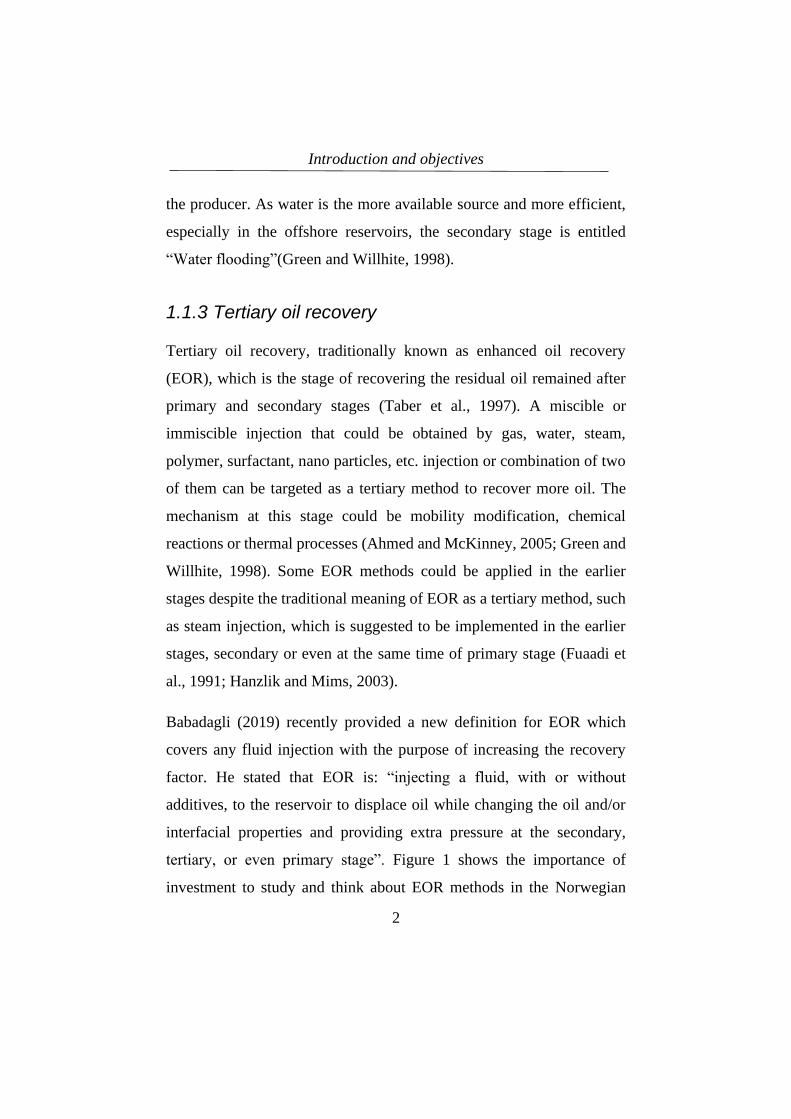
tertiary, or even primary stage”. Figure 1 shows the importance of
investment to study and think about EOR methods in the Norwegian
Introduction and objectives
3
continental shelf (NCS). It presents the amount of produced oil,
remaining oil reserves and residual oil after planned production cessation
for the 27 largest oil fields in NCS at 31 August 2019 (NPD, 2019).
Figure 1. The amount of produced oil, remaining oil reserves and residual oil after
planned production cessation for the 27 largest oil fields in NCS at 31
August 2019. (Redrawn data from NPD (2019) )
The results from figure 1, reported by Norwegian Petroleum Directorate
(NPD) show an overall technical EOR potential of 320-860 million
standard cubic metres (scm) at the beginning of 2019, which of course,
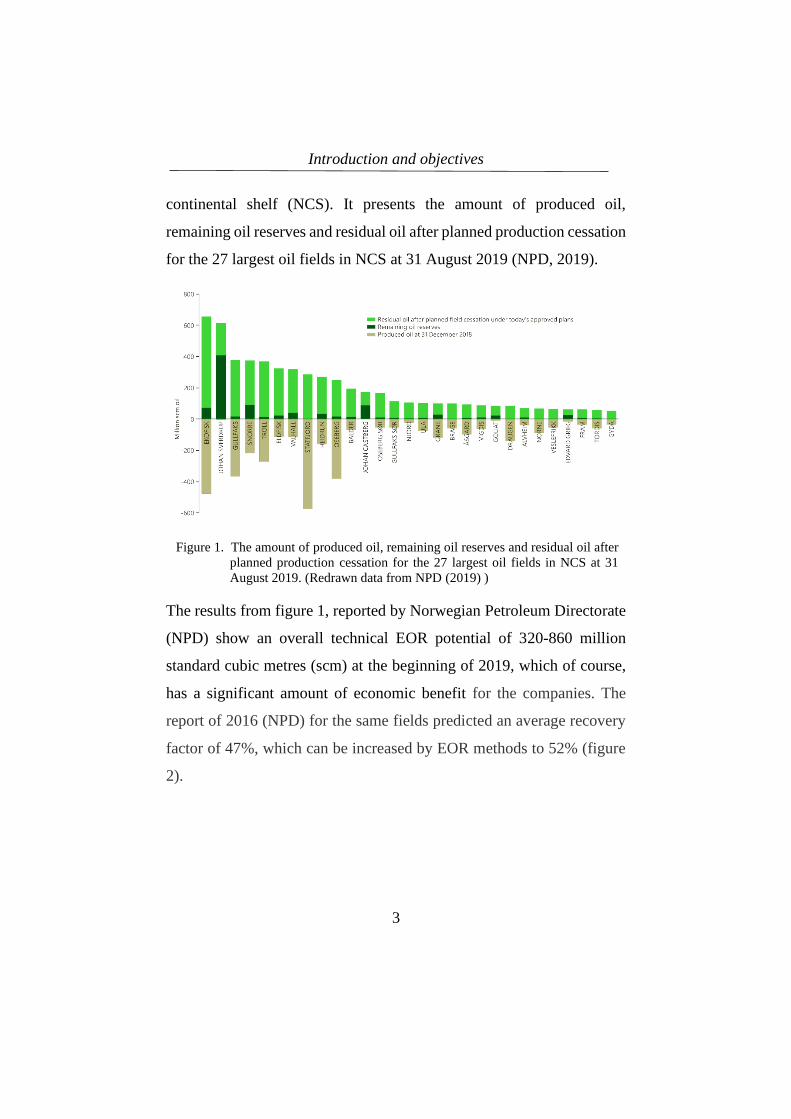
has a significant amount of economic benefit for the companies. The
report of 2016 (NPD) for the same fields predicted an average recovery
factor of 47%, which can be increased by EOR methods to 52% (figure
2).
Introduction and objectives
4
Figure 2. Technical EOR potential for the 27 largest fields in the NCS. (Redrawn
data from NPD (2017) )
1.2 Oil recovery forces in sandstone
Different EOR methods are evaluated by their displacement efficiency,
which is a factor of microscopic displacement efficiency in the pore scale
and also macroscopic displacement efficiency in the areal and vertical
direction towards production wells (Green and Willhite, 1998), equation 1.
𝐸 = 𝐸𝐷 × 𝐸𝑉 (1)
Where,
E is displacement efficiency,
ED is microscopic displacement efficiency
And, EV is macroscopic (volumetric sweep) displacement efficiency.
Introduction and objectives
5
Green and Willhite (1998) subjected three main forces that determine the
microscopic displacement in porous media. These forces are:
One of the essential aspects of the EOR process is the effectiveness of
process fluids in removing oil from the rock pores at the microscopic
scale. Green and Willhite (2008) describe three microscopic
displacement forces for determining the fluid flow in porous media,
which are: capillary forces, viscous forces, and gravitational forces.
Before explaining these three forces, two important terms, interfacial
tension (IFT) and wettability, have to be briefly introduced.
1.2.1 Interfacial tension, IFT
Interfacial tension arises when two immiscible fluids get in contact in a
porous medium. It referes to the difference in the cohesive force in the
molecular pressure across the boundary. Interfacial tension is presented
by symbol σ, and it is measured by force per unit length (Ahmed and
McKinney, 2005).
1.2.2 Wettability
When studying the distribution of oil, water, and gas in hydrocarbon
reservoirs, not only the fluid-fluid interface forces, but also the fluid-
solid interface forces also must be considered. The tendency of one fluid
to spread or adhere on a solid surface, in presence of another immiscible
fluid is called wettability (Green and Willhite, 1998). The fluid which
has spread more, is called wetting phase. A common way to stablish the
Introduction and objectives
6
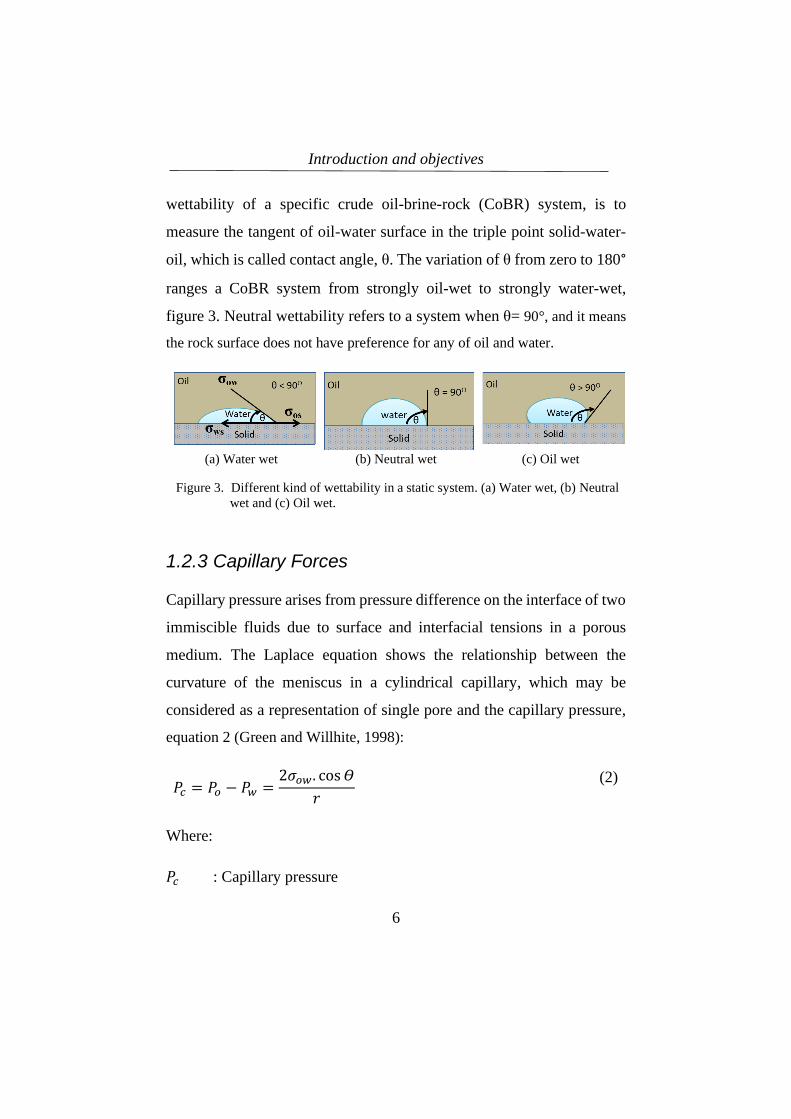
wettability of a specific crude oil-brine-rock (CoBR) system, is to
measure the tangent of oil-water surface in the triple point solid-water-
oil, which is called contact angle, θ. The variation of θ from zero to 180°
ranges a CoBR system from strongly oil-wet to strongly water-wet,
figure 3. Neutral wettability refers to a system when θ= 90°, and it means
the rock surface does not have preference for any of oil and water.
(a) Water wet (b) Neutral wet (c) Oil wet
Figure 3. Different kind of wettability in a static system. (a) Water wet, (b) Neutral
wet and (c) Oil wet.
1.2.3 Capillary Forces
Capillary pressure arises from pressure difference on the interface of two
immiscible fluids due to surface and interfacial tensions in a porous
medium. The Laplace equation shows the relationship between the
curvature of the meniscus in a cylindrical capillary, which may be
considered as a representation of single pore and the capillary pressure,
equation 2 (Green and Willhite, 1998):
𝑃𝑐 = 𝑃𝑜 − 𝑃𝑤 =2𝜎𝑜𝑤. cos 𝛳
𝑟
(2)
Where:
𝑃𝑐 : Capillary pressure

Introduction and objectives
7
𝑃𝑜 : Oil-Phase pressure at a point just above the oil-water interface
𝑃𝑤 : Water-phase pressure just below the interface
𝑟 : Radius of cylindrical pore channel
𝜎𝑜𝑤 : Interfacial tension between oil and water
𝛳 : Contact angle measured through the wetting phase (water)
Thus, the capillary pressure is a function of IFT and wettability, which
shows itself in the contact angle. Positive values of the capillary pressure
give an indication that the water phase has less pressure, and that is the
wetting phase.
1.2.4 Viscous Forces
Viscous forces in the porous media arise by pressure drop when flowing the
fluids into the porous media. This force is dominated by viscosity and
velocity of the fluid and can be calculated by equation 3.
∆𝑃 = −8𝜇𝐿�̅�
𝑟2 𝑔𝑐
(3)
Where:
∆𝑃 : Pressure across the capillary tube
µ : Viscosity of flowing fluid
𝐿 : Capillary tube length
�̅� : Average velocity in a capillary tube
𝑟 : Capillary tube radius
𝑔𝑐 : Conversion factor
Viscose force is the basis of Darcy’s law in porous media. In order to have
fluid flow, viscose forces must overcome the capillary forces (Green and
Willhite, 1998).
Introduction and objectives
8
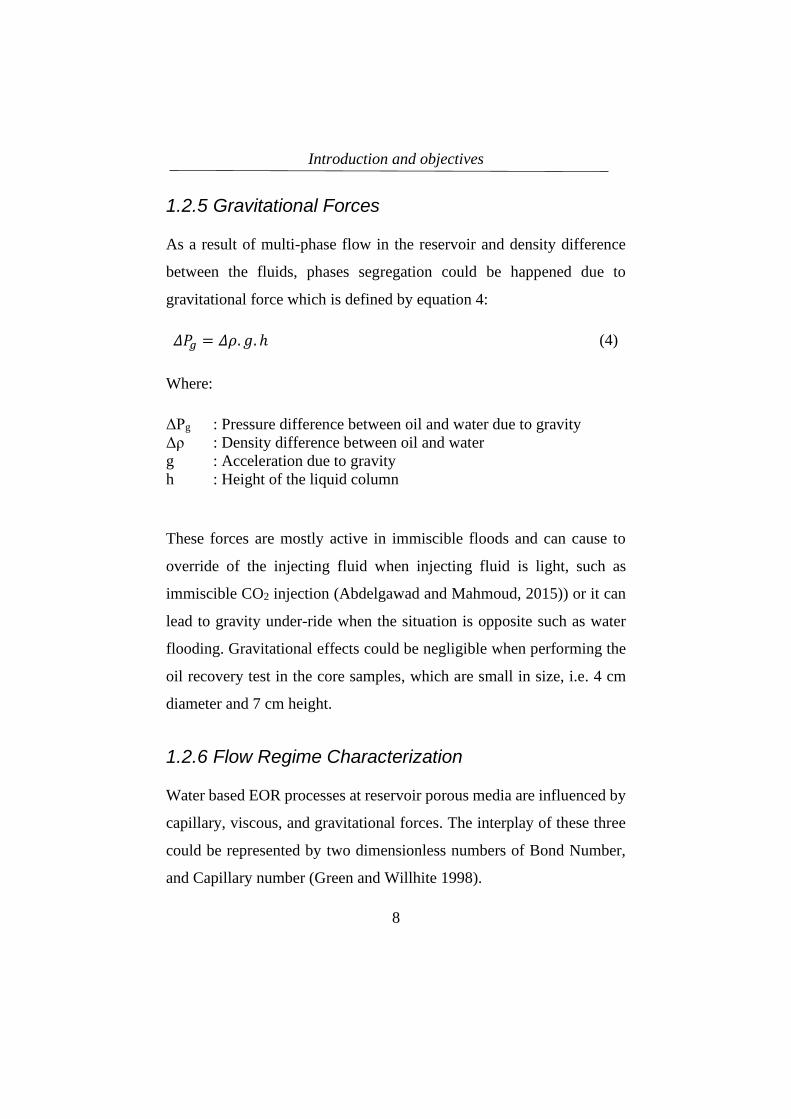
1.2.5 Gravitational Forces
As a result of multi-phase flow in the reservoir and density difference
between the fluids, phases segregation could be happened due to
gravitational force which is defined by equation 4:
𝛥𝑃𝑔 = 𝛥𝜌. 𝑔. ℎ (4)
Where:
ΔPg : Pressure difference between oil and water due to gravity
Δρ : Density difference between oil and water
g : Acceleration due to gravity
h : Height of the liquid column
These forces are mostly active in immiscible floods and can cause to
override of the injecting fluid when injecting fluid is light, such as
immiscible CO2 injection (Abdelgawad and Mahmoud, 2015)) or it can
lead to gravity under-ride when the situation is opposite such as water
flooding. Gravitational effects could be negligible when performing the
oil recovery test in the core samples, which are small in size, i.e. 4 cm
diameter and 7 cm height.
1.2.6 Flow Regime Characterization
Water based EOR processes at reservoir porous media are influenced by
capillary, viscous, and gravitational forces. The interplay of these three
could be represented by two dimensionless numbers of Bond Number,
and Capillary number (Green and Willhite 1998).
Introduction and objectives
9
Bond Number
Bond number denoted as Nb, characterizes the ratio of gravitational
forces to capillary forces, which has importance in vertical
displacements:
𝑁𝑏 =𝐺𝑟𝑎𝑣𝑖𝑡𝑦 𝑓𝑜𝑟𝑐𝑒
𝐶𝑎𝑝𝑖𝑙𝑙𝑎𝑟𝑦 𝑓𝑜𝑟𝑐𝑒 =
𝜌 𝑎 𝐿2
𝜎
(5)
Where:
Nb : Bond number (dimensionless),
ρ : Density, or the density difference between fluids (∆ρ),
𝑎 : Acceleration associated with the body force, almost always
gravity,
L : “characteristic length scale”, e.g. radius of a drop or the radius
of a capillary tube,
and σ : is the surface tension of the interface.
Capillary number
The dimensionless magnitude of the ratio between viscose and capillary
force is denoted as Capillary number. There are many expressions for
Capillary number (Taber, 1981), one of the most commonly used form
is defined by Moore and Slobod (1955) as:
𝑁𝑐 =𝑉𝑖𝑠𝑐𝑜𝑠𝑒 𝑓𝑜𝑟𝑐𝑒
𝐶𝑎𝑝𝑖𝑙𝑙𝑎𝑟𝑦 𝑓𝑜𝑟𝑐𝑒=
𝑉 𝜇𝑤
𝜎𝑜𝑤 cos 𝜃
(6)
Where
Nc : Capillary number (dimensionless),
Introduction and objectives
10
σ : Interfacial tension between the two immiscible fluids (N m-1),
V : Velocity of the displacing phase (m s-1),
µ : Displacing fluid viscosity (N s m-2),
θ : Contact angle (degrees, °),
and subscripts w and o denote displacing and displaced phase,
respectively water and oil in water based EOR.
Laboratory experiments resulted in that the oil recovery in immiscible
EOR methods increased when viscose forces are increased and overcome
the capillary forces which are responsible for oil entrapments. Moore and
Slobod (1955) and also Abram (1975) attempted to correlate the residual
oil saturation as a function of capillary number, figure 4. They concluded
that to increase the oil recovery, i.e. reduction in residual oil saturation,
the capillary number must be increased. This can happen by increasing
the velocity of injection fluid or its viscosity, which means the creation
of a favourable mobility ratio, or by reducing the interfacial tension and
of course, by optimizing of contact angle (Lake, 1989).
Considering the limitations of injection facilities in compare to the
enormous volume of reservoir, the big variation in velocity is not
achievable. Favourable mobility and IFT can be achieved respectively
by polymer injection and adding surfactants to the injection water. Both
methods are extremely expensive so that can not be even examined in a
single reservoir. Following restrictions emphasizes the importance of
fourth parameter, which is change in contact angle, i.e wettability
alteration (Abrams, 1975; Green and Willhite, 1998; Johannesen and
Graue, 2007; Lake, 1989).

Introduction and objectives
11
Figure 4. Illustrating the relationship between Nc, the capillary number, given in
Equation 6 and the residual oil saturation, Sor (Redrawn with data from
Moore and Slobod (1955))
Note: The values of Nc in this chart are multiplied by100 due to the use of pois as
unit of µ instead of cp, which is the unite Morre, and Slobod plotted their chart
based on it.
1.3 LS Smart Water flooding as a low cost
environmentally friendly EOR method
Over the past decade, low salinity (LS) water flooding has been
considered as one of the high ranked options to be applied in many
sandstone oil reservoirs. NPD using an extensive screening of different
EOR methods on each of the oil fields placed in NCS, proved that LS
EOR is among high potential methods, which can significantly reduce
the residual oil saturation, figure 5 (NPD, 2019). In addition to pure low
salinity method, a hybrid method such as LS brine injection combined
with polymer injection also proved to have a high potential specially in

Introduction and objectives
12
the Utsira High and the surrounding area located in the North Sea
(Smalley et al., 2018).
The LS EOR method has two main advantages in addition to successful
field trials and laboratory reports, which cause it to be promising for
future plans of the oil reservoirs. The main advantages are relatively low
cost of the implementation for both offshore and onshore fields and the
second benefit that must be considered is environmental issues, and it
has been qualitatively reported that LS EOR is among the most
environmentally friendly methods.
Figure 5. EOR potential considering the technical potential multiplied by
operational and economic factors, based on the investigations performed
on 27 largest NCS oil fields at the end of 2018. (Redrawn data from NPD
(2019)).
Introduction and objectives
13
1.3.1 Costs of implementing LS EOR
One of the critical factors that influence the implementation of any EOR
project is economic issues. Considering the expected amount of extra oil
recovered, building water desalination plants, and oil price, the LS EOR
method has been considered as one of the beneficial EOR methods
especially for the reservoirs, which are nearby an appropriate aquifer
(Althani, 2014; Reddick et al., 2012).
Forasmuch as all the factors, BP reported that they are expecting to
recover over 40 million additional barrels of oil using LS EOR method
at the Clair Ridge Field, UK, by a development cost of only 3 $/bbl
(Mair, 2010; Robbana et al., 2012). Layti (2017) also simulated
economic potential of LS EOR at the Clair Ridge Field, and she
concluded that by the implementation of LS EOR method in Clair Ridge
field, the net present value will be about 697$ million, where 6% increase
in recovery will be achieved by only 2% increase in investments. In
addition, she emphasized the importance of secondary LS EOR by
reckoning of 37 million barrels extra oil compared to the tertiary LS
EOR. Abdulla et.al (2011) also economically investigated the LS EOR
project in the Burgan Wara field in Kuwait with considering all the
uncertainties and they confirmed that this method could be economically
efficient for a reduction of 1% of the Sor even at low oil price condition.
Introduction and objectives
14
1.3.2 Environmental Issues
There is a lack of documented discussion about the different aspects of
environmental issues linked to LS EOR. Donaldson et al. (1989)
subjected eight issues that could be concerned in different types of EOR
methods which are: atmospheric emissions, water use, water quality
impacts, waste water effluents, solid wastes, occupational safety and
health, physical disturbances and noise. Researchers agree that the LS
EOR method is among the most environmentally friendly methods. The
main worry is about sludges, salts, and high harnesses, which are
expelled from the input of the desalination plant either by nanofiltration
or reverse osmosis method. In addition, reduction of sulphate ion, which
is the case in most of the common LS brines, will reduce the risk of
souring and scaling problems in the pipelines and also the reservoir by
itself (Hardy et al., 1992).
1.4 LS Smart Water EOR mechanism by wettability
alteration
In order to be able to make a strategy for optimal water flooding of oil
reservoirs, detailed knowledge about initial properties and relevant
parameters, which have influence on the wetting conditions, are needed.
Improved chemical understanding about the rock fluid interaction during
the last years has made it possible to take benefit on wettability
modification to improve oil recovery during water flooding. The wetting
properties have great impact on important physical parameters like
Introduction and objectives
15
capillary pressure, Pc, and relative permeability of oil and water, kro and
krw. In the following some important issues are commented.
Formation water salinity: Morrow and co-workers performed
parametric studies on oil recovery using the same brine as both FW and
flooding fluid, and they observed an increase in oil recovery when using
a LS brine compared to a HS brine (Morrow et al., 1998; Tang and
Morrow, 1997). In those cases, no wettability alteration took place
during the flooding because the injected water, FW, was already in
equilibrium with the system. The authors explained the results by
increased capillary trapping of oil using the HS brine, which means that
the rock became more water wet at high salinities compared to low
salinities.
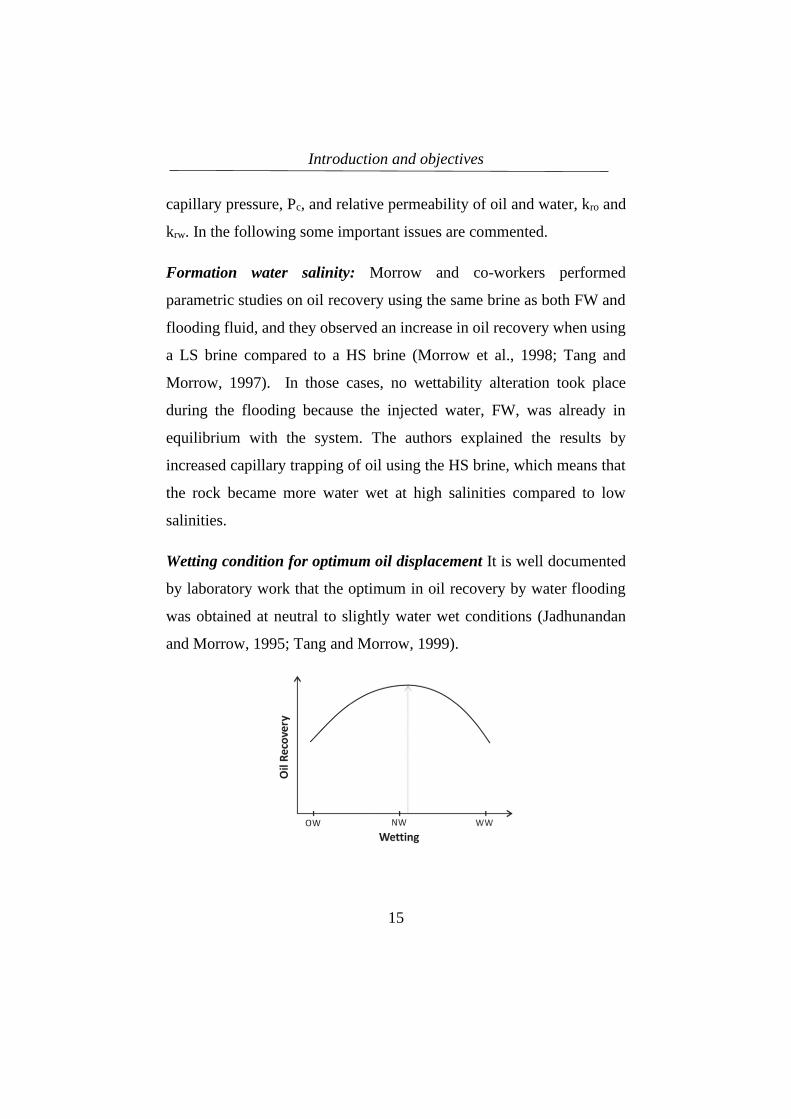
Wetting condition for optimum oil displacement It is well documented
by laboratory work that the optimum in oil recovery by water flooding
was obtained at neutral to slightly water wet conditions (Jadhunandan
and Morrow, 1995; Tang and Morrow, 1999).
Introduction and objectives
16
Figure 6. Maximum waterflood oil recovery at neutral to slightly water-wet
conditions. OW=oil-wet, NW=neutral-wet and WW=water-wet. (Redrawn
after Jadhunandan and Morrow (1995)).
Wettability alteration by induced pH gradient: Buckley and Morrow
tested adhesion properties of 22 crude oils onto silica surfaces as a
function of brine composition and, pH and, noticed remarkable
similarities in the results. In the adhesion map, they observed
characteristic pH values in the range of 6-7, above which, adhesion did
not occur at different salinities, and they concluded that the pH was the
dominant factor (Buckley and Morrow, 1990). Similar results were
recently confirmed by Didier et al.(2015) in adhesion studies of crude oil
using two different sands. At given pH, it was also observed that the
adhesion of oil increased by lowering the salinity, i. e. in direct
contradiction to the ionic double layer model and the DLVO theory,
which has been used by many researchers to explain the LS EOR
mechanism (Ligthelm et al., 2009).
The mechanism for wettability modification by LS or “Smart Water”
was proposed by Austad et al. and can be illustrated chemically by the
following equations (Austad, 2013; Austad et al., 2010; Rezaeidoust et
al., 2010):
Clay-Ca2+ + H2O = Clay-H+ + Ca2+ + OH- + heat (7)
Slow reaction
Clay- R3NH+ + OH- = Clay + R3N: + H2O (8)
Fast reaction
Clay-RCOOH + OH- = Clay + RCOO- + H2O (9)
Fast reaction
Introduction and objectives
17
A schematic of the reaction involved in Smart water EOR by a LS brine
is illustrated in figure 7.
Figure 7. Illustration of chemical reactions involved in wettability alteration by a
LS brine (Redrawn from Austad et al.,(2010).
Analysis and calculations have shown, that it is only a very small fraction
of the desorbed Ca2+ ions from the clay surface that are exchanged by
H+. It should also be noticed that the desorption of active cations from
the clay minerals, equation 7, is an exothermic process, meaning that the
imposed pH gradient when switching from HS to LS brine will be
smaller. It is therefore difficult to observe LS EOR effects at high
temperatures, Tres>100 oC (Aksulu et al., 2012).
Static adsorption studies on clay minerals using both model compound
and crude oil are supporting the suggested mechanism by confirming
maximum adsorption of organic material close to pH≈5 and that the

Introduction and objectives
18
adsorption decreased as pH increased, figure 7 (Fogden, 2012; Fogden
and Lebedeva, 2011; RezaeiDoust et al., 2011).
(a) (b)
Figure 8. (a) Adsorption of crude oil sample onto kaolinite in contact with brines
of varying concentration and pH. (Redrawn with data from Fogden
(2012)), (b) adsorption of Quinoline onto illite as a function of pH in
presence of high and low salinity brine (Redrawn with data from Aksulu
et al. (2012)).
In the LS two-well pilot test in the Endicott field in Alaska, BP made
several chemical observations of the produced water from the production
well, which are in complete agreement with the proposed mechanism
(Lager et al., 2011; RezaeiDoust et al., 2011).
The induced pH gradient is the key parameter to promote wettability
modification in sandstone oil reservoirs. Normally, the LS EOR effect is
related to mixed wet conditions or close to optimum wetting conditions
for water flooding. The “Smart Water” or LS brine improves the water
wetness to achieve a better microscopic sweep efficiency due to
increased capillary forces. The imposed pH gradient as the HS formation
brine is exchanged with the Smart Water depleted in divalent cations,
like Ca2+, will cause a redistribution of the residual oil in the porous
network as the rock becomes more water wet.

Objective
19
2 Objective
Offshore sandstone oil reservoirs are usually flooded with seawater for
two reasons: to give pressure support and to displace the oil towards the
producing wells. At low temperatures, if the salinity difference between
the formation water initially in place and the injected seawater is
significant, excluding other parameters, the concentration difference of
active cations could make a potential to recover more oil by wettability
alteration (Austad et al., 2010), and seawater act as a “Smart Water”
EOR-fluid and get an incremental oil recovery factor. But how it will be
if the reservoir temperature is high? This is an actual topic for the North
Sea sandstone oil reservoirs, which is one of the main objective of this
PhD thesis; “If seawater can act as a smart water at high temperature”?!
and if that is the case, is there still a further potential for improved oil
recovery by subsequently injecting an “even smarter” fluid, LS, in a
tertiary waterflood? What are the requirements for obtaining low salinity
EOR-effects in a tertiary flooding process?
To investigate these issues, about 40 surface reactivity and oil recovery
tests have been performed using 15 preserved reservoir cores which were
obtained from four different high temperature North Sea oil reservoirs.
The material and methodology are explained in section 3 and the main
results are presented and discussed in section 4.3.
Alongside the oil recovery test, to improve our chemical understanding
of the low salinity EOR-mechanism in sandstones, it was planned to

Objective
20
perform some parametric studies on the key factors dictating both the
initial wetting condition and wettability alteration process. Numerous
static three phase (Crude oil-Brine-Rock, CoBR) studies and dynamic
two phase Rock-Brine studies were performed to obtain a conclusion
based on the promising reproducible results presented in section 4.1 and
4.2.
Experimental methodology
21
3 Experimental methodology
This study consists of two main series of experiments, firstly some
fundamental parametric study and secondly oil recovery experiments
included both forced and spontaneous oil recovery. In the following
section of chapter 3, the materials used and also the methods applied on
each set of experiments are explained, and in the end, the performed
analyses are briefly listed and described. It must be noticed that
nomenclatures of materials and tests may vary for the ones mentioned in
the papers.
3.1 Materials
3.1.1 Minerals
Pure quartz, kaolinite clay, and illite clays are used in this study. The
detailed information is presented in the following sections.
Quartz
Quartz is one of the most common minerals found in clastic rock. The
crystal structure is built up of SiO2 unit-cell and can be noticed by their
unique shape. To make a sand pack and mimic physical properties of real
sandstone rock material (porosity and permeability) and to keep small
clay particles immobile, a mixture of fine (>8.4 μm) and coarse (>8.4
μm) milled quartz provided by Sibelco company, previously known as
North Cape, was used. Target particle size was achieved using
Experimental methodology
22
cylindrical containers, filled with a slurry of milled quartz and distilled
water, and applying Stoke`s law (Rhodes 2008) on the settling time of
particles with two main assumptions: (1) Particles are spherical and (2)
Settling happens at Reynolds number less than two. Figure 9 shows that
particle sizes are from 8 μm up to ∼500 μm
(a) (b)
Figure 9. SEM image of fine quartz clay provided by PROLABO: (a) Coarse
particles with a magnification of 201 and (b) fine particles with a
magnification of 1000.
Kaolinite
Kaolinite clay was provided by PROLABO in the form of very fine
particles. SEM picture of the kaolinite clay prior to use in packing shows
that the particle sizes are in the range of few micrometers, µm (figure
10). The surface area of the cleaned kaolinite particle measured by BET
analysis was 13 m2/g.
Experimental methodology
23
Figure 10. SEM image of kaolinite clay provided by PROLABO with a
magnification of 5000
Illite
Illite clay was provided by Ward´s Natural Science Establishment. It is
sampled in the form of green shale containing about 85 % illite from
Rochester formation in New York. It was crushed and milled into powder
with a particle size of a few μm. Then to remove any impurities, possible
divalent cations on the clay surface, and precipitated salts on it, the
milled illite was cleaned and protonated with 5 M hydrochloric acid at
pH~3. Lastly, the Illite was washed with distilled water (until the pH
adjusted about 5) and dried at 90 ºC. Figure 11 shows that particle sizes
of illite clay, after cleaning procedures, are in the range of a few μm. The
surface area of the cleaned illite particle measured by BET analysis was
22 m2/g.
Experimental methodology
24
Figure 11. SEM image of cleaned Illite clay provided by Ward´s Natural Science
Establishment with a magnification of 5000
3.1.2 Sand pack
Sand packs were prepared to fundamentally study the effect of some
important parameters involved in the LS smart water EOR mechanism
such as clay presence, active cations, and temperature. The packings
have done in a Polyether Ether Ketone (PEEK) cell, which was the sand
pack holder during the experiments too. PEEK is a semi-crystalline
thermoplastic (up to 260) with excellent mechanical and chemical
resistivity (Park and Seo, 2011), which ensure the secure condition
during the experiments at low and high temperatures. To avoid trapping
of air bubbles in the column and to prevent swelling of clays, wet packing
was performed using a low concentration of NaCl brine. Both end caps
of the sand pack cell contain a PEEK filter. The filter distributes the fluid
through the sand column in each side and also prevents movements of
the particle into the tube line.

Experimental methodology
25
To investigate the role of different minerals, three different sand packs
with different mineralogy were made (Table 1). One containing only
pure quartz particle (SP#1), the second sand pack (SP#2) was made by a
mixture of quartz and about 8%wt kaolinite by wet packing. The porosity
of 29.9% confirms very good packing, which can be a good sandstone
representative. The third and fourth sand packs (SP#3 and SP#4) are
made by wet packing of a mixture of illite clay and quartz, resulted in a
sand pack with a porosity of ~31%.
Table 1. Sand pack properties for SP#1-4.
SP#
Quartz
[wt%]
Kaolinite
[wt%]
Illite
[wt%]
Pore Volume,
PV [ml]
Porosity,
[%]
Permeability,
k [mD]
1 100 -- -- 12.0 32.8 7.0
2 92.1 7.9 -- 10.8 29.9 3.0
3 91.1 -- 8.9 11.4 30.8 2.8
4 89.9 -- 10.1 11.2 31.1 --
3.1.3 Reservoir cores
15 different preserved reservoir cores were used in this PhD project.
They are sampled from five different reservoirs: Reservoir M, reservoir
P, reservoir T, reservoir Y, and reservoir L. This thesis only includes the
main results from six cores originated from three Reservoirs M, P and T.
Mineralogical data from a representative rock sample was obtained by
either XRD analysis or QEMSCAN analysis, performed by oil
companies and Rocktype Ltd, UK, respectively. Physical core properties
and also mineralogical data for each set of the test are presented in table

Experimental methodology
26
2 and 3, respectively. Note that during core cleaning, dissolution of
anhydrite, CaSO4 (s), were detected in some of the water effluent
samples, while anhydrite minerals were not detected in the XRD or
QEMSCAN analysis.
Table 2. Physical core properties
Core Length,
cm
Diameter,
cm
Pore
Volume,
ml
Porosity,
%
Permeability *kwro,
mD
**BET,
m2/g
M3 7.03 3.84 11.82 14.6 9.0 0.92
M5 7.25 3.84 11.64 13.9 8 0.97
P41 6.99 3.78 14.61 18.6 -- 0.75
P49 5.57 3.78 13.97 22.3 -- 1.00
T1 5.53 3.87 14.3 21.9 3.4 3.36
T2 5.26 3.78 14 23.7 3.4 4.14
*kwro : NaCl (1000 ppm) permeability at Sor (heptane) during the first
restoration
**BET: Specific surface area using TriStar II PLUS from Metromeritics®.
Experimental methodology
27
Table 3. Mineralogical data of the cores
Sample#
Minerals
Reservoir M Reservoir P Reservoir T
M3 & M5 P41 & P49 T1 & T2
Quartz 75.01 88.53 50.24
K-Feldspar 9.82 0.04 20.94
Albite 4.17 0.05 9.19
Biotite 0.04 0 0.15
Muscovite 3.19 4.41 1.28
Illite 0.33 0.24 1.54
Chlorite 0.38 0 0.09
Kaolinite 4.39 5.33 0.01
Smectite 0.19 0.29 0.33
QuartzClayMix 0.11 0.44 3.37
OtherClays 0.83 0.36 2.15
Heulandite 0.06 0.15 0.31
Rutile_Anatase 0.41 0 0.27
Apatite 0 0 0.12
Calcite 0 0.01 0.02
Dolomite 0 0 4.71
FeDolomite 0 0 3.88
FeOxides 0 0 0.13
Pyrite 0.31 0.1 0.48
Other minerals/Phases 0.73 0.02 0.51
Unclassified 0.03 0.03 0.28
Total 100 100 100
3.1.4 Quinoline
Quinoline (C9H7N) is a heterocyclic aromatic organic compound
which is delivered by Merck by the purity of >97%. Quinoline can be
slightly dissolved in the cold distilled water at low concentrations and
controlled pH, but it is easily dissolvable in the water at higher

Experimental methodology
28
temperatures (Jones, 1997). Initially, a ∼0.07M quinoline stock solution
is made by adding pure Quinoline to distilled water at pH 5. Mixing of a
low salinity brine (LS), a high salinity brine (HS), a brine containing only
CaCl2 (HSCa) and a special formation water (FW) with a particular
portion of stock Quinoline solution produce respectively a low salinity
brine-quinoline solution (LSQ), high salinity brine-quinoline solution
(HSQ), high salinity Ca brine-quinoline solution (CaQ) and formation
water brine-Quinoline solution (FWQ) with desired optimum
concentration of 0.01 M Quinoline. The composition of each brine listed
in section 3.1.4.2.
3.1.5 Crude Oil
Three stabilized reservoir crude oils from different fields were delivered
by oil companies. The crude oils were centrifuged to remove any solid
particles and brines. Then the oils were filtered through a 5.0 µm filter
paper to remove any dispersed particles in the crude oil. The physical
properties of the crude oils, such as density, viscosity, acid and base
numbers were measured and are listed in table 4.
Table 4. Physical and chemical properties of stabilized crude oil
AN
(mg KOH/g)
BN
(mg KOH/g) Asphaltenes
(wt%) Density@20 °C
(g/cm3)
Viscosity@20°C
(cp)
Oil M 0.16 0.76 1.1 0.85 7.0
Oil P <0.05 1.35 0.6 0.85 --
Oil T 0.04 0.77 1.2 0.84 6.6
Experimental methodology
29
3.1.6 Brines
The brines synthetically made in the laboratory based on the
compositions either designed by Smart Water EOR group at UiS (used
in static and dynamic fundamental studies) or specifically given by
companies along with different core materials. Brines are prepared by
mixing deionized water (DI) and Chemicals which are delivered by
Merck laboratories. The brines were stirred for about one hour and then
filtrated using a 0.22 µm membrane filter using a vacuum pump to
prevent the presence of any gas dissolved and unsolved particles.
The detailed brine compositions of each set of experiments are listed in
the following.
Brines used in Ca2+/Mg2+ Ads. /Des. study
Synthetic brines were used to study the reactivity of active divalent
cations towards quartz, kaolinite, and illite surfaces in
adsorption/desorption tests. Pure NaCl brine termed B was used as the
base brine for initial saturation of the sand pack, and also during the
desorption studies of Ca2+ and Mg2+ ions. The brines containing Ca2+ and
Mg2+ as active cations with Li+ as a tracer were termed BCL and BML,
respectively. The last brine, termed BCM, contained both Ca2+ and Mg2+
and was used to compare the affinity of the two cations towards the
kaolinite. Brine compositions and properties are given in table 5.

Experimental methodology
30
Table 5. Brines composition and properties used in active cations Ads. /Des.
study
Brine
Ion
B
(mM)
BCL
(mM)
BML
(mM)
BCM
(mM)
Na+ 40.2 40.2 40.2 40.2
Li+ -- 10.0 10.0 --
Ca2+ -- 10.0 -- 10.0
Mg2+ -- -- 10.0 10.0
Cl- 40.2 70.2 70.2 80.2
Ionic Strength, IS (M) 0.04 0.08 0.08 0.10
TDS (mg/l) 2350 3882 3725 4413
mM =10-3 mole/l
Brines used in quinoline Ads. /Des. study
Four brines with different salinities/compositions were prepared based
on the procedure described in section 3.1.3. The compositions are listed
in Tables 6 and 7.

Experimental methodology
31
Table 6. Brine compositions and properties used in Quinoline Ads. /Des. study
Brine
Ion
HS
(mM)
LS
(mM)
HSCa
(mM)
FW
(mM)
Na+ 355.0 13.7 - 2384
Ca2+ 45.0 1.7 270.3 613
Mg2+ 45.0 1.7 - 164
Ba2+ -- -- -- 8
Sr2+ -- -- -- 9
Cl- 535.0 20.5 540.6 4030
IS (M) 0.624 0.024 0.811 4824
TDS (mg/l) 30000 1150 30000 230000
mM =10-3 mole/l
Table 7. 0.01 M quinoline-brine solutions used in the Ads. /Des. study of
quinoline onto illite(Aksulu et al., 2012), kaolinite, and quartz.
Brine
Ion
HSQ
(mM)
LSQ
(mM)
CaQ
(mM)
FWQ
(mM)
Na+ 295.9 11.7 0.0 2085.8
Ca2+ 37.5 1.5 225.3 536.1
Mg2+ 37.1 1.5 0.0 143.9
Ba2+ -- -- -- 7.0
Sr2+ -- -- -- 7.9
Cl- 445.1 17.6 450.6 3526.0
IS (M) 0.520 0.021 0.676 4.221
TDS, mg/l 24 990 990 25 000 201 560
Experimental methodology
32
Brines used in oil recovery tests
For each set of oil recovery test performed on the cores from known
reservoir i, three main brines were used. The notation of brines used are
FWi for formation water from reservoir i. SW for north seawater, mSW
for pretreated seawater to reduce scaling problem by sulfate removal by
membrane filtration. LSi is a low salinity brine based on different
receipts i.e 20 times diluted FW or SW or mSW received by company i.
Table 8 lists the ion composition and properties of the brine used in oil
recovery tests.
Experimental methodology
33
Table 8. Brines composition and properties used in oil recovery tests
SW
(mM)
mSW
(mM)
FWm
(mM)
FWp
(mM)
FWt
(mM)
LSm
(mM)
LSp & LSt
(mM)
Na+ 450 477.2 929.8 370.9 2563.2 23.9 17.0
K+ 10 8.1 17.8 3.1 58.8 0.4 0.4
Ca2+ 13 8.2 44.2 3.5 123.8 0.4 0.3
Mg2+ 45 13.5 7.0 1.4 18.3 0.7 1.8
Ba2+ - - 5.2 0.6 0.6 - -
Sr2+ - - 3.0 0.9 0.9 - -
HCO3- 2 0.3 7.7 2.7 3.4 0.02 -
Cl- 525 527.9 1058.8 384.0 2905.7 26.4 19.9
SO42- 24 0.4 - - - 0.02 0.8
TDS
(mg/l) 33390 30725 63000 22763 170010 1536 1245
ρ*
(g/cm3) 1.024 1.020 1.042 1.014 1.133 0.999 0.999
μ*
(cP) 0.99 0.99 1.07 0.97 ˃1.3 0.94 0.99
pH* 7.6 7.0 6.8 N/A 6.1 6.4 6.8
* Measured at @ 20°C
3.2 Methodology
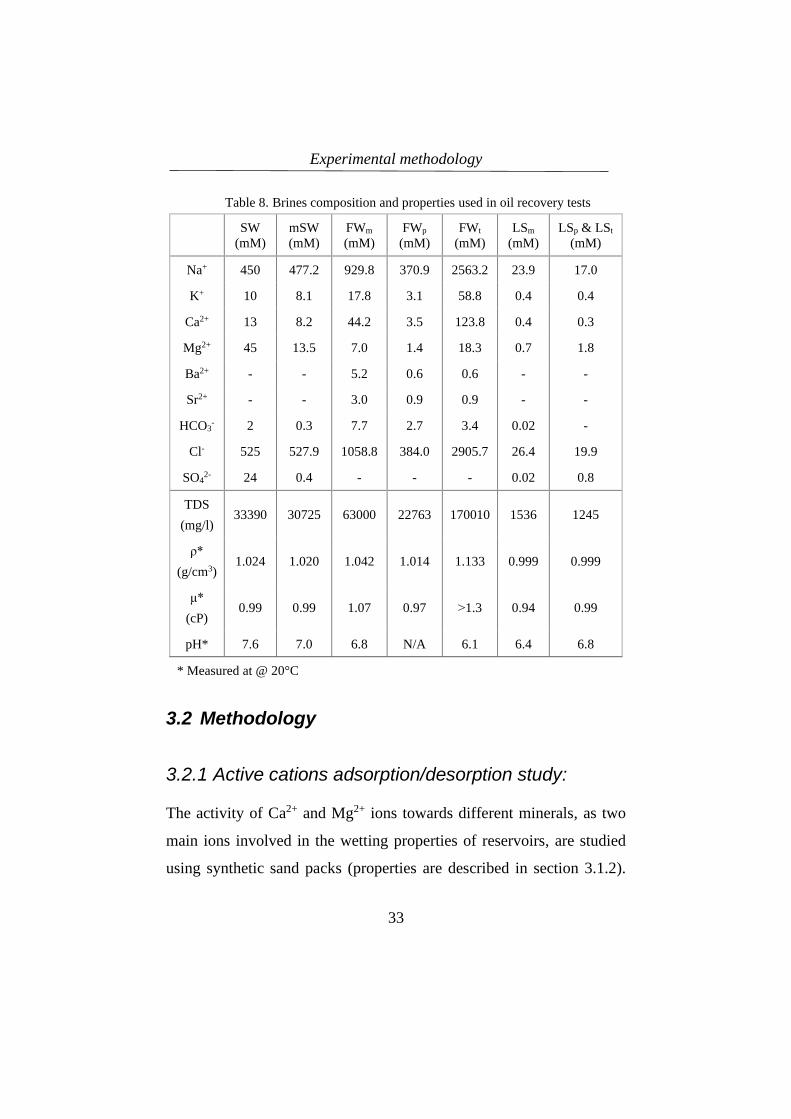
3.2.1 Active cations adsorption/desorption study:
The activity of Ca2+ and Mg2+ ions towards different minerals, as two
main ions involved in the wetting properties of reservoirs, are studied
using synthetic sand packs (properties are described in section 3.1.2).

Experimental methodology
34
The sand pack is vertically positioned in a heating chamber, and the
brines are injected using a Gilson HPLC-pump from top to
reduce/prevent mobilization of fine particles. The flow rate is adjusted to
4 PV/D, and the tests are performed at 10 bar using a backpressure valve.
Prior to each test, the sand pack was saturated and equilibrated with the
base brine, brine B, which is 40.2 mM NaCl brine. Each test is consisting
of a dynamic key ions adsorption process followed by dynamic key ions
desorption using base brine, Brine B.
The dynamic process is performed by flooding of brines BCL or BML
or BCM, and it is continued until the relative concentration of the key
ions in the effluent was ~1, i. e. [Ca2+(ad)] / [Ca2+(aq)] ~1. Then the
dynamic desorption was
Then, desorption was deliberate by flooding with brine B. Due to the
difference in concentration of active cation, the desorption will take
place. The flooding of brine B was continued until the least amount of
Ca2+/Mg2+ was detected in the effluent. The tests were performed at 23
and 130 °C.
The schematic of the active cations Ads./Des. study is shown in figure
12.
Experimental methodology
35
Figure 12. Illustration of active cations adsorption/desorption study set up
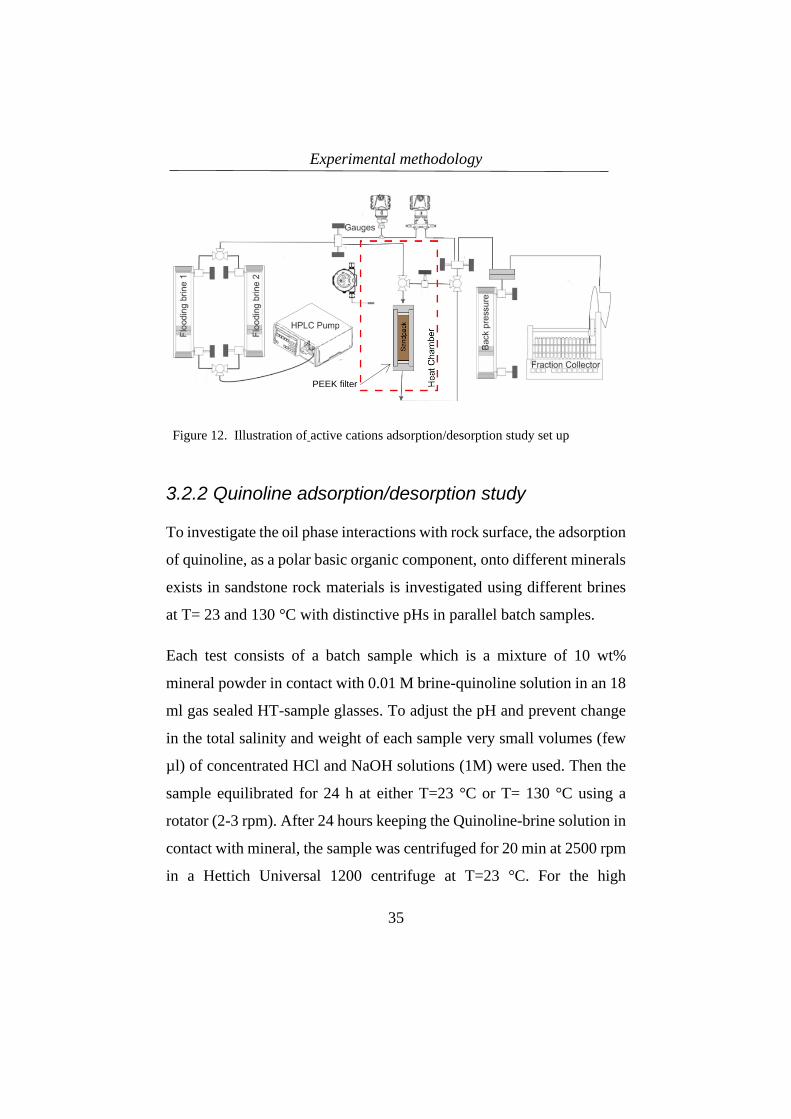
3.2.2 Quinoline adsorption/desorption study
To investigate the oil phase interactions with rock surface, the adsorption
of quinoline, as a polar basic organic component, onto different minerals
exists in sandstone rock materials is investigated using different brines
at T= 23 and 130 °C with distinctive pHs in parallel batch samples.
Each test consists of a batch sample which is a mixture of 10 wt%
mineral powder in contact with 0.01 M brine-quinoline solution in an 18
ml gas sealed HT-sample glasses. To adjust the pH and prevent change
in the total salinity and weight of each sample very small volumes (few
µl) of concentrated HCl and NaOH solutions (1M) were used. Then the
sample equilibrated for 24 h at either T=23 °C or T= 130 °C using a
rotator (2-3 rpm). After 24 hours keeping the Quinoline-brine solution in
contact with mineral, the sample was centrifuged for 20 min at 2500 rpm
in a Hettich Universal 1200 centrifuge at T=23 °C. For the high
PEEK filter

Experimental methodology
36
temperature experiments, it is assumed there will be no change in the
amount of adsorbed Quinoline by reduction of temperature from 130 to
23°C due to immediate centrifuging of the samples and thus separation
of liquid and solid phases. A mass balance between quinoline
concentration in the supernatant and the original quinoline solution
indicates the amount of adsorption.
3.2.3 Core cleaning
Reservoir cores went through a standard mild cleaning process using
Kerosene and n-Heptane, before performing the oil recovery and pH
screening tests. Then the cores were flooded with 1000 ppm NaCl for
four PV to remove any dissolvable salts. The presence of dissolved
sulphate in effluent samples was detected manually by adding Ba2+ to a
portion of each samples and the quantity is monitored by analysing their
composition using an ion chromatograph (IC). If needed. the depletion
process of sulphate was continued until the SO4-2 concentration was less
than 0.1 mM. The presence of SO4-2, could be explained as anhydrite
(CaSO4) presence initially in the core. At the end, the cores were dried
at 60-90 °C and dry weight of each core was measured.
3.2.4 Core Restoration
Initial water saturation
Initial FW saturation (Swi) was established in the cleaned and dried cores
using the desiccator technique (Springer et al., 2003). A dry core was

Experimental methodology
37
evacuated and placed on marbles inside a plastic container situated inside
a desiccator. Firstly, the set up completely vacuumed to remove any gas
inside the core. Then the diluted formation water was slowly poured into
the plastic container until the core is fully submerged in the saturation
brine. Figure 13 illustrates the setup schematic of the 100% diluted
formation water saturation apparatus. The initial water saturation
percentage compare to the 100% saturation tells us how much the
dilution degree must be. In the end, the 100% saturated core with diluted
FWi brine must be placed inside a sealed desiccator containing silica gel
at the bottom, until the desired initial water saturation is achieved by
evaporation of water molecules. Equation 10 shows the relation to
calculate the desired weight after the evaporation process.
WT = (Ws-Wd)Siw + Wd (10)
Where:
WT : Target weight of the core at desired Swi
Ws : Weight of the 100% saturated core with diluted FWi
Wd : Dry weight of the core
Swi : Initial water saturation as a fraction of the pore volume
To get an equilibrated FWi distribution, the core placed in a sealed
container for three days.
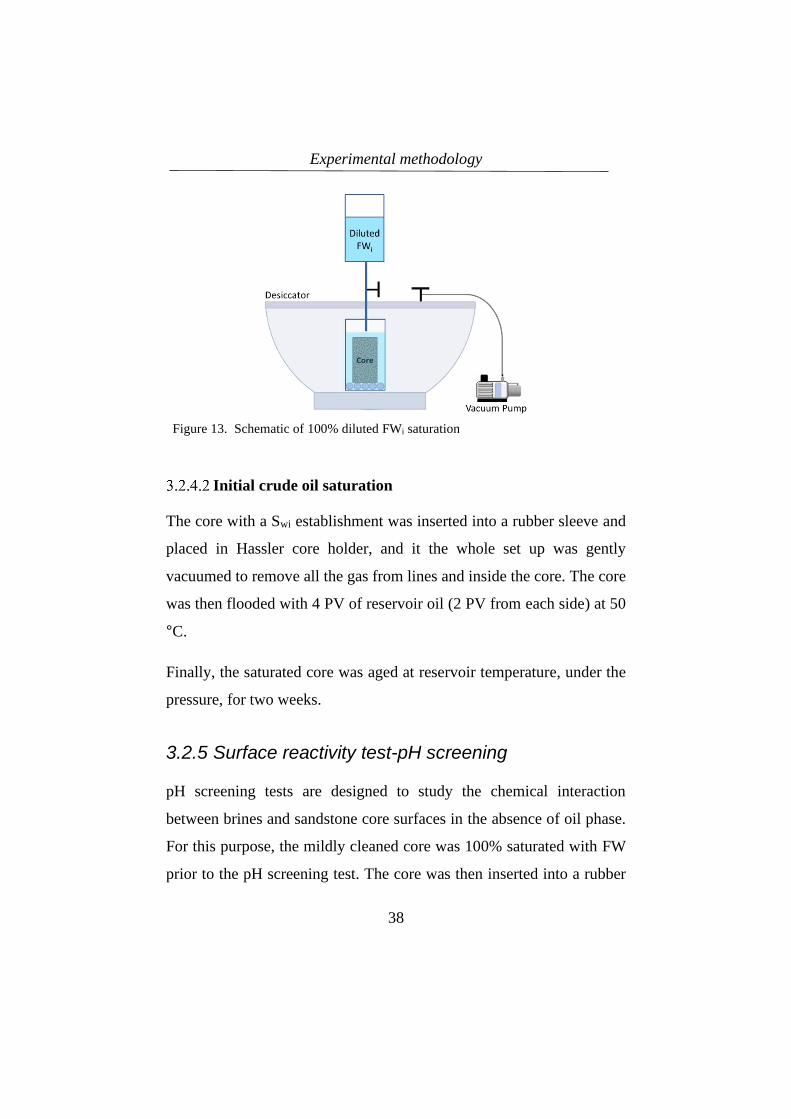
Experimental methodology
38
Figure 13. Schematic of 100% diluted FWi saturation
Initial crude oil saturation
The core with a Swi establishment was inserted into a rubber sleeve and
placed in Hassler core holder, and it the whole set up was gently
vacuumed to remove all the gas from lines and inside the core. The core
was then flooded with 4 PV of reservoir oil (2 PV from each side) at 50
°C.
Finally, the saturated core was aged at reservoir temperature, under the
pressure, for two weeks.
3.2.5 Surface reactivity test-pH screening
pH screening tests are designed to study the chemical interaction
between brines and sandstone core surfaces in the absence of oil phase.
For this purpose, the mildly cleaned core was 100% saturated with FW
prior to the pH screening test. The core was then inserted into a rubber
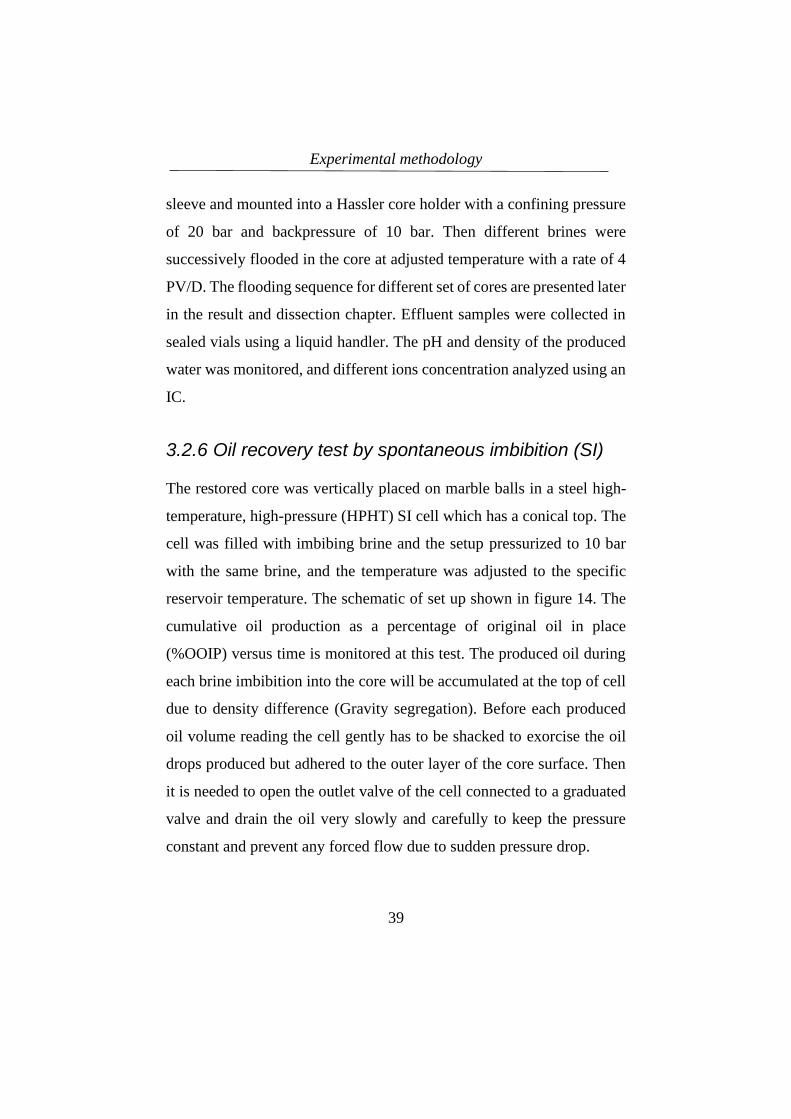
Experimental methodology
39
sleeve and mounted into a Hassler core holder with a confining pressure
of 20 bar and backpressure of 10 bar. Then different brines were
successively flooded in the core at adjusted temperature with a rate of 4
PV/D. The flooding sequence for different set of cores are presented later
in the result and dissection chapter. Effluent samples were collected in
sealed vials using a liquid handler. The pH and density of the produced
water was monitored, and different ions concentration analyzed using an
IC.
3.2.6 Oil recovery test by spontaneous imbibition (SI)
The restored core was vertically placed on marble balls in a steel high-
temperature, high-pressure (HPHT) SI cell which has a conical top. The
cell was filled with imbibing brine and the setup pressurized to 10 bar
with the same brine, and the temperature was adjusted to the specific
reservoir temperature. The schematic of set up shown in figure 14. The
cumulative oil production as a percentage of original oil in place
(%OOIP) versus time is monitored at this test. The produced oil during
each brine imbibition into the core will be accumulated at the top of cell
due to density difference (Gravity segregation). Before each produced
oil volume reading the cell gently has to be shacked to exorcise the oil
drops produced but adhered to the outer layer of the core surface. Then
it is needed to open the outlet valve of the cell connected to a graduated
valve and drain the oil very slowly and carefully to keep the pressure
constant and prevent any forced flow due to sudden pressure drop.
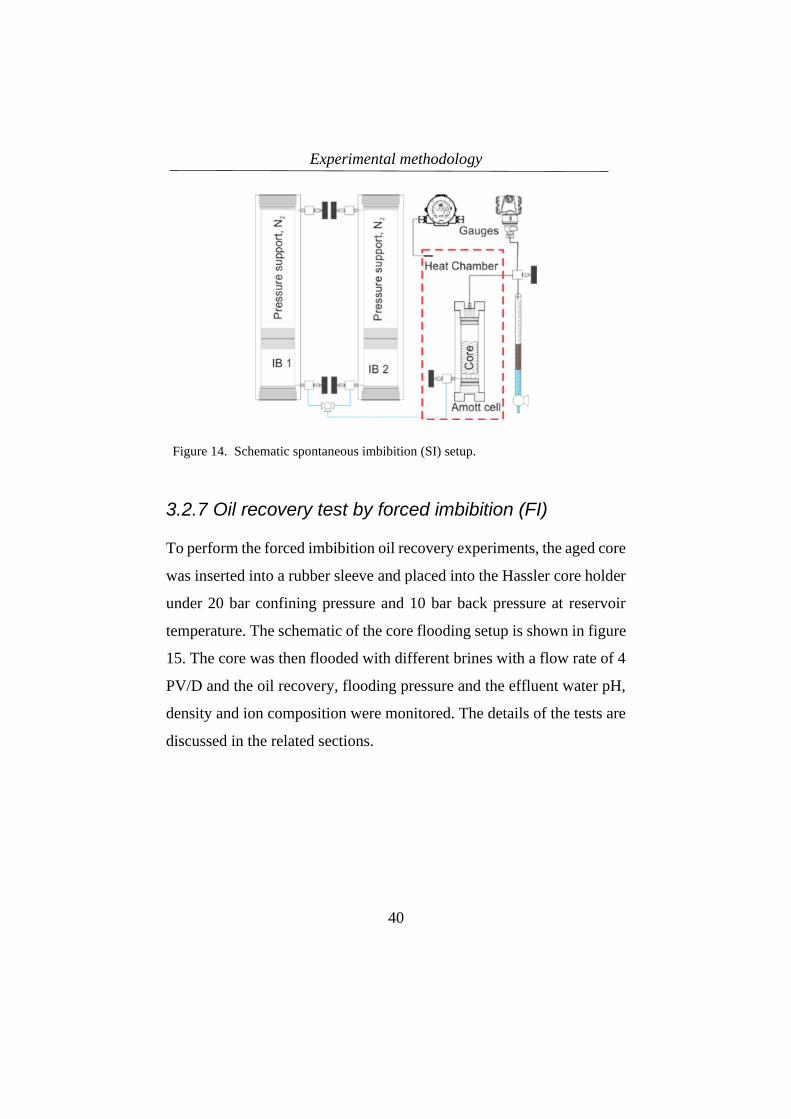
Experimental methodology
40
Figure 14. Schematic spontaneous imbibition (SI) setup.
3.2.7 Oil recovery test by forced imbibition (FI)
To perform the forced imbibition oil recovery experiments, the aged core
was inserted into a rubber sleeve and placed into the Hassler core holder
under 20 bar confining pressure and 10 bar back pressure at reservoir
temperature. The schematic of the core flooding setup is shown in figure
15. The core was then flooded with different brines with a flow rate of 4
PV/D and the oil recovery, flooding pressure and the effluent water pH,
density and ion composition were monitored. The details of the tests are
discussed in the related sections.

Experimental methodology
41
Figure 15. Core flooding setup for oil recovery tests by viscous flooding. IB =
injection brine. O/W = Oil/Water
The list of all the experiments performed on the reservoir cores are
presented in table 9.
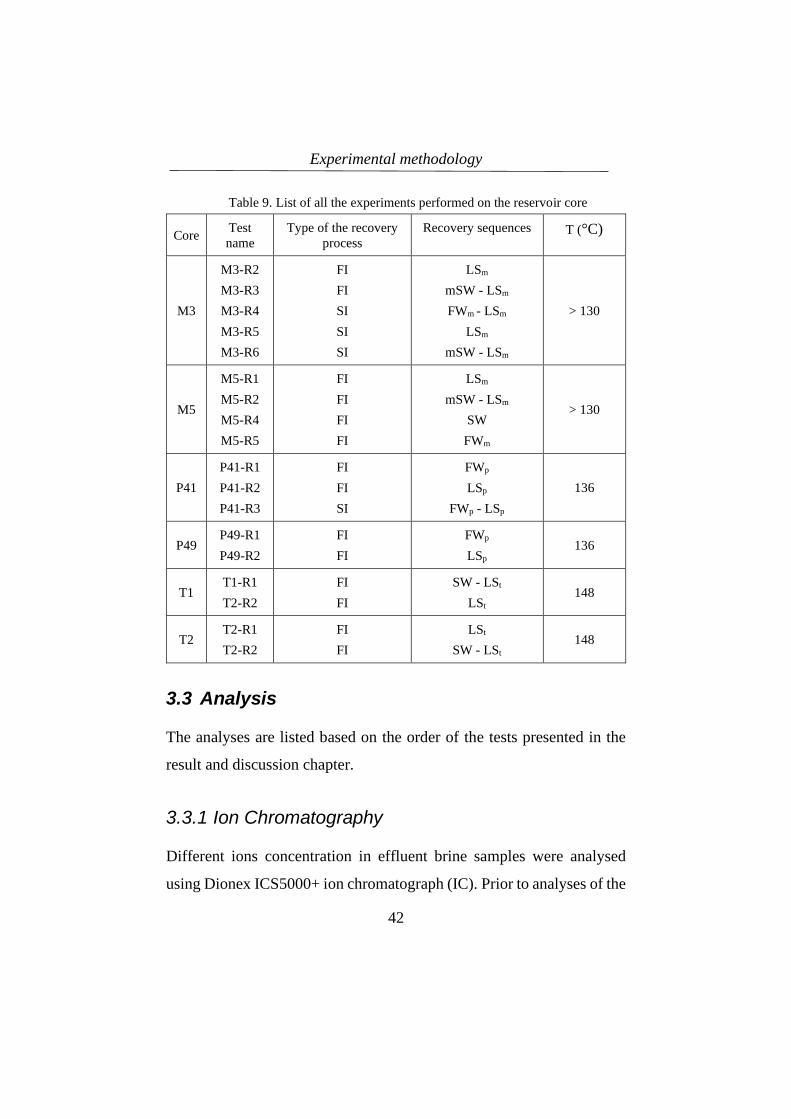
Experimental methodology
42
Table 9. List of all the experiments performed on the reservoir core
Core Test
name
Type of the recovery
process
Recovery sequences T (°C)
M3
M3-R2
M3-R3
M3-R4
M3-R5
M3-R6
FI
FI
SI
SI
SI
LSm
mSW - LSm
FWm - LSm
LSm
mSW - LSm
> 130
M5
M5-R1
M5-R2
M5-R4
M5-R5
FI
FI
FI
FI
LSm
mSW - LSm
SW
FWm
> 130
P41
P41-R1
P41-R2
P41-R3
FI
FI
SI
FWp
LSp
FWp - LSp
136
P49 P49-R1
P49-R2
FI
FI
FWp
LSp 136
T1 T1-R1
T2-R2
FI
FI
SW - LSt
LSt 148
T2 T2-R1
T2-R2
FI
FI
LSt
SW - LSt
148
3.3 Analysis
The analyses are listed based on the order of the tests presented in the
result and discussion chapter.
3.3.1 Ion Chromatography
Different ions concentration in effluent brine samples were analysed
using Dionex ICS5000+ ion chromatograph (IC). Prior to analyses of the

Experimental methodology
43
samples, effluent samples were diluted 500-1000 times using a GX-271
Liquid Handler to reduce the concentrations into the optimum detection
range of each ion. Diluted samples then filtered through a 0.2 um filter
into sealed sample glasses. It has to be noticed that an external sample
also must be analysed in between of main diluted samples to be able to
calculate ions concentration.
3.3.2 pH measurements
The pH of brines and effluent samples were measured using Seven
Easy™ pH meter delivered by Mettler Toledo, with a Semi-micro pH
electrode. The repeatability of measurement was ± 0.02 pH units at
ambient temperature.
3.3.3 Quinoline concentration measurement
The amount of quinoline adsorption is indirectly indicated using a Shimadzu
UV-1700 PharmaSpec UV-VIS spectrophotometer at ambient temperature.
The spectrophotometer measures absorbance (ABS) of Quinoline at
wavelength of 312.5 nm by scanning in the wavelength of 190-700 nm. To
accomplish an exact ABS measurement of quinoline in the solution, the
sample must be 100 times diluted with DI water at pH≈3.5. The reason to
perform the ABS measurement at this low pH is that the degree of
protonation of quinoline increases as the pH of the solution goes below
the pKa value and reaches 100% around pH∼3.5.(Burgos et al., 2002),
figure 16.
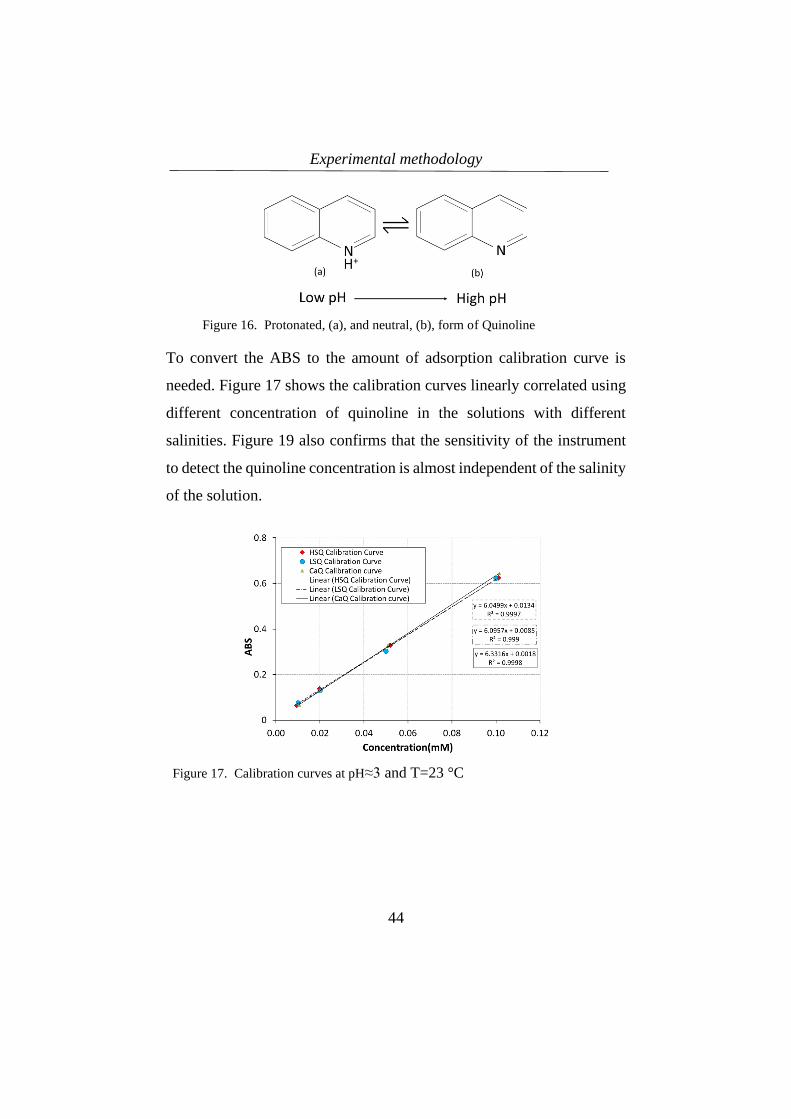
Experimental methodology
44
Figure 16. Protonated, (a), and neutral, (b), form of Quinoline
To convert the ABS to the amount of adsorption calibration curve is
needed. Figure 17 shows the calibration curves linearly correlated using
different concentration of quinoline in the solutions with different
salinities. Figure 19 also confirms that the sensitivity of the instrument
to detect the quinoline concentration is almost independent of the salinity
of the solution.
Figure 17. Calibration curves at pH≈3 and T=23 °C
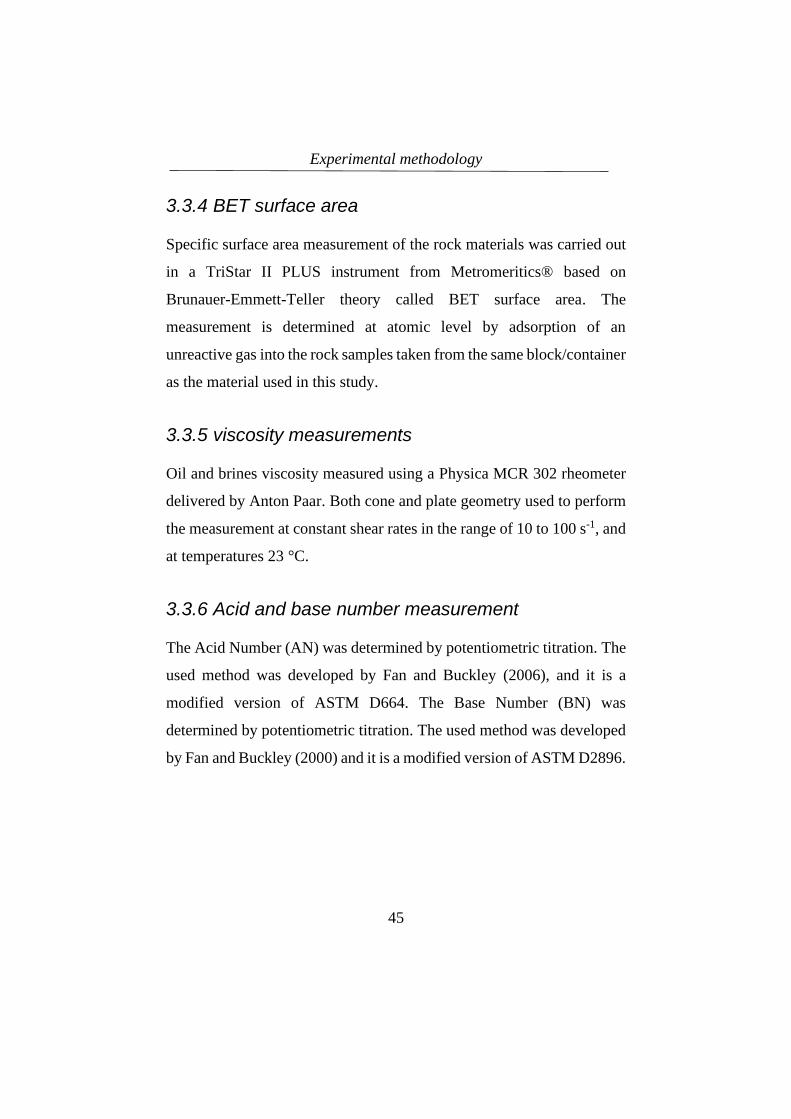
Experimental methodology
45
3.3.4 BET surface area
Specific surface area measurement of the rock materials was carried out
in a TriStar II PLUS instrument from Metromeritics® based on
Brunauer-Emmett-Teller theory called BET surface area. The
measurement is determined at atomic level by adsorption of an
unreactive gas into the rock samples taken from the same block/container
as the material used in this study.
3.3.5 viscosity measurements
Oil and brines viscosity measured using a Physica MCR 302 rheometer
delivered by Anton Paar. Both cone and plate geometry used to perform
the measurement at constant shear rates in the range of 10 to 100 s-1, and
at temperatures 23 °C.
3.3.6 Acid and base number measurement
The Acid Number (AN) was determined by potentiometric titration. The
used method was developed by Fan and Buckley (2006), and it is a
modified version of ASTM D664. The Base Number (BN) was
determined by potentiometric titration. The used method was developed
by Fan and Buckley (2000) and it is a modified version of ASTM D2896.

Experimental methodology
46
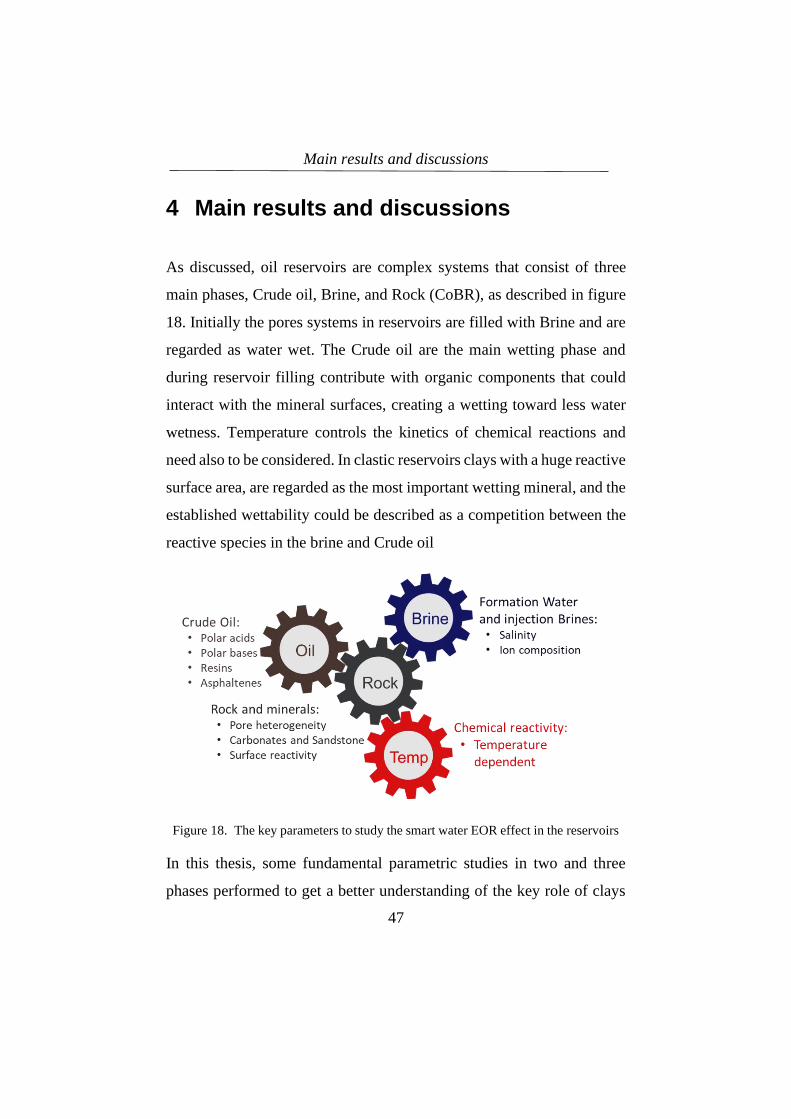
Main results and discussions
47
4 Main results and discussions
As discussed, oil reservoirs are complex systems that consist of three
main phases, Crude oil, Brine, and Rock (CoBR), as described in figure
18. Initially the pores systems in reservoirs are filled with Brine and are
regarded as water wet. The Crude oil are the main wetting phase and
during reservoir filling contribute with organic components that could
interact with the mineral surfaces, creating a wetting toward less water
wetness. Temperature controls the kinetics of chemical reactions and
need also to be considered. In clastic reservoirs clays with a huge reactive
surface area, are regarded as the most important wetting mineral, and the
established wettability could be described as a competition between the
reactive species in the brine and Crude oil
Figure 18. The key parameters to study the smart water EOR effect in the reservoirs
In this thesis, some fundamental parametric studies in two and three
phases performed to get a better understanding of the key role of clays
Main results and discussions
48
on the initial wettability and also the wettability alteration process during
the smart water EOR effect. And then using real reservoir cores, the
potential of different LS brine, compare to SW and mSW and also after
those brine in tertiary mode are investigated at high reservoir
temperature.
4.1 Reactivity of divalent ions towards sandstone
mineral surface
In clastic reservoirs, there are three main groups of minerals, Quartz,
Feldspars, and Clays. Clays are important because they have
permanently negative surface charges giving a Cation Exchange
Capacity (CEC), and contribute with a large portion of the mineral
surfaces. With a huge reactive surface area, clays are regarded as the
most important wetting mineral, and the established wettability could be
described as a competition between the reactive species in the brine and
Crude oil.
Tang and Morrow (1999) were the first discussed the importance of clay
present in order to see the LS brine EOR effect, by recovering no more
oil in the clay free sandstones. Further studies confirmed that the
adsorption/desorption of both polar organic component of crude oil and
also ions from brine, both happen on the negative charge surface of clays
(Austad et al., 2010). It is also argued that presence of active cations such
as Ca2+ and Mg2+ in the FW, are important to create the optimum initial
wetting condition, and also to create the alkaline environment during the
Main results and discussions
49
smart water LS brine injection (Austad et al., 2010; Lager et al., 2007;
Ligthelm et al., 2009).
In the following section, the rate-determining reaction of chemically
induced wettability alteration is fundamentally studied by investigating
the affinity of two important cations presenting in the FW, i.e Ca2+ and
Mg2+, towards three different minerals, at ambient and high temperature.
And also the affinity of those two cations compared to each other towards
different minerals.
4.1.1 Reactivity of divalent cations towards quartz
‘Even though Quartz is the most dominant mineral in sandstone
reservoirs, the minerals contribute with low surface area and low
reactivity towards cations and are expected to have limited effect on
wetting and wettability alteration processes in Sandstone reservoirs.
A sand pack containing only quartz (SP#1) was used as a “blank” test to
evaluate the reactivity active cations, i.e Ca2+ and Mg2+, towards the
quartz mineral surfaces in a dynamic flooding process. Three different
injection brines, B, BCL, and BML were used. B contains only NaCl.
BCL contains Ca2+ and Li+ as a tracer in addition to NaCl. in BML the
Ca2+ is substituted with Mg2+.
The sand pack was initially equilibrated with brine B (pure NaCl) prior
to the test. Then the flooding continued with BCL (with Ca2+ and Li+) or
with BML (with Mg2+ and Li+) for an adsorption process. Ion
concentrations in effluent samples at 130°C are presented in figure 19.
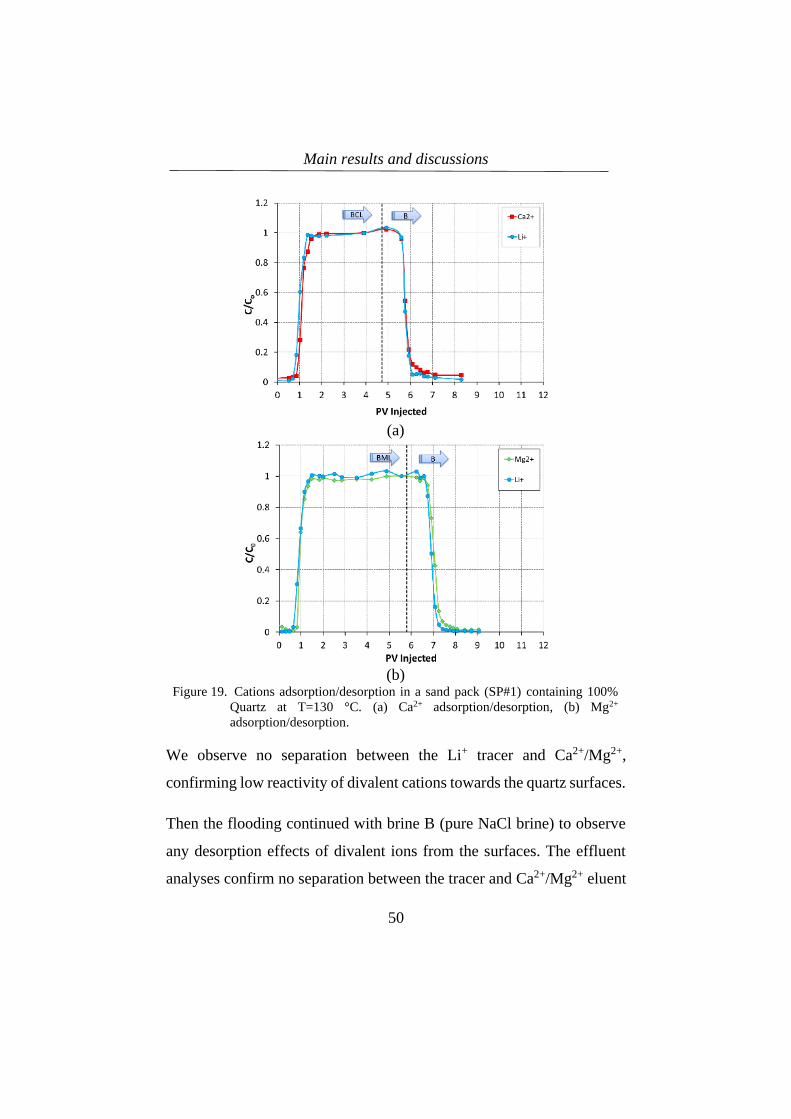
Main results and discussions
50
(a)
(b)
Figure 19. Cations adsorption/desorption in a sand pack (SP#1) containing 100%
Quartz at T=130 °C. (a) Ca2+ adsorption/desorption, (b) Mg2+
adsorption/desorption.
We observe no separation between the Li+ tracer and Ca2+/Mg2+,
confirming low reactivity of divalent cations towards the quartz surfaces.
Then the flooding continued with brine B (pure NaCl brine) to observe
any desorption effects of divalent ions from the surfaces. The effluent
analyses confirm no separation between the tracer and Ca2+/Mg2+ eluent
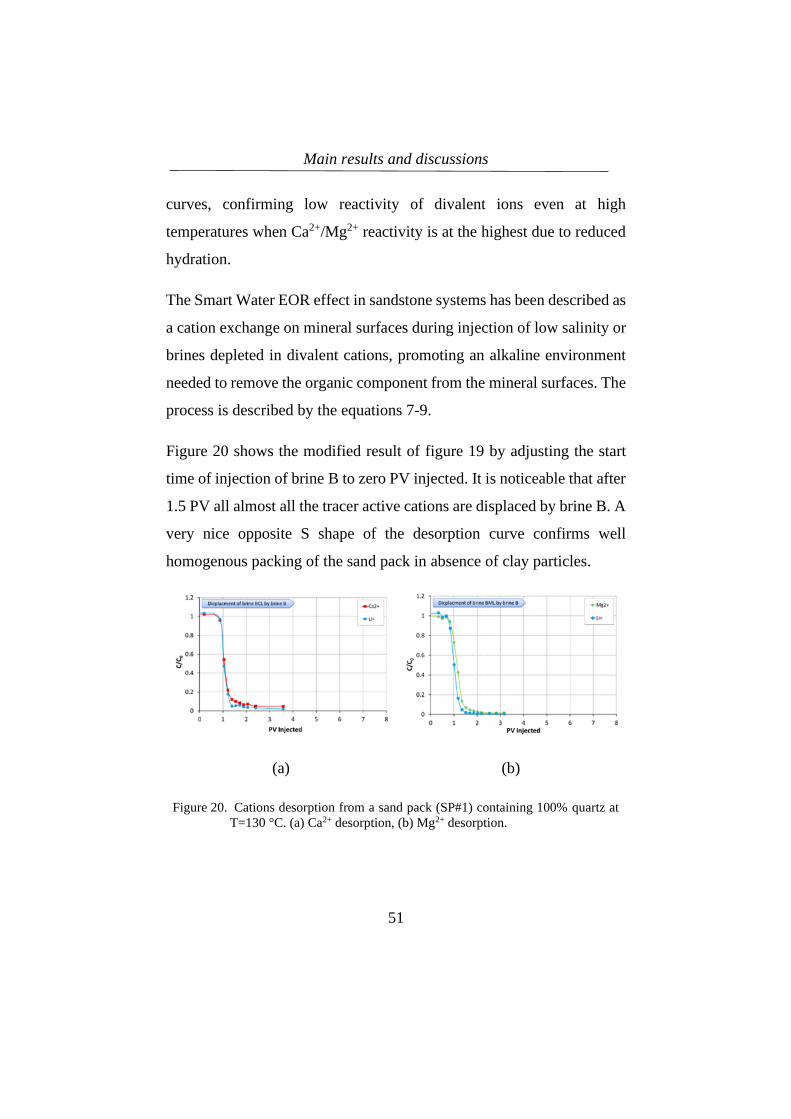
Main results and discussions
51
curves, confirming low reactivity of divalent ions even at high
temperatures when Ca2+/Mg2+ reactivity is at the highest due to reduced
hydration.
The Smart Water EOR effect in sandstone systems has been described as
a cation exchange on mineral surfaces during injection of low salinity or
brines depleted in divalent cations, promoting an alkaline environment
needed to remove the organic component from the mineral surfaces. The
process is described by the equations 7-9.
Figure 20 shows the modified result of figure 19 by adjusting the start
time of injection of brine B to zero PV injected. It is noticeable that after
1.5 PV all almost all the tracer active cations are displaced by brine B. A
very nice opposite S shape of the desorption curve confirms well
homogenous packing of the sand pack in absence of clay particles.
(a) (b)
Figure 20. Cations desorption from a sand pack (SP#1) containing 100% quartz at
T=130 °C. (a) Ca2+ desorption, (b) Mg2+ desorption.
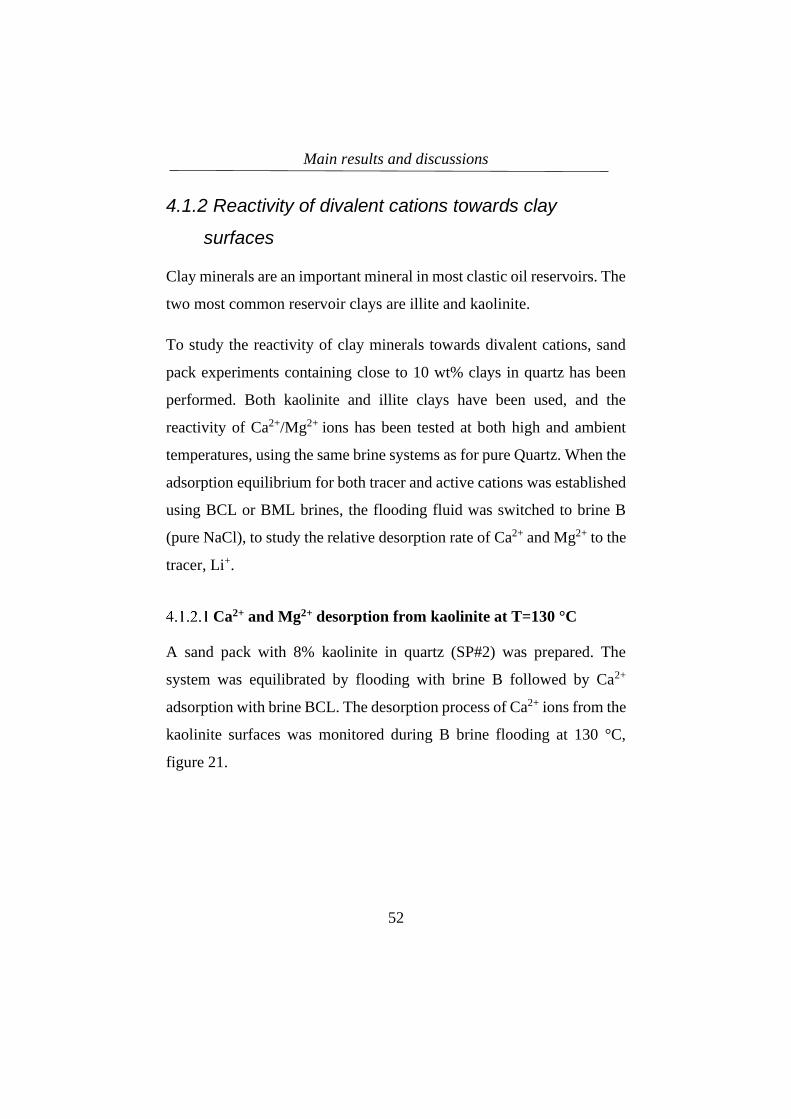
Main results and discussions
52
4.1.2 Reactivity of divalent cations towards clay
surfaces
Clay minerals are an important mineral in most clastic oil reservoirs. The
two most common reservoir clays are illite and kaolinite.
To study the reactivity of clay minerals towards divalent cations, sand
pack experiments containing close to 10 wt% clays in quartz has been
performed. Both kaolinite and illite clays have been used, and the
reactivity of Ca2+/Mg2+ ions has been tested at both high and ambient
temperatures, using the same brine systems as for pure Quartz. When the
adsorption equilibrium for both tracer and active cations was established
using BCL or BML brines, the flooding fluid was switched to brine B
(pure NaCl), to study the relative desorption rate of Ca2+ and Mg2+ to the
tracer, Li+.
Ca2+ and Mg2+ desorption from kaolinite at T=130 °C
A sand pack with 8% kaolinite in quartz (SP#2) was prepared. The
system was equilibrated by flooding with brine B followed by Ca2+
adsorption with brine BCL. The desorption process of Ca2+ ions from the
kaolinite surfaces was monitored during B brine flooding at 130 °C,
figure 21.
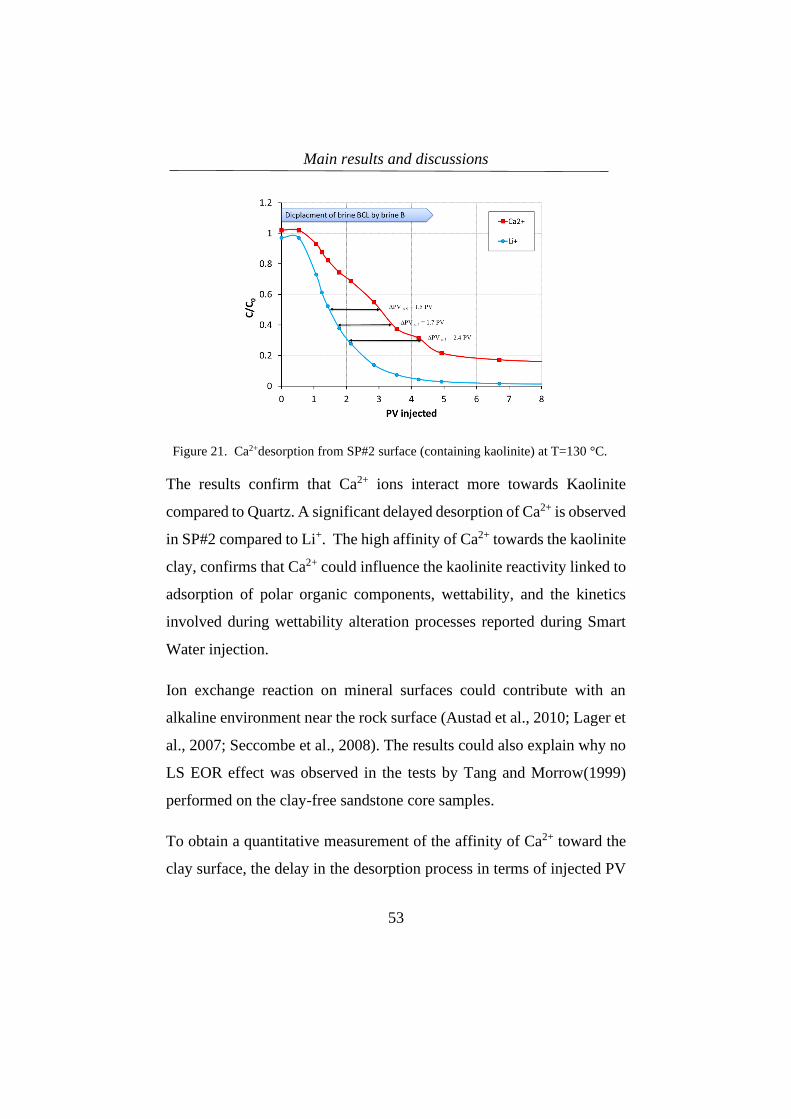
Main results and discussions
53
Figure 21. Ca2+desorption from SP#2 surface (containing kaolinite) at T=130 °C.
The results confirm that Ca2+ ions interact more towards Kaolinite
compared to Quartz. A significant delayed desorption of Ca2+ is observed
in SP#2 compared to Li+. The high affinity of Ca2+ towards the kaolinite
clay, confirms that Ca2+ could influence the kaolinite reactivity linked to
adsorption of polar organic components, wettability, and the kinetics
involved during wettability alteration processes reported during Smart
Water injection.
Ion exchange reaction on mineral surfaces could contribute with an
alkaline environment near the rock surface (Austad et al., 2010; Lager et
al., 2007; Seccombe et al., 2008). The results could also explain why no
LS EOR effect was observed in the tests by Tang and Morrow(1999)
performed on the clay-free sandstone core samples.
To obtain a quantitative measurement of the affinity of Ca2+ toward the
clay surface, the delay in the desorption process in terms of injected PV
Main results and discussions
54
was obtained by calculating the average difference in elusion time (∆PV)
between the tracer Li+, and Ca2+ at the relative ion concentrations of 0.5,
0.4, and 0.3, as shown in figure 1 and summarized in Table 3. The
average retention value of Ca2+ relative to tracer Li+, was 1.9 PV in SP#2
at 130 °C.
The reactivity of Mg2+ toward Kaolinite clays was also measured at 130
°C. SP#2 was equilibrated with brine B, before exposed to Mg2+ ions by
flooding with and flooded with BML brine. The desorption of Mg2+
relative to Li+ ions was monitored during the B brine flooding, figure 22.
The desorption curves of Li+ and Mg2+ show that Mg2+ interacts stronger
to kaolinite clays compared to Li+. The average elusion time was
calculated to 0.65 PV which is only 34% compared to Ca2+ at 130 °C,
(Table 10).
Figure 22. Mg2+ desorption from kaolinite surfaces in SP#2 at 130 °C.
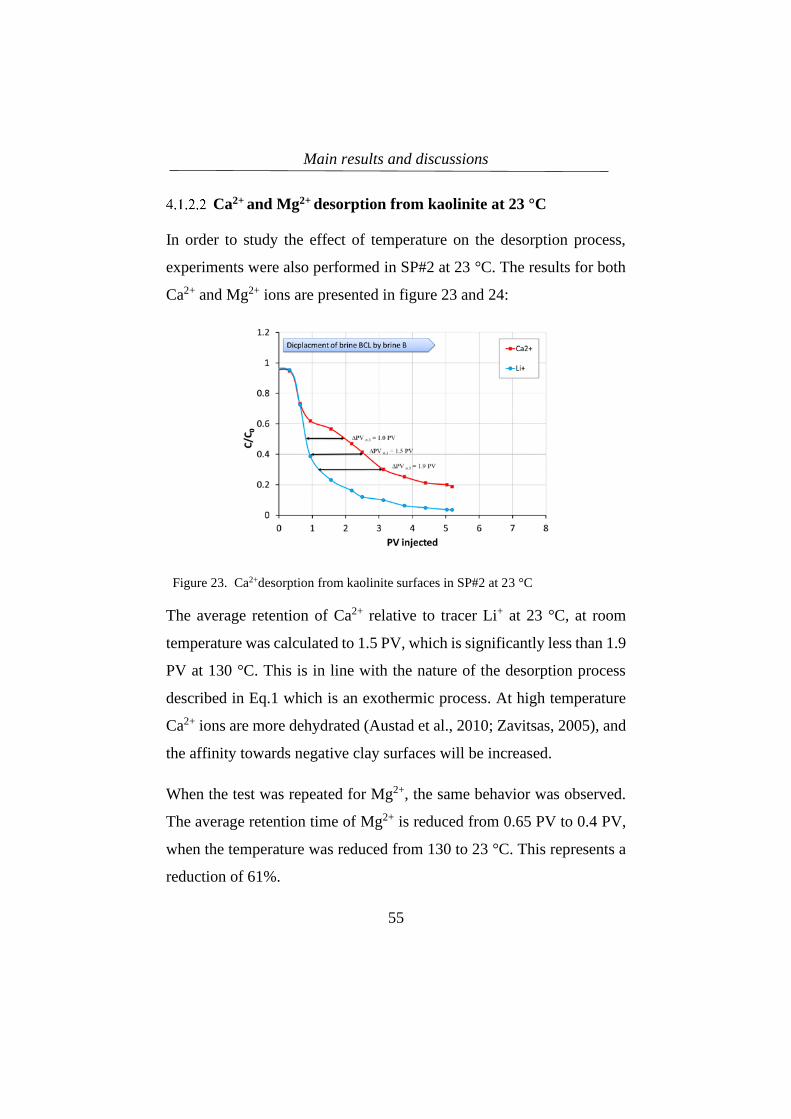
Main results and discussions
55
Ca2+ and Mg2+ desorption from kaolinite at 23 °C
In order to study the effect of temperature on the desorption process,
experiments were also performed in SP#2 at 23 °C. The results for both
Ca2+ and Mg2+ ions are presented in figure 23 and 24:
Figure 23. Ca2+desorption from kaolinite surfaces in SP#2 at 23 °C
The average retention of Ca2+ relative to tracer Li+ at 23 °C, at room
temperature was calculated to 1.5 PV, which is significantly less than 1.9
PV at 130 °C. This is in line with the nature of the desorption process
described in Eq.1 which is an exothermic process. At high temperature
Ca2+ ions are more dehydrated (Austad et al., 2010; Zavitsas, 2005), and
the affinity towards negative clay surfaces will be increased.
When the test was repeated for Mg2+, the same behavior was observed.
The average retention time of Mg2+ is reduced from 0.65 PV to 0.4 PV,
when the temperature was reduced from 130 to 23 °C. This represents a
reduction of 61%.

Main results and discussions
56
Figure 24. Mg2+ desorption from kaolinite surfaces in SP#2 at 23 °C.
Ca2+ and Mg2+desorption from illite clays at 23 °C
Illite clays are also common in clastic reservoir systems. The reactivity
of divalent cations towards illite surfaces is also important to evaluate.
Cissokho et. al. (2010) have reported that illite clay could also play a key
role as well as kaolinite in the LS EOR mechanism.
Sand Packs containing illite clays were prepared in the same way as for
the kaolinite. SP#3 contained 8 wt% illite in quartz. Adsorption
/desorption studies was performed to evaluate the Ca2+ reactivity toward
illite at 23 °C. The desorption curves are presented in figure 25.

Main results and discussions
57
Figure 25. Desorption of Ca2+ ions from Illite surfaces in SP#3 at 23 °C.
The Ca2+ retention compared to tracer Li+ was calculated to 0.83 PV. The
value is significantly less than the value of 1.5 PV observed kaolinite at
23 °C, even though illite has higher CEC. A possible explanation could
be the grouped structure of illites with less exposed surfaces.
Table 10. Retention of Ca2+ and Mg2+ relative to tracer, Li+, in contact with
kaolinite and illite clay at room temperature and 130 °C, in ∆PV.
Sand pack SP#2, Kaolinite SP#3,
Illite
Rel. conc.
(desorption)
C/C0
Delayed
Ca2+
@23°C
[∆PV]
Delayed
Ca2+ @130
°C
[∆PV]
Delayed
Mg2+ @
23°C
[∆PV]
Delayed
Mg2+ @130
°C
[∆PV]
Delayed
Ca2+
@23°C
[∆PV]
0.5 1 1.5 0.2 0.5 0.6
0.4 1.5 1.7 0.4 0.65 0.75
0.3 1.9 2.4 0.6 0.8 1.15
Avg. ∆PV 1.5 1.9 0.4 0.65 0.83
Main results and discussions
58
The quantitative comparison of the five desorption studies performed
at 23 °C and 130 both in kaolinite and illite sand packs are summarized
in table 10.
4.1.3 Competitive reactivity of Ca2+ and Mg2+ onto clays
Formation water (FW) has typically 5 times higher Ca2+ conc. than Mg2+,
while Seawater (SW) as typical injection water has 4 times Mg2+
compared to Ca2+. Smart water EOR brines have modified brine
compositions depending on the type of reservoir mineralogy. In
sandstone reservoirs, injection brines depleted in divalent cations have
been observed as very efficient Smart Water. Competitive reactivity
between Ca2+ and Mg2+ toward clay surfaces have been performed in
Sand Pack studies, to verify any symbiotic effects.
Competitive desorption of Ca2+ and Mg2+ from Illite surface
To compare the affinity of Ca2+ and Mg2+ towards illite surface, SP#4
with 10 wt% Illite in Quarz sand were used. Brine flooding sequence was
B – BCM – B. The BCM brine contain equal amounts of Ca2+ and Mg2+,
10 mM. Experiments were performed at both 23 °C and 130 °C. The
results from the desorption process is presented in figure 25 and 26.
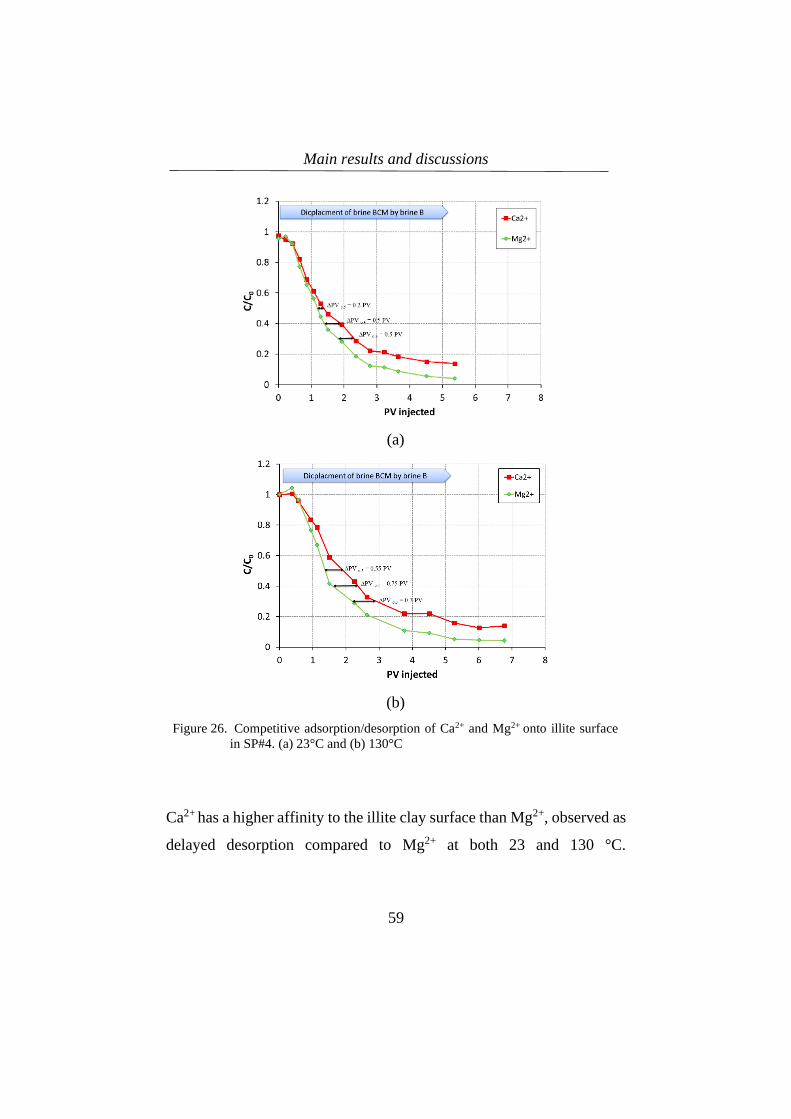
Main results and discussions
59
(a)
(b)
Figure 26. Competitive adsorption/desorption of Ca2+ and Mg2+ onto illite surface
in SP#4. (a) 23°C and (b) 130°C
Ca2+ has a higher affinity to the illite clay surface than Mg2+, observed as
delayed desorption compared to Mg2+ at both 23 and 130 °C.
Main results and discussions
60
Quantitative values of the delayed desorption d Ca2+ compared to Mg2+
is 0.4 and 0.67 PV, respectively, and reported in table 11.
The shift of whole desorption curves to the right by an increase of
temperature, confirms an increase in affinity of both divalent cations at
higher temperatures due to dehydration.
The results highlight the key role of Ca2+ in FW and temperature will
have on reservoir wettability. It could also explain the delayed chemical
wettability alteration processes observed during Smart Water injection
in Clastic reservoir systems with kaolinite clays according to equation.7.
Competitive desorption of Ca2+ and Mg2+ from Kaolinite
surface
Competitive desorption of Ca2+ and Mg2+ was also studied in sand pack
SP#2 containing kaolinite clay at 130 ºC with the same test procedure as
for illite, figure 27.
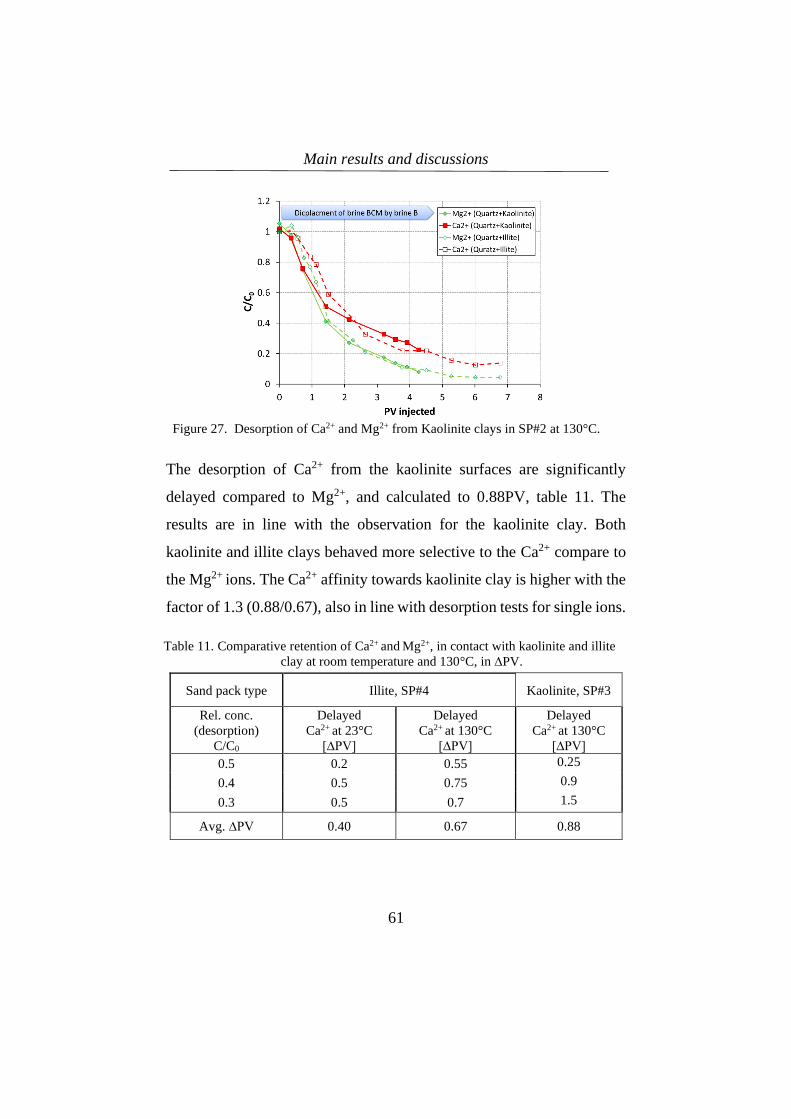
Main results and discussions
61
Figure 27. Desorption of Ca2+ and Mg2+ from Kaolinite clays in SP#2 at 130°C.
The desorption of Ca2+ from the kaolinite surfaces are significantly
delayed compared to Mg2+, and calculated to 0.88PV, table 11. The
results are in line with the observation for the kaolinite clay. Both
kaolinite and illite clays behaved more selective to the Ca2+ compare to
the Mg2+ ions. The Ca2+ affinity towards kaolinite clay is higher with the
factor of 1.3 (0.88/0.67), also in line with desorption tests for single ions.
Table 11. Comparative retention of Ca2+ and Mg2+, in contact with kaolinite and illite
clay at room temperature and 130°C, in ∆PV.
Sand pack type Illite, SP#4 Kaolinite, SP#3
Rel. conc.
(desorption)
C/C0
Delayed
Ca2+ at 23°C
[∆PV]
Delayed
Ca2+ at 130°C
[∆PV]
Delayed
Ca2+ at 130°C
[∆PV]
0.5 0.2 0.55 0.25
0.4 0.5 0.75 0.9
0.3 0.5 0.7 1.5
Avg. ∆PV 0.40 0.67 0.88
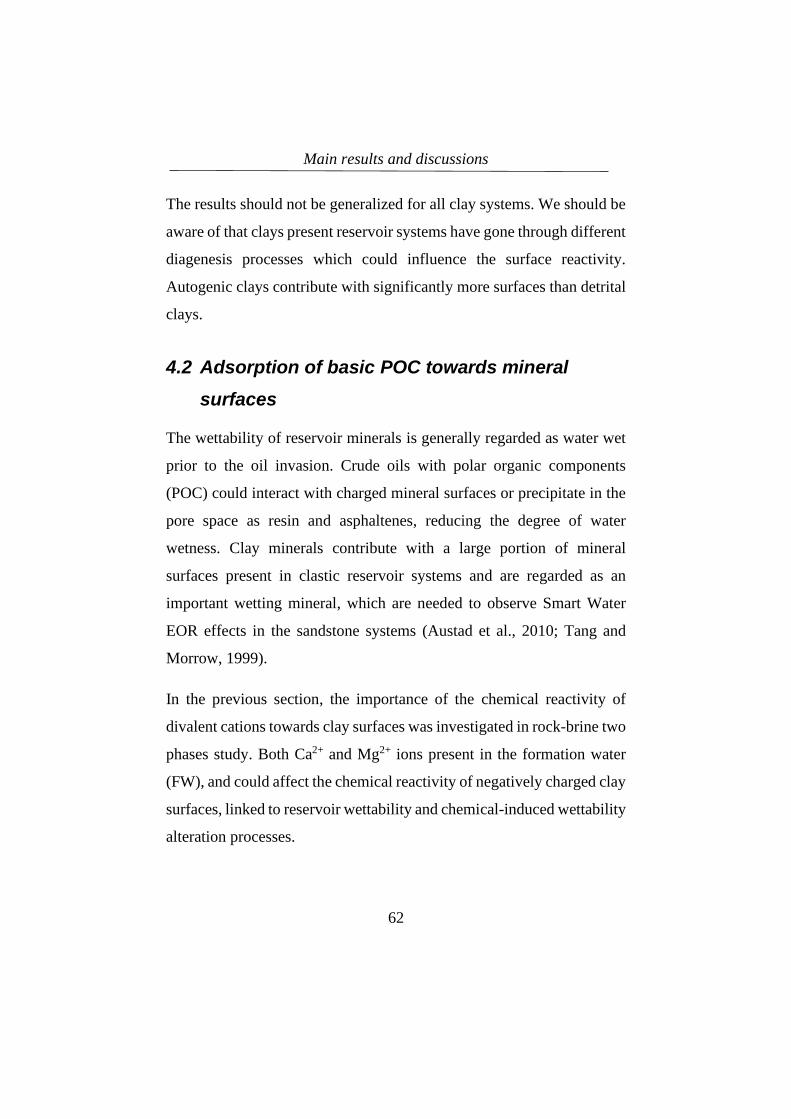
Main results and discussions
62
The results should not be generalized for all clay systems. We should be
aware of that clays present reservoir systems have gone through different
diagenesis processes which could influence the surface reactivity.
Autogenic clays contribute with significantly more surfaces than detrital
clays.
4.2 Adsorption of basic POC towards mineral
surfaces
The wettability of reservoir minerals is generally regarded as water wet
prior to the oil invasion. Crude oils with polar organic components
(POC) could interact with charged mineral surfaces or precipitate in the
pore space as resin and asphaltenes, reducing the degree of water
wetness. Clay minerals contribute with a large portion of mineral
surfaces present in clastic reservoir systems and are regarded as an
important wetting mineral, which are needed to observe Smart Water
EOR effects in the sandstone systems (Austad et al., 2010; Tang and
Morrow, 1999).
In the previous section, the importance of the chemical reactivity of
divalent cations towards clay surfaces was investigated in rock-brine two
phases study. Both Ca2+ and Mg2+ ions present in the formation water
(FW), and could affect the chemical reactivity of negatively charged clay
surfaces, linked to reservoir wettability and chemical-induced wettability
alteration processes.
Main results and discussions
63
In this section, behavior of the third phase, the oil phase, in relation to
the initial wetting and wettability alteration requirements has been
fundamentally investigated. The wettability of clay surfaces is generally
controlled by adsorption of POC in the Crude oil (Denekas et al., 1959;
Fogden, 2012; Lager et al., 2008; Morrow, 1990; Wolcott et al., 1993).
Quinoline, as a representative model for POC in crude oil is selected to
be studied in contact with different minerals and brines. Previous
experimental studies have confirmed that Quinoline which is a Basic
POC and present in crude oil, could promisingly be used as a model
component in parametric laboratory studies evaluating the affinity
towards mineral surfaces. (Aksulu et al., 2012; Fogden, 2012),
4.2.1 Adsorption of quinoline to the quartz and Clay
surfaces
The adsorption of quinoline towards illite and kaolinite clays was
compared with quartz. 10 mM quinoline in LS brine (LSQ) was
equilibrated with 10 wt% mineral phases, and the adsorption of quinoline
as a function of pH was measured. The results are presented in figure 28.

Main results and discussions
64
Figure 28. Adsorption of quinoline towards mineral surfaces vs. pH. 10mM
Quinoline in LS brine (LSQ) was equilibrated with 10 wt% illite,
kaolinite or quartz t at 23°C
As expected, quartz minerals have the least adsorption of quinoline at all
pH values from 2-8. This could be explained by less specific surface area
(BET=0.3m2/g) and less negative charge densities (Allard et al., 1983).
In Addition, the low observed adsorption is not pH depended. The results
are also in line with the observation of divalent cation adsorption and
desorption towards quartz in sand pack experiments.
The adsorption of quinoline towards kaolinite and illite surfaces are
significantly higher and confirms a pH dependence. The amount of
adsorption towards illite is twice the kaolinite adsorption at peak values
close to pH 5. The BET values of kaolinite and illite are measured to 13
and 22 m2/g respectively, confirming increased adsorption with
increased reactive surfaces.
At high pH, the adsorption of quinoline towards kaolinite is very low
compared to illite clay. A stacked clay structure with less easily

Main results and discussions
65
accessible illite surfaces could explain why low adsorption is not reached
for illite. The results are also in line with sand pack experiments with
reduced delay in desorption of divalent cation from illite surfaces.
4.2.2 Quinoline adsorption onto kaolinite – Effect of pH,
salinity, and temperature
Quinoline adsorption towards Kaolinite surfaces was also studied by
using 3 different brines solutions, LSQ, HSQ and CaQ . 10 wt% kaolinite
clay was equilibrated with the brine solutions at constant pH with values
in the range of 2-10. Experiments were performed at both 23 and 130°C,
and the results are presented in figure 29 and 30.
Figure 29. Adsorption of quinoline onto 10 wt% kaolinite clay in contact with LSQ,
HSQ and CaQ solutions vs. pH at (a) T=23 °C
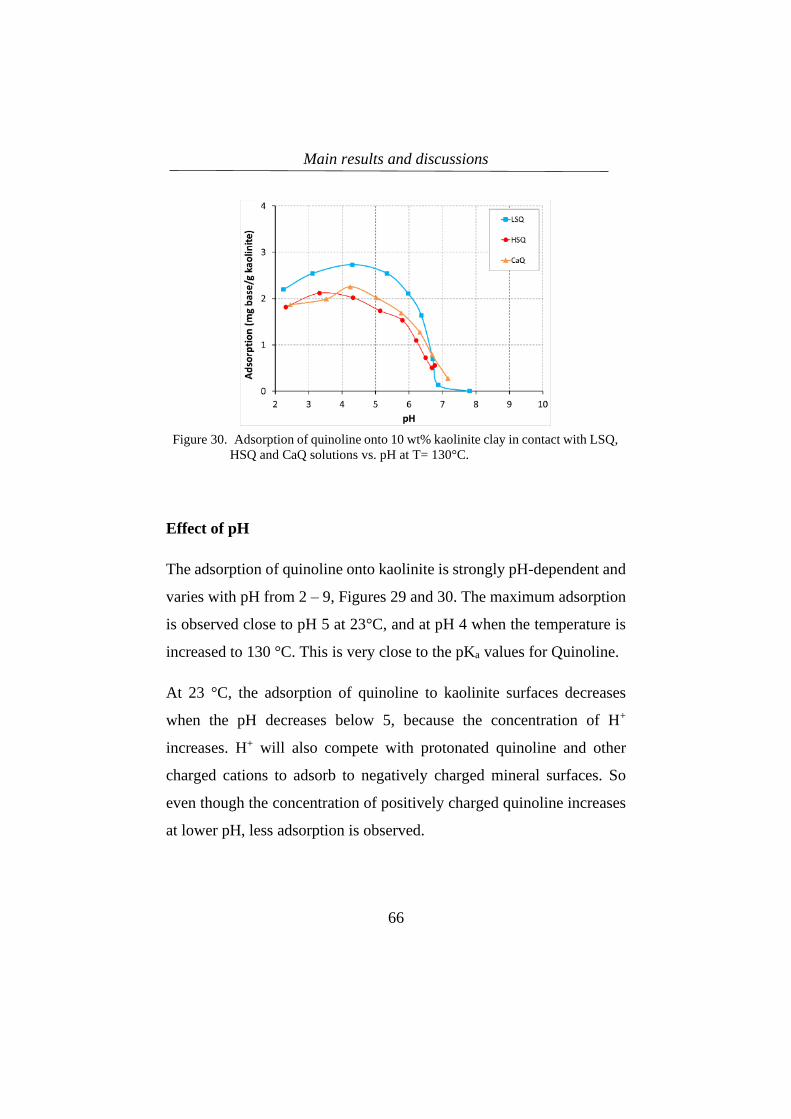
Main results and discussions
66
Figure 30. Adsorption of quinoline onto 10 wt% kaolinite clay in contact with LSQ,
HSQ and CaQ solutions vs. pH at T= 130°C.
Effect of pH
The adsorption of quinoline onto kaolinite is strongly pH-dependent and
varies with pH from 2 – 9, Figures 29 and 30. The maximum adsorption
is observed close to pH 5 at 23°C, and at pH 4 when the temperature is
increased to 130 °C. This is very close to the pKa values for Quinoline.
At 23 °C, the adsorption of quinoline to kaolinite surfaces decreases
when the pH decreases below 5, because the concentration of H+
increases. H+ will also compete with protonated quinoline and other
charged cations to adsorb to negatively charged mineral surfaces. So
even though the concentration of positively charged quinoline increases
at lower pH, less adsorption is observed.

Main results and discussions
67
At pH higher than 5, the quinoline adsorption also decreases. Increased
amount of OH- will neutralize the quinoline and the adsorption
decreases. As expected, very low quinoline adsorption are observed at
pH above 7.
Effect of Temperature
As the temperature increases, the quinoline adsorption decreases at all
pH values, figure 30. The reactivity of divalent cations increases with
increasing temperature due to less hydration as described by the equation
7:
𝐶𝑎2+ ⋯ 𝐶𝑙𝑎𝑦 + 𝐻2O ⇄ 𝐻+ ⋯ 𝐶𝑙𝑎𝑦 + 𝐶𝑎2+ + 𝑂𝐻− + HEAT
When heat is added to the system, the equilibrium will move to the left.
At high temperature the reactivity of the divalent cations, especially
Ca2+, increases. This leads to less available sites on the clay surface for
quinoline adsorption.
Effect of ion composition and salinity
The ion composition and salinity of the brines are also important
regarding quinoline adsorption. At all tested pH and temperatures, we
observe significant higher quinoline adsorption using the 1000 ppm LSQ
brine system compared to 25 000 ppm HSQ and CaQ brines, figure 24.
The chemical reactivity of species seems to dominate the adsorption
process. Reduced competition of inorganic cations towards the negative
sites on the clay surfaces, promotes increased adsorption of protonated
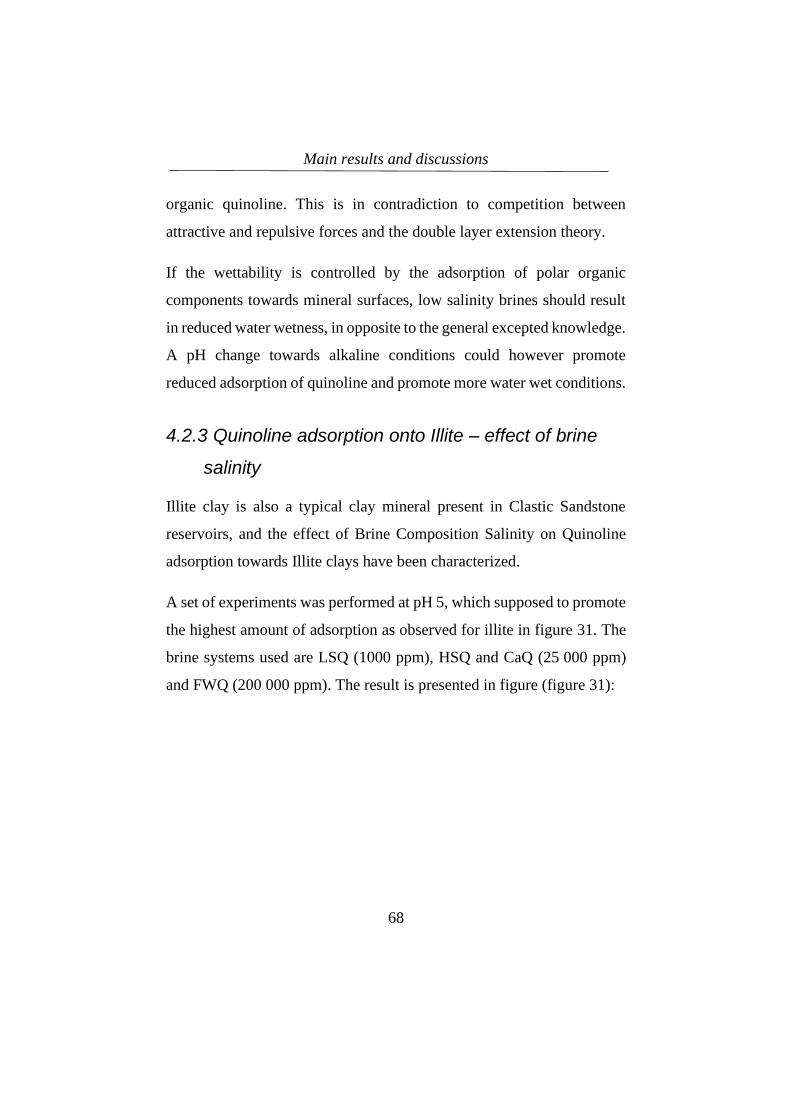
Main results and discussions
68
organic quinoline. This is in contradiction to competition between
attractive and repulsive forces and the double layer extension theory.
If the wettability is controlled by the adsorption of polar organic
components towards mineral surfaces, low salinity brines should result
in reduced water wetness, in opposite to the general excepted knowledge.
A pH change towards alkaline conditions could however promote
reduced adsorption of quinoline and promote more water wet conditions.
4.2.3 Quinoline adsorption onto Illite – effect of brine
salinity
Illite clay is also a typical clay mineral present in Clastic Sandstone
reservoirs, and the effect of Brine Composition Salinity on Quinoline
adsorption towards Illite clays have been characterized.
A set of experiments was performed at pH 5, which supposed to promote
the highest amount of adsorption as observed for illite in figure 31. The
brine systems used are LSQ (1000 ppm), HSQ and CaQ (25 000 ppm)
and FWQ (200 000 ppm). The result is presented in figure (figure 31):
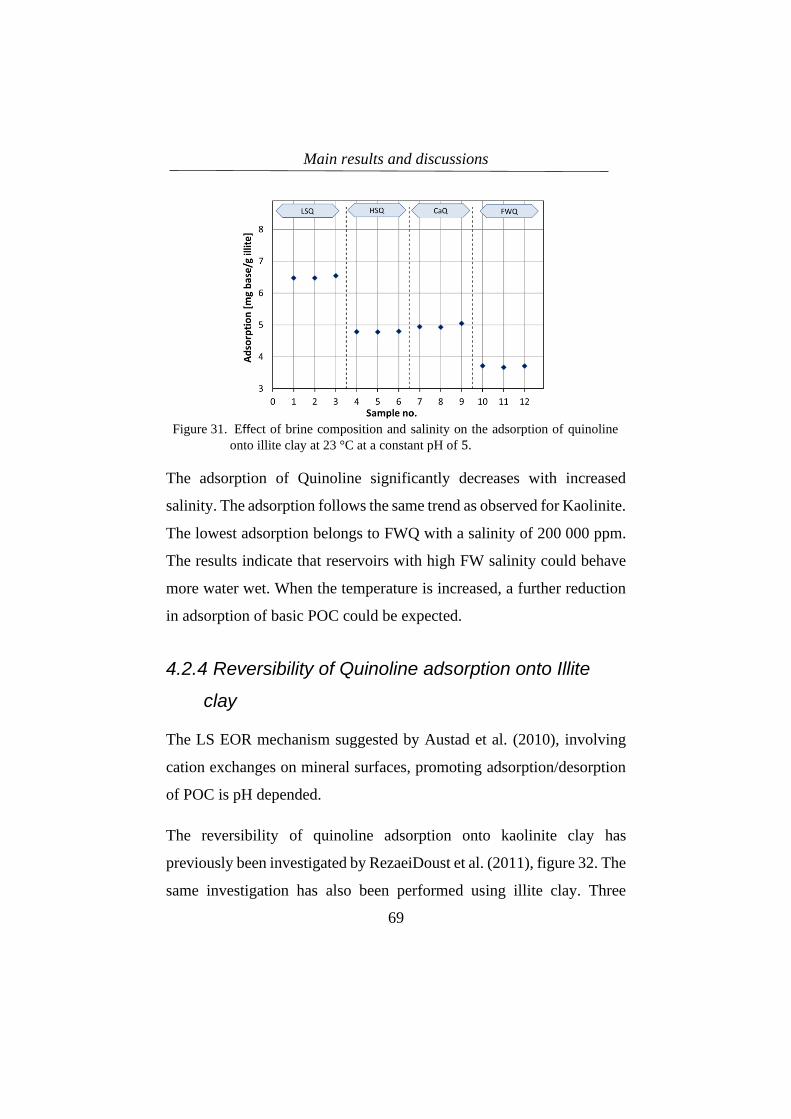
Main results and discussions
69
Figure 31. Effect of brine composition and salinity on the adsorption of quinoline
onto illite clay at 23 °C at a constant pH of 5.
The adsorption of Quinoline significantly decreases with increased
salinity. The adsorption follows the same trend as observed for Kaolinite.
The lowest adsorption belongs to FWQ with a salinity of 200 000 ppm.
The results indicate that reservoirs with high FW salinity could behave
more water wet. When the temperature is increased, a further reduction
in adsorption of basic POC could be expected.
4.2.4 Reversibility of Quinoline adsorption onto Illite
clay
The LS EOR mechanism suggested by Austad et al. (2010), involving
cation exchanges on mineral surfaces, promoting adsorption/desorption
of POC is pH depended.
The reversibility of quinoline adsorption onto kaolinite clay has
previously been investigated by RezaeiDoust et al. (2011), figure 32. The
same investigation has also been performed using illite clay. Three

Main results and discussions
70
parallel experiments were performed with 10wt% illite equilibrated with
LSQ or HSQ at 23 °C at an initial pH of 5. The results are presented in
figure 32.
Figure 32. Reversibility test of adsorption of quinoline from kaolinite clay at T=23
°C (RezaeiDoust et al., 2011)
LSQ gives higher adsorption compare to HSQ, and the results are
quantitively in line with the results for kaolinite, figure 29. When the pH
was increased to 8-9, the pH increase facilitates quinoline desorption
from the illite clay, from 7.7mgQ/g to 4.2mgQ/g for LSQ, and 7.0 to 4.0
for HSQ, confirming 45% desorption of Quinoline, figure 33.
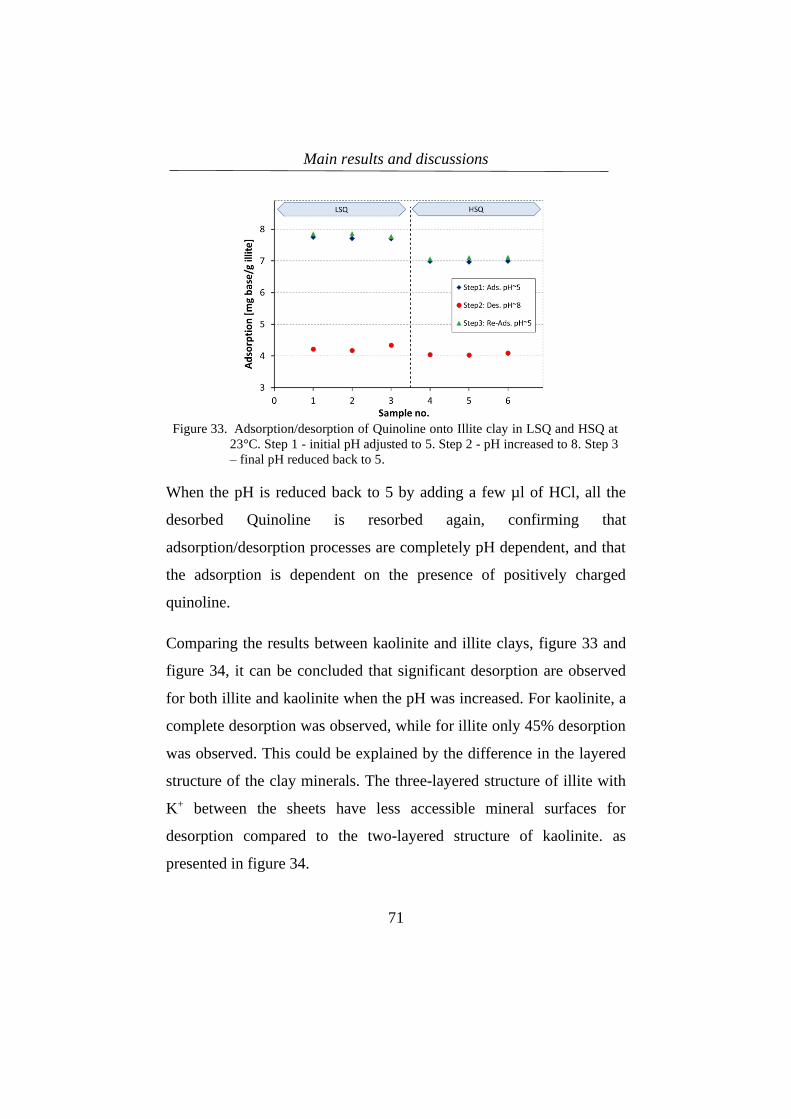
Main results and discussions
71
Figure 33. Adsorption/desorption of Quinoline onto Illite clay in LSQ and HSQ at
23°C. Step 1 - initial pH adjusted to 5. Step 2 - pH increased to 8. Step 3
– final pH reduced back to 5.
When the pH is reduced back to 5 by adding a few µl of HCl, all the
desorbed Quinoline is resorbed again, confirming that
adsorption/desorption processes are completely pH dependent, and that
the adsorption is dependent on the presence of positively charged
quinoline.
Comparing the results between kaolinite and illite clays, figure 33 and
figure 34, it can be concluded that significant desorption are observed
for both illite and kaolinite when the pH was increased. For kaolinite, a
complete desorption was observed, while for illite only 45% desorption
was observed. This could be explained by the difference in the layered
structure of the clay minerals. The three-layered structure of illite with
K+ between the sheets have less accessible mineral surfaces for
desorption compared to the two-layered structure of kaolinite. as
presented in figure 34.

Main results and discussions
72
Figure 34. Schematic of kaolinite and illite layered structure
4.3 EOR by wettability modification of sandstone
reservoirs at high temperature
In order to be able to make a strategy for optimal water flooding of oil
reservoirs, detailed knowledge about initial properties and relevant
parameters which have an influence on the wetting conditions are
needed. Improved chemical understanding of the rock-fluid interactions
discussed in the previous subchapters, add new knowledge and makes it
easier to discuss wettability and wettability modifications during smart
water flooding for improving oil recovery.
Previous studies using outcrop material have confirmed high EOR
potentials using LS brine as Smart Water at both low and high reservoir
temperatures. Based on the mechanism proposed by Austad et al.(2010),

Main results and discussions
73
the main controlling reactions are exothermic, which means that higher
reservoir temperatures could have negative effects on the EOR potential.
In this section results from individual Smart Water EOR projects are
presented. Five sets of preserved reservoir core materials from different
high temperature North Sea oil reservoirs have been studied, and the
EOR potential of smart water flooding has been investigated.
4.3.1 Secondary LS EOR at high temperature
Preserved reservoir cores from the BRENT formation of a North Sea oil
reservoir were received from the operator to study the secondary LS
EOR potential. The core mineralogy was obtained by QEMSCAN
analysis. The reservoir contained a light crude oil. As expected, the acid
number, AN, was below the detection limit for the analysis. Due to the
high reservoir temperature, Tres=130°C, decarboxylation of the carboxyl
group could take place over geological time. The base number, BN, is,
however, large, 1.35 mgKOH/g, which indicates enough available polar
components to make the rock surface mixed wet, provided the presence
of sufficient clay minerals.
The salinity and composition of the formation water, FWP, was rather
low, with a total salinity of 22 763 ppm, and Ca2+ and Mg2+
concentrations of 3.5 and 1.4 mM, respectively. Compared to SW where
the concentration of Ca2+ and Mg2+ is 13.0 and 44.5 mM, the divalent
concentrations in FWp appeared very low.
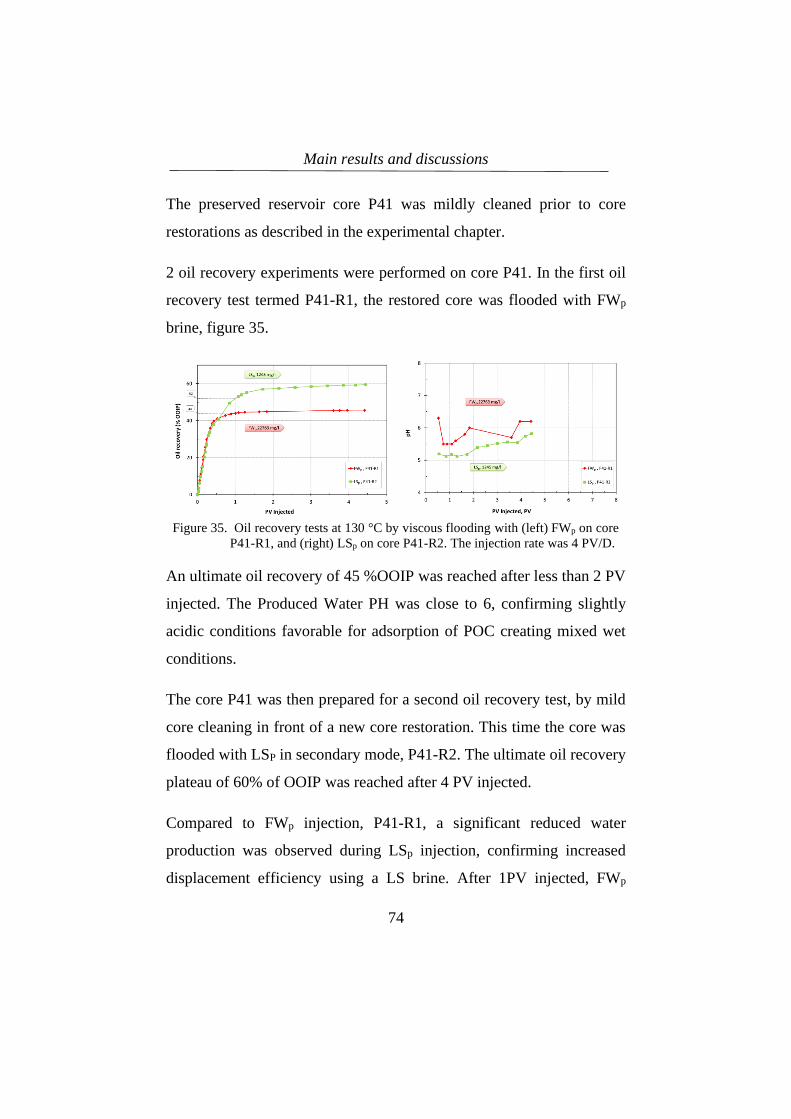
Main results and discussions
74
The preserved reservoir core P41 was mildly cleaned prior to core
restorations as described in the experimental chapter.
2 oil recovery experiments were performed on core P41. In the first oil
recovery test termed P41-R1, the restored core was flooded with FWp
brine, figure 35.
Figure 35. Oil recovery tests at 130 °C by viscous flooding with (left) FWp on core
P41-R1, and (right) LSp on core P41-R2. The injection rate was 4 PV/D.
An ultimate oil recovery of 45 %OOIP was reached after less than 2 PV
injected. The Produced Water PH was close to 6, confirming slightly
acidic conditions favorable for adsorption of POC creating mixed wet
conditions.
The core P41 was then prepared for a second oil recovery test, by mild
core cleaning in front of a new core restoration. This time the core was
flooded with LSP in secondary mode, P41-R2. The ultimate oil recovery
plateau of 60% of OOIP was reached after 4 PV injected.
Compared to FWp injection, P41-R1, a significant reduced water
production was observed during LSp injection, confirming increased
displacement efficiency using a LS brine. After 1PV injected, FWp
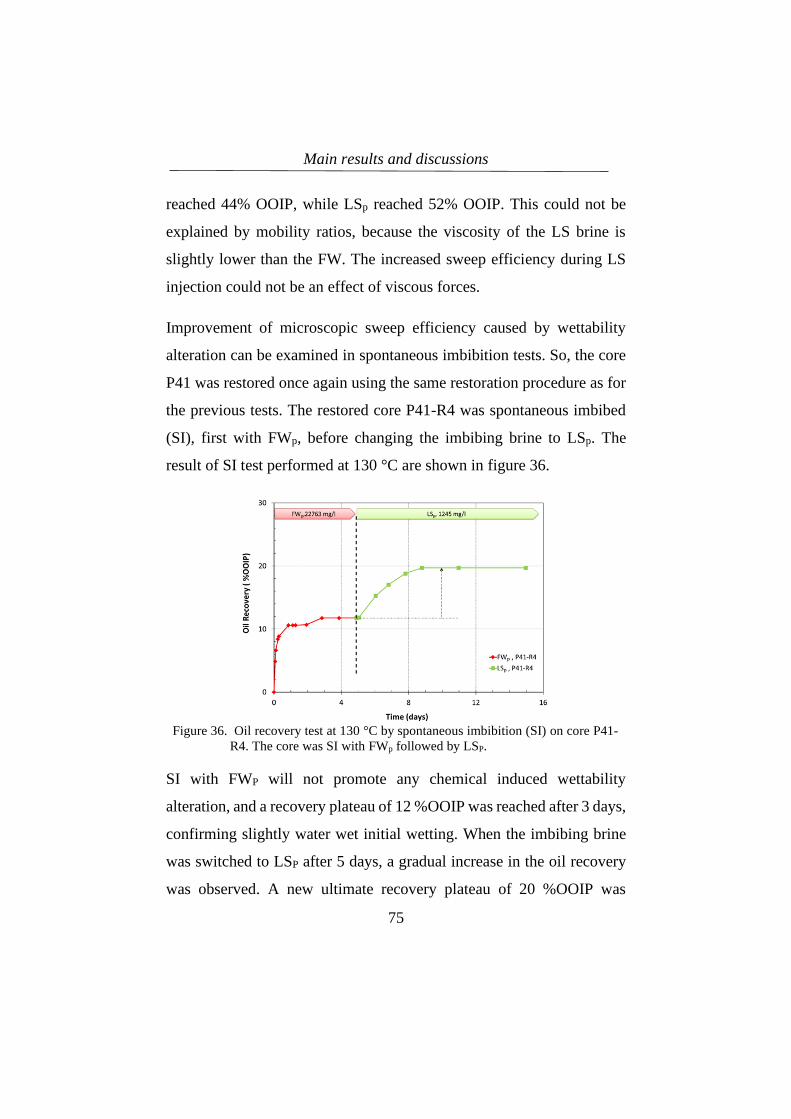
Main results and discussions
75
reached 44% OOIP, while LSp reached 52% OOIP. This could not be
explained by mobility ratios, because the viscosity of the LS brine is
slightly lower than the FW. The increased sweep efficiency during LS
injection could not be an effect of viscous forces.
Improvement of microscopic sweep efficiency caused by wettability
alteration can be examined in spontaneous imbibition tests. So, the core
P41 was restored once again using the same restoration procedure as for
the previous tests. The restored core P41-R4 was spontaneous imbibed
(SI), first with FWp, before changing the imbibing brine to LSp. The
result of SI test performed at 130 °C are shown in figure 36.
Figure 36. Oil recovery test at 130 °C by spontaneous imbibition (SI) on core P41-
R4. The core was SI with FWp followed by LSP.
SI with FWP will not promote any chemical induced wettability
alteration, and a recovery plateau of 12 %OOIP was reached after 3 days,
confirming slightly water wet initial wetting. When the imbibing brine
was switched to LSP after 5 days, a gradual increase in the oil recovery
was observed. A new ultimate recovery plateau of 20 %OOIP was
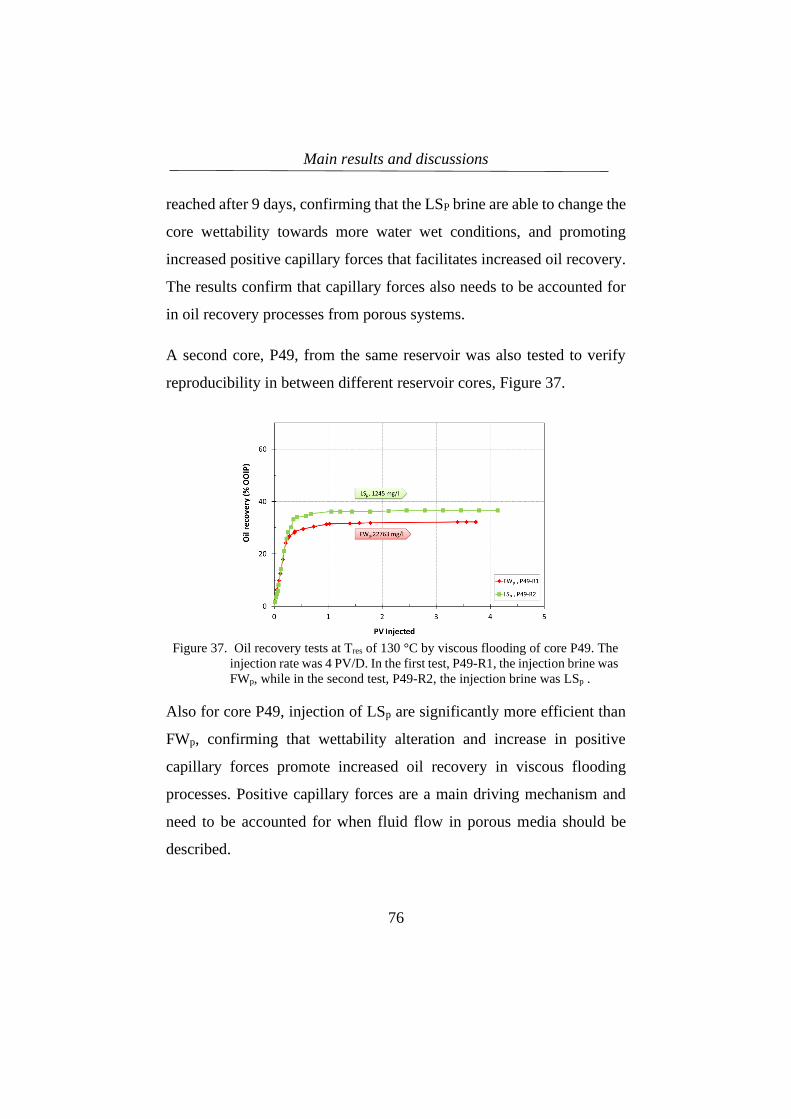
Main results and discussions
76
reached after 9 days, confirming that the LSP brine are able to change the
core wettability towards more water wet conditions, and promoting
increased positive capillary forces that facilitates increased oil recovery.
The results confirm that capillary forces also needs to be accounted for
in oil recovery processes from porous systems.
A second core, P49, from the same reservoir was also tested to verify
reproducibility in between different reservoir cores, Figure 37.
Figure 37. Oil recovery tests at Tres of 130 °C by viscous flooding of core P49. The
injection rate was 4 PV/D. In the first test, P49-R1, the injection brine was
FWp, while in the second test, P49-R2, the injection brine was LSp .
Also for core P49, injection of LSp are significantly more efficient than
FWp, confirming that wettability alteration and increase in positive
capillary forces promote increased oil recovery in viscous flooding
processes. Positive capillary forces are a main driving mechanism and
need to be accounted for when fluid flow in porous media should be
described.
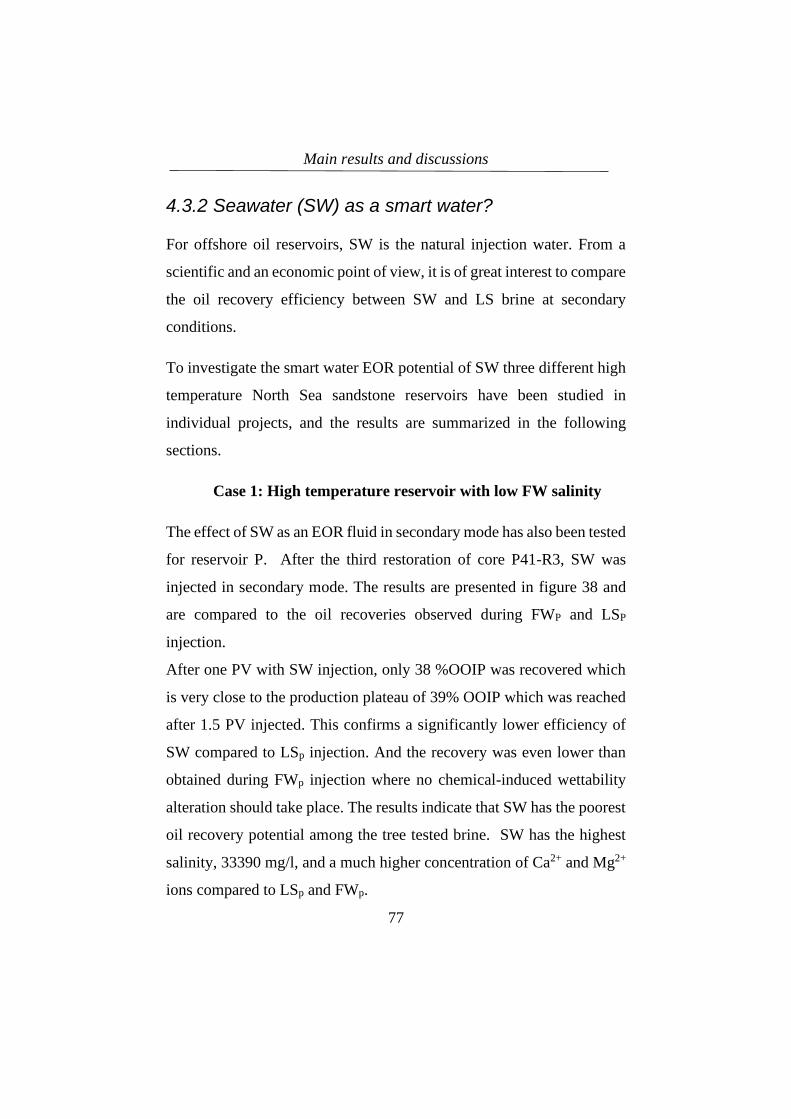
Main results and discussions
77
4.3.2 Seawater (SW) as a smart water?
For offshore oil reservoirs, SW is the natural injection water. From a
scientific and an economic point of view, it is of great interest to compare
the oil recovery efficiency between SW and LS brine at secondary
conditions.
To investigate the smart water EOR potential of SW three different high
temperature North Sea sandstone reservoirs have been studied in
individual projects, and the results are summarized in the following
sections.
Case 1: High temperature reservoir with low FW salinity
The effect of SW as an EOR fluid in secondary mode has also been tested
for reservoir P. After the third restoration of core P41-R3, SW was
injected in secondary mode. The results are presented in figure 38 and
are compared to the oil recoveries observed during FWP and LSP
injection.
After one PV with SW injection, only 38 %OOIP was recovered which
is very close to the production plateau of 39% OOIP which was reached
after 1.5 PV injected. This confirms a significantly lower efficiency of
SW compared to LSp injection. And the recovery was even lower than
obtained during FWp injection where no chemical-induced wettability
alteration should take place. The results indicate that SW has the poorest
oil recovery potential among the tree tested brine. SW has the highest
salinity, 33390 mg/l, and a much higher concentration of Ca2+ and Mg2+
ions compared to LSp and FWp.
Main results and discussions
78
Figure 38. Secondary oil recovery tests at 130 °C by viscous flooding of core P#49
by SW with a rate of 4 PV/D after the third restoration, P#41-R3.
Ca2+ concentration in the SW is 13 mM while FWp and LSp have a
concentration of 3.5 and 0.3 mM respectively. Mg2+ concentration in the
SW is 44.5 mM while FWp and LSp have a concentration of 1.4 and 1.8
mM, respectively. Based on the chemical mechanism suggested by
Austad et al., increased divalent cation ion concentrations as observed
for SW will reduce the potential for wettability alteration, Eq. 7. At high
reservoir temperatures, both Ca2+ and Mg2+ will make a complex with
the OH-, (𝑀𝑔2+ ⋯ 𝑂𝐻−)+, which will reduce the pH increase needed to
facilitate a wettability alteration.
Case 2: High temperature reservoir with high FW salinity
With limited access to core material, it is needed to use each core in
multiple experiments. Optimized core cleaning and core restoration
procedures need to be developed to minimize the differences in the initial
wetting condition in between each core experiment (Loahardjo et al.,
2008).
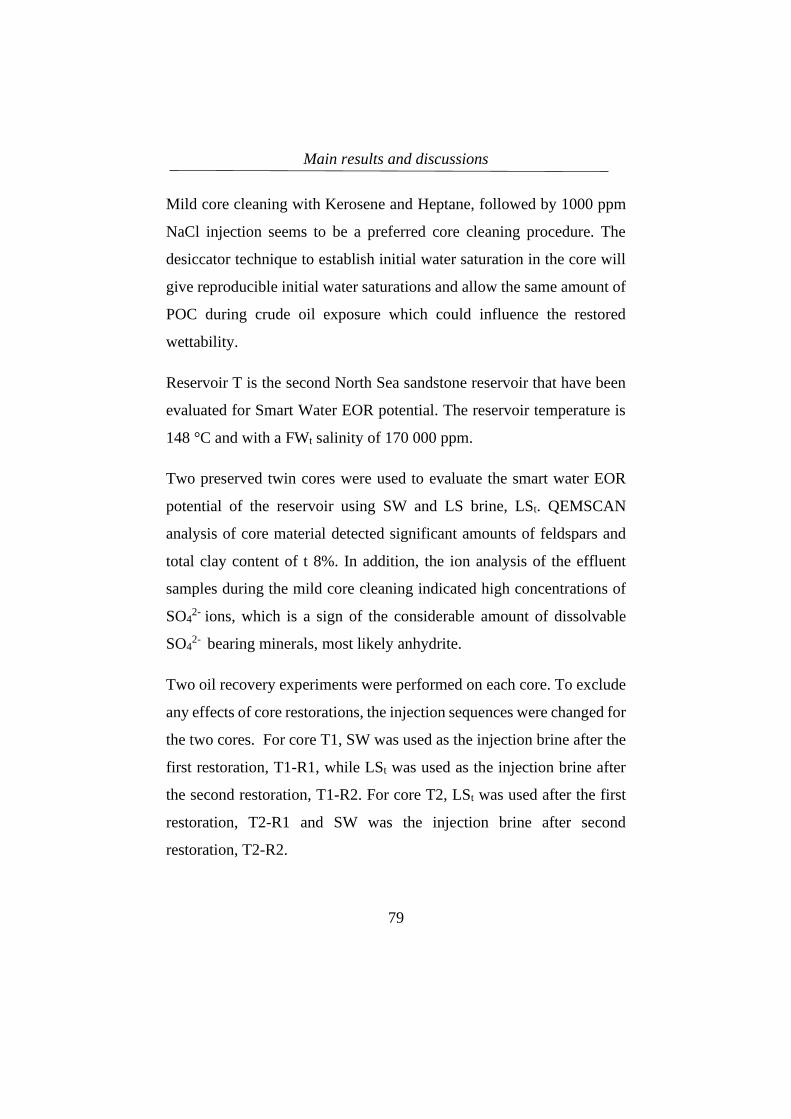
Main results and discussions
79
Mild core cleaning with Kerosene and Heptane, followed by 1000 ppm
NaCl injection seems to be a preferred core cleaning procedure. The
desiccator technique to establish initial water saturation in the core will
give reproducible initial water saturations and allow the same amount of
POC during crude oil exposure which could influence the restored
wettability.
Reservoir T is the second North Sea sandstone reservoir that have been
evaluated for Smart Water EOR potential. The reservoir temperature is
148 °C and with a FWt salinity of 170 000 ppm.
Two preserved twin cores were used to evaluate the smart water EOR
potential of the reservoir using SW and LS brine, LSt. QEMSCAN
analysis of core material detected significant amounts of feldspars and
total clay content of t 8%. In addition, the ion analysis of the effluent
samples during the mild core cleaning indicated high concentrations of
SO42- ions, which is a sign of the considerable amount of dissolvable
SO42- bearing minerals, most likely anhydrite.
Two oil recovery experiments were performed on each core. To exclude
any effects of core restorations, the injection sequences were changed for
the two cores. For core T1, SW was used as the injection brine after the
first restoration, T1-R1, while LSt was used as the injection brine after
the second restoration, T1-R2. For core T2, LSt was used after the first
restoration, T2-R1 and SW was the injection brine after second
restoration, T2-R2.
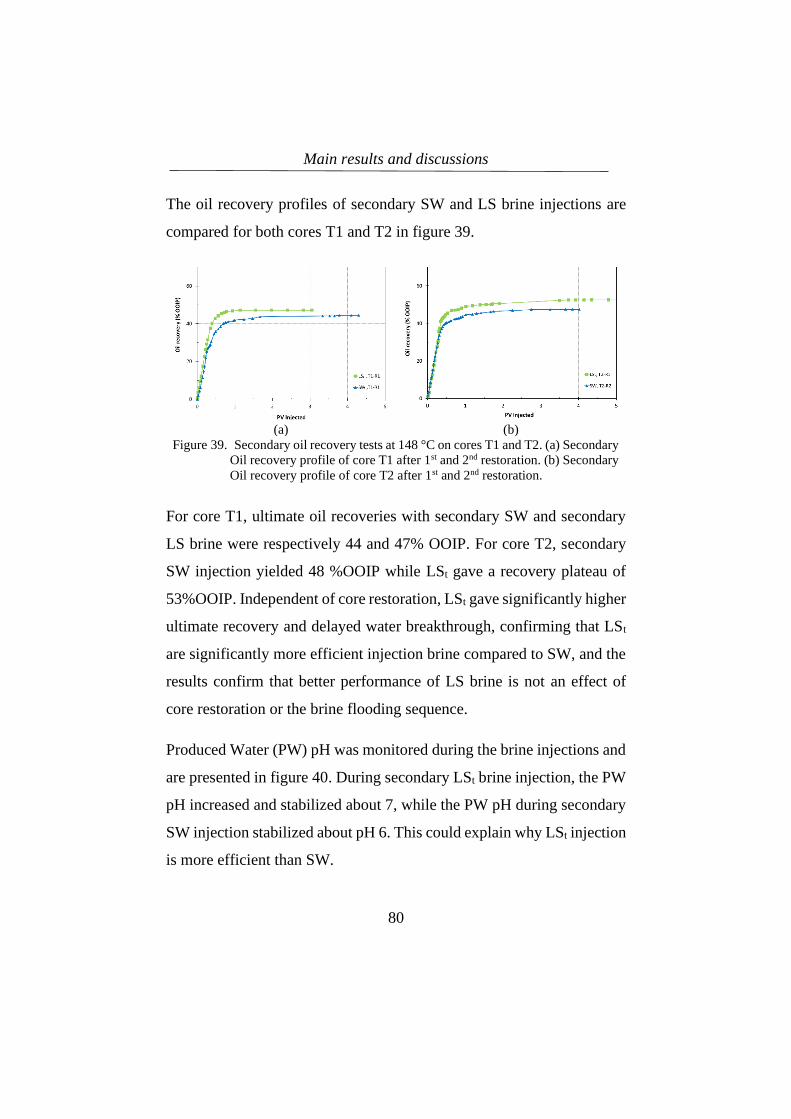
Main results and discussions
80
The oil recovery profiles of secondary SW and LS brine injections are
compared for both cores T1 and T2 in figure 39.
(a) (b)
Figure 39. Secondary oil recovery tests at 148 °C on cores T1 and T2. (a) Secondary
Oil recovery profile of core T1 after 1st and 2nd restoration. (b) Secondary
Oil recovery profile of core T2 after 1st and 2nd restoration.
For core T1, ultimate oil recoveries with secondary SW and secondary
LS brine were respectively 44 and 47% OOIP. For core T2, secondary
SW injection yielded 48 %OOIP while LSt gave a recovery plateau of
53%OOIP. Independent of core restoration, LSt gave significantly higher
ultimate recovery and delayed water breakthrough, confirming that LSt
are significantly more efficient injection brine compared to SW, and the
results confirm that better performance of LS brine is not an effect of
core restoration or the brine flooding sequence.
Produced Water (PW) pH was monitored during the brine injections and
are presented in figure 40. During secondary LSt brine injection, the PW
pH increased and stabilized about 7, while the PW pH during secondary
SW injection stabilized about pH 6. This could explain why LSt injection
is more efficient than SW.
Main results and discussions
81
(a) (b)
Figure 40. Oil recovery tests at 148 °C on cores T1 and T2. (a) PW pH during
secondary oil recovery tests on core T1 and (b) PW pH during secondary
oil recovery tests on core T2.
High FWt salinity, presence of Anhydrite in the core material, and very
high reservoir temperature are all parameters reported to reduce Smart
Water EOR potentials. Still, the observed increased pH during LSt
injection promotes potentials for wettability alteration towards more
water wet conditions. A reasonable explanation could be the presence of
feldspars, specially albite, which triggers a local pH at the pore surfaces
needed for the wettability alteration, even at high reservoir temperatures
(Piñerez Torrijos et al., 2017; Strand et al., 2014).
4.3.3 LS EOR potential after SW flooding
Offshore oil reservoirs are typically water flooded by the easiest
available brine which is SW. Thus, if LS brines should be implemented
in a mature field, it has to be as a tertiary injection after SW.
Laboratory studies involving outcrop sandstone cores have indicated that
tertiary LS EOR effects are reduced after the cores have been exposed to
SW (Piñerez Torrijos et al., 2016a; Winoto et al., 2012).
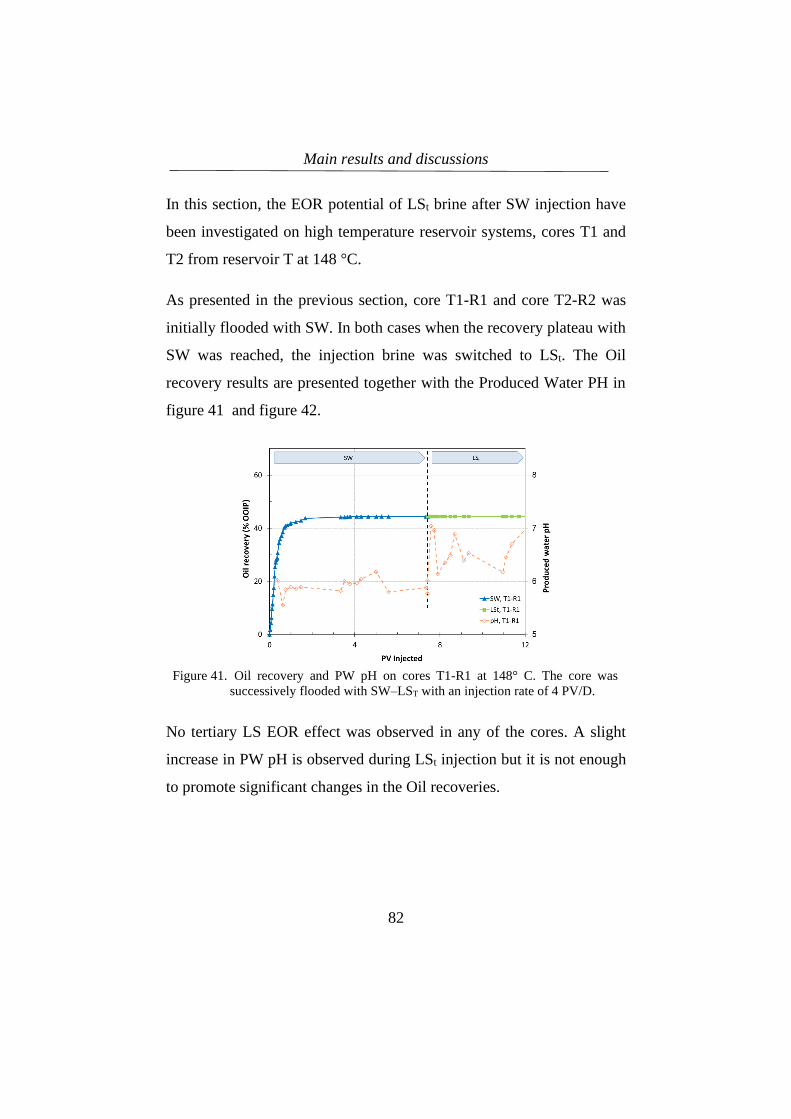
Main results and discussions
82
In this section, the EOR potential of LSt brine after SW injection have
been investigated on high temperature reservoir systems, cores T1 and
T2 from reservoir T at 148 °C.
As presented in the previous section, core T1-R1 and core T2-R2 was
initially flooded with SW. In both cases when the recovery plateau with
SW was reached, the injection brine was switched to LSt. The Oil
recovery results are presented together with the Produced Water PH in
figure 41 and figure 42.
Figure 41. Oil recovery and PW pH on cores T1-R1 at 148° C. The core was
successively flooded with SW–LST with an injection rate of 4 PV/D.
No tertiary LS EOR effect was observed in any of the cores. A slight
increase in PW pH is observed during LSt injection but it is not enough
to promote significant changes in the Oil recoveries.
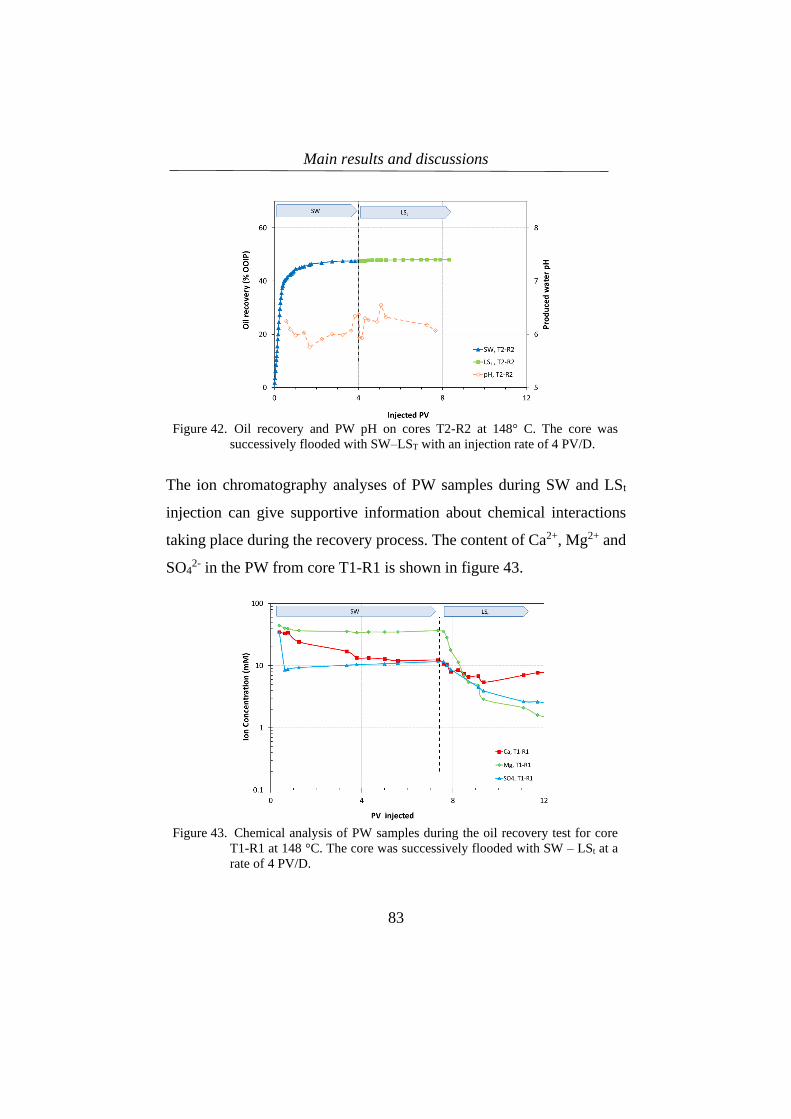
Main results and discussions
83
Figure 42. Oil recovery and PW pH on cores T2-R2 at 148° C. The core was
successively flooded with SW–LST with an injection rate of 4 PV/D.
The ion chromatography analyses of PW samples during SW and LSt
injection can give supportive information about chemical interactions
taking place during the recovery process. The content of Ca2+, Mg2+ and
SO42- in the PW from core T1-R1 is shown in figure 43.
Figure 43. Chemical analysis of PW samples during the oil recovery test for core
T1-R1 at 148 °C. The core was successively flooded with SW – LSt at a
rate of 4 PV/D.
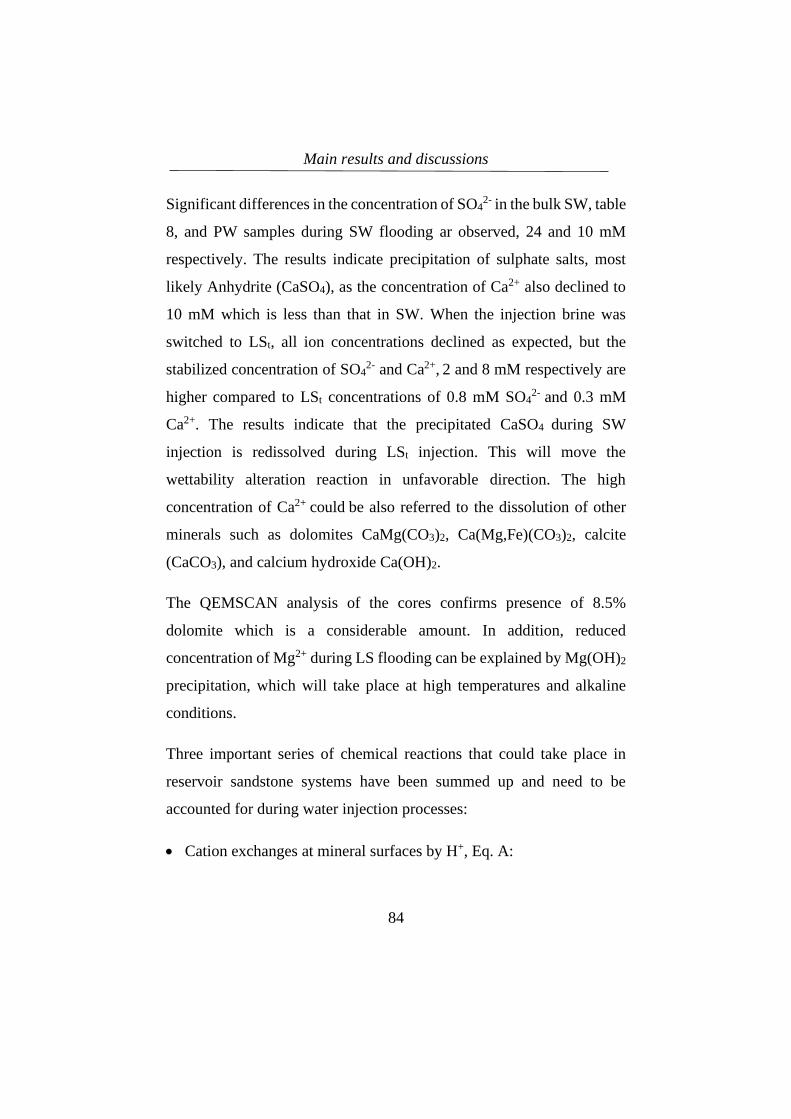
Main results and discussions
84
Significant differences in the concentration of SO42- in the bulk SW, table
8, and PW samples during SW flooding ar observed, 24 and 10 mM
respectively. The results indicate precipitation of sulphate salts, most
likely Anhydrite (CaSO4), as the concentration of Ca2+ also declined to
10 mM which is less than that in SW. When the injection brine was
switched to LSt, all ion concentrations declined as expected, but the
stabilized concentration of SO42- and Ca2+, 2 and 8 mM respectively are
higher compared to LSt concentrations of 0.8 mM SO42- and 0.3 mM
Ca2+. The results indicate that the precipitated CaSO4 during SW
injection is redissolved during LSt injection. This will move the
wettability alteration reaction in unfavorable direction. The high
concentration of Ca2+ could be also referred to the dissolution of other
minerals such as dolomites CaMg(CO3)2, Ca(Mg,Fe)(CO3)2, calcite
(CaCO3), and calcium hydroxide Ca(OH)2.
The QEMSCAN analysis of the cores confirms presence of 8.5%
dolomite which is a considerable amount. In addition, reduced
concentration of Mg2+ during LS flooding can be explained by Mg(OH)2
precipitation, which will take place at high temperatures and alkaline
conditions.
Three important series of chemical reactions that could take place in
reservoir sandstone systems have been summed up and need to be
accounted for during water injection processes:
• Cation exchanges at mineral surfaces by H+, Eq. A:
Main results and discussions
85
𝐶𝑎2+ ⋯ 𝐶𝑙𝑎𝑦 + 𝐻2O ⇄ 𝐻+ ⋯ 𝐶𝑙𝑎𝑦 + 𝐶𝑎2+ + 𝑂𝐻−
(A) 𝑀𝑔2+ ⋯ 𝐶𝑙𝑎𝑦 + 𝐻2O ⇄ 𝐻+ ⋯ 𝐶𝑙𝑎𝑦 + 𝐶𝑎2+ + 𝑂𝐻−
𝑁𝑎𝐴𝑙𝑆𝑖3𝑂8 + 𝐻2O ⇄ 𝐻𝐴𝑙𝑆𝑖3𝑂8 + 𝑁𝑎+ + 𝑂𝐻−
• Mineral dissolution reactions, Eq. B:
𝐶𝑎𝑀𝑔(𝐶𝑂3)2 (𝑠)
⇄ 𝐶𝑎2+(𝑎𝑞) + 𝑀𝑔+(𝑎𝑞) + 2 𝐶𝑂32− (𝑎𝑞) (B)
𝐶𝑎𝑆𝑂4 (𝑠) ⇄ 𝐶𝑎2+(𝑎𝑞) + 𝑆𝑂42− (𝑎𝑞)
• Precipitation at increased pH (increased OH- concentrations), Eq.C:
𝐶𝑎2+(𝑎𝑞) + 2𝑂𝐻− ⇄ 𝐶𝑎(𝑂𝐻)2 (𝑠)
(C)
𝑀𝑔2+(𝑎𝑞) + 2𝑂𝐻− ⇄ 𝑀𝑔(𝑂𝐻)2 (𝑠)
In offshore Smart water EOR projects, Three different brines, FW, SW,
and potential Smart Water presents. Different ions, in contact with
reservoir minerals, will affect the wettability alteration process. In
Addition at reservoir high temperature, the reactivity of ions and
solubility of precipitated and minerals will be affected by the
temperature, which has to be taken into account while investigating the
potential for any individual reservoir.
4.3.4 Modified SW as smart water?
Formation Waters in the sandstone reservoirs contain abundance
concentrations of light divalent cations, i.e Ca2+ and Mg2+ and also less
Main results and discussions
86
concentration of heavy cations such as Ba2+ and Sr2+ (Crabtree et al.,
1999). The reactivity of the divalent cations increases with increasing
temperature, and in offshore reservoirs, at a temperature above 100 °C,
SW with a high concentration of SO42- may cause reservoir souring and
precipitation of SO42- -bearing minerals like anhydrite (CaSO4), barite
(BaSO4) and celestine (SrSO4). Barium scale will precipitate even at very
low concentrations and need to be controlled (Olajire, 2015). By
considering these issues, chemical modification of the seawater is often
recommended. This was authenticated in the early 1990’s during the
development of the South Brae oilfield in the North Sea (Davis and
McElhiney, 2002; Hardy et al., 1992).
In addition of scale problems, switching the injection brine to a LS brine
may re-dissolve precipitates such as CaSO4 and increase the
concentration of Ca2+ ions in the LS brine which could be unfavorable
for observing wettability alteration. In high salinity reservoirs, secondary
SW injection could reduce the potential of tertiary LS flooding. Then it
is questioned if “modified seawater” (mSW) with reduced sulfate
concentration for scale prevention can behave as a Smart Water? And if
there is a LS brine EOR potential after mSW flooding?
To answer these questions, a new set of the oil recovery experiments
have been performed on another high temperature North Sea sandstone
reservoir, reservoir M, are tested for secondary mSW flooding and
secondary and tertiary LS flooding with EOR purpose.
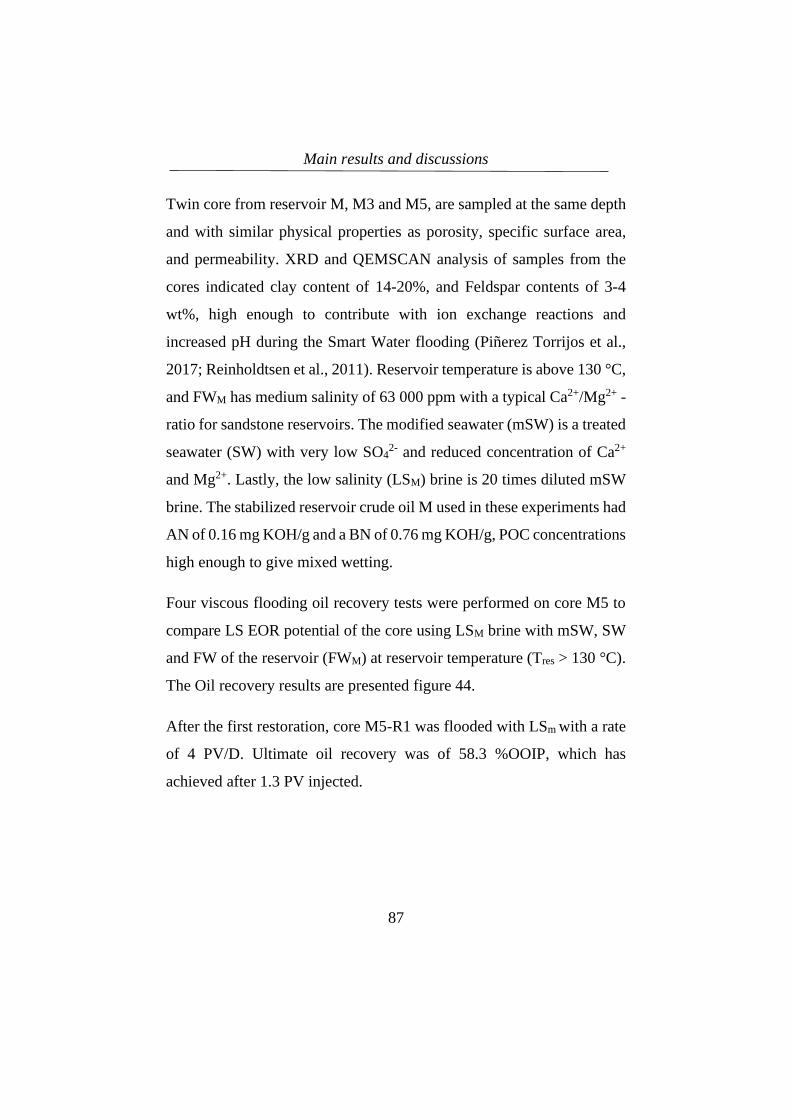
Main results and discussions
87
Twin core from reservoir M, M3 and M5, are sampled at the same depth
and with similar physical properties as porosity, specific surface area,
and permeability. XRD and QEMSCAN analysis of samples from the
cores indicated clay content of 14-20%, and Feldspar contents of 3-4
wt%, high enough to contribute with ion exchange reactions and
increased pH during the Smart Water flooding (Piñerez Torrijos et al.,
2017; Reinholdtsen et al., 2011). Reservoir temperature is above 130 °C,
and FWM has medium salinity of 63 000 ppm with a typical Ca2+/Mg2+ -
ratio for sandstone reservoirs. The modified seawater (mSW) is a treated
seawater (SW) with very low SO42- and reduced concentration of Ca2+
and Mg2+. Lastly, the low salinity (LSM) brine is 20 times diluted mSW
brine. The stabilized reservoir crude oil M used in these experiments had
AN of 0.16 mg KOH/g and a BN of 0.76 mg KOH/g, POC concentrations
high enough to give mixed wetting.
Four viscous flooding oil recovery tests were performed on core M5 to
compare LS EOR potential of the core using LSM brine with mSW, SW
and FW of the reservoir (FWM) at reservoir temperature (Tres > 130 °C).
The Oil recovery results are presented figure 44.
After the first restoration, core M5-R1 was flooded with LSm with a rate
of 4 PV/D. Ultimate oil recovery was of 58.3 %OOIP, which has
achieved after 1.3 PV injected.
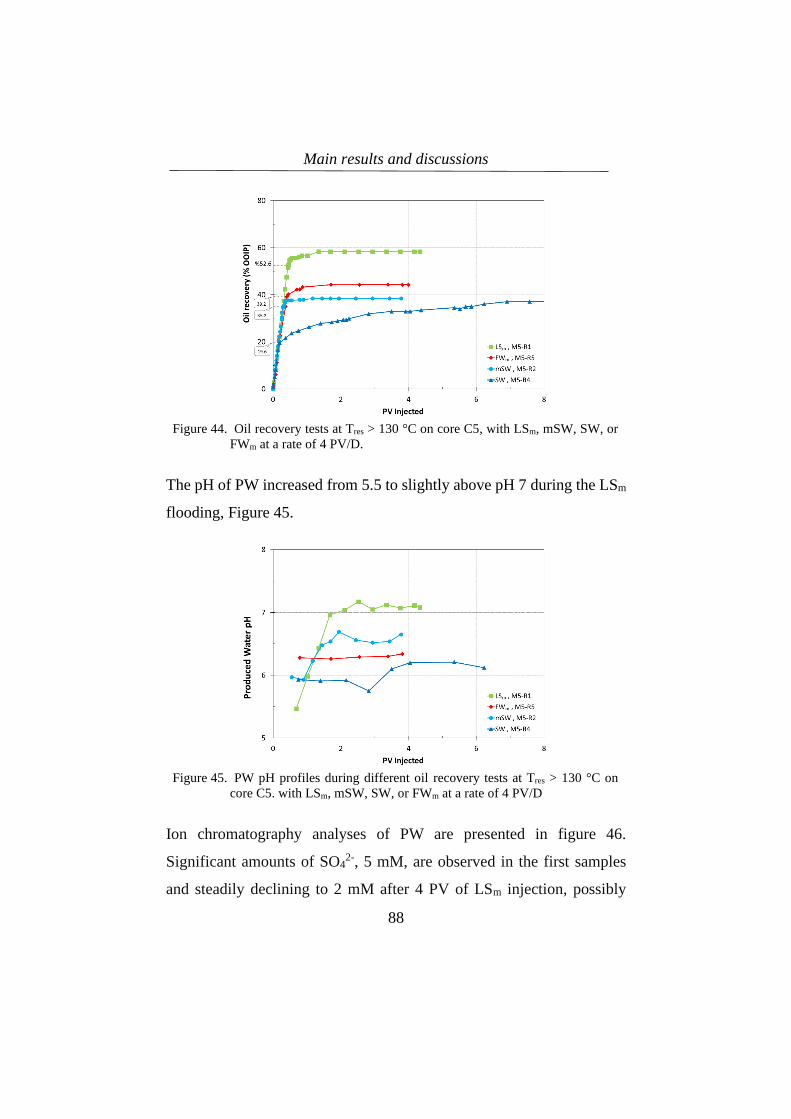
Main results and discussions
88
Figure 44. Oil recovery tests at Tres > 130 °C on core C5, with LSm, mSW, SW, or
FWm at a rate of 4 PV/D.
The pH of PW increased from 5.5 to slightly above pH 7 during the LSm
flooding, Figure 45.
Figure 45. PW pH profiles during different oil recovery tests at Tres > 130 °C on
core C5. with LSm, mSW, SW, or FWm at a rate of 4 PV/D
Ion chromatography analyses of PW are presented in figure 46.
Significant amounts of SO42-, 5 mM, are observed in the first samples
and steadily declining to 2 mM after 4 PV of LSm injection, possibly
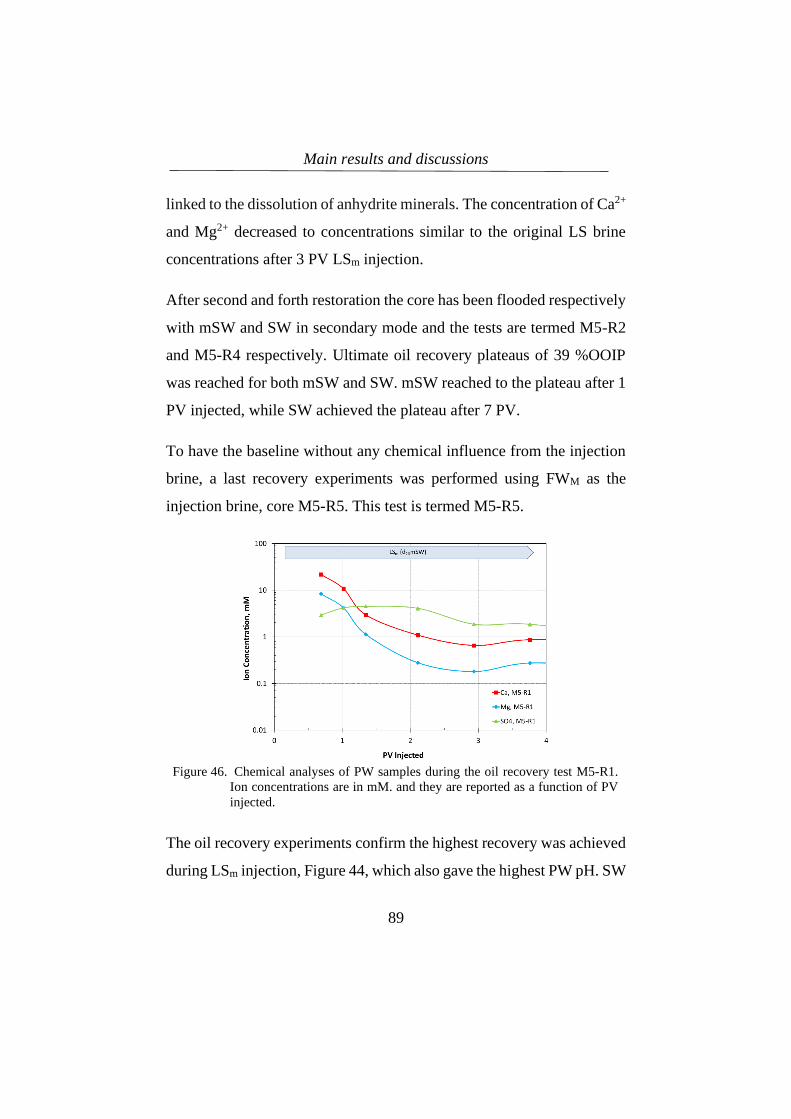
Main results and discussions
89
linked to the dissolution of anhydrite minerals. The concentration of Ca2+
and Mg2+ decreased to concentrations similar to the original LS brine
concentrations after 3 PV LSm injection.
After second and forth restoration the core has been flooded respectively
with mSW and SW in secondary mode and the tests are termed M5-R2
and M5-R4 respectively. Ultimate oil recovery plateaus of 39 %OOIP
was reached for both mSW and SW. mSW reached to the plateau after 1
PV injected, while SW achieved the plateau after 7 PV.
To have the baseline without any chemical influence from the injection
brine, a last recovery experiments was performed using FWM as the
injection brine, core M5-R5. This test is termed M5-R5.
Figure 46. Chemical analyses of PW samples during the oil recovery test M5-R1.
Ion concentrations are in mM. and they are reported as a function of PV
injected.
The oil recovery experiments confirm the highest recovery was achieved
during LSm injection, Figure 44, which also gave the highest PW pH. SW
Main results and discussions
90
injection gave the slowest and lowest oil recovery, and the results are
supported by the lowest PW pH. Both SW and mSW gave lower ultimate
oil recovery compared to baseline recovery during FWm injection.
Clearly, also for this reservoir system, the LS brine behaved as the
smartest water with the highest EOR potential.
The combination of high clay content, moderate FW salinity and low
initial pH observed in all the experiments indicates favorable conditions
for adsorption of POC at mineral surfaces, (Burgos et al., 2002; Fogden,
2012; Strand et al., 2016), creating reduced water wetness even at
reservoir temperatures above 130 °C (Aghaeifar et al., 2015; Gamage
and Thyne, 2011). Initially reduced water wetness is an absolute need for
being able to observe Smart water EOR effects by wettability alteration.
Tertiary LS EOR after mSW injection
After the secondary injection of modified SW, core M5-R2, a tertiary
LSM injection was performed to evaluate the LS EOR potential in a
reservoir pre-flooded by mSW. The full oil recovery profile and PW pH
are presented in figure 47.
Ultimate oil recovery during mSW injection reached 38 %OOIP. When
the injection brine was switched to LSm, 6 %OOIP extra oil was
recovered. The increased recovery was accompanied by an increase in
PW pH from 6.5 to 7.7.
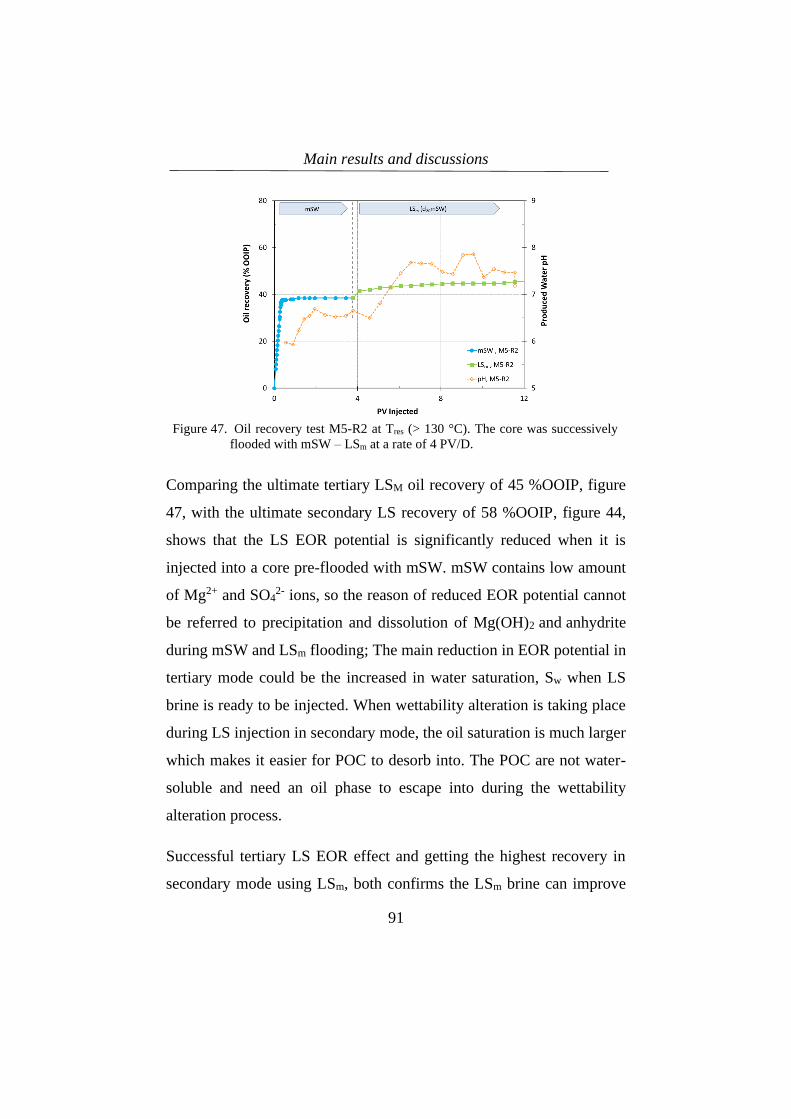
Main results and discussions
91
Figure 47. Oil recovery test M5-R2 at Tres (> 130 °C). The core was successively
flooded with mSW – LSm at a rate of 4 PV/D.
Comparing the ultimate tertiary LSM oil recovery of 45 %OOIP, figure
47, with the ultimate secondary LS recovery of 58 %OOIP, figure 44,
shows that the LS EOR potential is significantly reduced when it is
injected into a core pre-flooded with mSW. mSW contains low amount
of Mg2+ and SO42- ions, so the reason of reduced EOR potential cannot
be referred to precipitation and dissolution of Mg(OH)2 and anhydrite
during mSW and LSm flooding; The main reduction in EOR potential in
tertiary mode could be the increased in water saturation, Sw when LS
brine is ready to be injected. When wettability alteration is taking place
during LS injection in secondary mode, the oil saturation is much larger
which makes it easier for POC to desorb into. The POC are not water-
soluble and need an oil phase to escape into during the wettability
alteration process.
Successful tertiary LS EOR effect and getting the highest recovery in
secondary mode using LSm, both confirms the LSm brine can improve
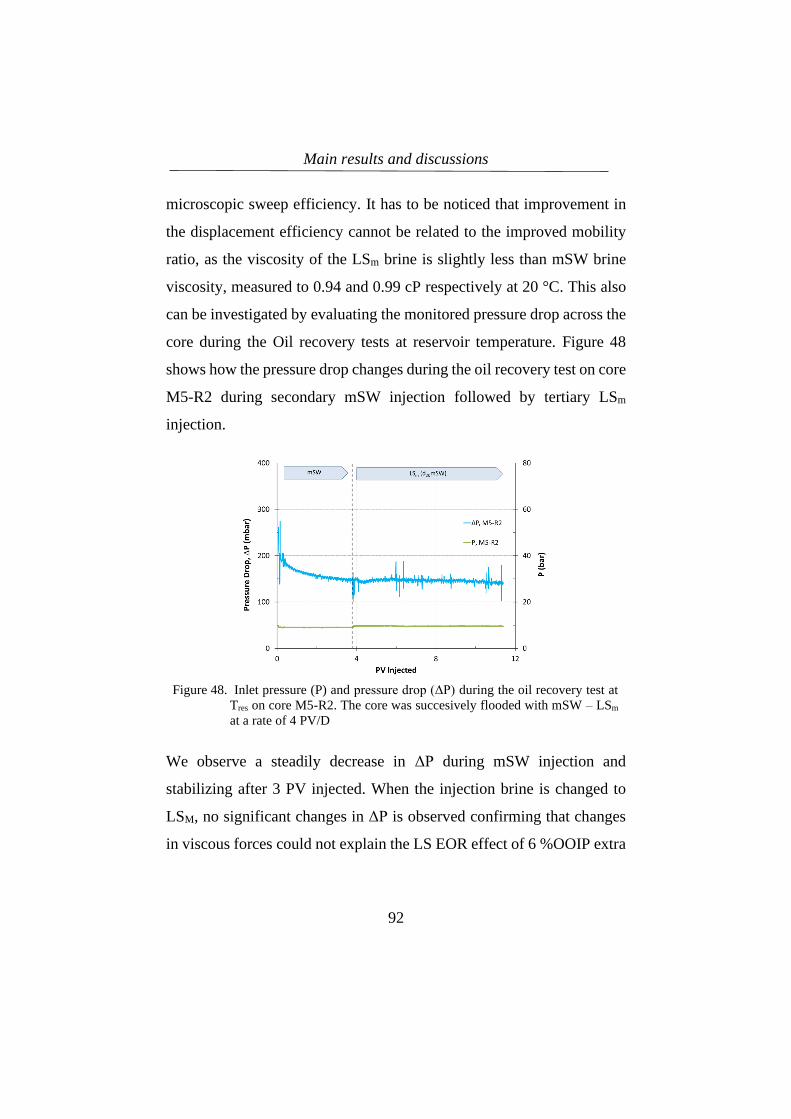
Main results and discussions
92
microscopic sweep efficiency. It has to be noticed that improvement in
the displacement efficiency cannot be related to the improved mobility
ratio, as the viscosity of the LSm brine is slightly less than mSW brine
viscosity, measured to 0.94 and 0.99 cP respectively at 20 °C. This also
can be investigated by evaluating the monitored pressure drop across the
core during the Oil recovery tests at reservoir temperature. Figure 48
shows how the pressure drop changes during the oil recovery test on core
M5-R2 during secondary mSW injection followed by tertiary LSm
injection.
Figure 48. Inlet pressure (P) and pressure drop (ΔP) during the oil recovery test at
Tres on core M5-R2. The core was succesively flooded with mSW – LSm
at a rate of 4 PV/D
We observe a steadily decrease in ΔP during mSW injection and
stabilizing after 3 PV injected. When the injection brine is changed to
LSM, no significant changes in ΔP is observed confirming that changes
in viscous forces could not explain the LS EOR effect of 6 %OOIP extra

Main results and discussions
93
oil. The fluctuations in ΔP observed during oil production are mainly due
to two-phase flow of oil and brine across the back-pressure valve.
In figure 49, the pressure drop during secondary LSM injection in core
M5-R1 is presented. With no larger differences in absolute pressure
values and the same trend of gradually decrease in ΔP as the water
saturation decreases, the observations are not supporting the idea of
swelling of clays, fines migration, and diverted flow inside the core
during LS brine flooding.
Figure 49. Inlet pressure (P) and pressure drop (ΔP) during oil recovery test
on core M5-R1 by secondary LSm injection.
The ΔP observations support that the observed LS EOR effect is a result
of wettability alteration. This will be discussed more in detail in section
4.4.
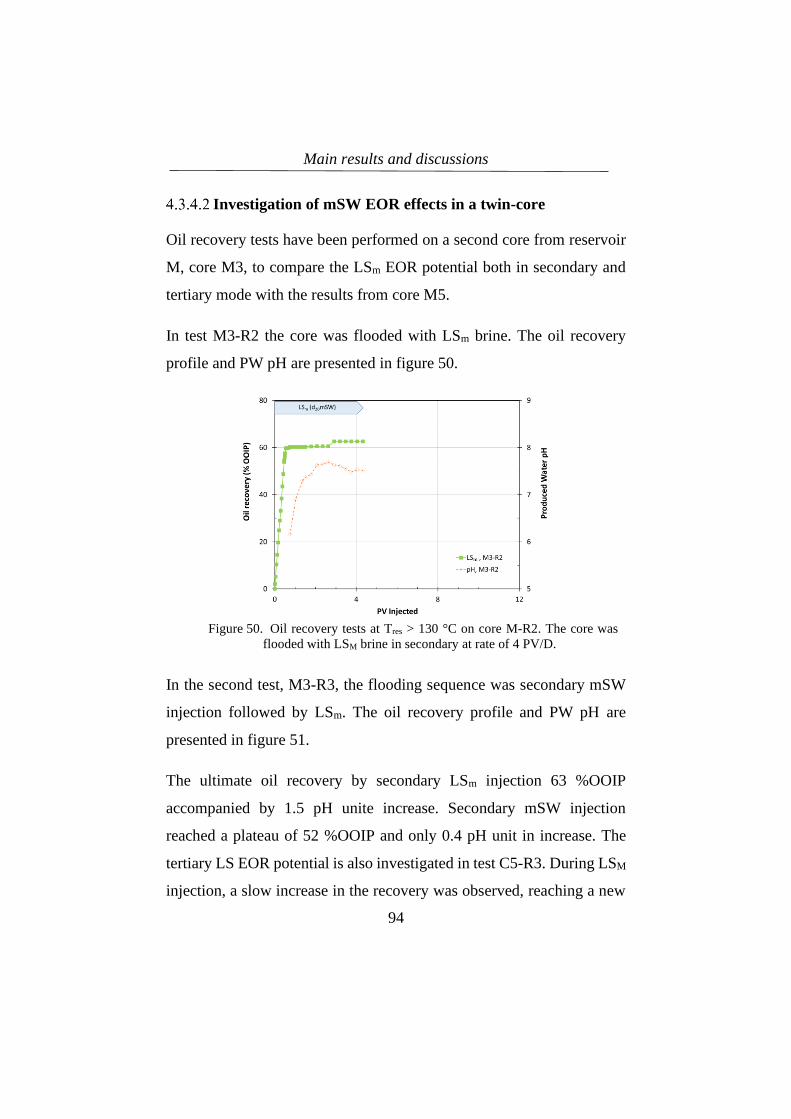
Main results and discussions
94
Investigation of mSW EOR effects in a twin-core
Oil recovery tests have been performed on a second core from reservoir
M, core M3, to compare the LSm EOR potential both in secondary and
tertiary mode with the results from core M5.
In test M3-R2 the core was flooded with LSm brine. The oil recovery
profile and PW pH are presented in figure 50.
Figure 50. Oil recovery tests at Tres > 130 °C on core M-R2. The core was
flooded with LSM brine in secondary at rate of 4 PV/D.
In the second test, M3-R3, the flooding sequence was secondary mSW
injection followed by LSm. The oil recovery profile and PW pH are
presented in figure 51.
The ultimate oil recovery by secondary LSm injection 63 %OOIP
accompanied by 1.5 pH unite increase. Secondary mSW injection
reached a plateau of 52 %OOIP and only 0.4 pH unit in increase. The
tertiary LS EOR potential is also investigated in test C5-R3. During LSM
injection, a slow increase in the recovery was observed, reaching a new

Main results and discussions
95
recovery plateau of 60 %OOIP after 4 PV injected. The PW pH one pH
unit increased during the LSm injection.
(b)
Figure 51. Oil recovery tests at Tres > 130 °C on core M3-R3. The core was
successively flooded with mSW – LSm at rate of 4 PV/D..
The most interesting point to notice is the significant difference in water
breakthrough time during secondary mSW, figure 51, and secondary LSm
injection, figure 50. The water breakthrough during mSW injection was
observed after 46 %OOIP, while the LSm gave a significant delayed
water breakthrough at 58 %OOIP.
The results from core C3 are in line with results concluded from core C5,
and both are confirming that LSm brine is the Smartest brine compare to
SW and mSW. When the LSm is introduced in the secondary mode it is
proved to be very efficient, reaching the ultimate oil recovery just after
1PV injected.
Main results and discussions
96
According to the tests performed on the core material from reservoir M,
T and P, tertiary LS EOR are dramatically reduced both in speed and
ultimate recovery but is more promising when it is injected after mSW
instead of normal SW.
4.4 Significance of Capillary Forces
In the previous part it is discussed that ion exchange at mineral surfaces
promotes an alkaline environment needed for desorption of POC. This
process leads to wettability alteration towards more water-wet conditions
which results in increased capillary forces. (Austad et al., 2010; Piñerez
Torrijos et al., 2016b). The wettability alteration is a result of CoBR-
interactions at mineral pore surfaces. The process is time-dependent, and
low flow rates could be needed to observe the LS EOR effect. Radial
well geometries and reservoir heterogeneities result in low flow rates and
low pressure drop in the main part of the reservoirs. The oil displacement
could then be more dependent on capillary forces compared to the
viscous forces.
In our experiments a low flow rate has been chosen, 4 PV/D, which will
allow the chemical reactions to take place, so capillary forces could
contribute to the recovery process. 4 PV/D corresponds approximately
to the industry standard of 1ft/D (foot/Day).
The efficiency of LS brine injection has been tested by a large number
of forced imbibition (viscous flooding) tests presented in the previous
section. In this chapter, we will prove the idea of EOR by favorable
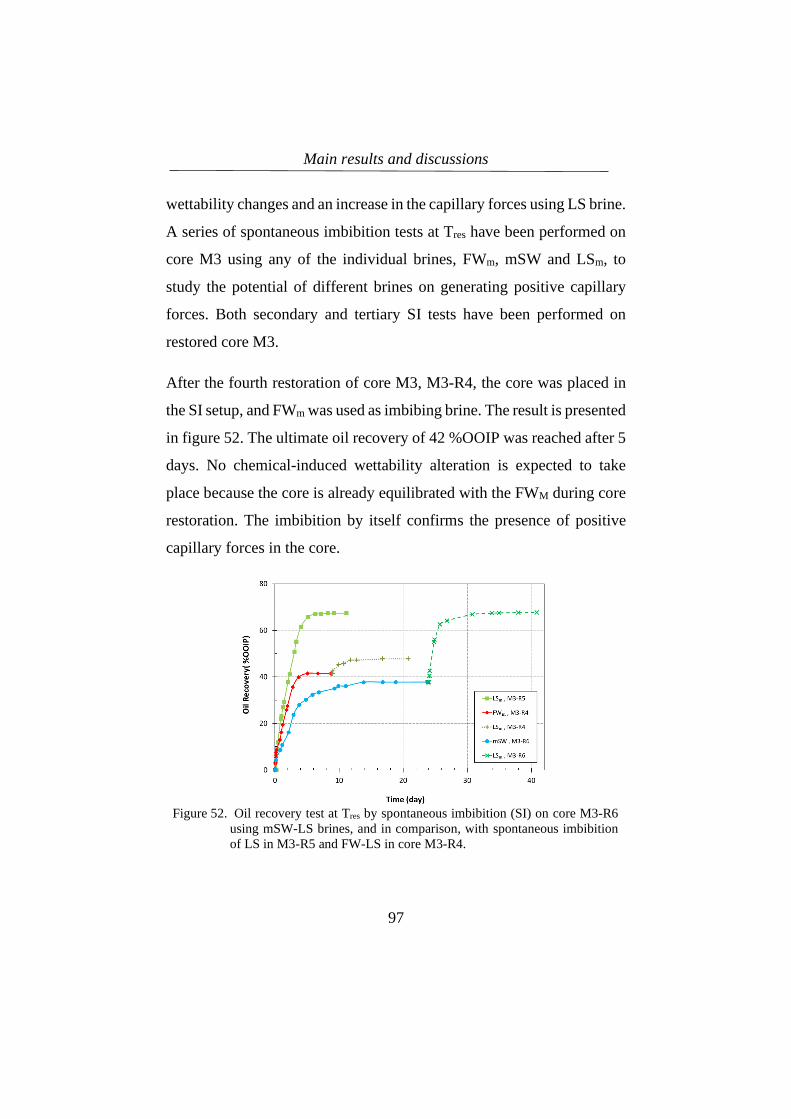
Main results and discussions
97
wettability changes and an increase in the capillary forces using LS brine.
A series of spontaneous imbibition tests at Tres have been performed on
core M3 using any of the individual brines, FWm, mSW and LSm, to
study the potential of different brines on generating positive capillary
forces. Both secondary and tertiary SI tests have been performed on
restored core M3.
After the fourth restoration of core M3, M3-R4, the core was placed in
the SI setup, and FWm was used as imbibing brine. The result is presented
in figure 52. The ultimate oil recovery of 42 %OOIP was reached after 5
days. No chemical-induced wettability alteration is expected to take
place because the core is already equilibrated with the FWM during core
restoration. The imbibition by itself confirms the presence of positive
capillary forces in the core.
Figure 52. Oil recovery test at Tres by spontaneous imbibition (SI) on core M3-R6
using mSW-LS brines, and in comparison, with spontaneous imbibition
of LS in M3-R5 and FW-LS in core M3-R4.

Main results and discussions
98
After eight days, the imbibing brine was changed to LSm, and 6 %OOIP
extra oil is gradually recovered during the next five days, confirming
wettability alteration and increased positive capillary forces during LSm
imbibition, figure 52.
After the fifth restoration, M3-R5, the core is exposed to the LSm in the
secondary mode. As expected, the LS brine significantly increased the
capillary forces compared to FW, due to wettability alteration, and a oil
recovery plateau of 67 %OOIP was reached after six days. Comparing
the recoveries in the same time frame confirms an increased rate of
imbibition with LSm, which is a crucial parameter for optimized recovery
processes.
Comparing the ultimate oil recoveries during SI and viscous flooding
with LSM brine in secondary mode on core M3, SI with LSM gave the
highest recovery of 67 %OOIP compared to 63%OOIP during viscous
flooding. This confirms the key role of capillary forces during oil
production from heterogeneous porous networks. Wettability alteration
processes and capillary forces is normally ignored in mathematical
reservoir modeling.
The final imbibition experiment, called M3-R6, was performed by SI
with mSW followed by LSm brine. The result is presented in the figure
52. The ultimate oil recovery by mSW is 38 %OOIP, which is almost
comparable with FWm, but the rate of imbibition is far slower. The result
confirms the mSW is not smart water, and not able to induce increased
capillary forces. But interestingly, when the imbibition brine is switched
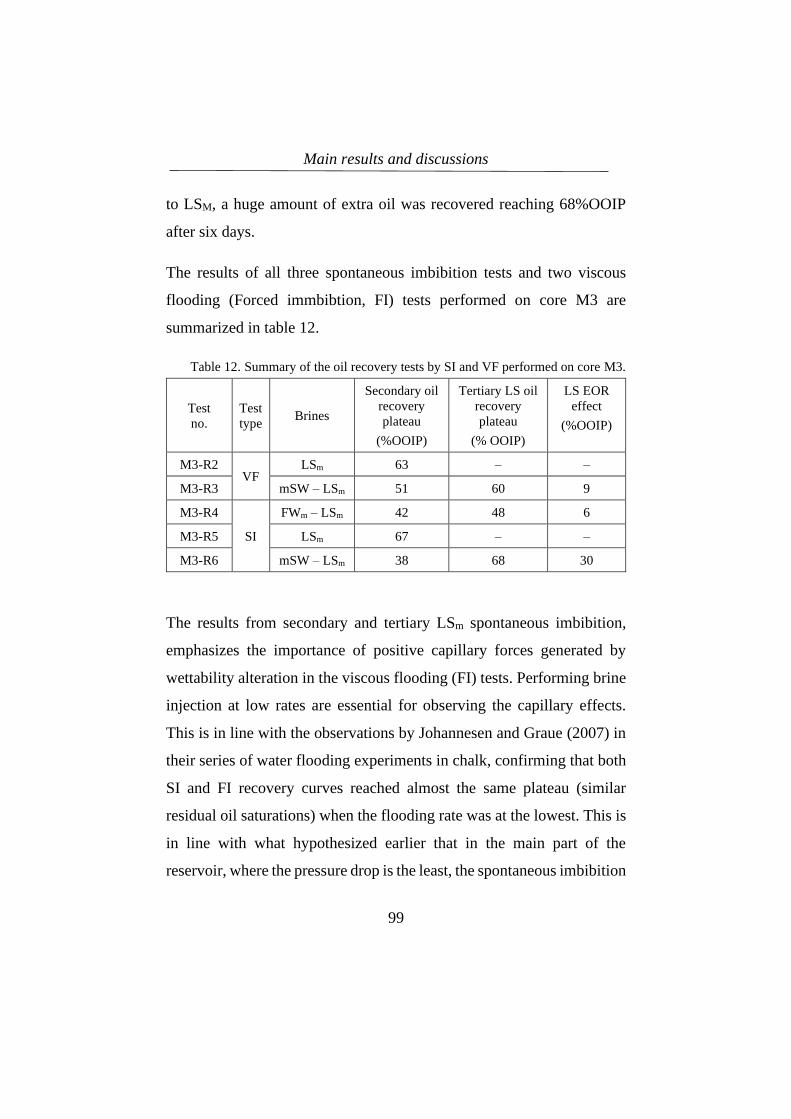
Main results and discussions
99
to LSM, a huge amount of extra oil was recovered reaching 68%OOIP
after six days.
The results of all three spontaneous imbibition tests and two viscous
flooding (Forced immbibtion, FI) tests performed on core M3 are
summarized in table 12.
Table 12. Summary of the oil recovery tests by SI and VF performed on core M3.
Test
no.
Test
type Brines
Secondary oil
recovery
plateau
(%OOIP)
Tertiary LS oil
recovery
plateau
(% OOIP)
LS EOR
effect
(%OOIP)
M3-R2 VF
LSm 63 – –
M3-R3 mSW – LSm 51 60 9
M3-R4
SI
FWm – LSm 42 48 6
M3-R5 LSm 67 – –
M3-R6 mSW – LSm 38 68 30
The results from secondary and tertiary LSm spontaneous imbibition,
emphasizes the importance of positive capillary forces generated by
wettability alteration in the viscous flooding (FI) tests. Performing brine
injection at low rates are essential for observing the capillary effects.
This is in line with the observations by Johannesen and Graue (2007) in
their series of water flooding experiments in chalk, confirming that both
SI and FI recovery curves reached almost the same plateau (similar
residual oil saturations) when the flooding rate was at the lowest. This is
in line with what hypothesized earlier that in the main part of the
reservoir, where the pressure drop is the least, the spontaneous imbibition

Main results and discussions
100
due to positive capillary forces are the main driving forces during smart
water flooding process.
The recovery data presented in table 12, confirms that The LSM promoted
the most water wet system, and also behaved the smartest brine for EOR
purposes. The LSm brine gave the best sweep efficiency and showed the
latest water breakthrough point during the FI test, figure 50. SI tests
confirmed that the highest recovery is achieved in the most water wet
system which is inconsistency with what Jadhunandan and Morrow
(1995) stated that the highest oil recovery will be achieved in the neutral
to slightly water-wet conditions.
Contrarily to the LSm brine, mSW could not contribute to increased
capillary forces by wettability alteration compare to the base brine which
is FWm.
The oil recovery process during FW injection into heterogeneous porous
systems can be explained by viscous displacement of oil from larger high
permeable pores, and some contribution of capillary forces, figure 53b.
When the flooding brine is switched to a Smart Water, the chemical
wettability alteration will increase capillary forces and the oil recovery
is increased by improving both the microscopic and macroscopic sweep
efficiencies, figure 53c.
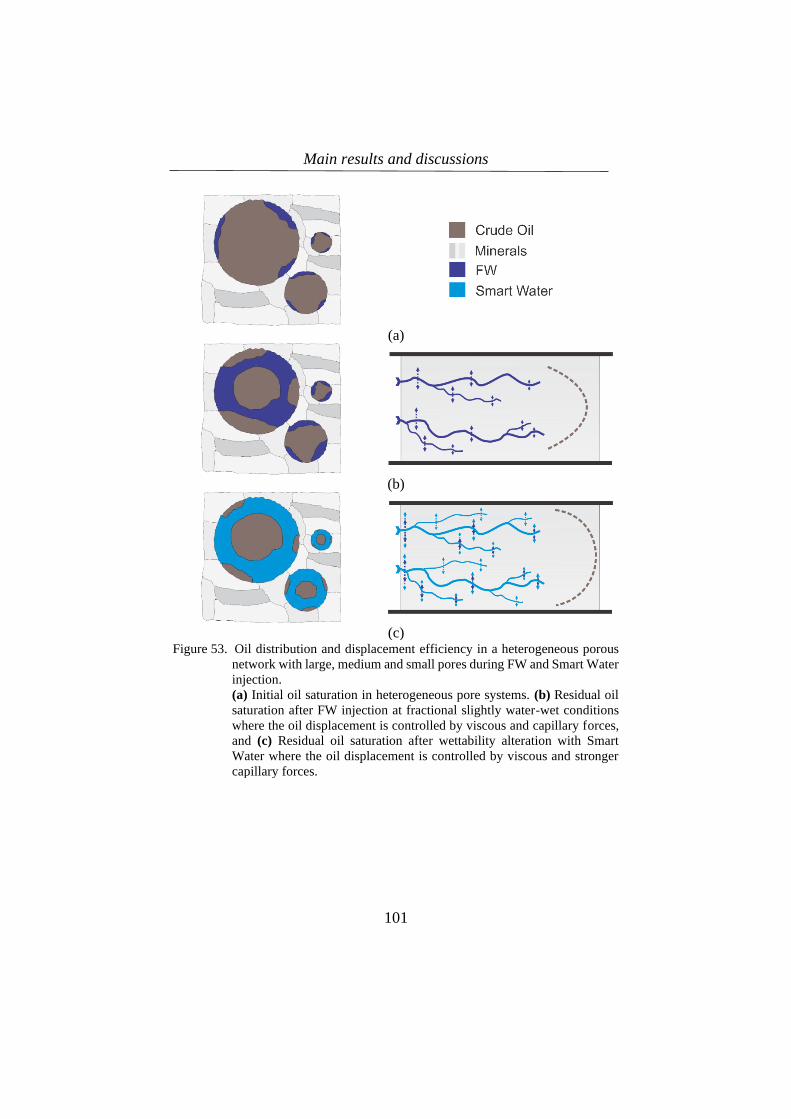
Main results and discussions
101
(a)
(b)
(c) Figure 53. Oil distribution and displacement efficiency in a heterogeneous porous
network with large, medium and small pores during FW and Smart Water
injection.
(a) Initial oil saturation in heterogeneous pore systems. (b) Residual oil
saturation after FW injection at fractional slightly water-wet conditions
where the oil displacement is controlled by viscous and capillary forces,
and (c) Residual oil saturation after wettability alteration with Smart
Water where the oil displacement is controlled by viscous and stronger
capillary forces.

Main results and discussions
102
Concluding remarks
103
5 Concluding remarks
5.1 Conclusions
By performing some fundamental experiments and also some case
studies the potential of LS brine, seawater, and modified seawater
injection for EOR purposes in high temperature sandstone offshore
reservoirs was evaluated.
The results obtained from several number of oil recovery tests using an
excellent promising restoration method provides the following points:
• Low salinity brine always shows the best EOR performance,
resulting in higher ultimate oil recovery and better sweep
efficiency by giving a later water breakthrough. Most of the
recoverable oil can be produced after one PV injected. The higher
oil recovery also corresponds to the higher ∆pH of the produced
water during the water flooding EOR. Secondary LS EOR
potential has consistent behaviour for a variety of formation
water salinities with a low to high salinity.
• Seawater is not smart water in secondary mode at high
temperature reservoir. And due to the high concentration of Ca2+
and Mg2+ and also SO42- it reduces the potential for wettability
alteration by lowering the ∆pH during tertiary low salinity brine
injection for EOR.
• Modified seawater also did not perform as an efficient secondary
EOR method, and was not able to sufficiently increase the
Concluding remarks
104
capillary forces leading to incremental recovery factor, but due to
lower divalent ion concertation, it still provides a good initial
condition for tertiary LS smart water flooding.
In addition, parametric studies of the initial wetting and wettability
alteration process were accomplished in two sets of experiments: Firstly
adsorption/desorption tests of Ca2+ and Mg2+ to/from sand pack surfaces
containing pure quartz, mixture of quartz-kaolinite and mixture of
quartz-illite at ambient and elevated temperature, and secondly by
adsorption/desorption study of a basic POC model (Quinoline) towards
quartz, kaolinite and illite surfaces. The experiments confirmed:
• Far less importance of quartz minerals compared to both kaolinite
and illite on the adsorption of both active cations and also the
basic POC model, compared to kaolinite and illite clay. This
result clearly highlights the clay presence importance on
initiating the mixed wettability, by adsorption on the rock surface
• The affinity of Ca2+ towards kaolinite and illite was much
stronger than Mg2+.
• The affinity of both ions, Ca2+ and Mg2+, towards kaolinite,
increased as the temperature increased, i.e. the desorption process
took place in a more extended time, confirming that desorption
from the clay surface is an exothermic process.
• Adsorption/desorption of quinoline on the kaolinite is absolutely
pH dependent, same as the results obtained by illite. Moreover,
Concluding remarks
105
the maximum adsorption on the kaolinite clay was obtained at pH
~5.
• The adsorption of quinoline is also temperature dependent, and
the potential to adsorb on the clay surface is reduced by
increasing temperature to 130 °C.
• The quinoline adsorption is higher when using LS brine, and it is
reduced by an increase in the salinity of the brine, i.e by
increasing the salinity of initial brine in the rock the potential of
POC adsorption will be reduced and the rock will get more water
wet.
• The adsorption of quinoline onto illite clay is significantly higher
compared to the kaolinite clay, while the adsorption process of
quinoline is not totally reversible from the illite surface.
5.2 Future work
• Based on the experiments performed and results and observations
made in this research, the following suggestion can be considered
for the future study plans:
• Investigation of the potential of modified seawater in other
reservoir cores with different mineralogy, specially the cases
which do not contain dissolvable minerals.
• Combined LS brine EOR effect with other methods to get an even
higher increase in the capillary number, such as polymer flooding
which can be a reasonable option for the reservoirs with high
permeability and, CO2 LS water alternative gas (CO2 LS WAG)

Concluding remarks
106
to get benefit of both wettability alteration and also improving
gas flooding performance by controlling the gas mobility.
• Performing a single oil recovery scenario in single or twin cores
at the different injection flow rate, to investigate how SI during
FI oil recovery test can be affected.
• More extensive parametric study to prove the upper and lower
salinity and composition limit for formation water, to have the
optimum initial wetting condition. This can help to predict the
performance of LS EOR for specific reservoirs.
107
6 References
Abdelgawad, K.Z. and Mahmoud, M.A., 2015. In-Situ Generation of CO2 to
Eliminate the Problem of Gravity Override in EOR of Carbonate
Reservoirs. SPE-172516-MS. SPE Middle East Oil & Gas Show and
Conference, Manama, Bahrain, 8-11 March.
https://doi.org/10.2118/172516-MS.
Abrams, A., 1975. The Influence of Fluid Viscosity, Interfacial Tension, and
Flow Velocity on Residual Oil Saturation Left by Waterflood. SPE-
5050-PA, 15(05): 437-447. https://doi.org/10.2118/5050-PA.
Aghaeifar, Z., Strand, S., Austad, T., Puntervold, T., Aksulu, H., Navratil, K.,
Storås, S. and Håmsø, D., 2015. Influence of formation water
salinity/composition on the low salinity EOR effect in high temperature
sandstone reservoirs. Energy & Fuels, 29(8): 4747-4754.
https://doi.org/10.1021/acs.energyfuels.5b01621.
Ahmed, T. and McKinney, P.D., 2005. Performance of Oil Reservoirs. In: T.
Ahmed and P.D. McKinney (Editors), Advanced Reservoir
Engineering. Gulf Professional Publishing, Burlington, pp. 291-325.
https://doi.org/10.1016/B978-075067733-2/50006-X.
Aksulu, H., Håmsø, D., Strand, S., Puntervold, T. and Austad, T., 2012.
Evaluation of low salinity EOR-effects in sandstone: Effects of
temperature and pH gradient. Energy & Fuels 26(6): 3497-3503.
https://doi.org/10.1021/ef300162n.
Allard, B., Karlsson, M., Tullborg, E.-L. and Larson, S.Å., 1983. Ion exchange
capacities and surface areas of some major components and common
fracture filling materials of igneous rocks, Göteborg, Sweden.
Althani, M.G., 2014. An Evaluation of Low Salinity Waterflooding in
Carbonates Using Simulation and Economics. Master thesis Thesis,
Colorado School of Mines, Golden, Colorado.
Austad, T., 2013. Chapter 13 - Water-Based EOR in Carbonates and
Sandstones: New Chemical Understanding of the EOR Potential Using
“Smart Water”. In: J.J. Sheng (Editor), Enhanced Oil Recovery Field
Case Studies. Gulf Professional Publishing, Boston, pp. 301-335.
https://doi.org/10.1016/B978-0-12-386545-8.00013-0.
Austad, T., Rezaeidoust, A. and Puntervold, T., 2010. Chemical mechanism of
low salinity water flooding in sandstone reservoirs. SPE-129767-MS.
108
SPE Improved Oil Recovery Symposium, Tulsa, Oklahoma, USA, 24-
28 April. https://doi.org/10.2118/129767-MS.
Babadagli, T., 2019. Philosophy of EOR. SPE-196362-MS. SPE/IATMI Asia
Pacific Oil & Gas Conference and Exhibition, Bali, Indonesia, 29-31
October. https://doi.org/10.2118/196362-MS.
Bjørlykke, K. and Jahren, J., 2010. Sandstones and Sandstone Reservoirs. In:
K. Bjorlykke (Editor), Petroleum Geoscience: From Sedimentary
Environments to Rock Physics. Springer Berlin Heidelberg, Berlin,
Heidelberg, pp. 113-140. https://doi.org/10.1007/978-3-642-02332-
3_4.
Buckley, J.S. and Morrow, N.R., 1990. Characterization of crude oil wetting
behavior by adhesion tests. SPE-20263-MS. SPE/DOE Seventh
Symposium on Enhanced Oil Recovery, Tulsa, Oklahoma, April 22-
25. https://doi.org/10.2118/20263-MS.
Burgos, W.D., Pisutpaisal, N., Mazzarese, M.C. and Chorover, J., 2002.
Adsorption of quinoline to kaolinite and montmorillonite.
Environmental Engineering Science, 19(2): 59-68.
https://doi.org/10.1089/10928750252953697.
Cissokho, M., Bertin, H., Boussour, S., Cordier, P. and Hamon, G., 2010. Low
Salinity Oil Recovery On Clayey Sandstone: Experimental Study.
Petrophysics, 51(05): 9.
Crabtree, M., Eslinger, D., Fletcher, P., Johnson, A. and King, G., 1999.
Fighting scale—removal and prevention. Oilfield Review, 11(3): 30-
45.
Davis, R.A. and McElhiney, J.E., 2002. The advancement of sulfate removal
from seawater in offshore waterflood operations. NACE-02314.
Corrosion, Denver, Colorado, 7-11 April.
Denekas, M.O., Mattax, C.C. and Davis, G.T., 1959. Effects of Crude Oil
Components on Rock Wettability. SPE-1276-G. AIChE-SPE Joint
Symposium, Kansas City, Missouri, US, 17-20 May.
Didier, M., Chaumont, A., Joubert, T., Bondino, I. and Hamon, G., 2015.
Contradictory trends for smart water injection method: Role of pH and
salinity from sand/oil/brine adhesion maps. SCA2015-005. The
International Symposium of the Society of Core Analysts, St. John’s
Newfoundland and Labrador, Canada, 16-21 August.
Donaldson, E.C., Yen, T.F. and Chilingarian, G.V., 1989. Chapter 16
Environmental Factors Associated with Oil Recovery. In: E.C.

109
Donaldson, G.V. Chilingarian and T.F. Yen (Editors), Developments
in Petroleum Science. Elsevier, pp. 495-510.
https://doi.org/10.1016/S0376-7361(08)70468-0.
Ehrenberg, S.N., Nadeau, P.H. and Steen, O., 2009. Petroleum reservoir
porosity versus depth: Influence of geological age. The American
Association of Petroleum Geologists Bulletin, 93(10): 1281-1296.
https://doi.org/10.1306/06120908163.
Fan, T. and Buckley, J., 2000. Base number titration of crude oil samples.
Personal communication.
Fan, T. and Buckley, J., 2006. Acid number measurements revisited. SPE-
99884-MS. SPE IOR Symposium, Tulsa, OK, USA, 22-26 April.
https://doi.org/10.2118/99884-MS.
Fogden, A., 2012. Removal of crude oil from kaolinite by water flushing at
varying salinity and pH. Colloids and Surfaces A: Physicochemical and
Engineering Aspects, 402: 13-23.
https://doi.org/10.1016/j.colsurfa.2012.03.005.
Fogden, A. and Lebedeva, E., 2011. Changes in Wettability State Due to
Waterflooding. The International Symposium of the Society of Core
Analysts, Austin, TX, USA, 18-21 September.
Fuaadi, I.M., Pearce, J.C. and Gael, B.T., 1991. Evaluation of Steam-Injection
Designs for the Duri Steamflood Project. SPE-22995-MS. SPE Asia-
Pacific Conference, Perth. Australia, 4-7 November.
https://doi.org/10.2118/22995-MS.
Gamage, P. and Thyne, G., 2011. Systematic investigation of the effect of
temperature during aging and low salinity flooding of Berea sandstone
and Minn. 16th European Symposium on Improved Oil Recovery
Cambridge, UK, 12 April. https://doi.org/10.3997/2214-
4609.201404798.
Green, D.W. and Willhite, G.P., 1998. Enhanced Oil Recovery. SPE Textbook
Series, 6. Society of Petroleum Engineers, Richardson, Texas.
Hanzlik, E.J. and Mims, D.S., 2003. Forty Years of Steam Injection in
California - The Evolution of Heat Management. SPE-84848-MS. SPE
International Improved Oil Recovery Conference in Asia Pacific,
Kuala Lumpur, Malaysia, 20-21 October.
https://doi.org/10.2118/84848-MS.
Hardy, J.A., Barthorpe, R.T., Plummer, M.A. and Rhudy, J.S., 1992. Control
of scaling in the South Brae field. OTC-7058-MS. Offshore
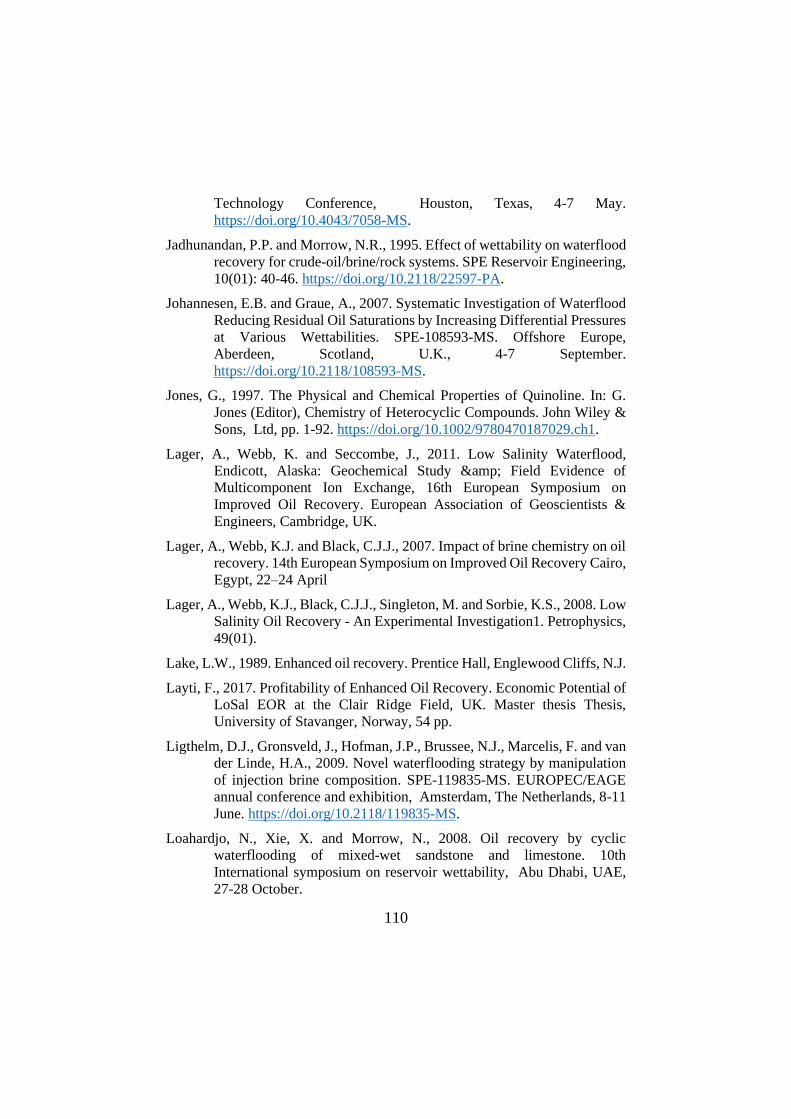
110
Technology Conference, Houston, Texas, 4-7 May.
https://doi.org/10.4043/7058-MS.
Jadhunandan, P.P. and Morrow, N.R., 1995. Effect of wettability on waterflood
recovery for crude-oil/brine/rock systems. SPE Reservoir Engineering,
10(01): 40-46. https://doi.org/10.2118/22597-PA.
Johannesen, E.B. and Graue, A., 2007. Systematic Investigation of Waterflood
Reducing Residual Oil Saturations by Increasing Differential Pressures
at Various Wettabilities. SPE-108593-MS. Offshore Europe,
Aberdeen, Scotland, U.K., 4-7 September.
https://doi.org/10.2118/108593-MS.
Jones, G., 1997. The Physical and Chemical Properties of Quinoline. In: G.
Jones (Editor), Chemistry of Heterocyclic Compounds. John Wiley &
Sons, Ltd, pp. 1-92. https://doi.org/10.1002/9780470187029.ch1.
Lager, A., Webb, K. and Seccombe, J., 2011. Low Salinity Waterflood,
Endicott, Alaska: Geochemical Study & Field Evidence of
Multicomponent Ion Exchange, 16th European Symposium on
Improved Oil Recovery. European Association of Geoscientists &
Engineers, Cambridge, UK.
Lager, A., Webb, K.J. and Black, C.J.J., 2007. Impact of brine chemistry on oil
recovery. 14th European Symposium on Improved Oil Recovery Cairo,
Egypt, 22–24 April
Lager, A., Webb, K.J., Black, C.J.J., Singleton, M. and Sorbie, K.S., 2008. Low
Salinity Oil Recovery - An Experimental Investigation1. Petrophysics,
49(01).
Lake, L.W., 1989. Enhanced oil recovery. Prentice Hall, Englewood Cliffs, N.J.
Layti, F., 2017. Profitability of Enhanced Oil Recovery. Economic Potential of
LoSal EOR at the Clair Ridge Field, UK. Master thesis Thesis,
University of Stavanger, Norway, 54 pp.
Ligthelm, D.J., Gronsveld, J., Hofman, J.P., Brussee, N.J., Marcelis, F. and van
der Linde, H.A., 2009. Novel waterflooding strategy by manipulation
of injection brine composition. SPE-119835-MS. EUROPEC/EAGE
annual conference and exhibition, Amsterdam, The Netherlands, 8-11
June. https://doi.org/10.2118/119835-MS.
Loahardjo, N., Xie, X. and Morrow, N., 2008. Oil recovery by cyclic
waterflooding of mixed-wet sandstone and limestone. 10th
International symposium on reservoir wettability, Abu Dhabi, UAE,
27-28 October.
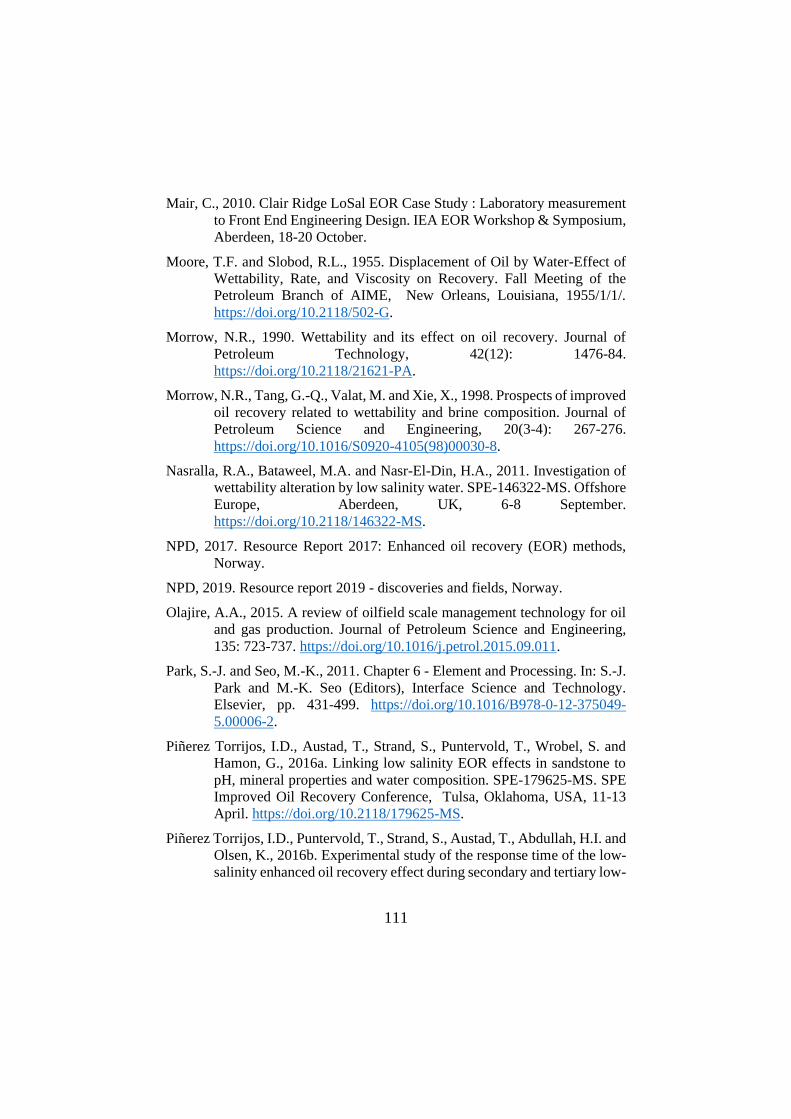
111
Mair, C., 2010. Clair Ridge LoSal EOR Case Study : Laboratory measurement
to Front End Engineering Design. IEA EOR Workshop & Symposium,
Aberdeen, 18-20 October.
Moore, T.F. and Slobod, R.L., 1955. Displacement of Oil by Water-Effect of
Wettability, Rate, and Viscosity on Recovery. Fall Meeting of the
Petroleum Branch of AIME, New Orleans, Louisiana, 1955/1/1/.
https://doi.org/10.2118/502-G.
Morrow, N.R., 1990. Wettability and its effect on oil recovery. Journal of
Petroleum Technology, 42(12): 1476-84.
https://doi.org/10.2118/21621-PA.
Morrow, N.R., Tang, G.-Q., Valat, M. and Xie, X., 1998. Prospects of improved
oil recovery related to wettability and brine composition. Journal of
Petroleum Science and Engineering, 20(3-4): 267-276.
https://doi.org/10.1016/S0920-4105(98)00030-8.
Nasralla, R.A., Bataweel, M.A. and Nasr-El-Din, H.A., 2011. Investigation of
wettability alteration by low salinity water. SPE-146322-MS. Offshore
Europe, Aberdeen, UK, 6-8 September.
https://doi.org/10.2118/146322-MS.
NPD, 2017. Resource Report 2017: Enhanced oil recovery (EOR) methods,
Norway.
NPD, 2019. Resource report 2019 - discoveries and fields, Norway.
Olajire, A.A., 2015. A review of oilfield scale management technology for oil
and gas production. Journal of Petroleum Science and Engineering,
135: 723-737. https://doi.org/10.1016/j.petrol.2015.09.011.
Park, S.-J. and Seo, M.-K., 2011. Chapter 6 - Element and Processing. In: S.-J.
Park and M.-K. Seo (Editors), Interface Science and Technology.
Elsevier, pp. 431-499. https://doi.org/10.1016/B978-0-12-375049-
5.00006-2.
Piñerez Torrijos, I.D., Austad, T., Strand, S., Puntervold, T., Wrobel, S. and
Hamon, G., 2016a. Linking low salinity EOR effects in sandstone to
pH, mineral properties and water composition. SPE-179625-MS. SPE
Improved Oil Recovery Conference, Tulsa, Oklahoma, USA, 11-13
April. https://doi.org/10.2118/179625-MS.
Piñerez Torrijos, I.D., Puntervold, T., Strand, S., Austad, T., Abdullah, H.I. and
Olsen, K., 2016b. Experimental study of the response time of the low-
salinity enhanced oil recovery effect during secondary and tertiary low-
112
salinity waterflooding. Energy & Fuels, 30(6): 4733-4739.
https://doi.org/10.1021/acs.energyfuels.6b00641.
Piñerez Torrijos, I.D., Puntervold, T., Strand, S., Austad, T., Tran, V.V. and
Olsen, K., 2017. Impact of temperature on the low salinity EOR effect
for sandstone cores containing reactive plagioclase. Journal of
Petroleum Science and Engineering, 156: 102-109.
https://doi.org/10.1016/j.petrol.2017.05.014.
Reddick, C.E., Buikema, T.A. and Williams, D., 2012. Managing Risk in the
Deployment of New Technology: Getting LoSal into the Business. SPE
Improved Oil Recovery Symposium, Tulsa, Oklahoma, USA, 14-18
April. https://doi.org/10.2118/153933-MS.
Reinholdtsen, A.J., RezaeiDoust, A., Strand, S. and Austad, T., 2011. Why such
a small low salinity EOR - potential from the Snorre formation? 16th
European Symposium on Improved Oil Recovery, Cambridge, UK,
12-14 April. https://doi.org/10.3997/2214-4609.201404796
Rezaeidoust, A., Puntervold, T. and Austad, T., 2010. A discussion of the low-
salinity EOR potential for a North Sea sandstone field. SPE-134459-
MS. SPE Annual Technical Conference and Exhibition, Florence,
Italy, 19-22 September. https://doi.org/10.2118/134459-MS.
RezaeiDoust, A., Puntervold, T. and Austad, T., 2011. Chemical Verification
of the EOR Mechanism by Using Low Saline/Smart Water in
Sandstone. Energy & Fuels, 25(5): 2151-2162.
https://doi.org/10.1021/ef200215y.
Robbana, E., Buikema, T.A., Mair, C., Williams, D., Mercer, D.J., Webb, K.J.,
Hewson, A. and Reddick, C.E., 2012. Low Salinity Enhanced Oil
Recovery - Laboratory to Day One Field Implementation - LoSal EOR
into the Clair Ridge Project. SPE-161750-MS. Abu Dhabi International
Petroleum Conference and Exhibition, Abu Dhabi, UAE, 11-14
November. https://doi.org/10.2118/161750-MS.
Seccombe, J.C., Lager, A., Webb, K.J., Jerauld, G. and Fueg, E., 2008.
Improving Wateflood Recovery: LoSalTM EOR Field Evaluation. SPE
Symposium on Improved Oil Recovery, Tulsa, Oklahoma, USA, 20-
23 April. https://doi.org/10.2118/113480-MS.
Smalley, P.C., Muggeridge, A.H., Dalland, M., Helvig, O.S., Høgnesen, E.J.,
Hetland, M. and Østhus, A., 2018. Screening for EOR and Estimating
Potential Incremental Oil Recovery on the Norwegian Continental
Shelf. SPE-190230-MS. SPE Improved Oil Recovery Conference,
113
Tulsa, Oklahoma, USA, 14-18 April. https://doi.org/10.2118/190230-
MS.
Springer, N., Korsbech, U. and Aage, H.K., 2003. Resistivity index
measurement without the porous plate: A desaturation technique based
on evaporation produces uniform water saturation profiles and more
reliable results for tight North Sea chalk. International Symposium of
the Society of Core Analysts Pau, France, 21-24 September.
Strand, S., Austad, T., Puntervold, T., Aksulu, H., Haaland, B. and
RezaeiDoust, A., 2014. The impact of plagioclase on the low salinity
EOR-effect in sandstone. Energy & Fuels, 28(4): 2378-2383.
https://doi.org/10.1021/ef4024383.
Strand, S., Puntervold, T. and Austad, T., 2016. Water based EOR from clastic
oil reservoirs by wettability alteration: A review of chemical aspects.
Journal of Petroleum Science and Engineering, 146: 1079-1091.
https://doi.org/10.1016/j.petrol.2016.08.012.
Taber, J.J., 1981. Research on Enhanced Oil Recovery: Past, Present and
Future. In: D.O. Shah (Editor), Surface Phenomena in Enhanced Oil
Recovery. Springer US, Boston, MA, pp. 13-52.
https://doi.org/10.1007/978-1-4757-0337-5_2.
Taber, J.J., Martin, F.D. and Seright, R.S., 1997. EOR Screening Criteria
Revisited - Part 1: Introduction to Screening Criteria and Enhanced
Recovery Field Projects. SPE Reservoir Engineering, 12(03): 189-198.
https://doi.org/10.2118/35385-PA.
Tang, G.-Q. and Morrow, N.R., 1999. Influence of brine composition and fines
migration on crude oil/brine/rock interactions and oil recovery. Journal
of Petroleum Science and Engineering, 24(2-4): 99-111.
https://doi.org/10.1016/S0920-4105(99)00034-0.
Tang, G.Q.Q. and Morrow, N.R., 1997. Salinity, Temperature, Oil
Composition, and Oil Recovery by Waterflooding. SPE Reservoir
Engineering, 12(04): 269-276. https://doi.org/10.2118/36680-PA.
Thomas, S., 2008. Enhanced Oil Recovery - An Overview. Oil & Gas Science
and Technology - Rev. IFP, 63(1): 9-19.
https://doi.org/10.2516/ogst:2007060.
Winoto, W., Loahardjo, N., Xie, S.X., Yin, P. and Morrow, N.R., 2012.
Secondary and tertiary recovery of crude oil from outcrop and reservoir
rocks by low salinity waterflooding. SPE-154209-MS. SPE Improved

114
Oil Recovery Symposium, Tulsa, Oklahoma, USA, 14-18 April.
https://doi.org/10.2118/154209-MS.
Wolcott, J.M., Groves, F.R., Jr., Trujillo, D.E. and Lee, H.G., 1993.
Investigation Of Crude-Oil/Mineral Interactions: Factors Influencing
Wettability Alteration. SPE-21042-PA, 1(01): 117-126.
https://doi.org/10.2118/21042-PA.
Zavitsas, A.A., 2005. Aqueous Solutions of Calcium Ions: Hydration Numbers
and the Effect of Temperature. The Journal of Physical Chemistry B,
109(43): 20636-20640. https://doi.org/10.1021/jp053909i.
Pap
er I Paper I
“Smart Water injection strategies for optimized EOR in a high
temperature offshore oil reservoir”, Z. Aghaeifar, S. Strand, T.
Puntervold, T. Austad. Journal of Petroleum Science and Engineering,
June 2018, 165, pp 743-751. https://doi.org/10.1016/j.petrol.2018.02.021
115

116
Smart Water injection strategies for optimized EOR in a high temperatureoffshore oil reservoir
Zahra Aghaeifar *, Skule Strand, Tina Puntervold, Tor Austad, Farasdaq Muchibbus Sajjad
University of Stavanger, 4036 Stavanger, Norway
A B S T R A C T
Smart Water injection is an EOR technique that is both environmentally friendly and easily implementable to a fractional cost compared to other water-based EORmethods. EOR by Smart Water is a wettability alteration process towards more water-wet conditions, which induces increased positive capillary forces and increasedmicroscopic sweep efficiency.
The objective of this work was to evaluate the injection strategy for Smart Water in an offshore high temperature sandstone reservoir, and compare the efficiency ofseawater-based injection brines with low salinity brines, which can behave as Smart Water in sandstone reservoirs. Oil recovery experiments have been performed atreservoir conditions using preserved reservoir cores and reservoir fluids.
Secondary low salinity injection gave an average of 33.5 %OOIP extra oil produced, compared to modified seawater injection. The tertiary low salinity EOR effectafter modified seawater flooding gave an average of 11.8 %OOIP extra oil. Significant changes in produced water pH from initially acidic to alkaline conditions duringlow salinity injection were observed, favoring wettability alteration towards more water-wet conditions.
The results confirmed that low salinity brine behaved as a Smart Water, contributing with significant extra oil recovery in a high temperature sandstone reservoir.Introducing Smart Water from day one in a reservoir, i.e. in secondary recovery mode, is significantly more efficient, regarding both response time and ultimate oilrecovery, than tertiary mode Smart Water injection.
1. Introduction
Waterflooding is extensively practiced in sandstone oil reservoirs toprovide pressure support and to improve the oil displacement efficiency,and is typically introduced after a primary pressure depletion period. Thewater source used in the waterflooding process is typically the easiestavailable at the lowest possible cost. Considering Crude Oil/Brine/Rock(COBR) interactions, the injection water chemistry has been shown tohave an impact on oil recovery. The first experimental investigation onthe effect of waterflood salinity was performed by Bernard (1967). Yearslater, in early 1990's, the effect of injection water composition wasbroadly examined by Morrow and co-workers (Jadhunandan, 1990;Jadhunandan and Morrow, 1995). The results confirmed that the oilrecovery increased when the salinity of the injection brine decreased.Recent research has confirmed that not only the salinity, but also the ioncomposition in the injection brine is important for optimizing the EOReffect (Austad et al., 2010; Pi~nerez Torrijos et al., 2016a; Pi~nerez Torrijoset al., 2016c; RezaeiDoust et al., 2011). It was experimentally verifiedthat injecting a 25 000 ppm NaCl brine can give the same ultimate oilrecovery as that observed by injecting a 1000 ppm NaCl brine (Pi~nerezTorrijos et al., 2016c). Therefore the term “Smart Water” is used for a
brine that is able to alter rock wettability for increased oil recovery. Thecomposition of the Smart Water brine is not fixed, but may vary for theindividual reservoir rocks.
Seawater (SW) is the natural injection fluid in offshore oil reservoirs.The typical formation water (FW) has high salinity and high divalentcation concentrations (Crabtree et al., 1999). SW contains high amountsof sulfate (SO4
2-), which may cause precipitation upon contact withdivalent cations, and therefore chemical modification of the seawater isoften recommended, especially for high reservoir temperatures (Tres).This was authenticated in the early 1990's during the development of theSouth Brae oilfield in the North Sea (Davis and McElhiney, 2002; Hardyet al., 1992). SW was modified to prevent reservoir souring and precip-itation of anhydrite (CaSO4), barite (BaSO4), celestine (SrSO4) or otherSO4
2- -bearing minerals, by decreasing the divalent ion concentrations ofCa2þ, Mg2þ, and especially SO4
2-. The salinity of the modified SWwas stillin the range of 30 000 ppm, and the Smart Water EOR potential of usingsuch a brine for injection purposes could be limited. Therefore, it is ofgreat scientific interest to verify if SW or modified SW (mSW) can behaveas Smart Water. Furthermore, by diluting the SW or the modified SW 20times, the usually recommended salinity of 1500 ppm to observe SmartWater EOR effects was reached, containing an ionic composition, which
* Corresponding author.E-mail address: [email protected] (Z. Aghaeifar).
Contents lists available at ScienceDirect
Journal of Petroleum Science and Engineering
journal homepage: www.elsevier.com/locate/petrol
https://doi.org/10.1016/j.petrol.2018.02.021Received 25 July 2017; Received in revised form 9 February 2018; Accepted 10 February 2018Available online 14 February 20180920-4105/© 2018 Elsevier B.V. All rights reserved.
Journal of Petroleum Science and Engineering 165 (2018) 743–751
117
is achievable at offshore installations.The pore surface minerals, FW composition, and specific crude oil
components affect the reservoir pH, and they are also the main param-eters controlling the initial wettability in sandstone reservoirs (Buckleyand Morrow, 1990; Didier et al., 2015; Fogden, 2012; Strand et al.,2016). Reservoir temperature and the competition between all speciesthat could interact with negative charged sites at the mineral surfaceswill influence the established wettability equilibrium in a reservoir, asseen in Fig. 1.
The minerals constitute the wetting surfaces, and the properties of themineral surfaces are controlled by the mineral distribution within thepore space, available surface area, surface charge, cation exchange ca-pacity (CEC), and the ionic composition and salinity of FW (Mamonovet al., 2017). The sour gasses CO2 and H2S in crude oil partition into thebrine phase, and can also affect the reservoir pH. The clay mineralscontribute with a large portion of the pore surface, and with permanentnegative charges, they can interact with protonated polar organic com-ponents at acidic conditions, creating a fractional wetting. Withincreasing pH, the degree of protonation of the polar organic componentsdecreases, and at alkaline conditions the polar organic components willnot adsorb to the negatively charged clay mineral surface (Austad et al.,2010; Burgos et al., 2002; Håmsø, 2011; Madsen and Lind, 1998).
The Smart Water EOR effect is described as a wettability alterationprocess towards more water-wet conditions (Austad et al., 2010; Lageret al., 2008; Morrow and Buckley, 2011; Nasralla et al., 2011). Accordingto the suggested chemical Smart Water EOR model, cation desorptionand proton (Hþ) adsorption at mineral surfaces induces a local pH in-crease, needed for the wettability alteration, as the high salinity FW isdisplaced by the Smart Water. This model is illustrated by the followingchemical equations using Ca2þ as the active cation (Austad, 2013; Austadet al., 2010; RezaeiDoust et al., 2011).
Slow reaction: Clay-Ca2þ þ H2O ↔ Clay-Hþ þ Ca2þ þ OH� þ HEAT (1)
Fast reaction: Clay- R3NHþ þ OH� ↔ Clay þ R3N: þ H2O (2)
Fast reaction: Clay-RCOOH þ OH� ↔ Clay þ RCOO� þ H2O (3)
It should be noticed that desorption of Ca2þ ions from clay minerals,
Eq. (1), is an exothermic process, generating heat. The induced pHgradient when switching from FW to LS brine will be smaller withincreased Tres (Aghaeifar et al., 2015a; Aksulu et al., 2012). Anexothermic contribution to the low salinity EOR effect in sandstonereservoirs was previously also suggested by Gamage and Thyne (2011). Acombination of high Tres and high FW salinity reduces the adsorption oforganic material onto the clay minerals, and as a consequence the min-eral pore surfaces could become too water-wet for observing significantSmart Water EOR effects (Aghaeifar et al., 2015a).
Offshore oil reservoirs at temperatures above 100 �C and with highFW salinity may contain anhydrite (CaSO4) minerals. SW injection canalso cause anhydrite precipitation. Dissolution of CaSO4 during LS in-jection will increase the concentration of Ca2þ in the brine, and ac-cording to Le Chateli�er's principle, move Eq. (1) to the left, resulting in areduced pH gradient. As a result, reduced tertiary LS EOR effects aftersecondary flooding with SW could be expected for high temperaturereservoirs.
In this work the Smart Water EOR potential for an undevelopedsandstone oil reservoir at a temperature above 130 �C, has been evalu-ated. The objective was to compare the oil recovery results by secondaryLS brine injection and by tertiary LS brine injection after modified(reduced sulfate to minimize scale potential) seawater flooding.
2. Experimental
2.1. Material
2.1.1. Reservoir coresFour preserved reservoir cores were used, C#1, C#3, C#4 and C#5.
All cores were sampled from the same reservoir zone, only centimetersapart. Mineralogical data from neighboring cores were provided by thefield operator, and are presented in Table 1. It should be noted thatduring core cleaning, anhydrite (CaSO4) was detected in the effluentsamples, however anhydrite minerals were not reported in the given XRDdata. Physical core properties are listed in Table 2.
2.1.2. BrinesDifferent synthetic brines based on given ionic compositions were
prepared in the laboratory. The reservoir formation water (FW) hasmedium salinity of 63 000 ppm, with a typical FW ionic composition andCa2þ/Mg2þ -ratio for sandstone reservoirs. The modified seawater(mSW) is a treated seawater (SW) with reduced concentration of SO4
2-,Ca2þ and Mg2þ, for reduced scale potential. The low salinity (LS) brine isa 20 times diluted mSW brine. The brine properties are presented inTable 3.
2.1.3. OilA stabilized reservoir crude oil (stock tank oil) was used in the oil
recovery experiments. The crude oil was centrifuged and filtered througha 5.0 μmMillipore filter to remove any solid particles or water phase. Theacid number (AN) and base number (BN) were determined by potenti-ometric titration with an accuracy of �0.02mg KOH/g. The methodsused were developed by Fan and Buckley, and are modified versions ofASTM D664 and ASTM D2896 (Fan and Buckley, 2000, 2006). Theasphaltene content was measured based on a modified version of theASTM D6560, proposed by J. Buckley. The crude oil viscosity wasmeasured at 20 and 60 �C using a MCR 302 rheometer delivered byAnton Paar. The crude oil properties are given in Table 4.
2.2. Core preparation and restoration
All cores used in the experiments went through the same core prep-aration procedure. The preserved cores were initially mildly cleaned atambient temperature in a core holder. The core was first floodedwith lowaromatic kerosene to displace the crude oil phase. At clear effluents, thekerosene was displaced by heptane. At the end, the core was flooded with
Fig. 1. The competition between active species towards negatively charged siteson the sandstone mineral surfaces will dictate the initial wettability (Strandet al., 2016).
Z. Aghaeifar et al. Journal of Petroleum Science and Engineering 165 (2018) 743–751
744
118

4 pore volumes (PV) of 1000 ppm NaCl brine to remove initial brine andany easily dissolvable salts. Effluent brine samples were collected forchemical analyses. Finally, the core was dried at 60 �C to constantweight.
Initial FW saturation of Swi¼ 15% was established using the desic-cator technique (Springer et al., 2003), and the core was equilibrated in aclosed container for 3 days to establish an even ionic distributionthroughout the core. Afterwards the core was mounted in a core holder,briefly evacuated down to the water vapor pressure, and then saturatedby crude oil followed by 2 PV crude oil flooding in both directions tosecure an even oil distribution. Finally, the core was placed on marbleballs inside a steel aging cell surrounded by crude oil and aged for2 weeks at Tres (>130 �C).
After completion of the subsequent oil recovery test, the core wasremoved from the Hassler core holder and restored according to the sameprocedure as described above. By using this method to establish theinitial water and oil saturations, the uncertainties of the initial saturationgeneration in each restoration are reduced.
2.3. Oil recovery tests
The restored core was placed into a temperature controlled Hasslercore holder. The oil recovery experiment was performed with a confiningpressure of 20 bar and a back pressure of 10 bar at constant Tres (above130 �C). The core was successively flooded with different injection brinesat Tres and using a constant flooding rate of 4 pore volumes per day (PV/D), corresponding to approximately 1 ft/day. At the end of each experi-ment, the flooding rate was increased four times to 16 PV/D to investi-gate any possible end-effects. The schematic illustration of the setup isshown in Fig. 2.
The accuracy of the injection rate was �5%. Cumulative oil produc-tion with an accuracy of �0.1ml was monitored versus PV injected.Produced water (PW) samples, each containing 2–3ml, were regularlycollected and pH, density, and ionic composition were analyzed. Processparameters such as temperature, inlet pressure and pressure drop (ΔP)over the core were also monitored. A PT100 element with an accuracy of�0.03 �C was used to ensure stable oven temperature of �0.2 �C. Pres-sures were monitored using Rosemount 3051 pressure gauges with anaccuracy of �0.075% of full scale.
2.4. Surface reactivity/pH-screening test
A mildly cleaned, 100% FW saturated core was mounted in theHassler core holder and flooded with FW –mSW – LS – FW – LS – FW at arate of 4PV/D at Tres (>130 �C). Effluent samples, each containing2–3ml, were collected, and pH and density of the produced water weremonitored.
2.5. Analyses
2.5.1. Ion analysisChemical analysis of effluent brine samples was performed using a
Dionex ICS5000 þ ion chromatograph (IC). The effluent samples werediluted 1000 times with deionized water and filtered through a 0.02 μmpore size paper filter prior to analyses. Ion concentrations were calcu-lated based on the external standard method.
2.5.2. Fluid densityFluid densities were measured using a density meter DMA-4500 from
Anton Paar.
Table 1Mineralogical data from XRD analyses reported in wt%.
Illite/Smectite
Illite/Mica
Kaolinite Chlorite Quartz K-feldspar
Plagioclase Dolomite Total
0–0.2 6.1–10.0 6.8–9.0 0.9–1.2 74.2–81.6 2.5–3.2 1.0–1.4 0.8–1 100
Table 2Reservoir core properties.
Core Length,cm
Diameter,cm
PoreVolume,ml
Porosity,%
Permeabilityakwro,md
bBET,m2/g
C#1 7.26 3.84 11.77 14.0 6 0.67C#3 7.03 3.84 11.82 14.6 9 0.92C#4 7.00 3.84 11.10 13.7 5 1.40C#5 7.25 3.84 11.64 13.9 8 0.97
a kwro: 1000 ppm NaCl permeability measured at heptane Sor. Measured duringthe first restoration.
b BET: Specific surface area using TriStar II PLUS from Metromeritics®.
Table 3Brine compositions, with ionic concentrations given in millimole/L (mM).
Ions FWmM
SWmM
mSWmM
LSmM
Naþ 929.8 450.1 477.2 23.9Kþ 17.8 10.1 8.1 0.4Ca2þ 44.2 13.0 8.2 0.4Mg2þ 7.0 44.5 13.5 0.7Ba2þ 5.2 0.0 0.0 0.0Sr2þ 3.0 0.0 0.0 0.0Cl� 1058.8 525.1 527.9 26.4HCO3
� 7.7 2.0 0.3 0.02SO4
2- 0.0 24.0 0.4 0.02pH 6.8 7.7 7.0 6.4TDS, mg/kg 63 000 33 390 30 725 1536Density, g/cm3 1.042 1.023 1.020 0.999
Table 4Chemical and physical properties of the stabilized reservoir crude oil.
AN(mgKOH/g)
BN(mgKOH/g)
Asphaltene(wt%)
Density @20 �C(g/cm3)
Viscosity @20 �C(mPas)
Viscosity @60 �C(mPas)
0.16 0.76 1.1 0.847 7.0 2.9
Fig. 2. Experimental setup for the oil recovery tests.
Z. Aghaeifar et al. Journal of Petroleum Science and Engineering 165 (2018) 743–751
745
119
2.5.3. ViscosityA Physica MCR 302 rotational rheometer from Anton Paar was used
for viscosity measurements. The measurements were performed with acone and plate geometry at constant shear rates in the range of 10–100s�1, and at 20–60 �C.
2.5.4. BET surface areaBET surface area measurements were carried out in a TriStar II PLUS
instrument from Metromeritics®. The measurements were performed onrock samples taken from the same block as the core material used in thisstudy, and the measurement accuracy was 0.02m2/g.
2.5.5. pH measurementsThe pH was measured using the Seven Easy™ pH meter delivered by
Mettler Toledo, with a Semi-micro pH electrode optimized for smallsample volumes. The measurements were performed at ambient tem-perature with a repeatability of �0.02 pH units.
3. Results and discussion
The Smart Water EOR potential for a high temperature (>130 �C),medium FW salinity offshore sandstone oil reservoir has been evaluated.The Smart Water EOR effect is the result of a wettability alteration pro-cess towards more water-wet conditions, which induces increased posi-tive capillary forces and improved microscopic sweep efficiency. A seriesof oil recovery experiments has been performed using preserved reservoircores sampled close to each other in the same well. Core data are given inTable 1. The average core porosity was 14%, and the water permeabilityat residual heptane saturation measured during the core cleaning, was inthe range of 5–9 mD. Due to the low permeability, even small wettabilitymodifications toward more water-wet condition can significantlyenhance capillary forces and improve the microscopic sweep efficiencyduring Smart Water injection.
The mineralogical data of the two cores are also expected to becomparable, as is indicated by the XRD data given in Table 2. A total claycontent of 14–20wt%, with equal amounts of kaolinite and illite/mica,which are characterized as non-swelling clays, are good initial conditionsfor observing LS EOR effects (RezaeiDoust et al., 2011; Robbana et al.,2012). The content of feldspar minerals is low, about 3–4wt%, andtherefore these minerals are not expected to contribute significantly toCEC and increased pH during the Smart Water flooding (Pi~nerez Torrijoset al., 2017; Reinholdtsen et al., 2011).
The presence of polar organic components in the crude oil is neededto create a mixed reservoir wetting. Positively charged polar organiccomponents are anchor molecules attaching to negatively charged sites atthe mineral surfaces (Burgos et al., 2002; Madsen and Lind, 1998;RezaeiDoust et al., 2011). As expected for a high temperature oil reser-voir, the AN¼ 0.16 mgKOH/g is low due to decarboxylation duringgeological time. The BN of 0.76mg KOH/g is moderate, but still highenough to partly wet mineral surfaces at acidic reservoir pH. The com-bination of high clay content and moderate FW salinity are promising forcreating initial mixed wetting even at reservoir temperatures above130 �C (Aghaeifar et al., 2015a; Gamage and Thyne, 2011).
In this experimental work, the efficiency of using LS brine as a SmartWater has been evaluated. Secondary injections of LS brine and modifiedSW (mSW), which is a possible injection brine for a high temperatureoffshore reservoir (>130 �C) have been compared. The efficiency ofusing the LS brine in tertiary mode after mSW injection has also beenevaluated.
A mildly cleaned reservoir core was used in a surface reactivity test toevaluate the pore surface mineral – brine interactions at reservoir tem-perature. CEC at mineral surfaces will affect the pH development duringFW, mSW and LS injection. The results give valuable information aboutthe initial reservoir wettability and the potential of observing SmartWater EOR effect during mSW and LS injection.
Seven oil recovery experiments were performed using three initially
preserved reservoir cores. All cores went through the same core resto-ration procedure prior to testing for minimizing experimental variationbetween each experiment. Each core was used in more than one oil re-covery experiment, and to reduce experimental uncertainties, the brineflooding sequences varied for the individual cores.
3.1. Investigation of surface reactivity
The preserved and mildly cleaned reservoir core C#4 was succes-sively flooded with FW – mSW – LS – FW – LS – FW brines at a constantrate, 4 PV/D, at Tres (>130 �C). At each stage, the flooding continueduntil the pH and density of eluted brine stabilized as shown in Fig. 3.
During the first FW flooding, the effluent pH stabilized at 7.2. Thenthe injection brine was changed to mSW, and a decrease in the effluentdensity was observed, but the pH stabilized at 7.3, confirming that themSW did not influence the pH that had stabilized during the FW flooding.Next, when LS brine was injected, a decrease in density was observed andwhen it was low enough after about 2 PV injected, a rapid increase in pHwas observed. The pH stabilized above pH 8 with an ultimate ΔpH¼ 1.0.Switching back to FW, the salinity increased again and pH decreased tovalues below 7. The highest ultimate pH increase was observed when theLS brine was injected directly after FW, with an ultimate ΔpH¼ 1.8.Thus, simply based on pH increment values, the possibility of wettabilityalteration is larger with LS brine than with mSW brine.
The effluent concentrations of Ca2þ, Mg2þ and SO42- were determined,
and the results are shown in Fig. 4.The most significant observation from the chemical analysis was that
during the first FW flooding, the first effluent samples had SO42- con-
centrations close to 10mM, indicating that the cores may contain smallamounts of dissolvable anhydrite, CaSO4. It must be noted that no sulfatewas initially present in FW. During mSW flooding, the SO4
2- concentrationdecreased to 1.5mM, which is more than 3 times the SO4
2- concentrationinitially present in mSW. During the flooding with LS brine containing0.02mM SO4
2-, a concentration of 1mM SO42- was observed in the effluent.
After 12 PV injected, the anhydrite dissolution was dramatically reducedand effluent SO4
2- concentrations were reduced to the expected low valuesduring both FW and LS brine injection.
Anhydrite dissolution was confirmed by increased concentration ofSO4
2-, but it also contributed to increased Ca2þ concentrations. An in-crease in Ca2þ concentration during LS injection will move Eq. (1) to theleft, and consequently decrease the pH gradient. Thus, the presence ofdissolvable CaSO4 might reduce wettability alteration and thus decreasethe LS EOR potential.
The Ca2þ and Mg2þ concentrations in the LS brine were 0.4 and0.7mM, respectively. Effluent concentrations during LS injectionsconfirm Ca2þ concentrations close to 0.4 mM, but the Mg concentration
Fig. 3. Surface reactivity test performed on mildly cleaned core C#4 at Tres(>130 �C). The flooding sequence was FW – mSW – LS – FW – LS – FW at a rateof 4 PV/D. pH and density of the effluent samples are presented vs. PV injected.
Z. Aghaeifar et al. Journal of Petroleum Science and Engineering 165 (2018) 743–751
746
120
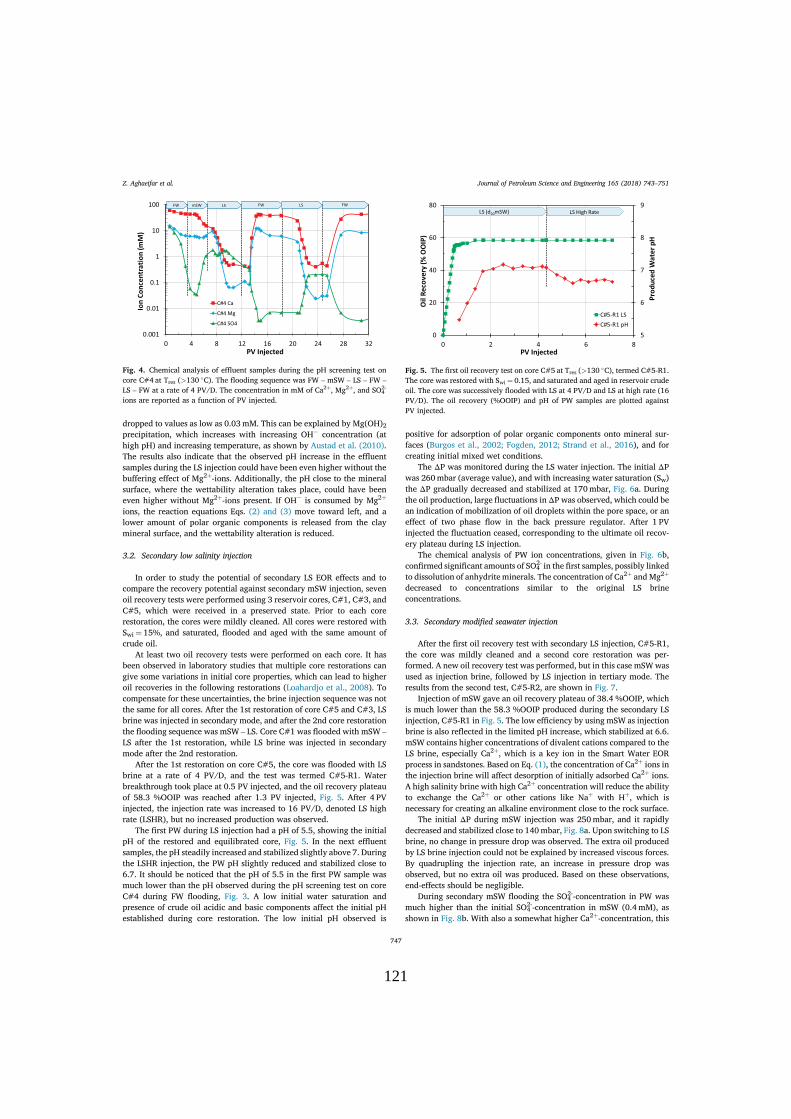
dropped to values as low as 0.03mM. This can be explained by Mg(OH)2precipitation, which increases with increasing OH� concentration (athigh pH) and increasing temperature, as shown by Austad et al. (2010).The results also indicate that the observed pH increase in the effluentsamples during the LS injection could have been even higher without thebuffering effect of Mg2þ-ions. Additionally, the pH close to the mineralsurface, where the wettability alteration takes place, could have beeneven higher without Mg2þ-ions present. If OH� is consumed by Mg2þ
ions, the reaction equations Eqs. (2) and (3) move toward left, and alower amount of polar organic components is released from the claymineral surface, and the wettability alteration is reduced.
3.2. Secondary low salinity injection
In order to study the potential of secondary LS EOR effects and tocompare the recovery potential against secondary mSW injection, sevenoil recovery tests were performed using 3 reservoir cores, C#1, C#3, andC#5, which were received in a preserved state. Prior to each corerestoration, the cores were mildly cleaned. All cores were restored withSwi¼ 15%, and saturated, flooded and aged with the same amount ofcrude oil.
At least two oil recovery tests were performed on each core. It hasbeen observed in laboratory studies that multiple core restorations cangive some variations in initial core properties, which can lead to higheroil recoveries in the following restorations (Loahardjo et al., 2008). Tocompensate for these uncertainties, the brine injection sequence was notthe same for all cores. After the 1st restoration of core C#5 and C#3, LSbrine was injected in secondary mode, and after the 2nd core restorationthe flooding sequence was mSW – LS. Core C#1 was flooded with mSW –
LS after the 1st restoration, while LS brine was injected in secondarymode after the 2nd restoration.
After the 1st restoration on core C#5, the core was flooded with LSbrine at a rate of 4 PV/D, and the test was termed C#5-R1. Waterbreakthrough took place at 0.5 PV injected, and the oil recovery plateauof 58.3 %OOIP was reached after 1.3 PV injected, Fig. 5. After 4 PVinjected, the injection rate was increased to 16 PV/D, denoted LS highrate (LSHR), but no increased production was observed.
The first PW during LS injection had a pH of 5.5, showing the initialpH of the restored and equilibrated core, Fig. 5. In the next effluentsamples, the pH steadily increased and stabilized slightly above 7. Duringthe LSHR injection, the PW pH slightly reduced and stabilized close to6.7. It should be noticed that the pH of 5.5 in the first PW sample wasmuch lower than the pH observed during the pH screening test on coreC#4 during FW flooding, Fig. 3. A low initial water saturation andpresence of crude oil acidic and basic components affect the initial pHestablished during core restoration. The low initial pH observed is
positive for adsorption of polar organic components onto mineral sur-faces (Burgos et al., 2002; Fogden, 2012; Strand et al., 2016), and forcreating initial mixed wet conditions.
The ΔP was monitored during the LS water injection. The initial ΔPwas 260mbar (average value), and with increasing water saturation (Sw)the ΔP gradually decreased and stabilized at 170mbar, Fig. 6a. Duringthe oil production, large fluctuations in ΔP was observed, which could bean indication of mobilization of oil droplets within the pore space, or aneffect of two phase flow in the back pressure regulator. After 1 PVinjected the fluctuation ceased, corresponding to the ultimate oil recov-ery plateau during LS injection.
The chemical analysis of PW ion concentrations, given in Fig. 6b,confirmed significant amounts of SO4
2- in the first samples, possibly linkedto dissolution of anhydrite minerals. The concentration of Ca2þ andMg2þ
decreased to concentrations similar to the original LS brineconcentrations.
3.3. Secondary modified seawater injection
After the first oil recovery test with secondary LS injection, C#5-R1,the core was mildly cleaned and a second core restoration was per-formed. A new oil recovery test was performed, but in this case mSWwasused as injection brine, followed by LS injection in tertiary mode. Theresults from the second test, C#5-R2, are shown in Fig. 7.
Injection of mSW gave an oil recovery plateau of 38.4 %OOIP, whichis much lower than the 58.3 %OOIP produced during the secondary LSinjection, C#5-R1 in Fig. 5. The low efficiency by using mSW as injectionbrine is also reflected in the limited pH increase, which stabilized at 6.6.mSW contains higher concentrations of divalent cations compared to theLS brine, especially Ca2þ, which is a key ion in the Smart Water EORprocess in sandstones. Based on Eq. (1), the concentration of Ca2þ ions inthe injection brine will affect desorption of initially adsorbed Ca2þ ions.A high salinity brine with high Ca2þ concentration will reduce the abilityto exchange the Ca2þ or other cations like Naþ with Hþ, which isnecessary for creating an alkaline environment close to the rock surface.
The initial ΔP during mSW injection was 250mbar, and it rapidlydecreased and stabilized close to 140mbar, Fig. 8a. Upon switching to LSbrine, no change in pressure drop was observed. The extra oil producedby LS brine injection could not be explained by increased viscous forces.By quadrupling the injection rate, an increase in pressure drop wasobserved, but no extra oil was produced. Based on these observations,end-effects should be negligible.
During secondary mSW flooding the SO42--concentration in PW was
much higher than the initial SO42--concentration in mSW (0.4mM), as
shown in Fig. 8b. With also a somewhat higher Ca2þ-concentration, this
Fig. 4. Chemical analysis of effluent samples during the pH screening test oncore C#4 at Tres (>130 �C). The flooding sequence was FW – mSW – LS – FW –
LS – FW at a rate of 4 PV/D. The concentration in mM of Ca2þ, Mg2þ, and SO42-
ions are reported as a function of PV injected.
Fig. 5. The first oil recovery test on core C#5 at Tres (>130 �C), termed C#5-R1.The core was restored with Swi¼ 0.15, and saturated and aged in reservoir crudeoil. The core was successively flooded with LS at 4 PV/D and LS at high rate (16PV/D). The oil recovery (%OOIP) and pH of PW samples are plotted againstPV injected.
Z. Aghaeifar et al. Journal of Petroleum Science and Engineering 165 (2018) 743–751
747
121
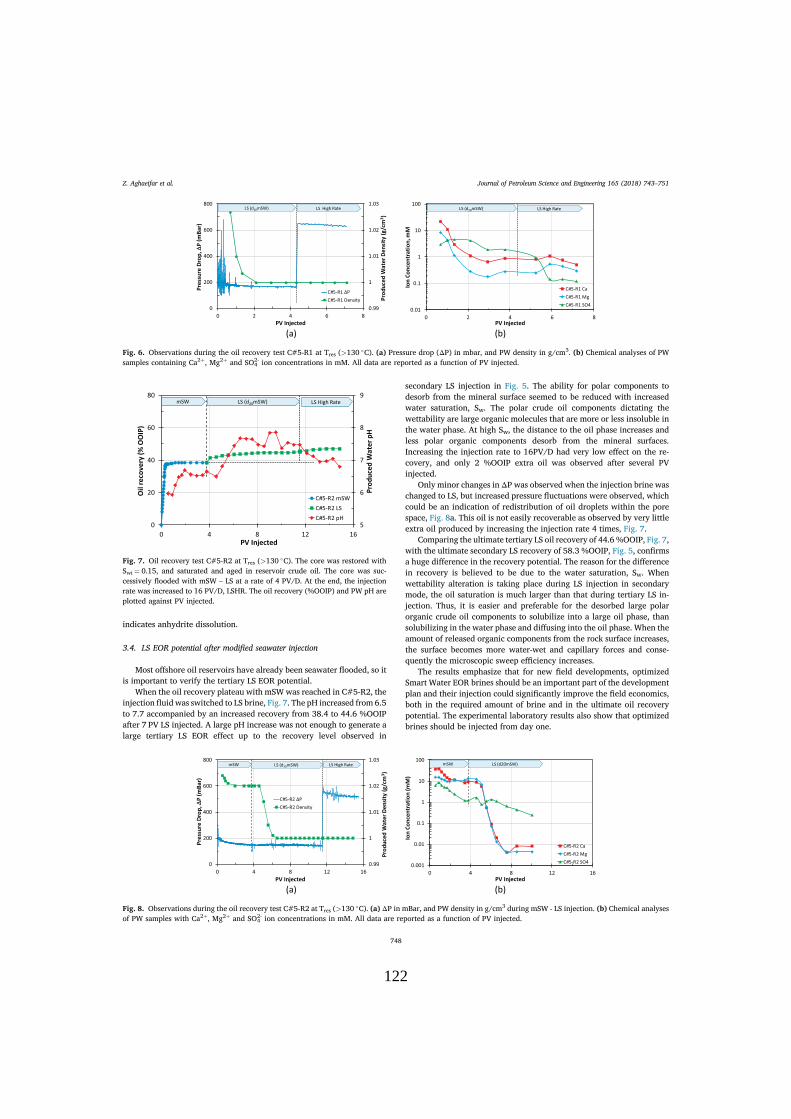
indicates anhydrite dissolution.
3.4. LS EOR potential after modified seawater injection
Most offshore oil reservoirs have already been seawater flooded, so itis important to verify the tertiary LS EOR potential.
When the oil recovery plateau with mSWwas reached in C#5-R2, theinjection fluid was switched to LS brine, Fig. 7. The pH increased from 6.5to 7.7 accompanied by an increased recovery from 38.4 to 44.6 %OOIPafter 7 PV LS injected. A large pH increase was not enough to generate alarge tertiary LS EOR effect up to the recovery level observed in
secondary LS injection in Fig. 5. The ability for polar components todesorb from the mineral surface seemed to be reduced with increasedwater saturation, Sw. The polar crude oil components dictating thewettability are large organic molecules that are more or less insoluble inthe water phase. At high Sw, the distance to the oil phase increases andless polar organic components desorb from the mineral surfaces.Increasing the injection rate to 16PV/D had very low effect on the re-covery, and only 2 %OOIP extra oil was observed after several PVinjected.
Only minor changes in ΔP was observed when the injection brine waschanged to LS, but increased pressure fluctuations were observed, whichcould be an indication of redistribution of oil droplets within the porespace, Fig. 8a. This oil is not easily recoverable as observed by very littleextra oil produced by increasing the injection rate 4 times, Fig. 7.
Comparing the ultimate tertiary LS oil recovery of 44.6%OOIP, Fig. 7,with the ultimate secondary LS recovery of 58.3 %OOIP, Fig. 5, confirmsa huge difference in the recovery potential. The reason for the differencein recovery is believed to be due to the water saturation, Sw. Whenwettability alteration is taking place during LS injection in secondarymode, the oil saturation is much larger than that during tertiary LS in-jection. Thus, it is easier and preferable for the desorbed large polarorganic crude oil components to solubilize into a large oil phase, thansolubilizing in the water phase and diffusing into the oil phase. When theamount of released organic components from the rock surface increases,the surface becomes more water-wet and capillary forces and conse-quently the microscopic sweep efficiency increases.
The results emphasize that for new field developments, optimizedSmart Water EOR brines should be an important part of the developmentplan and their injection could significantly improve the field economics,both in the required amount of brine and in the ultimate oil recoverypotential. The experimental laboratory results also show that optimizedbrines should be injected from day one.
Fig. 6. Observations during the oil recovery test C#5-R1 at Tres (>130 �C). (a) Pressure drop (ΔP) in mbar, and PW density in g/cm3. (b) Chemical analyses of PWsamples containing Ca2þ, Mg2þ and SO4
2- ion concentrations in mM. All data are reported as a function of PV injected.
Fig. 7. Oil recovery test C#5-R2 at Tres (>130 �C). The core was restored withSwi¼ 0.15, and saturated and aged in reservoir crude oil. The core was suc-cessively flooded with mSW – LS at a rate of 4 PV/D. At the end, the injectionrate was increased to 16 PV/D, LSHR. The oil recovery (%OOIP) and PW pH areplotted against PV injected.
Fig. 8. Observations during the oil recovery test C#5-R2 at Tres (>130 �C). (a) ΔP in mBar, and PW density in g/cm3 during mSW - LS injection. (b) Chemical analysesof PW samples with Ca2þ, Mg2þ and SO4
2- ion concentrations in mM. All data are reported as a function of PV injected.
Z. Aghaeifar et al. Journal of Petroleum Science and Engineering 165 (2018) 743–751
748
122
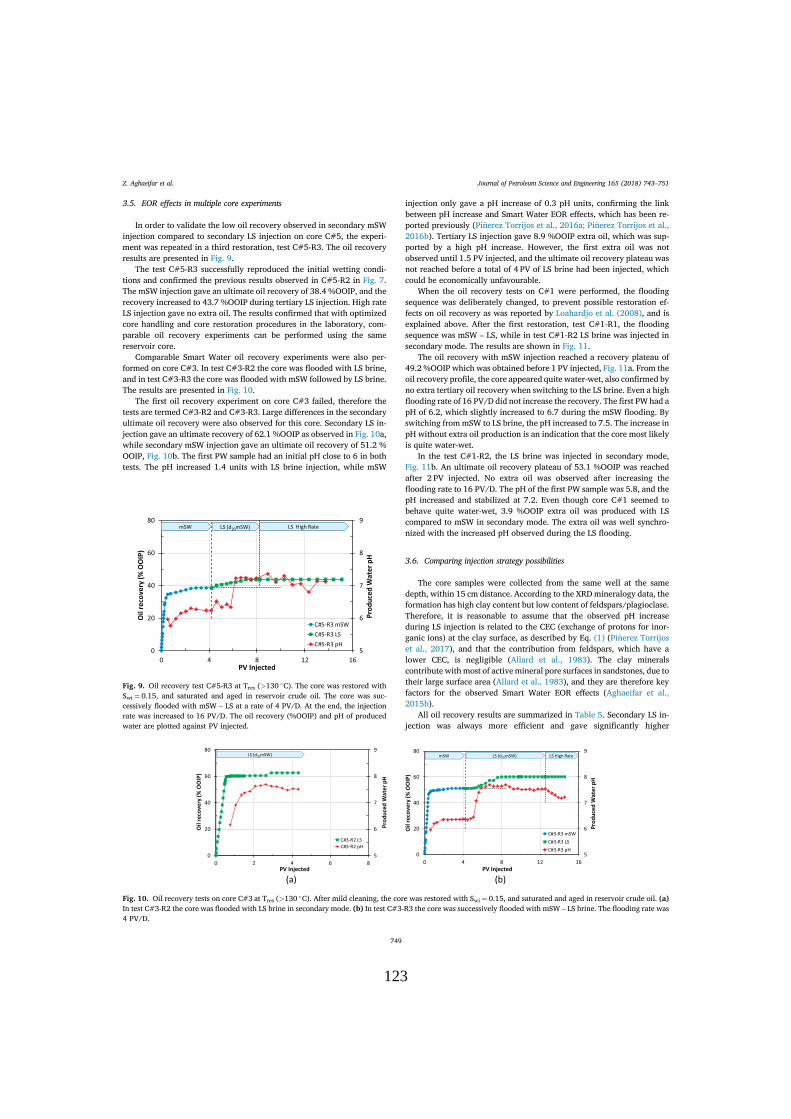
3.5. EOR effects in multiple core experiments
In order to validate the low oil recovery observed in secondary mSWinjection compared to secondary LS injection on core C#5, the experi-ment was repeated in a third restoration, test C#5-R3. The oil recoveryresults are presented in Fig. 9.
The test C#5-R3 successfully reproduced the initial wetting condi-tions and confirmed the previous results observed in C#5-R2 in Fig. 7.The mSW injection gave an ultimate oil recovery of 38.4 %OOIP, and therecovery increased to 43.7 %OOIP during tertiary LS injection. High rateLS injection gave no extra oil. The results confirmed that with optimizedcore handling and core restoration procedures in the laboratory, com-parable oil recovery experiments can be performed using the samereservoir core.
Comparable Smart Water oil recovery experiments were also per-formed on core C#3. In test C#3-R2 the core was flooded with LS brine,and in test C#3-R3 the core was flooded with mSW followed by LS brine.The results are presented in Fig. 10.
The first oil recovery experiment on core C#3 failed, therefore thetests are termed C#3-R2 and C#3-R3. Large differences in the secondaryultimate oil recovery were also observed for this core. Secondary LS in-jection gave an ultimate recovery of 62.1 %OOIP as observed in Fig. 10a,while secondary mSW injection gave an ultimate oil recovery of 51.2 %OOIP, Fig. 10b. The first PW sample had an initial pH close to 6 in bothtests. The pH increased 1.4 units with LS brine injection, while mSW
injection only gave a pH increase of 0.3 pH units, confirming the linkbetween pH increase and Smart Water EOR effects, which has been re-ported previously (Pi~nerez Torrijos et al., 2016a; Pi~nerez Torrijos et al.,2016b). Tertiary LS injection gave 8.9 %OOIP extra oil, which was sup-ported by a high pH increase. However, the first extra oil was notobserved until 1.5 PV injected, and the ultimate oil recovery plateau wasnot reached before a total of 4 PV of LS brine had been injected, whichcould be economically unfavourable.
When the oil recovery tests on C#1 were performed, the floodingsequence was deliberately changed, to prevent possible restoration ef-fects on oil recovery as was reported by Loahardjo et al. (2008), and isexplained above. After the first restoration, test C#1-R1, the floodingsequence was mSW – LS, while in test C#1-R2 LS brine was injected insecondary mode. The results are shown in Fig. 11.
The oil recovery with mSW injection reached a recovery plateau of49.2 %OOIP which was obtained before 1 PV injected, Fig. 11a. From theoil recovery profile, the core appeared quite water-wet, also confirmed byno extra tertiary oil recovery when switching to the LS brine. Even a highflooding rate of 16 PV/D did not increase the recovery. The first PW had apH of 6.2, which slightly increased to 6.7 during the mSW flooding. Byswitching from mSW to LS brine, the pH increased to 7.5. The increase inpH without extra oil production is an indication that the core most likelyis quite water-wet.
In the test C#1-R2, the LS brine was injected in secondary mode,Fig. 11b. An ultimate oil recovery plateau of 53.1 %OOIP was reachedafter 2 PV injected. No extra oil was observed after increasing theflooding rate to 16 PV/D. The pH of the first PW sample was 5.8, and thepH increased and stabilized at 7.2. Even though core C#1 seemed tobehave quite water-wet, 3.9 %OOIP extra oil was produced with LScompared to mSW in secondary mode. The extra oil was well synchro-nized with the increased pH observed during the LS flooding.
3.6. Comparing injection strategy possibilities
The core samples were collected from the same well at the samedepth, within 15 cm distance. According to the XRDmineralogy data, theformation has high clay content but low content of feldspars/plagioclase.Therefore, it is reasonable to assume that the observed pH increaseduring LS injection is related to the CEC (exchange of protons for inor-ganic ions) at the clay surface, as described by Eq. (1) (Pi~nerez Torrijoset al., 2017), and that the contribution from feldspars, which have alower CEC, is negligible (Allard et al., 1983). The clay mineralscontribute with most of active mineral pore surfaces in sandstones, due totheir large surface area (Allard et al., 1983), and they are therefore keyfactors for the observed Smart Water EOR effects (Aghaeifar et al.,2015b).
All oil recovery results are summarized in Table 5. Secondary LS in-jection was always more efficient and gave significantly higher
Fig. 9. Oil recovery test C#5-R3 at Tres (>130 �C). The core was restored withSwi¼ 0.15, and saturated and aged in reservoir crude oil. The core was suc-cessively flooded with mSW – LS at a rate of 4 PV/D. At the end, the injectionrate was increased to 16 PV/D. The oil recovery (%OOIP) and pH of producedwater are plotted against PV injected.
Fig. 10. Oil recovery tests on core C#3 at Tres (>130 �C). After mild cleaning, the core was restored with Swi¼ 0.15, and saturated and aged in reservoir crude oil. (a)In test C#3-R2 the core was flooded with LS brine in secondary mode. (b) In test C#3-R3 the core was successively flooded with mSW – LS brine. The flooding rate was4 PV/D.
Z. Aghaeifar et al. Journal of Petroleum Science and Engineering 165 (2018) 743–751
749
123

recoveries than injection of mSW in secondary mode.The incremental oil produced with secondary LS injection over sec-
ondary mSW injection varied from 7.9 to 51.8%, with an average of33.5%. Most of this extra oil was produced after only 1PV of LS brineinjected. Together with the observed EOR during LS injection, a signifi-cant change in pH was observed, supporting wettability alterationinduced by the LS brine injection according to the proposed chemicalmechanism, illustrated by Eqs. (1)-(3). Spontaneous imbibition intosmaller non-swept pores takes place, producing the extra oil from thesepores, improving the microscopic sweep efficiency and delaying thebreakthrough of the injection brine. This work only includes viscousflooding experiments. No quantitative data of wettability indices wereobtained before and after water flooding, to verify changes in wettability.A series of spontaneous imbibition experiments could have provided suchnumbers, but was not performed in this study due to the limited access ofpreserved reservoir cores. Wettability alteration with LS brine havepreviously been confirmed in spontaneous imbibition experiments,although on a different COBR-system (Pi~nerez Torrijos et al., 2017).Nevertheless, the viscous flooding experiments confirm that Smart Waterinjection in secondarymode could be an extremely efficient EORmethod.
Introducing the Smart Water in tertiary mode after mSW flooding,gave a tertiary EOR effect of 0.0–17.4%, with an average of 11.8%, extraoil produced with LS injection after mSW injection. Tertiary LS oil pro-duction was a much slower process, and 3–4 PVwith LS brine was neededto reach the recovery plateau. A large pH increase is not enough toguarantee a large tertiary LS EOR effect. The ability for polar componentsto desorb from the mineral surface seems to be reduced with increasedSw. The polar crude oil components dictating the surface wettability arelarge organic molecules, which are not soluble in the water phase. Athigh Sw, the distance to the oil phase increases and less polar organiccomponents desorb.
4. Conclusions
The Smart Water EOR potential for an undeveloped high temperature(>130 �C), medium FW salinity, offshore sandstone oil reservoir wasevaluated. Modified seawater (mSW), treated for reduced scaling po-tential, is a typical injection water for this type of reservoir. The SmartWater EOR potential was evaluated using a low salinity (LS) brine madeby diluting mSW 20 times. Secondary LS EOR potential and tertiary LSEOR potential after mSW flooding were evaluated by comparing a seriesof oil recovery tests performed on reservoir cores sampled close to eachother. The results are shortly summarized below:
� A surface reactivity test performed on a mildly cleaned reservoir coreconfirmed significant pH gradients (ΔpH) when FW was displaced byLS brine, and when mSW was displaced by LS brine. Only minor pHchanges were observed when FW was displaced by mSW brine. Theresults confirm that the pore surface minerals contribute with CECduring LS injection, inducing a pH increase needed for observingwettability alteration and EOR.
� Secondary oil recovery tests at Tres showed a significant increase in oilrecovery using LS brine compared to mSW. The extra produced oilvaried from 7.9 to 51.8%, with an average of 33.5% for the 3 testedcores.
� Tertiary LS injection after mSW injection gave LS EOR effects from0 to 17.4%, with an average of 11.8% extra oil for the 3 tested cores.
� A significant increase in PW pH from initially acidic, favoring frac-tional wetting to slightly more alkaline, favoring more water-wetconditions, were observed in all oil recovery experiments during LSinjection.
� When LS brine as Smart Water was introduced to the core in sec-ondary mode, it proved to be very efficient, and most of the extra oil
Fig. 11. Oil recovery tests from core C#1 at Tres (>130 �C). The core was restored with Swi¼ 0.15, and saturated and aged in reservoir crude oil before core flooding ata constant rate of 4 PV/D. (a) The core was successively flooded with mSW - LS brine, test C#1-R1. (b) The core was flooded with LS brine in secondary mode,C#1-R2.
Table 5Results from the forced displacement tests on all tested cores.
Core Test Brine floodingsequence
Secondaryoil recovery(%OOIP)
Tertiary LSoil recovery (%OOIP)
Tertiary oil produced(%OOIP)
Improved secondaryLS effect (%)
TertiaryLS effect (%)
Total number of PV injected
C#5 C#5-R1 LS 58.3 – – ~7C#5-R2 mSW-LS 38.4 44.6 6.2 51.8a 16.1b ~15C#5-R3 mSW-LS 38.4 43.7 5.3 51.8 13.8 ~15
C#3 C#3-R2 LS 62.6 – – 22.3 17.4 ~4C#3-R3 mSW-LS 51.2 60.1 8.9 ~15
C#1 C#1-R1 mSW-LS 49.2 49.2 0 7.9 0.0 ~12C#1-R2 LS 53.1 – – ~8
a Improved secondary LS effect (%) ¼ ((Secondary LS oil recovery (%OOIP) – Secondary mSW oil recovery (%OOIP))/Secondary mSW oil recovery (%OOIP))*100 ¼((58.3–38.4)/38.4)*100 ¼ 51.8.
b Tertiary LS effect (%) ¼ ((Tertiary oil produced (%OOIP) - Secondary mSW oil recovery (%OOIP))/Secondary mSW oil recovery (%OOIP))*100 ¼ ((44.6–38.4)/38.4)*100 ¼ 16.1.
Z. Aghaeifar et al. Journal of Petroleum Science and Engineering 165 (2018) 743–751
750
124
was produced after 1PV injected. In contrast, during tertiary LS in-jection, up to 4PV brine was needed to reach the recovery plateau.
Acknowledgements
The authors are grateful to the oil company for supplying the reser-voir material, and for financial support of research activities in the SmartWater EOR group at the University of Stavanger. Bachelor student GadiahAlbraji for participating in some of the laboratory work.
References
Aghaeifar, Z., Strand, S., Austad, T., Puntervold, T., Aksulu, H., Navratil, K., Storås, S.,Håmsø, D., 2015a. Influence of formation water salinity/composition on the lowsalinity EOR effect in high temperature sandstone reservoirs. Energy Fuel. 29 (8),4747–4754. https://doi.org/10.1021/acs.energyfuels.5b01621.
Aghaeifar, Z., Strand, S., Puntervold, T., Austad, T., Aarnes, S., Aarnes, C., 2015b.Adsorption/desorption of Ca2þ and Mg2þ to/from kaolinite clay in relation to the lowsalinity EOR effect. In: IOR 2015–18th European Symposium on Improved OilRecovery, Dresden, Germany, 14-16 April. https://doi.org/10.3997/2214-4609.201412132.
Aksulu, H., Håmsø, D., Strand, S., Puntervold, T., Austad, T., 2012. Evaluation of lowsalinity EOR-effects in sandstone: effects of temperature and pH gradient. EnergyFuel. 26 (6), 3497–3503. https://doi.org/10.1021/ef300162n.
Allard, B., Karlsson, M., Tullborg, E.-L., Larson, S., 1983. Ion Exchange Capacities andSurface Areas of Some Major Components and Common Fracture Filling Materials ofIgneous Rocks. SKB/KBS Technical Report TR 83–64, G€oteborg, Sweden.
Austad, T., 2013. Water based EOR in carbonates and sandstones: new chemicalunderstanding of the EOR potential using “Smart Water”. In: Sheng, J.J. (Ed.),Enhanced Oil Recovery Field Case Studies. Elsevier, Oxford, UK, pp. 301–335.
Austad, T., Rezaeidoust, A., Puntervold, T., 2010. Chemical mechanism of low salinitywater flooding in sandstone reservoirs. In: SPE-129767-MS. SPE Improved OilRecovery Symposium, Tulsa, Oklahoma, USA, 24–28 April. https://doi.org/10.2118/129767-MS.
Bernard, G.G., 1967. Effect of floodwater salinity on recovery of oil from cores containingclays. In: SPE-1725-MS. Annual California Regional Meeting, Los Angeles, California,USA, 26–27 October. https://doi.org/10.2118/1725-MS.
Buckley, J.S., Morrow, N.R., 1990. Characterization of crude oil wetting behavior byadhesion tests. SPE-20263-MS. In: SPE/DOE Seventh Symposium on Enhanced OilRecovery, Tulsa, Oklahoma, April 22–25. https://doi.org/10.2118/20263-MS.
Burgos, W.D., Pisutpaisal, N., Mazzarese, M.C., Chorover, J., 2002. Adsorption ofquinoline to kaolinite and montmorillonite. Environ. Eng. Sci. 19 (2), 59–68. https://doi.org/10.1089/10928750252953697.
Crabtree, M., Eslinger, D., Fletcher, P., Johnson, A., King, G., 1999. Fightingscale—removal and prevention. Oilfield Rev. 11 (3), 30–45.
Davis, R.A., McElhiney, J.E., 2002. The Advancement of Sulfate Removal from Seawaterin Offshore Waterflood Operations. NACE-02314. CORROSION, Denver, Colorado,7–11 April.
Didier, M., Chaumont, A., Joubert, T., Bondino, I., Hamon, G., 2015. Contradictory trendsfor smart water injection method: Role of pH and salinity from sand/oil/brineadhesion maps. SCA2015–005. In: The International Symposium of the Society ofCore Analysts, St. John's Newfoundland and Labrador, Canada, 16-21 August.
Fan, T., Buckley, J., 2000. Base Number Titration of Crude Oil Samples. PersonalCommunication.
Fan, T., Buckley, J., 2006. Acid number measurements revisited. In: SPE-99884-MS. SPEIOR Symposium, Tulsa, OK, USA, 22–26 April. https://doi.org/10.2118/99884-MS.
Fogden, A., 2012. Removal of crude oil from kaolinite by water flushing at varyingsalinity and pH. Colloid. Surface. Physicochem. Eng. Aspect. 402, 13–23. https://doi.org/10.1016/j.colsurfa.2012.03.005.
Gamage, P., Thyne, G., 2011. Systematic investigation of the effect of temperature duringaging and low salinity flooding of Berea sandstone and Minn. In: 16th EuropeanSymposium on Improved Oil Recovery Cambridge, UK, 12 April. https://doi.org/10.3997/2214-4609.201404798.
Håmsø, D., 2011. Adsorption of Quinoline onto Illite at High Temperature in Relation toLow Salinity Water Flooding in Sandstone Reservoirs. Master Thesis. University ofStavanger, Norway.
Hardy, J.A., Barthorpe, R.T., Plummer, M.A., Rhudy, J.S., 1992. Control of scaling in theSouth Brae field. In: OTC-7058-MS. Offshore Technology Conference, Houston,Texas, 4–7 May. https://doi.org/10.4043/7058-MS.
Jadhunandan, P.P., 1990. Effects of Brine Composition, Crude Oil and Aging Conditionson Wettability and Oil Recovery. PhD Thesis. New Mexico institute of mining andtechnology, Socorro, New Mexico.
Jadhunandan, P.P., Morrow, N.R., 1995. Effect of wettability on waterflood recovery forcrude-oil/brine/rock systems. SPE-22597-PA. SPE Reservoir Eng. 10 (01), 40–46.https://doi.org/10.2118/22597-PA.
Lager, A., Webb, K.J., Black, C.J.J., Singleton, M., Sorbie, K.S., 2008. Low salinity oilrecovery - an experimental Investigation1. Petrophysics 49 (01).
Loahardjo, N., Xie, X., Morrow, N., 2008. Oil recovery by cyclic waterflooding of mixed-wet sandstone and limestone. In: 10th International Symposium on ReservoirWettability, Abu Dhabi, UAE, 27–28 October.
Madsen, L., Lind, I., 1998. Adsorption of carboxylic acids on Reservoir minerals fromorganic and aqueous phase. SPE-37292-PA. SPE Reservoir Eval. Eng. 1 (01), 47–51.https://doi.org/10.2118/37292-PA.
Mamonov, A., Puntervold, T., Strand, S., 2017. EOR by smart water flooding in sandstonereservoirs - effect of sandstone mineralogy on initial wetting and oil recovery. In:SPE-187839-MS. SPE Russian Petroleum Technology Conference, Moscow, Russia,16–18 October. https://doi.org/10.2118/187839-MS.
Morrow, N., Buckley, J., 2011. Improved oil recovery by low-salinity waterflooding.J. Petrol. Technol. 63 (05), 106–112. https://doi.org/10.2118/129421-JPT.
Nasralla, R.A., Bataweel, M.A., Nasr-El-Din, H.A., 2011. Investigation of wettabilityalteration by low salinity water. In: SPE-146322-MS. Offshore Europe, Aberdeen, UK,6–8 September. https://doi.org/10.2118/146322-MS.
Pi~nerez Torrijos, I.D., Austad, T., Strand, S., Puntervold, T., Wrobel, S., Hamon, G., 2016a.Linking low salinity EOR effects in sandstone to pH, mineral properties and watercomposition. In: SPE-179625-MS. SPE Improved Oil Recovery Conference, Tulsa,Oklahoma, USA, 11–13 April. https://doi.org/10.2118/179625-MS.
Pi~nerez Torrijos, I.D., Puntervold, T., Strand, S., Austad, T., Abdullah, H.I., Olsen, K.,2016b. Experimental study of the response time of the low-salinity enhanced oilrecovery effect during secondary and tertiary low-salinity waterflooding. EnergyFuel. 30 (6), 4733–4739. https://doi.org/10.1021/acs.energyfuels.6b00641.
Pi~nerez Torrijos, I.D., Puntervold, T., Strand, S., Austad, T., Tran, V.V., Olsen, K., 2017.Impact of temperature on the low salinity EOR effect for sandstone cores containingreactive plagioclase. J. Petrol. Sci. Eng. 156, 102–109. https://doi.org/10.1016/j.petrol.2017.05.014.
Pi~nerez Torrijos, I.D., Puntervold, T., Strand, S., Rezaeidoust, A., 2016c. Optimizing thelow salinity water for EOR effects in sandstone reservoirs - composition vs salinity. In:78th EAGE Conference and Exhibition, Vienna, Austria, 30 May- 2 June. https://doi.org/10.3997/2214-4609.201600763.
Reinholdtsen, A.J., RezaeiDoust, A., Strand, S., Austad, T., 2011. Why such a small lowsalinity EOR - potential from the Snorre formation?. In: 16th European Symposiumon Improved Oil Recovery, Cambridge, UK, 12–14 April https://doi.org/10.3997/2214-4609.201404796.
RezaeiDoust, A., Puntervold, T., Austad, T., 2011. Chemical verification of the EORmechanism by using low saline/smart water in sandstone. Energy Fuel. 25 (5),2151–2162. https://doi.org/10.1021/ef200215y.
Robbana, E., Buikema, T.A., Mair, C., Williams, D., Mercer, D.J., Webb, K.J., Hewson, A.,Reddick, C.E., 2012. Low salinity enhanced oil recovery - laboratory to day one fieldimplementation - LoSal EOR into the clair ridge project. SPE-161750-MS. In: AbuDhabi International Petroleum Conference and Exhibition, Abu Dhabi, UAE, 11–14November. https://doi.org/10.2118/161750-MS.
Springer, N., Korsbech, U., Aage, H.K., 2003. Resistivity index measurement without theporous plate: a desaturation technique based on evaporation produces uniform watersaturation profiles and more reliable results for tight North Sea chalk. In:International Symposium of the Society of Core Analysts Pau, France, 21–24September.
Strand, S., Puntervold, T., Austad, T., 2016. Water based EOR from clastic oil reservoirsby wettability alteration: a review of chemical aspects. J. Petrol. Sci. Eng. 146,1079–1091. https://doi.org/10.1016/j.petrol.2016.08.012.
Z. Aghaeifar et al. Journal of Petroleum Science and Engineering 165 (2018) 743–751
751
125

126
Pap
er II
127
Paper II
“Significance of Capillary Forces during Low-Rate Waterflooding”, Z.
Aghaeifar, S. Strand, T. Austad, T. Puntervold. Energy Fuels, 2019, 33 (5),
pp 4747–4754. https://doi.org/10.1021/acs.energyfuels.9b00023
The remaining papers of this thesis are unfortunately not available in Brage due to copyright.

128

Pap
er II
I Paper III
“Seawater as a Smart Water in Sandstone reservoirs?”, Iván D. Piñerez
Torrijos, Zahra Aghaeifar, Tina Puntervold and Skule Strand. Manuscript
submitted to SPE Reservoir Evaluation & Engineering journal, 2019
139

140
Pap
er IV
Paper IV
“Low Salinity EOR Effects After Seawater Flooding In A High
Temperature And High Salinity Offshore Sandstone Reservoir”, Z.
Aghaeifar, T. Puntervold, S. Strand, T. Austad, B. Maghsoudi and J. C.
Ferreira, SPE-191334-MS, SPE Norwegian One Day Seminar, Bergen,
Norway, 2018. https://doi.org/10.2118/191334-MS
161

162
Pap
er V
Paper V
“Influence of Formation Water Salinity/Composition on the Low-
Salinity Enhanced Oil Recovery Effect in High-Temperature
Sandstone Reservoirs”, Z. Aghaeifar, S. Strand, T. Austad, T. Puntervold,
H. Aksulu, K. Navratil, S. Storås, and D. Håmsø. Energy Fuels, 2015, 29 (8), pp 4747–4754. https://doi.org/10.1021/acs.energyfuels.5b01621
179

180

Pap
er V
I
Paper VI
“The role of kaolinite clay minerals in EOR by low salinity water
injection”, T. Puntervold; A. Mamonov, Z. Aghaeifar, G. O. Frafjord, G.
M. Moldestad, S. Strand, T. Austad. Energy Fuels, 2018, 32 (7), pp 7374–
7382. https://doi.org/10.1021/acs.energyfuels.8b007
189

190
Pap
er V
II
Paper VII
“Adsorption/desorption of Ca2+ and Mg2+ to/from Kaolinite Clay in
Relation to the Low Salinity EOR Effect”, Z. Aghaeifar, S. Strand, T.
Puntervold, T. Austad, S. Aarnes and Ch. Aarnes. 18th European
Symposium on Improved Oil Recovery, At Dresden, Germany, April
2015. https://doi.org/10.3997/2214-4609.20
201

202
Related Documents