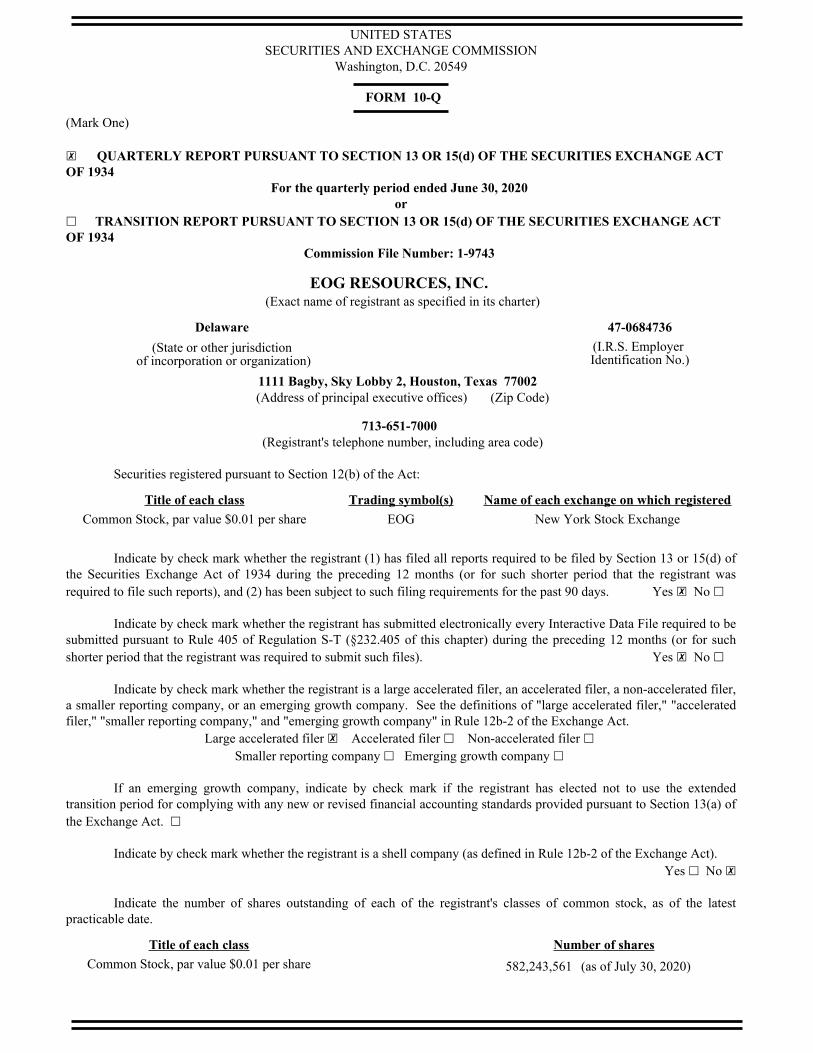
UNITED STATES SECURITIES AND EXCHANGE COMMISSION Washington, D.C. 20549 FORM 10-Q (Mark One) ☒ QUARTERLY REPORT PURSUANT TO SECTION 13 OR 15(d) OF THE SECURITIES EXCHANGE ACT OF 1934 For the quarterly period ended June 30, 2020 or ☐ TRANSITION REPORT PURSUANT TO SECTION 13 OR 15(d) OF THE SECURITIES EXCHANGE ACT OF 1934 Commission File Number: 1-9743 EOG RESOURCES, INC. (Exact name of registrant as specified in its charter) Delaware 47-0684736 (State or other jurisdiction of incorporation or organization) (I.R.S. Employer Identification No.) 1111 Bagby, Sky Lobby 2, Houston, Texas 77002 (Address of principal executive offices) (Zip Code) 713-651-7000 (Registrant's telephone number, including area code) Securities registered pursuant to Section 12(b) of the Act: Title of each class Trading symbol(s) Name of each exchange on which registered Common Stock, par value $0.01 per share EOG New York Stock Exchange Indicate by check mark whether the registrant (1) has filed all reports required to be filed by Section 13 or 15(d) of the Securities Exchange Act of 1934 during the preceding 12 months (or for such shorter period that the registrant was required to file such reports), and (2) has been subject to such filing requirements for the past 90 days. Yes ☒ No ☐ Indicate by check mark whether the registrant has submitted electronically every Interactive Data File required to be submitted pursuant to Rule 405 of Regulation S-T (§232.405 of this chapter) during the preceding 12 months (or for such shorter period that the registrant was required to submit such files). Yes ☒ No ☐ Indicate by check mark whether the registrant is a large accelerated filer, an accelerated filer, a non-accelerated filer, a smaller reporting company, or an emerging growth company. See the definitions of "large accelerated filer," "accelerated filer," "smaller reporting company," and "emerging growth company" in Rule 12b-2 of the Exchange Act. Large accelerated filer ☒ Accelerated filer ☐ Non-accelerated filer ☐ Smaller reporting company ☐ Emerging growth company ☐ If an emerging growth company, indicate by check mark if the registrant has elected not to use the extended transition period for complying with any new or revised financial accounting standards provided pursuant to Section 13(a) of the Exchange Act. ☐ Indicate by check mark whether the registrant is a shell company (as defined in Rule 12b-2 of the Exchange Act). Yes ☐ No ☒ Indicate the number of shares outstanding of each of the registrant's classes of common stock, as of the latest practicable date. Title of each class Number of shares Common Stock, par value $0.01 per share 582,243,561 (as of July 30, 2020)

Welcome message from author
This document is posted to help you gain knowledge. Please leave a comment to let me know what you think about it! Share it to your friends and learn new things together.
Transcript
UNITED STATESSECURITIES AND EXCHANGE COMMISSION
Washington, D.C. 20549
FORM 10-Q (Mark One)
☒ QUARTERLY REPORT PURSUANT TO SECTION 13 OR 15(d) OF THE SECURITIES EXCHANGE ACT OF 1934
For the quarterly period ended June 30, 2020 or
☐ TRANSITION REPORT PURSUANT TO SECTION 13 OR 15(d) OF THE SECURITIES EXCHANGE ACT OF 1934
Commission File Number: 1-9743
EOG RESOURCES, INC. (Exact name of registrant as specified in its charter)
Delaware 47-0684736(State or other jurisdiction
of incorporation or organization) (I.R.S. Employer
Identification No.)1111 Bagby, Sky Lobby 2, Houston, Texas 77002
(Address of principal executive offices) (Zip Code)
713-651-7000 (Registrant's telephone number, including area code)
Securities registered pursuant to Section 12(b) of the Act:
Title of each class Trading symbol(s) Name of each exchange on which registeredCommon Stock, par value $0.01 per share EOG New York Stock Exchange
Indicate by check mark whether the registrant (1) has filed all reports required to be filed by Section 13 or 15(d) of the Securities Exchange Act of 1934 during the preceding 12 months (or for such shorter period that the registrant was required to file such reports), and (2) has been subject to such filing requirements for the past 90 days. Yes ☒ No ☐
Indicate by check mark whether the registrant has submitted electronically every Interactive Data File required to be submitted pursuant to Rule 405 of Regulation S-T (§232.405 of this chapter) during the preceding 12 months (or for such shorter period that the registrant was required to submit such files). Yes ☒ No ☐
Indicate by check mark whether the registrant is a large accelerated filer, an accelerated filer, a non-accelerated filer, a smaller reporting company, or an emerging growth company. See the definitions of "large accelerated filer," "accelerated filer," "smaller reporting company," and "emerging growth company" in Rule 12b-2 of the Exchange Act.
Large accelerated filer ☒ Accelerated filer ☐ Non-accelerated filer ☐ Smaller reporting company ☐ Emerging growth company ☐
If an emerging growth company, indicate by check mark if the registrant has elected not to use the extended transition period for complying with any new or revised financial accounting standards provided pursuant to Section 13(a) of the Exchange Act. ☐
Indicate by check mark whether the registrant is a shell company (as defined in Rule 12b-2 of the Exchange Act). Yes ☐ No ☒
Indicate the number of shares outstanding of each of the registrant's classes of common stock, as of the latest practicable date.
Title of each class Number of sharesCommon Stock, par value $0.01 per share 582,243,561 (as of July 30, 2020)
EOG RESOURCES, INC.
TABLE OF CONTENTS
PART I. FINANCIAL INFORMATION Page No. ITEM 1. Financial Statements (Unaudited) Condensed Consolidated Statements of Income (Loss) and Comprehensive Income (Loss) -
Three Months and Six Months Ended June 30, 2020 and 2019 3 Condensed Consolidated Balance Sheets - June 30, 2020 and December 31, 2019 4
Condensed Consolidated Statements of Stockholders' Equity - Three Months and Six Months Ended June 30, 2020 and 2019
5
Condensed Consolidated Statements of Cash Flows - Six Months Ended June 30, 2020 and 2019 7
Notes to Condensed Consolidated Financial Statements 8 ITEM 2. Management's Discussion and Analysis of Financial Condition and Results of Operations 22 ITEM 3. Quantitative and Qualitative Disclosures About Market Risk 44 ITEM 4. Controls and Procedures 44 PART II. OTHER INFORMATION ITEM 1. Legal Proceedings 45
ITEM 1A. Risk Factors 45 ITEM 2. Unregistered Sales of Equity Securities and Use of Proceeds 46 ITEM 4. Mine Safety Disclosures 46 ITEM 6. Exhibits 47 SIGNATURES 49
-2-
PART I. FINANCIAL INFORMATIONITEM 1. FINANCIAL STATEMENTS
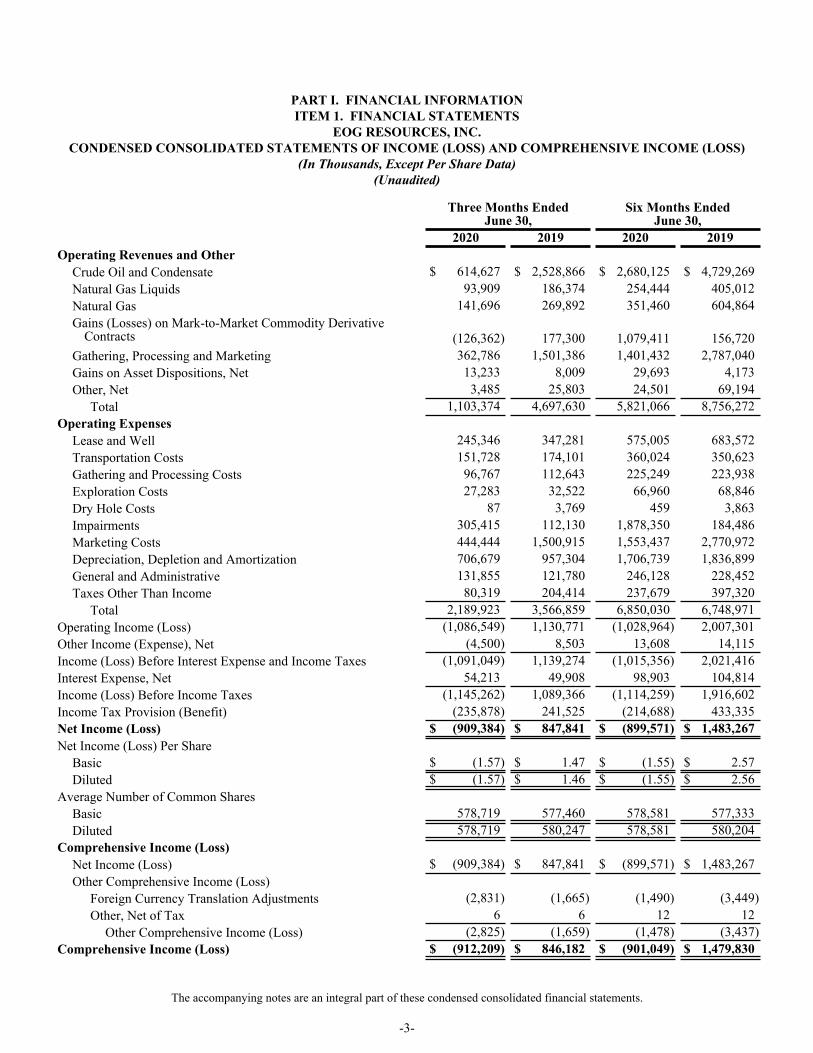
EOG RESOURCES, INC.CONDENSED CONSOLIDATED STATEMENTS OF INCOME (LOSS) AND COMPREHENSIVE INCOME (LOSS)
(In Thousands, Except Per Share Data)(Unaudited)
Three Months EndedJune 30,
Six Months EndedJune 30,
2020 2019 2020 2019Operating Revenues and Other
Crude Oil and Condensate $ 614,627 $ 2,528,866 $ 2,680,125 $ 4,729,269 Natural Gas Liquids 93,909 186,374 254,444 405,012 Natural Gas 141,696 269,892 351,460 604,864 Gains (Losses) on Mark-to-Market Commodity Derivative
Contracts (126,362) 177,300 1,079,411 156,720 Gathering, Processing and Marketing 362,786 1,501,386 1,401,432 2,787,040 Gains on Asset Dispositions, Net 13,233 8,009 29,693 4,173 Other, Net 3,485 25,803 24,501 69,194
Total 1,103,374 4,697,630 5,821,066 8,756,272 Operating Expenses
Lease and Well 245,346 347,281 575,005 683,572 Transportation Costs 151,728 174,101 360,024 350,623 Gathering and Processing Costs 96,767 112,643 225,249 223,938 Exploration Costs 27,283 32,522 66,960 68,846 Dry Hole Costs 87 3,769 459 3,863 Impairments 305,415 112,130 1,878,350 184,486 Marketing Costs 444,444 1,500,915 1,553,437 2,770,972 Depreciation, Depletion and Amortization 706,679 957,304 1,706,739 1,836,899 General and Administrative 131,855 121,780 246,128 228,452 Taxes Other Than Income 80,319 204,414 237,679 397,320
Total 2,189,923 3,566,859 6,850,030 6,748,971 Operating Income (Loss) (1,086,549) 1,130,771 (1,028,964) 2,007,301 Other Income (Expense), Net (4,500) 8,503 13,608 14,115 Income (Loss) Before Interest Expense and Income Taxes (1,091,049) 1,139,274 (1,015,356) 2,021,416 Interest Expense, Net 54,213 49,908 98,903 104,814 Income (Loss) Before Income Taxes (1,145,262) 1,089,366 (1,114,259) 1,916,602 Income Tax Provision (Benefit) (235,878) 241,525 (214,688) 433,335 Net Income (Loss) $ (909,384) $ 847,841 $ (899,571) $ 1,483,267 Net Income (Loss) Per Share
Basic $ (1.57) $ 1.47 $ (1.55) $ 2.57 Diluted $ (1.57) $ 1.46 $ (1.55) $ 2.56
Average Number of Common Shares Basic 578,719 577,460 578,581 577,333 Diluted 578,719 580,247 578,581 580,204
Comprehensive Income (Loss) Net Income (Loss) $ (909,384) $ 847,841 $ (899,571) $ 1,483,267 Other Comprehensive Income (Loss)
Foreign Currency Translation Adjustments (2,831) (1,665) (1,490) (3,449) Other, Net of Tax 6 6 12 12
Other Comprehensive Income (Loss) (2,825) (1,659) (1,478) (3,437) Comprehensive Income (Loss) $ (912,209) $ 846,182 $ (901,049) $ 1,479,830
The accompanying notes are an integral part of these condensed consolidated financial statements.
-3-

EOG RESOURCES, INC.CONDENSED CONSOLIDATED BALANCE SHEETS
(In Thousands, Except Share Data)(Unaudited)
June 30,2020
December 31,2019
ASSETSCurrent Assets
Cash and Cash Equivalents $ 2,416,501 $ 2,027,972 Accounts Receivable, Net 943,354 2,001,658 Inventories 676,580 767,297 Assets from Price Risk Management Activities 207,019 1,299 Income Taxes Receivable 196,958 151,665 Other 156,979 323,448
Total 4,597,391 5,273,339 Property, Plant and Equipment
Oil and Gas Properties (Successful Efforts Method) 64,406,245 62,830,415 Other Property, Plant and Equipment 4,665,815 4,472,246
Total Property, Plant and Equipment 69,072,060 67,302,661 Less: Accumulated Depreciation, Depletion and Amortization (39,838,595) (36,938,066)
Total Property, Plant and Equipment, Net 29,233,465 30,364,595 Deferred Income Taxes 1,846 2,363 Other Assets 1,388,969 1,484,311 Total Assets $ 35,221,671 $ 37,124,608
LIABILITIES AND STOCKHOLDERS' EQUITYCurrent Liabilities
Accounts Payable $ 1,281,166 $ 2,429,127 Accrued Taxes Payable 193,763 254,850 Dividends Payable 217,004 166,273 Liabilities from Price Risk Management Activities — 20,194 Current Portion of Long-Term Debt 21,121 1,014,524 Current Portion of Operating Lease Liabilities 252,642 369,365 Other 188,685 232,655
Total 2,154,381 4,486,988
Long-Term Debt 5,703,141 4,160,919 Other Liabilities 2,138,696 1,789,884 Deferred Income Taxes 4,837,896 5,046,101 Commitments and Contingencies (Note 8)
Stockholders' Equity Common Stock, $0.01 Par, 1,280,000,000 Shares Authorized and 582,386,619 Shares
Issued at June 30, 2020 and 582,213,016 Shares Issued at December 31, 2019 205,824 205,822 Additional Paid in Capital 5,886,298 5,817,475 Accumulated Other Comprehensive Loss (6,130) (4,652) Retained Earnings 14,312,493 15,648,604
Common Stock Held in Treasury, 142,025 Shares at June 30, 2020 and 298,820 Shares at December 31, 2019 (10,928) (26,533)
Total Stockholders' Equity 20,387,557 21,640,716 Total Liabilities and Stockholders' Equity $ 35,221,671 $ 37,124,608
The accompanying notes are an integral part of these condensed consolidated financial statements.
-4-

EOG RESOURCES, INC.CONDENSED CONSOLIDATED STATEMENTS OF STOCKHOLDERS' EQUITY
(In Thousands, Except Per Share Data)(Unaudited)
CommonStock
AdditionalPaid InCapital
AccumulatedOther
ComprehensiveIncome (Loss)
RetainedEarnings
CommonStock
Held InTreasury
TotalStockholders'
EquityBalance at March 31, 2020 $ 205,824 $ 5,852,821 $ (3,305) $ 15,440,142 $ (24,807) $ 21,470,675 Net Loss — — — (909,384) — (909,384) Common Stock Issued Under Stock Plans — — — — — — Common Stock Dividends Declared,
$0.375 Per Share — — — (218,265) — (218,265) Other Comprehensive Loss — — (2,825) — — (2,825) Change in Treasury Stock - Stock
Compensation Plans, Net — (6,635) — — 14,872 8,237 Restricted Stock and Restricted Stock
Units, Net — 541 — — (541) — Stock-Based Compensation Expenses — 39,571 — — — 39,571 Treasury Stock Issued as Compensation — — — — (452) (452)
Balance at June 30, 2020 $ 205,824 $ 5,886,298 $ (6,130) $ 14,312,493 $ (10,928) $ 20,387,557
CommonStock
AdditionalPaid InCapital
AccumulatedOther
ComprehensiveIncome (Loss)
RetainedEarnings
CommonStock
Held InTreasury
TotalStockholders'
EquityBalance at March 31, 2019 $ 205,807 $ 5,695,197 $ (2,869) $ 14,050,676 $ (45,014) $ 19,903,797 Net Income — — — 847,841 — 847,841 Common Stock Issued Under Stock Plans — — — — — — Common Stock Dividends Declared,
$0.2875 Per Share — — — (166,908) — (166,908) Other Comprehensive Loss — — (1,659) — — (1,659) Change in Treasury Stock - Stock
Compensation Plans, Net — (5,834) — — 12,027 6,193 Restricted Stock and Restricted Stock
Units, Net 2 1,788 — — (1,790) — Stock-Based Compensation Expenses — 38,566 — — — 38,566 Treasury Stock Issued as Compensation — (399) — — 2,845 2,446
Balance at June 30, 2019 $ 205,809 $ 5,729,318 $ (4,528) $ 14,731,609 $ (31,932) $ 20,630,276
The accompanying notes are an integral part of these condensed consolidated financial statements.
-5-

EOG RESOURCES, INC.CONDENSED CONSOLIDATED STATEMENTS OF STOCKHOLDERS' EQUITY
(In Thousands, Except Per Share Data)(Unaudited)
CommonStock
AdditionalPaid InCapital
AccumulatedOther
ComprehensiveIncome (Loss)
RetainedEarnings
CommonStock
Held InTreasury
TotalStockholders'
EquityBalance at December 31, 2019 $ 205,822 $ 5,817,475 $ (4,652) $ 15,648,604 $ (26,533) $ 21,640,716 Net Loss — — — (899,571) — (899,571) Common Stock Issued Under Stock Plans — (14) — — — (14) Common Stock Dividends Declared,
$0.75 Per Share — — — (436,540) — (436,540) Other Comprehensive Loss — — (1,478) — — (1,478) Change in Treasury Stock - Stock
Compensation Plans, Net — (7,011) — — 10,673 3,662 Restricted Stock and Restricted Stock
Units, Net 2 (3,415) — — 3,413 — Stock-Based Compensation Expenses — 79,643 — — — 79,643 Treasury Stock Issued as Compensation — (380) — — 1,519 1,139
Balance at June 30, 2020 $ 205,824 $ 5,886,298 $ (6,130) $ 14,312,493 $ (10,928) $ 20,387,557
CommonStock
AdditionalPaid InCapital
AccumulatedOther
ComprehensiveIncome (Loss)
RetainedEarnings
CommonStock
Held InTreasury
TotalStockholders'
EquityBalance at December 31, 2018 $ 205,804 $ 5,658,794 $ (1,358) $ 13,543,130 $ (42,182) $ 19,364,188 Net Income — — — 1,483,267 — 1,483,267 Common Stock Issued Under Stock Plans — — — — — — Common Stock Dividends Declared,
$0.5075 Per Share — — — (294,521) — (294,521) Other Comprehensive Loss — — (3,437) — — (3,437) Change in Treasury Stock - Stock
Compensation Plans, Net — (7,074) — — 7,478 404 Restricted Stock and Restricted Stock
Units, Net 5 384 — — (389) — Stock-Based Compensation Expenses — 77,653 — — — 77,653 Treasury Stock Issued as Compensation — (439) — — 3,161 2,722 Cumulative Effect of Adoption of ASU
2018-02, "Income Statement - Reporting Comprehensive Income (Topic 220)" — — 267 (267) — —
Balance at June 30, 2019 $ 205,809 $ 5,729,318 $ (4,528) $ 14,731,609 $ (31,932) $ 20,630,276
The accompanying notes are an integral part of these condensed consolidated financial statements.
-6-
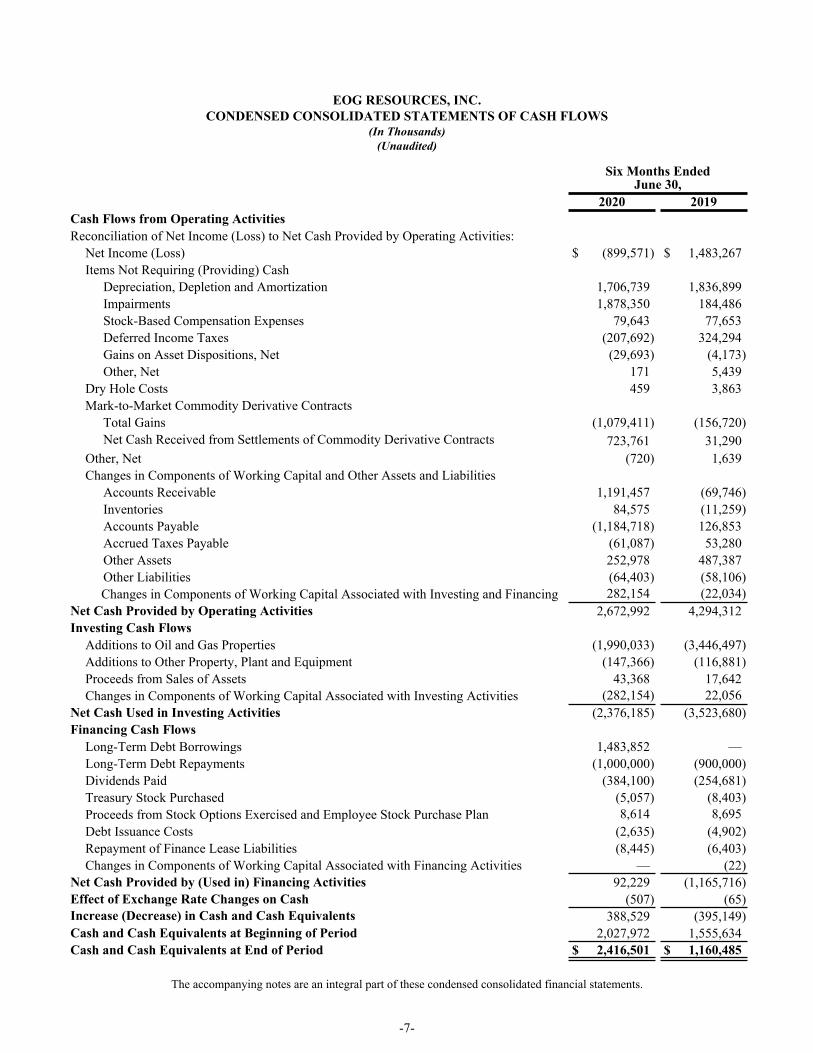
EOG RESOURCES, INC.CONDENSED CONSOLIDATED STATEMENTS OF CASH FLOWS
(In Thousands)(Unaudited)
Six Months EndedJune 30,
2020 2019Cash Flows from Operating ActivitiesReconciliation of Net Income (Loss) to Net Cash Provided by Operating Activities:
Net Income (Loss) $ (899,571) $ 1,483,267 Items Not Requiring (Providing) Cash
Depreciation, Depletion and Amortization 1,706,739 1,836,899 Impairments 1,878,350 184,486 Stock-Based Compensation Expenses 79,643 77,653 Deferred Income Taxes (207,692) 324,294 Gains on Asset Dispositions, Net (29,693) (4,173) Other, Net 171 5,439
Dry Hole Costs 459 3,863 Mark-to-Market Commodity Derivative Contracts
Total Gains (1,079,411) (156,720) Net Cash Received from Settlements of Commodity Derivative Contracts 723,761 31,290
Other, Net (720) 1,639 Changes in Components of Working Capital and Other Assets and Liabilities
Accounts Receivable 1,191,457 (69,746) Inventories 84,575 (11,259) Accounts Payable (1,184,718) 126,853 Accrued Taxes Payable (61,087) 53,280 Other Assets 252,978 487,387 Other Liabilities (64,403) (58,106) Changes in Components of Working Capital Associated with Investing and Financing
Activities 282,154 (22,034)
Net Cash Provided by Operating Activities 2,672,992 4,294,312 Investing Cash Flows
Additions to Oil and Gas Properties (1,990,033) (3,446,497) Additions to Other Property, Plant and Equipment (147,366) (116,881) Proceeds from Sales of Assets 43,368 17,642 Changes in Components of Working Capital Associated with Investing Activities (282,154) 22,056
Net Cash Used in Investing Activities (2,376,185) (3,523,680) Financing Cash Flows
Long-Term Debt Borrowings 1,483,852 — Long-Term Debt Repayments (1,000,000) (900,000) Dividends Paid (384,100) (254,681) Treasury Stock Purchased (5,057) (8,403) Proceeds from Stock Options Exercised and Employee Stock Purchase Plan 8,614 8,695 Debt Issuance Costs (2,635) (4,902) Repayment of Finance Lease Liabilities (8,445) (6,403) Changes in Components of Working Capital Associated with Financing Activities — (22)
Net Cash Provided by (Used in) Financing Activities 92,229 (1,165,716) Effect of Exchange Rate Changes on Cash (507) (65) Increase (Decrease) in Cash and Cash Equivalents 388,529 (395,149) Cash and Cash Equivalents at Beginning of Period 2,027,972 1,555,634 Cash and Cash Equivalents at End of Period $ 2,416,501 $ 1,160,485
The accompanying notes are an integral part of these condensed consolidated financial statements.
-7-
1. Summary of Significant Accounting Policies
General. The condensed consolidated financial statements of EOG Resources, Inc., together with its subsidiaries (collectively, EOG), included herein have been prepared by management without audit pursuant to the rules and regulations of the United States Securities and Exchange Commission (SEC). Accordingly, they reflect all normal recurring adjustments which are, in the opinion of management, necessary for a fair presentation of the financial results for the interim periods presented. Certain information and notes normally included in financial statements prepared in accordance with accounting principles generally accepted in the United States of America (U.S. GAAP) have been condensed or omitted pursuant to such rules and regulations. However, management believes that the disclosures included either on the face of the financial statements or in these notes are sufficient to make the interim information presented not misleading. These condensed consolidated financial statements should be read in conjunction with the consolidated financial statements and the notes thereto included in EOG's Annual Report on Form 10-K for the year ended December 31, 2019, filed on February 27, 2020 (EOG's 2019 Annual Report).
The preparation of financial statements in conformity with U.S. GAAP requires management to make estimates and assumptions that affect the reported amounts of assets and liabilities and disclosure of contingent assets and liabilities at the date of the financial statements and the reported amounts of revenues and expenses during the reporting period. Actual results could differ from those estimates. The operating results for the three and six months ended June 30, 2020, are not necessarily indicative of the results to be expected for the full year.
Effective January 1, 2020, EOG adopted the provisions of Accounting Standards Update (ASU) 2016-13, "Measurement of Credit Losses on Financial Instruments" (ASU 2016-13). ASU 2016-13 changes the impairment model for financial assets and certain other instruments by requiring entities to adopt a forward-looking expected loss model that will result in earlier recognition of credit losses. EOG elected to adopt ASU 2016-13 using the modified retrospective approach with a cumulative-effect adjustment to retained earnings as of the effective date. Financial results reported in periods prior to January 1, 2020, are unchanged. EOG assessed its applicable financial assets, which are primarily its accounts receivable from hydrocarbon sales and joint interest billings to third-party companies, including foreign state-owned entities in the oil and gas industry. Based on its assessment and various potential remedies ensuring collection, EOG did not record an impact to retained earnings upon adoption and expects current and future credit losses to be immaterial. EOG continues to monitor the credit risk from third-party companies to determine if expected credit losses may become material.
Recently Issued Accounting Standards. In March 2020, the Financial Accounting Standards Board (FASB) issued ASU 2020-04, "Reference Rate Reform (Topic 848)" (ASU 2020-04), which provides optional expedients and exceptions for accounting treatment of contracts which are affected by the anticipated discontinuation of the London InterBank Offered Rate (LIBOR) and other rates resulting from rate reform. Contract terms that are modified due to the replacement of a reference rate are not required to be remeasured or reassessed under relevant accounting standards. Early adoption is permitted. ASU 2020-04 covers certain contracts which reference these rates and that are entered into on or before December 31, 2022. EOG is evaluating the provisions of ASU 2020-04 and has not determined the full impact on its consolidated financial statements and related disclosures related to its $2.0 billion senior unsecured Revolving Credit Agreement.
In December 2019, the FASB issued ASU 2019-12, "Income Taxes (Topic 740) Simplifying the Accounting for Income Taxes" (ASU 2019-12), which amends certain aspects of accounting for income taxes. ASU 2019-12 removes specific exceptions within existing U.S. GAAP related to the incremental approach for intraperiod tax allocation and to the general methodology for calculating income taxes in interim periods, among other changes. ASU 2019-12 also requires an entity to reflect the effect of an enacted change in tax laws or rates in the annual effective tax rate computation in the interim period that includes the enactment date, among other requirements. ASU 2019-12 is effective for interim and annual periods beginning after December 15, 2020, and early adoption is permitted. EOG is continuing to evaluate the provisions of ASU 2019-12 and has not determined the full impact on its consolidated financial statements and related disclosures.
EOG RESOURCES, INC.NOTES TO CONDENSED CONSOLIDATED FINANCIAL STATEMENTS
(Unaudited)
-8-
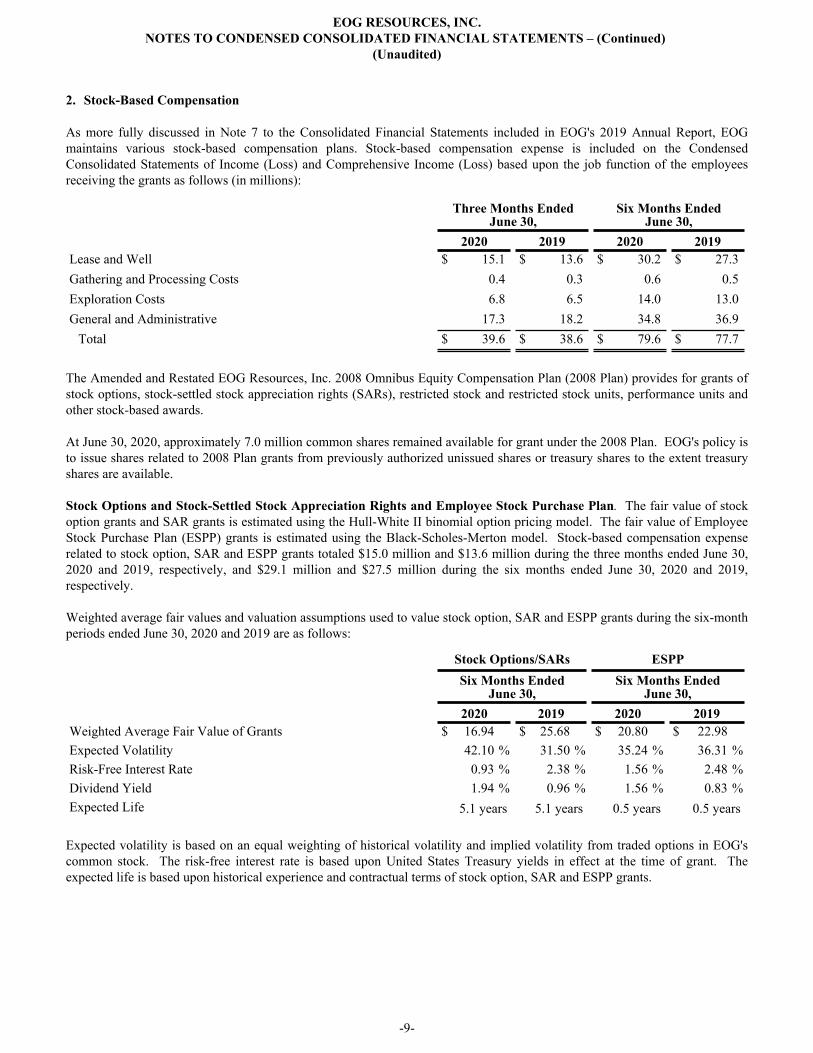
2. Stock-Based Compensation
As more fully discussed in Note 7 to the Consolidated Financial Statements included in EOG's 2019 Annual Report, EOG maintains various stock-based compensation plans. Stock-based compensation expense is included on the Condensed Consolidated Statements of Income (Loss) and Comprehensive Income (Loss) based upon the job function of the employees receiving the grants as follows (in millions):
Three Months EndedJune 30,
Six Months EndedJune 30,
2020 2019 2020 2019Lease and Well $ 15.1 $ 13.6 $ 30.2 $ 27.3 Gathering and Processing Costs 0.4 0.3 0.6 0.5 Exploration Costs 6.8 6.5 14.0 13.0 General and Administrative 17.3 18.2 34.8 36.9
Total $ 39.6 $ 38.6 $ 79.6 $ 77.7
The Amended and Restated EOG Resources, Inc. 2008 Omnibus Equity Compensation Plan (2008 Plan) provides for grants of stock options, stock-settled stock appreciation rights (SARs), restricted stock and restricted stock units, performance units and other stock-based awards.
At June 30, 2020, approximately 7.0 million common shares remained available for grant under the 2008 Plan. EOG's policy is to issue shares related to 2008 Plan grants from previously authorized unissued shares or treasury shares to the extent treasury shares are available.
Stock Options and Stock-Settled Stock Appreciation Rights and Employee Stock Purchase Plan. The fair value of stock option grants and SAR grants is estimated using the Hull-White II binomial option pricing model. The fair value of Employee Stock Purchase Plan (ESPP) grants is estimated using the Black-Scholes-Merton model. Stock-based compensation expense related to stock option, SAR and ESPP grants totaled $15.0 million and $13.6 million during the three months ended June 30, 2020 and 2019, respectively, and $29.1 million and $27.5 million during the six months ended June 30, 2020 and 2019, respectively.
Weighted average fair values and valuation assumptions used to value stock option, SAR and ESPP grants during the six-month periods ended June 30, 2020 and 2019 are as follows:
Stock Options/SARs ESPPSix Months Ended
June 30,Six Months Ended
June 30, 2020 2019 2020 2019Weighted Average Fair Value of Grants $ 16.94 $ 25.68 $ 20.80 $ 22.98 Expected Volatility 42.10 % 31.50 % 35.24 % 36.31 %Risk-Free Interest Rate 0.93 % 2.38 % 1.56 % 2.48 %Dividend Yield 1.94 % 0.96 % 1.56 % 0.83 %Expected Life 5.1 years 5.1 years 0.5 years 0.5 years
Expected volatility is based on an equal weighting of historical volatility and implied volatility from traded options in EOG's common stock. The risk-free interest rate is based upon United States Treasury yields in effect at the time of grant. The expected life is based upon historical experience and contractual terms of stock option, SAR and ESPP grants.
EOG RESOURCES, INC.NOTES TO CONDENSED CONSOLIDATED FINANCIAL STATEMENTS – (Continued)
(Unaudited)
-9-

The following table sets forth stock option and SAR transactions for the six-month periods ended June 30, 2020 and 2019 (stock options and SARs in thousands):
Six Months EndedJune 30, 2020
Six Months EndedJune 30, 2019
Number ofStock
Options/SARs
WeightedAverageGrantPrice
Number ofStock
Options/SARs
WeightedAverageGrantPrice
Outstanding at January 1 9,395 $ 94.53 8,310 $ 96.90 Granted 16 58.40 32 93.29 Exercised (1) (23) 69.59 (157) 73.39 Forfeited (389) 91.39 (107) 105.47 Outstanding at June 30 (2) 8,999 $ 94.66 8,078 $ 97.23 Vested or Expected to Vest (3) 8,670 $ 94.67 7,741 $ 96.78 Exercisable at June 30 (4) 4,963 $ 94.61 3,905 $ 86.71
(1) The total intrinsic value of stock options/SARs exercised during the six months ended June 30, 2020 and 2019 was $0.4 million and $3.9 million, respectively. The intrinsic value is based upon the difference between the market price of EOG's common stock on the date of exercise and the grant price of the stock options/SARs.
(2) The total intrinsic value of stock options/SARs outstanding at June 30, 2020 and 2019 was $0.1 million and $45.0 million, respectively. At June 30, 2020 and 2019, the weighted average remaining contractual life was 3.9 years and 4.0 years, respectively.
(3) The total intrinsic value of stock options/SARs vested or expected to vest at June 30, 2020 and 2019 was $0.1 million and $44.4 million, respectively. At June 30, 2020 and 2019, the weighted average remaining contractual life was 3.9 years and 3.9 years, respectively.
(4) The total intrinsic value of stock options/SARs exercisable at June 30, 2020 and 2019 was zero and $37.1 million, respectively. At June 30, 2020 and 2019, the weighted average remaining contractual life was 2.7 years and 2.5 years, respectively.
At June 30, 2020, unrecognized compensation expense related to non-vested stock option, SAR and ESPP grants totaled $61.6 million. Such unrecognized expense will be amortized on a straight-line basis over a weighted average period of 1.5 years.
Restricted Stock and Restricted Stock Units. Employees may be granted restricted (non-vested) stock and/or restricted stock units without cost to them. Stock-based compensation expense related to restricted stock and restricted stock units totaled $23.4 million and $23.1 million for the three months ended June 30, 2020 and 2019, respectively, and $48.2 million and $46.4 million for the six months ended June 30, 2020 and 2019, respectively.
The following table sets forth restricted stock and restricted stock unit transactions for the six-month periods ended June 30, 2020 and 2019 (shares and units in thousands):
Six Months EndedJune 30, 2020
Six Months EndedJune 30, 2019
Number ofShares and
Units
WeightedAverage
Grant DateFair Value
Number ofShares and
Units
WeightedAverage
Grant DateFair Value
Outstanding at January 1 4,546 $ 90.16 3,792 $ 96.64 Granted 67 51.83 401 96.22 Released (1) (304) 88.58 (395) 93.84 Forfeited (36) 90.61 (68) 98.27 Outstanding at June 30 (2) 4,273 $ 89.67 3,730 $ 96.86
(1) The total intrinsic value of restricted stock and restricted stock units released during the six months ended June 30, 2020 and 2019 was $13.1 million and $35.7 million, respectively. The intrinsic value is based upon the closing price of EOG's common stock on the date the restricted stock and restricted stock units are released.
(2) The total intrinsic value of restricted stock and restricted stock units outstanding at June 30, 2020 and 2019 was $216.5 million and $347.5 million, respectively.
EOG RESOURCES, INC.NOTES TO CONDENSED CONSOLIDATED FINANCIAL STATEMENTS – (Continued)
(Unaudited)
-10-

At June 30, 2020, unrecognized compensation expense related to restricted stock and restricted stock units totaled $154.2 million. Such unrecognized expense will be amortized on a straight-line basis over a weighted average period of 1.4 years.
Performance Units. EOG grants performance units annually to its executive officers without cost to them. As more fully discussed in the grant agreements, the performance metric applicable to the performance units is EOG's total shareholder return over a three-year performance period relative to the total shareholder return of a designated group of peer companies (Performance Period). Upon the application of the performance multiple at the completion of the Performance Period, a minimum of 0% and a maximum of 200% of the performance units granted could be outstanding. The fair value of the performance units is estimated using a Monte Carlo simulation. Stock-based compensation expense related to the performance unit grants totaled $1.2 million and $1.9 million for the three months ended June 30, 2020 and 2019, respectively, and $2.3 million and $3.8 million for the six months ended June 30, 2020 and 2019, respectively.
The following table sets forth the performance unit transactions for the six-month periods ended June 30, 2020 and 2019 (units in thousands):
Six Months EndedJune 30, 2020
Six Months EndedJune 30, 2019
Number ofUnits
WeightedAveragePrice per
Grant DateNumber of
Units
WeightedAveragePrice per
Grant DateOutstanding at January 1 598 $ 92.19 539 $ 101.53 Granted — — — — Granted for Performance Multiple (1) 66 100.95 72 69.43 Released (2) (121) 104.69 (83) 85.65 Forfeited — — — — Outstanding at June 30 (3) 543 (4) $ 90.48 528 $ 99.64
(1) Upon completion of the Performance Period for the performance units granted in 2016 and 2015, a performance multiple of 150% and 200%, respectively, was applied to each of the grants resulting in additional grants of performance units in February 2020 and February 2019, respectively.
(2) The total intrinsic value of performance units released during the six months ended June 30, 2020 and 2019 was $9.0 million and $7.7 million, respectively. The intrinsic value is based upon the closing price of EOG's common stock on the date the performance units are released.
(3) The total intrinsic value of performance units outstanding at June 30, 2020 and 2019 was approximately $27.5 million and $49.2 million, respectively.
(4) Upon the application of the relevant performance multiple at the completion of each of the remaining Performance Periods, a minimum of 179 and a maximum of 907 performance units could be outstanding.
At June 30, 2020, unrecognized compensation expense related to performance units totaled $6.4 million. Such unrecognized expense will be amortized on a straight-line basis over a weighted average period of 1.7 years.
EOG RESOURCES, INC.NOTES TO CONDENSED CONSOLIDATED FINANCIAL STATEMENTS – (Continued)
(Unaudited)
-11-

3. Net Income (Loss) Per Share
The following table sets forth the computation of Net Income (Loss) Per Share for the three-month and six-month periods ended June 30, 2020 and 2019 (in thousands, except per share data):
Three Months EndedJune 30,
Six Months EndedJune 30,
2020 2019 2020 2019Numerator for Basic and Diluted Earnings Per Share -
Net Income (Loss) $ (909,384) $ 847,841 $ (899,571) $ 1,483,267 Denominator for Basic Earnings Per Share -
Weighted Average Shares 578,719 577,460 578,581 577,333 Potential Dilutive Common Shares -
Stock Options/SARs/ESPP — 434 — 452 Restricted Stock/Units and Performance Units — 2,353 — 2,419
Denominator for Diluted Earnings Per Share - Adjusted Diluted Weighted Average Shares 578,719 580,247 578,581 580,204
Net Income (Loss) Per Share Basic $ (1.57) $ 1.47 $ (1.55) $ 2.57 Diluted $ (1.57) $ 1.46 $ (1.55) $ 2.56
The diluted earnings per share calculation excludes stock options, SARs, restricted stock, restricted stock units and performance units and ESPP grants that were anti-dilutive. Shares underlying the excluded stock options, SARs and ESPP grants were 9.3 million and 6.0 million shares for the three months ended June 30, 2020 and 2019, respectively, and were 9.3 million and 6.0 million shares for the six months ended June 30, 2020 and 2019, respectively. For the three and six months ended June 30, 2020, 4.8 million shares of restricted stock, restricted stock units and performance units were excluded.
4. Supplemental Cash Flow Information
Net cash paid (received) for interest and income taxes was as follows for the six-month periods ended June 30, 2020 and 2019 (in thousands):
Six Months EndedJune 30,
2020 2019Interest (1) $ 68,730 $ 108,994 Income Taxes, Net of Refunds Received $ (76,489) $ (331,778)
(1) Net of capitalized interest of $17 million and $18 million for the six months ended June 30, 2020 and 2019, respectively.
EOG's accrued capital expenditures at June 30, 2020 and 2019 were $246 million and $626 million, respectively.
Non-cash investing activities for the six months ended June 30, 2020 and 2019, included additions of $55 million and $72 million, respectively, to EOG's oil and gas properties as a result of property exchanges. Non-cash investing activities for the six months ended June 30, 2020 included additions of $73 million to EOG's other property, plant and equipment primarily in connection with a finance lease transaction.
EOG RESOURCES, INC.NOTES TO CONDENSED CONSOLIDATED FINANCIAL STATEMENTS – (Continued)
(Unaudited)
-12-

5. Segment Information
Selected financial information by reportable segment is presented below for the three-month and six-month periods ended June 30, 2020 and 2019 (in thousands):
Three Months EndedJune 30,
Six Months EndedJune 30,
2020 2019 2020 2019Operating Revenues and Other
United States $ 1,055,673 $ 4,611,789 $ 5,716,408 $ 8,588,808 Trinidad 33,899 71,132 75,542 141,000 Other International (1) 13,802 14,709 29,116 26,464
Total $ 1,103,374 $ 4,697,630 $ 5,821,066 $ 8,756,272 Operating Income (Loss)
United States (2) $ (1,079,201) $ 1,107,910 $ (973,795) $ 1,958,810 Trinidad 10,234 34,390 22,897 73,222 Other International (1) (3) (17,582) (11,529) (78,066) (24,731)
Total (1,086,549) 1,130,771 (1,028,964) 2,007,301 Reconciling Items
Other Income (Expense), Net (4,500) 8,503 13,608 14,115 Interest Expense, Net (54,213) (49,908) (98,903) (104,814)
Income (Loss) Before Income Taxes $ (1,145,262) $ 1,089,366 $ (1,114,259) $ 1,916,602
(1) Other International primarily consists of EOG's China and Canada operations. (2) EOG recorded pretax impairment charges of $6 million and $1,462 million for the three and six months ended June 30, 2020,
respectively, for proved oil and gas properties, leasehold costs and other assets due to the decline in commodity prices. See Note 11. In addition, EOG recorded pretax impairment charges of $219 million for the three and six months ended June 30, 2020, for sand and crude-by-rail assets.
(3) EOG recorded pretax impairment charges of $19 million for the three months ended June 30, 2020, and $79 million for the six months ended June 30, 2020, for proved oil and gas properties and firm commitment contracts related to its decision to exit the Horn River Basin in British Columbia, Canada.
Total assets by reportable segment are presented below at June 30, 2020 and December 31, 2019 (in thousands):
AtJune 30,
2020
AtDecember 31,
2019Total Assets
United States $ 34,534,344 $ 36,274,942 Trinidad 531,454 705,747 Other International (1) 155,873 143,919
Total $ 35,221,671 $ 37,124,608
(1) Other International primarily consists of EOG's China and Canada operations.
EOG RESOURCES, INC.NOTES TO CONDENSED CONSOLIDATED FINANCIAL STATEMENTS – (Continued)
(Unaudited)
-13-
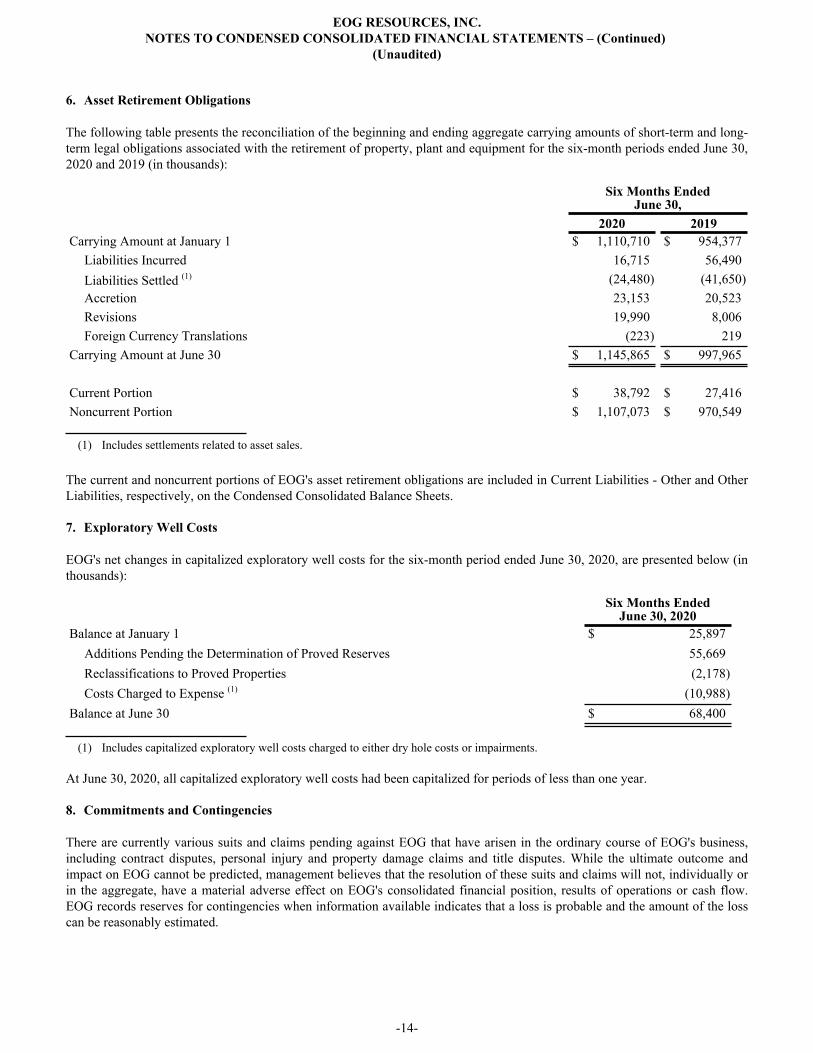
6. Asset Retirement Obligations
The following table presents the reconciliation of the beginning and ending aggregate carrying amounts of short-term and long-term legal obligations associated with the retirement of property, plant and equipment for the six-month periods ended June 30, 2020 and 2019 (in thousands):
Six Months EndedJune 30,
2020 2019Carrying Amount at January 1 $ 1,110,710 $ 954,377
Liabilities Incurred 16,715 56,490 Liabilities Settled (1) (24,480) (41,650) Accretion 23,153 20,523 Revisions 19,990 8,006 Foreign Currency Translations (223) 219
Carrying Amount at June 30 $ 1,145,865 $ 997,965
Current Portion $ 38,792 $ 27,416 Noncurrent Portion $ 1,107,073 $ 970,549
(1) Includes settlements related to asset sales.
The current and noncurrent portions of EOG's asset retirement obligations are included in Current Liabilities - Other and Other Liabilities, respectively, on the Condensed Consolidated Balance Sheets.
7. Exploratory Well Costs
EOG's net changes in capitalized exploratory well costs for the six-month period ended June 30, 2020, are presented below (in thousands):
Six Months EndedJune 30, 2020
Balance at January 1 $ 25,897 Additions Pending the Determination of Proved Reserves 55,669 Reclassifications to Proved Properties (2,178) Costs Charged to Expense (1) (10,988)
Balance at June 30 $ 68,400
(1) Includes capitalized exploratory well costs charged to either dry hole costs or impairments.
At June 30, 2020, all capitalized exploratory well costs had been capitalized for periods of less than one year.
8. Commitments and Contingencies
There are currently various suits and claims pending against EOG that have arisen in the ordinary course of EOG's business, including contract disputes, personal injury and property damage claims and title disputes. While the ultimate outcome and impact on EOG cannot be predicted, management believes that the resolution of these suits and claims will not, individually or in the aggregate, have a material adverse effect on EOG's consolidated financial position, results of operations or cash flow. EOG records reserves for contingencies when information available indicates that a loss is probable and the amount of the loss can be reasonably estimated.
EOG RESOURCES, INC.NOTES TO CONDENSED CONSOLIDATED FINANCIAL STATEMENTS – (Continued)
(Unaudited)
-14-

9. Pension and Postretirement Benefits
EOG has defined contribution pension plans in place for most of its employees in the United States, and a defined benefit pension plan covering certain of its employees in Trinidad. For the six months ended June 30, 2020 and 2019, EOG's total costs recognized for these pension plans were $20.7 million and $23.0 million, respectively. EOG also has postretirement medical and dental plans in place for eligible employees and their dependents in the United States and Trinidad, the costs of which are not material.
10. Long-Term Debt and Common Stock
Long-Term Debt. EOG had no outstanding commercial paper borrowings at June 30, 2020 and December 31, 2019, and did not utilize any commercial paper borrowings during the six months ended June 30, 2020 and 2019.
At June 30, 2020, $750 million aggregate principal amount of EOG's 4.100% Senior Notes due 2021 was reclassified as long-term debt as a result of EOG's intent and ability to ultimately replace such amounts with other long-term debt.
EOG currently has a $2.0 billion senior unsecured Revolving Credit Agreement (Agreement) with domestic and foreign lenders (Banks). The Agreement has a scheduled maturity date of June 27, 2024, and includes an option for EOG to extend, on up to two occasions, the term for successive one-year periods subject to certain terms and conditions. The Agreement (i) commits the Banks to provide advances up to an aggregate principal amount of $2.0 billion at any one time outstanding, with an option for EOG to request increases in the aggregate commitments to an amount not to exceed $3.0 billion, subject to certain terms and conditions and (ii) includes a swingline subfacility and a letter of credit subfacility. Advances under the Agreement will accrue interest based, at EOG's option, on either LIBOR plus an applicable margin (Eurodollar rate) or the base rate (as defined in the Agreement) plus an applicable margin. The Agreement contains representations, warranties, covenants and events of default that EOG believes are customary for investment-grade, senior unsecured commercial bank credit agreements, including a financial covenant for the maintenance of a ratio of total debt-to-total capitalization (as such terms are defined in the Agreement) of no greater than 65%. At June 30, 2020, EOG was in compliance with this financial covenant. At June 30, 2020 and December 31, 2019, there were no borrowings or letters of credit outstanding under the Agreement. The Eurodollar rate and base rate (inclusive of the applicable margin), had there been any amounts borrowed under the Agreement at June 30, 2020, would have been 1.06% and 3.25%, respectively.
On April 1, 2020, EOG repaid upon maturity the $500 million aggregate principal amount of its 2.45% Senior Notes due 2020.
On April 14, 2020, EOG closed on its offering of $750 million aggregate principal amount of its 4.375% Senior Notes due 2030 and $750 million aggregate principal amount of its 4.950% Senior Notes due 2050 (together, the Notes). Interest on the Notes is payable semi-annually in arrears on April 15 and October 15 of each year, beginning on October 15, 2020. EOG received net proceeds of approximately $1.48 billion from the issuance of the Notes, which were used to repay the 4.40% Senior Notes due 2020 when they matured on June 1, 2020 (see below), and have also been used (and will continue to be used) for general corporate purposes, including the funding of capital expenditures.
On June 1, 2020, EOG repaid upon maturity the $500 million aggregate principal amount of its 4.40% Senior Notes due 2020.
Common Stock. On February 27, 2020, EOG's Board of Directors increased the quarterly cash dividend on the common stock from the previous $0.2875 per share to $0.375 per share, effective beginning with the dividend paid on April 30, 2020, to stockholders of record as of April 16, 2020.
EOG RESOURCES, INC.NOTES TO CONSOLIDATED FINANCIAL STATEMENTS – (Continued)
(Unaudited)
-15-
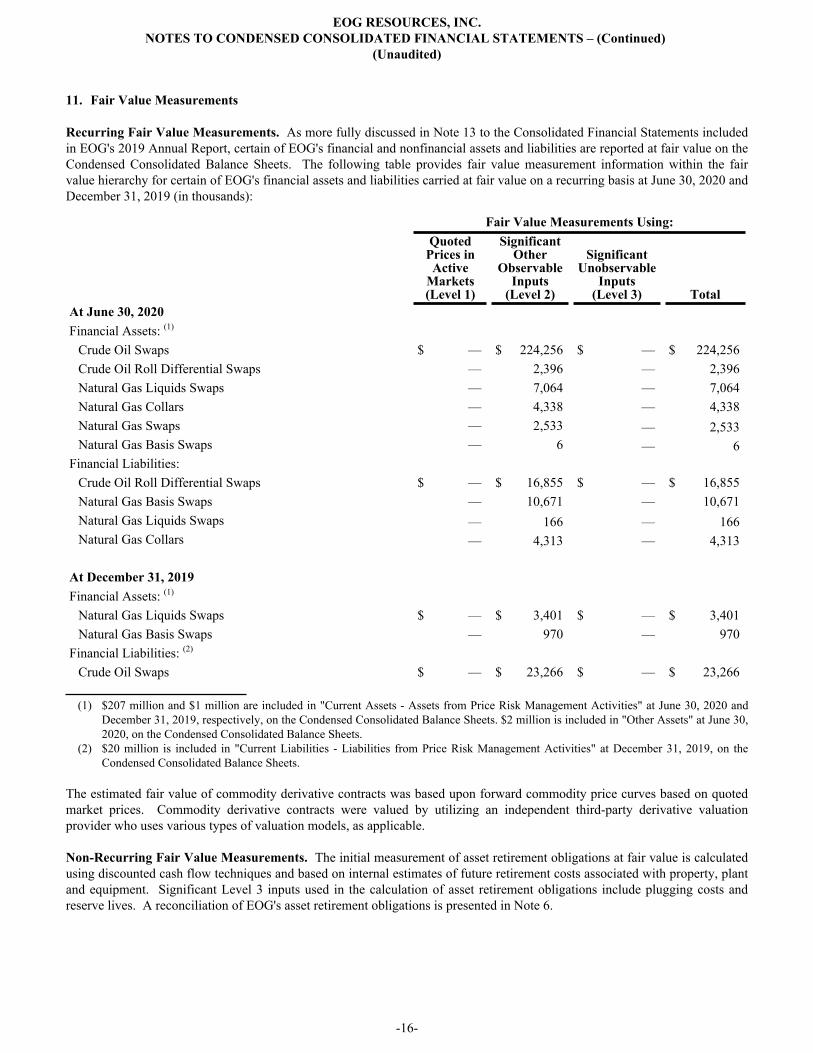
11. Fair Value Measurements
Recurring Fair Value Measurements. As more fully discussed in Note 13 to the Consolidated Financial Statements included in EOG's 2019 Annual Report, certain of EOG's financial and nonfinancial assets and liabilities are reported at fair value on the Condensed Consolidated Balance Sheets. The following table provides fair value measurement information within the fair value hierarchy for certain of EOG's financial assets and liabilities carried at fair value on a recurring basis at June 30, 2020 and December 31, 2019 (in thousands):
Fair Value Measurements Using: Quoted
Prices inActive
Markets(Level 1)
SignificantOther
ObservableInputs
(Level 2)
SignificantUnobservable
Inputs(Level 3) Total
At June 30, 2020 Financial Assets: (1)
Crude Oil Swaps $ — $ 224,256 $ — $ 224,256 Crude Oil Roll Differential Swaps — 2,396 — 2,396 Natural Gas Liquids Swaps — 7,064 — 7,064 Natural Gas Collars — 4,338 — 4,338 Natural Gas Swaps — 2,533 — 2,533 Natural Gas Basis Swaps — 6 — 6
Financial Liabilities:Crude Oil Roll Differential Swaps $ — $ 16,855 $ — $ 16,855 Natural Gas Basis Swaps — 10,671 — 10,671 Natural Gas Liquids Swaps — 166 — 166 Natural Gas Collars — 4,313 — 4,313
At December 31, 2019Financial Assets: (1)
Natural Gas Liquids Swaps $ — $ 3,401 $ — $ 3,401 Natural Gas Basis Swaps — 970 — 970
Financial Liabilities: (2)
Crude Oil Swaps $ — $ 23,266 $ — $ 23,266
(1) $207 million and $1 million are included in "Current Assets - Assets from Price Risk Management Activities" at June 30, 2020 and December 31, 2019, respectively, on the Condensed Consolidated Balance Sheets. $2 million is included in "Other Assets" at June 30, 2020, on the Condensed Consolidated Balance Sheets.
(2) $20 million is included in "Current Liabilities - Liabilities from Price Risk Management Activities" at December 31, 2019, on the Condensed Consolidated Balance Sheets.
The estimated fair value of commodity derivative contracts was based upon forward commodity price curves based on quoted market prices. Commodity derivative contracts were valued by utilizing an independent third-party derivative valuation provider who uses various types of valuation models, as applicable.
Non-Recurring Fair Value Measurements. The initial measurement of asset retirement obligations at fair value is calculated using discounted cash flow techniques and based on internal estimates of future retirement costs associated with property, plant and equipment. Significant Level 3 inputs used in the calculation of asset retirement obligations include plugging costs and reserve lives. A reconciliation of EOG's asset retirement obligations is presented in Note 6.
EOG RESOURCES, INC.NOTES TO CONDENSED CONSOLIDATED FINANCIAL STATEMENTS – (Continued)
(Unaudited)
-16-
When circumstances indicate that proved oil and gas properties may be impaired, EOG compares expected undiscounted future cash flows at a depreciation, depletion and amortization group level to the unamortized capitalized cost of the asset. If the expected undiscounted future cash flows, based on EOG's estimate of (and assumptions regarding) future crude oil and natural gas prices, operating costs, development expenditures, anticipated production from proved reserves and other relevant data, are lower than the unamortized capitalized cost, the capitalized cost is reduced to fair value. Fair value is generally calculated using the Income Approach described in the Fair Value Measurement Topic of the ASC. In certain instances, EOG utilizes accepted offers from third-party purchasers as the basis for determining fair value.
During the first half of 2020, due to the decline in commodity prices, proved oil and gas properties with a carrying amount of $1,424 million were written down to their fair value of $264 million, resulting in pretax impairment charges of $1,160 million for the six months ended June 30, 2020. In addition, EOG recorded pretax impairment charges of $72 million for the six months ended June 30, 2020, for a commodity price-related write-down of other assets.
EOG utilized average prices per acre from comparable market transactions and estimated discounted cash flows as the basis for determining the fair value of unproved and proved properties, respectively, received in non-cash property exchanges. See Note 4.
Fair Value Disclosures. EOG's financial instruments, other than commodity derivative contracts, consist of cash and cash equivalents, accounts receivable, accounts payable and current and long-term debt. The carrying values of cash and cash equivalents, accounts receivable and accounts payable approximate fair value.
At June 30, 2020 and December 31, 2019, respectively, EOG had outstanding $5,640 million and $5,140 million aggregate principal amount of senior notes, which had estimated fair values at such dates of approximately $6,416 million and $5,452 million, respectively. The estimated fair value of debt was based upon quoted market prices and, where such prices were not available, other observable (Level 2) inputs regarding interest rates available to EOG at the end of each respective period.
12. Risk Management Activities
Commodity Price Risk. As more fully discussed in Note 12 to the Consolidated Financial Statements included in EOG's 2019 Annual Report, EOG engages in price risk management activities from time to time. These activities are intended to manage EOG's exposure to fluctuations in commodity prices for crude oil, NGLs and natural gas. EOG utilizes financial commodity derivative instruments, primarily price swap, option, swaption, collar and basis swap contracts, as a means to manage this price risk. EOG has not designated any of its financial commodity derivative contracts as accounting hedges and, accordingly, accounts for financial commodity derivative contracts using the mark-to-market accounting method.
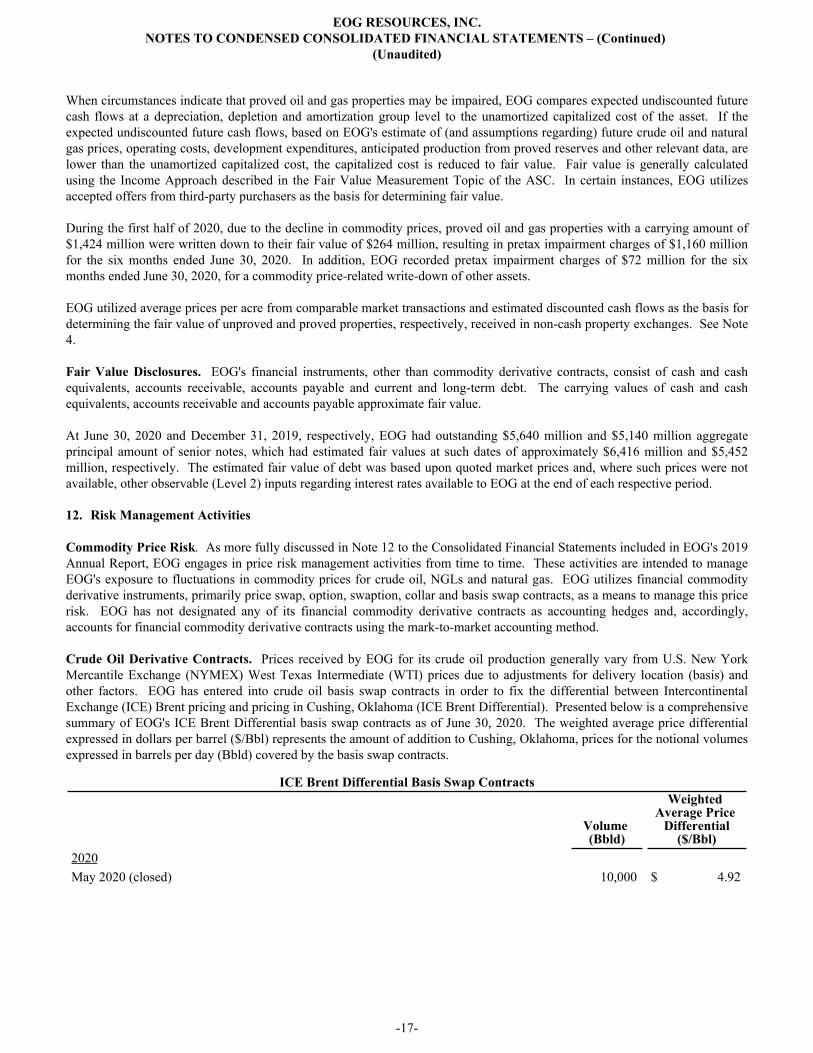
Crude Oil Derivative Contracts. Prices received by EOG for its crude oil production generally vary from U.S. New York Mercantile Exchange (NYMEX) West Texas Intermediate (WTI) prices due to adjustments for delivery location (basis) and other factors. EOG has entered into crude oil basis swap contracts in order to fix the differential between Intercontinental Exchange (ICE) Brent pricing and pricing in Cushing, Oklahoma (ICE Brent Differential). Presented below is a comprehensive summary of EOG's ICE Brent Differential basis swap contracts as of June 30, 2020. The weighted average price differential expressed in dollars per barrel ($/Bbl) represents the amount of addition to Cushing, Oklahoma, prices for the notional volumes expressed in barrels per day (Bbld) covered by the basis swap contracts.
ICE Brent Differential Basis Swap Contracts
Volume (Bbld)
Weighted Average Price
Differential($/Bbl)
2020May 2020 (closed) 10,000 $ 4.92
EOG RESOURCES, INC.NOTES TO CONDENSED CONSOLIDATED FINANCIAL STATEMENTS – (Continued)
(Unaudited)
-17-
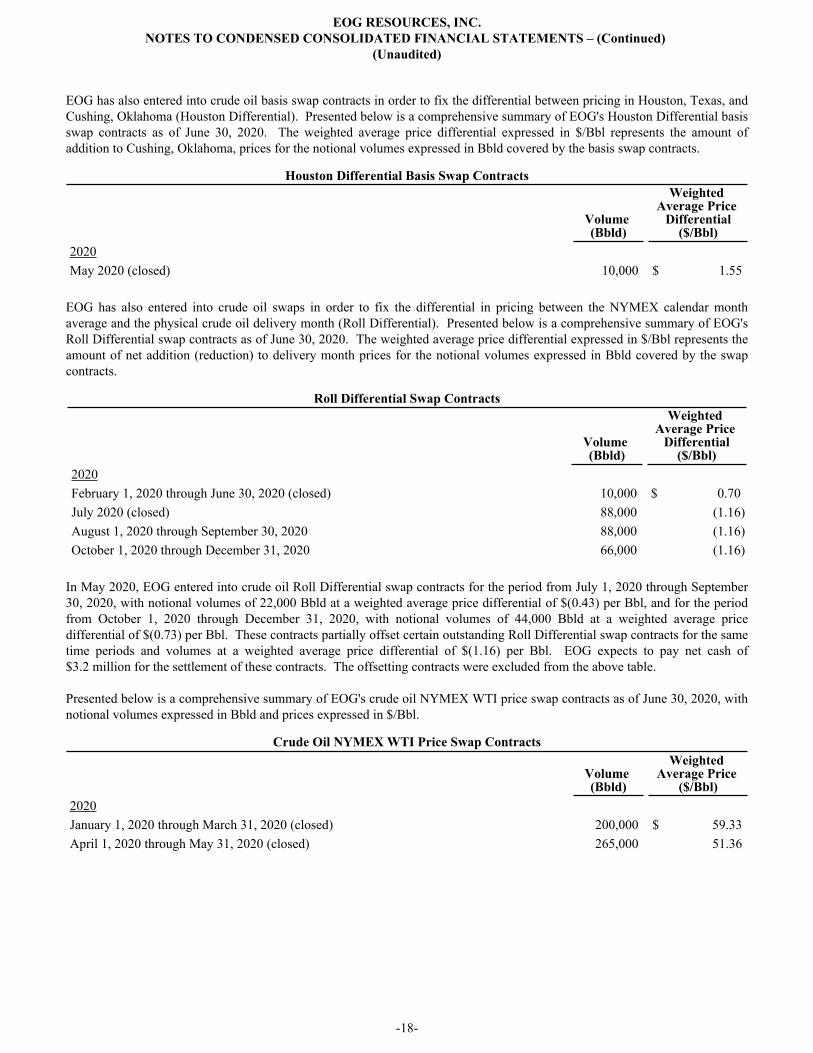
EOG has also entered into crude oil basis swap contracts in order to fix the differential between pricing in Houston, Texas, and Cushing, Oklahoma (Houston Differential). Presented below is a comprehensive summary of EOG's Houston Differential basis swap contracts as of June 30, 2020. The weighted average price differential expressed in $/Bbl represents the amount of addition to Cushing, Oklahoma, prices for the notional volumes expressed in Bbld covered by the basis swap contracts.
Houston Differential Basis Swap Contracts
Volume (Bbld)
Weighted Average Price
Differential($/Bbl)
2020May 2020 (closed) 10,000 $ 1.55
EOG has also entered into crude oil swaps in order to fix the differential in pricing between the NYMEX calendar month average and the physical crude oil delivery month (Roll Differential). Presented below is a comprehensive summary of EOG's Roll Differential swap contracts as of June 30, 2020. The weighted average price differential expressed in $/Bbl represents the amount of net addition (reduction) to delivery month prices for the notional volumes expressed in Bbld covered by the swap contracts.
Roll Differential Swap Contracts
Volume (Bbld)
Weighted Average Price
Differential($/Bbl)
2020February 1, 2020 through June 30, 2020 (closed) 10,000 $ 0.70 July 2020 (closed) 88,000 (1.16) August 1, 2020 through September 30, 2020 88,000 (1.16) October 1, 2020 through December 31, 2020 66,000 (1.16)
In May 2020, EOG entered into crude oil Roll Differential swap contracts for the period from July 1, 2020 through September 30, 2020, with notional volumes of 22,000 Bbld at a weighted average price differential of $(0.43) per Bbl, and for the period from October 1, 2020 through December 31, 2020, with notional volumes of 44,000 Bbld at a weighted average price differential of $(0.73) per Bbl. These contracts partially offset certain outstanding Roll Differential swap contracts for the same time periods and volumes at a weighted average price differential of $(1.16) per Bbl. EOG expects to pay net cash of $3.2 million for the settlement of these contracts. The offsetting contracts were excluded from the above table.
Presented below is a comprehensive summary of EOG's crude oil NYMEX WTI price swap contracts as of June 30, 2020, with notional volumes expressed in Bbld and prices expressed in $/Bbl.
Crude Oil NYMEX WTI Price Swap Contracts
Volume (Bbld)
Weighted Average Price
($/Bbl)2020January 1, 2020 through March 31, 2020 (closed) 200,000 $ 59.33 April 1, 2020 through May 31, 2020 (closed) 265,000 51.36
EOG RESOURCES, INC.NOTES TO CONDENSED CONSOLIDATED FINANCIAL STATEMENTS – (Continued)
(Unaudited)
-18-

In April and May 2020, EOG entered into crude oil NYMEX WTI price swap contracts for the period from June 1, 2020 through June 30, 2020, with notional volumes of 265,000 Bbld at a weighted average price of $33.80 per Bbl, for the period from July 1, 2020 through July 31, 2020, with notional volumes of 254,000 Bbld at a weighted average price of $33.75 per Bbl, for the period from August 1, 2020 through September 30, 2020, with notional volumes of 154,000 Bbld at a weighted average price of $34.18 per Bbl and for the period from October 1, 2020 through December 31, 2020, with notional volumes of 47,000 Bbld at a weighted average price of $30.04 per Bbl. These contracts offset the remaining NYMEX WTI price swap contracts for the same time periods and volumes at a weighted average price of $51.36 per Bbl for the period from June 1, 2020 through June 30, 2020, $42.36 per Bbl for the period from July 1, 2020 through July 31, 2020, $50.42 per Bbl for the period from August 1, 2020 through September 30, 2020 and $31.00 per Bbl for the period from October 1, 2020 through December 31, 2020. EOG expects to receive net cash of $364.0 million for the settlement of these contracts. The offsetting contracts were excluded from the above table.
Presented below is a comprehensive summary of EOG's crude oil ICE Brent price swap contracts as of June 30, 2020, with notional volumes expressed in Bbld and prices expressed in $/Bbl.
Crude Oil ICE Brent Price Swap Contracts
Volume (Bbld)
Weighted Average Price
($/Bbl)2020April 2020 (closed) 75,000 $ 25.66 May 2020 (closed) 35,000 26.53
NGLs Derivative Contracts. Presented below is a comprehensive summary of EOG's Mont Belvieu propane (non-TET) financial price swap contracts (Mont Belvieu Propane Price Swap Contracts) as of June 30, 2020, with notional volumes expressed in Bbld and prices expressed in $/Bbl.
Mont Belvieu Propane Price Swap Contracts
Volume (Bbld)
Weighted Average Price
($/Bbl)2020January 1, 2020 through February 29, 2020 (closed) 4,000 $ 21.34 March 1, 2020 through April 30, 2020 (closed) 25,000 17.92
In April and May 2020, EOG entered into Mont Belvieu propane price swap contracts for the period from May 1, 2020 through December 31, 2020, with notional volumes of 25,000 Bbld at a weighted average price of $16.41 per Bbl. These contracts offset the remaining Mont Belvieu propane price swap contracts for the same time period with notional volumes of 25,000 Bbld at a weighted average price of $17.92 per Bbl. EOG expects to receive net cash of $9.2 million for the settlement of these contracts. The offsetting contracts were excluded from the above table.
Natural Gas Derivative Contracts. Presented below is a comprehensive summary of EOG's natural gas price swap contracts as of June 30, 2020, with notional volumes expressed in million British thermal units (MMBtu) per day (MMBtud) and prices expressed in dollars per MMBtu ($/MMBtu).
Natural Gas Price Swap Contracts
Volume
(MMBtud)
Weighted Average Price
($/MMBtu)2021January 1, 2021 through December 31, 2021 50,000 $ 2.75
EOG RESOURCES, INC.NOTES TO CONDENSED CONSOLIDATED FINANCIAL STATEMENTS – (Continued)
(Unaudited)
-19-

EOG has entered into natural gas collar contracts, which establish ceiling and floor prices for the sale of notional volumes of natural gas as specified in the collar contracts. The collars require that EOG pay the difference between the ceiling price and the NYMEX Henry Hub natural gas price for the contract month (Henry Hub Index Price) in the event the Henry Hub Index Price is above the ceiling price. The collars grant EOG the right to receive the difference between the floor price and the Henry Hub Index Price in the event the Henry Hub Index Price is below the floor price. In March 2020, EOG executed the early termination provision granting EOG the right to terminate certain 2020 natural gas collar contracts with notional volumes of 250,000 MMBtud at a weighted average ceiling price of $2.50 per MMBtu and a weighted average floor price of $2.00 per MMBtu for the period from April 1, 2020 through July 31, 2020. The net cash EOG received for settling these contracts was $7.8 million. Presented below is a comprehensive summary of EOG's natural gas collar contracts as of June 30, 2020, with notional volumes expressed in MMBtud and prices expressed in $/MMBtu.
Natural Gas Collar ContractsWeighted Average Price ($/MMBtu)
Volume (MMBtud) Ceiling Price Floor Price2020April 1, 2020 through July 31, 2020 (closed) 250,000 $ 2.50 $ 2.00
In April 2020, EOG entered into natural gas collar contracts for the period from August 1, 2020 through October 31, 2020, with notional volumes of 250,000 MMBtud at a ceiling price of $2.50 per MMBtu and a floor price of $2.00 per MMBtu. These contracts offset the remaining natural gas collar contracts for the same time period with notional volumes of 250,000 MMBtud at a ceiling price of $2.50 per MMBtu and a floor price of $2.00 per MMBtu. EOG expects to receive net cash of $1.1 million for the settlement of these contracts. The offsetting contracts were excluded from the above table.
Prices received by EOG for its natural gas production generally vary from NYMEX Henry Hub prices due to adjustments for delivery location (basis) and other factors. EOG has entered into natural gas basis swap contracts in order to fix the differential between pricing in the Rocky Mountain area and NYMEX Henry Hub prices (Rockies Differential). Presented below is a comprehensive summary of EOG's Rockies Differential basis swap contracts as of June 30, 2020. The weighted average price differential expressed in $/MMBtu represents the amount of reduction to NYMEX Henry Hub prices for the notional volumes expressed in MMBtud covered by the basis swap contracts.
Rockies Differential Basis Swap Contracts
Volume
(MMBtud)
Weighted Average Price
Differential ($/MMBtu)
2020January 1, 2020 through June 30, 2020 (closed) 30,000 $ 0.55 July 1, 2020 through December 31, 2020 30,000 0.55
EOG has also entered into natural gas basis swap contracts in order to fix the differential between pricing at the Houston Ship Channel (HSC) and NYMEX Henry Hub prices (HSC Differential). In March 2020, EOG executed the early termination provision granting EOG the right to terminate certain 2020 HSC Differential basis swaps with notional volumes of 60,000 MMBtud at a weighted average price differential of $0.05 per MMBtu for the period from April 1, 2020 through December 31, 2020. The net cash EOG paid for settling these contracts was $0.4 million. Presented below is a comprehensive summary of EOG's HSC Differential basis swap contracts as of June 30, 2020. The weighted average price differential expressed in $/MMBtu represents the amount of reduction to NYMEX Henry Hub prices for the notional volumes expressed in MMBtud covered by the basis swap contracts.
HSC Differential Basis Swap Contracts
Volume
(MMBtud)
Weighted Average Price
Differential ($/MMBtu)
2020January 1, 2020 through December 31, 2020 (closed) 60,000 $ 0.05
EOG RESOURCES, INC.NOTES TO CONDENSED CONSOLIDATED FINANCIAL STATEMENTS – (Continued)
(Unaudited)
-20-
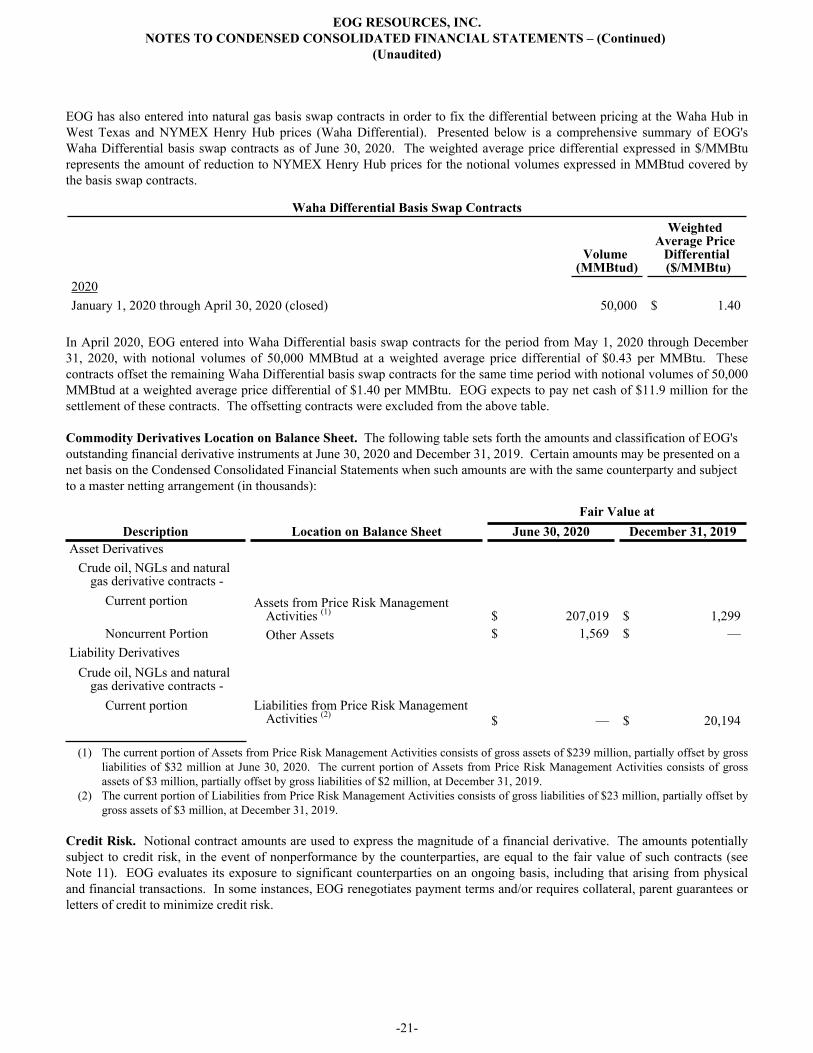
EOG has also entered into natural gas basis swap contracts in order to fix the differential between pricing at the Waha Hub in West Texas and NYMEX Henry Hub prices (Waha Differential). Presented below is a comprehensive summary of EOG's Waha Differential basis swap contracts as of June 30, 2020. The weighted average price differential expressed in $/MMBtu represents the amount of reduction to NYMEX Henry Hub prices for the notional volumes expressed in MMBtud covered by the basis swap contracts.
Waha Differential Basis Swap Contracts
Volume
(MMBtud)
Weighted Average Price
Differential ($/MMBtu)
2020January 1, 2020 through April 30, 2020 (closed) 50,000 $ 1.40
In April 2020, EOG entered into Waha Differential basis swap contracts for the period from May 1, 2020 through December 31, 2020, with notional volumes of 50,000 MMBtud at a weighted average price differential of $0.43 per MMBtu. These contracts offset the remaining Waha Differential basis swap contracts for the same time period with notional volumes of 50,000 MMBtud at a weighted average price differential of $1.40 per MMBtu. EOG expects to pay net cash of $11.9 million for the settlement of these contracts. The offsetting contracts were excluded from the above table.
Commodity Derivatives Location on Balance Sheet. The following table sets forth the amounts and classification of EOG's outstanding financial derivative instruments at June 30, 2020 and December 31, 2019. Certain amounts may be presented on a net basis on the Condensed Consolidated Financial Statements when such amounts are with the same counterparty and subject to a master netting arrangement (in thousands):
Fair Value atDescription Location on Balance Sheet June 30, 2020 December 31, 2019
Asset Derivatives Crude oil, NGLs and natural
gas derivative contracts -
Current portion Assets from Price Risk Management Activities (1) $ 207,019 $ 1,299
Noncurrent Portion Other Assets $ 1,569 $ — Liability Derivatives
Crude oil, NGLs and natural gas derivative contracts -
Current portion Liabilities from Price Risk Management Activities (2) $ — $ 20,194
(1) The current portion of Assets from Price Risk Management Activities consists of gross assets of $239 million, partially offset by gross liabilities of $32 million at June 30, 2020. The current portion of Assets from Price Risk Management Activities consists of gross assets of $3 million, partially offset by gross liabilities of $2 million, at December 31, 2019.
(2) The current portion of Liabilities from Price Risk Management Activities consists of gross liabilities of $23 million, partially offset by gross assets of $3 million, at December 31, 2019.
Credit Risk. Notional contract amounts are used to express the magnitude of a financial derivative. The amounts potentially subject to credit risk, in the event of nonperformance by the counterparties, are equal to the fair value of such contracts (see Note 11). EOG evaluates its exposure to significant counterparties on an ongoing basis, including that arising from physical and financial transactions. In some instances, EOG renegotiates payment terms and/or requires collateral, parent guarantees or letters of credit to minimize credit risk.
EOG RESOURCES, INC.NOTES TO CONDENSED CONSOLIDATED FINANCIAL STATEMENTS – (Continued)
(Unaudited)
-21-
All of EOG's derivative instruments are covered by International Swap Dealers Association Master Agreements (ISDAs) with counterparties. The ISDAs may contain provisions that require EOG, if it is the party in a net liability position, to post collateral when the amount of the net liability exceeds the threshold level specified for EOG's then-current credit ratings. In addition, the ISDAs may also provide that as a result of certain circumstances, including certain events that cause EOG's credit ratings to become materially weaker than its then-current ratings, the counterparty may require all outstanding derivatives under the ISDAs to be settled immediately. See Note 11 for the aggregate fair value of all derivative instruments that were in a net asset position at June 30, 2020 and December 31, 2019. EOG had no collateral posted and held collateral of $62 million at June 30, 2020, and had no collateral posted and held no collateral at December 31, 2019.
13. Acquisitions and Divestitures
During the six months ended June 30, 2020, EOG paid cash for property acquisitions of $46 million in the United States. Additionally, during the six months ended June 30, 2020, EOG recognized net gains on asset dispositions of $30 million, primarily due to the sale of proved properties and non-cash property exchanges of unproved leasehold in Texas, New Mexico and the Rocky Mountain area, and received proceeds of approximately $43 million. During the six months ended June 30, 2019, EOG paid cash for property acquisitions of $304 million in the United States. Additionally, during the six months ended June 30, 2019, EOG recognized net gains on asset dispositions of $4 million and received proceeds of approximately $18 million.
EOG RESOURCES, INC.NOTES TO CONDENSED CONSOLIDATED FINANCIAL STATEMENTS – (Continued)
(Unaudited)
-22-

PART I. FINANCIAL INFORMATION
ITEM 2. MANAGEMENT'S DISCUSSION AND ANALYSIS OFFINANCIAL CONDITION AND RESULTS OF OPERATIONS
EOG RESOURCES, INC.
Overview
EOG Resources, Inc., together with its subsidiaries (collectively, EOG), is one of the largest independent (non-integrated) crude oil and natural gas companies in the United States with proved reserves in the United States, Trinidad and China. EOG operates under a consistent business and operational strategy that focuses predominantly on maximizing the rate of return on investment of capital by controlling operating and capital costs and maximizing reserve recoveries. Each prospective drilling location is evaluated by its estimated rate of return. This strategy is intended to enhance the generation of cash flow and earnings from each unit of production on a cost-effective basis, allowing EOG to deliver long-term production growth while maintaining a strong balance sheet. EOG implements its strategy primarily by emphasizing the drilling of internally generated prospects in order to find and develop low-cost reserves. Maintaining the lowest possible operating cost structure that is consistent with efficient, safe and environmentally responsible operations is also an important goal in the implementation of EOG's strategy.
Recent Developments. The COVID-19 pandemic and the measures being taken to address and limit the spread of the virus have adversely affected the economies and financial markets of the world, resulting in an economic downturn that has negatively impacted, and may continue to negatively impact, global demand and prices for crude oil and condensate, natural gas liquids (NGLs) and natural gas. See PART II, ITEM 1A, "Risk Factors" below, for further discussion.
In early March 2020, due to the failure of the members of the Organization of the Petroleum Exporting Countries and Russia (OPEC+) to reach an agreement on individual crude oil production limits, Saudi Arabia unilaterally reduced the sales price of its crude oil and announced that it would increase its crude oil production. The combination of these actions and the effects of the COVID-19 pandemic on crude oil demand, resulted in lower commodity prices in March and April 2020. In April 2020, the members of OPEC+ reached an agreement to cut production beginning in May 2020 and extending through April 2022 with the quantity of the production cuts decreasing over time. In May and June 2020, crude oil prices recovered, but remain significantly below average prices in 2019 as a result of the rebalancing of crude oil supply from the actions of OPEC+ and the continuing effect of the COVID-19 pandemic on global demand.
In response to the current commodity price environment, EOG updated its 2020 capital and operating plan to reduce activity across its operating areas and decrease its total anticipated 2020 capital expenditures. EOG also elected to reduce its 2020 crude oil production, including delaying initial production from new wells and shutting-in or otherwise curtailing existing production. As a result, EOG expects its full-year 2020 total crude oil production to be lower than its full-year 2019 total crude oil production. See "2020 Capital and Operating Plan" below for further discussion.
Commodity Prices. As a result of the many uncertainties associated with (i) the world economic environment, (ii) the COVID-19 pandemic and its continuing effect on the economies and financial markets of the world and (iii) any future actions by the members of OPEC+, and the effect of these uncertainties on worldwide supplies of, and demand for, crude oil and condensate, NGLs and natural gas, EOG is unable to predict what changes may occur in crude oil and condensate, NGLs, and natural gas prices in the future. However, prices for crude oil and condensate, NGLs and natural gas have historically been volatile, and this volatility is expected to continue.
The market prices of crude oil and condensate, NGLs and natural gas during the remainder of 2020 will impact the amount of cash generated from EOG's operating activities, which will in turn impact EOG's financial position and results of operations. For the first six months of 2020, the average U.S. New York Mercantile Exchange (NYMEX) crude oil and condensate and natural gas prices were $36.97 per barrel and $1.85 per million British thermal units (MMBtu), respectively, both representing decreases of 36% from the average NYMEX prices for the same period in 2019. Market prices for NGLs are influenced by the components extracted, including ethane, propane and butane and natural gasoline, among others, and the respective market pricing for each component.
-23-
United States. EOG's efforts to identify plays with large reserve potential have proven to be successful. EOG has placed an emphasis on applying its horizontal drilling and completion expertise to unconventional crude oil and liquids-rich reservoirs, EOG continues to drill numerous wells in large acreage plays, which in the aggregate have contributed substantially to, and are expected to continue to contribute substantially to, EOG's crude oil and liquids-rich natural gas production.
During the first six months of 2020, EOG continued to focus on increasing drilling, completion and operating efficiencies gained in prior years. In addition, EOG continued to evaluate certain potential crude oil and liquids-rich natural gas exploration and development prospects and to look for opportunities to add drilling inventory through leasehold acquisitions, farm-ins, exchanges or tactical acquisitions. On a volumetric basis, as calculated using the ratio of 1.0 barrel of crude oil and condensate or NGLs to 6.0 thousand cubic feet of natural gas, crude oil and condensate and NGL production accounted for approximately 76% and 77% of EOG's United States production during the first six months of 2020 and 2019, respectively. During the first six months of 2020, EOG's drilling and completion activities occurred primarily in the Eagle Ford play, Delaware Basin play and Rocky Mountain area. EOG's major producing areas in the United States are in New Mexico and Texas. In the second quarter of 2020, EOG delayed initial production from most newly-completed wells and shut in some existing production.
Trinidad. In Trinidad, EOG continues to deliver natural gas under existing supply contracts. Several fields in the South East Coast Consortium (SECC) Block, Modified U(a) Block, Block 4(a), Modified U(b) Block, the Banyan Field and the Sercan Area have been developed and are producing natural gas which is sold to the National Gas Company of Trinidad and Tobago Limited and its subsidiary, and crude oil and condensate which is sold to Heritage Petroleum Company Limited. In the first half of 2020, EOG completed the drilling of one net exploratory well and was in the process of drilling and completing a second well on a different block as of June 30, 2020. Subsequent to the second quarter of 2020, it was announced that one of the exploratory wells found commercial quantities of proved reserves. During the remainder of 2020, EOG plans to drill two additional net wells, continue its evaluation of the remaining exploratory well and begin formulating development plans.
Other International. In the Sichuan Basin, Sichuan Province, China, EOG continues to work closely with its partner, PetroChina, under the Production Sharing Contract and other related agreements, to ensure uninterrupted production in order to reach the level allowed by pipeline capacity. All natural gas produced from the Baijaochang Field is sold under a long-term contract to PetroChina.
In March 2020, EOG began the process of exiting its Canada operations.
EOG continues to evaluate other select crude oil and natural gas opportunities outside the United States, primarily by pursuing exploitation opportunities in countries where indigenous crude oil and natural gas reserves have been identified.
Management continues to believe EOG has one of the strongest prospect inventories in EOG's history. When it fits EOG's strategy, EOG will make acquisitions that bolster existing drilling programs or offer incremental exploration and/or production opportunities.
2020 Capital and Operating Plan. Total anticipated 2020 capital expenditures are estimated to range from approximately $3.4 billion to $3.6 billion, including facilities and gathering, processing and other expenditures, and excluding acquisitions and non-cash transactions. The updated 2020 capital and operating plan represents a reduction in total anticipated capital expenditures compared to the original 2020 capital and operating plan and, as a result, EOG expects its full-year 2020 total crude oil production to be lower than its full-year 2019 total crude oil production.
EOG's 2020 capital expenditures will continue to be focused on drilling operations in its high rate-of-return plays as well as targeted infrastructure, exploration and environmental projects that support the long-term value of EOG. EOG remains flexible and will continue to evaluate its 2020 capital and operating plan. EOG expects to continue monitoring market conditions in the second half of the year and adjust its production volumes accordingly, with the anticipation of increasing production as prices improve. EOG will also continue to exercise financial flexibility with a goal toward preserving liquidity while supporting its dividend.
Capital Structure. One of management's key strategies is to maintain a strong balance sheet with a consistently below average debt-to-total capitalization ratio as compared to those in EOG's peer group. EOG's debt-to-total capitalization ratio was 22% at June 30, 2020 and 19% at December 31, 2019. As used in this calculation, total capitalization represents the sum of total current and long-term debt and total stockholders' equity.
-24-
At June 30, 2020, EOG maintained a strong financial and liquidity position, including $2.4 billion of cash and cash equivalents and $2.0 billion of availability under its senior unsecured revolving credit facility. EOG's cash and cash equivalents as of June 30, 2020 included $62 million of collateral deposits from counterparties in anticipation of future settlements of financial commodity derivative contracts.
On April 1, 2020, EOG repaid, with cash on hand, the $500 million aggregate principal amount of its 2.45% Senior Notes due 2020 that matured on that date.
On April 14, 2020, EOG closed on its offering of $750 million aggregate principal amount of its 4.375% Senior Notes due 2030 and $750 million aggregate principal amount of its 4.950% Senior Notes due 2050 (together, the Notes). EOG received net proceeds of approximately $1.48 billion from the issuance of the Notes, which were used to repay the 4.40% Senior Notes due 2020 when they matured on June 1, 2020 (see below), and have also been used (and will continue to be used) for general corporate purposes, including the funding of capital expenditures.
Additionally, on June 1, 2020, EOG repaid, with cash on hand, the $500 million aggregate principal amount of its 4.40% Senior Notes due 2020 that matured on that date.
EOG believes it has significant flexibility and availability with respect to financing alternatives, including borrowings under its commercial paper program, bank borrowings, borrowings under its senior unsecured revolving credit facility, joint development agreements and similar agreements and equity and debt offerings.
-25-

Results of Operations
The following review of operations for the three months and six months ended June 30, 2020 and 2019 should be read in conjunction with the Condensed Consolidated Financial Statements of EOG and notes thereto included in this Quarterly Report on Form 10-Q.
Three Months Ended June 30, 2020 vs. Three Months Ended June 30, 2019
Operating Revenues. During the second quarter of 2020, operating revenues decreased $3,595 million, or 77%, to $1,103 million from $4,698 million for the same period of 2019. Total wellhead revenues, which are revenues generated from sales of EOG's production of crude oil and condensate, NGLs and natural gas, for the second quarter of 2020 decreased $2,135 million, or 72%, to $850 million from $2,985 million for the same period of 2019. EOG recognized net losses on the mark-to-market of financial commodity derivative contracts of $126 million for the second quarter of 2020 compared to net gains of $177 million for the same period of 2019. Gathering, processing and marketing revenues for the second quarter of 2020 decreased $1,138 million, or 76%, to $363 million from $1,501 million for the same period of 2019. Net gains on asset dispositions were $13 million for the second quarter of 2020 compared to net gains of $8 million for the same period of 2019.
-26-
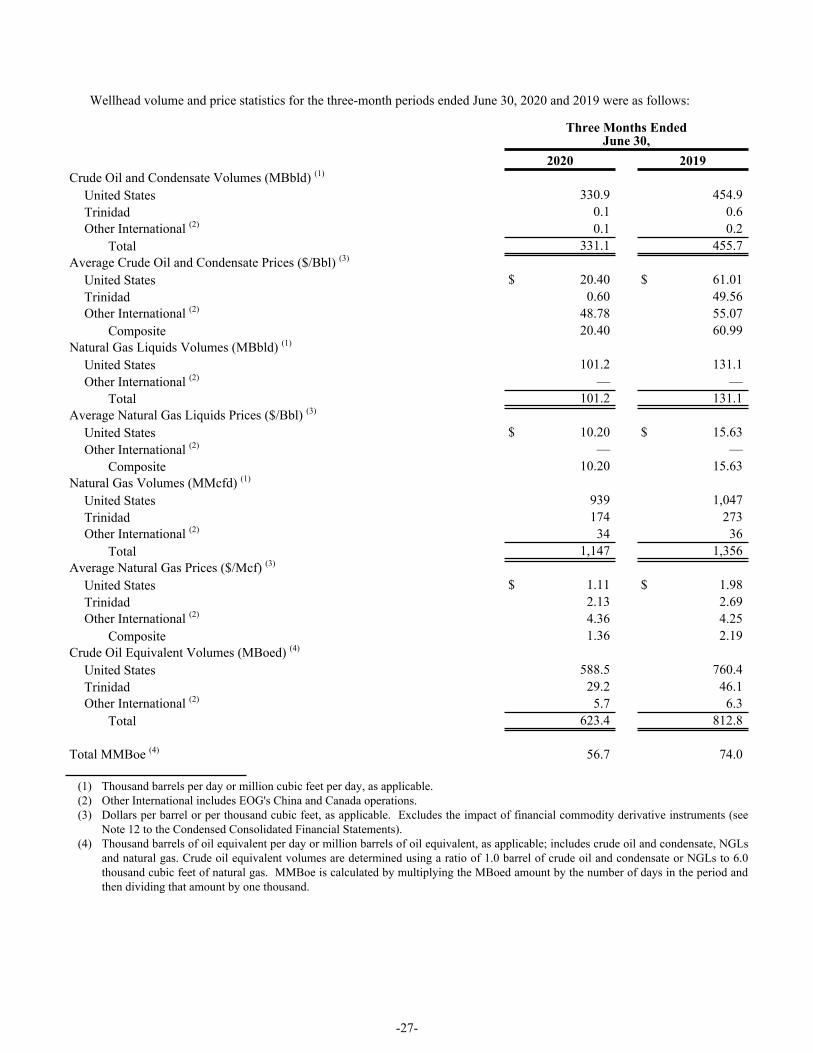
Wellhead volume and price statistics for the three-month periods ended June 30, 2020 and 2019 were as follows:
Three Months EndedJune 30,
2020 2019Crude Oil and Condensate Volumes (MBbld) (1)
United States 330.9 454.9 Trinidad 0.1 0.6 Other International (2) 0.1 0.2
Total 331.1 455.7 Average Crude Oil and Condensate Prices ($/Bbl) (3)
United States $ 20.40 $ 61.01 Trinidad 0.60 49.56 Other International (2) 48.78 55.07
Composite 20.40 60.99 Natural Gas Liquids Volumes (MBbld) (1)
United States 101.2 131.1 Other International (2) — —
Total 101.2 131.1 Average Natural Gas Liquids Prices ($/Bbl) (3)
United States $ 10.20 $ 15.63 Other International (2) — —
Composite 10.20 15.63 Natural Gas Volumes (MMcfd) (1)
United States 939 1,047 Trinidad 174 273 Other International (2) 34 36
Total 1,147 1,356 Average Natural Gas Prices ($/Mcf) (3)
United States $ 1.11 $ 1.98 Trinidad 2.13 2.69 Other International (2) 4.36 4.25
Composite 1.36 2.19 Crude Oil Equivalent Volumes (MBoed) (4)
United States 588.5 760.4 Trinidad 29.2 46.1 Other International (2) 5.7 6.3
Total 623.4 812.8
Total MMBoe (4) 56.7 74.0
(1) Thousand barrels per day or million cubic feet per day, as applicable.(2) Other International includes EOG's China and Canada operations. (3) Dollars per barrel or per thousand cubic feet, as applicable. Excludes the impact of financial commodity derivative instruments (see
Note 12 to the Condensed Consolidated Financial Statements).(4) Thousand barrels of oil equivalent per day or million barrels of oil equivalent, as applicable; includes crude oil and condensate, NGLs
and natural gas. Crude oil equivalent volumes are determined using a ratio of 1.0 barrel of crude oil and condensate or NGLs to 6.0 thousand cubic feet of natural gas. MMBoe is calculated by multiplying the MBoed amount by the number of days in the period and then dividing that amount by one thousand.
-27-
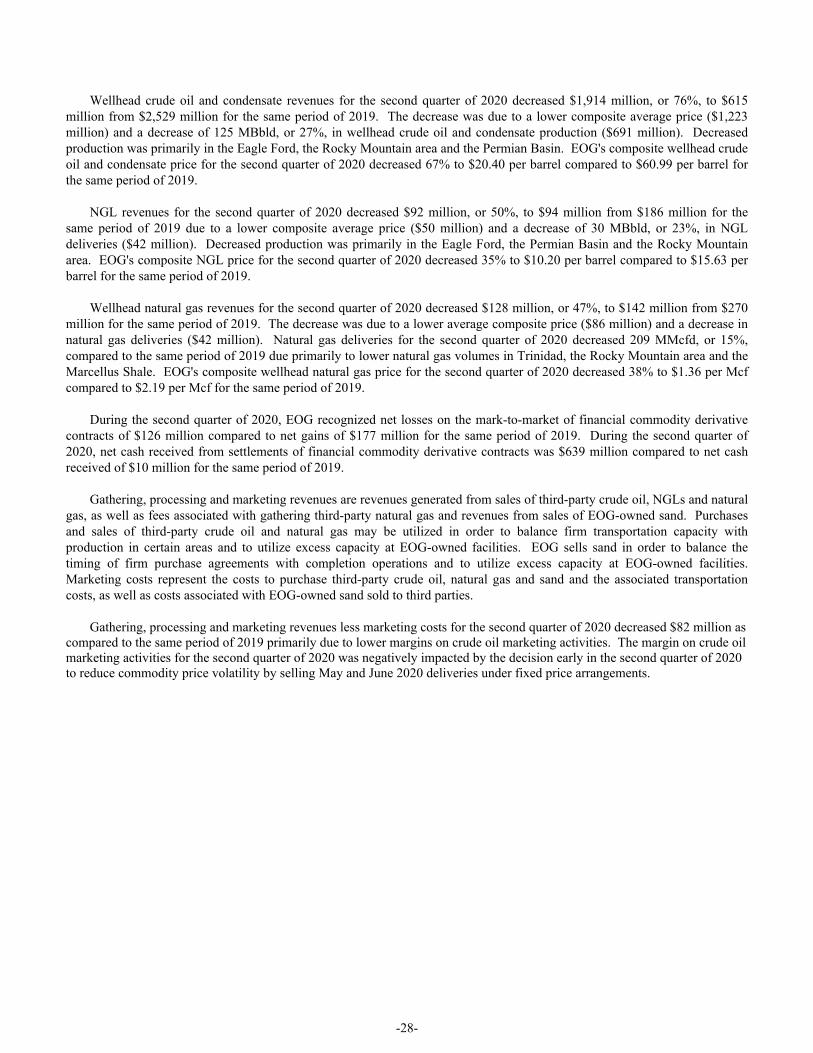
Wellhead crude oil and condensate revenues for the second quarter of 2020 decreased $1,914 million, or 76%, to $615 million from $2,529 million for the same period of 2019. The decrease was due to a lower composite average price ($1,223 million) and a decrease of 125 MBbld, or 27%, in wellhead crude oil and condensate production ($691 million). Decreased production was primarily in the Eagle Ford, the Rocky Mountain area and the Permian Basin. EOG's composite wellhead crude oil and condensate price for the second quarter of 2020 decreased 67% to $20.40 per barrel compared to $60.99 per barrel for the same period of 2019.
NGL revenues for the second quarter of 2020 decreased $92 million, or 50%, to $94 million from $186 million for the same period of 2019 due to a lower composite average price ($50 million) and a decrease of 30 MBbld, or 23%, in NGL deliveries ($42 million). Decreased production was primarily in the Eagle Ford, the Permian Basin and the Rocky Mountain area. EOG's composite NGL price for the second quarter of 2020 decreased 35% to $10.20 per barrel compared to $15.63 per barrel for the same period of 2019.
Wellhead natural gas revenues for the second quarter of 2020 decreased $128 million, or 47%, to $142 million from $270 million for the same period of 2019. The decrease was due to a lower average composite price ($86 million) and a decrease in natural gas deliveries ($42 million). Natural gas deliveries for the second quarter of 2020 decreased 209 MMcfd, or 15%, compared to the same period of 2019 due primarily to lower natural gas volumes in Trinidad, the Rocky Mountain area and the Marcellus Shale. EOG's composite wellhead natural gas price for the second quarter of 2020 decreased 38% to $1.36 per Mcf compared to $2.19 per Mcf for the same period of 2019.
During the second quarter of 2020, EOG recognized net losses on the mark-to-market of financial commodity derivative contracts of $126 million compared to net gains of $177 million for the same period of 2019. During the second quarter of 2020, net cash received from settlements of financial commodity derivative contracts was $639 million compared to net cash received of $10 million for the same period of 2019.
Gathering, processing and marketing revenues are revenues generated from sales of third-party crude oil, NGLs and natural gas, as well as fees associated with gathering third-party natural gas and revenues from sales of EOG-owned sand. Purchases and sales of third-party crude oil and natural gas may be utilized in order to balance firm transportation capacity with production in certain areas and to utilize excess capacity at EOG-owned facilities. EOG sells sand in order to balance the timing of firm purchase agreements with completion operations and to utilize excess capacity at EOG-owned facilities. Marketing costs represent the costs to purchase third-party crude oil, natural gas and sand and the associated transportation costs, as well as costs associated with EOG-owned sand sold to third parties.
Gathering, processing and marketing revenues less marketing costs for the second quarter of 2020 decreased $82 million as compared to the same period of 2019 primarily due to lower margins on crude oil marketing activities. The margin on crude oil marketing activities for the second quarter of 2020 was negatively impacted by the decision early in the second quarter of 2020 to reduce commodity price volatility by selling May and June 2020 deliveries under fixed price arrangements.
-28-
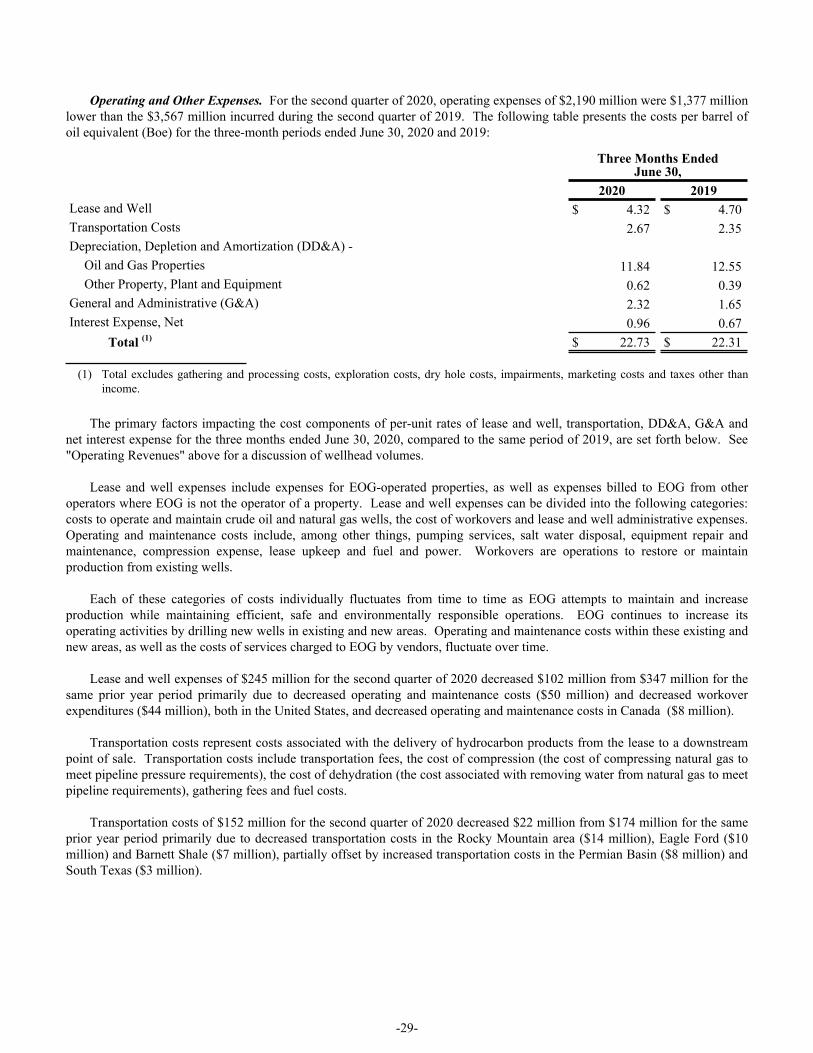
Operating and Other Expenses. For the second quarter of 2020, operating expenses of $2,190 million were $1,377 million lower than the $3,567 million incurred during the second quarter of 2019. The following table presents the costs per barrel of oil equivalent (Boe) for the three-month periods ended June 30, 2020 and 2019:
Three Months EndedJune 30,
2020 2019Lease and Well $ 4.32 $ 4.70 Transportation Costs 2.67 2.35 Depreciation, Depletion and Amortization (DD&A) -
Oil and Gas Properties 11.84 12.55 Other Property, Plant and Equipment 0.62 0.39
General and Administrative (G&A) 2.32 1.65 Interest Expense, Net 0.96 0.67
Total (1) $ 22.73 $ 22.31
(1) Total excludes gathering and processing costs, exploration costs, dry hole costs, impairments, marketing costs and taxes other than income.
The primary factors impacting the cost components of per-unit rates of lease and well, transportation, DD&A, G&A and net interest expense for the three months ended June 30, 2020, compared to the same period of 2019, are set forth below. See "Operating Revenues" above for a discussion of wellhead volumes.
Lease and well expenses include expenses for EOG-operated properties, as well as expenses billed to EOG from other operators where EOG is not the operator of a property. Lease and well expenses can be divided into the following categories: costs to operate and maintain crude oil and natural gas wells, the cost of workovers and lease and well administrative expenses. Operating and maintenance costs include, among other things, pumping services, salt water disposal, equipment repair and maintenance, compression expense, lease upkeep and fuel and power. Workovers are operations to restore or maintain production from existing wells.
Each of these categories of costs individually fluctuates from time to time as EOG attempts to maintain and increase production while maintaining efficient, safe and environmentally responsible operations. EOG continues to increase its operating activities by drilling new wells in existing and new areas. Operating and maintenance costs within these existing and new areas, as well as the costs of services charged to EOG by vendors, fluctuate over time.
Lease and well expenses of $245 million for the second quarter of 2020 decreased $102 million from $347 million for the same prior year period primarily due to decreased operating and maintenance costs ($50 million) and decreased workover expenditures ($44 million), both in the United States, and decreased operating and maintenance costs in Canada ($8 million).
Transportation costs represent costs associated with the delivery of hydrocarbon products from the lease to a downstream point of sale. Transportation costs include transportation fees, the cost of compression (the cost of compressing natural gas to meet pipeline pressure requirements), the cost of dehydration (the cost associated with removing water from natural gas to meet pipeline requirements), gathering fees and fuel costs.
Transportation costs of $152 million for the second quarter of 2020 decreased $22 million from $174 million for the same prior year period primarily due to decreased transportation costs in the Rocky Mountain area ($14 million), Eagle Ford ($10 million) and Barnett Shale ($7 million), partially offset by increased transportation costs in the Permian Basin ($8 million) and South Texas ($3 million).
-29-
DD&A of the cost of proved oil and gas properties is calculated using the unit-of-production method. EOG's DD&A rate and expense are the composite of numerous individual DD&A group calculations. There are several factors that can impact EOG's composite DD&A rate and expense, such as field production profiles, drilling or acquisition of new wells, disposition of existing wells and reserve revisions (upward or downward) primarily related to well performance, economic factors and impairments. Changes to these factors may cause EOG's composite DD&A rate and expense to fluctuate from period to period. DD&A of the cost of other property, plant and equipment is generally calculated using the straight-line depreciation method over the useful lives of the assets.
DD&A expenses for the second quarter of 2020 decreased $250 million to $707 million from $957 million for the same prior year period. DD&A expenses associated with oil and gas properties for the second quarter of 2020 were $256 million lower than the same prior year period. The decrease primarily reflects decreased production in the United States ($202 million) and in Trinidad ($8 million) and lower unit rates in the United States ($47 million). Unit rates in the United States decreased primarily due to upward reserve revisions and reserves added at lower costs as a result of increased efficiencies. DD&A expenses associated with other property, plant and equipment for the second quarter of 2020 were $6 million higher than the same prior year period primarily due to an increase in expense related to gathering and storage assets and equipment.
G&A expenses of $132 million for the second quarter of 2020 increased $10 million from $122 million for the same prior year period primarily due to idle equipment and termination fees ($26 million) and increased information system costs ($2 million), partially offset by a decrease in professional and other services ($11 million) and employee-related costs ($5 million).
Exploration costs of $27 million for the second quarter of 2020 decreased $5 million from $33 million for the same prior year period primarily due to decreased geological and geophysical costs in the United States.
Interest expense, net of $54 million for the second quarter of 2020 increased $4 million compared to the same prior year period primarily due to the issuance of the Notes in April 2020 ($15 million), partially offset by repayment in June 2019 of the $900 million aggregate principal amount of 5.625% Senior Notes due 2019 ($9 million).
Gathering and processing costs represent operating and maintenance expenses and administrative expenses associated with operating EOG's gathering and processing assets as well as natural gas processing fees and certain NGL fractionation fees paid to third parties. EOG pays third parties to process the majority of its natural gas production to extract NGLs.
Gathering and processing costs decreased $16 million to $97 million for the second quarter of 2020 compared to $113 million for the same prior year period primarily due to decreased operating costs ($8 million) and decreased gathering and processing fees ($6 million), both in the Eagle Ford.
Impairments include: amortization of unproved oil and gas property costs as well as impairments of proved oil and gas properties; other property, plant and equipment; and other assets. Unproved properties with acquisition costs that are not individually significant are aggregated, and the portion of such costs estimated to be nonproductive is amortized over the remaining lease term. Unproved properties with individually significant acquisition costs are reviewed individually for impairment. When circumstances indicate that a proved property may be impaired, EOG compares expected undiscounted future cash flows at a DD&A group level to the unamortized capitalized cost of the asset. If the expected undiscounted future cash flows, based on EOG's estimates of (and assumptions regarding) future crude oil and natural gas prices, operating costs, development expenditures, anticipated production from proved reserves and other relevant data, are lower than the unamortized capitalized cost, the capitalized cost is reduced to fair value. Fair value is generally calculated by using the Income Approach described in the Fair Value Measurement Topic of the Financial Accounting Standards Board's Accounting Standards Codification. In certain instances, EOG utilizes accepted offers from third-party purchasers as the basis for determining fair value.
Impairments of $305 million for the second quarter of 2020 were $193 million higher than impairments for the same prior year period primarily due to the impairments of sand and crude-by-rail assets in the United States ($219 million), of proved properties as a result of the decision to exit the Horn River Basin in Canada ($19 million) and increased amortization of unproved property costs in the United States ($14 million), partially offset by lower impairments of other assets in the United States ($60 million). EOG recorded impairments of proved properties, other property, plant and equipment and other assets of $245 million and $65 million for the second quarters of 2020 and 2019, respectively.
-30-
Taxes other than income include severance/production taxes, ad valorem/property taxes, payroll taxes, franchise taxes and other miscellaneous taxes. Severance/production taxes are generally determined based on wellhead revenues, and ad valorem/property taxes are generally determined based on the valuation of the underlying assets.
Taxes other than income for the second quarter of 2020 decreased $124 million to $80 million (9.4% of wellhead revenues) from $204 million (6.8% of wellhead revenues) for the same prior year period. The decrease in taxes other than income was primarily due to decreased severance/production taxes ($119 million) and decreased ad valorem/property taxes ($8 million), partially offset by a decrease in credits available to EOG in the second quarter of 2020 for state incentive severance tax rate reductions ($4 million), all in the United States.
Other income (expense), net for the second quarter of 2020 decreased $13 million compared to the same prior year period primarily due to an increase in deferred compensation expense ($7 million) and decrease in interest income ($5 million).
In response to the economic impacts of the COVID-19 pandemic, the President of the United States signed the Coronavirus Aid, Relief, and Economic Security Act (the CARES Act) into law on March 27, 2020. The CARES Act provides economic support to individuals and businesses through enhanced loan programs, expanded unemployment benefits, and certain payroll and income tax relief, among other provisions. The primary tax benefit of the CARES Act for EOG was the acceleration of approximately $150 million of additional refundable alternative minimum tax (AMT) credits into tax year 2019. These credits originated from AMT paid by EOG in years prior to 2018 and were reflected as a deferred tax asset and a non-current receivable as of December 31, 2019 since they had been expected to either offset future current tax liabilities or be refunded on a declining balance schedule through 2021. As a result of the CARES Act, EOG has reclassified these credits from a non-current receivable in Other Assets to a current receivable in Income Taxes Receivable on the Condensed Consolidated Balance Sheet at June 30, 2020. The $150 million of additional refundable AMT credits were received in July 2020.
EOG recognized an income tax benefit of $236 million for the second quarter of 2020 compared to an income tax provision of $242 million for the second quarter of 2019, primarily due to decreased pretax income. The net effective tax rate for the second quarter of 2020 decreased to 21% from 22% in 2019.
Six Months Ended June 30, 2020 vs. Six Months Ended June 30, 2019
Operating Revenues. During the first six months of 2020, operating revenues decreased $2,935 million, or 34%, to $5,821 million from $8,756 million for the same period of 2019. Total wellhead revenues for the first six months of 2020 decreased $2,453 million, or 43%, to $3,286 million from $5,739 million for the same period of 2019. During the first six months of 2020, EOG recognized net gains on the mark-to-market of financial commodity derivative contracts of $1,079 million compared to net gains of $157 million for the same period of 2019. Gathering, processing and marketing revenues for the first six months of 2020 decreased $1,386 million, or 50%, to $1,401 million from $2,787 million for the same period of 2019. Net gains on asset dispositions were $30 million for the first six months of 2020 compared to net gains of $4 million for the same period of 2019.
-31-

Wellhead volume and price statistics for the six-month periods ended June 30, 2020 and 2019 were as follows:
Six Months EndedJune 30,
2020 2019Crude Oil and Condensate Volumes (MBbld)
United States 406.8 445.1 Trinidad 0.3 0.7 Other International 0.1 —
Total 407.2 445.8 Average Crude Oil and Condensate Prices ($/Bbl) (1)
United States $ 36.17 $ 58.63 Trinidad 27.75 46.62 Other International 53.41 57.78
Composite 36.16 58.61 Natural Gas Liquids Volumes (MBbld)
United States 131.2 125.4 Other International — —
Total 131.2 125.4 Average Natural Gas Liquids Prices ($/Bbl) (1)
United States $ 10.65 $ 17.84 Other International — —
Composite 10.65 17.84 Natural Gas Volumes (MMcfd)
United States 1,039 1,025 Trinidad 188 270 Other International 35 37
Total 1,262 1,332 Average Natural Gas Prices ($/Mcf) (1)
United States $ 1.32 $ 2.37 Trinidad 2.15 2.80 Other International 4.34 4.31
Composite 1.53 2.51 Crude Oil Equivalent Volumes (MBoed)
United States 711.1 741.3 Trinidad 31.6 45.6 Other International 6.1 6.4
Total 748.8 793.3
Total MMBoe 136.3 143.6
(1) Excludes the impact of financial commodity derivative instruments (see Note 12 to the Condensed Consolidated Financial Statements).
-32-
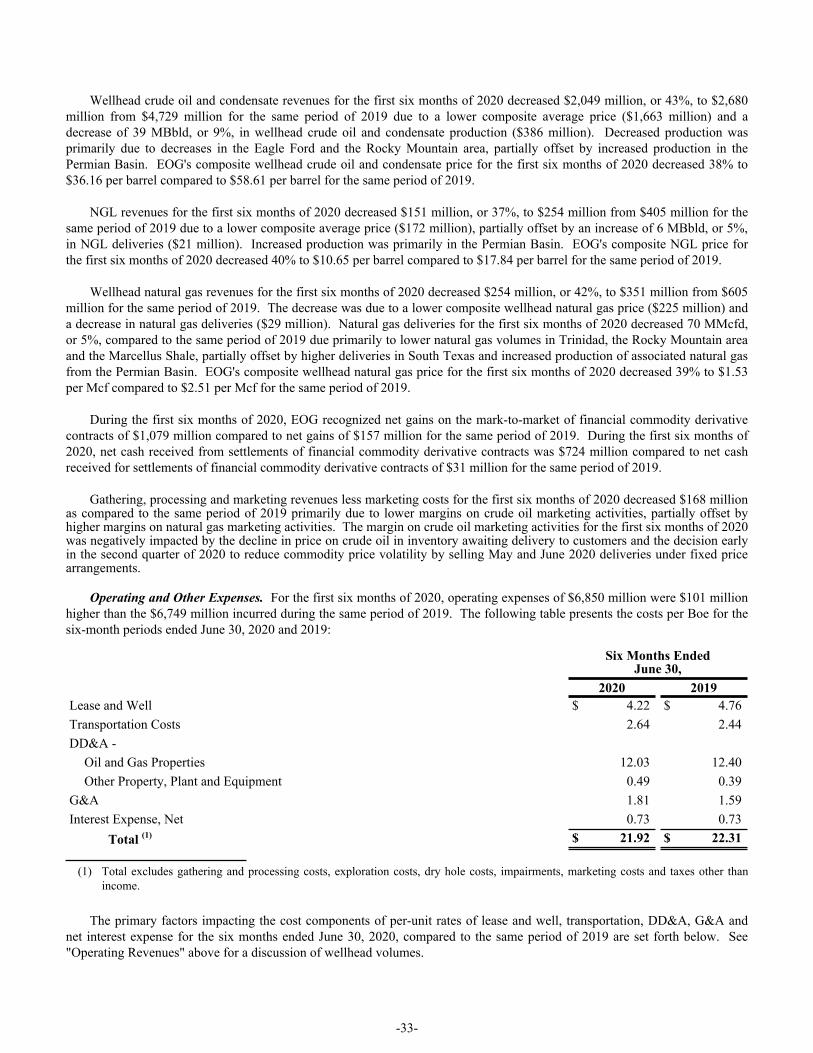
Wellhead crude oil and condensate revenues for the first six months of 2020 decreased $2,049 million, or 43%, to $2,680 million from $4,729 million for the same period of 2019 due to a lower composite average price ($1,663 million) and a decrease of 39 MBbld, or 9%, in wellhead crude oil and condensate production ($386 million). Decreased production was primarily due to decreases in the Eagle Ford and the Rocky Mountain area, partially offset by increased production in the Permian Basin. EOG's composite wellhead crude oil and condensate price for the first six months of 2020 decreased 38% to $36.16 per barrel compared to $58.61 per barrel for the same period of 2019.
NGL revenues for the first six months of 2020 decreased $151 million, or 37%, to $254 million from $405 million for the same period of 2019 due to a lower composite average price ($172 million), partially offset by an increase of 6 MBbld, or 5%, in NGL deliveries ($21 million). Increased production was primarily in the Permian Basin. EOG's composite NGL price for the first six months of 2020 decreased 40% to $10.65 per barrel compared to $17.84 per barrel for the same period of 2019.
Wellhead natural gas revenues for the first six months of 2020 decreased $254 million, or 42%, to $351 million from $605 million for the same period of 2019. The decrease was due to a lower composite wellhead natural gas price ($225 million) and a decrease in natural gas deliveries ($29 million). Natural gas deliveries for the first six months of 2020 decreased 70 MMcfd, or 5%, compared to the same period of 2019 due primarily to lower natural gas volumes in Trinidad, the Rocky Mountain area and the Marcellus Shale, partially offset by higher deliveries in South Texas and increased production of associated natural gas from the Permian Basin. EOG's composite wellhead natural gas price for the first six months of 2020 decreased 39% to $1.53 per Mcf compared to $2.51 per Mcf for the same period of 2019.
During the first six months of 2020, EOG recognized net gains on the mark-to-market of financial commodity derivative contracts of $1,079 million compared to net gains of $157 million for the same period of 2019. During the first six months of 2020, net cash received from settlements of financial commodity derivative contracts was $724 million compared to net cash received for settlements of financial commodity derivative contracts of $31 million for the same period of 2019.
Gathering, processing and marketing revenues less marketing costs for the first six months of 2020 decreased $168 million as compared to the same period of 2019 primarily due to lower margins on crude oil marketing activities, partially offset by higher margins on natural gas marketing activities. The margin on crude oil marketing activities for the first six months of 2020 was negatively impacted by the decline in price on crude oil in inventory awaiting delivery to customers and the decision early in the second quarter of 2020 to reduce commodity price volatility by selling May and June 2020 deliveries under fixed price arrangements.
Operating and Other Expenses. For the first six months of 2020, operating expenses of $6,850 million were $101 million higher than the $6,749 million incurred during the same period of 2019. The following table presents the costs per Boe for the six-month periods ended June 30, 2020 and 2019:
Six Months EndedJune 30,
2020 2019Lease and Well $ 4.22 $ 4.76 Transportation Costs 2.64 2.44 DD&A -
Oil and Gas Properties 12.03 12.40 Other Property, Plant and Equipment 0.49 0.39
G&A 1.81 1.59 Interest Expense, Net 0.73 0.73
Total (1) $ 21.92 $ 22.31
(1) Total excludes gathering and processing costs, exploration costs, dry hole costs, impairments, marketing costs and taxes other than income.
The primary factors impacting the cost components of per-unit rates of lease and well, transportation, DD&A, G&A and net interest expense for the six months ended June 30, 2020, compared to the same period of 2019 are set forth below. See "Operating Revenues" above for a discussion of wellhead volumes.
-33-

Lease and well expenses of $575 million for the first six months of 2020 decreased $109 million from $684 million for the same prior year period primarily due to decreased workover expenditures ($54 million) and decreased operating and maintenance costs ($50 million), both in the United States, and decreased operating and maintenance costs in Canada ($14 million), partially offset by increased lease and well administrative expenses in the United States ($13 million).
Transportation costs of $360 million for the first six months of 2020 increased $9 million from $351 million for the same prior year period primarily due to increased transportation costs in the Permian Basin ($43 million) and South Texas ($8 million), partially offset by decreased transportation costs in the Barnett Shale ($17 million), Rocky Mountain area ($10 million), Eagle Ford ($10 million) and Marcellus Shale ($2 million).
DD&A expenses for the first six months of 2020 decreased $130 million to $1,707 million from $1,837 million for the same prior year period. DD&A expenses associated with oil and gas properties for the first six months of 2020 were $141 million lower than the same prior year period. The decrease primarily reflects lower unit rates in the United States ($71 million) and decreased production in the United States ($61 million) and in Trinidad ($12 million). Unit rates in the United States decreased primarily due to upward reserve revisions and reserves added at lower costs as a result of increased efficiencies. DD&A expenses associated with other property, plant and equipment for the first six months of 2020 were $11 million higher than the same prior year period primarily due to an increase in expense related to gathering and storage assets and equipment.
G&A expenses of $246 million for the first six months of 2020 increased $18 million from $228 million for the same prior year period primarily due to idle equipment and termination fees ($26 million) and increased information system costs ($5 million), partially offset by a decrease in professional and other services ($8 million) and employee-related costs ($7 million).
Interest expense, net of $99 million for the first six months of 2020 decreased $6 million compared to the same prior year period primarily due to repayment in June 2019 of the $900 million aggregate principal amount of 5.625% Senior Notes due 2019 ($21 million), partially offset by the issuance of the Notes in April 2020 ($15 million).
Impairments of $1,878 million for the first six months of 2020 were $1,694 million higher than impairments for the same prior year period primarily due to increased impairments of proved properties and other assets, primarily related to legacy and non-core natural gas, crude oil and combo plays in the United States ($1,374 million), sand and crude-by-rail assets in the United States ($219 million), as a result of the decision to exit the Horn River Basin in Canada ($79 million) and increased amortization of unproved property costs in the United States ($23 million). EOG recorded impairments of proved properties, other property, plant and equipment and other assets of $1,761 million and $91 million for the first six months of 2020 and 2019, respectively.
Taxes other than income for the first six months of 2020 decreased $159 million to $238 million (7.2% of wellhead revenues) from $397 million (6.9% of wellhead revenues) for the same prior year period. The decrease in taxes other than income was primarily due to decreased severance/production taxes ($128 million), decreased ad valorem/property taxes ($27 million) and an increase in credits available to EOG in the first six months of 2020 for state incentive severance tax rate reductions ($5 million), all in the United States.
EOG recognized an income tax benefit of $215 million for the first six months of 2020 compared to an income tax provision of $433 million for the first six months of 2019, primarily due to decreased pretax income. The net effective tax rate for the first six months of 2020 decreased to 19% from 23% in the first six months of 2019. The lower effective tax rate is mostly due to EOG's foreign operations, primarily related to increased losses in Canada, which have not been tax effected due to valuation allowances.
-34-
Capital Resources and Liquidity
Cash Flow. The primary sources of cash for EOG during the six months ended June 30, 2020, were funds generated from operations, net proceeds from the issuance of long-term debt and net cash received from settlements of commodity derivative contracts. The primary uses of cash were exploration and development expenditures; funds used in operations; long-term debt repayments; dividend payments to stockholders; and other property, plant and equipment expenditures. During the first six months of 2020, EOG's cash balance increased $389 million to $2,417 million from $2,028 million at December 31, 2019.
Net cash provided by operating activities of $2,673 million for the first six months of 2020 decreased $1,621 million compared to the same period of 2019 primarily due to a decrease in wellhead revenues ($2,453 million), a decrease in net cash received relating to income taxes ($255 million) and a decrease in gathering, processing and marketing revenues less marketing costs ($168 million), partially offset by an increase in net cash received for settlements of commodity derivative contracts ($692 million), a decrease in cash operating expenses ($239 million) and a favorable change in working capital ($95 million).
Net cash used in investing activities of $2,376 million for the first six months of 2020 decreased by $1,147 million compared to the same period of 2019 due to a decrease in additions to oil and gas properties ($1,456 million) and an increase in proceeds from the sale of assets ($26 million), partially offset by an unfavorable change in components of working capital associated with investing activities ($304 million) and an increase in additions to other property, plant and equipment ($30 million).
Net cash provided by financing activities of $92 million for the first six months of 2020 included net proceeds from the issuance of long-term debt ($1,484 million). Net cash used in financing activities for the first six months of 2020 included repayments of long-term debt ($1,000 million) and cash dividend payments ($384 million). Net cash used in financing activities of $1,166 million for the first six months of 2019 included repayments of long-term debt ($900 million) and cash dividend payments ($255 million).
-35-
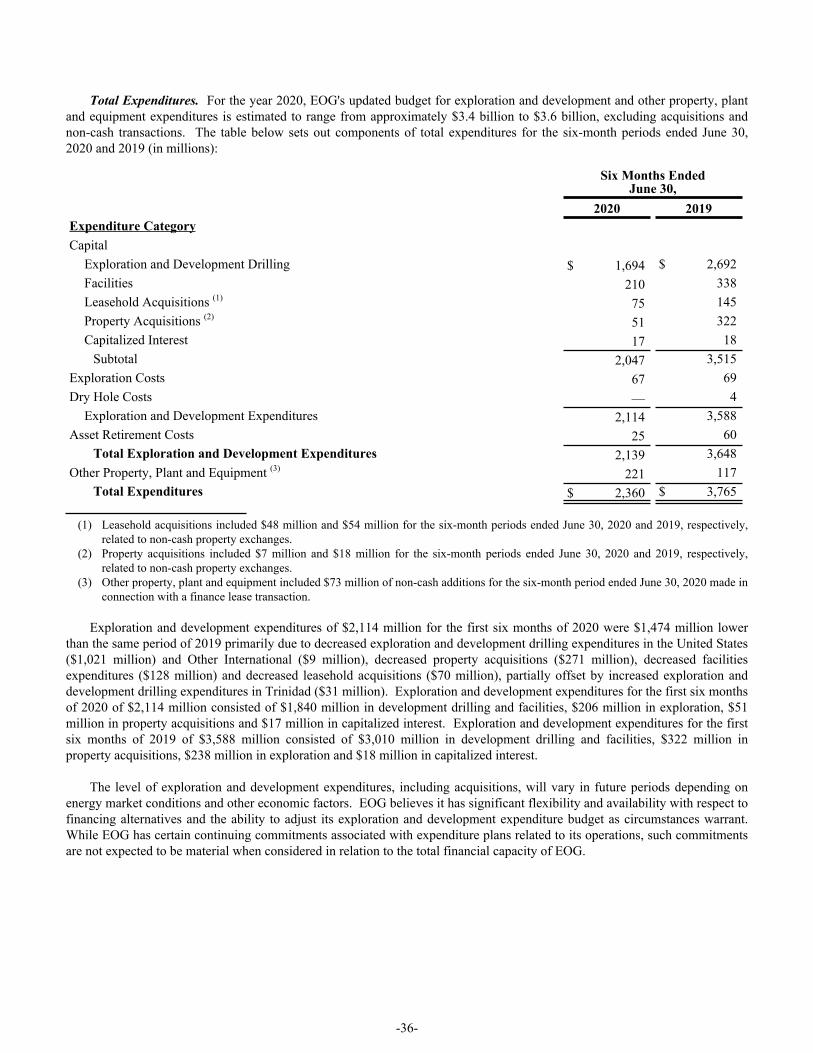
Total Expenditures. For the year 2020, EOG's updated budget for exploration and development and other property, plant and equipment expenditures is estimated to range from approximately $3.4 billion to $3.6 billion, excluding acquisitions and non-cash transactions. The table below sets out components of total expenditures for the six-month periods ended June 30, 2020 and 2019 (in millions):
Six Months EndedJune 30,
2020 2019Expenditure CategoryCapital
Exploration and Development Drilling $ 1,694 $ 2,692 Facilities 210 338 Leasehold Acquisitions (1) 75 145 Property Acquisitions (2) 51 322 Capitalized Interest 17 18
Subtotal 2,047 3,515 Exploration Costs 67 69 Dry Hole Costs — 4
Exploration and Development Expenditures 2,114 3,588 Asset Retirement Costs 25 60
Total Exploration and Development Expenditures 2,139 3,648 Other Property, Plant and Equipment (3) 221 117
Total Expenditures $ 2,360 $ 3,765
(1) Leasehold acquisitions included $48 million and $54 million for the six-month periods ended June 30, 2020 and 2019, respectively, related to non-cash property exchanges.
(2) Property acquisitions included $7 million and $18 million for the six-month periods ended June 30, 2020 and 2019, respectively, related to non-cash property exchanges.
(3) Other property, plant and equipment included $73 million of non-cash additions for the six-month period ended June 30, 2020 made in connection with a finance lease transaction.
Exploration and development expenditures of $2,114 million for the first six months of 2020 were $1,474 million lower than the same period of 2019 primarily due to decreased exploration and development drilling expenditures in the United States ($1,021 million) and Other International ($9 million), decreased property acquisitions ($271 million), decreased facilities expenditures ($128 million) and decreased leasehold acquisitions ($70 million), partially offset by increased exploration and development drilling expenditures in Trinidad ($31 million). Exploration and development expenditures for the first six months of 2020 of $2,114 million consisted of $1,840 million in development drilling and facilities, $206 million in exploration, $51 million in property acquisitions and $17 million in capitalized interest. Exploration and development expenditures for the first six months of 2019 of $3,588 million consisted of $3,010 million in development drilling and facilities, $322 million in property acquisitions, $238 million in exploration and $18 million in capitalized interest.
The level of exploration and development expenditures, including acquisitions, will vary in future periods depending on energy market conditions and other economic factors. EOG believes it has significant flexibility and availability with respect to financing alternatives and the ability to adjust its exploration and development expenditure budget as circumstances warrant. While EOG has certain continuing commitments associated with expenditure plans related to its operations, such commitments are not expected to be material when considered in relation to the total financial capacity of EOG.
-36-
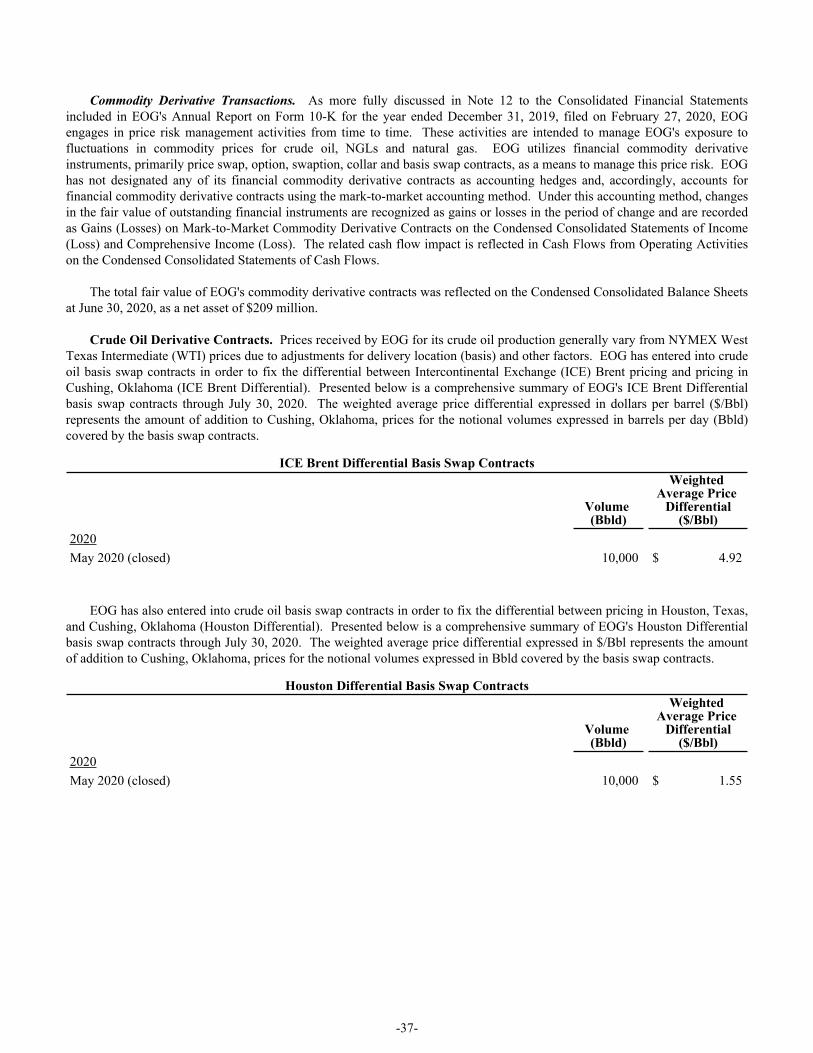
Commodity Derivative Transactions. As more fully discussed in Note 12 to the Consolidated Financial Statements included in EOG's Annual Report on Form 10-K for the year ended December 31, 2019, filed on February 27, 2020, EOG engages in price risk management activities from time to time. These activities are intended to manage EOG's exposure to fluctuations in commodity prices for crude oil, NGLs and natural gas. EOG utilizes financial commodity derivative instruments, primarily price swap, option, swaption, collar and basis swap contracts, as a means to manage this price risk. EOG has not designated any of its financial commodity derivative contracts as accounting hedges and, accordingly, accounts for financial commodity derivative contracts using the mark-to-market accounting method. Under this accounting method, changes in the fair value of outstanding financial instruments are recognized as gains or losses in the period of change and are recorded as Gains (Losses) on Mark-to-Market Commodity Derivative Contracts on the Condensed Consolidated Statements of Income (Loss) and Comprehensive Income (Loss). The related cash flow impact is reflected in Cash Flows from Operating Activities on the Condensed Consolidated Statements of Cash Flows.
The total fair value of EOG's commodity derivative contracts was reflected on the Condensed Consolidated Balance Sheets at June 30, 2020, as a net asset of $209 million.
Crude Oil Derivative Contracts. Prices received by EOG for its crude oil production generally vary from NYMEX West Texas Intermediate (WTI) prices due to adjustments for delivery location (basis) and other factors. EOG has entered into crude oil basis swap contracts in order to fix the differential between Intercontinental Exchange (ICE) Brent pricing and pricing in Cushing, Oklahoma (ICE Brent Differential). Presented below is a comprehensive summary of EOG's ICE Brent Differential basis swap contracts through July 30, 2020. The weighted average price differential expressed in dollars per barrel ($/Bbl) represents the amount of addition to Cushing, Oklahoma, prices for the notional volumes expressed in barrels per day (Bbld) covered by the basis swap contracts.
ICE Brent Differential Basis Swap Contracts
Volume (Bbld)
Weighted Average Price
Differential($/Bbl)
2020May 2020 (closed) 10,000 $ 4.92
EOG has also entered into crude oil basis swap contracts in order to fix the differential between pricing in Houston, Texas, and Cushing, Oklahoma (Houston Differential). Presented below is a comprehensive summary of EOG's Houston Differential basis swap contracts through July 30, 2020. The weighted average price differential expressed in $/Bbl represents the amount of addition to Cushing, Oklahoma, prices for the notional volumes expressed in Bbld covered by the basis swap contracts.
Houston Differential Basis Swap Contracts
Volume (Bbld)
Weighted Average Price
Differential($/Bbl)
2020May 2020 (closed) 10,000 $ 1.55
-37-
EOG has also entered into crude oil swaps in order to fix the differential in pricing between the NYMEX calendar month average and the physical crude oil delivery month (Roll Differential). Presented below is a comprehensive summary of EOG's Roll Differential swap contracts through July 30, 2020. The weighted average price differential expressed in $/Bbl represents the amount of net addition (reduction) to delivery month prices for the notional volumes expressed in Bbld covered by the swap contracts.
Roll Differential Swap Contracts
Volume (Bbld)
Weighted Average Price
Differential($/Bbl)
2020February 1, 2020 through June 30, 2020 (closed) 10,000 $ 0.70 July 1, 2020 through August 31, 2020 (closed) 88,000 (1.16) September 2020 88,000 (1.16) October 1, 2020 through December 31, 2020 66,000 (1.16)
In May 2020, EOG entered into crude oil Roll Differential swap contracts for the period from July 1, 2020 through September 30, 2020, with notional volumes of 22,000 Bbld at a weighted average price differential of $(0.43) per Bbl, and for the period from October 1, 2020 through December 31, 2020, with notional volumes of 44,000 Bbld at a weighted average price differential of $(0.73) per Bbl. These contracts partially offset certain outstanding Roll Differential swap contracts for the same time periods and volumes at a weighted average price differential of $(1.16) per Bbl. EOG expects to pay net cash of $3.2 million for the settlement of these contracts. The offsetting contracts were excluded from the above table.
Presented below is a comprehensive summary of EOG's crude oil NYMEX WTI price swap contracts through July 30, 2020, with notional volumes expressed in Bbld and prices expressed in $/Bbl.
Crude Oil NYMEX WTI Price Swap Contracts
Volume (Bbld)
Weighted Average Price
($/Bbl)2020January 1, 2020 through March 31, 2020 (closed) 200,000 $ 59.33 April 1, 2020 through May 31, 2020 (closed) 265,000 51.36
In April and May 2020, EOG entered into crude oil NYMEX WTI price swap contracts for the period from June 1, 2020 through June 30, 2020, with notional volumes of 265,000 Bbld at a weighted average price of $33.80 per Bbl, for the period from July 1, 2020 through July 31, 2020, with notional volumes of 254,000 Bbld at a weighted average price of $33.75 per Bbl, for the period from August 1, 2020 through September 30, 2020, with notional volumes of 154,000 Bbld at a weighted average price of $34.18 per Bbl and for the period from October 1, 2020 through December 31, 2020, with notional volumes of 47,000 Bbld at a weighted average price of $30.04 per Bbl. These contracts offset the remaining NYMEX WTI price swap contracts for the same time periods and volumes at a weighted average price of $51.36 per Bbl for the period from June 1, 2020 through June 30, 2020, $42.36 per Bbl for the period from July 1, 2020 through July 31, 2020, $50.42 per Bbl for the period from August 1, 2020 through September 30, 2020 and $31.00 per Bbl for the period from October 1, 2020 through December 31, 2020. EOG expects to receive net cash of $364.0 million for the settlement of these contracts. The offsetting contracts were excluded from the above table.
-38-
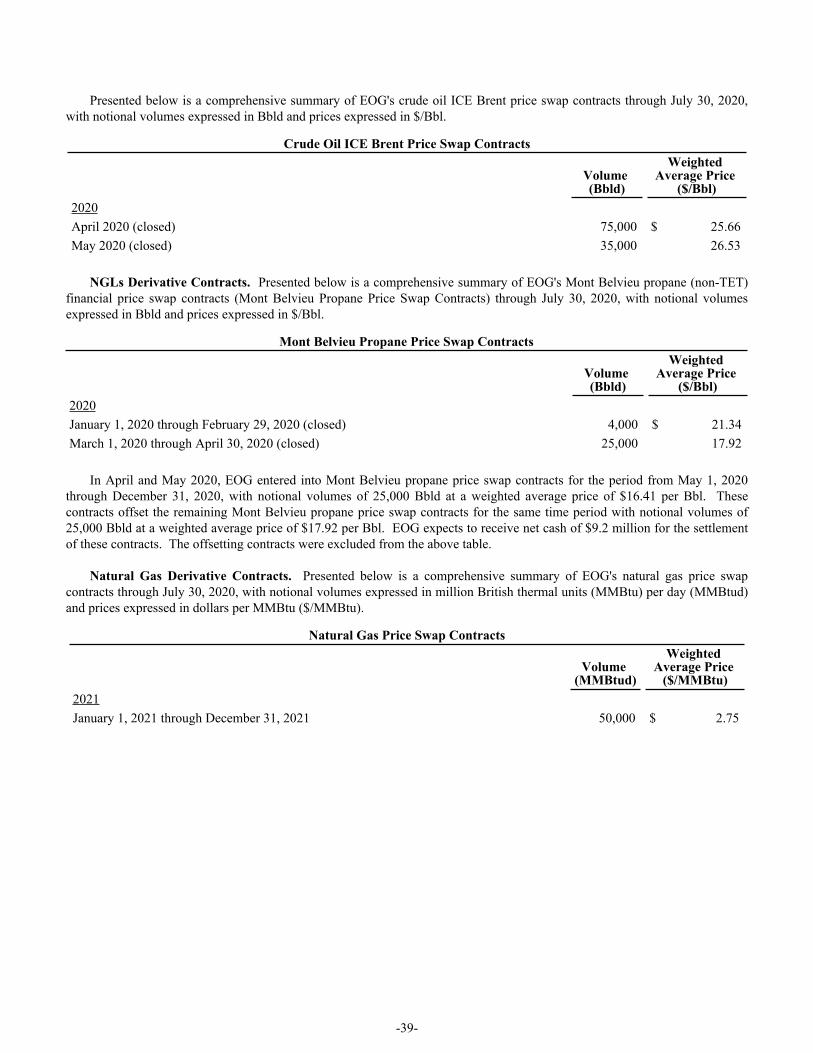
Presented below is a comprehensive summary of EOG's crude oil ICE Brent price swap contracts through July 30, 2020, with notional volumes expressed in Bbld and prices expressed in $/Bbl.
Crude Oil ICE Brent Price Swap Contracts
Volume (Bbld)
Weighted Average Price
($/Bbl)2020April 2020 (closed) 75,000 $ 25.66 May 2020 (closed) 35,000 26.53
NGLs Derivative Contracts. Presented below is a comprehensive summary of EOG's Mont Belvieu propane (non-TET) financial price swap contracts (Mont Belvieu Propane Price Swap Contracts) through July 30, 2020, with notional volumes expressed in Bbld and prices expressed in $/Bbl.
Mont Belvieu Propane Price Swap Contracts
Volume (Bbld)
Weighted Average Price
($/Bbl)2020January 1, 2020 through February 29, 2020 (closed) 4,000 $ 21.34 March 1, 2020 through April 30, 2020 (closed) 25,000 17.92
In April and May 2020, EOG entered into Mont Belvieu propane price swap contracts for the period from May 1, 2020 through December 31, 2020, with notional volumes of 25,000 Bbld at a weighted average price of $16.41 per Bbl. These contracts offset the remaining Mont Belvieu propane price swap contracts for the same time period with notional volumes of 25,000 Bbld at a weighted average price of $17.92 per Bbl. EOG expects to receive net cash of $9.2 million for the settlement of these contracts. The offsetting contracts were excluded from the above table.
Natural Gas Derivative Contracts. Presented below is a comprehensive summary of EOG's natural gas price swap contracts through July 30, 2020, with notional volumes expressed in million British thermal units (MMBtu) per day (MMBtud) and prices expressed in dollars per MMBtu ($/MMBtu).
Natural Gas Price Swap Contracts
Volume
(MMBtud)
Weighted Average Price
($/MMBtu)2021January 1, 2021 through December 31, 2021 50,000 $ 2.75
-39-

EOG has entered into natural gas collar contracts, which establish ceiling and floor prices for the sale of notional volumes of natural gas as specified in the collar contracts. The collars require that EOG pay the difference between the ceiling price and the NYMEX Henry Hub natural gas price for the contract month (Henry Hub Index Price) in the event the Henry Hub Index Price is above the ceiling price. The collars grant EOG the right to receive the difference between the floor price and the Henry Hub Index Price in the event the Henry Hub Index Price is below the floor price. In March 2020, EOG executed the early termination provision granting EOG the right to terminate certain 2020 natural gas collar contracts with notional volumes of 250,000 MMBtud at a weighted average ceiling price of $2.50 per MMBtu and a weighted average floor price of $2.00 per MMBtu for the period from April 1, 2020 through July 31, 2020. The net cash EOG received for settling these contracts was $7.8 million. Presented below is a comprehensive summary of EOG's natural gas collar contracts through July 30, 2020, with notional volumes expressed in MMBtud and prices expressed in $/MMBtu.
Natural Gas Collar ContractsWeighted Average Price ($/MMBtu)
Volume (MMBtud) Ceiling Price Floor Price2020April 1, 2020 through July 31, 2020 (closed) 250,000 $ 2.50 $ 2.00
In April 2020, EOG entered into natural gas collar contracts for the period from August 1, 2020 through October 31, 2020, with notional volumes of 250,000 MMBtud at a ceiling price of $2.50 per MMBtu and a floor price of $2.00 per MMBtu. These contracts offset the remaining natural gas collar contracts for the same time period with notional volumes of 250,000 MMBtud at a ceiling price of $2.50 per MMBtu and a floor price of $2.00 per MMBtu. EOG expects to receive net cash of $1.1 million for the settlement of these contracts. The offsetting contracts were excluded from the above table.
Prices received by EOG for its natural gas production generally vary from NYMEX Henry Hub prices due to adjustments for delivery location (basis) and other factors. EOG has entered into natural gas basis swap contracts in order to fix the differential between pricing in the Rocky Mountain area and NYMEX Henry Hub prices (Rockies Differential). Presented below is a comprehensive summary of EOG's Rockies Differential basis swap contracts through July 30, 2020. The weighted average price differential expressed in $/MMBtu represents the amount of reduction to NYMEX Henry Hub prices for the notional volumes expressed in MMBtud covered by the basis swap contracts.
Rockies Differential Basis Swap Contracts
Volume
(MMBtud)
Weighted Average Price
Differential ($/MMBtu)
2020January 1, 2020 through July 31, 2020 (closed) 30,000 $ 0.55 August 1, 2020 through December 31, 2020 30,000 0.55
EOG has also entered into natural gas basis swap contracts in order to fix the differential between pricing at the Houston Ship Channel (HSC) and NYMEX Henry Hub prices (HSC Differential). In March 2020, EOG executed the early termination provision granting EOG the right to terminate certain 2020 HSC Differential basis swaps with notional volumes of 60,000 MMBtud at a weighted average price differential of $0.05 per MMBtu for the period from April 1, 2020 through December 31, 2020. The net cash EOG paid for settling these contracts was $0.4 million. Presented below is a comprehensive summary of EOG's HSC Differential basis swap contracts through July 30, 2020. The weighted average price differential expressed in $/MMBtu represents the amount of reduction to NYMEX Henry Hub prices for the notional volumes expressed in MMBtud covered by the basis swap contracts.
HSC Differential Basis Swap Contracts
Volume
(MMBtud)
Weighted Average Price
Differential ($/MMBtu)
2020January 1, 2020 through December 31, 2020 (closed) 60,000 $ 0.05
-40-
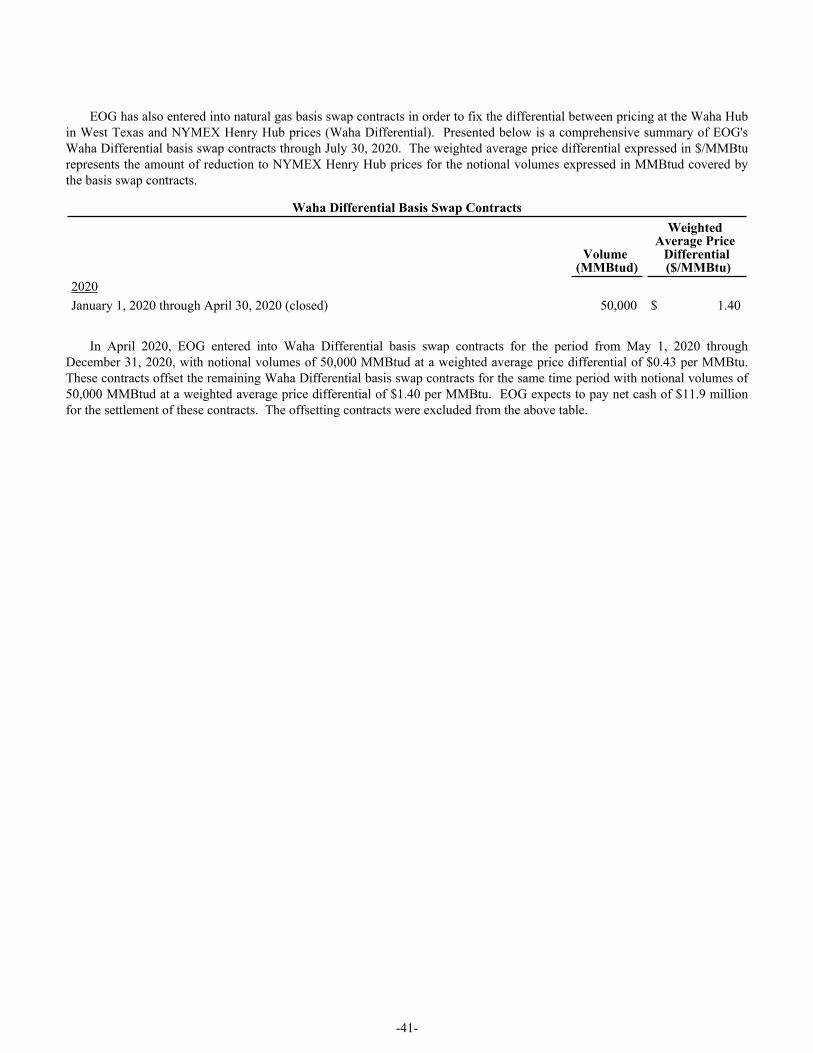
EOG has also entered into natural gas basis swap contracts in order to fix the differential between pricing at the Waha Hub in West Texas and NYMEX Henry Hub prices (Waha Differential). Presented below is a comprehensive summary of EOG's Waha Differential basis swap contracts through July 30, 2020. The weighted average price differential expressed in $/MMBtu represents the amount of reduction to NYMEX Henry Hub prices for the notional volumes expressed in MMBtud covered by the basis swap contracts.
Waha Differential Basis Swap Contracts
Volume
(MMBtud)
Weighted Average Price
Differential ($/MMBtu)
2020January 1, 2020 through April 30, 2020 (closed) 50,000 $ 1.40
In April 2020, EOG entered into Waha Differential basis swap contracts for the period from May 1, 2020 through December 31, 2020, with notional volumes of 50,000 MMBtud at a weighted average price differential of $0.43 per MMBtu. These contracts offset the remaining Waha Differential basis swap contracts for the same time period with notional volumes of 50,000 MMBtud at a weighted average price differential of $1.40 per MMBtu. EOG expects to pay net cash of $11.9 million for the settlement of these contracts. The offsetting contracts were excluded from the above table.
-41-
Information Regarding Forward-Looking Statements
This Quarterly Report on Form 10-Q includes forward-looking statements within the meaning of Section 27A of the Securities Act of 1933, as amended, and Section 21E of the Securities Exchange Act of 1934, as amended. All statements, other than statements of historical facts, including, among others, statements and projections regarding EOG's future financial position, operations, performance, business strategy, returns, budgets, reserves, levels of production, capital expenditures, costs and asset sales, statements regarding future commodity prices and statements regarding the plans and objectives of EOG's management for future operations, are forward-looking statements. EOG typically uses words such as "expect," "anticipate," "estimate," "project," "strategy," "intend," "plan," "target," "aims," "goal," "may," "will," "should" and "believe" or the negative of those terms or other variations or comparable terminology to identify its forward-looking statements. In particular, statements, express or implied, concerning EOG's future operating results and returns or EOG's ability to replace or increase reserves, increase production, generate returns, replace or increase drilling locations, reduce or otherwise control operating costs and capital expenditures, generate cash flows, pay down or refinance indebtedness or pay and/or increase dividends are forward-looking statements. Forward-looking statements are not guarantees of performance. Although EOG believes the expectations reflected in its forward-looking statements are reasonable and are based on reasonable assumptions, no assurance can be given that these assumptions are accurate or that any of these expectations will be achieved (in full or at all) or will prove to have been correct. Moreover, EOG's forward-looking statements may be affected by known, unknown or currently unforeseen risks, events or circumstances that may be outside EOG's control. Important factors that could cause EOG's actual results to differ materially from the expectations reflected in EOG's forward-looking statements include, among others:
• the timing, extent and duration of changes in prices for, supplies of, and demand for, crude oil and condensate, natural gas liquids, natural gas and related commodities;
• the extent to which EOG is successful in its efforts to acquire or discover additional reserves; • the extent to which EOG is successful in its efforts to (i) economically develop its acreage in, (ii) produce reserves
and achieve anticipated production levels and rates of return from, (iii) decrease or otherwise control its drilling, completion, operating and capital costs related to, and (iv) maximize reserve recovery from, its existing and future crude oil and natural gas exploration and development projects and associated potential and existing drilling locations;
• the extent to which EOG is successful in its efforts to market its crude oil and condensate, natural gas liquids, natural gas and related commodity production;
• security threats, including cybersecurity threats and disruptions to our business and operations from breaches of our information technology systems, physical breaches of our facilities and other infrastructure or breaches of the information technology systems, facilities and infrastructure of third parties with which we transact business;
• the availability, proximity and capacity of, and costs associated with, appropriate gathering, processing, compression, storage, transportation and refining facilities;
• the availability, cost, terms and timing of issuance or execution of, and competition for, mineral licenses and leases and governmental and other permits and rights-of-way, and EOG’s ability to retain mineral licenses and leases;
• the impact of, and changes in, government policies, laws and regulations, including tax laws and regulations; climate change and other environmental, health and safety laws and regulations relating to air emissions, disposal of produced water, drilling fluids and other wastes, hydraulic fracturing and access to and use of water; laws and regulations imposing conditions or restrictions on drilling and completion operations and on the transportation of crude oil and natural gas; laws and regulations with respect to derivatives and hedging activities; and laws and regulations with respect to the import and export of crude oil, natural gas and related commodities;
• EOG's ability to effectively integrate acquired crude oil and natural gas properties into its operations, fully identify existing and potential problems with respect to such properties and accurately estimate reserves, production and drilling, completing and operating costs with respect to such properties;
• the extent to which EOG's third-party-operated crude oil and natural gas properties are operated successfully and economically;
• competition in the oil and gas exploration and production industry for the acquisition of licenses, leases and properties, employees and other personnel, facilities, equipment, materials and services;
• the availability and cost of employees and other personnel, facilities, equipment, materials (such as water and tubulars) and services;
• the accuracy of reserve estimates, which by their nature involve the exercise of professional judgment and may therefore be imprecise;
-42-

• weather, including its impact on crude oil and natural gas demand, and weather-related delays in drilling and in the installation and operation (by EOG or third parties) of production, gathering, processing, refining, compression, storage and transportation facilities;
• the ability of EOG's customers and other contractual counterparties to satisfy their obligations to EOG and, related thereto, to access the credit and capital markets to obtain financing needed to satisfy their obligations to EOG;
• EOG's ability to access the commercial paper market and other credit and capital markets to obtain financing on terms it deems acceptable, if at all, and to otherwise satisfy its capital expenditure requirements;
• the extent to which EOG is successful in its completion of planned asset dispositions;• the extent and effect of any hedging activities engaged in by EOG;• the timing and extent of changes in foreign currency exchange rates, interest rates, inflation rates, global and
domestic financial market conditions and global and domestic general economic conditions;• the duration and economic and financial impact of epidemics, pandemics or other public health issues, including
the COVID-19 pandemic;• geopolitical factors and political conditions and developments around the world (such as the imposition of tariffs
or trade or other economic sanctions, political instability and armed conflict), including in the areas in which EOG operates;
• the use of competing energy sources and the development of alternative energy sources;• the extent to which EOG incurs uninsured losses and liabilities or losses and liabilities in excess of its insurance
coverage;• acts of war and terrorism and responses to these acts; and• the other factors described under ITEM 1A, Risk Factors, on pages 13 through 23 of EOG's Annual Report on
Form 10-K for the fiscal year ended December 31, 2019, under ITEM 1A, Risk Factors, on page 37 of EOG's Quarterly Report on Form 10-Q for the quarterly period ended March 31, 2020, and under ITEM 1A, Risk Factors, in this Quarterly Report on Form 10-Q, and any updates to those factors set forth in EOG's subsequent Quarterly Reports on Form 10-Q or Current Reports on Form 8-K.
In light of these risks, uncertainties and assumptions, the events anticipated by EOG's forward-looking statements may not occur, and, if any of such events do, we may not have anticipated the timing of their occurrence or the duration or extent of their impact on our actual results. Accordingly, you should not place any undue reliance on any of EOG's forward-looking statements. EOG's forward-looking statements speak only as of the date made, and EOG undertakes no obligation, other than as required by applicable law, to update or revise its forward-looking statements, whether as a result of new information, subsequent events, anticipated or unanticipated circumstances or otherwise.
-43-
PART I. FINANCIAL INFORMATION
ITEM 3. QUANTITATIVE AND QUALITATIVE DISCLOSURES ABOUT MARKET RISKEOG RESOURCES, INC.
EOG's exposure to commodity price risk, interest rate risk and foreign currency exchange rate risk is discussed in (i) the "Commodity Derivative Transactions," "Financing," "Foreign Currency Exchange Rate Risk" and "Outlook" sections of "Management's Discussion and Analysis of Financial Condition and Results of Operations - Capital Resources and Liquidity" on pages 40 through 46 of EOG's Annual Report on Form 10-K for the year ended December 31, 2019, filed on February 27, 2020 (EOG's 2019 Annual Report); and (ii) Note 12, "Risk Management Activities," to EOG's Consolidated Financial Statements on pages F-30 through F-33 of EOG's 2019 Annual Report. There have been no material changes in this information. For additional information regarding EOG's financial commodity derivative contracts and physical commodity contracts, see (i) Note 12, "Risk Management Activities," to EOG's Condensed Consolidated Financial Statements in this Quarterly Report on Form 10-Q; (ii) "Management's Discussion and Analysis of Financial Condition and Results of Operations - Results of Operations - Operating Revenues" in this Quarterly Report on Form 10-Q; and (iii) "Management's Discussion and Analysis of Financial Condition and Results of Operations - Capital Resources and Liquidity - Commodity Derivative Transactions" in this Quarterly Report on Form 10-Q.
ITEM 4. CONTROLS AND PROCEDURESEOG RESOURCES, INC.
Disclosure Controls and Procedures. EOG's management, with the participation of EOG's principal executive officer and principal financial officer, evaluated the effectiveness of EOG's disclosure controls and procedures (as defined in Rules 13a-15(e) and 15d-15(e) promulgated under the Securities Exchange Act of 1934, as amended (Exchange Act)) as of the end of the period covered by this Quarterly Report on Form 10-Q (Evaluation Date). Based on this evaluation, EOG's principal executive officer and principal financial officer have concluded that EOG's disclosure controls and procedures were effective as of the Evaluation Date in ensuring that information that is required to be disclosed in the reports EOG files or furnishes under the Exchange Act is (i) recorded, processed, summarized and reported within the time periods specified in the United States Securities and Exchange Commission's rules and forms and (ii) accumulated and communicated to EOG's management, as appropriate, to allow timely decisions regarding required disclosure.
Internal Control Over Financial Reporting. There were no changes in EOG's internal control over financial reporting (as defined in Rules 13a-15(f) and 15d-15(f) promulgated under the Exchange Act) that occurred during the quarterly period covered by this Quarterly Report on Form 10-Q that have materially affected, or are reasonably likely to materially affect, EOG's internal control over financial reporting.
-44-

PART II. OTHER INFORMATION
EOG RESOURCES, INC.
ITEM 1. LEGAL PROCEEDINGS
See Part I, Item 1, Note 8 to Condensed Consolidated Financial Statements, which is incorporated herein by reference.
ITEM 1A. RISK FACTORS
There have been no material changes from the risk factors disclosed in Item 1A. Risk Factors of our Annual Report on Form 10-K for the year ended December 31, 2019, other than the following:
Outbreaks of communicable diseases can adversely affect our business, financial condition and results of operations.
Global or national health concerns, including a widespread outbreak of contagious disease, can, among other impacts, negatively impact the global economy, reduce demand and pricing for crude oil, natural gas liquids (NGLs) and natural gas, lead to operational disruptions and limit our ability to execute on our business plan, any of which could materially and adversely affect our business, financial condition and results of operations. Furthermore, uncertainty regarding the impact of any outbreak of contagious disease could lead to increased volatility in crude oil, NGLs and natural gas prices.
For example, the current pandemic involving a highly transmissible and pathogenic coronavirus (COVID-19) and the measures being taken to address and limit the spread of the virus have adversely affected the economies and financial markets of the world, resulting in an economic downturn that has negatively impacted, and may continue to negatively impact, global demand and prices for crude oil and condensate, natural gas liquids (NGLs) and natural gas. The resulting decline in commodity prices has materially and adversely affected our cash flows and results of operations; if such decline were to continue for an extended period of time or worsen, our cash flows and results of operations would be further adversely affected. For further discussion regarding the potential impacts on us of lower commodity prices and extended declines in commodity prices, see ITEM 1A, Risk Factors, of our Annual Report on Form 10-K for the fiscal year ended December 31, 2019, filed on February 27, 2020.
If the COVID-19 outbreak should continue or worsen, we may also experience disruptions to commodities markets, equipment supply chains and the availability of our workforce, which could adversely affect our ability to conduct our business and operations. Further, if the resulting economic downturn and adverse impact on commodity prices should continue or worsen, our customers and other contractual parties may be unable to pay amounts owed to us from time to time and to otherwise satisfy their contractual obligations to us, and may be unable to access the credit and capital markets for such purposes. Such inability of our customers and other contractual counterparties may materially and adversely affect our business, financial condition, results of operations and cash flows.
There are still too many variables and uncertainties regarding the COVID-19 pandemic - including the ultimate geographic spread of the virus, the duration and severity of the outbreak and the extent of travel restrictions and business closures imposed in affected countries - to fully assess the potential impact on our business, financial condition and results of operations.
-45-
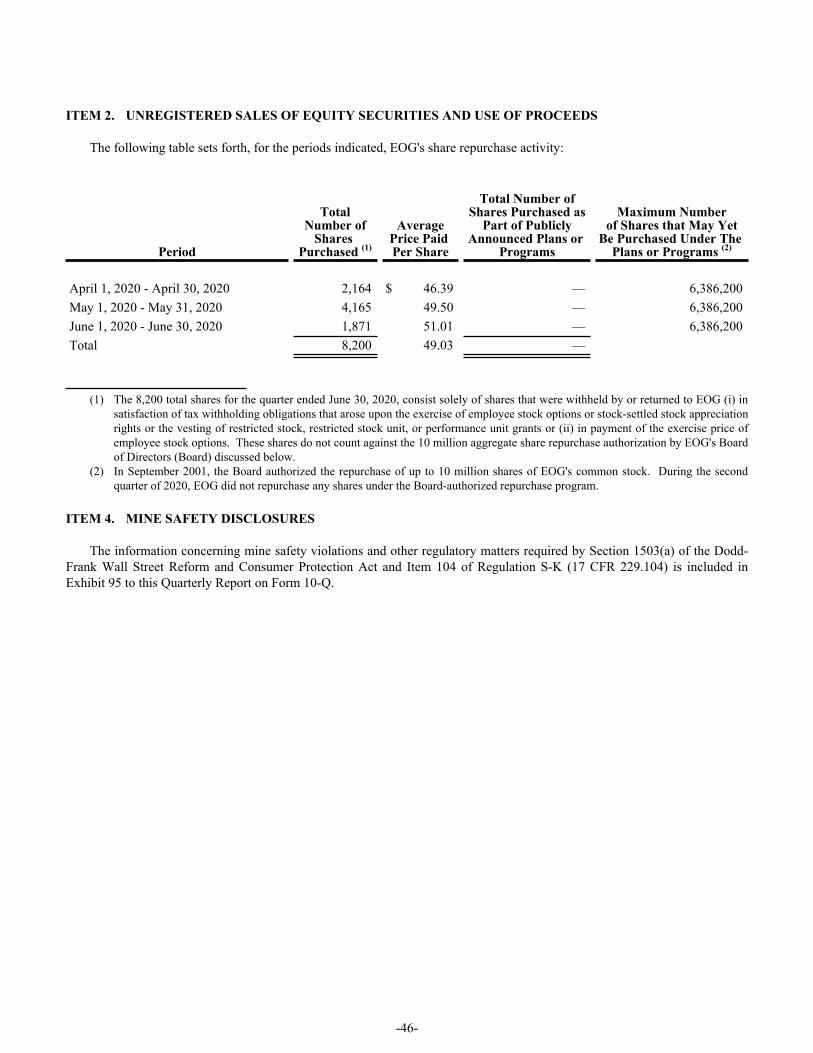
ITEM 2. UNREGISTERED SALES OF EQUITY SECURITIES AND USE OF PROCEEDS
The following table sets forth, for the periods indicated, EOG's share repurchase activity:
Period
TotalNumber of
Shares Purchased (1)
AveragePrice Paid Per Share
Total Number ofShares Purchased as
Part of PubliclyAnnounced Plans or
Programs
Maximum Numberof Shares that May Yet
Be Purchased Under The Plans or Programs (2)
April 1, 2020 - April 30, 2020 2,164 $ 46.39 — 6,386,200 May 1, 2020 - May 31, 2020 4,165 49.50 — 6,386,200 June 1, 2020 - June 30, 2020 1,871 51.01 — 6,386,200 Total 8,200 49.03 —
(1) The 8,200 total shares for the quarter ended June 30, 2020, consist solely of shares that were withheld by or returned to EOG (i) in satisfaction of tax withholding obligations that arose upon the exercise of employee stock options or stock-settled stock appreciation rights or the vesting of restricted stock, restricted stock unit, or performance unit grants or (ii) in payment of the exercise price of employee stock options. These shares do not count against the 10 million aggregate share repurchase authorization by EOG's Board of Directors (Board) discussed below.
(2) In September 2001, the Board authorized the repurchase of up to 10 million shares of EOG's common stock. During the second quarter of 2020, EOG did not repurchase any shares under the Board-authorized repurchase program.
ITEM 4. MINE SAFETY DISCLOSURES
The information concerning mine safety violations and other regulatory matters required by Section 1503(a) of the Dodd-Frank Wall Street Reform and Consumer Protection Act and Item 104 of Regulation S-K (17 CFR 229.104) is included in Exhibit 95 to this Quarterly Report on Form 10-Q.
-46-

ITEM 6. EXHIBITS
Exhibit No. Description
3.1(a) - Restated Certificate of Incorporation, dated September 3, 1987 (incorporated by reference to Exhibit 3.1(a) to EOG's Annual Report on Form 10-K for the year ended December 31, 2008) (SEC File No. 001-09743).
3.1(b) - Certificate of Amendment of Restated Certificate of Incorporation, dated May 5, 1993 (incorporated by reference to Exhibit 4.1(b) to EOG's Registration Statement on Form S-8, SEC File No. 33-52201, filed February 8, 1994).
3.1(c) - Certificate of Amendment of Restated Certificate of Incorporation, dated June 14, 1994 (incorporated by reference to Exhibit 4.1(c) to EOG's Registration Statement on Form S-8, SEC File No. 33-58103, filed March 15, 1995).
3.1(d) - Certificate of Amendment of Restated Certificate of Incorporation, dated June 11, 1996 (incorporated by reference to Exhibit 3(d) to EOG's Registration Statement on Form S-3, SEC File No. 333-09919, filed August 9, 1996).
3.1(e) - Certificate of Amendment of Restated Certificate of Incorporation, dated May 7, 1997 (incorporated by reference to Exhibit 3(e) to EOG's Registration Statement on Form S-3, SEC File No. 333-44785, filed January 23, 1998).
3.1(f) - Certificate of Ownership and Merger Merging EOG Resources, Inc. into Enron Oil & Gas Company, dated August 26, 1999 (incorporated by reference to Exhibit 3.1(f) to EOG's Annual Report on Form 10-K for the year ended December 31, 1999) (SEC File No. 001-09743).
3.1(g) - Certificate of Designations of Series E Junior Participating Preferred Stock, dated February 14, 2000 (incorporated by reference to Exhibit 2 to EOG's Registration Statement on Form 8-A, SEC File No. 001-09743, filed February 18, 2000).
3.1(h) - Certificate of Elimination of the Fixed Rate Cumulative Perpetual Senior Preferred Stock, Series A, dated September 13, 2000 (incorporated by reference to Exhibit 3.1(j) to EOG's Registration Statement on Form S-3, SEC File No. 333-46858, filed September 28, 2000).
3.1(i) - Certificate of Elimination of the Flexible Money Market Cumulative Preferred Stock, Series C, dated September 13, 2000 (incorporated by reference to Exhibit 3.1(k) to EOG's Registration Statement on Form S-3, SEC File No. 333-46858, filed September 28, 2000).
3.1(j) - Certificate of Elimination of the Flexible Money Market Cumulative Preferred Stock, Series D, dated February 24, 2005 (incorporated by reference to Exhibit 3.1(k) to EOG's Annual Report on Form 10-K for the year ended December 31, 2004) (SEC File No. 001-09743).
3.1(k) - Amended Certificate of Designations of Series E Junior Participating Preferred Stock, dated March 7, 2005 (incorporated by reference to Exhibit 3.1(m) to EOG's Annual Report on Form 10-K for the year ended December 31, 2007) (SEC File No. 001-09743).
3.1(l) - Certificate of Amendment of Restated Certificate of Incorporation, dated May 3, 2005 (incorporated by reference to Exhibit 3.1(l) to EOG's Quarterly Report on Form 10-Q for the quarter ended June 30, 2005) (SEC File No. 001-09743).
3.1(m) - Certificate of Elimination of Fixed Rate Cumulative Perpetual Senior Preferred Stock, Series B, dated March 6, 2008 (incorporated by reference to Exhibit 3.1 to EOG's Current Report on Form 8-K, filed March 6, 2008) (SEC File No. 001-09743).
3.1(n) - Certificate of Amendment of Restated Certificate of Incorporation, dated April 28, 2017 (incorporated by reference to Exhibit 3.1 to EOG's Current Report on Form 8-K, filed May 2, 2017) (SEC File No. 001-09743).
3.2 - Bylaws, dated August 23, 1989, as amended and restated effective as of September 22, 2015 (incorporated by reference to Exhibit 3.1 to EOG's Current Report on Form 8-K, filed September 28, 2015) (SEC File No. 001-09743).
4.1 - Officers' Certificate Establishing 4.375% Senior Notes due 2030 and 4.950% Senior Notes due 2050 of EOG, dated April 14, 2020 (incorporated by reference to Exhibit 4.2 to EOG's Current Report on Form 8-K, filed April 14, 2020) (SEC File No. 001-09743).
-47-

Exhibit No. Description
4.2 - Form of Global Note with respect to the 4.375% Senior Notes due 2030 of EOG (included in, and incorporated by reference to, Exhibit 4.2 to EOG's Current Report on Form 8-K, filed April 14, 2020) (SEC File No. 001-09743).
4.3 - Form of Global Note with respect to the 4.950% Senior Notes due 2050 of EOG (included in, and incorporated by reference to, Exhibit 4.2 to EOG's Current Report on Form 8-K, filed April 14, 2020) (SEC File No. 001-09743).
31.1 - Section 302 Certification of Periodic Report of Principal Executive Officer.
31.2 - Section 302 Certification of Periodic Report of Principal Financial Officer.
32.1 - Section 906 Certification of Periodic Report of Principal Executive Officer.
32.2 - Section 906 Certification of Periodic Report of Principal Financial Officer.
95 - Mine Safety Disclosure Exhibit.
101.INS - Inline XBRL Instance Document - the instance document does not appear in the Interactive Data File because its XBRL tags are embedded within the Inline XBRL document.
*101.SCH - Inline XBRL Schema Document.
*101.CAL - Inline XBRL Calculation Linkbase Document.
*101.DEF - Inline XBRL Definition Linkbase Document.
*101.LAB - Inline XBRL Label Linkbase Document.
*101.PRE - Inline XBRL Presentation Linkbase Document.
104 - Cover Page Interactive Data File (formatted as Inline XBRL and contained in Exhibit 101).
*Attached as Exhibit 101 to this report are the following documents formatted in XBRL (Extensible Business Reporting Language): (i) the Condensed Consolidated Statements of Income (Loss) and Comprehensive Income (Loss) - Three Months and Six Months Ended June 30, 2020 and 2019, (ii) the Condensed Consolidated Balance Sheets - June 30, 2020 and December 31, 2019, (iii) the Condensed Consolidated Statements of Stockholders' Equity - Three Months and Six Months Ended June 30, 2020 and 2019, (iv) the Condensed Consolidated Statements of Cash Flows - Six Months Ended June 30, 2020 and 2019 and (v) the Notes to Condensed Consolidated Financial Statements.
-48-
SIGNATURES
Pursuant to the requirements of the Securities Exchange Act of 1934, as amended, the registrant has duly caused this report to be signed on its behalf by the undersigned thereunto duly authorized.
EOG RESOURCES, INC. (Registrant) Date: August 6, 2020 By: /s/ TIMOTHY K. DRIGGERS
Timothy K. DriggersExecutive Vice President and Chief Financial Officer(Principal Financial Officer and Duly Authorized Officer)
-49-
Related Documents