ENZYME-FREE GLUCOSE SENSOR BASED ON FERRITE MAGNETIC NANOPARTICLES ZOHREH SHAHNAVAZ THESIS SUBMITTED IN FULFILMENT OF THE REQUIREMENT OF THE DEGREE OF DOCTOR OF PHLOSOPHY FACULTY OF SCIENCE UNIVERSITY OF MALAYA KUALA LUMPUR 2016

Welcome message from author
This document is posted to help you gain knowledge. Please leave a comment to let me know what you think about it! Share it to your friends and learn new things together.
Transcript
ENZYME-FREE GLUCOSE SENSOR BASED ON
FERRITE MAGNETIC NANOPARTICLES
ZOHREH SHAHNAVAZ
THESIS SUBMITTED IN FULFILMENT OF THE
REQUIREMENT OF THE DEGREE OF DOCTOR OF
PHLOSOPHY
FACULTY OF SCIENCE
UNIVERSITY OF MALAYA
KUALA LUMPUR
2016
UNIVERSITY OF MALAYA
ORIGINAL LITERARY WORK DECLARATION
Name of Candidate: ZOHREH SHAHNAVAZ
I/C/Passport No: F22544715
Regisration/Matric No: SHC110070
Name of Degree: DOCTOR OF PHILOSOPHY
Title of Project Paper/Research Report/Dissertation/Thesis (“this Work”):
“ENZYME-FREE GLUCOSE SENSOR BASED ON FERRITE MAGNETIC
NANOPARTICLES”
Field of Study: ELECTROCHEMISTRY
I do solemnly and sincerely declare that:
(1) I am the sole author/writer of this Work,
(2) This Work is original,
(3) Any use of any work in which copyright exists was done by way of fair dealing and for
permitted purposes and any excerpt or extract from, or reference to or reproduction of any
copyright work has been disclosed expressly and sufficiently and the title of the Work and
its authorship have been acknowledged in this Work,
(4) I do not have any actual knowledge nor do I ought reasonably to know that the making of
this work constitutes an infringement of any copyright work,
(5) I hereby assign all and every rights in the copyright to this Work to the University of
Malaya (“UM”), who henceforth shall be owner of the copyright in this Work and that any
reproduction or use in any form or by any means whatsoever is prohibited without the
written consent of UM having been first had and obtained,
(6) I am fully aware that if in the course of making this Work I have infringed any copyright
whether intentionally or otherwise, I may be subject to legal action or any other action as
may be determined by UM.
(Candidate Signature) Date:
Subscribed and solemnly declared before,
Witness’s Signature Date:
Name PROFESSOR. Dr. YATIMAH ALIAS
Designation PROFESSOR
Witness’s Signature Date:
Name Dr. WOI PEI MENG
Designation SENIOR LECTURER
Safri
Highlight

iii
iii
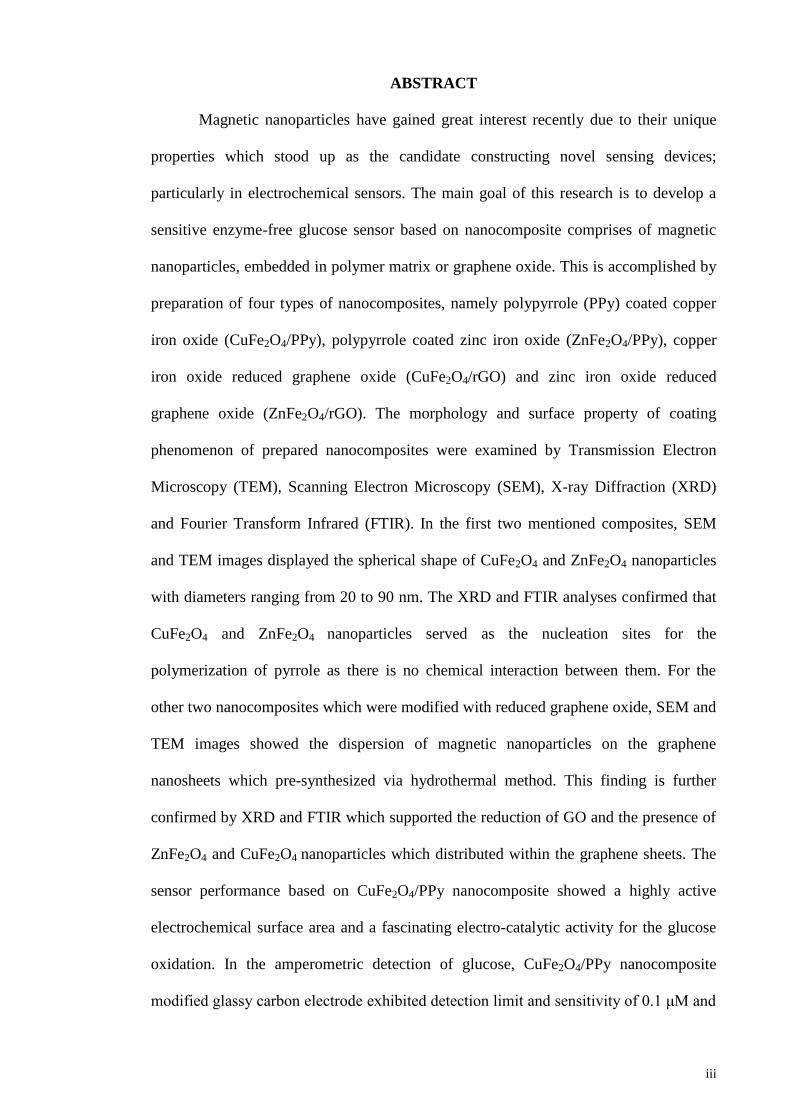
ABSTRACT
Magnetic nanoparticles have gained great interest recently due to their unique
properties which stood up as the candidate constructing novel sensing devices;
particularly in electrochemical sensors. The main goal of this research is to develop a
sensitive enzyme-free glucose sensor based on nanocomposite comprises of magnetic
nanoparticles, embedded in polymer matrix or graphene oxide. This is accomplished by
preparation of four types of nanocomposites, namely polypyrrole (PPy) coated copper
iron oxide (CuFe2O4/PPy), polypyrrole coated zinc iron oxide (ZnFe2O4/PPy), copper
iron oxide reduced graphene oxide (CuFe2O4/rGO) and zinc iron oxide reduced
graphene oxide (ZnFe2O4/rGO). The morphology and surface property of coating
phenomenon of prepared nanocomposites were examined by Transmission Electron
Microscopy (TEM), Scanning Electron Microscopy (SEM), X-ray Diffraction (XRD)
and Fourier Transform Infrared (FTIR). In the first two mentioned composites, SEM
and TEM images displayed the spherical shape of CuFe2O4 and ZnFe2O4 nanoparticles
with diameters ranging from 20 to 90 nm. The XRD and FTIR analyses confirmed that
CuFe2O4 and ZnFe2O4 nanoparticles served as the nucleation sites for the
polymerization of pyrrole as there is no chemical interaction between them. For the
other two nanocomposites which were modified with reduced graphene oxide, SEM and
TEM images showed the dispersion of magnetic nanoparticles on the graphene
nanosheets which pre-synthesized via hydrothermal method. This finding is further
confirmed by XRD and FTIR which supported the reduction of GO and the presence of
ZnFe2O4 and CuFe2O4 nanoparticles which distributed within the graphene sheets. The
sensor performance based on CuFe2O4/PPy nanocomposite showed a highly active
electrochemical surface area and a fascinating electro-catalytic activity for the glucose
oxidation. In the amperometric detection of glucose, CuFe2O4/PPy nanocomposite
modified glassy carbon electrode exhibited detection limit and sensitivity of 0.1 μM and
iv
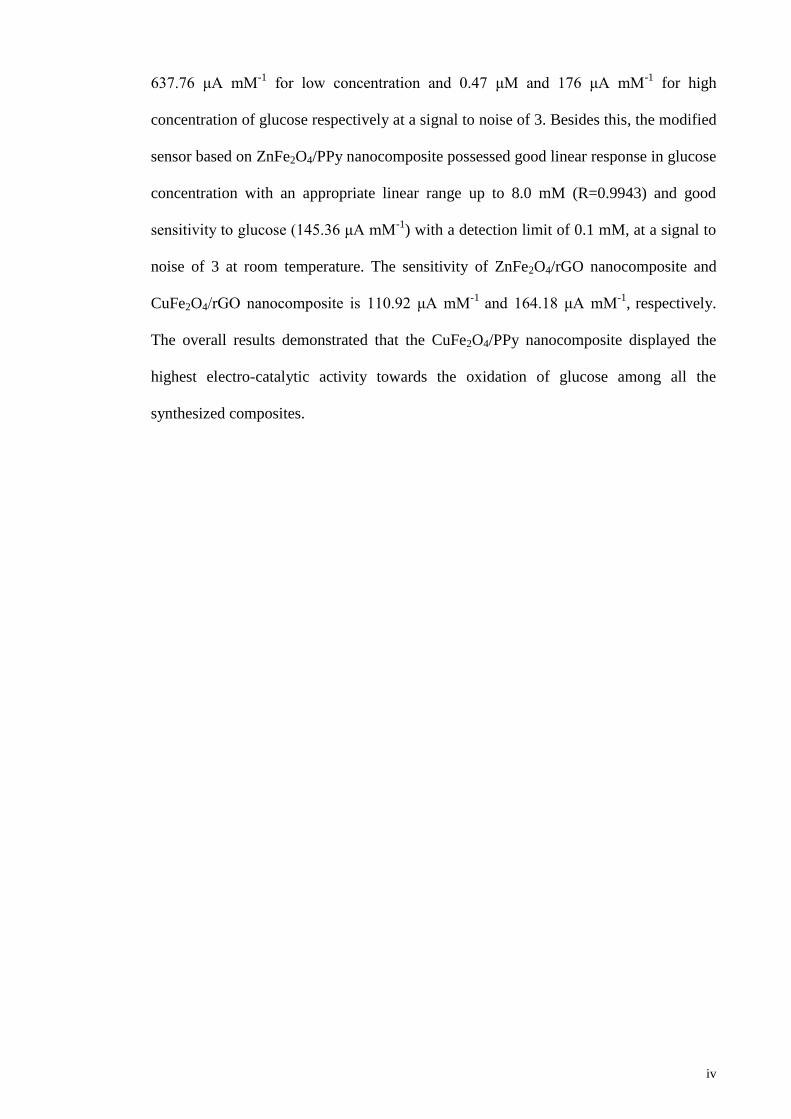
637.76 μA mM-1
for low concentration and 0.47 μM and 176 μA mM-1
for high
concentration of glucose respectively at a signal to noise of 3. Besides this, the modified
sensor based on ZnFe2O4/PPy nanocomposite possessed good linear response in glucose
concentration with an appropriate linear range up to 8.0 mM (R=0.9943) and good
sensitivity to glucose (145.36 μA mM-1
) with a detection limit of 0.1 mM, at a signal to
noise of 3 at room temperature. The sensitivity of ZnFe2O4/rGO nanocomposite and
CuFe2O4/rGO nanocomposite is 110.92 μA mM-1
and 164.18 μA mM-1
, respectively.
The overall results demonstrated that the CuFe2O4/PPy nanocomposite displayed the
highest electro-catalytic activity towards the oxidation of glucose among all the
synthesized composites.
v
ABSTRAK
Kebelakangan ini nanopartikal magnet telah mendapat tumpuan hangat
disebabkan oleh sifatnya yang unik membolehkan ia diguna dalam pembinaan peranti
pengesan baru; khususnya dalam sensor elektrokimia tertentu. Matlamat utama kajian
ini adalah untuk menghasilkan pengesan glukosa tanpa enzim yang sensitif berdasarkan
nanokomposit yang mengandungi nanopartikal magnet, bersama dengan polimer dan
graphene oksida. Ini dapat dicapai dengan menyediakan empat jenis nanokomposit,
seperti oksida besi tembaga iaitu polypyrrole (PPy) bersalut (CuFe2O4/PPy),
polypyrrole bersalut besi zink oksida (ZnFe2O4/PPy), besi tembaga oksida dengan
penurunan graphene oksida (CuFe2O4/rGO) dan oksida besi zink dengan penurunan
graphene oksida (ZnFe2O4/rGO). Morfologi dan ciri permukaan fenomena salutan
nanokomposit yang dihasilkan telah dikaji dengan menggunakan Transmisi Elektron
Mikroskopi (TEM), Mikroskop Imbasan Elektron (SEM), pembelauan X-ray (XRD)
dan Fourier Transform Infrared (FTIR). Berdasarkan dua komposit pertama yang
dinyatakan imej SEM dan TEM menunjukkan bentuk sfera bagi nanopartikal CuFe2O4
dan ZnFe2O4 dengan diameter antara 20-90 nm. Analisis XRD dan FTIR mengesahkan
bahawa nanopartikal CuFe2O4 dan ZnFe2O4 bertidak sebagai tapak penukleusan bagi
pempolimeran pyrrole kerana tiada interaksi kimia antara mereka. Untuk kedua-dua
nanokomposit lain yang diubahsuai dengan menggunakan penurunan graphene oksida,
imej SEM dan TEM menunjukkan penyebaran nanopartikel magnet di atas kepingan
nano graphene yang pra-sintesis melalui kaedah hidroterma. Penemuan ini seterusnya
disahkan oleh XRD dan FTIR yang menyokong penurunan GO dan kehadiran
nanopartikal ZnFe2O4 dan CuFe2O4 yang disebarkan dalam kepingan graphene. Prestasi
sensor berasaskan nanokomposit CuFe2O4/PPy menunjukkan kawasan permukaan
elektrokimia yang sangat aktif dan aktiviti pemangkin electron menarik untuk
pengoksidaan glukosa. Dalam pengesanan amperometrik glukosa, Karbon elektrode
vi
berkaca yang diubahsuai dengan nanocomposit CuFe2O4/PPy menunjukkan had
pengesanan dan sensitiviti 0.1 μM dan 637.76 μA mM-1
untuk kepekatan glukosa yang
rendah, manakala 0.47 μM dan 176 μA mM-1
untuk kepekatan glukosa yang tinggi pada
nisbah 3. Selain itu, sensor diubahsuai berdasarkan nanokomposit ZnFe2O4/PPy
mempunyai tindak balas linear yang baik dalam kepekatan glukosa dengan linear yang
sesuai berukuran sehingga 8.0 mM (R = 0.9943) dan had kepekaan yang baik kepada
glukosa (145.36 μA mM-1
) dengan takat pengesanan 0.1 mM, pada nisbah 3 dalam suhu
bilik. Kepekaan nanokomposit ZnFe2O4/rGO dan CuFe2O4/rGO masing-masing adalah
110.92 μA mM-1
dan 164.18 μA mM-1
. Keputusan keseluruhan menunjukkan bahawa
nanokomposit CuFe2O4/PPy memaparkan aktiviti pemangkin elektro yang paling tinggi
terhadap pengoksidaan glukosa di kalangan semua komposit yang telah disintesis.

vii
ACKNOWLEDGEMENT
First and foremost, I would like to thank my supervisor Prof. Dr. Yatimah Alias
for her continuous support and guidance in my Ph.D research. Her patience, motivation
and immense knowledge in science have been inspiring me during my study.
My most sincere gratitude also goes to my supervisor Dr. Woi Pei Meng. I am
deeply influenced by her energy and enthusiasm in science and research. She has helped
me in many ways and has molded me to be a better researcher. I am truly blessed to
have such a great supervision during my Ph.D. I could not complete my thesis without
her help and advice.
I would like to thank dear Ms. Marhaini and all my dear friends (Kumuthini,
Rahimah, Dazylah, Maizathul, Azlan, and Atiqa) for their support, advice and help in
every problems that I have been faced off and for giving me the joyous throughout my
Ph.D years.
I would like to express my deepest acknowledgement to my parents and especially
my lovely brother ”Hossein” for their continuous love, moral support, encouragement
and financial help.
Finally, I would like to thank University of Malaya grant, High Impact Research
MoE Grant M.C/625/1/HIR/MoE/SC/04 from the Ministry of Education Malaysia,
FRGS FP051-2014A and PPP Grant PV124-2012A for funding my research project
throughout my PhD study.
viii
TABLE OF CONTENTS
ABSTRACT…..………..………………………………………………………..……..iii
ABSTRAK……………………………………………………………………………....v
ACKNOWLEDGEMENT............................................................................................vii
TABLE OF CONTENTS.……...…………………………………………………….viii
LIST OF FIGURES….…...…………………………………………………………..xiv
LIST OF SCHEMES………………………………………………………………..xviii
LIST OF TABLES……………………………………………………………………xix
LIST OF SYMBOLS AND ABBREVIATIONS…..……….………………………..xx
CHAPTER 1: INTRODUCTION..…………………………………………………....1
1.1 Study background…………...……………………………………………………..1
1.2 Thesis outline…...………………………………………………………………….4
1.3 Objectives………………………………………………………………………….5
CHAPTER 2: LITERATURE REVIEW………………………………………….....6
2.1 Diabetes……………………………………………………………………………6
2.2 Analyte……………………………………………………………………………..7
2.2.1 Glucose............................................................................................................7
2.2.2 Fructose……………………………………………………………………...8
2.2.3 Sucrose……………………….………………………………………………8
2.2.4 Uric acid……………………………………………………………………..9
2.2.5 Ascorbic acid………………………………………………………………..9
2.3 Chemical sensors....................................................................................................10
2.4 Types of chemical sensors………………………………………………………..11
2.4.1 Optical sensors……………………………………………………………...11
2.4.2 Mass sensitive sensors……………………………………………………...12
ix
2.4.3 Thermal sensors..…………………………………………………..………13
2.4.4 Electrochemical sensors................................................................................14
2.5 Electrochemical glucose sensors............................................................................15
2.5.1 Enzymatic glucose sensors...........................................................................16
2.5.2 Enzyme-free glucose sensors………………………………………………18
2.6 Nanomaterials…………………………………………………………………….20
2.7 Magnetic nanoparticles…………………………………………………………...21
2.8 Synthesis of magnetic nanoparticles......................................................................23
2.8.1 Thermal decomposition................................................................................23
2.8.2 Template assisted fabrication……………..……..………………………...23
2.8.3 Self-assembly of magnetic nanostructures……..………….………………24
2.8.4 Hydrothermal synthesis……………………………………………………25
2.9 Application of magnetic nanoparticles…………………………………………...26
2.9.1 Gas sensing…………………………………………………………………26
2.9.2 Water treatment…………………………………………………………….27
2.9.3 Biomedical………………………………………………………………….27
2.10 Selected magnetic nanoparticles………………………………………………….28
2.10.1 Zinc ferrite (ZnFe2O4) magnetic nanoparticles………..…………………..30
2.10.2 Copper ferrite (CuFe2O4) magnetic nanoparticles.......................................31
2.11 Conducting polymer……………………………………………………………...33
2.11.1 Synthesis of polypyrrole (PPy)....................................................................35
2.11.2 Application of polypyrrole..........................................................................37
2.12 Graphene and its applications................................................................................39
CHAPTER 3: METHODOLOGY…………………………………………………..43
3.1. Reagents & materials.............................................................................................43
3.2 Experimental set-up……………………………………………………………...44
x
3.3 Preparation of conducting polymer–magnetic nanoparticles…………………….45
3.3.1 CuFe2O4/PPy core-shell nanoparticles……………………………………..46
3.3.2 ZnFe2O4/PPy core-shell nanoparticles…...……………………….………..47
3.4 Preparation of graphene–magnetic nanocomposites……………………………..47
3.4.1 Graphene oxide (GO)…………………………………..……………….....47
3.4.2 CuFe2O4/reduced graphene oxide magnetic nanocomposite……..……..…48
3.4.3 ZnFe2O4/reduced graphene oxide magnetic nanocomposite……………….49
3.5 Preparation of phosphate buffer………………………………………………….49
3.6 Preparation of real sample………………………………………………………..50
3.7 Fabrication of modified electrode………………………………………………..50
3.7.1 Pre-treatment of the electrode…………….………………………………...50
3.7.2 CuFe2O4/PPy core-shell nanoparticles.........................................................51
3.7.3 ZnFe2O4/PPy core-shell nanoparticles...........................................................52
3.7.4 CuFe2O4/reduced graphene oxide magnetic nanocomposite.........................53
3.7.5 ZnFe2O4/reduced graphene oxide magnetic nanocomposite….……………53
3.8 Characterization of modified electrode………………………………………….54
3.8.1 Scanning electron microscopy (SEM)...........................................................55
3.8.2 Transmission electron microscopy (TEM)…………………………………55
3.8.3 Fourier transform infrared spectroscopy (FTIR).………..…………………56
3.8.4 X-ray diffraction (XRD)…………………………………………………...56
3.8.5 Cyclic voltammetry (CV)………………………………………………….57
3.8.6 Electrochemical impedance spectroscopy (EIS)...…………………………57
3.8.7 Amperometry………………………………………………………………58
CHAPTER 4: RESULTS AND DISCUSSION…………………………………….60
Part 1: Core-shell CuFe2O4/PPy nanoparticles for glucose detection………………….60
xi
4.1 Introduction………………………………………………………………………60
4.2 Characterization of CuFe2O4 and CuFe2O4/PPy core-shell nanoparticles……….61
4.2.1 Fourier transform infrared spectroscopy (FTIR)…………………………..61
4.2.2 X-ray diffraction (XRD)….………………………………………………..62
4.2.3 Surface morphology study…………………………………………………63
4.2.4 Optimization of the sensor...........................................................................65
4.2.4.1 Polypyrrole shell thickness………………………………………….66
4.2.4.2 Optimization of potential for glucose oxidation…………………….68
4.2.5 Cyclic voltammetry studies………………………………………………..69
4.2.6 Electrochemical impedance spectroscopy (EIS) studies..………………....71
4.2.7 Amperometric detection of glucose on CuFe2O4/PPy/GCE..….………….72
4.2.8 Interference study………………………………………………………….75
4.2.9 Reproducibility and stability of the sensor………………………………..76
4.2.10 Detection of real samples...........................................................................77
4.3 Electro-oxidation mechanism of glucose on CuFe2O4/PPy/GCE……………….78
4.4 Conclusion………………………………………………………………………..79
Part 2: Polypyrrole-ZnFe2O4 nanoparticles with core-shell structure for glucose
sensing...………………………………………………………………………….79
4.5 Introduction………………………………………………………………………79
4.6 Characterization of ZnFe2O4 and ZnFe2O4/PPy core-shell nanoparticles……….80
4.6.1 Fourier transform infrared spectroscopy (FTIR)…………………………...80
4.6.2 X-ray diffraction (XRD)……………………………………………………80
4.6.3 Surface morphology study………………………………………………….82
4.6.4 Optimization of the sensor…………………………………………………83
4.6.5 Cyclic voltammetry studies………………………………………………..85
4.6.6 Electrochemical impedance spectroscopy (EIS) studies…………………..86
xii
4.6.7 Amperometric detection of glucose on ZnFe2O4/PPy/GCE……….…….....87
4.6.8 Interference study…………………………………………………………..89
4.6.9 Reproducibility, stability of the sensor and detection of real samples……..90
4.7 Electro-oxidation mechanism of glucose on ZnFe2O4/PPy/GCE……………….91
4.8 Conclusion………………………………………………………………………..92
Part 3: Reduced graphene oxide-supported copper ferrite hybrid for glucose sensing...93
4.9 Introduction………………………………………………………………………93
4.10 Characterization of CuFe2O4 and CuFe2O4/rGO magnetic nanocomposite……...93
4.10.1 Fourier transform infrared spectroscopy (FTIR)………………………….93
4.10.2 X-ray diffraction (XRD)…………………………………………………..94
4.10.3 Surface morphology study………………………………………………...95
4.10.4 Cyclic voltammetry studies…………………………………………….....96
4.10.5 Electrochemical impedance spectroscopy (EIS) studies……………….....99
4.10.6 Amperometric detection of glucose on CuFe2O4/rGO(30 wt%)/GCE......100
4.10.7 Interference study………………………………………………………..102
4.10.8 Reproducibility, stability and sample analysis studies…………………..103
4.11 Conclusion………………………………………………………………………104
Part 4: Electrochemical sensing of glucose by reduced graphene oxide-zinc ferrite…105
4.12 Introduction……………………………………………………………………..105
4.13 Characterization of ZnFe2O4 and ZnFe2O4/rGO nanocomposite……………….105
4.13.1 Fourier transform infrared spectroscopy (FTIR)………………………..105
4.13.2 X-ray diffraction (XRD)………………………………………………...106
4.13.3 Surface morphology study………………………………………………107
4.13.4 Cyclic voltammetry studies……………………………………………..108
4.13.5 Electrochemical impedance spectroscopy (EIS) studies………………..111
4.13.6 Amperometric detection of glucose at ZnFe2O4/rGO(30 wt%)/GCE…..112

xiii
4.13.7 Interference study……………………………………………………….113
4.13.8 Reproducibility, stability and sample analysis studies………………….114
4.14 Conclusion………………………………………………………………………116
CHAPTER 5: SUMMARY & FUTURE WORK………...………………………..117
REFERENCES………………………………………………………………………119
LIST OF PUBLICATIONS AND PAPERS PRESENTED..……………………..137
xiv
LIST OF FIGURES
Figure 2.1: Glucose molecule structure.…….……………...………….…..………….…8
Figure 2.2: Fructose molecule structure...……………………………………………….8
Figure 2.3: Sucrose molecule structure……...…………………………………………..9
Figure 2.4: Uric acid molecule structure...........................................................................9
Figure 2.5: Ascorbic acid molecule structure ....……………………………...………..10
Figure 2.6: The first generation of the enzymatic glucose..............................................16
Figure 2.7: The second generation of enzyme glucose sensors...………………………17
Figure 2.8: Zinc ferrite (ZnFe2O4) a) in powder; b) chemical structure..........................31
Figure 2.9: Copper ferrite (CuFe2O4) a) in powder; b) chemical structure.....................32
Figure 2.10: A band gap energy model for insulators, semiconductors and conductors.34
Figure 2.11: The structure of PPy where (a) is the neutral PPy and (b) is the oxidized
PPy...................................................................................................................................36
Figure 2.12: The structure of graphene...........................................................................41
Figure 3.1: Diagram of three-electrodes electrochemical system..……...…………….44
Figure 3.2: Three-electrodes electrochemical system..………………………………...45
Figure 3.3: Preparation of graphene oxide (GO)…...…………………………………..48
Figure 3.4: Electrode polishing process..........................................................................50
Figure 3.5: Fabrication of CuFe2O4/PPy glassy carbon modified electrode ……….….51
Figure 3.6: Fabrication of ZnFe2O4/PPy glassy carbon modified electrode……………52
Figure 3.7: Fabrication of CuFe2O4/rGO glassy carbon modified electrode…..………53
Figure 3.8: Fabrication of ZnFe2O4/rGO glassy carbon modified electrode...................54
Figure 4.1: FTIR spectra of (a) CuFe2O4 nanoparticles and (b) core-shell structured
CuFe2O4/PPy nanoparticles prepared by using 4.0 ml of pyrrole at 80 °C for 8 h……..62
Figure 4.2: XRD patterns of (a) CuFe2O4 and (b) core-shell structured CuFe2O4/PPy
nanoparticles by using 4.0 ml of pyrrole……………………………………………….63
Figure 4.3: The SEM images of (a) CuFe2O4 and TEM images of (b) CuFe2O4, (c) core-
shell structured CuFe2O4/PPy nanoparticles prepared by 1.0 ml (d) 2.0 ml and (e) 4.0 ml
of PPy………..…………………………………………………………………………64
xv
Figure 4.4: Cyclic voltammograms of CuFe2O4/PPy /GCE by (a) 1.0 ml of PPy (b) 2.0
mM of PPy (c) 4.0 ml of PPy in (i) 0.5 mM, (ii) 1.0 mM and (iii) 2.0 mM glucose in 0.1
M NaOH at the scan rate of 10 mV s-1
………..………………..……………………....67
Figure 4.5: Effect of the applied potential on the current response of CuFe2O4/PPy/GCE
(4.0 ml of PPy) in the presence of 2.0 mM glucose at the scan rate of 10 mV s-1
in 0.1 M
NaOH……………………………………………………………..…………………….68
Figure 4.6: Cyclic voltammograms of (a) bare GCE, (b) PPy/GCE, (c) CuFe2O4/GCE,
(d) CuFe2O4/PPy/GCE by 4.0 ml of PPy in presence of 2.0 mM glucose in 0.1 M NaOH
at the scan rate of 10 mV s-1
……………….……………………………………….…..70
Figure 4.7: Cyclic voltammograms of (a) CuFe2O4/GCE at pH 7.4 without glucose (b)
in presence of glucose (c) CuFe2O4/PPy/GCE (4.0 ml of PPy) at pH 7.4 without glucose
(d) in the presence of 2.0 mM glucose at the scan rate of 10 mV s-1
…………………..71
Figure 4.8: EIS of (a) bare GCE, (b) CuFe2O4/GCE, (c) CuFe2O4/PPy/GCE using 1.0 ml
of PPy, (d) CuFe2O4/PPy/GCE using 4.0 ml of PPy, in 0.1 M KCl solution containing
1.0 mM Fe[(CN)6]3−/4−
(1:1). The frequency range was from 0.1 to 1×10⁵ Hz………...72
Figure 4.9: The typical current–time dynamic response of the (a) CuFe2O4/PPy core-
shell (4.0 ml of PPy) modified GCE towards various concentrations of glucose; left
inset: the calibration curve for glucose detection. The calibration curves for glucose
detection (b) in low concentration, (c) in high concentration………………………….74
Figure 4.10: Interference test of the sensor in 0.1 M NaOH with 0.1 mM glucose and
other interferes as indicated…………………………………………………………….76
Figure 4.11:Long-term stability of a CuFe2O4/PPy/GCE measured in more than two
weeks……………………….…….…………………………………………………….77
Figure 4.12: FTIR spectra of (a) ZnFe2O4 and (b) core-shell structured ZnFe2O4/PPy
nanoparticles……………………………………………………………………………80
Figure 4.13: XRD patterns of (a) ZnFe2O4 and (b) core-shell structured ZnFe2O4/PPy
nanoparticles....................................................................................................................81
Figure 4.14: The SEM images of (a) ZnFe2O4 and TEM images of (b) ZnFe2O4, (c)
ZnFe2O4/PPy core-shell nanoparticles prepared by 1.0 ml, (d) 2.0 ml and (e) 4.0 ml of
PPy...……………………………………………………………………………………83
Figure 4.15: Cyclic voltammograms of ZnFe2O4/PPy/GCE by (a) 4.0 ml of PPy (b) 2.0
mM of PPy (c) 1.0 ml of PPy in (i) 0.5 mM, (ii) 1.0 mM and (iii) 2.0 mM glucose in 0.1
M NaOH at the scan rate of 10 mV s-1
……………….………………………………...84
Figure 4.16: Cyclic voltammograms of (a) bare GCE, (b) PPy/GCE, (c) ZnFe2O4/GCE,
(d) ZnFe2O4/PPy/GCE by 4.0 ml of PPy in presence of 2.0 mM glucose in 0.1 M NaOH
at the scan rate of 10 mV s-1
……………………………………………………………85
Figure 4.17: Cyclic voltammograms of (a) ZnFe2O4 at pH 7.4 without glucose (c) in
presence of glucose (b) ZnFe2O4/PPy (4.0 ml of PPy) at pH 7.4 without glucose (d) in
the presence of 2.0 mM glucose at the scan rate of 10 mV s-1
…………………………86
xvi
Figure 4.18: EIS of (a) bare GCE, (b) ZnFe2O4/ GCE, (c) ZnFe2O4/PPy/ GCE using 1.0
ml of PPy, (d) ZnFe2O4/PPy/ GCE using 4.0 ml of PPy, in 0.1 M KCl solution
containing 1.0 mM Fe[(CN)6]3−/4−
(1:1). The frequency range was scanned from 0.01 to
1×10⁵ Hz………………………………………………………………………………..87
Figure 4.19: The typical current–time dynamic response of the ZnFe2O4/PPy (4.0 ml of
PPy) modified GCE towards various concentrations of glucose; left inset: the calibration
curve for glucose detection..............................................................................................88
Figure 4.20: Interference test of the sensor in 0.1 M NaOH with 0.1 mM glucose and
other interference as indicated……….…………………………………………………89
Figure 4.21: Long-term stability of ZnFe2O4/PPy core-shell nanoparticles measured in
more than two weeks………….………………………………………………………..90
Figure 4.22: FTIR spectra of (a) GO, (b) CuFe2O4/rGO nanocomposite and (c) CuFe2O4
nanoparticle.....................................................................................................................94
Figure 4.23: XRD patterns of (a) CuFe2O4/rGO nanocomposite, (b) rGO and (c) GO..95
Figure 4.24: The SEM images of (a) CuFe2O4 and TEM images of (b) CuFe2O4, (c)
reduced graphene oxide (d) and (e) CuFe2O4/rGO nanocomposite……………………96
Figure 4.25: Cyclic voltammograms of (a) bare GCE; (b) rGO/GCE; (c) rGO/GCE; (d)
CuFe2O4/GCE; (e) CuFe2O4/rGO(10 wt%)/GCE; (f) CuFe2O4/rGO(20 wt%)/GCE; (g)
CuFe2O4/rGO(30 wt%)/GCE and (h) CuFe2O4/rGO(40 wt%)/GCE in presence of 2.0
mM glucose in 0.1 M phosphate buffer solution (pH 7.4) at the scan rate of 10 mV s-
1………………………………………………………………..……………………….98
Figure 4.26: Cyclic voltammograms of CuFe2O4/rGO(30 wt%) in 0.1 mM PBS solution
(pH 7.4) at different scan rates of 10, 20, 50, 100, 120 and 150 mV s-1
……………....98
Figure 4.27: EIS of (a) bare GCE; (b) rGO/ GCE; (c) CuFe2O4/ GCE; (d)
CuFe2O4/rGO(30 wt%)/GCE and (e) CuFe2O4/rGO(40 wt%)/GCE nanocomposites in
0.1 M KCl solution containing 1.0 mM Fe[(CN)6]3−/4−
(1:1). The frequency range was
from 0.1 to 1×10⁵ Hz…….……………………………………………………………100
Figure 4.28: The typical current–time dynamic response of the CuFe2O4/rGO(30 wt%)
modified GCE towards various concentrations of glucose; left inset: the calibration
curve for glucose detection………………………………….………………………...101
Figure 4.29: Interference test of the sensor in 0.1 M phosphate buffer solution (pH 7.4)
with 0.1 mM glucose and other interferes as indicated…………………………….....102
Figure 4.30: Stability of a CuFe2O4/rGO(30 wt%) nanocomposite electrode measured in
more than two weeks…………………………………………………………..……...103
Figure 4.31: FTIR spectra of (a) ZnFe2O4/rGO; (b) ZnFe2O4 nanoparticles and (c)
GO…………………………………………………………………………………….106
Figure 4.32: XRD patterns of (a) GO; (b) rGO; (c) ZnFe2O4 nanoparticles and (d)
ZnFe2O4/rGO nanocomposite…………………………………………………..……..107
xvii
Figure 4.33: The SEM images of (a) ZnFe2O4 and TEM images of (b) ZnFe2O4; (c and
d) reduced graphene oxide at different resolutions; (e and f) ZnFe2O4/rGO
nanocomposite at different resolutions..........................................................................108
Figure 4.34: Cyclic voltammograms of (a) bare GCE, (b) rGO/GCE, (c) rGO/GCE, (d)
ZnFe2O4/GCE (e) ZnFe2O4/rGO(10 wt%)/GCE (f) ZnFe2O4/rGO(20 wt%)/GCE (g)
ZnFe2O4/rGO(30 wt%)/GCE and (h) ZnFe2O4/rGO(40 wt%)/GCE in presence of 2.0
mM glucose in 0.1 M phosphate buffer solution (pH 7.4) at the scan rate of 10 mV s-
1…………………………………………………………….…………..………..….…110
Figure 4.35: Cyclic voltammograms of ZnFe2O4/rGO(30 wt%)/GCE in 0.1 M PBS
solution (pH 7.4) at different scan rates…………………………..…….…………….110
Figure 4.36: EIS of (a) bare GCE; (b) rGO/GCE; (c) ZnFe2O4/GCE; (d)
ZnFe2O4/rGO(30 wt%)/GCE and (e) ZnFe2O4/rGO(40 wt%)/GCE nanocomposite in
0.1 M KCl solution containing 1.0 mM Fe[(CN)6]3−/4−
(1:1). The frequency range was
from 0.1 to 1×10⁵ Hz……………………………………….…………………………111
Figure 4.37: The typical current–time dynamic response of the ZnFe2O4/rGO(30 wt%)/
GCE towards various concentrations of glucose; left inset: the calibration curve for
glucose detection…………………….………………………………………………..113
Figure 4.38: Interference test of the sensor in 0.1 M phosphate buffer solution (pH 7.4)
with 0.1 mM glucose and other interferes as indicated………..……………………...114
Figure 4.39: Stability of ZnFe2O4/rGO(30 wt%) modified electrode measured in more
than two weeks……………………………………………………………………..…115

xviii
LIST OF SCHEMES
Scheme 4.1: Electro-oxidation mechanism of glucose on CuFe2O4/PPy/GCE..…...…..78
Scheme 4.2: Electro-oxidation mechanism of glucose on ZnFe2O4/PPy/GCE………...91
xix
LIST OF TABLES
Table 3.1: List of chemicals used..……………………………..………………………43
Table 4.1: Comparison of the crystallite size from the XRD and TEM results………..65
Table 4.2: Comparison of the present CuFe2O4/PPy core-shell nanoparticles enzyme-
free glucose sensor with other glucose sensors based on different materials…………..75
Table 4.3: Determination of glucose in real sample of blood serum ……………………..77
Table 4.4: Comparison of the crystallite size from the XRD and TEM results………...82
Table 4.5: Comparison of the present ZnFe2O4/PPy nanoparticlese enzyme-free glucose
sensor with other glucose sensors based on Zn based materials.....................................89
Table 4.6: Determination of glucose in real sample of blood serum… ……………………..91
Table 4.7: Comparison of the present CuFe2O4/rGO(30 wt%) nanocomposite enzyme-
free glucose sensor with other glucose sensors based on different material..……...…102
Table 4.8: Determination of glucose in real sample of blood serum…. …………………104
Table 4.9: Comparison of the present ZnFe2O4/rGO(30 wt%) nanocomposite enzyme-
free glucose sensor with other glucose sensors based on Zn based materials...………114
Table 4.10: Determination of glucose in real sample of blood serum………………………115
xx
LIST OF SYMBOLS AND ABBREVIATIONS
AA : Ascorbic acid
b : Slope of the calibration curve
BSE : Backscattered electrons
CE : Counter electrode
CTAB : Cetyltrimethyl ammonium bromide
CuFe2O4 : Copper iron oxide or copper ferrite
CV : The cyclic voltammetry
Eg : Band gap
EIS : Electrochemical impedance spectroscopy
FTIR : Fourier Transform Infrared
GCE : Glassy carbon electrode
GDH : Glucose dehydrogenase
GO : Graphene oxide
GOx : Glucose oxidase
LOD : Limit of detection
MNPs : Metallic nanoparticles
MWCNT : Multi-walled carbon nanotubes
PPy : Polypyrrole
PVP : Poly(vinyl pyrrolidone)
RE : Reference electrode
rGO : Reduced graphene oxide
SB : Standard deviation of the blank solution
SCE : Saturated calomel electrode
SE : Secondary electrons
SEM : Scanning Electron Microscopy
xxi
TEM : Transmission Electron Microscopy
TDMAPP: Tetra (p-dimethylaminophenyl) porphyrin
TPP : 5,10,15,20-tetraphenylporphyrin
TPPP : Tetra (N-phenylpyrazole) porphyrin
UA : Uric acid
UMMC : University Malaya Medical Centre
V : Voltage
WE : Working electrode
XRD : X-ray Diffraction
ZnFe2O4 : Zinc iron oxide or zinc ferrite

1
CHAPTER 1 : INTRODUCTION
1.1 Study background
As diabetes is a worldwide public health problem, the quick and tight monitoring
of glucose level in the human body is required in the market due to increase in the
number of diabetes patient every year (Association, 2014). Providing this reliable
control and fast determination of glucose is the interest of many researches. It needs
highly sensitive glucose sensors and many efforts have been done to develop effective
methods for glucose measurement. Sensitive and selective glucose sensors are used in
blood sugar monitoring, food industry, bio-processing and also in the development of
renewable and sustainable fuel cells (Kumary et al., 2013; Prilutsky et al., 2010).
Although glucose oxidase (GOx) and glucose dehydrogenase (GDH)-based
biosensors have been widely used in the determination of blood glucose since 1962 but
they shared common disadvantages (Santhosh et al., (2009); Wang et al., 2013). The
intrinsic nature of enzymes is the main drawback and enzyme-based sensors suffer from
instability problem and easily being affected during fabrication, storage or use by the
environmental factors such as temperature, humidity, pH values and toxic chemicals
(Sim et al., 2012; Zhang et al., 2014). Furthermore, glucose oxidase immobilization
which included adsorption, cross-linking and electro-polymerization, is a complicated
and expensive process. Thus, enzyme-free glucose sensors have started to catch the
scientist’s attention (Huang et al., 2013; Li et al., 2014; Qiu & Huang, 2010). The
benefits of long term stability, reproducibility, resistance to thermal implications with
low cost, simple fabrication method and being free from oxygen limitation are the
strengths behind this category of sensors (Huang et al., 2013; Park et al., 2006; Qiu &
Huang, 2010).
2
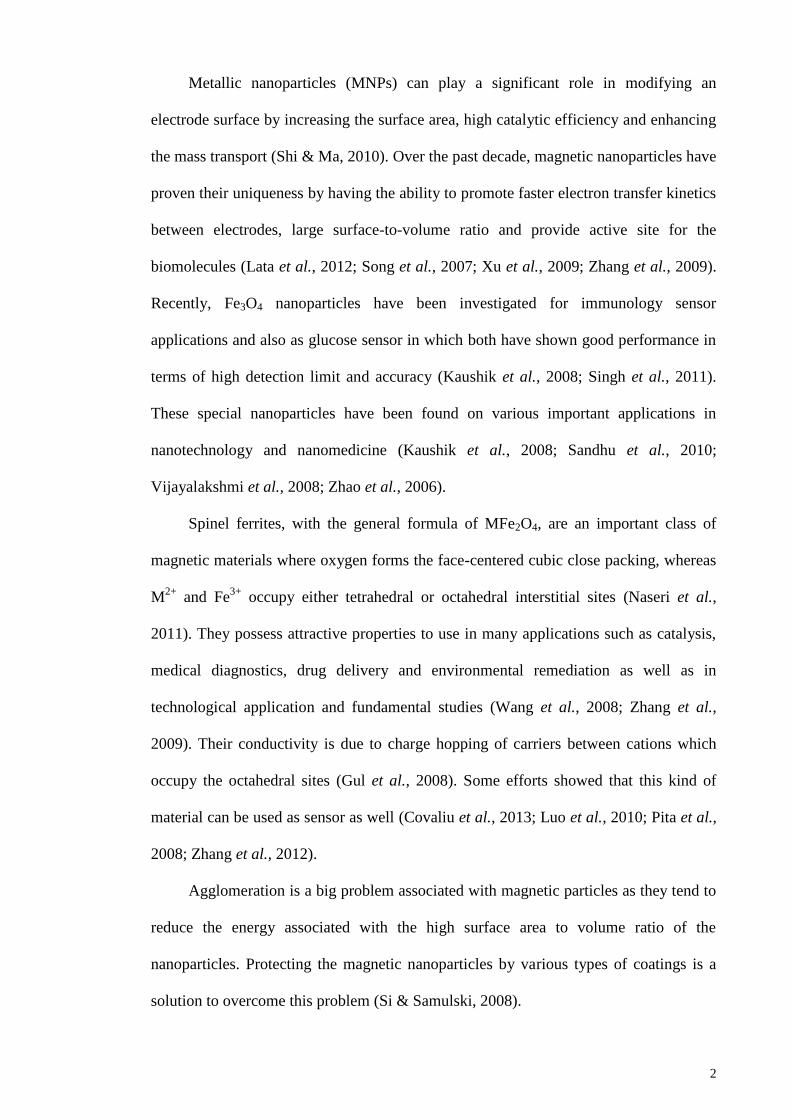
Metallic nanoparticles (MNPs) can play a significant role in modifying an
electrode surface by increasing the surface area, high catalytic efficiency and enhancing
the mass transport (Shi & Ma, 2010). Over the past decade, magnetic nanoparticles have
proven their uniqueness by having the ability to promote faster electron transfer kinetics
between electrodes, large surface-to-volume ratio and provide active site for the
biomolecules (Lata et al., 2012; Song et al., 2007; Xu et al., 2009; Zhang et al., 2009).
Recently, Fe3O4 nanoparticles have been investigated for immunology sensor
applications and also as glucose sensor in which both have shown good performance in
terms of high detection limit and accuracy (Kaushik et al., 2008; Singh et al., 2011).
These special nanoparticles have been found on various important applications in
nanotechnology and nanomedicine (Kaushik et al., 2008; Sandhu et al., 2010;
Vijayalakshmi et al., 2008; Zhao et al., 2006).
Spinel ferrites, with the general formula of MFe2O4, are an important class of
magnetic materials where oxygen forms the face-centered cubic close packing, whereas
M2+
and Fe3+
occupy either tetrahedral or octahedral interstitial sites (Naseri et al.,
2011). They possess attractive properties to use in many applications such as catalysis,
medical diagnostics, drug delivery and environmental remediation as well as in
technological application and fundamental studies (Wang et al., 2008; Zhang et al.,
2009). Their conductivity is due to charge hopping of carriers between cations which
occupy the octahedral sites (Gul et al., 2008). Some efforts showed that this kind of
material can be used as sensor as well (Covaliu et al., 2013; Luo et al., 2010; Pita et al.,
2008; Zhang et al., 2012).
Agglomeration is a big problem associated with magnetic particles as they tend to
reduce the energy associated with the high surface area to volume ratio of the
nanoparticles. Protecting the magnetic nanoparticles by various types of coatings is a
solution to overcome this problem (Si & Samulski, 2008).
3
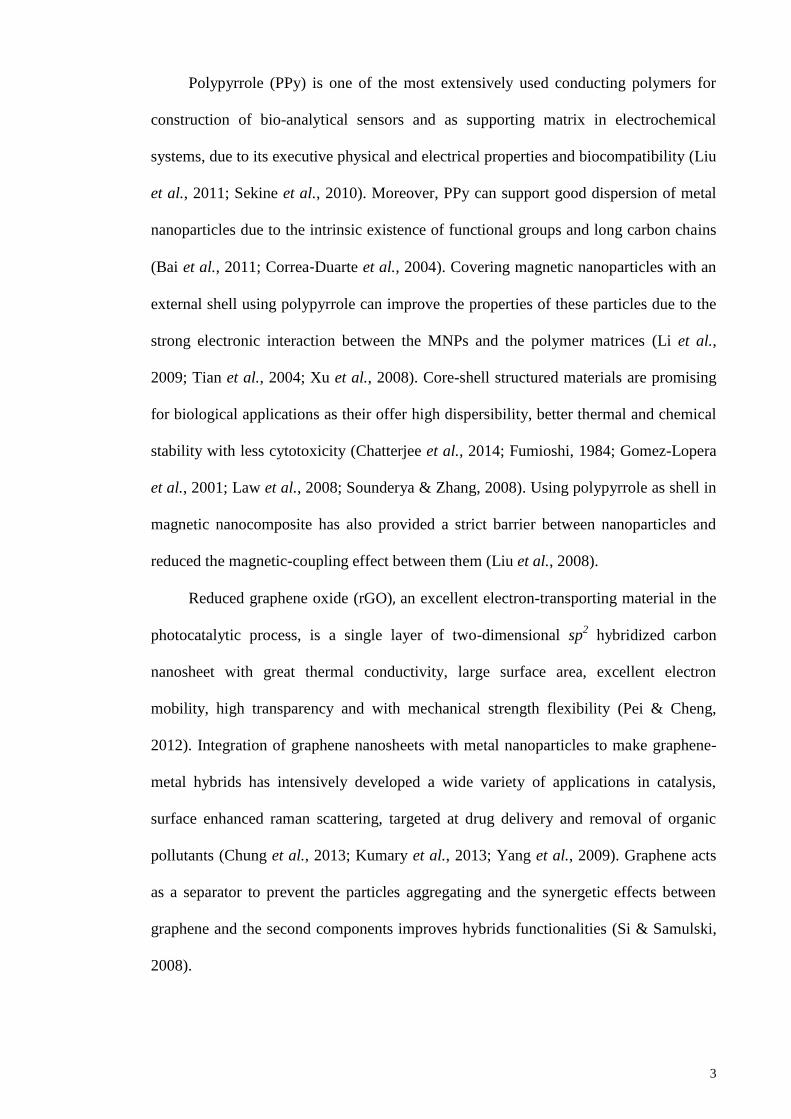
Polypyrrole (PPy) is one of the most extensively used conducting polymers for
construction of bio-analytical sensors and as supporting matrix in electrochemical
systems, due to its executive physical and electrical properties and biocompatibility (Liu
et al., 2011; Sekine et al., 2010). Moreover, PPy can support good dispersion of metal
nanoparticles due to the intrinsic existence of functional groups and long carbon chains
(Bai et al., 2011; Correa‐Duarte et al., 2004). Covering magnetic nanoparticles with an
external shell using polypyrrole can improve the properties of these particles due to the
strong electronic interaction between the MNPs and the polymer matrices (Li et al.,
2009; Tian et al., 2004; Xu et al., 2008). Core-shell structured materials are promising
for biological applications as their offer high dispersibility, better thermal and chemical
stability with less cytotoxicity (Chatterjee et al., 2014; Fumioshi, 1984; Gomez-Lopera
et al., 2001; Law et al., 2008; Sounderya & Zhang, 2008). Using polypyrrole as shell in
magnetic nanocomposite has also provided a strict barrier between nanoparticles and
reduced the magnetic-coupling effect between them (Liu et al., 2008).
Reduced graphene oxide (rGO), an excellent electron-transporting material in the
photocatalytic process, is a single layer of two-dimensional sp2 hybridized carbon
nanosheet with great thermal conductivity, large surface area, excellent electron
mobility, high transparency and with mechanical strength flexibility (Pei & Cheng,
2012). Integration of graphene nanosheets with metal nanoparticles to make graphene-
metal hybrids has intensively developed a wide variety of applications in catalysis,
surface enhanced raman scattering, targeted at drug delivery and removal of organic
pollutants (Chung et al., 2013; Kumary et al., 2013; Yang et al., 2009). Graphene acts
as a separator to prevent the particles aggregating and the synergetic effects between
graphene and the second components improves hybrids functionalities (Si & Samulski,
2008).
4
To my best knowledge, this is the first time that polypyrrole-ZnFe2O4 magnetic
nanocomposite and polypyrrole-CuFe2O4 magnetic nanocomposite were applied in
glucose sensors. The shell thickness in these core-shell nanoparticles is adjustable by
controlling the amount of pyrrole monomers. To take advantages on the benefits of
graphene oxide, ZnFe2O4/rGO magnetic nanocomposite and CuFe2O4/rGO magnetic
nanocomposite were fabricated as enzyme-free glucose sensor as well.
1.2 Thesis outline
The work presented in this thesis deals with the potential application of magnetic
nanocomposites as an enzymless sensor for detection of glucose in human blood.
Chapter 1 presents the general introduction on research background about magnetic
nanoparticles, conductive polymers, graphene oxide and their application in
electrochemical sensors, as well as the scope and objectives of this thesis.
Chapter 2 describes the literature review on nanomaterials, electrochemical glucose
sensors, chemical modified electrodes and electrochemical techniques.
Chapter 3 discusses chemicals, materials and techniques that are applied to synthesize
and characterize four types of nanocomposites as well as a general procedure for
fabrication of reported electrochemical sensors.
Chapter 4 reports the characterization and performance of each fabricated
electrochemical sensor.
Part 1 illustrates a novel glucose electrochemical sensor based on polypyrrole coated
copper ferrite oxide (CuFe2O4/PPy) nanocomposite (This work has been published in
Journal of Solid State Electrochemistry, April 2015, Volume 19, Issue 4, pp 1223-1233,
doi:10.1007/s10008-015-2738-6). Part 2 demonstrates the synthesized polypyrrole
coated zinc ferrite oxide nanocomposite (ZnFe2O4/PPy) for glucose sensing (This work
has been published in Journal of Applied Surface Science, Volume 317, pp 622-629,
5
doi:10.1016/j.apsusc.2014.08.194). Part 3 reveals the performance of copper ferrite
oxide reduced graphene oxide nanocomposite (CuFe2O4/rGO) for oxidation of glucose
where it shows that the hydrothermal synthesis graphene oxide was used to improve the
sensitivity of glucose sensor. (This work has been published in Journal of Ceramics
International doi:10.1016/j.ceramint.2015.06.103). Part 4 shows the ability of zinc
ferrite oxide reduced graphene oxide nanocomposite (ZnFe2O4/rGO) for glucose
sensing. (This work has been submitted to Journal of Applied Surface Science). All
nanocomposites were characterized by X-ray diffraction technique (XRD), Fourier
transform infrared spectroscopy (FTIR), scanning electron microscopy (SEM) and
transmission electron microscopy (TEM).
Chapter 5 draws the thesis summary and proposed future works.
1.3 Objectives
The aim of this research is to synthesise and characterise new class of magnetic
nanocomposites to develop new sensing materials for detecting glucose concentrations
in blood serum.
The goals of this thesis are as follow:
To synthesize polypyrrole/magnetic nanocomposite with core-shell structure and
reduced graphene oxide/ magnetic nanocomposite.
To demonstrate the synthesized nanocomposite as electrochemical sensor.
To optimize the performance of the electrochemical sensor as an enzyme-free
sensor for detection of glucose.
6
CHAPTER 2 : LITERATURE REVIEW
In this section, a literature review of the relevant subjects is presented, including a
brief description of the needs and techniques used to monitor the blood glucose level,
and review of magnetic nanoparticles, conducting polymers and graphene which are the
subject of this work.
2.1 Diabetes
Diabetes mellitus is becoming more widespread serious disease; there are about
387 million people have diabetes, while the number is expected to multiply by 1.54
folds by the end of 2030 (Kernt et al., 2014; Shaw et al., 2010). Diabetes is not curable
but manageable and accurate blood glucose monitoring of a diabetic patient is an
unavoidable activity. The blood glucose level must be maintained within the normal
range (4.4 - 6.6 mM) which is vital for the healthcare of diabetics (Wang, 2008).
Glucose is the most common tested analyte since many of the patients test their level of
glucose from blood daily. Via a finger prick, a small sample of blood is placed onto a
sensor test strip and a handheld electronic reader reports the glucose concentration
without the need for laboratory analysis (Ginsberg, 2009). However, there are
limitations can alter the accuracy of blood glucose strips including low stability of
enzymatic sensor test strip and interfering substances. Strips have a finite lifetime and
storing strips at high temperature or high humidity can shorten the life of the strips.
There is usually a great excess of enzyme, lack of enzyme or enzyme failure is the cause
of inaccuracy. Interfering substances in the blood can confound the accuracy of glucose
meters, thus using sensors which can negate effect of interferences substances is very
important (Bode, 2007; Cash & Clark, 2010). Improving the clinical use of blood
7
glucose monitoring is a need which can be done possibly by developing easier and more
accurate sensor in the future.
2.2 Analyte
An analyte refers as substance or chemical constituent which its properties is
measured in an analytical procedure. The main analyte that is determined by the
developed electrochemical enzyme-free sensor in this thesis is glucose; some sugars
such as fructose and sucrose were tested as interference studies. Interferences are
molecules which co-exist with glucose in blood and continue to disturb signals during
blood glucose monitoring in diabetes. An important factor in developing glucose sensor
is to eliminate or minimize the effect of interferences on glucose detection in the
electrochemical sensor; as a result ascorbic acid and uric acid (blood species) were
studied as part of the analyte in this work.
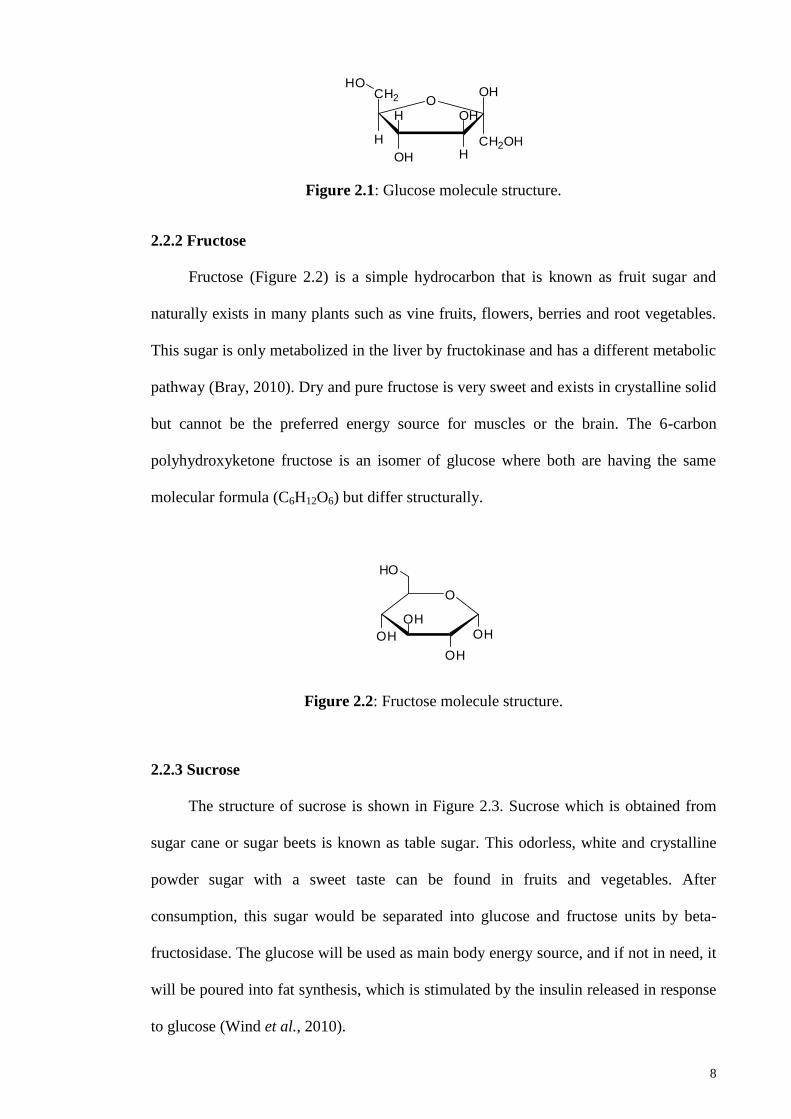
2.2.1 Glucose
Glucose (Figure 2.1) is a simple hydrocarbon which is known as grape sugar,
blood sugar or corn sugar. This monosaccharide is the major cellular carbohydrate
source and a common medical analyte measured in blood samples. Liver cell glycogen
gets converted to glucose and returns to the blood when insulin level is low or absence.
The concentration of glucose in the blood is regulated by the insulin and other
mechanisms. High blood sugar level is a symptom of pre-diabetic and diabetic
conditions. As a primary source of energy for the brain, any decline in glucose
concentration will damage psychological processes such as self-control and decision-
making (Berg et al., 2002).
8
CH2OH
OH
H
CH2
OH H
H OHO
HO
Figure 2.1: Glucose molecule structure.
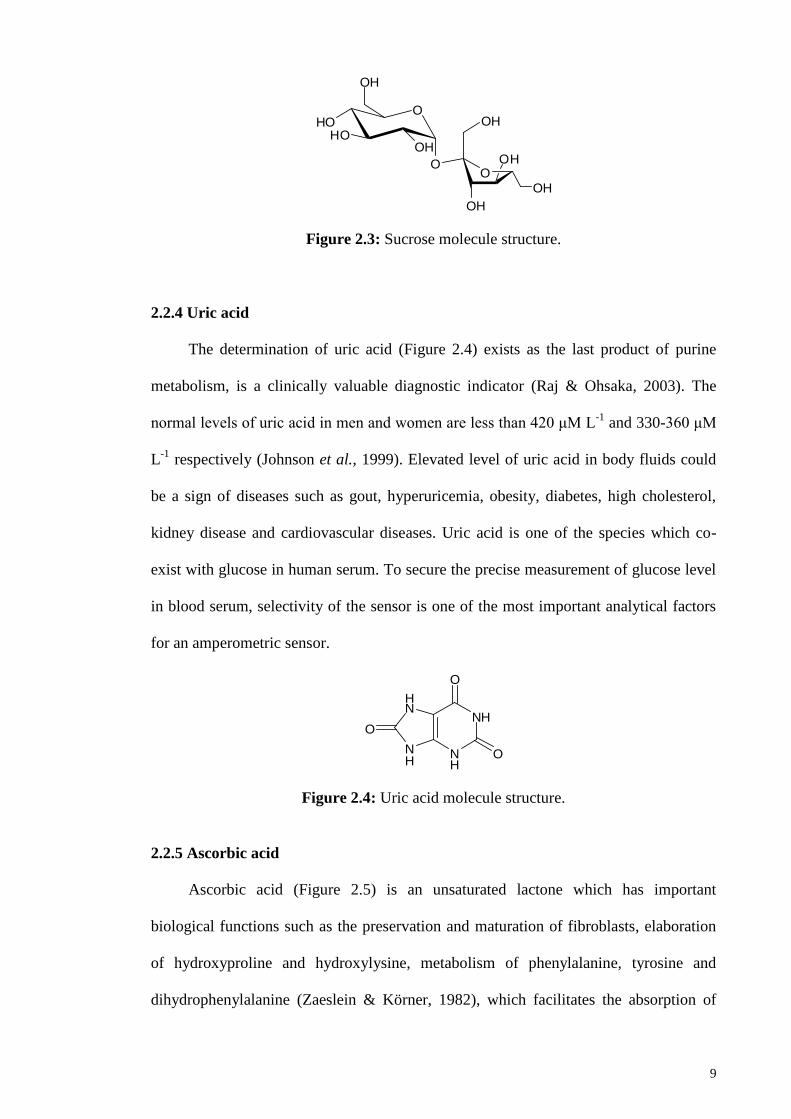
2.2.2 Fructose
Fructose (Figure 2.2) is a simple hydrocarbon that is known as fruit sugar and
naturally exists in many plants such as vine fruits, flowers, berries and root vegetables.
This sugar is only metabolized in the liver by fructokinase and has a different metabolic
pathway (Bray, 2010). Dry and pure fructose is very sweet and exists in crystalline solid
but cannot be the preferred energy source for muscles or the brain. The 6-carbon
polyhydroxyketone fructose is an isomer of glucose where both are having the same
molecular formula (C6H12O6) but differ structurally.
O
OH OH
OH
OH
HO
Figure 2.2: Fructose molecule structure.
2.2.3 Sucrose
The structure of sucrose is shown in Figure 2.3. Sucrose which is obtained from
sugar cane or sugar beets is known as table sugar. This odorless, white and crystalline
powder sugar with a sweet taste can be found in fruits and vegetables. After
consumption, this sugar would be separated into glucose and fructose units by beta-
fructosidase. The glucose will be used as main body energy source, and if not in need, it
will be poured into fat synthesis, which is stimulated by the insulin released in response
to glucose (Wind et al., 2010).
9
OHO
HO
O
OH
OH
O
OH
OH
OH
OH
Figure 2.3: Sucrose molecule structure.
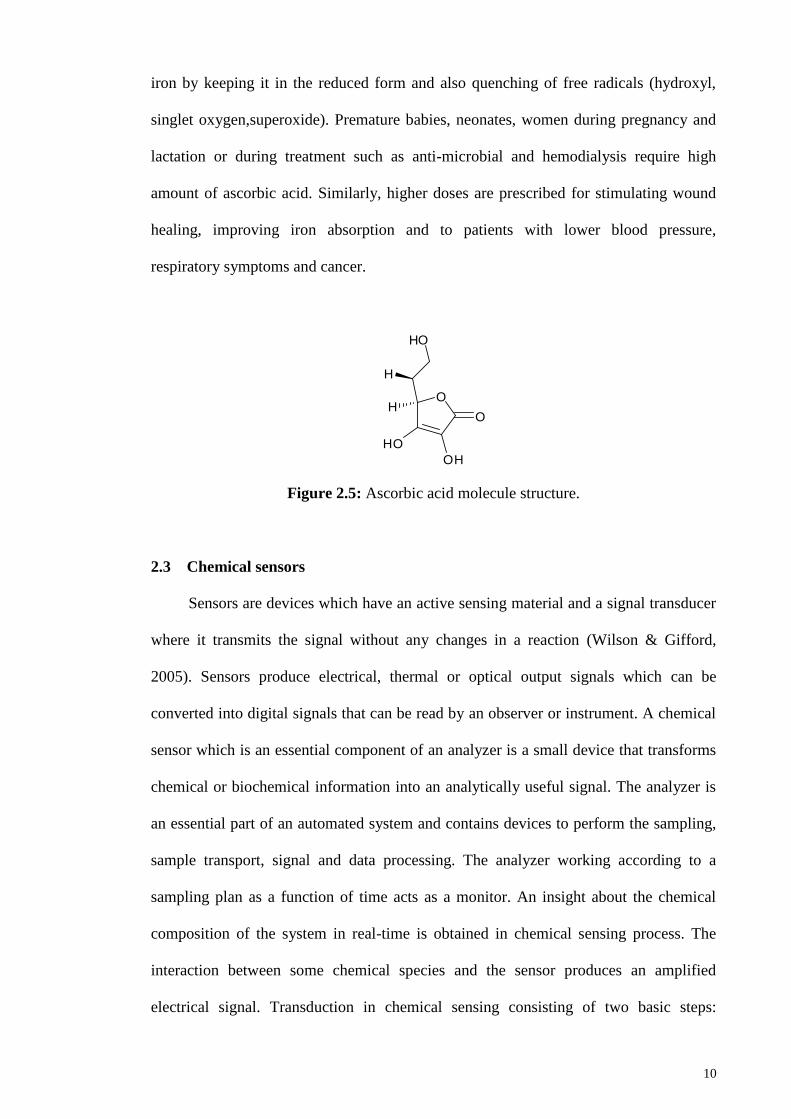
2.2.4 Uric acid
The determination of uric acid (Figure 2.4) exists as the last product of purine
metabolism, is a clinically valuable diagnostic indicator (Raj & Ohsaka, 2003). The
normal levels of uric acid in men and women are less than 420 μM L-1
and 330-360 μM
L-1
respectively (Johnson et al., 1999). Elevated level of uric acid in body fluids could
be a sign of diseases such as gout, hyperuricemia, obesity, diabetes, high cholesterol,
kidney disease and cardiovascular diseases. Uric acid is one of the species which co-
exist with glucose in human serum. To secure the precise measurement of glucose level
in blood serum, selectivity of the sensor is one of the most important analytical factors
for an amperometric sensor.
NH
NH
HN
NH
O
O
O
Figure 2.4: Uric acid molecule structure.
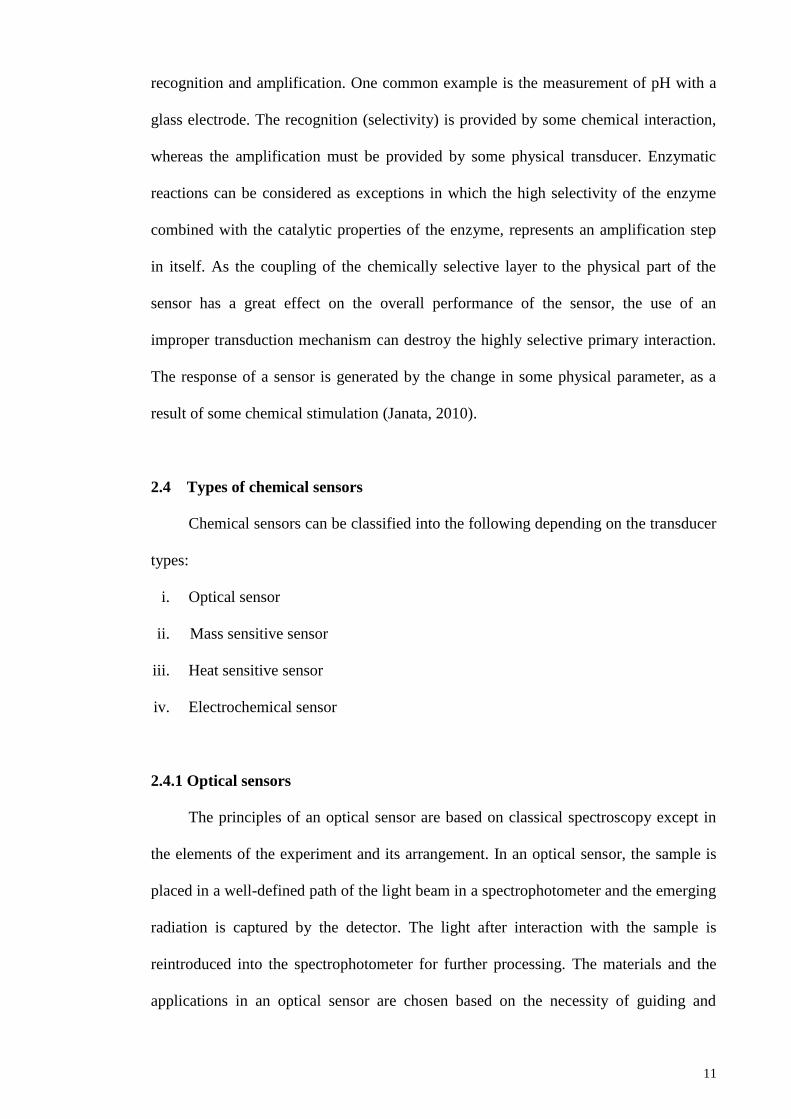
2.2.5 Ascorbic acid
Ascorbic acid (Figure 2.5) is an unsaturated lactone which has important
biological functions such as the preservation and maturation of fibroblasts, elaboration
of hydroxyproline and hydroxylysine, metabolism of phenylalanine, tyrosine and
dihydrophenylalanine (Zaeslein & Körner, 1982), which facilitates the absorption of
10
iron by keeping it in the reduced form and also quenching of free radicals (hydroxyl,
singlet oxygen,superoxide). Premature babies, neonates, women during pregnancy and
lactation or during treatment such as anti-microbial and hemodialysis require high
amount of ascorbic acid. Similarly, higher doses are prescribed for stimulating wound
healing, improving iron absorption and to patients with lower blood pressure,
respiratory symptoms and cancer.
O
HO
OH
OH
H
HO
Figure 2.5: Ascorbic acid molecule structure.
2.3 Chemical sensors
Sensors are devices which have an active sensing material and a signal transducer
where it transmits the signal without any changes in a reaction (Wilson & Gifford,
2005). Sensors produce electrical, thermal or optical output signals which can be
converted into digital signals that can be read by an observer or instrument. A chemical
sensor which is an essential component of an analyzer is a small device that transforms
chemical or biochemical information into an analytically useful signal. The analyzer is
an essential part of an automated system and contains devices to perform the sampling,
sample transport, signal and data processing. The analyzer working according to a
sampling plan as a function of time acts as a monitor. An insight about the chemical
composition of the system in real-time is obtained in chemical sensing process. The
interaction between some chemical species and the sensor produces an amplified
electrical signal. Transduction in chemical sensing consisting of two basic steps:
11
recognition and amplification. One common example is the measurement of pH with a
glass electrode. The recognition (selectivity) is provided by some chemical interaction,
whereas the amplification must be provided by some physical transducer. Enzymatic
reactions can be considered as exceptions in which the high selectivity of the enzyme
combined with the catalytic properties of the enzyme, represents an amplification step
in itself. As the coupling of the chemically selective layer to the physical part of the
sensor has a great effect on the overall performance of the sensor, the use of an
improper transduction mechanism can destroy the highly selective primary interaction.
The response of a sensor is generated by the change in some physical parameter, as a
result of some chemical stimulation (Janata, 2010).
2.4 Types of chemical sensors
Chemical sensors can be classified into the following depending on the transducer
types:
i. Optical sensor
ii. Mass sensitive sensor
iii. Heat sensitive sensor
iv. Electrochemical sensor
2.4.1 Optical sensors
The principles of an optical sensor are based on classical spectroscopy except in
the elements of the experiment and its arrangement. In an optical sensor, the sample is
placed in a well-defined path of the light beam in a spectrophotometer and the emerging
radiation is captured by the detector. The light after interaction with the sample is
reintroduced into the spectrophotometer for further processing. The materials and the
applications in an optical sensor are chosen based on the necessity of guiding and

12
manipulating the light over a distance dictates. The development and use of optical
sensors are informed by the knowledge base of spectroscopy. Yang synthesized three
porphyrin compounds including, 5,10,15,20-tetraphenylporphyrin (TPP), tetra(p-
dimethylaminophenyl)porphyrin (TDMAPP) and tetra(N-phenylpyrazole) porphyrin
(TPPP). These compounds were studied as mercury ions (Hg2+
) optical sensor. Among
them TDMAPP showed the best performance for detecting Hg2+
ions with a linear range
covering from 4.0 × 10⁻⁸
mol L−1
to 4.0 × 10⁻⁶
mol L−1
with a detection limit of
8.0 × 10⁻⁹
mol L−1
(Yang, 2009). In another work by Pandey and co-workers, silver
nanoparticles were synthesized by a very simple method to be used for ammonia
measurement. In this green method, guar gum acted as reducing agent to reduce silver
nitrate salts. The proposed optical sensor showed the response time of 2-3 s and the
detection limit of 1 ppm at room temperature (Pandey et al., 2012).
2.4.2 Mass sensitive sensors
This sensor relies on a change in mass on the surface of an oscillating crystal
which shifts the frequency of oscillation. The extent of the frequency shift is a function
of the amount of material absorbed on the surface (Gründler, 2007). In this sensor the
piezoelectric effect is important and is particularly useful as gas sensors. Among several
types of materials that exhibit the piezoelectric effect, quartz is one the best because of
its properties such as inexpensive and relatively strong piezoelectric coefficient. A
mass-sensitive pH sensor was described by Ruan et al. This sensor was based on the
poly(acrylic acid-co-isooctyl acrylate) hydrogel, with an acrylic acid (80%) and N,N-
methylenebis(acrylamide) cross linker which enhanced the sensitivity by increasing the
acrylic acid fraction in the poly(acrylic acid-co-isooctyl) acrylate copolymer (Ruan et
al., 2003). In another work, Mujahid et al. reported a mass-sensitive sensor for detection
of organic solvent vapours for both polar (methanol and ethanol) and non-polar
13
(chloroform and tetrachloroethylene) substances by using pure cholesteric liquid
crystals and in a polymer matrix. The results showed that the mass effect for
tetrachloroethylene was about six times higher than chloroform and combining
cholesteric liquid crystals with imprinted polymers improved the mechanical stability
(Mujahid et al., 2010).
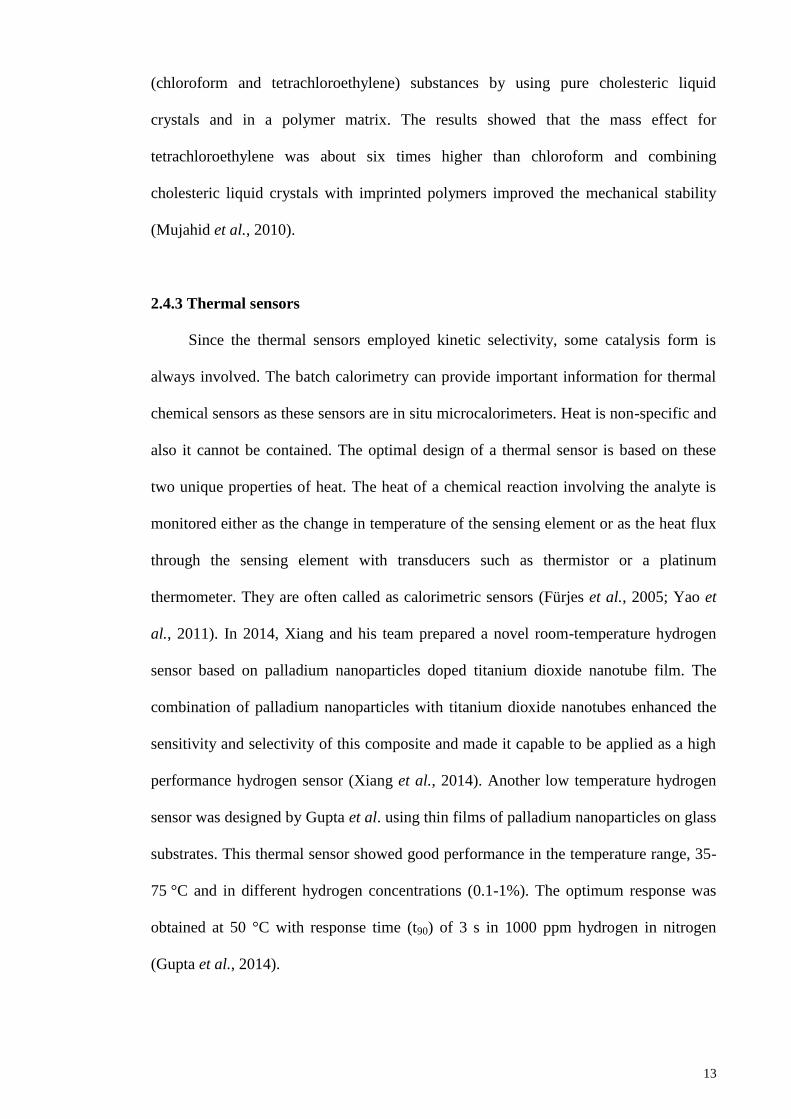
2.4.3 Thermal sensors
Since the thermal sensors employed kinetic selectivity, some catalysis form is
always involved. The batch calorimetry can provide important information for thermal
chemical sensors as these sensors are in situ microcalorimeters. Heat is non-specific and
also it cannot be contained. The optimal design of a thermal sensor is based on these
two unique properties of heat. The heat of a chemical reaction involving the analyte is
monitored either as the change in temperature of the sensing element or as the heat flux
through the sensing element with transducers such as thermistor or a platinum
thermometer. They are often called as calorimetric sensors (Fürjes et al., 2005; Yao et
al., 2011). In 2014, Xiang and his team prepared a novel room-temperature hydrogen
sensor based on palladium nanoparticles doped titanium dioxide nanotube film. The
combination of palladium nanoparticles with titanium dioxide nanotubes enhanced the
sensitivity and selectivity of this composite and made it capable to be applied as a high
performance hydrogen sensor (Xiang et al., 2014). Another low temperature hydrogen
sensor was designed by Gupta et al. using thin films of palladium nanoparticles on glass
substrates. This thermal sensor showed good performance in the temperature range, 35-
75 °C and in different hydrogen concentrations (0.1-1%). The optimum response was
obtained at 50 °C with response time (t90) of 3 s in 1000 ppm hydrogen in nitrogen
(Gupta et al., 2014).
14
2.4.4 Electrochemical sensors
In electrochemical sensor, the electrode serves as the signal transducer and the
measurable response is an electrical current. This kind of sensor is designed to detect and
responds to an analyte in all states. In comparison with optical, thermal and mass
sensors, electrochemical sensors are growing fast because of their outstanding
simplicity, detectability, low-cost and reproducibility (Bakker & Qin, 2006; Janata,
2001). There are three major types of electrochemical sensors which include
voltammetric, potentiometric and amperometric sensors (Janata, 1992). In voltammetry,
the current and the potential are measured and recorded. The position of peak current is
related to the specific chemical and the peak current density is proportional to the
concentration of the corresponding species. Low noise and simultaneous detection of
multiple analytes are the advantages of this technique (Su et al., 2011). Potentiometric
sensor interface has a local equilibrium where either the membrane or electrode
potential is measured, and information about the composition of a sample is obtained
from the potential difference between two electrodes (Skoog et al.). In this technique a
gas-sensing electrode or an ion-selective electrode is the transducer. Although a
potentiometric biosensor has high sensitivity and selectivity due to the species-selective
working electrode used in the system, but some required conditions such as a highly
stable and accurate reference electrode may potentially limit its application in microbial
biosensors (Su et al., 2011). In amperometric sensors, the current at the working
electrode is measured which is produced by an applicable voltage at the interface of
electrode and solution (Wang, 2006). The information from this kind of sensor is
obtained from the current-concentration relationship. The working electrode can be a
cathode or anode and it depends on added electrons or withdrawn electrons from the
sample. The current is the resultant of electrochemical oxidation or reduction of the
electroactive compound. By applying steady state convection, a constant current is
15
measured as the concentration of electroactive species is uniform (Kellner et al., 2004).
Sensitivity of an amperometric sensor is better than the potentiometric sensor and thus it
is used in high-performance liquid chromatography. The signal-transduction mechanism
is frequently used for biosensors. In this class of sensors, the high degree of electrodes
reproducibility eliminates the cumbersome requirement for repeated calibration and an
in situ measurement is possible. Based on advantages of amperometric sensors, this kind
of sensor was selected for determination of glucose level in this work.
2.5 Electrochemical glucose sensors
An electrochemical glucose sensor mainly consists of two- or three-electrodes
which are called working, reference and auxiliary (or counter) electrodes. Working
electrode is coated by active materials to react specifically with the glucose molecules.
In this configuration the working electrode potential can be measured against the
reference electrode without compromising the stability of the reference electrode by
passing current over it. The analyte diffuses into the sensor where it is oxidized or
reduced, thereby generating the change of electric signal, which then passes through the
external circuit comprising of amplifiers and other signal processing devices. The
electrical signal is then converted to the analyte detection signal and displayed as
concentration value (Zhang & Li, 2004). In an electrochemical sensor, an electrode
serves as the signal transducer and the measurable response is an electrical current. The
choice of molecular–recognition element depends on the analyte. Overall, the
electrochemical glucose sensor can be divided into two main categories; enzymatic
glucose sensor and enzyme-free glucose sensor.
16
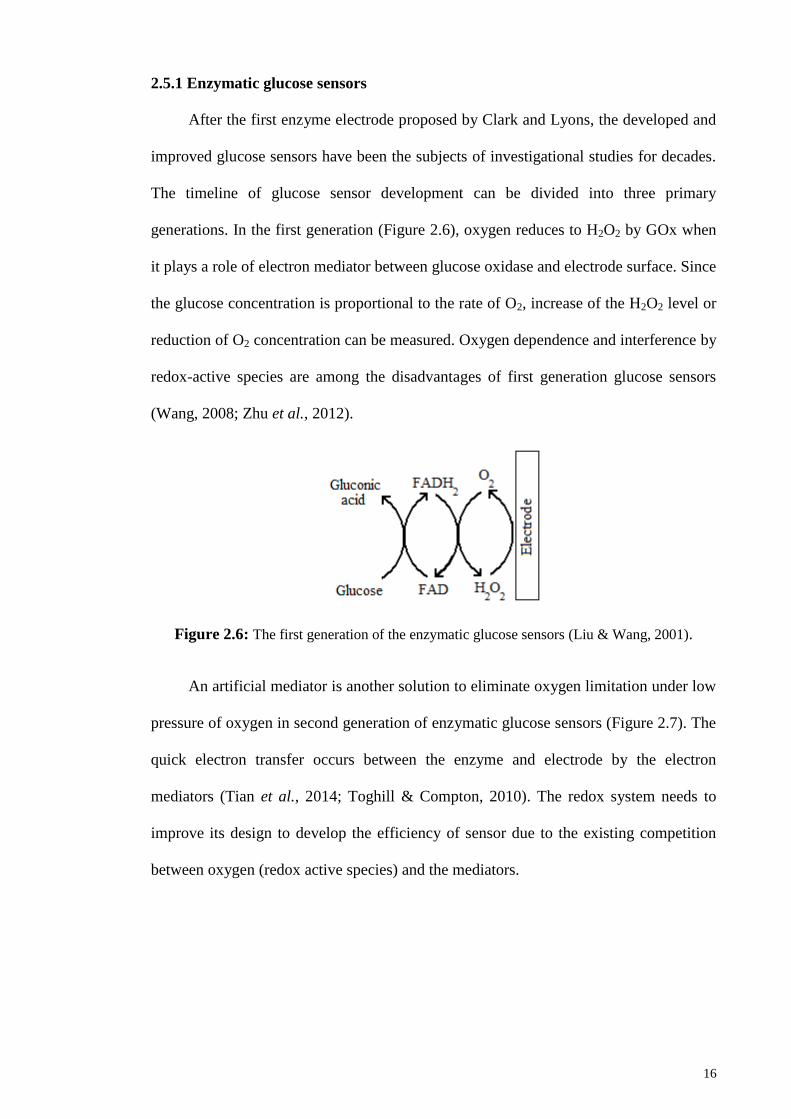
2.5.1 Enzymatic glucose sensors
After the first enzyme electrode proposed by Clark and Lyons, the developed and
improved glucose sensors have been the subjects of investigational studies for decades.
The timeline of glucose sensor development can be divided into three primary
generations. In the first generation (Figure 2.6), oxygen reduces to H2O2 by GOx when
it plays a role of electron mediator between glucose oxidase and electrode surface. Since
the glucose concentration is proportional to the rate of O2, increase of the H2O2 level or
reduction of O2 concentration can be measured. Oxygen dependence and interference by
redox-active species are among the disadvantages of first generation glucose sensors
(Wang, 2008; Zhu et al., 2012).
Figure 2.6: The first generation of the enzymatic glucose sensors (Liu & Wang, 2001).
An artificial mediator is another solution to eliminate oxygen limitation under low
pressure of oxygen in second generation of enzymatic glucose sensors (Figure 2.7). The
quick electron transfer occurs between the enzyme and electrode by the electron
mediators (Tian et al., 2014; Toghill & Compton, 2010). The redox system needs to
improve its design to develop the efficiency of sensor due to the existing competition
between oxygen (redox active species) and the mediators.

17
Figure 2.7: The second generation of enzyme glucose sensors (Cash & Clark, 2010).
In the third generation of glucose sensors, the electrons travel to the electrode
surface. The electrical connection between electrode and the active redox sites of the
enzyme facilitate the electron transfer as amperometric signal directly which it is not
influence by concentration of oxygen or redox mediators. The elimination of possible
interferences can be considered as the most important advantage in this design
(Palmisano et al., 2002; Rahman et al., 2010).
The enzymatic glucose sensors dominated the market; however, they suffer
various drawbacks. High oxygen dependence in first generation sensors made them
unsuitable for practical and reliable analytical use. Moreover, the presence of other
electroactive interferences in the sample hinders the enzymatic sensors ability. In
second generation sensors, the synthetic mediators could overcome oxygen dependence
with lower amperometric potential to avoid some electroactive interferences. In the third
generation sensors which are still in their infancy, stability is a big issue in development
and application of enzymatic glucose sensors (Bao et al., 2008), GOx is still affected by
pH ranges of 2-8, high temperatures and humidity levels (Sim et al., 2012; Zhang et al.,
2014) which make the sensor to be deformed, denatured or inactivated. The stability of
enzyme immobilization and mediator electrodes requires high attentions which include
fabrication processes, covalent cross-linking and sol-gel entrapment. These processes
are complicated and time consuming which may decrease the activity of the GOx since
the sensitivity of these glucose sensors is highly depend on the activity of the
18
immobilized enzymes (Li & Lin, 2007b). On the other hand, the high selectivity of the
enzyme towards glucose is one of the considerable advantages of enzymatic glucose
sensors but still it is essential to develop stable sensing applications in high
temperatures and under aggressive environment conditions. The problems associated
with enzyme based glucose sensors have steered researchers to explore enzyme-free
detection. These sensors allow glucose to be oxidized directly on the electrode surface
and have led to the development of the fourth generation of glucose sensor technology.
A considerable amount of research is on-going all around the world regards to enzyme-
free sensors and the number of publications has increased over recent years (Tian et al.,
2014).
2.5.2 Enzyme-free glucose sensors
The use of enzyme-free electrode as glucose sensor is an ideal system which
facilitates glucose oxidization directly in the sample instead of the needs of a fragile and
relatively difficult enzyme immobilization. Fabrication of glucose enzymless sensor is
still an attractive subject which can overcome the limitations of enzymatic glucose
sensor. Various metal based enzyme-free sensors have been investigated to improve the
electrocatalytic activity and selectivity toward the glucose oxidation by using: inert
metals, metal alloys and metal-dispersed carbon nanotubes (Meng et al., 2009; Sun et
al., 2001; Wang et al., 2008; Zhu et al., 2009). Kim et al. developed an enzyme-free
glucose sensor based on nanoporous platinum thin films which exhibited a sensitivity of
10 μA mM-1
cm-2
and a detection limit of 50 μM (Kim et al., 2013). An enzyme-free
glucose sensor was prepared by Kurniawan et al. using Au nanoparticles immobilized
on thin Au electrode, grown by a layer-by-layer deposition method with the detection
limit of below 500 μM and the sensitivity of about 160 μA mM-1
cm-2
(Kurniawan et
al., 2006). However these materials exhibited unsatisfied sensitivity and selectivity to
19
glucose, high costing and quick loss of activity by adsorption and accumulation of
intermediates or chloride ions (Sun et al., 2001; Wang et al., 2008). Besides low
sensitivity, various suggested enzyme-less glucose sensors are lack in glucose
recognition units and distinguishing of glucose from other interferents. To enhance the
sensitivity and selectivity of sensors, a lot of efforts were concentrated on the
modification of working electrodes by new nanomaterials composites. The extensive
research into the enzyme-free approach actually coincided with enzymatic development.
Direct enzyme-free electro-oxidation of glucose is non-diffusion controlled process
(Park et al., 2006) and considerably depends on the electrode material used. By
considering these aspects, the enzyme-free glucose sensor based on nano-sized particles
is an attractive alternative technique. The enzyme-free glucose sensor offers the
following advantages;
Stability: Improvement of enzymatic glucose sensor drawbacks has been the subject of
numerous studies during the past few years. These sensors suffer from insufficient
stability of the enzymes which could be deformed easily by high temperature or
chemicals. Enzyme-less glucose sensors have overcome this issue and shown excellent
sensitivity and selectivity towards detection of glucose even after exposure to sodium
hydroxide or sulphuric acid solution (Toghill & Compton, 2010).
Simplicity and reproducibility: Direct adsorption, sol–gel entrapment, cross-linking
are the processes of enzyme immobilization. Most of the sensitivity of enzymatic
glucose sensor depends on the immobilized enzymes activity (Cosnier, 2003). In spite
of attractive immobilization methods, reproducibility and the sorts of the enzymes
immobilized are still a critical issue in all kinds of enzyme electrodes. The enzymless
sensor is an effective alternative to eliminate these issues (Park et al., 2006).
Oxygen free: Although oxygen dependence is one of the main targets of enzymatic
glucose sensor but they still suffer from oxygen effect. This affection is due to the
20
competition between electron-mediating sites and dissolved oxygen in the solution
(Mano & Heller, 2005). Oxygen limitation is not an issue in enzyme-free glucose
sensors since oxygen in these sensors have been eliminated at appropriate potential for
oxygen effect.
2.6 Nanomaterials
Nanomaterial possesses the size between 1 to 100 nm and the large ratio between
surface atoms to inner atoms (Daniel & Astruc, 2004; Siegel & Fougere, 1995).
Chemical and physical properties of nanoparticles are very different from their bulk
counterparts and it can be tuned by changing the size and shape (Schmidt et al., 1998).
Nanoparticles are very useful for many applications due to their shape and size
dependent properties. These properties help to increase in surface to volume ratio of
nanoparticles and quantum size (Singh, 2011). The size at which the nanoparticle
behaves like its bulk depends on the type of materials. In metals, compared to
semiconductors, a few tens of atoms are adequate to make the nanoparticles behave.
With improvement of characterization and synthesis techniques on the nanometre scale,
nanotechnology has developed significantly in the last ten years. Nowadays, many
efforts have been done to shift from nanomaterials and investigation of their
physicochemical properties to the use of these properties in several applications.
Biomedical is one of the research fields that can vary benefit from the advancement in
nanotechnology (Gaffet, 2011). The great advantages of nanomaterials in the
biomedical research field lies in its ability to operate on the same small scale as all the
intimate biochemical functions involved in the growth, development and ageing of the
human body. One of the disadvantages of nanomaterials is certainly related to long-term
safety for in vitro and in vivo applications. Both toxicology and risk assessment and
management need to be defined for the use of nanoparticles in medical applications.
21
Nanomaterials are supposed to revolutionize human life in the future and have a great
impact on development of biosensors (Singh, 2011; Yousaf & Ali, 2008). Lei’s group
constructed two biosensors based on transferred ZnO and grown ZnO nanoparticles by
two different immobilization approaches to study their performance for glucose
detection. The finding showed that sensitivity of the grown biosensor is higher than that
of the transferred biosensor because the grown zinc oxide have higher specific surface
area and more glucose oxidase can be immobilized on them (Lei et al., 2011).
Periasamy and co-workers proposed a novel nanocomposite based on bismuth oxide
nanoparticles (Bi2O3) and multi-walled carbon nanotubes (MWCNT) to develop a H2O2
biosensor. A thin layer of 1% nafion solution was coated as a binder to anchor the
horseradish peroxidase molecules onto Bi2O3–MWCNT matrix. The nanocomposite
film possesses good biocompatibility and showed excellent electro-catalytic activity
towards H2O2 with high sensitivity and selectivity (Periasamy et al., 2011).
2.7 Magnetic nanoparticles
Magnetism is, to a large extent, a nanoscale phenomenon and the atomic exchange
interaction that defines ferromagnetism is typically on the length scale of 10 nm for
most materials (Lin & Samia, 2006; Skomski, 2003). In magnetic nanoparticles, the
difference between a massive (bulk) material and a nanomaterial is especially
pronounced. Magnetic nanoparticles show unique magnetic attributes such as
superparamagnetic behaviour, high coercivity, low curie temperatures, high magnetic
susceptibility and appropriate physico-chemistry properties (Indira & Lakshmi, 2010;
Majewski & Thierry, 2007). Magnetic characteristics of the material can be extended by
changing the nanoparticle size, shape, composition and structure. However, these
factors cannot always be controlled during the synthesis of nanoparticles nearly equal in
size and chemical composition; therefore, the properties of nanomaterials of the same
22
type can be markedly different. Magnetic nanomaterials have attracted the attention of
scientific community as potential materials for various applications. They are used in
information recording and storage systems (Chernyshov et al., 2013), new permanent
magnets (Balamurugan et al., 2012), magnetic cooling systems (Franco et al., 2012).
Magnetic nanoparticles can take the advantage of specific binding to detect or purify the
biological entities after being modified by biomolecules. The unique property of
magnetic nanoparticles which is response to a magnetic field, exhibit two features,
specificity and magnetism and they are being actively pursued for potential biomedical
applications such as drug delivery (Knežević & Lin, 2013), hyperthermia (Jiang et al.,
2014), magnetic resonance imaging (Yallapu et al., 2011). Due to high number of
potential applications for high quality magnetite nanoparticles in recent years, efficient
methods for the preparation and stabilization of magnetic nanoparticles as well as the
progress in the physical methods for the investigation of such particles have been
developed considerably.
Brownian motion of bare nanoparticles enhanced by Van der Waals and magnetic
dipole-dipole interaction leads to irreversible aggregation of the nanoparticles and can
affect the magnetic properties. For example, aggregation of magnetic nanoparticles in
catalysis decrease the number of accessible reactive groups and leads to less specific
surface areas which the whole catalytic process can be blocked. This unwanted
phenomenon can be minimized by producing colloidal stable magnetic nanoparticles
which can be gained by electrostatic stabilization or steric stabilization or combination
of both. Steric stabilization is provided by organic molecules, such as surfactants,
polymers, and designed ligand or by inorganic coating like silica, gold, silver and
carbon. Polymers are ideal candidates for magnetic nanoparticles coating and they can
also enhance stability via ionic interactions. Pyrrole with heterocyclic structure gives
23
easy access for polypyrrole to cover magnetite NPs, which form core-shell structures
(Karsten et al., 2012; Sharma et al., 2005).
2.8 Synthesis of magnetic nanoparticles
The great interest in magnetic nanoparticles has provided many ways of
preparation. Magnetic nanoparticles can be synthesized via following methods; such as
template-directed, thermal decomposition, deposition method and self-assembly.
2.8.1 Thermal decomposition
In thermal decomposition method, organometallic compounds such as
acetylacetonates in organic solvents (benzyl ether, ethylenediamine and carbonyls) with
surfactants such as oleic acid, oleylamine, poly(vinyl pyrrolidone) (PVP), cetyltrimethyl
ammonium bromide (CTAB) and hexadecylamine are used. The ratio of precursors and
time are two important factors which can affect morphology (spherical particles, cubes)
and particles size in this method. Short decomposition duration resulted in spherical and
longer duration resulted in cubic morphology. Hyeon et al. synthesized cobalt
nanodisks from the thermal decomposition of dicobalt octacarbonyl in the presence of
two surfactants mixture (Hyeon, 2003). The novel core/shell magnetic nickel
nanoparticles were developed via thermal decomposition by Zhang et al. The oleic acid
acted as surfactant and non-coordinating reagent in the preparation of Ni nanoparticles
with a narrow size distribution. It is expected to have a significant potential for
biomolecule separation, magnetic imaging, and optoelectronics (Zhang et al., 2009).
2.8.2. Template assisted fabrication
The template-assisted fabrication is based on growth of the nuclei at the holes of
the template to yield the desired morphology of the nanostructures. The size and shape
24
of the magnetic nanoparticles can be controlled via this method. Although this
technique has advantages such as determination of the final size and morphology of the
nanostructures with full control but the synthesis method is a multi-step process which
needs the fabrication based templates before any depositions (Khan et al.). Hurst and
co-workers demonstrated the synthesis of two components rod structure that was made
by deposition of hydrophilic Au block and hydrophobic polypyrrole block on anodic
alumina oxide template. Hydrophilic Au and hydrophobic polypyrrole were successfully
assembled in a unique shape which is attributed to differences in their diameter (Hurst et
al., 2006). Zhang et al. reported that nickel ferrite nanorods were successfully
synthesized by the thermal treatment of the rod-like precursor that were fabricated by a
coprecipitation of Ni2+
, Fe2+
and C2O42−
ions in a microemulsion solution. Small
subunits of nickel ferrite nanorods made it capable to exhibite higher discharge than that
of the sample with bigger building blocks and using this method increased proportion of
the total number of atoms lies on the surface with decreasing particle size to improve
the electrochemical performances (Zhang et al., 2009).
2.8.3 Self-assembly of magnetic nanostructures
The self-assembly method is based on the thermodynamically atomic arrangement
of magnetic nanoparticles into arrays of complex shape via nanoscale forces. The
relative strong dipole forces of magnetic nanoparticles can form the linear, branch
chains and close packed arrays of magnetic nanostructures. Perez et al. reported
monodisperse magnetic nanoparticles conjugated with virus-surface-specific antibodies
self-assemble in the presence of specific viral particles to create supramolecular
structures with enhanced magnetic properties (Perez et al., 2003). Another
monodispersed, stabilized cobalt nanocrystals were produced by this method. These
25
particles have been observed to produce two-dimensional self-assemblies when
evaporated at low rates under the controlled atmosphere (Puntes et al., 2001).
2.8.4 Hydrothermal synthesis
Hydrothermal synthesis is a technique for synthesis of magnetic nanoparticles
from high boiling point aqueous solution at high vapour pressure which gives great
control over the size and shape of the magnetic nanoparticles. This chemical technique
involves the use of liquid–solid–solution (LSS) reaction (Li et al., 2010). A novel room-
temperature ferromagnetic Mn-doped ZnO nanocrystal was synthesized by
hydrothermal method under high magnetic field. It was found that ferromagnetism is
strongly related to defects and pulsed high magnetic field improved the grain size to be
uniform and enhanced the saturation magnetization of Mn-doped ZnO nanocrystal
(Yang et al., 2010). A novel Fe3O4 nanoprism was prepared by a hydrothermal process.
In this work, Zeng et al. used oleylamine as surfactant and reducing agent and proved
that it plays key role in the formation of different planes of Fe3O4 nanoprism due to
presence of amine group which absorb at certain planes that lead to different
morphology (Zeng et al., 2010). Wu’ group synthesized nanocubes of α-Fe2O3 by one
step facile hydrothermal method. They investigated the effect of volume ratio of
oleylamine and acetylacetone for the fabrication of α- Fe2O3 and used these magnetic
nanoparticles for photocatalytic degradation of organic dye. The synthesized
nanoparticles showed higher photocatalytic degradation activity as compared to oblique
nanocubes which is attributed to the exposure of high-index planes (Wu et al., 2013).
Since the hydrothermal synthesis offers advantages such as uniformity of nucleation,
growth nanoparticles and reduced aggregation levels, which is not possible with many
other synthesis processes, this method was chosen in this thesis.
26
2.9 Application of magnetic nanoparticles
Magnetic nanoparticles have been used widely in various applications such as
storage devices, magnetic information storage, magnetic refrigeration, water splitting,
gas sensors and biomedical applications.
2.9.1 Gas sensing
Researchers reported that copper ferrite (CuFe2O4), zinc ferrite (ZnFe2O4) and
nickel ferrite (NiFe2O4) possessed great response for hydrogen sulfide and chlorine gas
sensing. Reddy et al. revealed that virgin cobalt and zinc ferrites can detect hydrogen
sulfide among all the studied gases. Moreover, it was indicated that nickel ferrite was
suited for chlorine gas sensing (Reddy et al., 2000). In similar work, Liu et al. reported
the preparation of NiFe2O4 nanopowder doped with Au, Pd and Pt by impregnation
technique as gas sensor. Au, Pd and Pt with different concentration were incorporated
into NiFe2O4 nanoparticles. The results showed that NiFe2O4 is a p-type semiconductor
with superior response and selectivity to H2S gas (Liu et al., 2004). An ethanol and H2S
gas sensor were defined by Liu et al. by a convenient and efficient solid-state reaction.
This sensor was based on MgFe2O4 nanomaterial with the grain size of about 15-30 nm
and experimental results showed excellent sensitivity of these nanomaterials to ethanol
and H2S gas at different operating temperatures. The optimum performance to ethanol
and H2S gas was obtained at 335 °C and 160 °C respectively (Liu et al., 2005). In
another research in 2009, magnesium ferrite was prepared via a co-precipitation method
by Hankare et al. The gas sensing of this compound was measured towards gases like
hydrogen sulfide, liquefied petroleum gas, ethanol vapors, H2, NH3, methanol, acetone
and petrol. The results showed the sensor exhibited various responses towards these
gases at different operating temperatures. Furthermore; the MgFe2O4 based sensor
27
exhibited a fast response and a good recovery towards petrol at temperature 250 °C
(Hankare et al., 2009).
2.9.2 Water treatment
Magnetic nanomaterials have been used in removal of metals in wastewater
treatment. They are widely applied for purification of small molecule pollutants in water
due to their unique properties as adsorbents that can be separated and recovered from
complex multiphase by an external magnetic field. Zhang et al. demonstrated
superparamagnetic Fe3O4 mesoporous carbon capsules can be used as absorbents for
highly efficient removal of pollutants from the wastewater. Experiments indicated that
the magnetic nanocomposite exhibited high adsorption rates and excellent removal
capacity of organic pollutants (Zhang et al., 2011). Humic acid coated Fe3O4
nanoparticles for the removal of toxic Hg(II), Pb(II), Cd(II) and Cu(II) from water by
co-precipitation were proposed by Liu et al. The nanocomposite was stable in tap water,
natural waters and acidic/basic solutions and was able to remove over 99% of Hg(II)
and Pb(II) and over 95% of Cu(II) and Cd(II) in natural and tap water at optimized pH
(Liu et al., 2008).
2.9.3 Biomedical
In the last few years many efforts were directed towards the development of
diagnostic tools in order to improve their performance in sensitivity of the response and
to reduce the time and labour required for analysis (Baby & Ramaprabhu, 2010; Yang et
al., 2009). Since many biosensors take several successive steps to generate results, an
obvious necessity for devices to operate in a short time is needed. Such devices can
have a major impact on the diagnosis of several diseases by allowing at-risk patients to
check tell-tale signs of proteins or other biomolecules by simply testing a small droplet
28
of blood or serum. Kaushik et al. demonstrated a new urea sensor by synthesis of
nanobiocomposite of CH and superparamagnetic Fe3O4, (magnetisation: 60.8 emu/g)
via immobilization of urease and glutamate dehydrogenase (Kaushik et al., 2009).
Teymourian et al. developed Fe3O4 magnetic nanoparticles/reduced graphene oxide
nanosheets modified glassy carbon (Fe3O4/rGO/GCE) as a novel system for the
preparation of electrochemical sensing platform (Teymourian et al., 2012). Jimenez et
al. fabricated a magneto-assisted formation of conducting nanowires upon self-
assembling of Au-shell/CoFe2O4-magnetic-core nanoparticles (18 ± 3 nm diameter) on
Au electrode surface by application of an external magnetic field to study
bioelectrocatalytic oxidation of glucose in the presence of soluble glucose oxidase
(Jimenez et al., 2008). In the case of sensors on a substrate, this nanoparticle-
biomolecule reacts with “probes” molecules on the surface of the magnetic sensor after
making complex. An output signal will be produced by the magnetic nanoparticles. In
the case of label-free biosensors, the nanoparticle-biomolecule complexes are directly
detected by probing changes in magnetic properties of the nanoparticles after the
binding events. These kind of label-free biosensors are extremely promising, especially
for point of care applications, where the assay should be simple, requiring no or
minimum preparation. The possibility of analyte detection directly in biological samples
will lead to more economic, simple to use, versatile and flexible sensors.
2.10 Selected magnetic nanoparticles
Ferrites are important group of magnetic nanoparticles that have general formula
AB2O4 where A is a transition metal such as Fe, Mn, Cu or Zn and B is the Fe ions.
They have a typical spinel lattice with a cubic close-packed arrangement, thus forming
two different types of sites, tetrahedral (A) and octahedral (B) (Figure 2.8). The spinal
structure is derived from MgAl2O4 or MgO.Al2O3, by Bragg in 1915. Spinel ferrites are
29
very stable attributed to its crystal structure; they are predominantly ionic. Spinel
ferrites can be divided into three categories-normal, inverse and random spinel ferrites
(Szotek et al., 2006). With the growing need for high specific applications, a lot of
research has been conducted to improve novel electrode materials for sensors
development. Nanostructured transition metal oxides (e.g. Fe3O4, CuO, CdFe2O4, and
CoFe2O4) have been used in many biomedical applications such as drug delivery,
diagnosis and magnetic mediated hyperthermia. Spinel ferrite nanoparticles present
different properties than their bulk counterparts and this makes them the focus for new
material. The varieties of transition metal cations have provided wide range of
applications. Sathiwaitayaku and his team investigated the gas-sensing properties of
orthorhombic and spinel ferrites. These ferrites were synthesized by self-propagating
high-temperature synthesis and were tested against a wide range of environmentally
important gases (ethanol, ethane, ethene, ammonia, propane and CO) at a range of
different operating temperatures. Good gas response behavior was found with excellent
selectivity towards ethanol, particularly in the case of the LaFeO3 sensor
(Sathiwitayakul et al., 2015). Mahmoodi studied the photocatalytic degradation of
manganese ferrite nanoparticle and finding showed formate, acetate and oxalate anions
were detected as dominant aliphatic intermediate and inorganic anions (nitrate and
sulfate) were detected as the mineralization products of dyes during the degradation
processes. These results confirmed the role of manganese ferrite nanoparticle as a
magnetic catalyst to degrade reactive dyes from wastewater (Mahmoodi, 2015). In this
thesis, zinc ferrite and copper ferrite were chosen to develop new nanomaterials for
glucose detection. So far, only a few research has been carried out on zinc ferrite and
copper ferrite in medical sensing and there is not any report about the glucose sensing
ability of these magnetic nanoparticles. In this work the ability of these magnetic
nanoparticles in glucose detection has been studied.
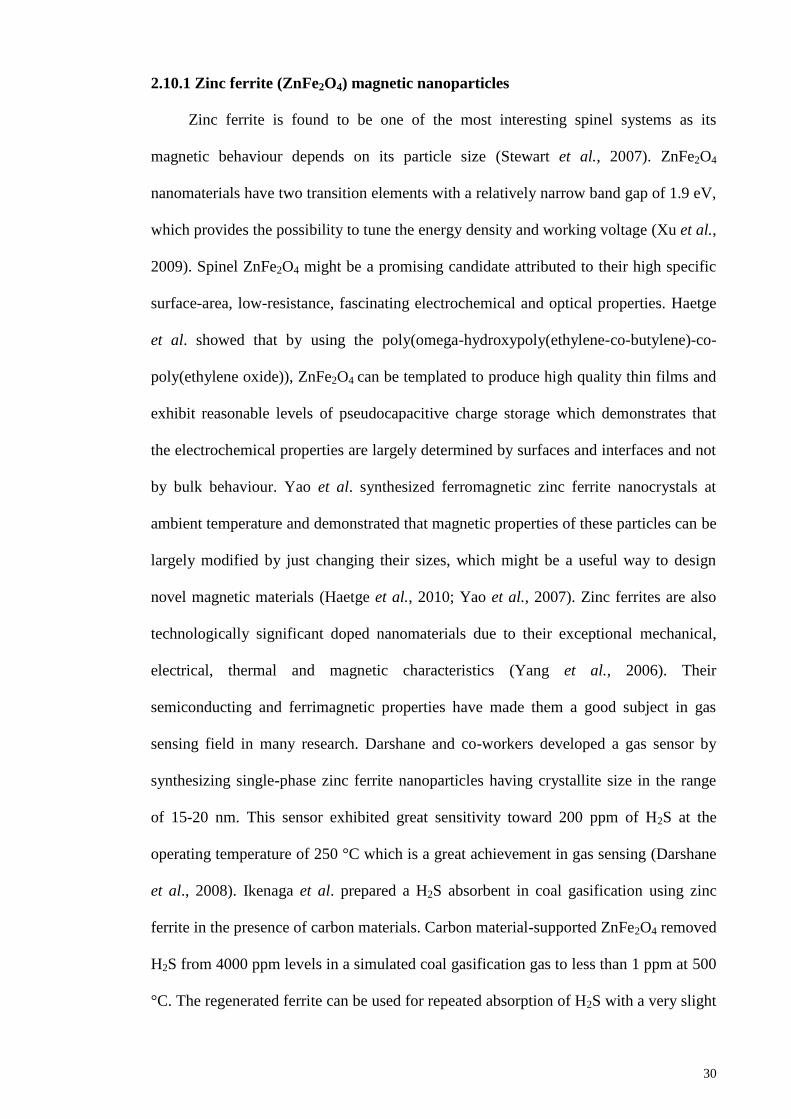
30
2.10.1 Zinc ferrite (ZnFe2O4) magnetic nanoparticles
Zinc ferrite is found to be one of the most interesting spinel systems as its
magnetic behaviour depends on its particle size (Stewart et al., 2007). ZnFe2O4
nanomaterials have two transition elements with a relatively narrow band gap of 1.9 eV,
which provides the possibility to tune the energy density and working voltage (Xu et al.,
2009). Spinel ZnFe2O4 might be a promising candidate attributed to their high specific
surface-area, low-resistance, fascinating electrochemical and optical properties. Haetge
et al. showed that by using the poly(omega-hydroxypoly(ethylene-co-butylene)-co-
poly(ethylene oxide)), ZnFe2O4 can be templated to produce high quality thin films and
exhibit reasonable levels of pseudocapacitive charge storage which demonstrates that
the electrochemical properties are largely determined by surfaces and interfaces and not
by bulk behaviour. Yao et al. synthesized ferromagnetic zinc ferrite nanocrystals at
ambient temperature and demonstrated that magnetic properties of these particles can be
largely modified by just changing their sizes, which might be a useful way to design
novel magnetic materials (Haetge et al., 2010; Yao et al., 2007). Zinc ferrites are also
technologically significant doped nanomaterials due to their exceptional mechanical,
electrical, thermal and magnetic characteristics (Yang et al., 2006). Their
semiconducting and ferrimagnetic properties have made them a good subject in gas
sensing field in many research. Darshane and co-workers developed a gas sensor by
synthesizing single-phase zinc ferrite nanoparticles having crystallite size in the range
of 15-20 nm. This sensor exhibited great sensitivity toward 200 ppm of H2S at the
operating temperature of 250 °C which is a great achievement in gas sensing (Darshane
et al., 2008). Ikenaga et al. prepared a H2S absorbent in coal gasification using zinc
ferrite in the presence of carbon materials. Carbon material-supported ZnFe2O4 removed
H2S from 4000 ppm levels in a simulated coal gasification gas to less than 1 ppm at 500
°C. The regenerated ferrite can be used for repeated absorption of H2S with a very slight

31
decrease in the absorption capacity (Ikenaga et al., 2004). Non-stoichiometric
ZnFe2O4 powders were synthesized by Sutka and his group to study optical and visible
light photocatalytic activity of these ferrite nanoparticles (Sutka et al., 2012). ZnFe2O4
magnetic nanomaterials have also been a major focus of research in medicine, medical
diagnostics and drug delivery. Mixed spinel hydrophobic ZnxFe1−xO.Fe2O3 (up to x=
0.34) nanoparticles encapsulated in polymeric micelles synthesized, Bárcena et al. have
developed a highly sensitive magnetic resonance probes for molecular imaging
applications (Bárcena et al., 2008). Combining all the special features possesed by zinc
ferrite magnetic nanoparticles, it makes a good candidate to explore its potential in
glucose sensor application.
Figure 2.8: Zinc ferrite (ZnFe2O4); a) in powder; b) chemical structure.
2.10.2 Copper ferrite (CuFe2O4) magnetic nanoparticles
Copper ferrite, CuFe2O4 can be described as a cubic close-packed arrangement of
oxygen ions, with Cu2+
and Fe3+
ions at two different crystallographic sites (Krupicka et
al., 1982). Local symmetries of the two sites are different which are tetrahedral and
octahedral (Jiang et al., 1999). The development of gas sensors in detection of toxic gas
pollutants based on these magnetic nanoparticles has been the subject of many
fundamental and applied researches. In an excellent work by Singh et al., copper ferrite
was successfully synthesized via co-precipitation for liquefied petroleum gas sensing at
room temperature. The band gap of copper ferrite were 3.09 and 2.81 eV, respectively
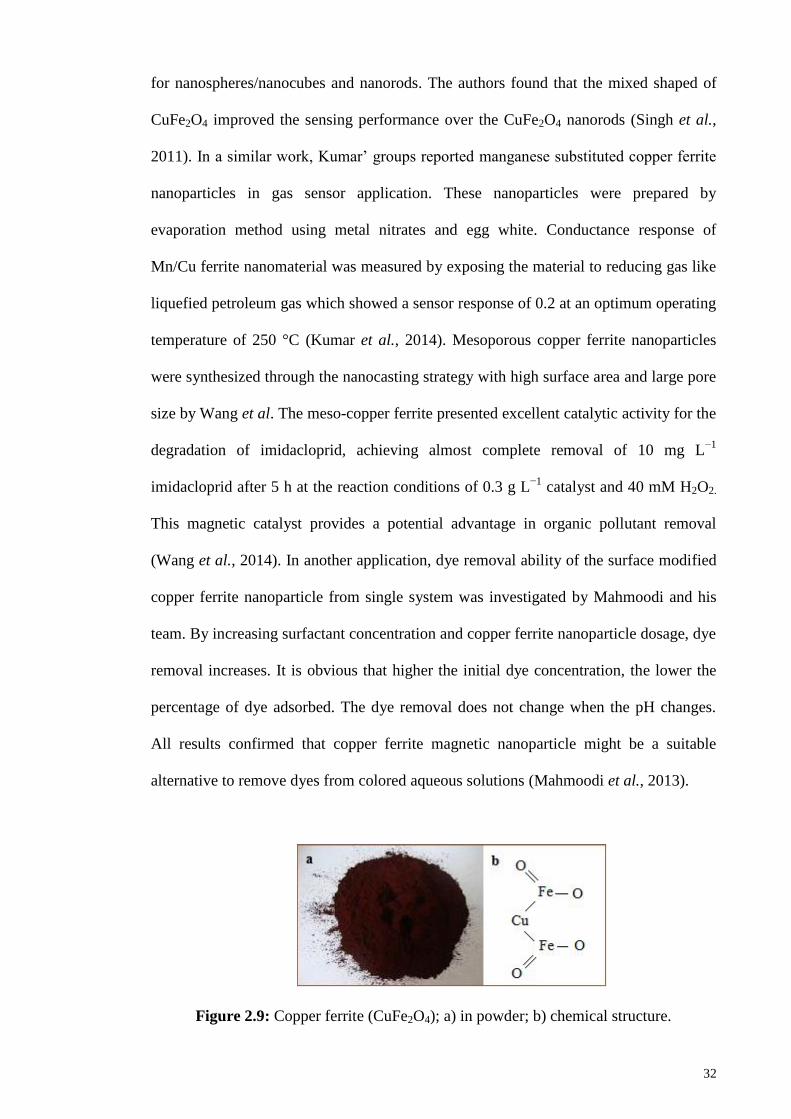
32
for nanospheres/nanocubes and nanorods. The authors found that the mixed shaped of
CuFe2O4 improved the sensing performance over the CuFe2O4 nanorods (Singh et al.,
2011). In a similar work, Kumar’ groups reported manganese substituted copper ferrite
nanoparticles in gas sensor application. These nanoparticles were prepared by
evaporation method using metal nitrates and egg white. Conductance response of
Mn/Cu ferrite nanomaterial was measured by exposing the material to reducing gas like
liquefied petroleum gas which showed a sensor response of 0.2 at an optimum operating
temperature of 250 °C (Kumar et al., 2014). Mesoporous copper ferrite nanoparticles
were synthesized through the nanocasting strategy with high surface area and large pore
size by Wang et al. The meso-copper ferrite presented excellent catalytic activity for the
degradation of imidacloprid, achieving almost complete removal of 10 mg L−1
imidacloprid after 5 h at the reaction conditions of 0.3 g L−1
catalyst and 40 mM H2O2.
This magnetic catalyst provides a potential advantage in organic pollutant removal
(Wang et al., 2014). In another application, dye removal ability of the surface modified
copper ferrite nanoparticle from single system was investigated by Mahmoodi and his
team. By increasing surfactant concentration and copper ferrite nanoparticle dosage, dye
removal increases. It is obvious that higher the initial dye concentration, the lower the
percentage of dye adsorbed. The dye removal does not change when the pH changes.
All results confirmed that copper ferrite magnetic nanoparticle might be a suitable
alternative to remove dyes from colored aqueous solutions (Mahmoodi et al., 2013).
Figure 2.9: Copper ferrite (CuFe2O4); a) in powder; b) chemical structure.
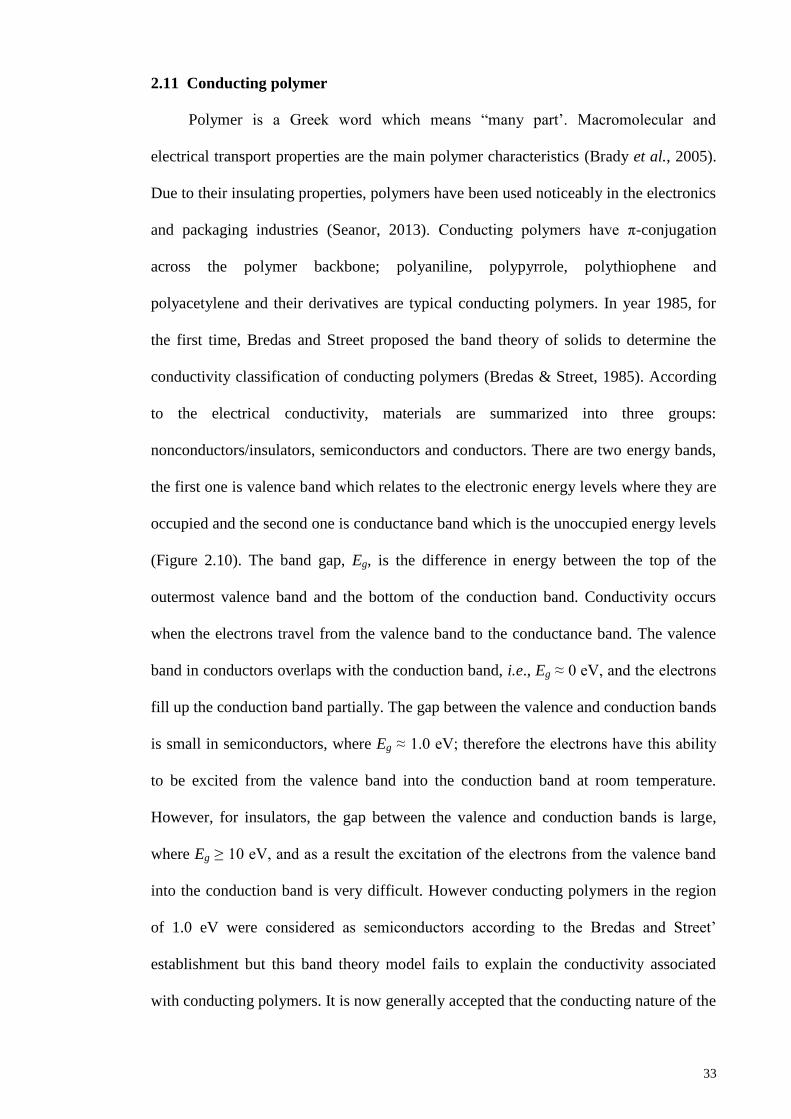
33
2.11 Conducting polymer
Polymer is a Greek word which means “many part’. Macromolecular and
electrical transport properties are the main polymer characteristics (Brady et al., 2005).
Due to their insulating properties, polymers have been used noticeably in the electronics
and packaging industries (Seanor, 2013). Conducting polymers have π-conjugation
across the polymer backbone; polyaniline, polypyrrole, polythiophene and
polyacetylene and their derivatives are typical conducting polymers. In year 1985, for
the first time, Bredas and Street proposed the band theory of solids to determine the
conductivity classification of conducting polymers (Bredas & Street, 1985). According
to the electrical conductivity, materials are summarized into three groups:
nonconductors/insulators, semiconductors and conductors. There are two energy bands,
the first one is valence band which relates to the electronic energy levels where they are
occupied and the second one is conductance band which is the unoccupied energy levels
(Figure 2.10). The band gap, Eg, is the difference in energy between the top of the
outermost valence band and the bottom of the conduction band. Conductivity occurs
when the electrons travel from the valence band to the conductance band. The valence
band in conductors overlaps with the conduction band, i.e., Eg ≈ 0 eV, and the electrons
fill up the conduction band partially. The gap between the valence and conduction bands
is small in semiconductors, where Eg ≈ 1.0 eV; therefore the electrons have this ability
to be excited from the valence band into the conduction band at room temperature.
However, for insulators, the gap between the valence and conduction bands is large,
where Eg ≥ 10 eV, and as a result the excitation of the electrons from the valence band
into the conduction band is very difficult. However conducting polymers in the region
of 1.0 eV were considered as semiconductors according to the Bredas and Street’
establishment but this band theory model fails to explain the conductivity associated
with conducting polymers. It is now generally accepted that the conducting nature of the
34
polymers arises from the formation of various redox states upon oxidation of the
conjugated backbone. This is due to the formation of mobile charge carriers, which are
termed polarons and bipolarons (Dai, 2004; Molapo et al., 2012).
Figure 2.10: A band gap energy model for insulators, semiconductors and conductors.
The synthesis of conducting polymers can be carried out by both electrochemical
and chemical oxidative polymerization. A chemical route is recommended for large
amounts of polymer. In chemical synthesis which typically carried out in solution, a
relatively strong oxidising agent such as ammonium peroxydisulphate permanganate or
dichromate anions, ferric ions or hydrogen peroxide will need to be used to oxidise a
monomer. The concentration of oxidant and monomer, the reaction temperature and
surface treating are the factors which affect the rate of polymerization. Electrochemical
polymerization is generally employed by galvanostatic, potentiostatic or
potentiodynamic methods. Electrochemical polymerization is simple, reproducible and
more preferable, especially if the polymeric product is intended for use as a polymer
film electrode, thin-layer sensor or in microtechnology because potential control is a
prerequisite for the production of good-quality material and the formation of the
35
polymer film at the desired spot in order to serve as an anode during synthesis (Inzelt,
2012; Lange et al., 2008).
2.11.1 Synthesis of polypyrrole (PPy)
Polypyrrole is an organic material consists of carbon, hydrogen and nitrogen
atoms which formed by pyrrole repeating units (Figure 2.11). Polypyrrole was
synthesized for the first time in 1916, when a report on the oxidation of pyrrole with
hydrogen peroxide gives an amorphous black powder was published. Since then a large
variety of PPy films and PPy derivatives have been successfully synthesized on
different electrode substrates, using various polymerizing solutions. In 2003, Fenelon
and Breslin reported the successful electropolymerization of pyrrole on CuNi electrode.
In this method, presence of the copper cations facilitated the pyrrole
electropolymerization to generate a homogenous and adherent polypyrrole film
(Fenelon & Breslin, 2003). Cadierno et al. reported a simple and highly efficient
method for the preparation of fully substituted pyrroles using readily accessible
secondary propargylic alcohols, 1,3-dicarbonyl compounds and primary amines. The
one-pot multicomponent reaction, which involves initial propargylation of the 1,3-
dicarbonyl compound promoted by CF3CO2H and subsequent condensation between the
resulting γ-keto alkyne and the primary amine to afford a propargylated β-enamino ester
or ketone, which undergoes a ruthenium-catalysed 5-exo-dig annulation to form the
final pyrrole (Cadierno et al., 2007). Rakshit’s group reported a conceptually novel
pyrrole synthesis by a novel rhodium catalyzed sp3 C-H bond activation of enamines
and successive coupling with unactivated alkynes (Rakshit et al., 2010). Li’s group
described an efficient method for the synthesis of 1, 3, 4-trisubstituted or 3, 4-
disubstituted pyrroles. The authors used AgOAc-mediated oxidative coupling reaction
in a one-pot manner. In this report, the pyrroles were synthesized directly from
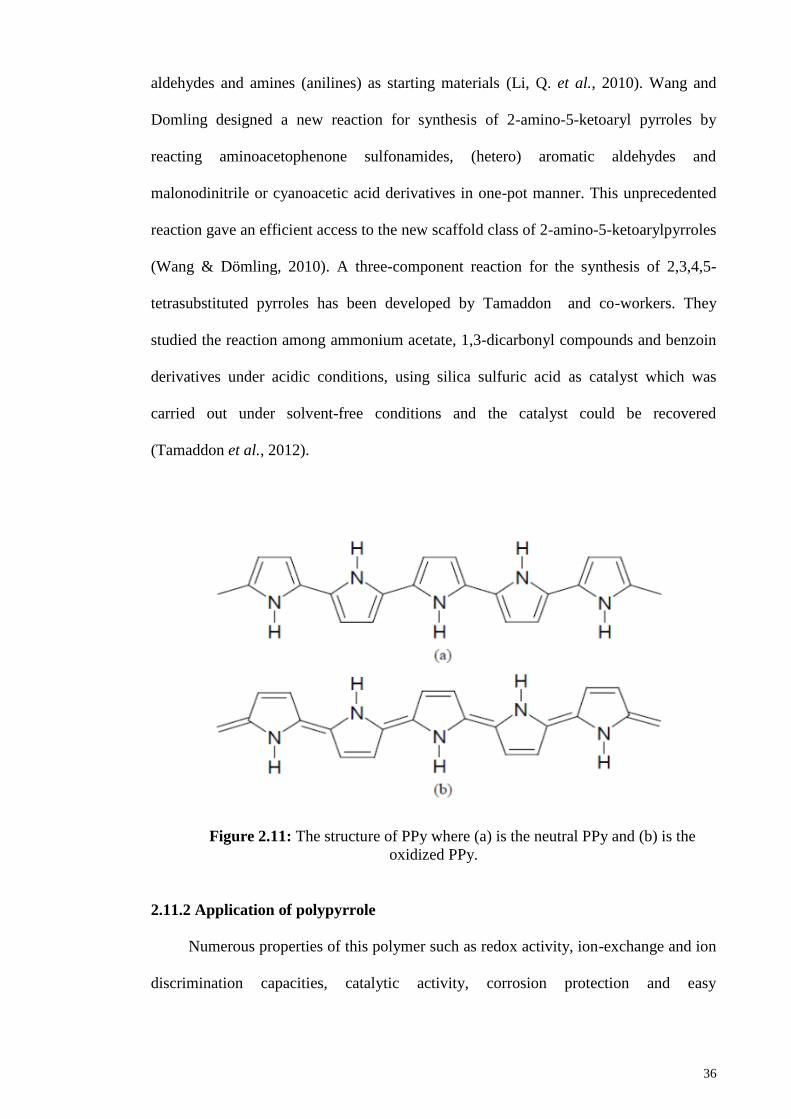
36
aldehydes and amines (anilines) as starting materials (Li, Q. et al., 2010). Wang and
Domling designed a new reaction for synthesis of 2-amino-5-ketoaryl pyrroles by
reacting aminoacetophenone sulfonamides, (hetero) aromatic aldehydes and
malonodinitrile or cyanoacetic acid derivatives in one-pot manner. This unprecedented
reaction gave an efficient access to the new scaffold class of 2-amino-5-ketoarylpyrroles
(Wang & Dömling, 2010). A three-component reaction for the synthesis of 2,3,4,5-
tetrasubstituted pyrroles has been developed by Tamaddon and co-workers. They
studied the reaction among ammonium acetate, 1,3-dicarbonyl compounds and benzoin
derivatives under acidic conditions, using silica sulfuric acid as catalyst which was
carried out under solvent-free conditions and the catalyst could be recovered
(Tamaddon et al., 2012).
Figure 2.11: The structure of PPy where (a) is the neutral PPy and (b) is the
oxidized PPy.
2.11.2 Application of polypyrrole
Numerous properties of this polymer such as redox activity, ion-exchange and ion
discrimination capacities, catalytic activity, corrosion protection and easy
37
electrochemical surface deposition have made it one of the most extensively used
conducting polymers in various applications (Raudsepp et al., 2014; Zhang et al., 2014).
High electrical conductivity and mechanical flexibility of pyrrole make it suitable
for the construction of electronic devices. Guo et al. reported an organic/inorganic p-n
junction nanowire consisting of polypyrrole and CdS fabricated using an Al2O3 template
to convert light energy into electricity. The organic/inorganic semiconductor nanowire
exhibits a power conversion efficiency of 0.018% under an illumination intensity of
6.05 mW/cm2
(Guo et al., 2009). Liu et al. demonstrated that Au/polypyrrole nanofiber
using aluminum anodic oxide membrane as template, rectifying behavior, and might
have been used for further application as nano-rectifiers (Liu et al., 2006).
The electrical and optical properties of PPy make this polymer to be explored as
chemical sensor, optical sensor and biosensor. Jin et al. reported the electrochemical
growth of conducting polymer filaments across screen-printed carbon track arrays and
this polypyrrole/polyvinyl sulfonic acid sodium salt filament sensor possess great
sensitivity to ethanol vapour which was three times more than a broad sensor (Jin et al.,
2004). Li et al. fabricated a novel biosensor based on nano-gold/overoxidized
polypyrrole composite. This nanocomposite had strong catalytic activity toward the
oxidation of epinephrine, uric acid and ascorbic acid. The results showed that the
modified electrode can selectively determine epinephrine and uric acid in the
coexistence of a large amount of ascorbic acid. Modifying electrodes with overoxidized
polypyrrole improved the selectivity of the sensor and eliminate the effects of
interferences (Li & Lin, 2007a). Buar et al. presented a reagentless DNA sensor which
was constructed based on an electropolymerized poly-pyrrole-nitrilotriacetic acid film
(poly(pyrrole-NTA)) for the first time. This sensor combined with Cu2+
and histidine
derivatives mimics the biological avidin-biotin interactions by replacing the bulky
avidin with a copper cation. Findings revealed an extremely sensitive detection limit for
38
the hybridization event without a labeling step for the DNA. The polypyrrole
derivatives provide the stable and reproducible immobilization of biological
macromolecules on a surface with complete retention of their biological activity (Baur
et al., 2009). In another work, Baba et al. developed glucose biosensor based on water-
soluble N-alkylaminated polypyrrole/glucose oxidase (GOx) multilayer thin. The
electrochemical and optical signals were simultaneously obtained from the composite
by the electro-activity and electrochromic property of the polypyrrole layers (Baba et
al., 2010). Shi et al. presented a non-enzymatic glucose sensor based on modified
palladium/silicon microchannel plate array electrode by over-oxidized polypyrrole. The
excellent performance of this sensor is attributed to a combination of the larger
electroactive surface area resulting from 3D structure of silicon microchannel plate and
permselectivity due to the over-oxidized polypyrrole film (Shi et al., 2011). Xing et al.
designed a facile strategy for the preparation of polypyrrole/platinum nanocomposite.
This nanocomposite was fabricated using direct deposition of Pt nanoparticles on
polypyrrole through an ultrafast microwave-assisted polyol process. Since this
nanocomposite possess a good electro-catalytic activity toward the reduction of H2O2, a
selective, stable, repeatable and reproducible non-enzymatic electrochemical sensor of
H2O2 based on the nanocomposite was constructed (Xing et al., 2015). During last
decades, considerable progress has been made in synthesis of conducting polymer and
they have displayed an impressive applicative potential from biochemical sensing to
electronic devices. Hybrid nanostructures which are based on conductive polymer can
enhance their properties and addressing the challenges in their applications. In this
work, PPy was used to improve the sensor performance due to its great properties and
its ability which can lead to a substantial increase in surface area and excellent ionic and
electronic conductivity.
39
2.12 Graphene and its applications
Graphene (Figure 2.12) is a one-atom-thick two-dimensional structure of sp2-
bonded carbon with unique mechanical, electronic and optical properties (Balandin et
al., 2008; Geim & Novoselov, 2007). High surface area (Park & Ruoff, 2009; Rao et al.,
2009), great stability, low cost, ease of processing and strong mechanical strength (Lee
et al., 2008; Shao et al., 2010) have made graphene an interesting material in studies
since its discovery in 2004. In recent years graphene exhibits a significant potential for
many applications and researchers have developed novel electronic materials including
transparent conductors, ultrafast transistors, high-performance energy generate devices.
One of the potential applications of graphene is in field emission displays. The electrons
are emitted from a material under the application of high electric field. This field can be
created by field enhancement at the tip of a sharp object and by erected the graphene
sheets on the substrates; higher field enhancement will be approached. Eda et al.
prepared field emission cathodes from graphene, synthesized from graphite oxide,
dissolved in polystyrene by spin coating it onto silicon substrates. This method
provides a route for the deposition of graphene based thin film on different substrates,
opening up avenues for a variety of applications (Eda et al., 2008). Malesevic et al.
synthesized few-layer graphene in the absence of any metallic catalyst by microwave
plasma enhanced chemical vapor deposition with gas mixtures of methane and
hydrogen to study the electric field emission behavior of vertically aligned few-layer
graphene. They found out that the few-layer graphene can be a good field emitter and
samples grown on titanium show lower turn-on field values and higher amplification
factors when compared to samples grown on silicon (Malesevic et al., 2008).
Reversibility and reasonable specific capacity of graphene make it a good choice
in Li-ion battery and supercapacitor. Paek et al. prepared graphene nanosheets
decorated with SnO2 nanoparticles by dispersing reduced graphene nanosheets in the
40
ethylene glycol and reassembling in presence of SnO2 nanoparticles. The obtained
SnO2/graphene exhibits a reversible capacity of 810 mA h/g and its cycling performance
is drastically enhanced in comparison with that of the bare SnO2 nanoparticle (Paek et
al., 2008). Zhang et al. designed supercapacitor electrodes by preparing
graphene/polyaniline nanofiber composites with uniform structure. The capacitor
showed high specific capacitance and good cycling stability which can be related to
doping chemically modified graphenes with polyaniline or by doping the bulky
polyaniline with graphene/graphene oxide (Zhang et al., 2010). Yang et al. reported the
preparation of chitosan and graphene nanocomposites by self-assembly of both
components in aqueous media for electrochemical applications. Incorporation of 1.0
wt% graphene oxide significantly improved the tensile strength and the results indicate
that graphene oxide sheets prefer to disperse well within the nanocomposites (Yang et
al., 2010).
Another application of graphene is in sensors and biosensors. The change of
graphene’s electrical conductivity (σ) plays main role which due to adsorption of
molecules as donors or acceptors on graphene surface (Lee et al., 2008). Some
properties of graphene aid to increase its sensitivity; for instance graphene is a two-
dimensional (2D) material and all carbon atoms are exposed to the analyte (Schedin et
al., 2007). Graphene is also highly conductive and a little change in carrier
concentration can cause a notable variation of electrical conductivity. Furthermore,
graphene has very few crystal defects ensuring a low level of noise caused by thermal
switching (Geim & Novoselov, 2007; Novoselov et al., 2006). Schedin et al. developed
a gas sensor by using graphene which showed good sensing properties towards NO2,
NH3, H2O and CO. It was demonstrated that graphene sensing properties are
recoverable after analyte exposure and chemical doping of graphene by both holes and
electrons, in high concentration, did not affect the mobility of graphene (Schedin et al.,
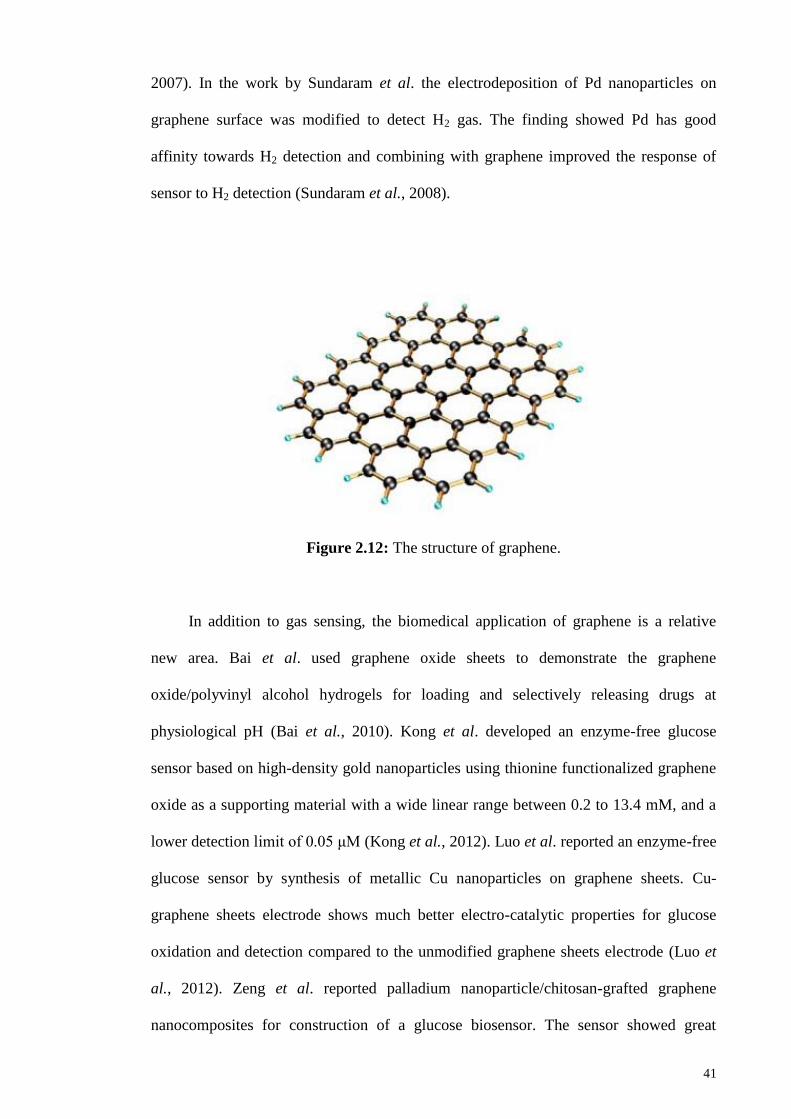
41
2007). In the work by Sundaram et al. the electrodeposition of Pd nanoparticles on
graphene surface was modified to detect H2 gas. The finding showed Pd has good
affinity towards H2 detection and combining with graphene improved the response of
sensor to H2 detection (Sundaram et al., 2008).
Figure 2.12: The structure of graphene.
In addition to gas sensing, the biomedical application of graphene is a relative
new area. Bai et al. used graphene oxide sheets to demonstrate the graphene
oxide/polyvinyl alcohol hydrogels for loading and selectively releasing drugs at
physiological pH (Bai et al., 2010). Kong et al. developed an enzyme-free glucose
sensor based on high-density gold nanoparticles using thionine functionalized graphene
oxide as a supporting material with a wide linear range between 0.2 to 13.4 mM, and a
lower detection limit of 0.05 μM (Kong et al., 2012). Luo et al. reported an enzyme-free
glucose sensor by synthesis of metallic Cu nanoparticles on graphene sheets. Cu-
graphene sheets electrode shows much better electro-catalytic properties for glucose
oxidation and detection compared to the unmodified graphene sheets electrode (Luo et
al., 2012). Zeng et al. reported palladium nanoparticle/chitosan-grafted graphene
nanocomposites for construction of a glucose biosensor. The sensor showed great
42
electro-catalytic activity toward H2O2 with a high sensitivity of 31.2 μA·mM−1
·cm−2
for
glucose was obtained with a wide linear range from 1.0 μM to 1.0 mM. Although
graphene-based biomedical applications are growing fast but they are still in their initial
stage. Some challenging issues for development of an efficient graphene-based
biosensor must be overcome. For instance, graphene derivatives must keep their unique
properties under physiological conditions, or understanding the graphene-cell
interactions especially the cellular uptake mechanism (Shen et al., 2012). In this thesis,
graphene oxide has been used to modify the magnetic nanoparticles to improve an
enzyme-free glucose detector.
43
CHAPTER 3 : METHODOLOGY
This chapter emphasizes on the materials, techniques and experimental methods
that were used in this research to fabricate and characterise the sensors. They include
electrochemical techniques (cyclic voltammetry, amperometry and electrochemical
impedance spectroscopy), microscopic (transmission electron microscopy, scanning
electron microscopy), Fourier transform infrared spectroscopy and X-ray diffraction.
The measurements were performed in three-electrodes system. For electrochemical
studies, depending on the system under investigation, different composites served as the
working electrode, a coiled platinum wire was used as the auxiliary (counter) electrode
and the reference electrode used was saturated calomel electrode (SCE), unless
mentioned elsewhere.
3.1. Reagents & materials
In this thesis, AR grade chemicals with high purity were used and were listed in
Table 3.1. Deionized water (resistivity of 18.2 MΩ.cm at 25 °C) was used throughout
the studies.
Table 3.1: List of chemicals used.
Chemical compounds
Molecular Formula
Brand
Purity (%)
Zinc iron oxide ZnFe2O4 Sigma Aldrich ≥99
Copper iron oxide CuFe2O4 Sigma Aldrich >98.5
Ammonium persulfate (NH4)2S2O8 Sigma Aldrich ≥98
Ethanol C2H6O Sigma Aldrich >99.8
Pyrrole C4H5N Sigma Aldrich >98
Sodium nitrate NaNO3 Sigma Aldrich ≥99
Phosphoric acid H3PO4 Sigma Aldrich ≥85
Potassium permanganate KMnO4 Sigma Aldrich ≥99
Sodium hydroxide NaOH Sigma Aldrich ≥98
Hydrochloric acid HCl Fluka ≥99
Zinc nitrate hexahydrate Zn(NO3)2.6H2O Sigma Aldrich ≥98
Iron(III) nitrate
nonahydrate
Fe(NO3)3·9H2O Sigma Aldrich ≥98
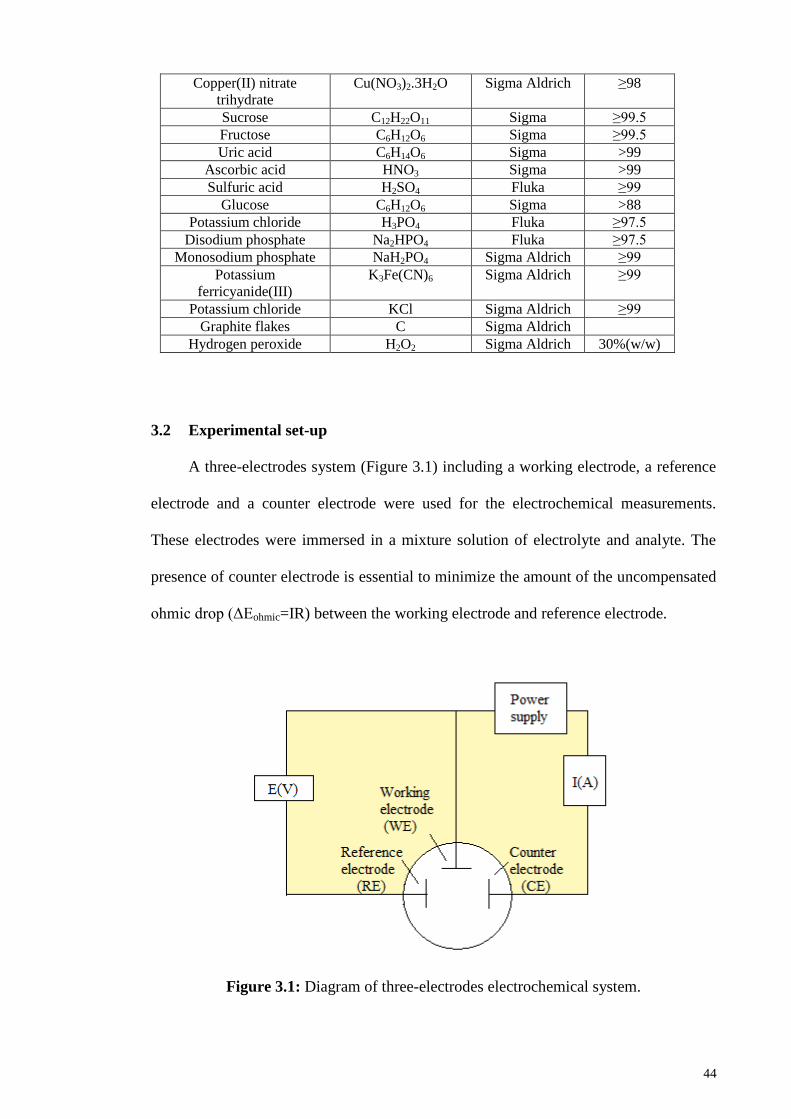
44
Copper(II) nitrate
trihydrate
Cu(NO3)2.3H2O Sigma Aldrich ≥98
Sucrose C12H22O11 Sigma ≥99.5
Fructose C6H12O6 Sigma ≥99.5
Uric acid C6H14O6 Sigma >99
Ascorbic acid HNO3 Sigma >99
Sulfuric acid H2SO4 Fluka ≥99
Glucose C6H12O6 Sigma >88
Potassium chloride H3PO4 Fluka ≥97.5
Disodium phosphate Na2HPO4 Fluka ≥97.5
Monosodium phosphate NaH2PO4 Sigma Aldrich ≥99
Potassium
ferricyanide(III)
K3Fe(CN)6 Sigma Aldrich ≥99
Potassium chloride KCl Sigma Aldrich ≥99
Graphite flakes C Sigma Aldrich
Hydrogen peroxide H2O2 Sigma Aldrich 30%(w/w)
3.2 Experimental set-up
A three-electrodes system (Figure 3.1) including a working electrode, a reference
electrode and a counter electrode were used for the electrochemical measurements.
These electrodes were immersed in a mixture solution of electrolyte and analyte. The
presence of counter electrode is essential to minimize the amount of the uncompensated
ohmic drop (ΔEohmic=IR) between the working electrode and reference electrode.
Figure 3.1: Diagram of three-electrodes electrochemical system.
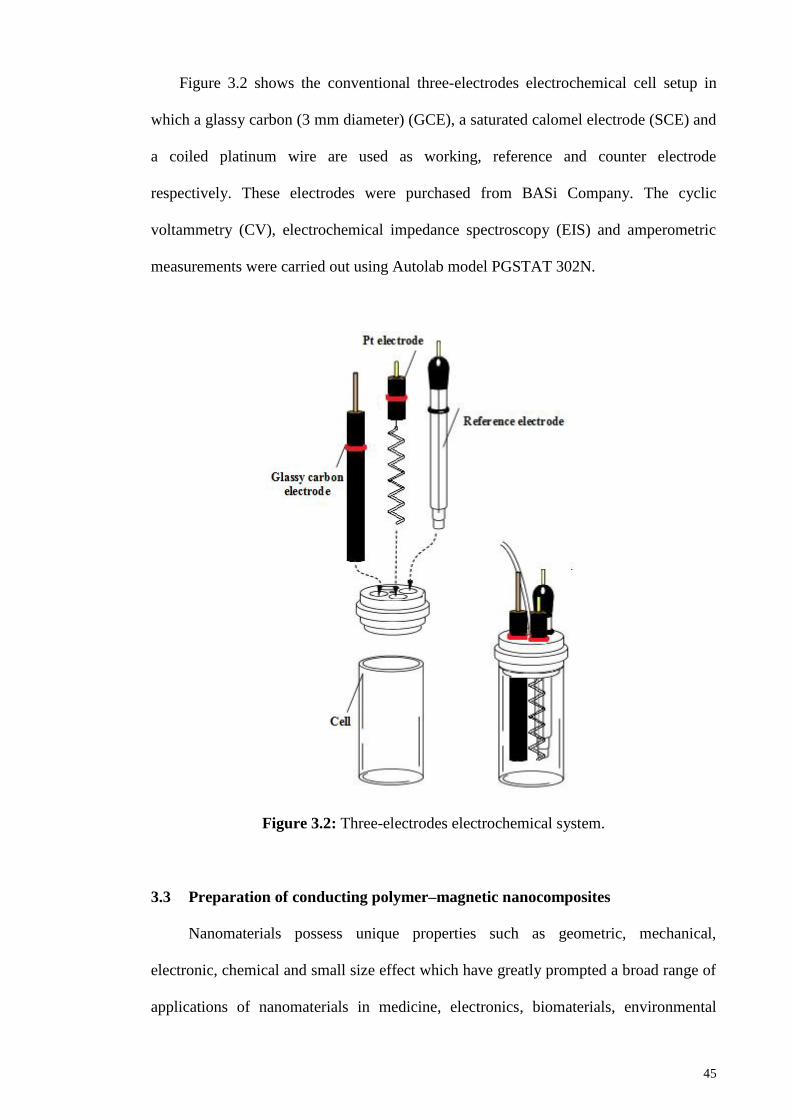
45
Figure 3.2 shows the conventional three-electrodes electrochemical cell setup in
which a glassy carbon (3 mm diameter) (GCE), a saturated calomel electrode (SCE) and
a coiled platinum wire are used as working, reference and counter electrode
respectively. These electrodes were purchased from BASi Company. The cyclic
voltammetry (CV), electrochemical impedance spectroscopy (EIS) and amperometric
measurements were carried out using Autolab model PGSTAT 302N.
Figure 3.2: Three-electrodes electrochemical system.
3.3 Preparation of conducting polymer–magnetic nanocomposites
Nanomaterials possess unique properties such as geometric, mechanical,
electronic, chemical and small size effect which have greatly prompted a broad range of
applications of nanomaterials in medicine, electronics, biomaterials, environmental
46
science, energy production and biosensors (Aillon et al., 2009). A variety of
nanomaterials have been synthesized and characterized for the electrochemical sensing
due to the huge specific surface area for the immobilization of more functional
molecules on the electrodes by nanomaterial-modified electrodes. Conducting polymers
are organic polymers with metallic conductivity or semiconductors properties. Many
conducting polymer–nanomaterials modified electrodes have been prepared for the
analysis of bioanalytes. The preparation of this modified electrode is often realized via
in situ electropolymerization from monomer solution. They act as promoters of
electrochemical communications, accelerating the electron transfer rate between an
analyte and electrodes. In this part of work, core-shell magnetic nanoparticles were
synthesized by combining the advantages of superparamagnetism of CuFe2O4 and
ZnFe2O4 with highly conductive PPy. CuFe2O4/PPy core-shell nanoparticles and
ZnFe2O4/PPy core-shell nanoparticles have been prepared to develop a novel
amperometric sensor for glucose determination.
3.3.1 CuFe2O4/PPy core-shell nanoparticles
CuFe2O4 nanoparticles (0.1 g, 0.43 mmol) were dispersed in deionized (200 ml)
water ultrasonically. Then pyrrole monomer (1.0 ml, 14 mmol) was injected into the
mixture. After stirring for 30 min, (NH4)2S2O8 (1.0 ml, 28 mmol, 0.01 mM) aqueous
solution (for oxidation of pyrrole) was dropped slowly into the mixture. The
polymerization was performed under 80 °C for 8 hours with constant mechanical
stirring. After several times washing with distilled water and ethanol, the core-shell
composite was dried at 50 °C for 6 hours in the air. The influence of pyrrole has also
been studied by deposited different amount of pyrrole (1.0, 2.0 and 4.0 ml) onto the
composite. The sample was denoted as CuFe2O4/PPy nanoparticles.
47
3.3.2 ZnFe2O4/PPy core-shell nanoparticles
After weighing ZnFe2O4 nanoparticles (0.1 grams, 0.41 mmol) and dispersed in
deionized water (200 ml) ultrasonically, pyrrole monomer (1.0 ml, 14 mmol) was
injected into this mixture. To complete the polymerization, (NH4)2S2O8 (1.0 ml, 28
mmol, 0.01 mM) aqueous solution was added into the mixture. The obtained core-shell
nanoparticles were washed several times with distilled water followed by ethanol and
then was dried at 50 °C for 6 hours in the air. To evaluate the influences of pyrrole
thickness on the sensor performance, different amount of pyrrole (1.0, 2.0 and 4.0 ml)
was used to synthesize different composites. The sample was denoted as ZnFe2O4/PPy
core-shell nanoparticles.
3.4 Preparation of graphene–magnetic nanocomposites
In this work a simple strategy is demonstrated to synthesize MFe2O4-graphene
nanocomposites (M= Zn and Fe) with different graphene content (10 wt% - 40 wt%) via
a one-step hydrothermal method. In the as-obtained composites, the excellent magnetic
properties of CuFe2O4 and ZnFe2O4 were maintained in the composite and could be
separated easily by an external magnetic field.
3.4.1 Graphene oxide (GO)
Graphene oxide (GO) was synthesized from graphite according to the modified
Hummer method (Barroso-Bujans et al., 2010; Gao et al., 2012). In brief, graphite
flakes (5.0 g, 420 mmol) and NaNO3 (2.5 g, 30 mmol) were mixed together followed by
the addition of concentrated H2SO4 (108 ml, 2.0 mol) and 12 ml H3PO4 (231
mmol). After 10 min stirring in an ice bath, KMnO4 (15.0 g, 950 mmol) was slowly
added. Temperature of the mixture was kept below 5 °C to prevent overheating and
explosion. The mixture was stirred at 35 °C for 12 h and the resulting solution was
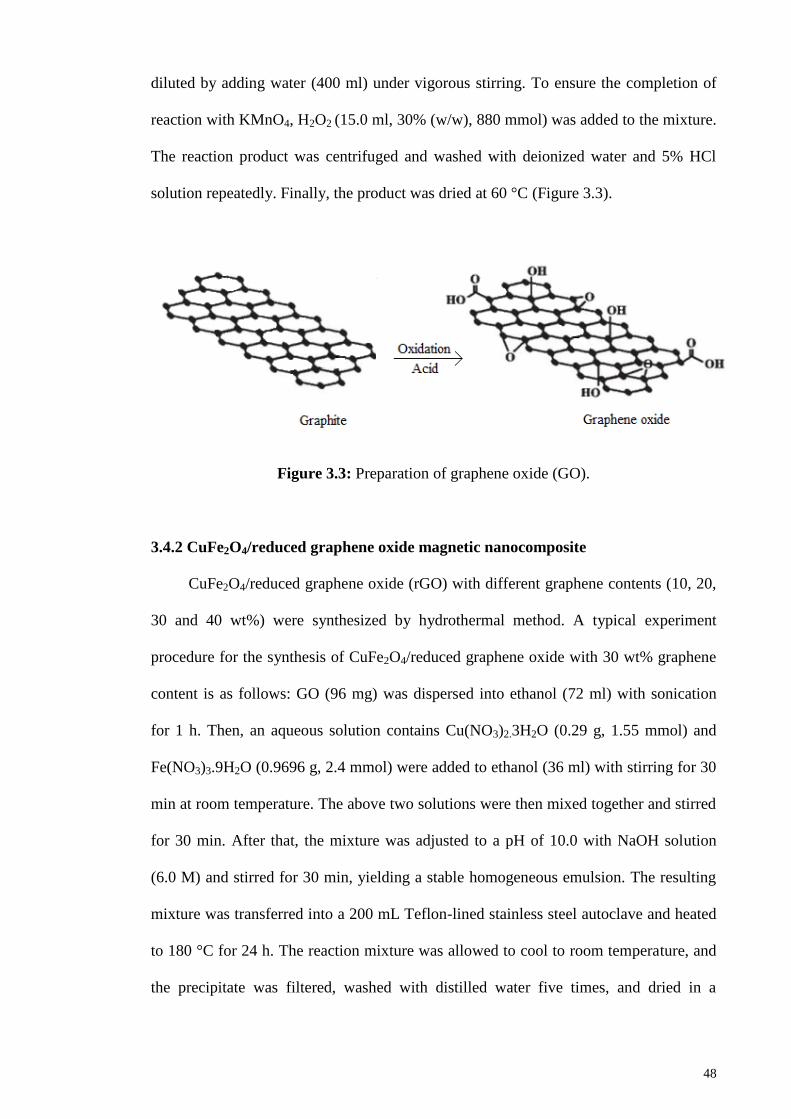
48
diluted by adding water (400 ml) under vigorous stirring. To ensure the completion of
reaction with KMnO4, H2O2 (15.0 ml, 30% (w/w), 880 mmol) was added to the mixture.
The reaction product was centrifuged and washed with deionized water and 5% HCl
solution repeatedly. Finally, the product was dried at 60 °C (Figure 3.3).
Figure 3.3: Preparation of graphene oxide (GO).
3.4.2 CuFe2O4/reduced graphene oxide magnetic nanocomposite
CuFe2O4/reduced graphene oxide (rGO) with different graphene contents (10, 20,
30 and 40 wt%) were synthesized by hydrothermal method. A typical experiment
procedure for the synthesis of CuFe2O4/reduced graphene oxide with 30 wt% graphene
content is as follows: GO (96 mg) was dispersed into ethanol (72 ml) with sonication
for 1 h. Then, an aqueous solution contains Cu(NO3)2.3H2O (0.29 g, 1.55 mmol) and
Fe(NO3)3.9H2O (0.9696 g, 2.4 mmol) were added to ethanol (36 ml) with stirring for 30
min at room temperature. The above two solutions were then mixed together and stirred
for 30 min. After that, the mixture was adjusted to a pH of 10.0 with NaOH solution
(6.0 M) and stirred for 30 min, yielding a stable homogeneous emulsion. The resulting
mixture was transferred into a 200 mL Teflon-lined stainless steel autoclave and heated
to 180 °C for 24 h. The reaction mixture was allowed to cool to room temperature, and
the precipitate was filtered, washed with distilled water five times, and dried in a
49
vacuum oven at 60 °C for 12 h. The product was labelled as CuFe2O4/rGO (30 wt%).
CuFe2O4 nanoparticles were synthesized by the same method without adding in rGO.
3.4.3 ZnFe2O4/reduced graphene oxide magnetic nanocomposite
The ZnFe2O4-reduced graphene oxide nanocomposite with different graphene
content (10, 20, 30 and 40 wt%) were synthesized and the method for the synthesis of
ZnFe2O4-reduced graphene nanocomposite with 30 wt% graphene oxide content, is as
follows: GO (96 mg) was dispersed into absolute ethanol (72 ml) with sonication for 1
h. Zn(NO3)2.6H2O (0.357 g, 1.2 mmol) was dissolved in water and then was mixed
with a solution of Fe(NO3)3.9H2O (0.9696 g, 2.4 mmol). This mixture was added to
absolute ethanol (24 ml) with stirring for 30 min at room temperature. The above two
systems were then mixed together, and stirred for 30 min, yielding a stable
homogeneous emulsion and then transferred into a 200 ml Teflon-lined stainless
autoclave and heated to 180 °C for 12 h under autogenously pressure. The obtained
precipitate was filtered, washed with distilled water several times and dried in a vacuum
oven at 60 °C for 12 h. The product was labelled as ZnFe2O4/rGO (30 wt%). For
comparison, the same method was used to synthesize ZnFe2O4 nanoparticles without
rGO.
3.5 Preparation of phosphate buffer
0.1 M phosphate buffer solution (PBS) was prepared from 1.0 M monosodium
phosphate (NaH2PO4) and 1.0 M disodium phosphate (Na2HPO4) in deionized water
making a solution of approximately pH 7.4 which is the same level of human blood pH.
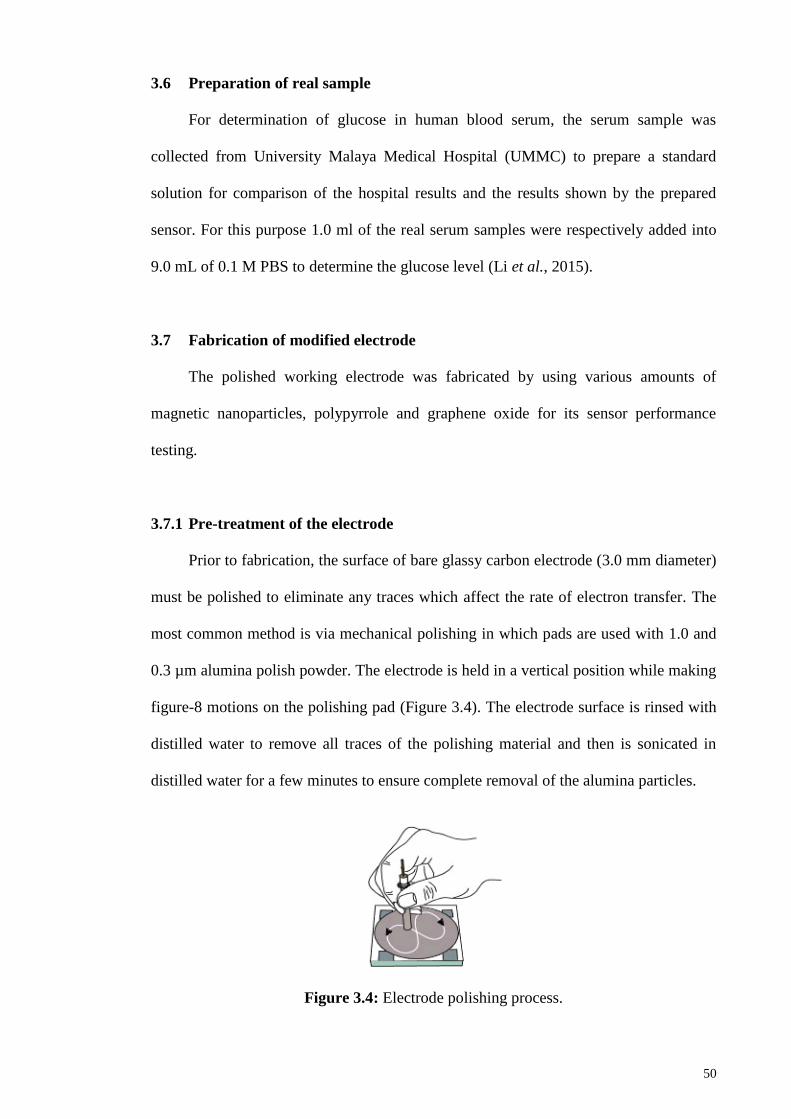
50
3.6 Preparation of real sample
For determination of glucose in human blood serum, the serum sample was
collected from University Malaya Medical Hospital (UMMC) to prepare a standard
solution for comparison of the hospital results and the results shown by the prepared
sensor. For this purpose 1.0 ml of the real serum samples were respectively added into
9.0 mL of 0.1 M PBS to determine the glucose level (Li et al., 2015).
3.7 Fabrication of modified electrode
The polished working electrode was fabricated by using various amounts of
magnetic nanoparticles, polypyrrole and graphene oxide for its sensor performance
testing.
3.7.1 Pre-treatment of the electrode
Prior to fabrication, the surface of bare glassy carbon electrode (3.0 mm diameter)
must be polished to eliminate any traces which affect the rate of electron transfer. The
most common method is via mechanical polishing in which pads are used with 1.0 and
0.3 µm alumina polish powder. The electrode is held in a vertical position while making
figure-8 motions on the polishing pad (Figure 3.4). The electrode surface is rinsed with
distilled water to remove all traces of the polishing material and then is sonicated in
distilled water for a few minutes to ensure complete removal of the alumina particles.
Figure 3.4: Electrode polishing process.
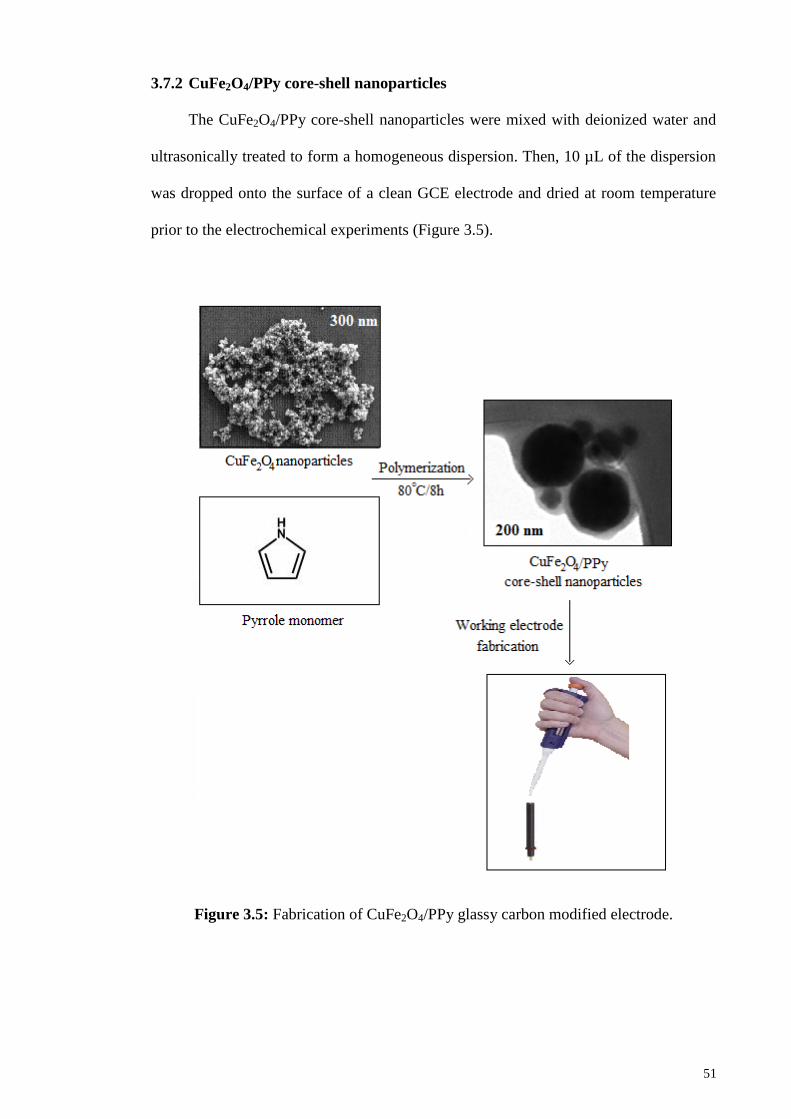
51
3.7.2 CuFe2O4/PPy core-shell nanoparticles
The CuFe2O4/PPy core-shell nanoparticles were mixed with deionized water and
ultrasonically treated to form a homogeneous dispersion. Then, 10 µL of the dispersion
was dropped onto the surface of a clean GCE electrode and dried at room temperature
prior to the electrochemical experiments (Figure 3.5).
Figure 3.5: Fabrication of CuFe2O4/PPy glassy carbon modified electrode.
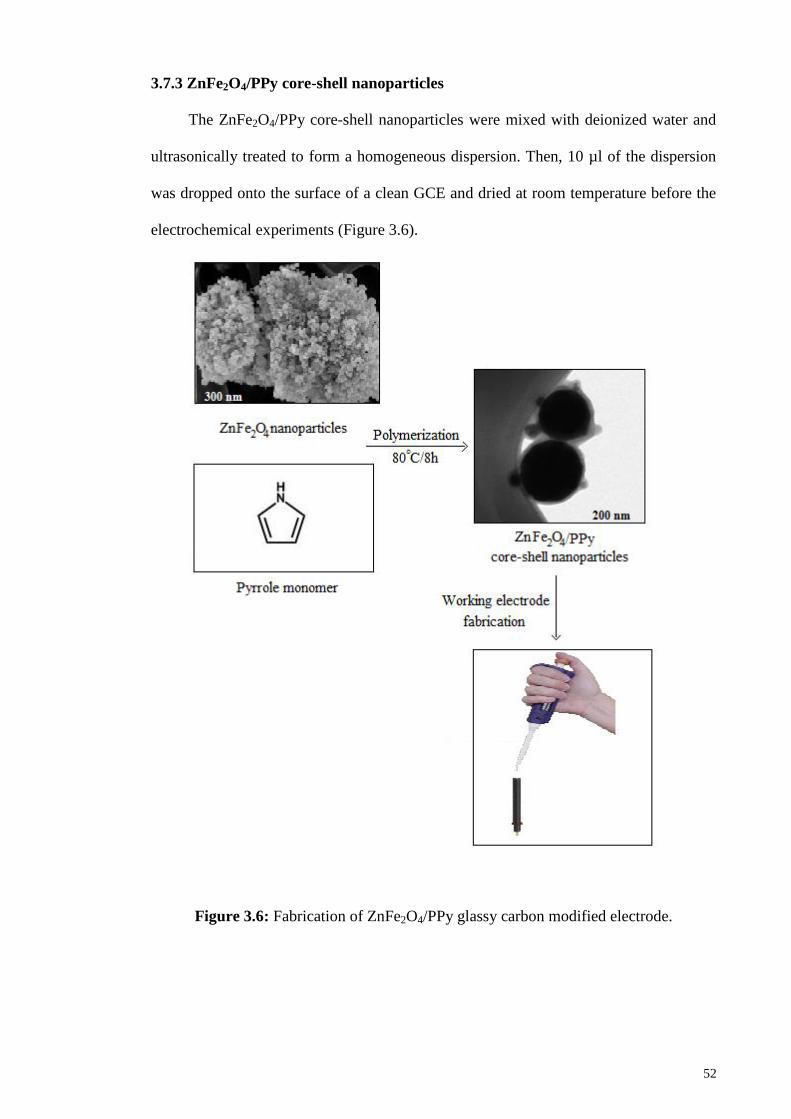
52
3.7.3 ZnFe2O4/PPy core-shell nanoparticles
The ZnFe2O4/PPy core-shell nanoparticles were mixed with deionized water and
ultrasonically treated to form a homogeneous dispersion. Then, 10 µl of the dispersion
was dropped onto the surface of a clean GCE and dried at room temperature before the
electrochemical experiments (Figure 3.6).
Figure 3.6: Fabrication of ZnFe2O4/PPy glassy carbon modified electrode.
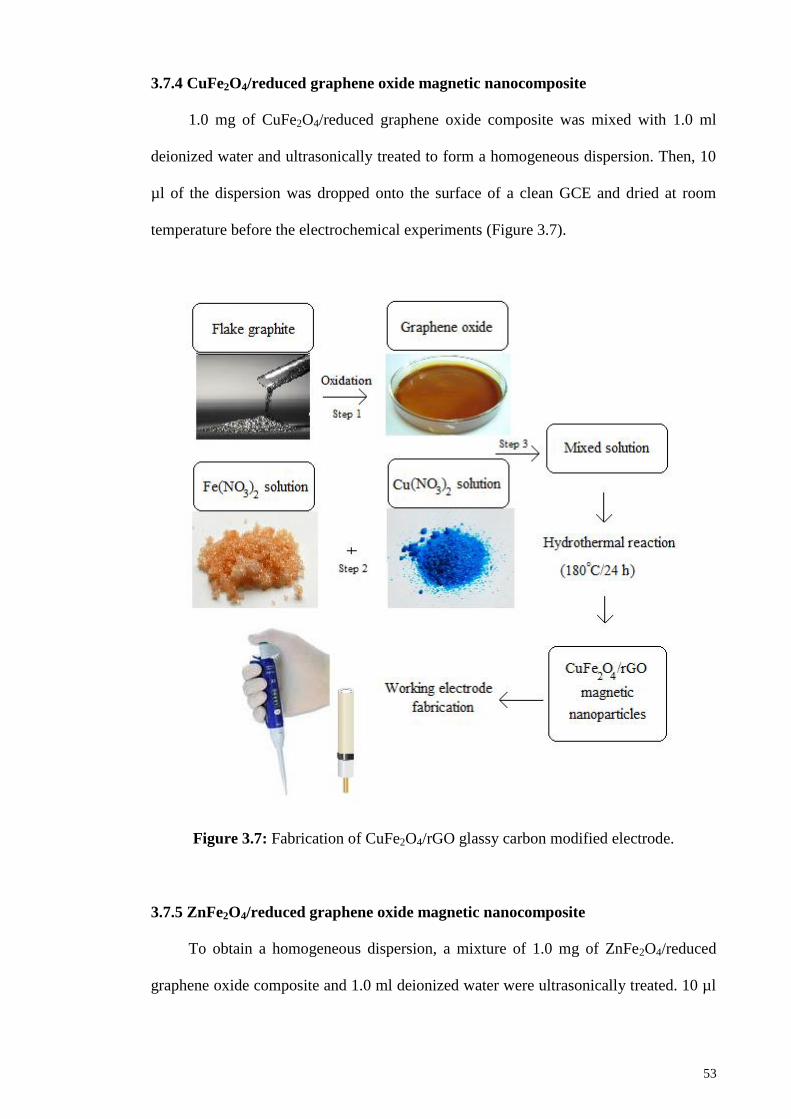
53
3.7.4 CuFe2O4/reduced graphene oxide magnetic nanocomposite
1.0 mg of CuFe2O4/reduced graphene oxide composite was mixed with 1.0 ml
deionized water and ultrasonically treated to form a homogeneous dispersion. Then, 10
µl of the dispersion was dropped onto the surface of a clean GCE and dried at room
temperature before the electrochemical experiments (Figure 3.7).
Figure 3.7: Fabrication of CuFe2O4/rGO glassy carbon modified electrode.
3.7.5 ZnFe2O4/reduced graphene oxide magnetic nanocomposite
To obtain a homogeneous dispersion, a mixture of 1.0 mg of ZnFe2O4/reduced
graphene oxide composite and 1.0 ml deionized water were ultrasonically treated. 10 µl
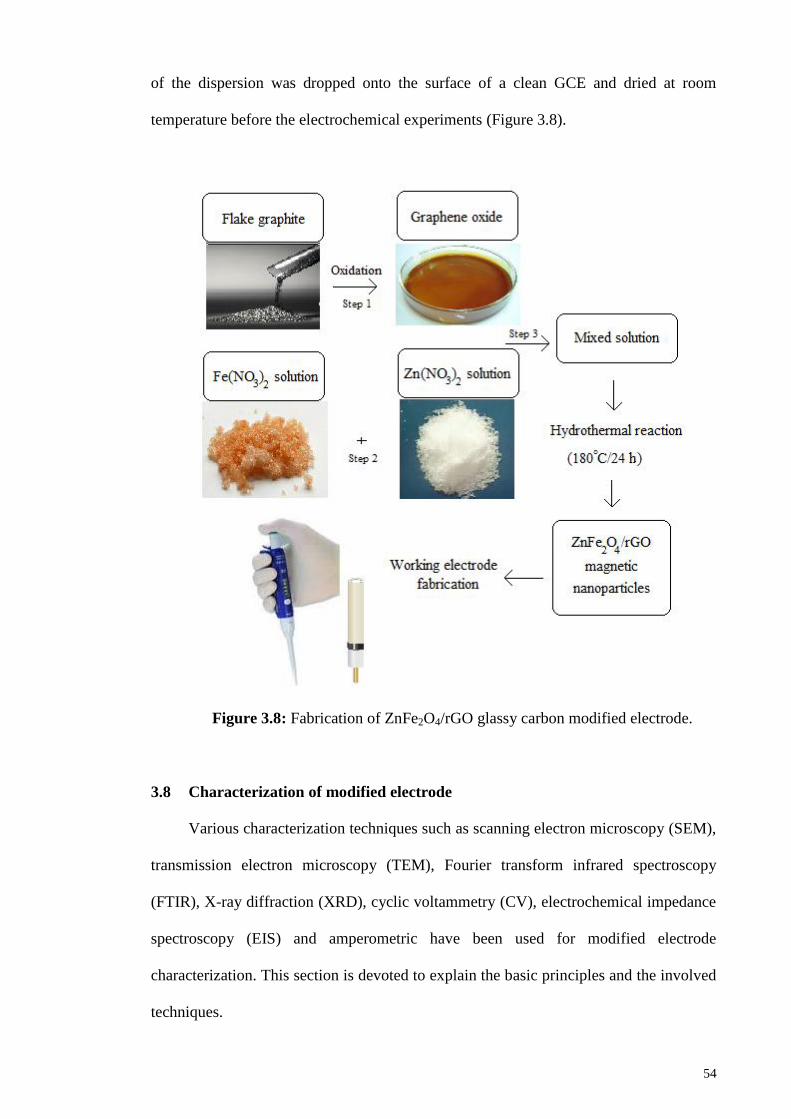
54
of the dispersion was dropped onto the surface of a clean GCE and dried at room
temperature before the electrochemical experiments (Figure 3.8).
Figure 3.8: Fabrication of ZnFe2O4/rGO glassy carbon modified electrode.
3.8 Characterization of modified electrode
Various characterization techniques such as scanning electron microscopy (SEM),
transmission electron microscopy (TEM), Fourier transform infrared spectroscopy
(FTIR), X-ray diffraction (XRD), cyclic voltammetry (CV), electrochemical impedance
spectroscopy (EIS) and amperometric have been used for modified electrode
characterization. This section is devoted to explain the basic principles and the involved
techniques.
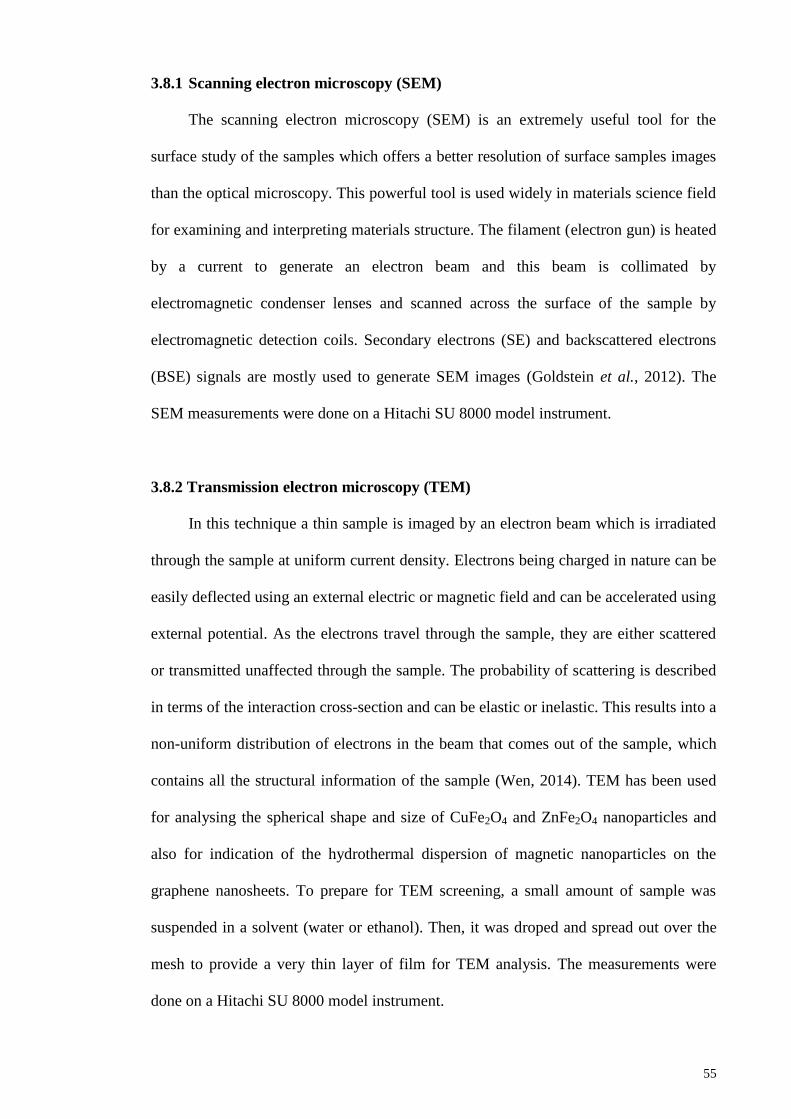
55
3.8.1 Scanning electron microscopy (SEM)
The scanning electron microscopy (SEM) is an extremely useful tool for the
surface study of the samples which offers a better resolution of surface samples images
than the optical microscopy. This powerful tool is used widely in materials science field
for examining and interpreting materials structure. The filament (electron gun) is heated
by a current to generate an electron beam and this beam is collimated by
electromagnetic condenser lenses and scanned across the surface of the sample by
electromagnetic detection coils. Secondary electrons (SE) and backscattered electrons
(BSE) signals are mostly used to generate SEM images (Goldstein et al., 2012). The
SEM measurements were done on a Hitachi SU 8000 model instrument.
3.8.2 Transmission electron microscopy (TEM)
In this technique a thin sample is imaged by an electron beam which is irradiated
through the sample at uniform current density. Electrons being charged in nature can be
easily deflected using an external electric or magnetic field and can be accelerated using
external potential. As the electrons travel through the sample, they are either scattered
or transmitted unaffected through the sample. The probability of scattering is described
in terms of the interaction cross-section and can be elastic or inelastic. This results into a
non-uniform distribution of electrons in the beam that comes out of the sample, which
contains all the structural information of the sample (Wen, 2014). TEM has been used
for analysing the spherical shape and size of CuFe2O4 and ZnFe2O4 nanoparticles and
also for indication of the hydrothermal dispersion of magnetic nanoparticles on the
graphene nanosheets. To prepare for TEM screening, a small amount of sample was
suspended in a solvent (water or ethanol). Then, it was droped and spread out over the
mesh to provide a very thin layer of film for TEM analysis. The measurements were
done on a Hitachi SU 8000 model instrument.
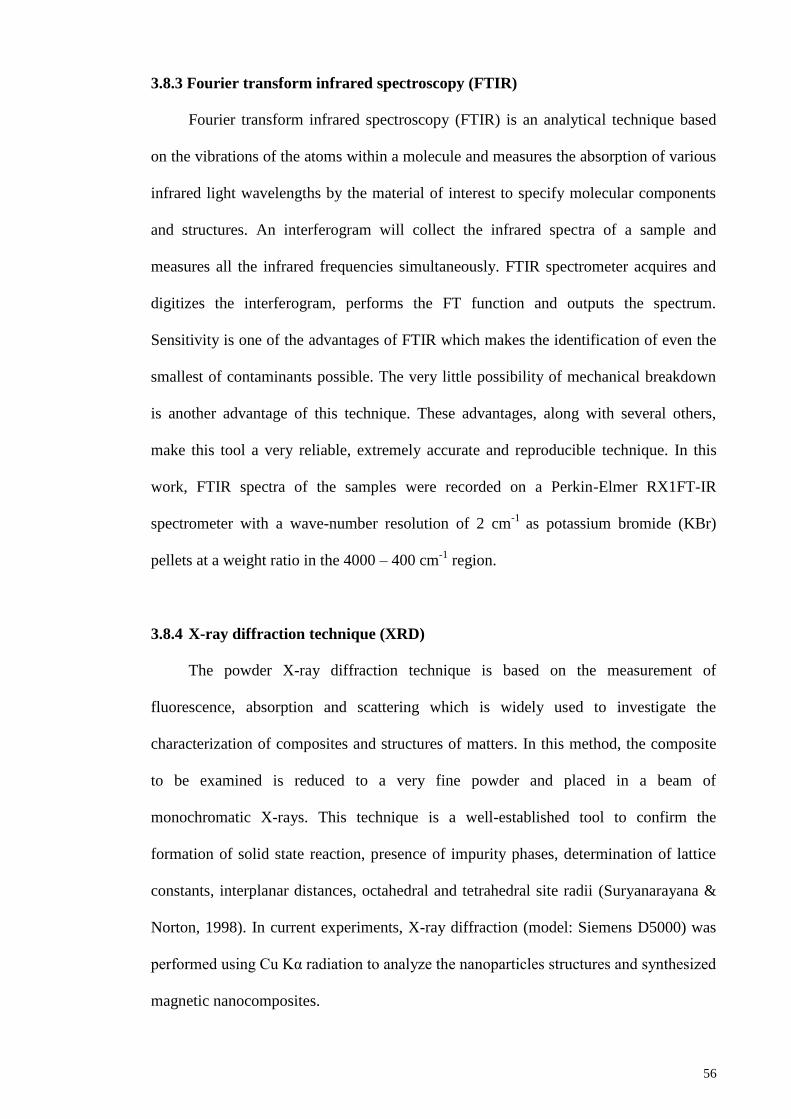
56
3.8.3 Fourier transform infrared spectroscopy (FTIR)
Fourier transform infrared spectroscopy (FTIR) is an analytical technique based
on the vibrations of the atoms within a molecule and measures the absorption of various
infrared light wavelengths by the material of interest to specify molecular components
and structures. An interferogram will collect the infrared spectra of a sample and
measures all the infrared frequencies simultaneously. FTIR spectrometer acquires and
digitizes the interferogram, performs the FT function and outputs the spectrum.
Sensitivity is one of the advantages of FTIR which makes the identification of even the
smallest of contaminants possible. The very little possibility of mechanical breakdown
is another advantage of this technique. These advantages, along with several others,
make this tool a very reliable, extremely accurate and reproducible technique. In this
work, FTIR spectra of the samples were recorded on a Perkin-Elmer RX1FT-IR
spectrometer with a wave-number resolution of 2 cm-1
as potassium bromide (KBr)
pellets at a weight ratio in the 4000 – 400 cm-1
region.
3.8.4 X-ray diffraction technique (XRD)
The powder X-ray diffraction technique is based on the measurement of
fluorescence, absorption and scattering which is widely used to investigate the
characterization of composites and structures of matters. In this method, the composite
to be examined is reduced to a very fine powder and placed in a beam of
monochromatic X-rays. This technique is a well-established tool to confirm the
formation of solid state reaction, presence of impurity phases, determination of lattice
constants, interplanar distances, octahedral and tetrahedral site radii (Suryanarayana &
Norton, 1998). In current experiments, X-ray diffraction (model: Siemens D5000) was
performed using Cu Kα radiation to analyze the nanoparticles structures and synthesized
magnetic nanocomposites.
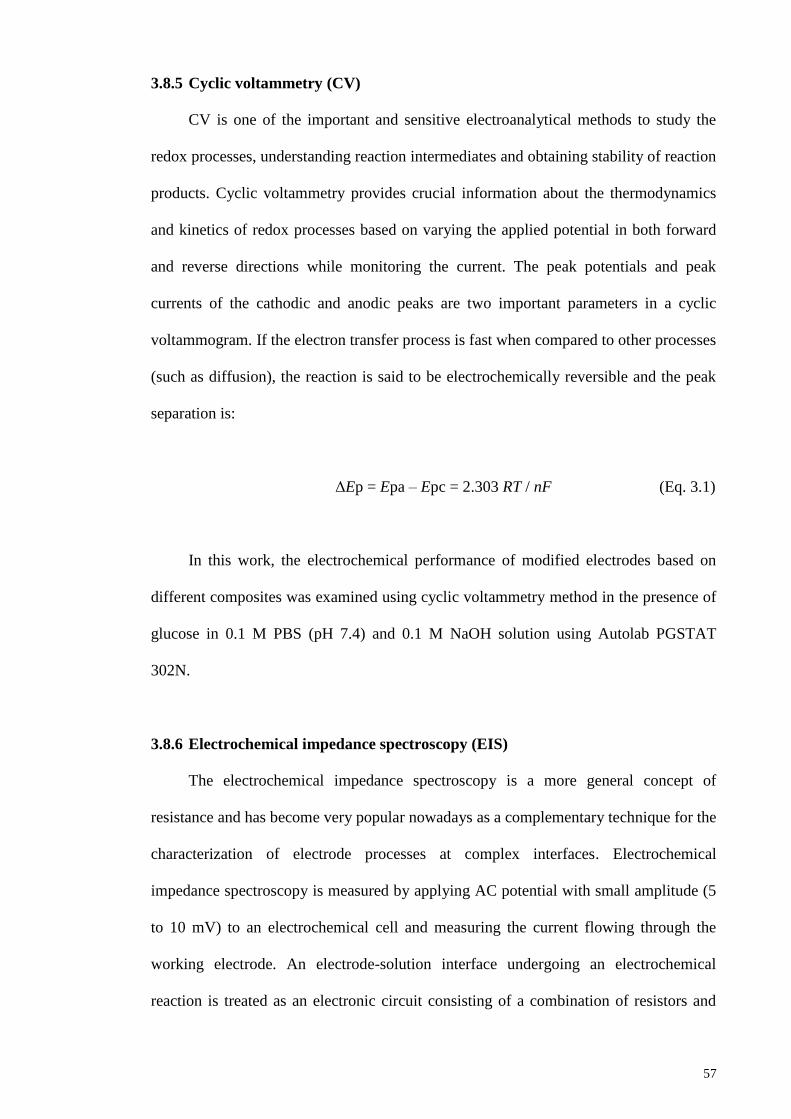
57
3.8.5 Cyclic voltammetry (CV)
CV is one of the important and sensitive electroanalytical methods to study the
redox processes, understanding reaction intermediates and obtaining stability of reaction
products. Cyclic voltammetry provides crucial information about the thermodynamics
and kinetics of redox processes based on varying the applied potential in both forward
and reverse directions while monitoring the current. The peak potentials and peak
currents of the cathodic and anodic peaks are two important parameters in a cyclic
voltammogram. If the electron transfer process is fast when compared to other processes
(such as diffusion), the reaction is said to be electrochemically reversible and the peak
separation is:
ΔEp = Epa – Epc = 2.303 RT / nF (Eq. 3.1)
In this work, the electrochemical performance of modified electrodes based on
different composites was examined using cyclic voltammetry method in the presence of
glucose in 0.1 M PBS (pH 7.4) and 0.1 M NaOH solution using Autolab PGSTAT
302N.
3.8.6 Electrochemical impedance spectroscopy (EIS)
The electrochemical impedance spectroscopy is a more general concept of
resistance and has become very popular nowadays as a complementary technique for the
characterization of electrode processes at complex interfaces. Electrochemical
impedance spectroscopy is measured by applying AC potential with small amplitude (5
to 10 mV) to an electrochemical cell and measuring the current flowing through the
working electrode. An electrode-solution interface undergoing an electrochemical
reaction is treated as an electronic circuit consisting of a combination of resistors and
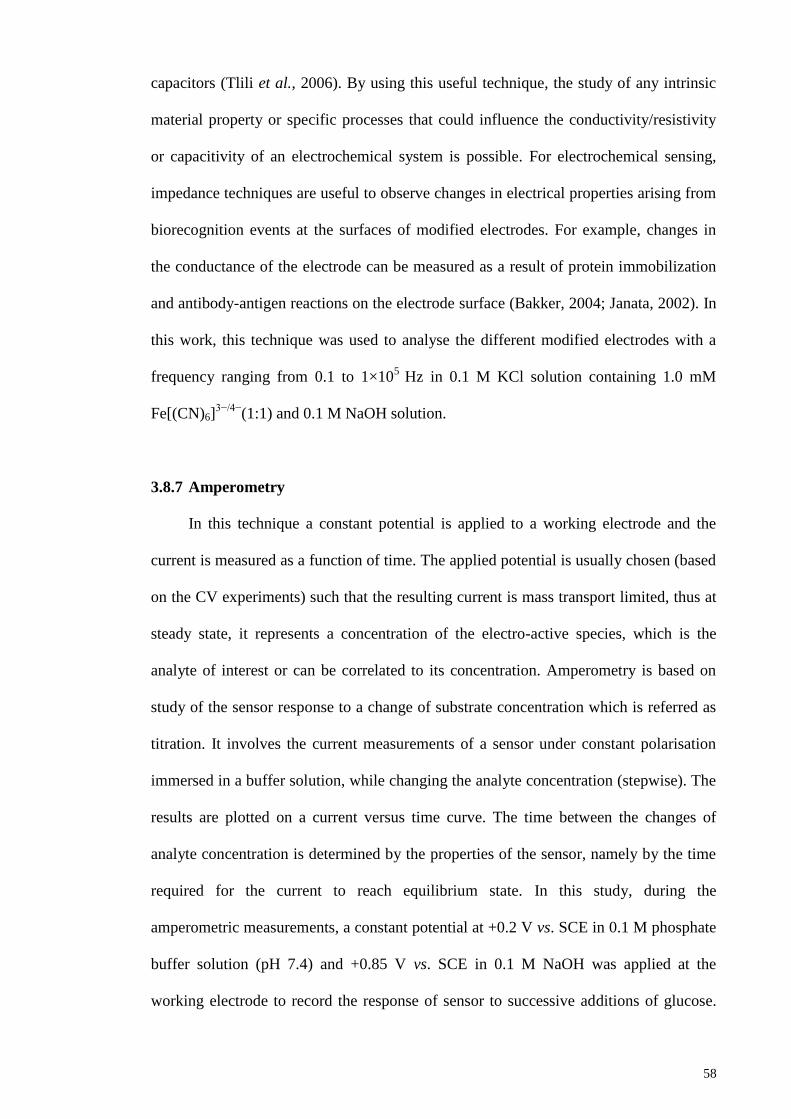
58
capacitors (Tlili et al., 2006). By using this useful technique, the study of any intrinsic
material property or specific processes that could influence the conductivity/resistivity
or capacitivity of an electrochemical system is possible. For electrochemical sensing,
impedance techniques are useful to observe changes in electrical properties arising from
biorecognition events at the surfaces of modified electrodes. For example, changes in
the conductance of the electrode can be measured as a result of protein immobilization
and antibody-antigen reactions on the electrode surface (Bakker, 2004; Janata, 2002). In
this work, this technique was used to analyse the different modified electrodes with a
frequency ranging from 0.1 to 1×10⁵
Hz in 0.1 M KCl solution containing 1.0 mM
Fe[(CN)6]3−/4−
(1:1) and 0.1 M NaOH solution.
3.8.7 Amperometry
In this technique a constant potential is applied to a working electrode and the
current is measured as a function of time. The applied potential is usually chosen (based
on the CV experiments) such that the resulting current is mass transport limited, thus at
steady state, it represents a concentration of the electro-active species, which is the
analyte of interest or can be correlated to its concentration. Amperometry is based on
study of the sensor response to a change of substrate concentration which is referred as
titration. It involves the current measurements of a sensor under constant polarisation
immersed in a buffer solution, while changing the analyte concentration (stepwise). The
results are plotted on a current versus time curve. The time between the changes of
analyte concentration is determined by the properties of the sensor, namely by the time
required for the current to reach equilibrium state. In this study, during the
amperometric measurements, a constant potential at +0.2 V vs. SCE in 0.1 M phosphate
buffer solution (pH 7.4) and +0.85 V vs. SCE in 0.1 M NaOH was applied at the
working electrode to record the response of sensor to successive additions of glucose.

59
Solution was stirred to provide faster convective transport of the analyte to the electrode
surface.
60
CHAPTER 4 : RESULTS AND DISCUSSION
This chapter reports the fabrication of four novel enzyme-free glucose sensors and
associated characterization in order to develop the new electrochemical sensors. There
are four main sections in this chapter begin with fabrication of CuFe2O4/PPy
nanoparticles. The effect of different shell thickness on the performance of sensor is
investigated. ZnFe2O4/PPy core-shell nanoparticles are synthesized for the development
of enzyme-free glucose sensor together with its characterization. Third part of this thesis
focuses on development of sensor based on magnetic nanocomposite of CuFe2O4/rGO.
Lastly, a new approach based on magnetic nanocomposite of ZnFe2O4/rGO which has
been synthesized via hydrothermal method, and applied as the active materials for high-
performance enzyme-free glucose sensor.
Part 1: Core-shell CuFe2O4/PPy nanoparticles enzyme-free sensor for glucose
detection
4.1 Introduction
CuFe2O4 is a spinal ferrite which has two crystallographic spinal structures and
attracted great attention due to its unique optical, electrical and magnetic properties. The
intrinsic existence of functional groups and long carbon chains of PPy will improve the
properties of CuFe2O4 particles due to the strong electronic interaction between the
nanoparticles and the polymer matrices. Here in this study, an enzyme-free sensor for
detection of glucose based on chemical oxidative polymerization of pyrrole monomers
on the surface of CuFe2O4 nanoparticles is demonstrated. The morphology and surface
property of coating phenomenon of CuFe2O4/PPy core-shell nanoparticles were
examined by TEM, SEM and XRD. The electro-catalytic activity of CuFe2O4/PPy
towards glucose oxidation was investigated using cyclic voltammetry and
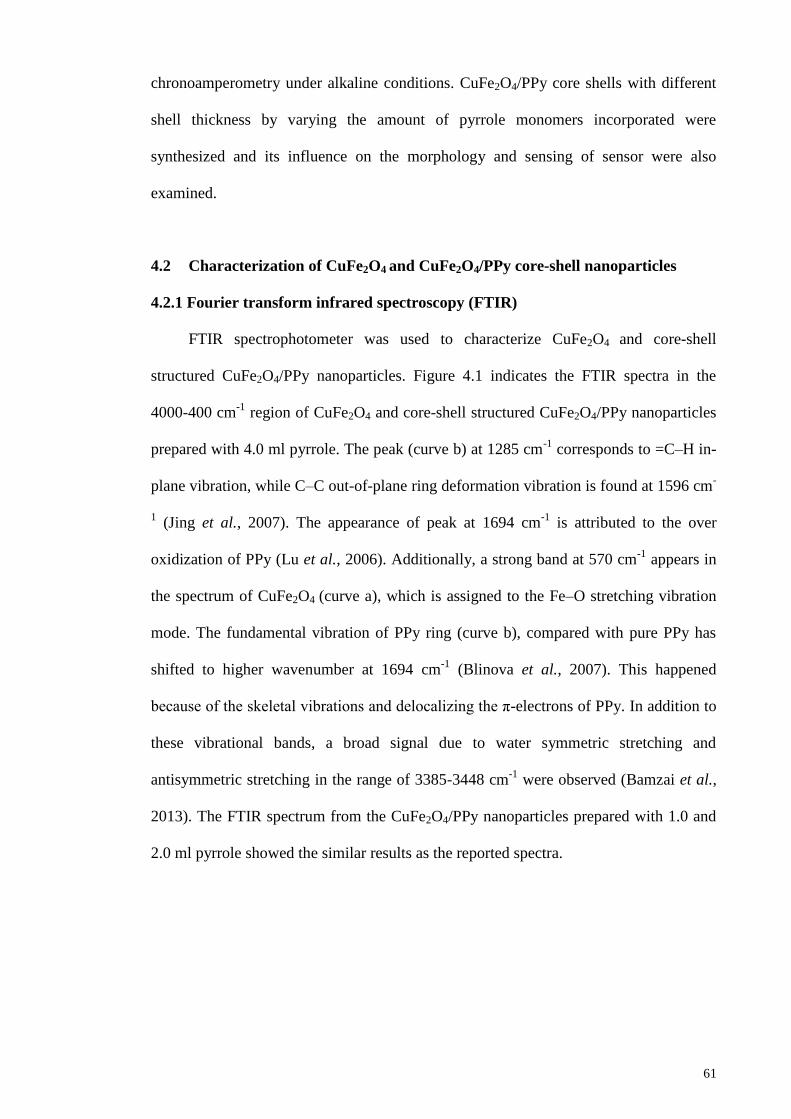
61
chronoamperometry under alkaline conditions. CuFe2O4/PPy core shells with different
shell thickness by varying the amount of pyrrole monomers incorporated were
synthesized and its influence on the morphology and sensing of sensor were also
examined.
4.2 Characterization of CuFe2O4 and CuFe2O4/PPy core-shell nanoparticles
4.2.1 Fourier transform infrared spectroscopy (FTIR)
FTIR spectrophotometer was used to characterize CuFe2O4 and core-shell
structured CuFe2O4/PPy nanoparticles. Figure 4.1 indicates the FTIR spectra in the
4000-400 cm-1
region of CuFe2O4 and core-shell structured CuFe2O4/PPy nanoparticles
prepared with 4.0 ml pyrrole. The peak (curve b) at 1285 cm-1
corresponds to =C–H in-
plane vibration, while C–C out-of-plane ring deformation vibration is found at 1596 cm-
1 (Jing et al., 2007). The appearance of peak at 1694 cm
-1 is attributed to the over
oxidization of PPy (Lu et al., 2006). Additionally, a strong band at 570 cm-1
appears in
the spectrum of CuFe2O4 (curve a), which is assigned to the Fe–O stretching vibration
mode. The fundamental vibration of PPy ring (curve b), compared with pure PPy has
shifted to higher wavenumber at 1694 cm-1
(Blinova et al., 2007). This happened
because of the skeletal vibrations and delocalizing the π-electrons of PPy. In addition to
these vibrational bands, a broad signal due to water symmetric stretching and
antisymmetric stretching in the range of 3385-3448 cm-1
were observed (Bamzai et al.,
2013). The FTIR spectrum from the CuFe2O4/PPy nanoparticles prepared with 1.0 and
2.0 ml pyrrole showed the similar results as the reported spectra.
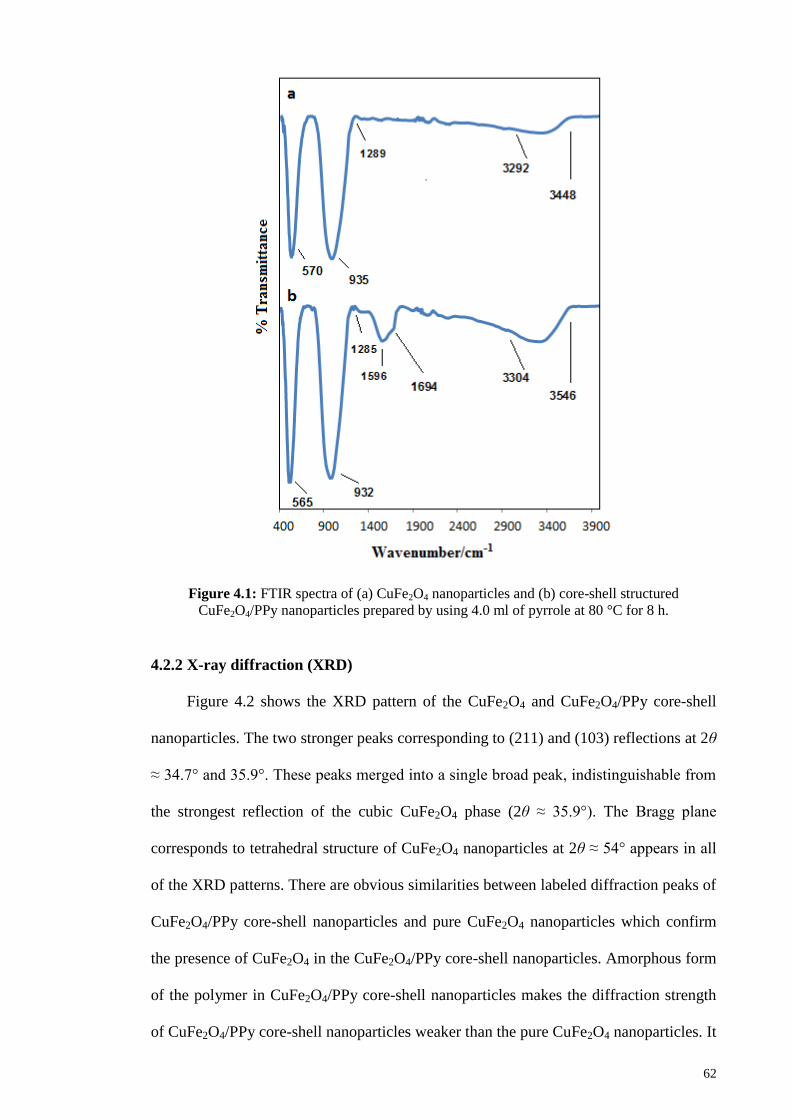
62
Figure 4.1: FTIR spectra of (a) CuFe2O4 nanoparticles and (b) core-shell structured
CuFe2O4/PPy nanoparticles prepared by using 4.0 ml of pyrrole at 80 °C for 8 h.
4.2.2 X-ray diffraction (XRD)
Figure 4.2 shows the XRD pattern of the CuFe2O4 and CuFe2O4/PPy core-shell
nanoparticles. The two stronger peaks corresponding to (211) and (103) reflections at 2θ
≈ 34.7° and 35.9°. These peaks merged into a single broad peak, indistinguishable from
the strongest reflection of the cubic CuFe2O4 phase (2θ ≈ 35.9°). The Bragg plane
corresponds to tetrahedral structure of CuFe2O4 nanoparticles at 2θ ≈ 54° appears in all
of the XRD patterns. There are obvious similarities between labeled diffraction peaks of
CuFe2O4/PPy core-shell nanoparticles and pure CuFe2O4 nanoparticles which confirm
the presence of CuFe2O4 in the CuFe2O4/PPy core-shell nanoparticles. Amorphous form
of the polymer in CuFe2O4/PPy core-shell nanoparticles makes the diffraction strength
of CuFe2O4/PPy core-shell nanoparticles weaker than the pure CuFe2O4 nanoparticles. It
63
can conclude that CuFe2O4 nanoparticles only served as the nucleation sites for the
polymerization of pyrrole because there is no chemical interaction between CuFe2O4
and PPy in the composites through the XRD and FTIR analyses. The similar patterns
were observed for core-shell structured CuFe2O4/PPy nanoparticles by using 1.0 ml and
2.0 ml of pyrrole.
Figure 4.2: XRD patterns of (a) CuFe2O4 and (b) core-shell structured CuFe2O4/PPy
nanoparticles by using 4.0 ml of pyrrole.
4.2.3 Surface morphology study
The morphology and shell thickness of CuFe2O4 and the CuFe2O4/PPy core-shell
nanoparticles were characterized by SEM and TEM (Figure 4.3). These images showed
the spherical shape of CuFe2O4 nanoparticles with diameters ranging from 20 to 90 nm.
Agglomeration of some particles can be attributed to magnetic dipole interactions
between particles. The influence of the amount of pyrrole monomers on the morphology
and shell thickness of core-shell nanoparticles was investigated in the experiment.
Coating shell with different thicknesses which were obtained using pyrrole monomers at
80 °C have been examined. From Figure 4.3(c), (d) and (e) it can obviously be observed
that the CuFe2O4 cores are surrounded by polypyrrole shells with the diameter of 10-25
nm. TEM images of CuFe2O4/PPy core-shell nanoparticles obtained by using 1.0, 2.0
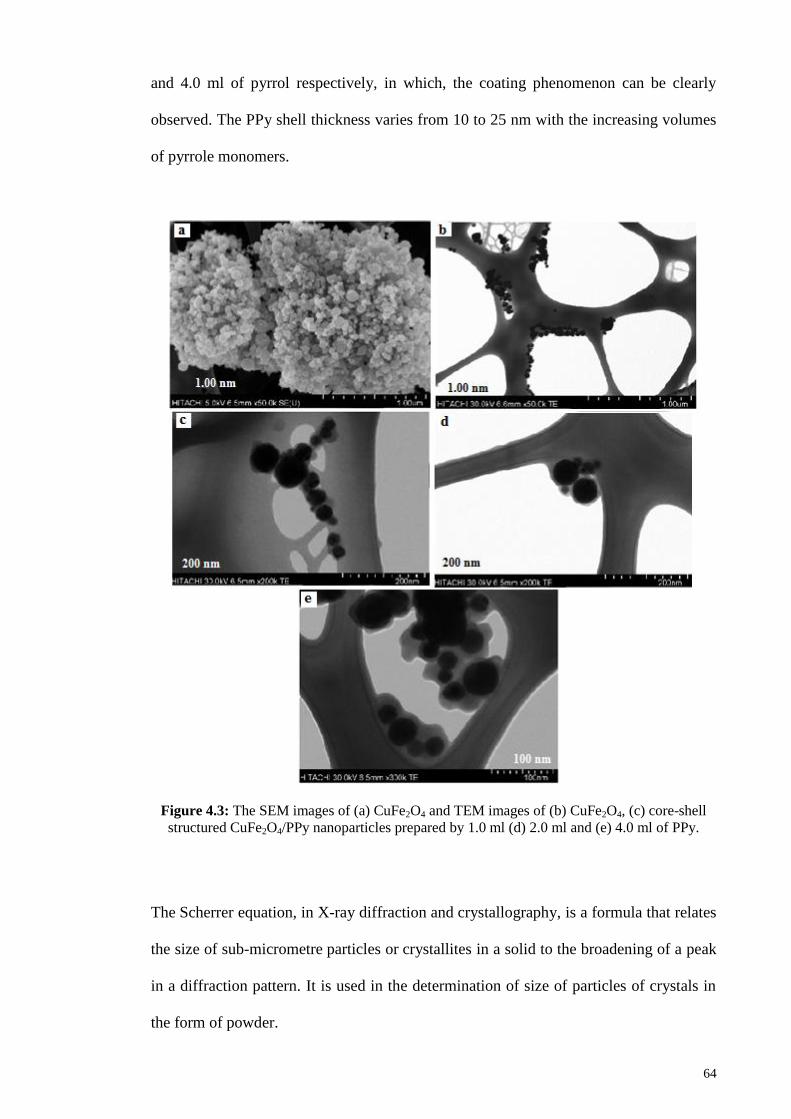
64
and 4.0 ml of pyrrol respectively, in which, the coating phenomenon can be clearly
observed. The PPy shell thickness varies from 10 to 25 nm with the increasing volumes
of pyrrole monomers.
Figure 4.3: The SEM images of (a) CuFe2O4 and TEM images of (b) CuFe2O4, (c) core-shell
structured CuFe2O4/PPy nanoparticles prepared by 1.0 ml (d) 2.0 ml and (e) 4.0 ml of PPy.
The Scherrer equation, in X-ray diffraction and crystallography, is a formula that relates
the size of sub-micrometre particles or crystallites in a solid to the broadening of a peak
in a diffraction pattern. It is used in the determination of size of particles of crystals in
the form of powder.
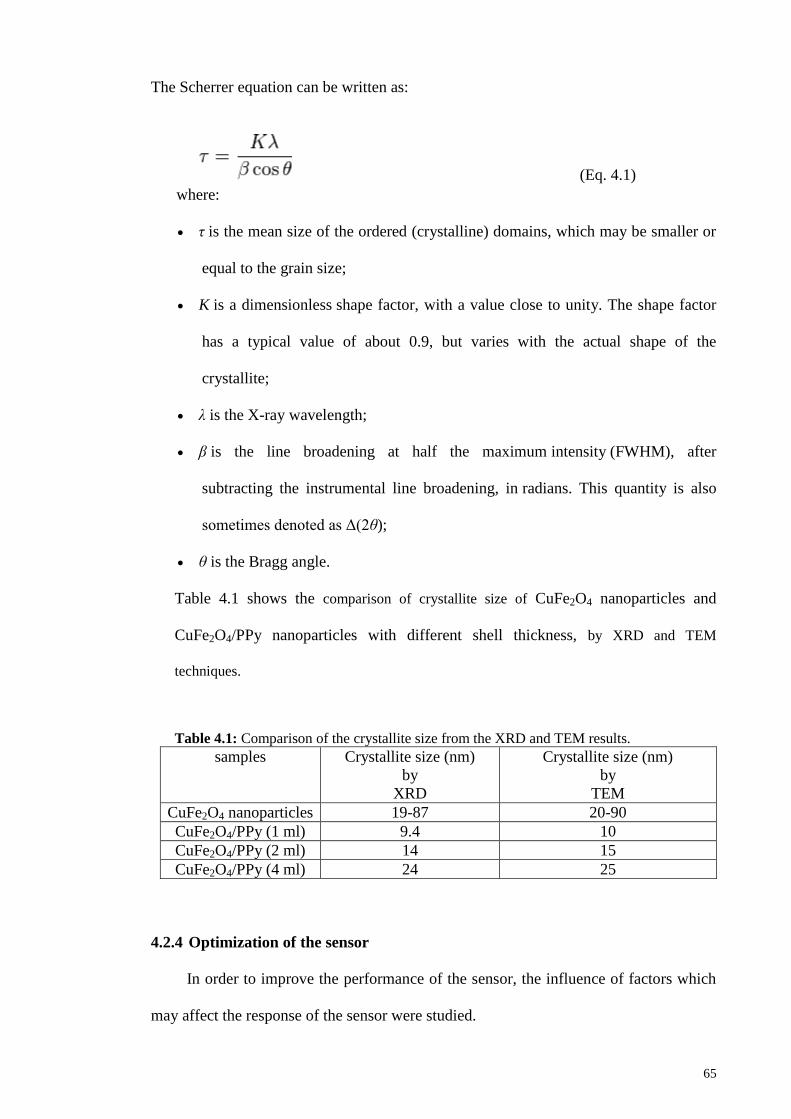
65
The Scherrer equation can be written as:
(Eq. 4.1)
where:
τ is the mean size of the ordered (crystalline) domains, which may be smaller or
equal to the grain size;
K is a dimensionless shape factor, with a value close to unity. The shape factor
has a typical value of about 0.9, but varies with the actual shape of the
crystallite;
λ is the X-ray wavelength;
β is the line broadening at half the maximum intensity (FWHM), after
subtracting the instrumental line broadening, in radians. This quantity is also
sometimes denoted as Δ(2θ);
θ is the Bragg angle.
Table 4.1 shows the comparison of crystallite size of CuFe2O4 nanoparticles and
CuFe2O4/PPy nanoparticles with different shell thickness, by XRD and TEM
techniques.
Table 4.1: Comparison of the crystallite size from the XRD and TEM results.
samples Crystallite size (nm)
by
XRD
Crystallite size (nm)
by
TEM CuFe2O4 nanoparticles 19-87 20-90
CuFe2O4/PPy (1 ml) 9.4 10
CuFe2O4/PPy (2 ml) 14 15
CuFe2O4/PPy (4 ml) 24 25
4.2.4 Optimization of the sensor
In order to improve the performance of the sensor, the influence of factors which
may affect the response of the sensor were studied.
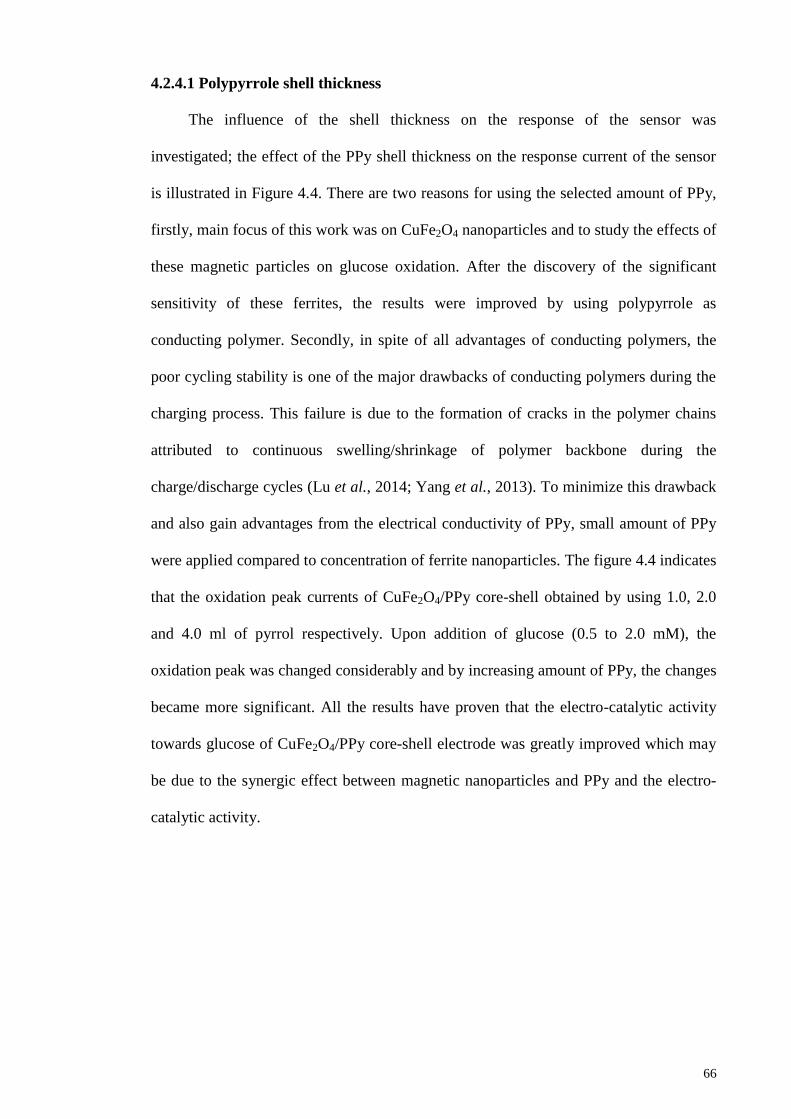
66
4.2.4.1 Polypyrrole shell thickness
The influence of the shell thickness on the response of the sensor was
investigated; the effect of the PPy shell thickness on the response current of the sensor
is illustrated in Figure 4.4. There are two reasons for using the selected amount of PPy,
firstly, main focus of this work was on CuFe2O4 nanoparticles and to study the effects of
these magnetic particles on glucose oxidation. After the discovery of the significant
sensitivity of these ferrites, the results were improved by using polypyrrole as
conducting polymer. Secondly, in spite of all advantages of conducting polymers, the
poor cycling stability is one of the major drawbacks of conducting polymers during the
charging process. This failure is due to the formation of cracks in the polymer chains
attributed to continuous swelling/shrinkage of polymer backbone during the
charge/discharge cycles (Lu et al., 2014; Yang et al., 2013). To minimize this drawback
and also gain advantages from the electrical conductivity of PPy, small amount of PPy
were applied compared to concentration of ferrite nanoparticles. The figure 4.4 indicates
that the oxidation peak currents of CuFe2O4/PPy core-shell obtained by using 1.0, 2.0
and 4.0 ml of pyrrol respectively. Upon addition of glucose (0.5 to 2.0 mM), the
oxidation peak was changed considerably and by increasing amount of PPy, the changes
became more significant. All the results have proven that the electro-catalytic activity
towards glucose of CuFe2O4/PPy core-shell electrode was greatly improved which may
be due to the synergic effect between magnetic nanoparticles and PPy and the electro-
catalytic activity.

67
Figure 4.4: Cyclic voltammogram of CuFe2O4/PPy /GCE by (a) 1.0 ml of PPy (b) 2.0 mM of
PPy (c) 4.0 ml of PPy in (i) 0.5 mM, (ii) 1.0 mM and (iii) 2.0 mM glucose in 0.1 M NaOH at the
scan rate of 10 mV s-1
.
68
4.2.4.2 Optimization of potential for glucose oxidation
The relationship between the applied potential in chronoamperometry and the
oxidation current of glucose was examined. From Figure 4.5, the dependence of the
amperometric response on the applied potential of the CuFe2O4/PPy core-shell coated
GCE under the batch conditions was evaluated over the range of 0.7 V to 1.0 V. The
current response was increased when the applied potential was changed from 0.7 V to
0.85 V vs. SCE, which suggests that the oxidation of glucose was achieved at low
potential. However, when the potential was more positive than 0.85 V, the response
current is decreased slightly. Since a suitable working potential should be chosen based
on the least potential to achieve good selectivity, thus, 0.85 V was selected as the
optimized condition.
Figure 4.5: Effect of the applied potential on the current response of CuFe2O4/PPy/GCE (4.0 ml
of PPy) in the presence of 2.0 mM glucose at the scan rate of 10 mV s-1
in 0.1 M NaOH.
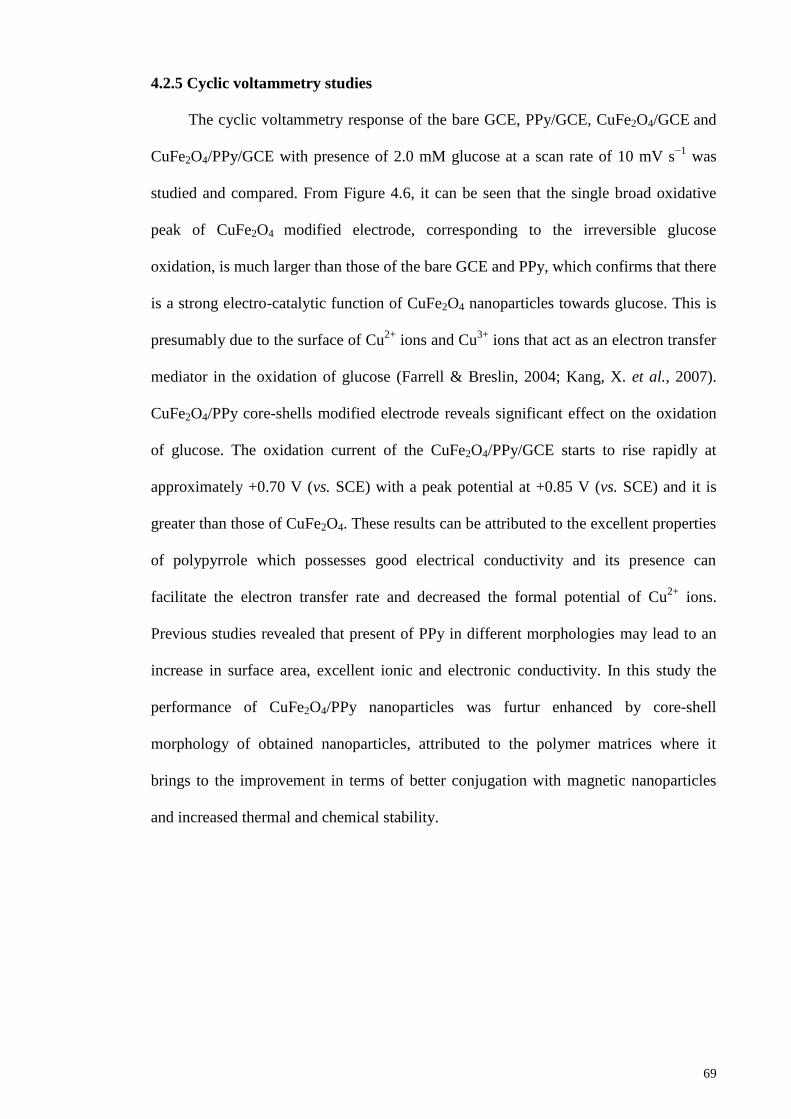
69
4.2.5 Cyclic voltammetry studies
The cyclic voltammetry response of the bare GCE, PPy/GCE, CuFe2O4/GCE and
CuFe2O4/PPy/GCE with presence of 2.0 mM glucose at a scan rate of 10 mV s−1
was
studied and compared. From Figure 4.6, it can be seen that the single broad oxidative
peak of CuFe2O4 modified electrode, corresponding to the irreversible glucose
oxidation, is much larger than those of the bare GCE and PPy, which confirms that there
is a strong electro-catalytic function of CuFe2O4 nanoparticles towards glucose. This is
presumably due to the surface of Cu2+
ions and Cu3+
ions that act as an electron transfer
mediator in the oxidation of glucose (Farrell & Breslin, 2004; Kang, X. et al., 2007).
CuFe2O4/PPy core-shells modified electrode reveals significant effect on the oxidation
of glucose. The oxidation current of the CuFe2O4/PPy/GCE starts to rise rapidly at
approximately +0.70 V (vs. SCE) with a peak potential at +0.85 V (vs. SCE) and it is
greater than those of CuFe2O4. These results can be attributed to the excellent properties
of polypyrrole which possesses good electrical conductivity and its presence can
facilitate the electron transfer rate and decreased the formal potential of Cu2+
ions.
Previous studies revealed that present of PPy in different morphologies may lead to an
increase in surface area, excellent ionic and electronic conductivity. In this study the
performance of CuFe2O4/PPy nanoparticles was furtur enhanced by core-shell
morphology of obtained nanoparticles, attributed to the polymer matrices where it
brings to the improvement in terms of better conjugation with magnetic nanoparticles
and increased thermal and chemical stability.
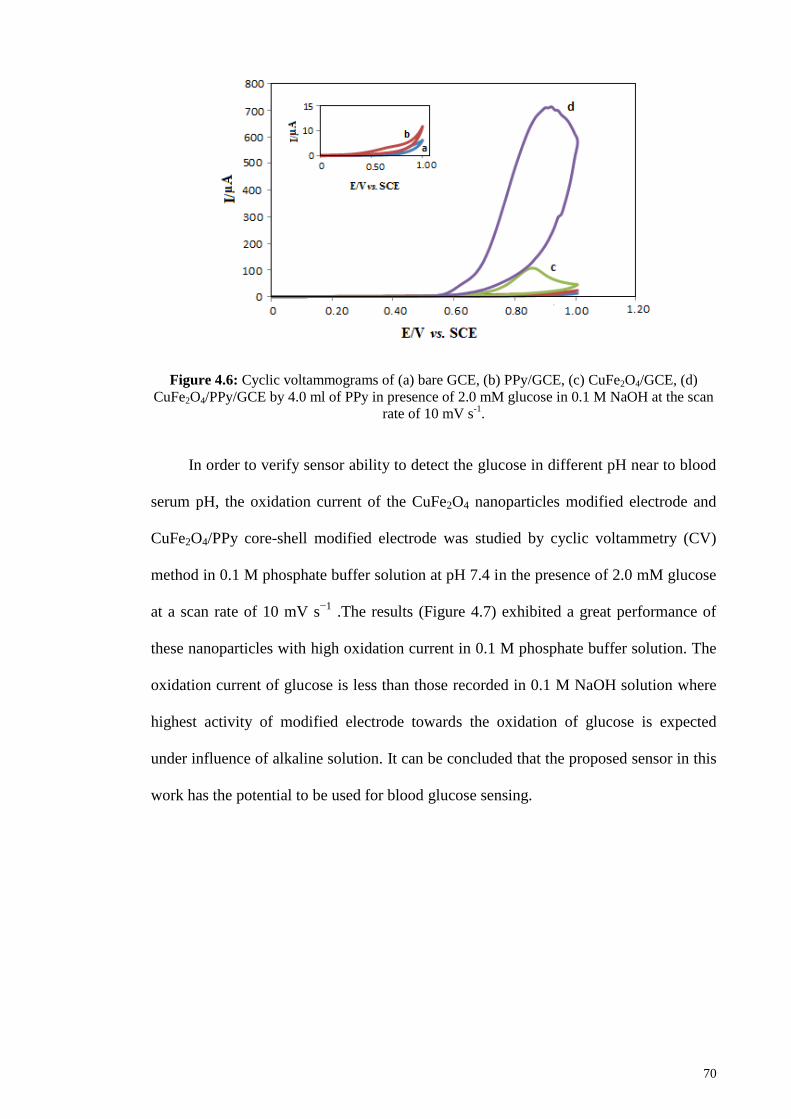
70
Figure 4.6: Cyclic voltammograms of (a) bare GCE, (b) PPy/GCE, (c) CuFe2O4/GCE, (d)
CuFe2O4/PPy/GCE by 4.0 ml of PPy in presence of 2.0 mM glucose in 0.1 M NaOH at the scan
rate of 10 mV s-1
.
In order to verify sensor ability to detect the glucose in different pH near to blood
serum pH, the oxidation current of the CuFe2O4 nanoparticles modified electrode and
CuFe2O4/PPy core-shell modified electrode was studied by cyclic voltammetry (CV)
method in 0.1 M phosphate buffer solution at pH 7.4 in the presence of 2.0 mM glucose
at a scan rate of 10 mV s−1
.The results (Figure 4.7) exhibited a great performance of
these nanoparticles with high oxidation current in 0.1 M phosphate buffer solution. The
oxidation current of glucose is less than those recorded in 0.1 M NaOH solution where
highest activity of modified electrode towards the oxidation of glucose is expected
under influence of alkaline solution. It can be concluded that the proposed sensor in this
work has the potential to be used for blood glucose sensing.
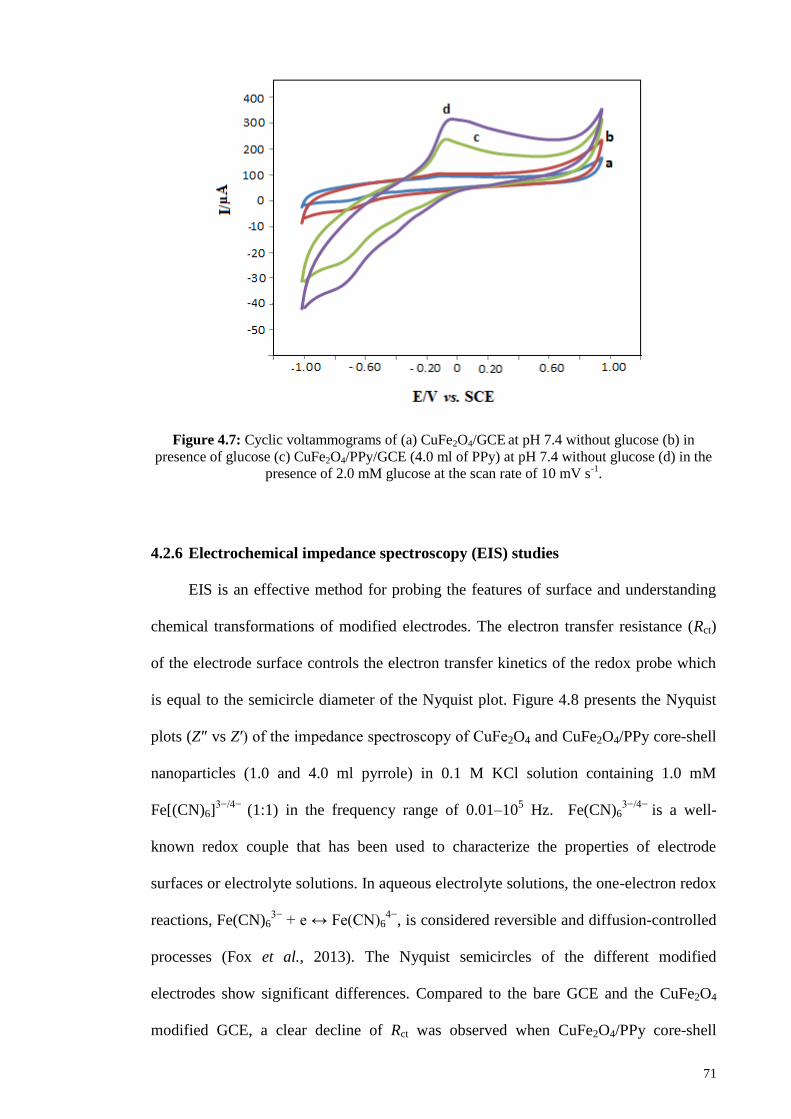
71
Figure 4.7: Cyclic voltammograms of (a) CuFe2O4/GCE at pH 7.4 without glucose (b) in
presence of glucose (c) CuFe2O4/PPy/GCE (4.0 ml of PPy) at pH 7.4 without glucose (d) in the
presence of 2.0 mM glucose at the scan rate of 10 mV s-1
.
4.2.6 Electrochemical impedance spectroscopy (EIS) studies
EIS is an effective method for probing the features of surface and understanding
chemical transformations of modified electrodes. The electron transfer resistance (Rct)
of the electrode surface controls the electron transfer kinetics of the redox probe which
is equal to the semicircle diameter of the Nyquist plot. Figure 4.8 presents the Nyquist
plots (Z″ vs Z′) of the impedance spectroscopy of CuFe2O4 and CuFe2O4/PPy core-shell
nanoparticles (1.0 and 4.0 ml pyrrole) in 0.1 M KCl solution containing 1.0 mM
Fe[(CN)6]3−/4−
(1:1) in the frequency range of 0.01–105 Hz. Fe(CN)6
3−/4− is a well-
known redox couple that has been used to characterize the properties of electrode
surfaces or electrolyte solutions. In aqueous electrolyte solutions, the one-electron redox
reactions, Fe(CN)63−
+ e ↔ Fe(CN)64−
, is considered reversible and diffusion-controlled
processes (Fox et al., 2013). The Nyquist semicircles of the different modified
electrodes show significant differences. Compared to the bare GCE and the CuFe2O4
modified GCE, a clear decline of Rct was observed when CuFe2O4/PPy core-shell
72
nanoparticles was cast on the GCE surface, possibly due to the great conductivity of
PPy. In fact, electron transfer ability of CuFe2O4 nanoparticles was improved by PPy
shells and also the electron transfer resistance has decreased with increasing of PPy
shell thickness. These shells were proven to improve the speed of electron transfer rate.
Figure 4.8: EIS of (a) bare GCE, (b) CuFe2O4/GCE, (c) CuFe2O4/PPy/GCE using 1.0 ml of
PPy, (d) CuFe2O4/PPy/GCE using 4.0 ml of PPy, in 0.1 M KCl solution containing 1.0 mM
Fe[(CN)6]3−/4−
(1:1). The frequency range was from 0.1 to 1×10⁵ Hz; right inset: the
Rs(CPE[RctW]) equivalent circuit model.
4.2.7 Amperometric detection of glucose on CuFe2O4/PPy core-shell nanoparticles
The amperometric response of the CuFe2O4/PPy core-shell modified electrode to
successive additions of glucose into 0.1 M NaOH is depicted in Figure 4.9. A typical
calibration curve for the sensor can be prepared from the amperometric response (left
inset). As the concentration of glucose has been changed, the sensor electrode
responded rapidly and showed a linear steady-state amperometric response up to 5.6
mM of glucose under the applied potential of +0.85 V vs. SCE. A quick increase in the
current after each glucose addition was observed and the amperometric signal displayed
linear correlation to glucose concentration in the range from 20.0 μM to 5.6 mM. The
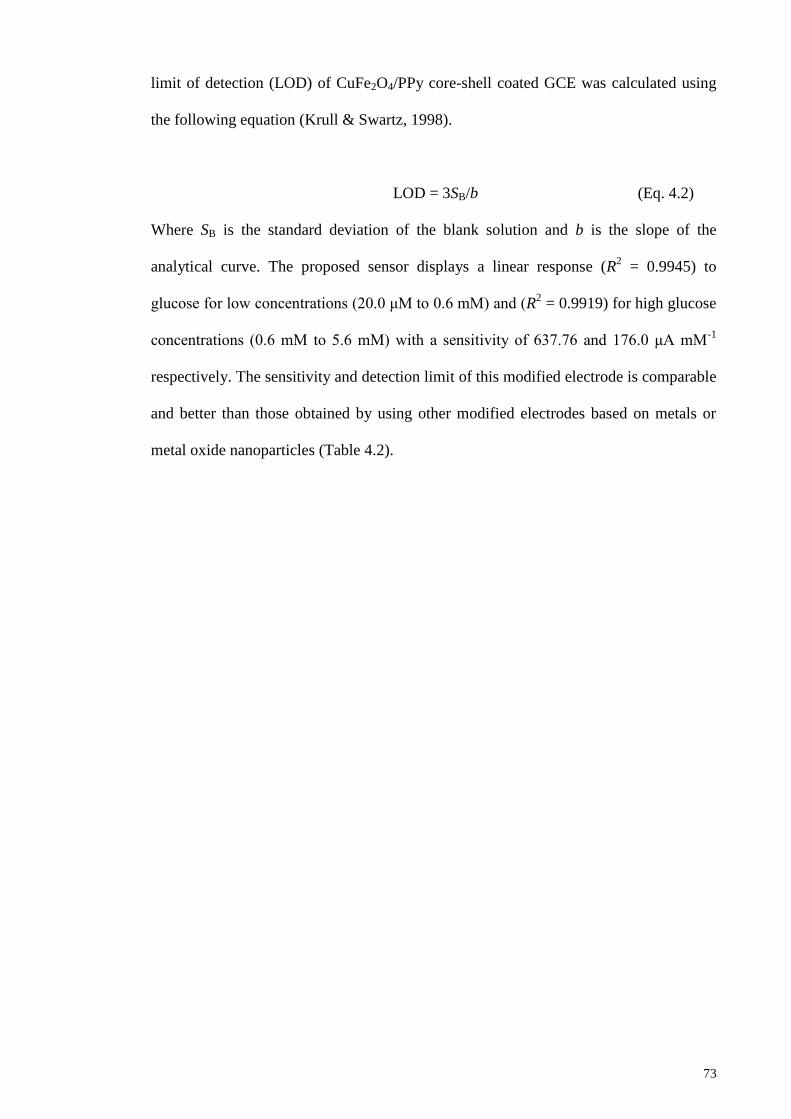
73
limit of detection (LOD) of CuFe2O4/PPy core-shell coated GCE was calculated using
the following equation (Krull & Swartz, 1998).
LOD = 3SB/b (Eq. 4.2)
Where SB is the standard deviation of the blank solution and b is the slope of the
analytical curve. The proposed sensor displays a linear response (R2 = 0.9945) to
glucose for low concentrations (20.0 μM to 0.6 mM) and (R2 = 0.9919) for high glucose
concentrations (0.6 mM to 5.6 mM) with a sensitivity of 637.76 and 176.0 μA mM-1
respectively. The sensitivity and detection limit of this modified electrode is comparable
and better than those obtained by using other modified electrodes based on metals or
metal oxide nanoparticles (Table 4.2).
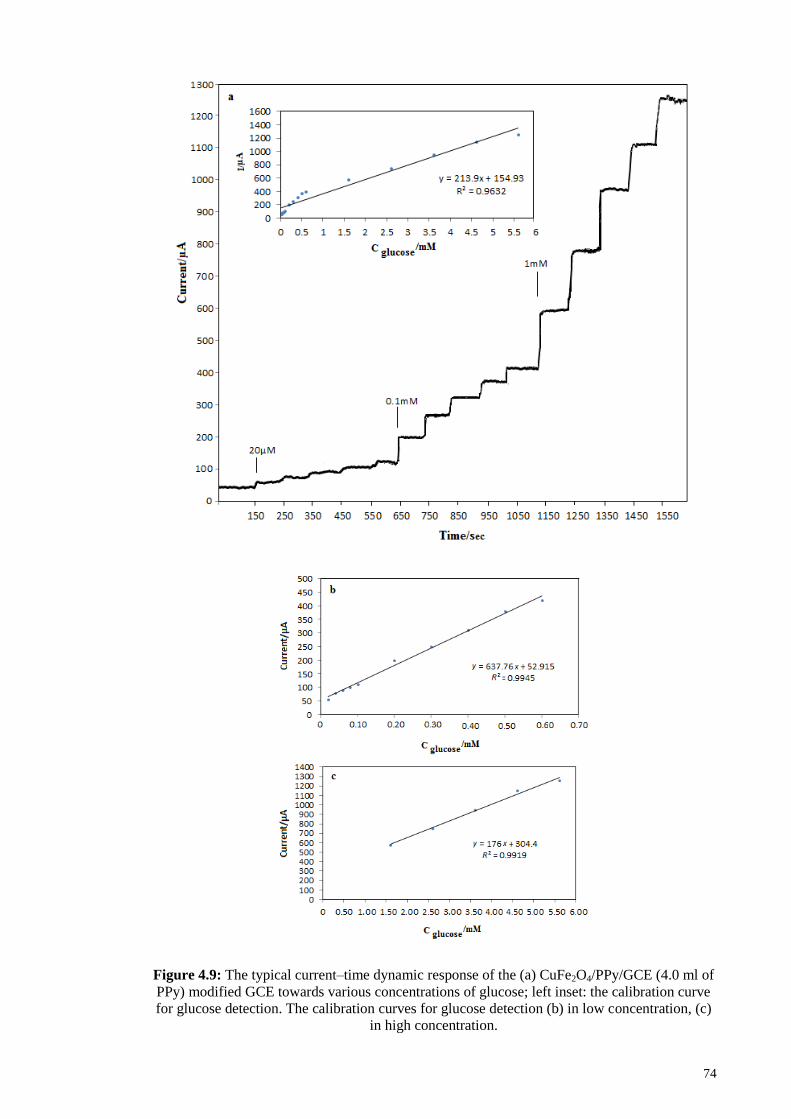
74
Figure 4.9: The typical current–time dynamic response of the (a) CuFe2O4/PPy/GCE (4.0 ml of
PPy) modified GCE towards various concentrations of glucose; left inset: the calibration curve
for glucose detection. The calibration curves for glucose detection (b) in low concentration, (c)
in high concentration.
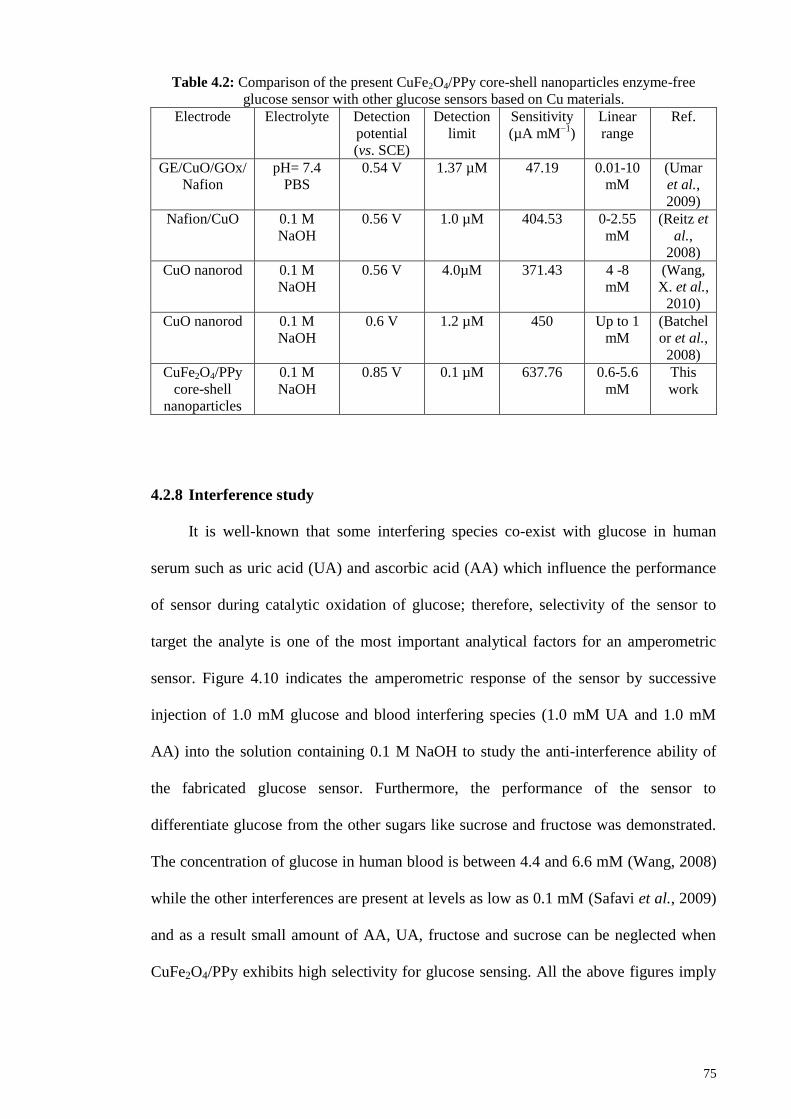
75
Table 4.2: Comparison of the present CuFe2O4/PPy core-shell nanoparticles enzyme-free
glucose sensor with other glucose sensors based on Cu materials.
Electrode Electrolyte
Detection
potential
(vs. SCE)
Detection
limit Sensitivity
(µA mM−1
) Linear
range Ref.
GE/CuO/GOx/
Nafion pH= 7.4
PBS 0.54 V
1.37 µM 47.19 0.01-10
mM (Umar
et al.,
2009)
Nafion/CuO 0.1 M
NaOH 0.56 V
1.0 µM 404.53 0-2.55
mM (Reitz et
al.,
2008)
CuO nanorod 0.1 M
NaOH 0.56 V
4.0µM 371.43 4 -8
mM (Wang,
X. et al.,
2010)
CuO nanorod 0.1 M
NaOH 0.6 V
1.2 µM 450
Up to 1
mM (Batchel
or et al.,
2008)
CuFe2O4/PPy
core-shell
nanoparticles
0.1 M
NaOH
0.85 V
0.1 µM 637.76 0.6-5.6
mM
This
work
4.2.8 Interference study
It is well-known that some interfering species co-exist with glucose in human
serum such as uric acid (UA) and ascorbic acid (AA) which influence the performance
of sensor during catalytic oxidation of glucose; therefore, selectivity of the sensor to
target the analyte is one of the most important analytical factors for an amperometric
sensor. Figure 4.10 indicates the amperometric response of the sensor by successive
injection of 1.0 mM glucose and blood interfering species (1.0 mM UA and 1.0 mM
AA) into the solution containing 0.1 M NaOH to study the anti-interference ability of
the fabricated glucose sensor. Furthermore, the performance of the sensor to
differentiate glucose from the other sugars like sucrose and fructose was demonstrated.
The concentration of glucose in human blood is between 4.4 and 6.6 mM (Wang, 2008)
while the other interferences are present at levels as low as 0.1 mM (Safavi et al., 2009)
and as a result small amount of AA, UA, fructose and sucrose can be neglected when
CuFe2O4/PPy exhibits high selectivity for glucose sensing. All the above figures imply
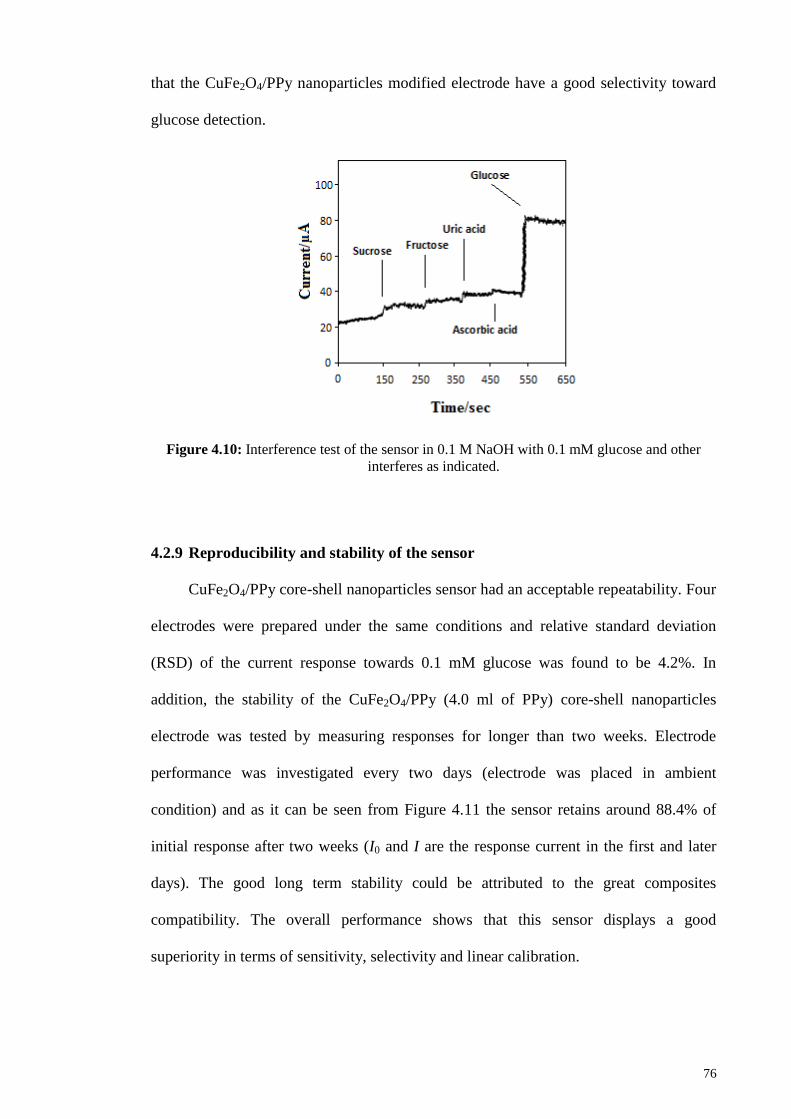
76
that the CuFe2O4/PPy nanoparticles modified electrode have a good selectivity toward
glucose detection.
Figure 4.10: Interference test of the sensor in 0.1 M NaOH with 0.1 mM glucose and other
interferes as indicated.
4.2.9 Reproducibility and stability of the sensor
CuFe2O4/PPy core-shell nanoparticles sensor had an acceptable repeatability. Four
electrodes were prepared under the same conditions and relative standard deviation
(RSD) of the current response towards 0.1 mM glucose was found to be 4.2%. In
addition, the stability of the CuFe2O4/PPy (4.0 ml of PPy) core-shell nanoparticles
electrode was tested by measuring responses for longer than two weeks. Electrode
performance was investigated every two days (electrode was placed in ambient
condition) and as it can be seen from Figure 4.11 the sensor retains around 88.4% of
initial response after two weeks (I0 and I are the response current in the first and later
days). The good long term stability could be attributed to the great composites
compatibility. The overall performance shows that this sensor displays a good
superiority in terms of sensitivity, selectivity and linear calibration.
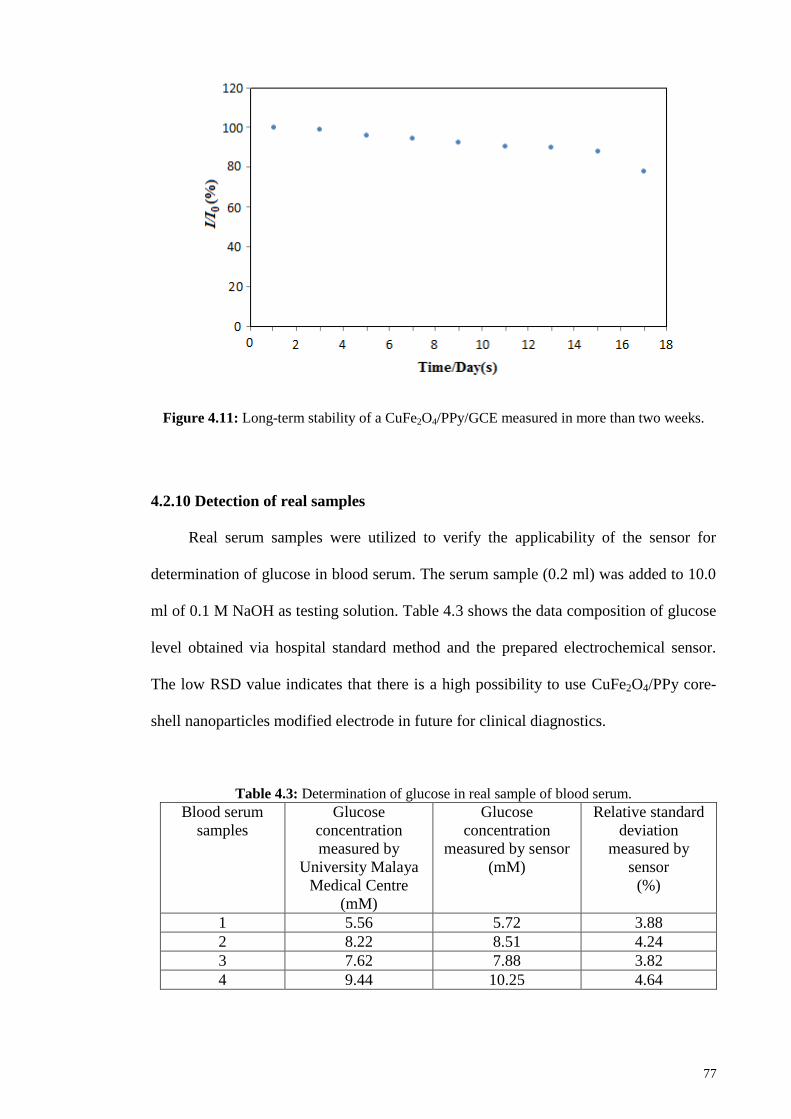
77
Figure 4.11: Long-term stability of a CuFe2O4/PPy/GCE measured in more than two weeks.
4.2.10 Detection of real samples
Real serum samples were utilized to verify the applicability of the sensor for
determination of glucose in blood serum. The serum sample (0.2 ml) was added to 10.0
ml of 0.1 M NaOH as testing solution. Table 4.3 shows the data composition of glucose
level obtained via hospital standard method and the prepared electrochemical sensor.
The low RSD value indicates that there is a high possibility to use CuFe2O4/PPy core-
shell nanoparticles modified electrode in future for clinical diagnostics.
Table 4.3: Determination of glucose in real sample of blood serum.
Blood serum
samples
Glucose
concentration
measured by
University Malaya
Medical Centre
(mM)
Glucose
concentration
measured by sensor
(mM)
Relative standard
deviation
measured by
sensor
(%)
1 5.56 5.72 3.88
2 8.22 8.51 4.24
3 7.62 7.88 3.82
4 9.44 10.25 4.64
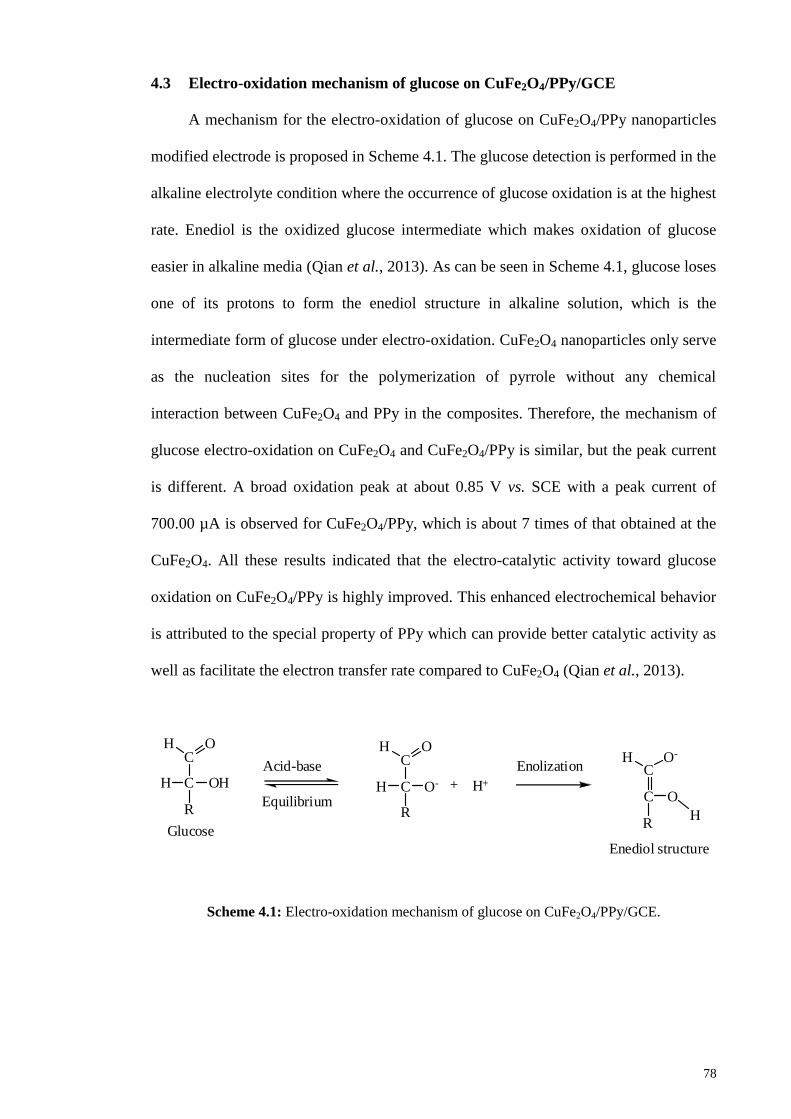
78
4.3 Electro-oxidation mechanism of glucose on CuFe2O4/PPy/GCE
A mechanism for the electro-oxidation of glucose on CuFe2O4/PPy nanoparticles
modified electrode is proposed in Scheme 4.1. The glucose detection is performed in the
alkaline electrolyte condition where the occurrence of glucose oxidation is at the highest
rate. Enediol is the oxidized glucose intermediate which makes oxidation of glucose
easier in alkaline media (Qian et al., 2013). As can be seen in Scheme 4.1, glucose loses
one of its protons to form the enediol structure in alkaline solution, which is the
intermediate form of glucose under electro-oxidation. CuFe2O4 nanoparticles only serve
as the nucleation sites for the polymerization of pyrrole without any chemical
interaction between CuFe2O4 and PPy in the composites. Therefore, the mechanism of
glucose electro-oxidation on CuFe2O4 and CuFe2O4/PPy is similar, but the peak current
is different. A broad oxidation peak at about 0.85 V vs. SCE with a peak current of
700.00 µA is observed for CuFe2O4/PPy, which is about 7 times of that obtained at the
CuFe2O4. All these results indicated that the electro-catalytic activity toward glucose
oxidation on CuFe2O4/PPy is highly improved. This enhanced electrochemical behavior
is attributed to the special property of PPy which can provide better catalytic activity as
well as facilitate the electron transfer rate compared to CuFe2O4 (Qian et al., 2013).
C
C
R
H O
OHH H+
Acid-base
Equilibrium
Enolization
Enediol structure
C
C
R
H O
O-H +C
C
R
H O-
O
HGlucose
Scheme 4.1: Electro-oxidation mechanism of glucose on CuFe2O4/PPy/GCE.
79
4.4 Conclusion
In this work, a novel core-shell CuFe2O4/PPy nanoparticles and its
electrochemical properties for the determination of glucose is presented. The sensor
showed a very high electrochemical active surface area and electro-catalytic activity for
the glucose electro-oxidation, a lower detection limit of 0.1 μM and high sensitivity of
637.76 μA mM-1
cm-2
. All these advantageous features hold the promise for the
development of an accurate enzyme-free glucose sensor.
Part 2: Polypyrrole-ZnFe2O4 nanoparticles with core-shell structure for glucose
sensing
4.5 Introduction
Among the magnetic nanoparticles, zinc ferrite (ZnFe2O4) nanoparticles are
occupying an important place for their unusual properties such as narrow band gaps,
excellent visible-light response, good photochemical stability and favorable magnetism.
Using polypyrrole as shell in polypyrrole-ZnFe2O4 nanoparticles has provided a strict
barrier between nanoparticles and reduced the magnetic-coupling effect between them.
An amperometric enzyme-free glucose sensor using core-shell nanoparticles based on
chemical oxidative polymerization of pyrrole on ZnFe2O4 nanoparticles surface was
investigated in this study. The electrochemical performance of the modified electrodes
was investigated by cyclic voltammetry method. The morphology and surface property
of coating phenomenon of ZnFe2O4/PPy core-shell nanoparticles were examined by
TEM, SEM and XRD.
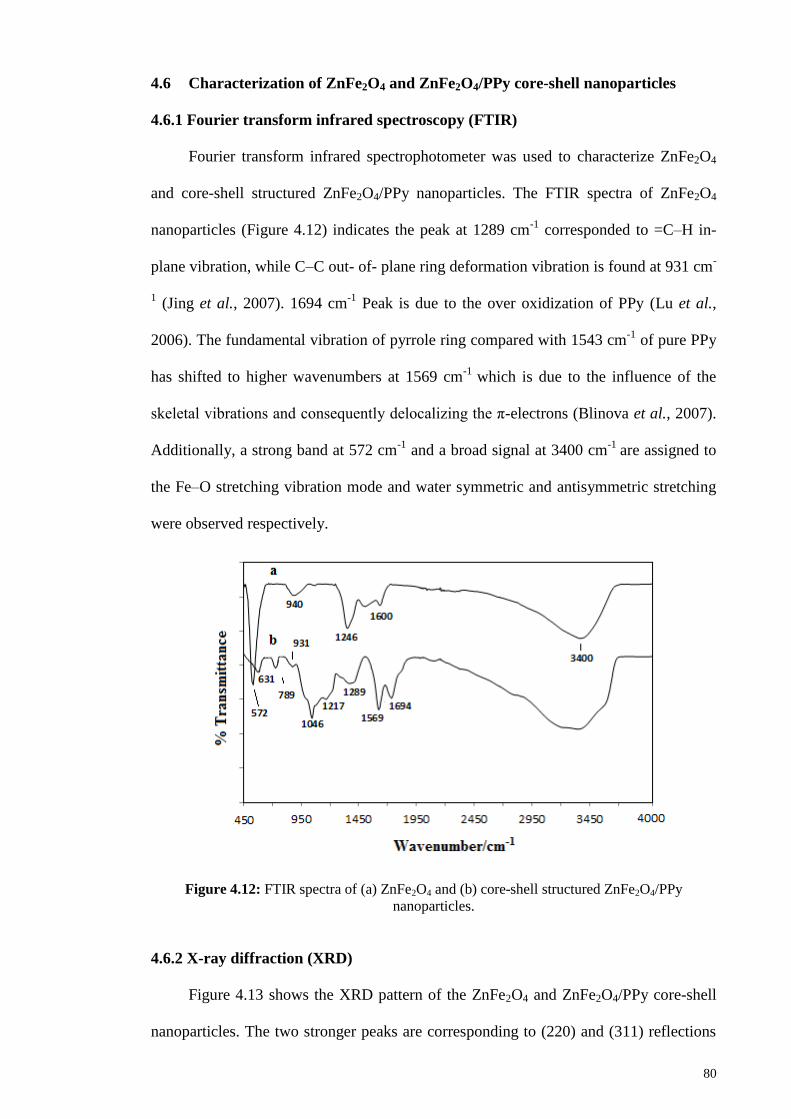
80
4.6 Characterization of ZnFe2O4 and ZnFe2O4/PPy core-shell nanoparticles
4.6.1 Fourier transform infrared spectroscopy (FTIR)
Fourier transform infrared spectrophotometer was used to characterize ZnFe2O4
and core-shell structured ZnFe2O4/PPy nanoparticles. The FTIR spectra of ZnFe2O4
nanoparticles (Figure 4.12) indicates the peak at 1289 cm-1
corresponded to =C–H in-
plane vibration, while C–C out- of- plane ring deformation vibration is found at 931 cm-
1 (Jing et al., 2007). 1694 cm
-1 Peak is due to the over oxidization of PPy (Lu et al.,
2006). The fundamental vibration of pyrrole ring compared with 1543 cm-1
of pure PPy
has shifted to higher wavenumbers at 1569 cm-1
which is due to the influence of the
skeletal vibrations and consequently delocalizing the π-electrons (Blinova et al., 2007).
Additionally, a strong band at 572 cm-1
and a broad signal at 3400 cm-1
are assigned to
the Fe–O stretching vibration mode and water symmetric and antisymmetric stretching
were observed respectively.
Figure 4.12: FTIR spectra of (a) ZnFe2O4 and (b) core-shell structured ZnFe2O4/PPy
nanoparticles.
4.6.2 X-ray diffraction (XRD)
Figure 4.13 shows the XRD pattern of the ZnFe2O4 and ZnFe2O4/PPy core-shell
nanoparticles. The two stronger peaks are corresponding to (220) and (311) reflections
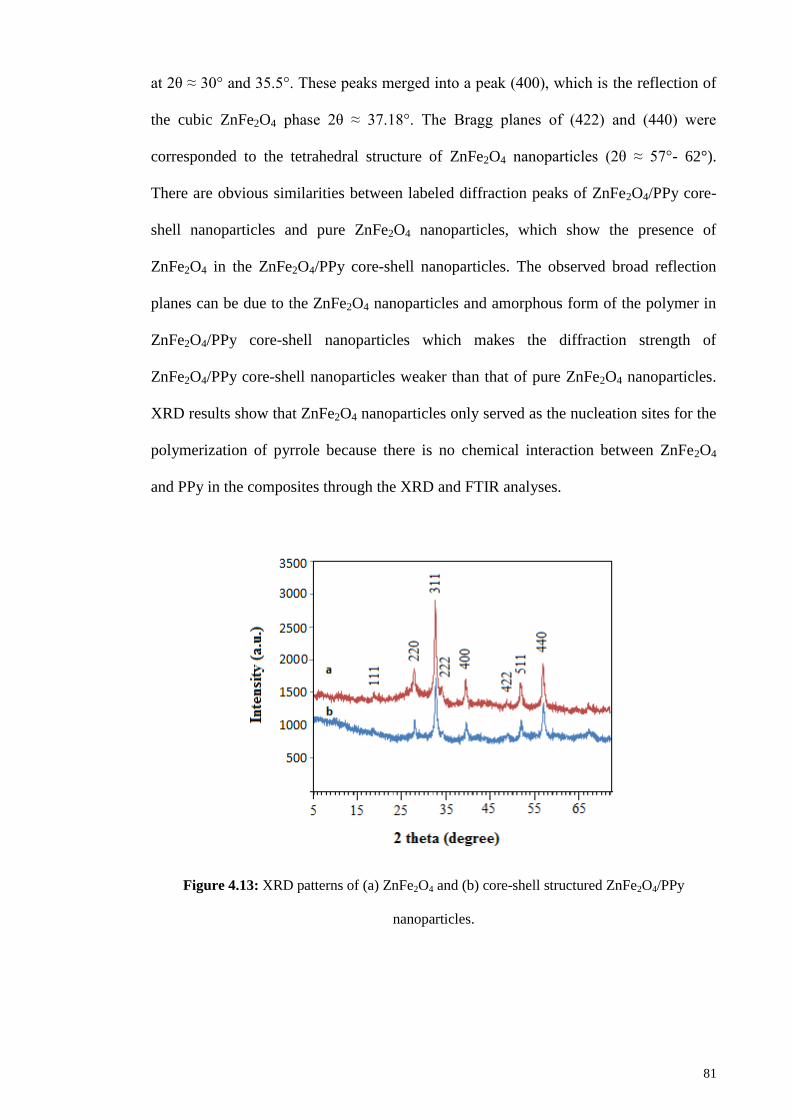
81
at 2θ ≈ 30° and 35.5°. These peaks merged into a peak (400), which is the reflection of
the cubic ZnFe2O4 phase 2θ ≈ 37.18°. The Bragg planes of (422) and (440) were
corresponded to the tetrahedral structure of ZnFe2O4 nanoparticles (2θ ≈ 57°- 62°).
There are obvious similarities between labeled diffraction peaks of ZnFe2O4/PPy core-
shell nanoparticles and pure ZnFe2O4 nanoparticles, which show the presence of
ZnFe2O4 in the ZnFe2O4/PPy core-shell nanoparticles. The observed broad reflection
planes can be due to the ZnFe2O4 nanoparticles and amorphous form of the polymer in
ZnFe2O4/PPy core-shell nanoparticles which makes the diffraction strength of
ZnFe2O4/PPy core-shell nanoparticles weaker than that of pure ZnFe2O4 nanoparticles.
XRD results show that ZnFe2O4 nanoparticles only served as the nucleation sites for the
polymerization of pyrrole because there is no chemical interaction between ZnFe2O4
and PPy in the composites through the XRD and FTIR analyses.
Figure 4.13: XRD patterns of (a) ZnFe2O4 and (b) core-shell structured ZnFe2O4/PPy
nanoparticles.
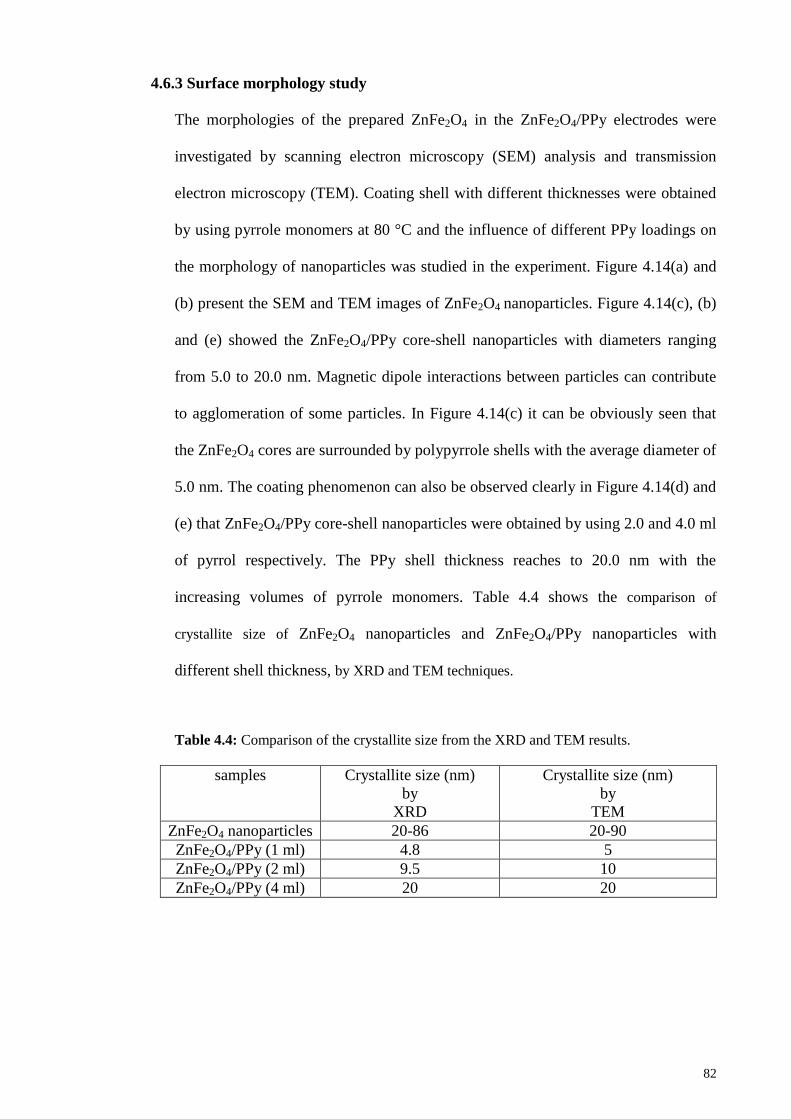
82
4.6.3 Surface morphology study
The morphologies of the prepared ZnFe2O4 in the ZnFe2O4/PPy electrodes were
investigated by scanning electron microscopy (SEM) analysis and transmission
electron microscopy (TEM). Coating shell with different thicknesses were obtained
by using pyrrole monomers at 80 °C and the influence of different PPy loadings on
the morphology of nanoparticles was studied in the experiment. Figure 4.14(a) and
(b) present the SEM and TEM images of ZnFe2O4 nanoparticles. Figure 4.14(c), (b)
and (e) showed the ZnFe2O4/PPy core-shell nanoparticles with diameters ranging
from 5.0 to 20.0 nm. Magnetic dipole interactions between particles can contribute
to agglomeration of some particles. In Figure 4.14(c) it can be obviously seen that
the ZnFe2O4 cores are surrounded by polypyrrole shells with the average diameter of
5.0 nm. The coating phenomenon can also be observed clearly in Figure 4.14(d) and
(e) that ZnFe2O4/PPy core-shell nanoparticles were obtained by using 2.0 and 4.0 ml
of pyrrol respectively. The PPy shell thickness reaches to 20.0 nm with the
increasing volumes of pyrrole monomers. Table 4.4 shows the comparison of
crystallite size of ZnFe2O4 nanoparticles and ZnFe2O4/PPy nanoparticles with
different shell thickness, by XRD and TEM techniques.
Table 4.4: Comparison of the crystallite size from the XRD and TEM results.
samples Crystallite size (nm)
by
XRD
Crystallite size (nm)
by
TEM ZnFe2O4 nanoparticles 20-86 20-90
ZnFe2O4/PPy (1 ml) 4.8 5
ZnFe2O4/PPy (2 ml) 9.5 10
ZnFe2O4/PPy (4 ml) 20 20
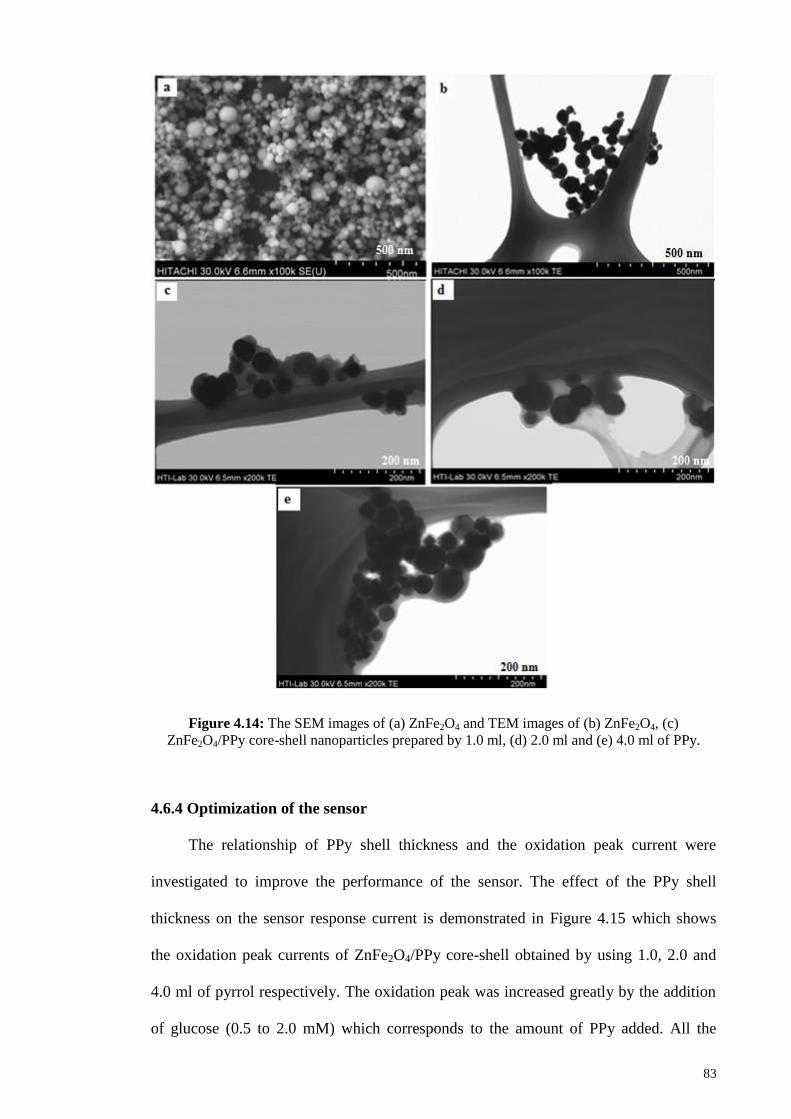
83
Figure 4.14: The SEM images of (a) ZnFe2O4 and TEM images of (b) ZnFe2O4, (c)
ZnFe2O4/PPy core-shell nanoparticles prepared by 1.0 ml, (d) 2.0 ml and (e) 4.0 ml of PPy.
4.6.4 Optimization of the sensor
The relationship of PPy shell thickness and the oxidation peak current were
investigated to improve the performance of the sensor. The effect of the PPy shell
thickness on the sensor response current is demonstrated in Figure 4.15 which shows
the oxidation peak currents of ZnFe2O4/PPy core-shell obtained by using 1.0, 2.0 and
4.0 ml of pyrrol respectively. The oxidation peak was increased greatly by the addition
of glucose (0.5 to 2.0 mM) which corresponds to the amount of PPy added. All the
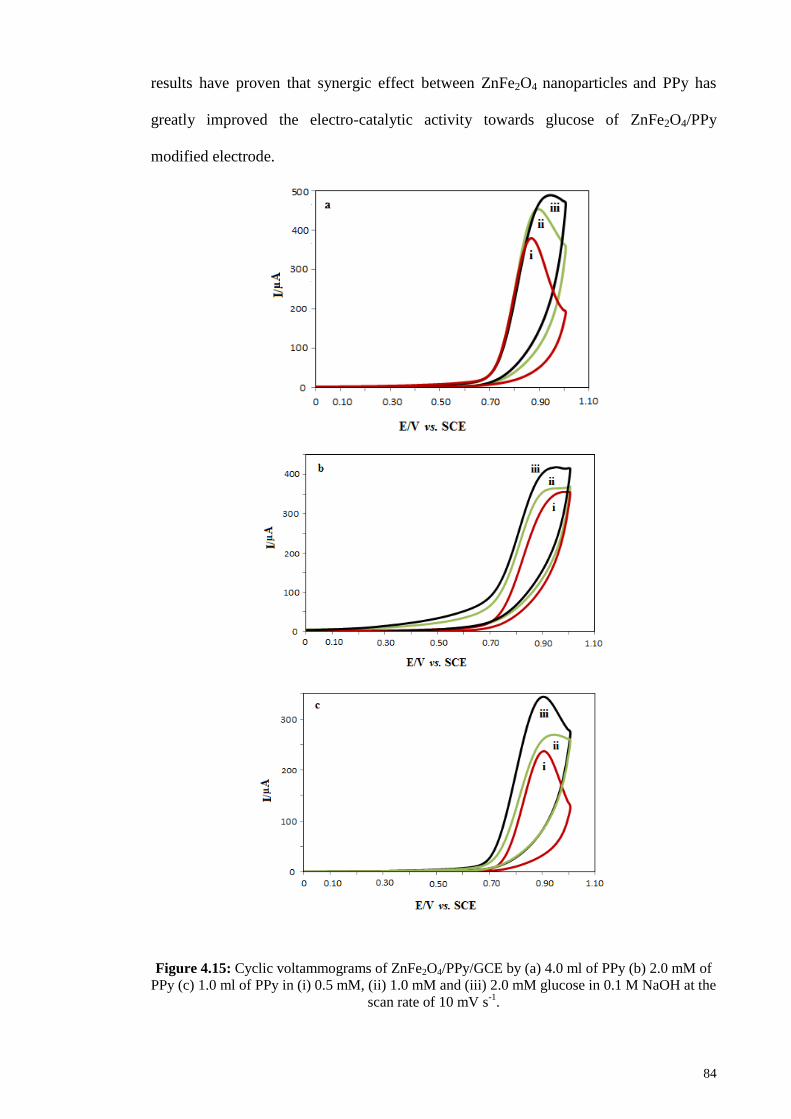
84
results have proven that synergic effect between ZnFe2O4 nanoparticles and PPy has
greatly improved the electro-catalytic activity towards glucose of ZnFe2O4/PPy
modified electrode.
Figure 4.15: Cyclic voltammograms of ZnFe2O4/PPy/GCE by (a) 4.0 ml of PPy (b) 2.0 mM of
PPy (c) 1.0 ml of PPy in (i) 0.5 mM, (ii) 1.0 mM and (iii) 2.0 mM glucose in 0.1 M NaOH at the
scan rate of 10 mV s-1
.
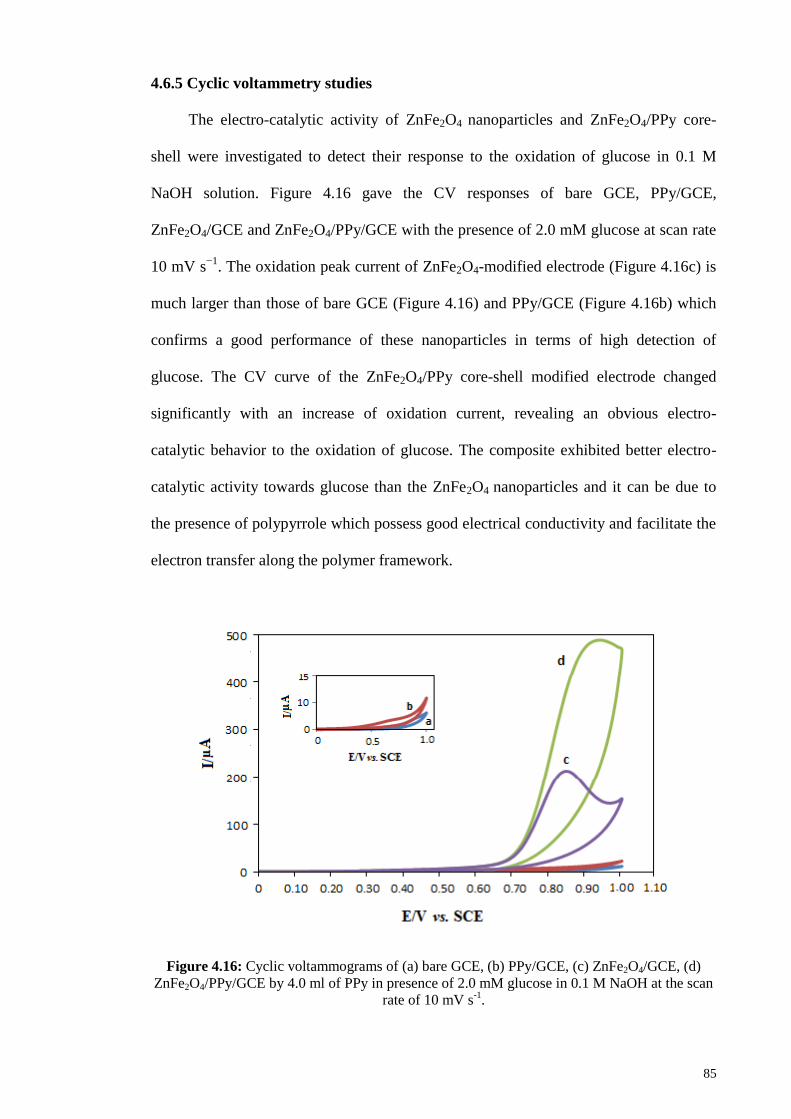
85
4.6.5 Cyclic voltammetry studies
The electro-catalytic activity of ZnFe2O4 nanoparticles and ZnFe2O4/PPy core-
shell were investigated to detect their response to the oxidation of glucose in 0.1 M
NaOH solution. Figure 4.16 gave the CV responses of bare GCE, PPy/GCE,
ZnFe2O4/GCE and ZnFe2O4/PPy/GCE with the presence of 2.0 mM glucose at scan rate
10 mV s−1
. The oxidation peak current of ZnFe2O4-modified electrode (Figure 4.16c) is
much larger than those of bare GCE (Figure 4.16) and PPy/GCE (Figure 4.16b) which
confirms a good performance of these nanoparticles in terms of high detection of
glucose. The CV curve of the ZnFe2O4/PPy core-shell modified electrode changed
significantly with an increase of oxidation current, revealing an obvious electro-
catalytic behavior to the oxidation of glucose. The composite exhibited better electro-
catalytic activity towards glucose than the ZnFe2O4 nanoparticles and it can be due to
the presence of polypyrrole which possess good electrical conductivity and facilitate the
electron transfer along the polymer framework.
Figure 4.16: Cyclic voltammograms of (a) bare GCE, (b) PPy/GCE, (c) ZnFe2O4/GCE, (d)
ZnFe2O4/PPy/GCE by 4.0 ml of PPy in presence of 2.0 mM glucose in 0.1 M NaOH at the scan
rate of 10 mV s-1
.
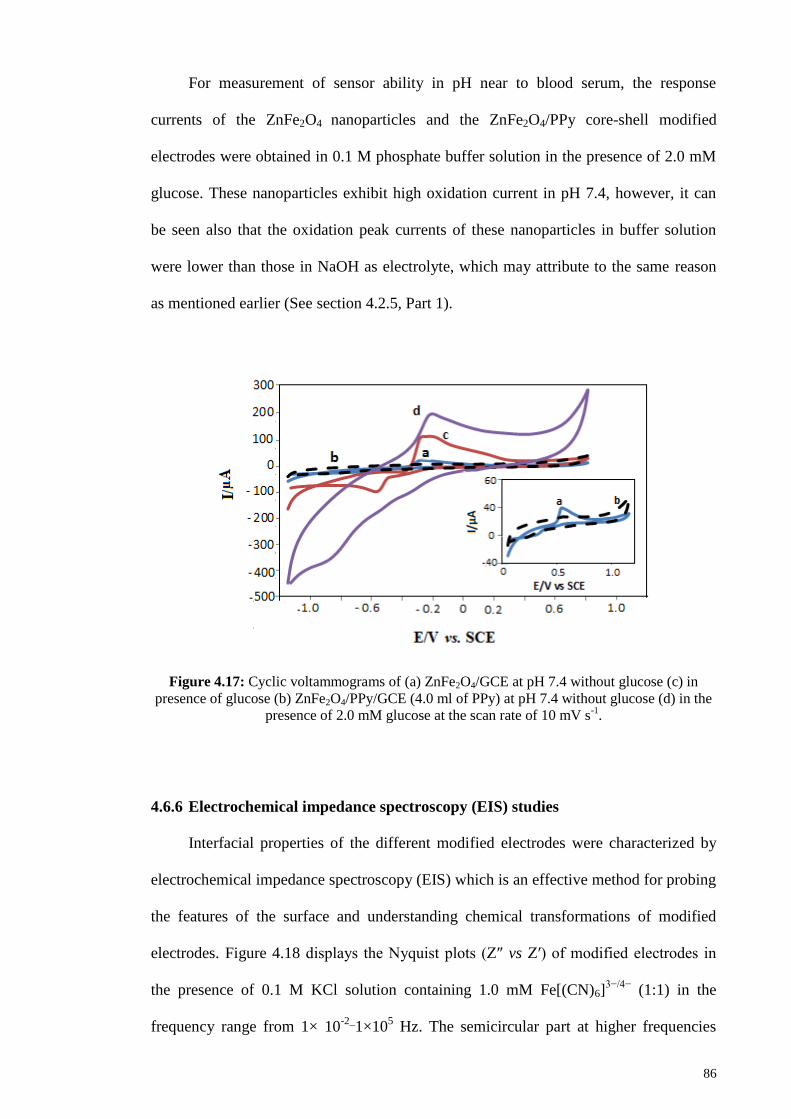
86
For measurement of sensor ability in pH near to blood serum, the response
currents of the ZnFe2O4 nanoparticles and the ZnFe2O4/PPy core-shell modified
electrodes were obtained in 0.1 M phosphate buffer solution in the presence of 2.0 mM
glucose. These nanoparticles exhibit high oxidation current in pH 7.4, however, it can
be seen also that the oxidation peak currents of these nanoparticles in buffer solution
were lower than those in NaOH as electrolyte, which may attribute to the same reason
as mentioned earlier (See section 4.2.5, Part 1).
Figure 4.17: Cyclic voltammograms of (a) ZnFe2O4/GCE at pH 7.4 without glucose (c) in
presence of glucose (b) ZnFe2O4/PPy/GCE (4.0 ml of PPy) at pH 7.4 without glucose (d) in the
presence of 2.0 mM glucose at the scan rate of 10 mV s-1
.
4.6.6 Electrochemical impedance spectroscopy (EIS) studies
Interfacial properties of the different modified electrodes were characterized by
electrochemical impedance spectroscopy (EIS) which is an effective method for probing
the features of the surface and understanding chemical transformations of modified
electrodes. Figure 4.18 displays the Nyquist plots (Z″ vs Z′) of modified electrodes in
the presence of 0.1 M KCl solution containing 1.0 mM Fe[(CN)6]3−/4−
(1:1) in the
frequency range from 1× 10⁻²_
1×10⁵ Hz. The semicircular part at higher frequencies
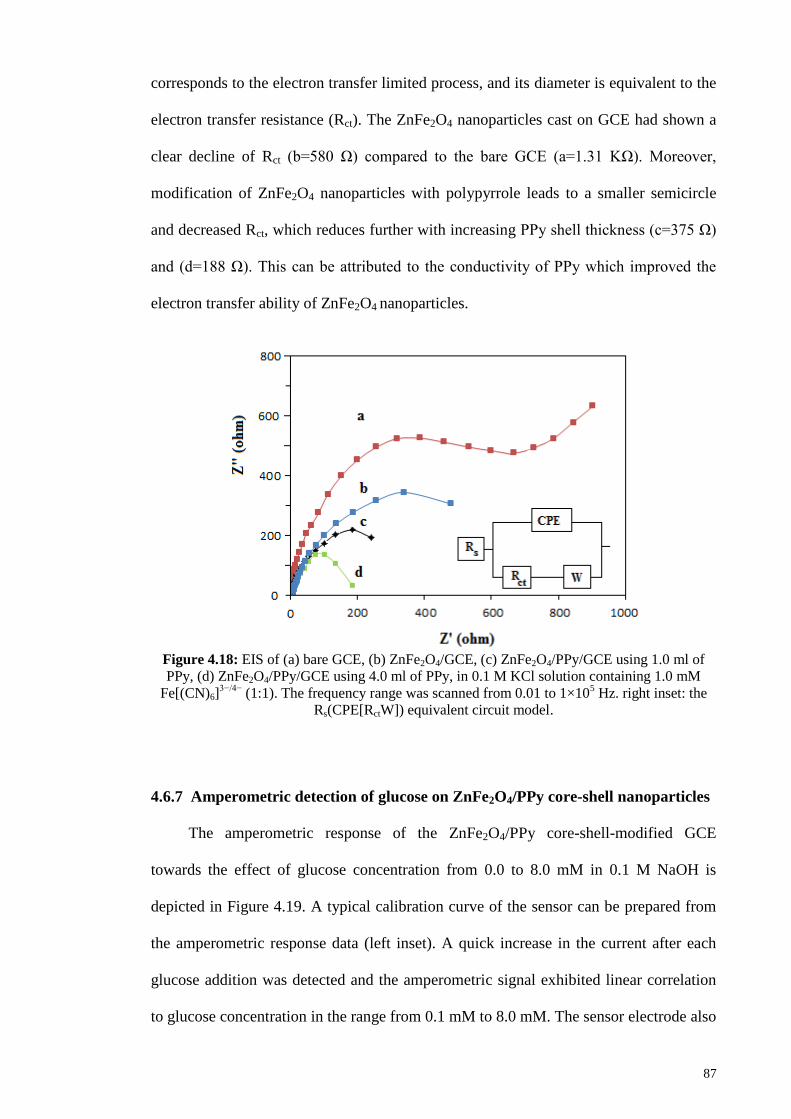
87
corresponds to the electron transfer limited process, and its diameter is equivalent to the
electron transfer resistance (Rct). The ZnFe2O4 nanoparticles cast on GCE had shown a
clear decline of Rct (b=580 Ω) compared to the bare GCE (a=1.31 KΩ). Moreover,
modification of ZnFe2O4 nanoparticles with polypyrrole leads to a smaller semicircle
and decreased Rct, which reduces further with increasing PPy shell thickness (c=375 Ω)
and (d=188 Ω). This can be attributed to the conductivity of PPy which improved the
electron transfer ability of ZnFe2O4 nanoparticles.
Figure 4.18: EIS of (a) bare GCE, (b) ZnFe2O4/GCE, (c) ZnFe2O4/PPy/GCE using 1.0 ml of
PPy, (d) ZnFe2O4/PPy/GCE using 4.0 ml of PPy, in 0.1 M KCl solution containing 1.0 mM
Fe[(CN)6]3−/4−
(1:1). The frequency range was scanned from 0.01 to 1×10⁵ Hz. right inset: the
Rs(CPE[RctW]) equivalent circuit model.
4.6.7 Amperometric detection of glucose on ZnFe2O4/PPy core-shell nanoparticles
The amperometric response of the ZnFe2O4/PPy core-shell-modified GCE
towards the effect of glucose concentration from 0.0 to 8.0 mM in 0.1 M NaOH is
depicted in Figure 4.19. A typical calibration curve of the sensor can be prepared from
the amperometric response data (left inset). A quick increase in the current after each
glucose addition was detected and the amperometric signal exhibited linear correlation
to glucose concentration in the range from 0.1 mM to 8.0 mM. The sensor electrode also
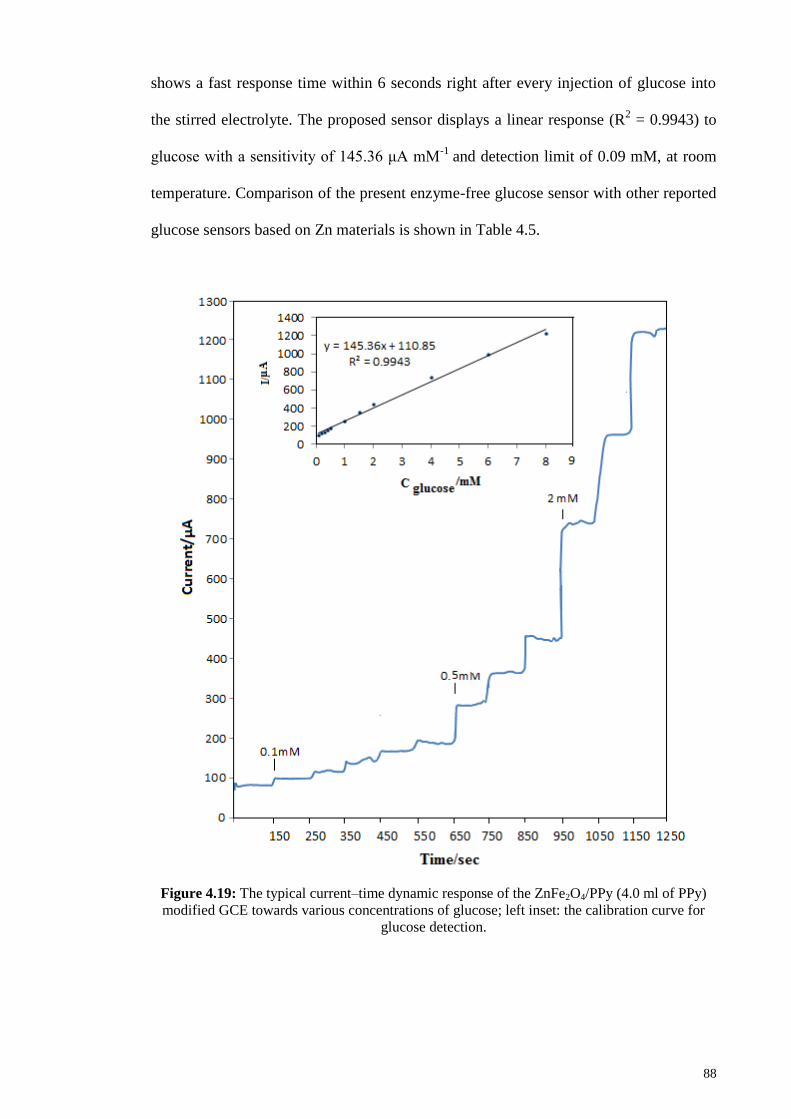
88
shows a fast response time within 6 seconds right after every injection of glucose into
the stirred electrolyte. The proposed sensor displays a linear response (R2 = 0.9943) to
glucose with a sensitivity of 145.36 μA mM-1
and detection limit of 0.09 mM, at room
temperature. Comparison of the present enzyme-free glucose sensor with other reported
glucose sensors based on Zn materials is shown in Table 4.5.
Figure 4.19: The typical current–time dynamic response of the ZnFe2O4/PPy (4.0 ml of PPy)
modified GCE towards various concentrations of glucose; left inset: the calibration curve for
glucose detection.

89
Table 4.5: Comparison of the present ZnFe2O4/PPy nanoparticles enzyme-free glucose sensor
with other glucose sensors based on Zn materials.
Electrode Detection
potential
(vs. SCE)
Detection
limit Sensitivity
(µA mM−1
) Linear range Ref.
ZnO nanotubes - 0.8 V 1.0 mM 21.7 0.05-12
mM (Kong, T. et
al., 2009)
ZnO nanonails - 5.0 µM 24.6 0.1-7.1 mM (Umar et al.,
2008)
ZnO hollow
nanospheres 0.8 V 1.0 µM 65.82 0.005-13.15
mM (Fang et al.,
2011)
ZnFe2O4/PPy/co
re-shell 0.85 V 0.09 µM 145.36 0.1-8.0 mM This work
4.6.8 Interference study
To study the anti-interference ability of the fabricated glucose sensor, the
amperometric response of the sensor recorded by successive injection of 0.1 mM
glucose and blood interfering species (0.1 mM uric acid, UA and 0.1 mM ascorbic acid,
AA) into solution containing 0.1 M NaOH (Figure 4.20). The performance of the sensor
to differentiate glucose from the other sugars like sucrose and fructose was also
demonstrated. It can be seen from Figure 4.20 that although the addition of 0.1 mM AA
and UA increased the current of ZnFe2O4/PPy, the intensity increase is much smaller
than the addition of 0.1 mM glucose, which is around 120 µA. As a result small amount
of AA, UA, fructose and sucrose can be neglected as ZnFe2O4/PPy modified electrode
exhibits high selectivity for glucose sensing.
Figure 4.20: Interference test of the sensor in 0.1 M NaOH with 0.1 mM glucose and other
interference as indicated.
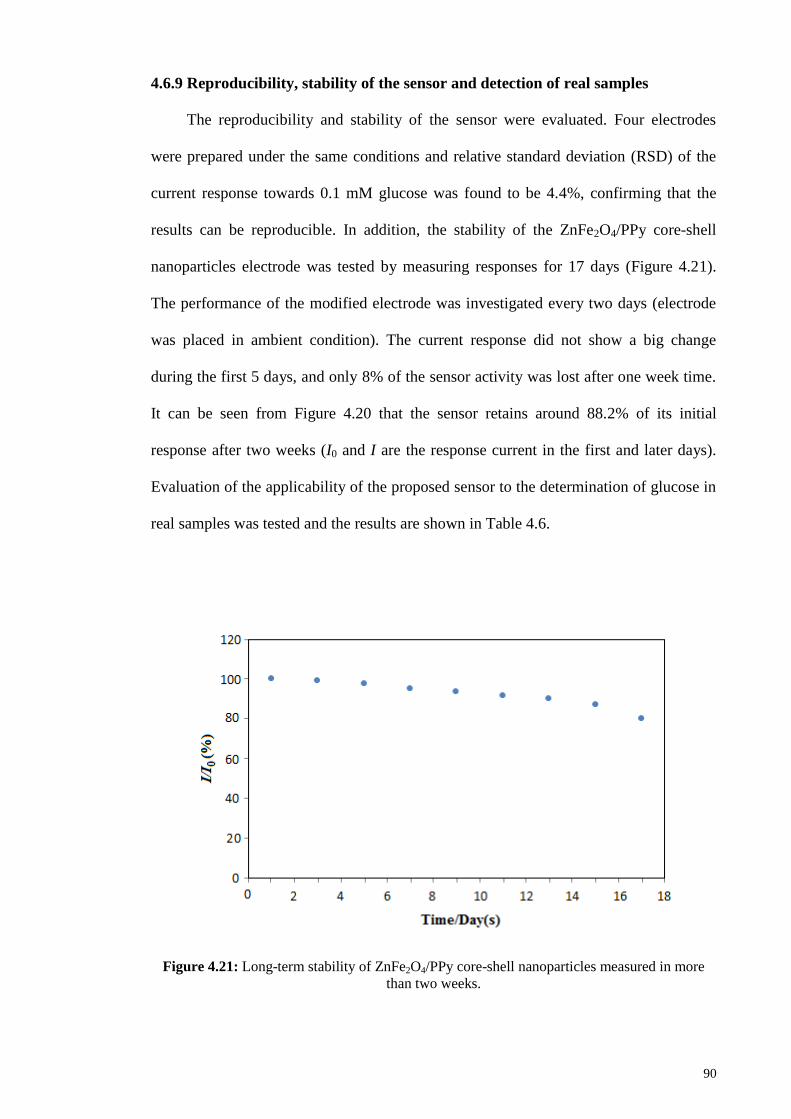
90
4.6.9 Reproducibility, stability of the sensor and detection of real samples
The reproducibility and stability of the sensor were evaluated. Four electrodes
were prepared under the same conditions and relative standard deviation (RSD) of the
current response towards 0.1 mM glucose was found to be 4.4%, confirming that the
results can be reproducible. In addition, the stability of the ZnFe2O4/PPy core-shell
nanoparticles electrode was tested by measuring responses for 17 days (Figure 4.21).
The performance of the modified electrode was investigated every two days (electrode
was placed in ambient condition). The current response did not show a big change
during the first 5 days, and only 8% of the sensor activity was lost after one week time.
It can be seen from Figure 4.20 that the sensor retains around 88.2% of its initial
response after two weeks (I0 and I are the response current in the first and later days).
Evaluation of the applicability of the proposed sensor to the determination of glucose in
real samples was tested and the results are shown in Table 4.6.
Figure 4.21: Long-term stability of ZnFe2O4/PPy core-shell nanoparticles measured in more
than two weeks.
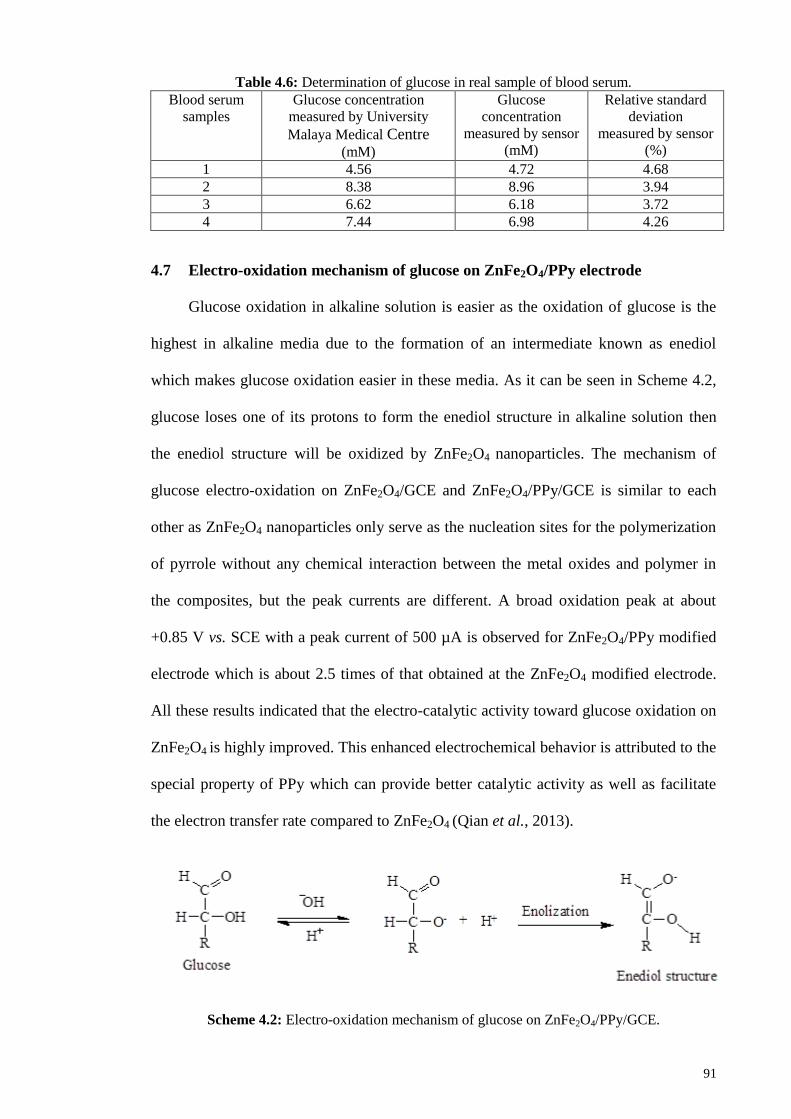
91
Table 4.6: Determination of glucose in real sample of blood serum.
Blood serum
samples
Glucose concentration
measured by University
Malaya Medical Centre
(mM)
Glucose
concentration
measured by sensor
(mM)
Relative standard
deviation
measured by sensor
(%)
1 4.56 4.72 4.68
2 8.38 8.96 3.94
3 6.62 6.18 3.72
4 7.44 6.98 4.26
4.7 Electro-oxidation mechanism of glucose on ZnFe2O4/PPy electrode
Glucose oxidation in alkaline solution is easier as the oxidation of glucose is the
highest in alkaline media due to the formation of an intermediate known as enediol
which makes glucose oxidation easier in these media. As it can be seen in Scheme 4.2,
glucose loses one of its protons to form the enediol structure in alkaline solution then
the enediol structure will be oxidized by ZnFe2O4 nanoparticles. The mechanism of
glucose electro-oxidation on ZnFe2O4/GCE and ZnFe2O4/PPy/GCE is similar to each
other as ZnFe2O4 nanoparticles only serve as the nucleation sites for the polymerization
of pyrrole without any chemical interaction between the metal oxides and polymer in
the composites, but the peak currents are different. A broad oxidation peak at about
+0.85 V vs. SCE with a peak current of 500 µA is observed for ZnFe2O4/PPy modified
electrode which is about 2.5 times of that obtained at the ZnFe2O4 modified electrode.
All these results indicated that the electro-catalytic activity toward glucose oxidation on
ZnFe2O4 is highly improved. This enhanced electrochemical behavior is attributed to the
special property of PPy which can provide better catalytic activity as well as facilitate
the electron transfer rate compared to ZnFe2O4 (Qian et al., 2013).
Scheme 4.2: Electro-oxidation mechanism of glucose on ZnFe2O4/PPy/GCE.
92
4.8 Conclusion
In this work, a novel enzyme-free glucose sensor based on chemical oxidative
polymerization of pyrrole on ZnFe2O4 nanoparticles surface is presented. The sensor
showed good activity towards the determination of glucose with the linear concentration
range of 0.1-8.0 mM. The current response for 0.1 mM glucose in the presence of
normal physiological concentrations of interferes (ascorbic acid and uric acid) and
sugars like fructose and sucrose did not have a significant change. The modified
electrode is stable enough in electrochemical measurements which are possibly due to
supporting matrix of PPy. In application of electrochemistry, it showed a very high
electrochemical active surface area and high electro-catalytic activity for the glucose
oxidation, a lower detection limit of 0.09 μA and high sensitivity of 145.36 μA mM-1
.
All these advantageous features hold the promise for the development of a practicable
application in the future.
93
Part 3: Reduced graphene oxide-supported copper ferrite hybrid for glucose
sensing
4.9 Introduction
A stable enzyme-free glucose sensor was fabricated via a facile in situ
hydrothermal route by the formation of CuFe2O4 nanoparticles into the graphene oxide
sheets. The contents of graphene oxide in composites were varied from 10 to 40 wt%.
The morphology of formed CuFe2O4/rGO nanocomposite was found by TEM analysis.
The electro-catalytic activity of different CuFe2O4/rGO samples towards glucose
oxidation was studied by employing cyclic voltammetry and chronoamperometry
techniques.
4.10 Characterization of CuFe2O4 and CuFe2O4/rGO magnetic nanocomposite
4.10.1 Fourier transform infrared spectroscopy (FTIR)
Figure 4.22 shows FTIR spectra of GO, CuFe2O4/rGO magnetic nanocomposite
(CuFe2O4/rGO(30 wt%) and pure CuFe2O4. The appearance of peak at 3410 and 1743 cm-
1 are attributed to the stretching vibrations of O–H and C=O, respectively. Additionally,
two strong bands at 1620 and 1278 cm-1
appear in the spectrum of GO which is assigned
to the vibration of carboxyl groups (Fu et al., 2012). A strong band at 570 cm-1
appears
in the spectrum of CuFe2O4 which is assigned to the Fe–O stretching vibration mode
(Ramankutty & Sugunan, 2001). Compared to the spectrum of CuFe2O4 nanoparticles,
the CuFe2O4/rGO composite showed weaker peaks which can be due to the nucleation
and growth of CuFe2O4 nanoparticles into the layered GO sheets. After the
hydrothermal reaction, the GO peaks became weak or disappear in CuFe2O4/rGO
nanocomposite to imply that there is reduced GO in the CuFe2O4/rGO nanocomposite.
The similar peaks were observed for CuFe2O4/rGO composite with different rGO
contents (10, 20 and 40 wt%).
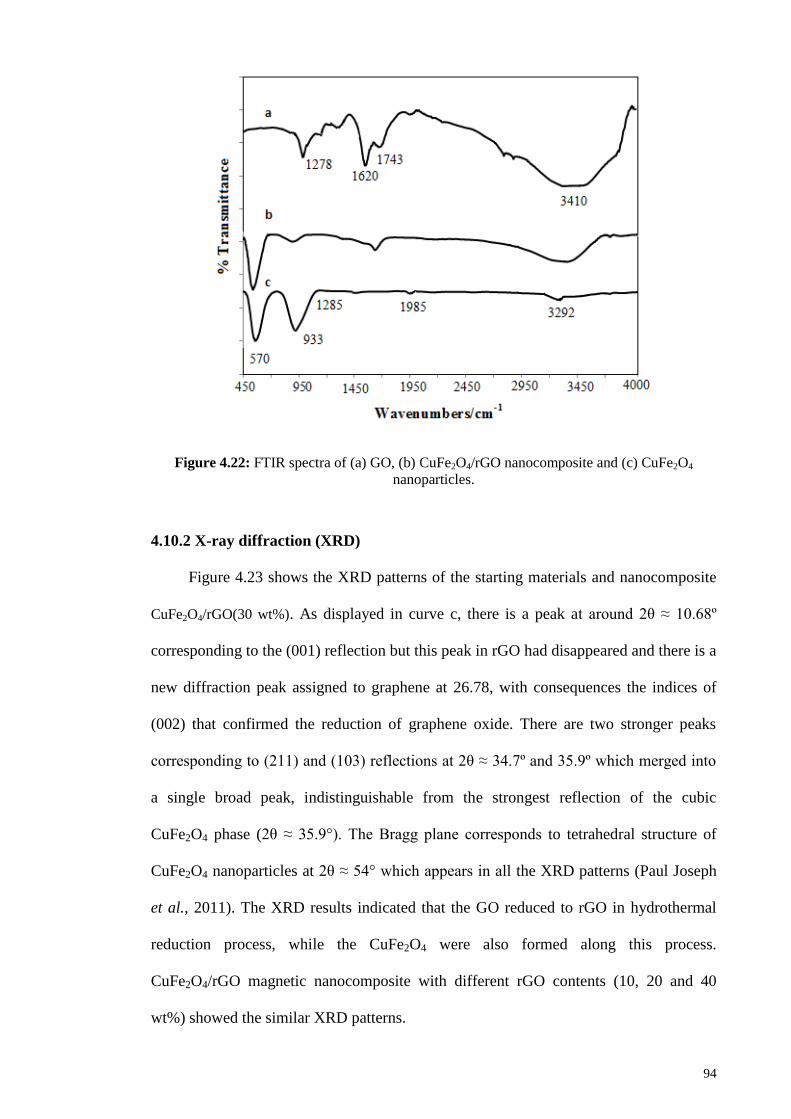
94
Figure 4.22: FTIR spectra of (a) GO, (b) CuFe2O4/rGO nanocomposite and (c) CuFe2O4
nanoparticles.
4.10.2 X-ray diffraction (XRD)
Figure 4.23 shows the XRD patterns of the starting materials and nanocomposite
CuFe2O4/rGO(30 wt%). As displayed in curve c, there is a peak at around 2θ ≈ 10.68º
corresponding to the (001) reflection but this peak in rGO had disappeared and there is a
new diffraction peak assigned to graphene at 26.78, with consequences the indices of
(002) that confirmed the reduction of graphene oxide. There are two stronger peaks
corresponding to (211) and (103) reflections at 2θ ≈ 34.7º and 35.9º which merged into
a single broad peak, indistinguishable from the strongest reflection of the cubic
CuFe2O4 phase (2θ ≈ 35.9°). The Bragg plane corresponds to tetrahedral structure of
CuFe2O4 nanoparticles at 2θ ≈ 54° which appears in all the XRD patterns (Paul Joseph
et al., 2011). The XRD results indicated that the GO reduced to rGO in hydrothermal
reduction process, while the CuFe2O4 were also formed along this process.
CuFe2O4/rGO magnetic nanocomposite with different rGO contents (10, 20 and 40
wt%) showed the similar XRD patterns.
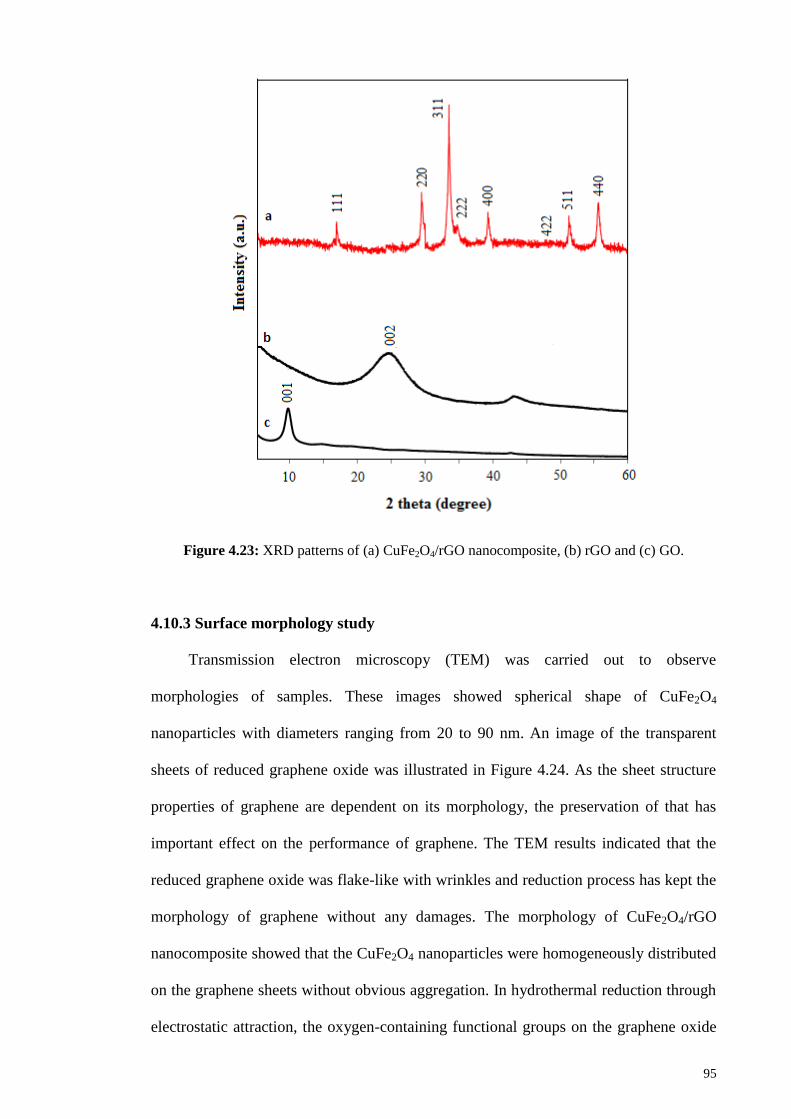
95
Figure 4.23: XRD patterns of (a) CuFe2O4/rGO nanocomposite, (b) rGO and (c) GO.
4.10.3 Surface morphology study
Transmission electron microscopy (TEM) was carried out to observe
morphologies of samples. These images showed spherical shape of CuFe2O4
nanoparticles with diameters ranging from 20 to 90 nm. An image of the transparent
sheets of reduced graphene oxide was illustrated in Figure 4.24. As the sheet structure
properties of graphene are dependent on its morphology, the preservation of that has
important effect on the performance of graphene. The TEM results indicated that the
reduced graphene oxide was flake-like with wrinkles and reduction process has kept the
morphology of graphene without any damages. The morphology of CuFe2O4/rGO
nanocomposite showed that the CuFe2O4 nanoparticles were homogeneously distributed
on the graphene sheets without obvious aggregation. In hydrothermal reduction through
electrostatic attraction, the oxygen-containing functional groups on the graphene oxide
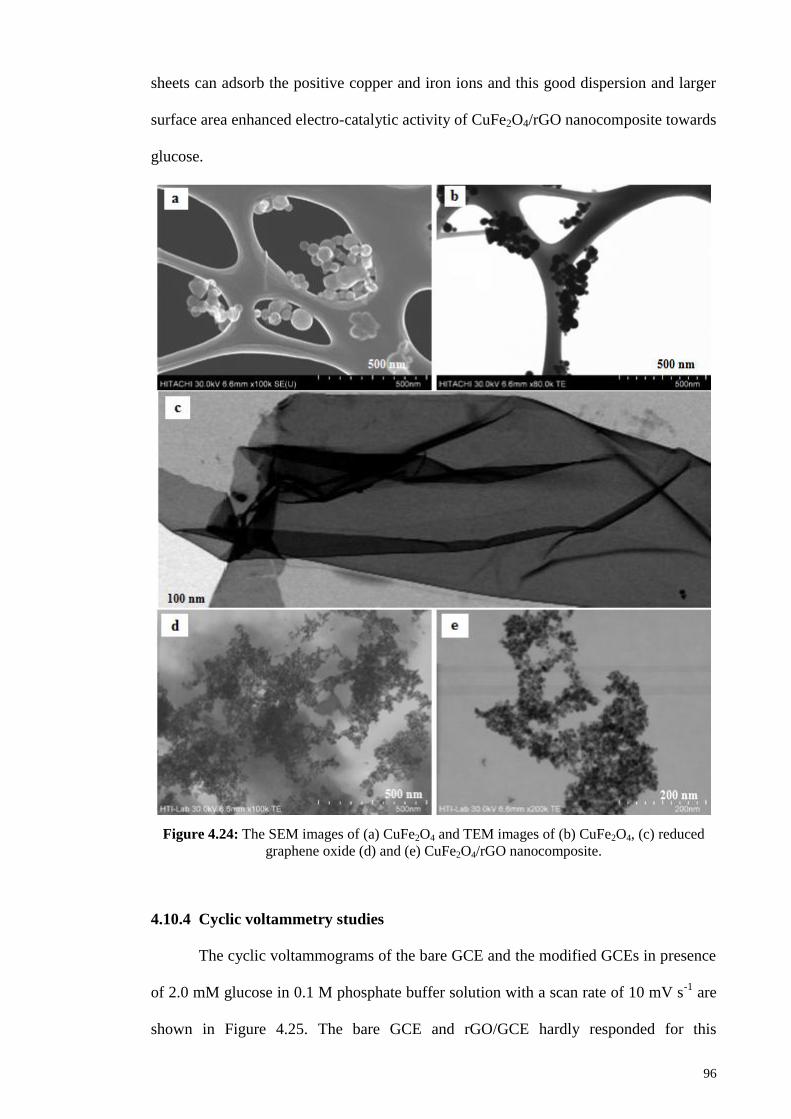
96
sheets can adsorb the positive copper and iron ions and this good dispersion and larger
surface area enhanced electro-catalytic activity of CuFe2O4/rGO nanocomposite towards
glucose.
Figure 4.24: The SEM images of (a) CuFe2O4 and TEM images of (b) CuFe2O4, (c) reduced
graphene oxide (d) and (e) CuFe2O4/rGO nanocomposite.
4.10.4 Cyclic voltammetry studies
The cyclic voltammograms of the bare GCE and the modified GCEs in presence
of 2.0 mM glucose in 0.1 M phosphate buffer solution with a scan rate of 10 mV s-1
are
shown in Figure 4.25. The bare GCE and rGO/GCE hardly responded for this
97
concentration of glucose. After the GCE was modified with CuFe2O4 nanoparticle, the
peak currents significantly enhanced to confirm great glucose catalytic ability of these
magnetic nanocomposites. The electro-catalytic activity of the different CuFe2O4/rGO
nanocomposites modified GCE were investigated as well. As can be seen, the obtained
redox peak of CuFe2O4/rGO(10 wt%)/GCE increases compared to those of
CuFe2O4/GCE and the redox peak current rising continued with increasing graphene
oxide content from the range of 10 wt% to 40 wt% . Unique transport properties of
graphene due to zero bandgap and two-dimensional π-conjugation structure lead to
these results. It can be concluded that the existence of graphene nanosheets as a carbon
support with excellent electronic conduction features is responsible for improve the
electro-catalytic behaviour at CuFe2O4/rGO nanocomposite modified electrode. This
high electro-catalytic activity can be attributed to the good synergistic coupling effects
between the CuFe2O4 nanoparticles and rGO nanosheets. The cyclic voltammograms of
the CuFe2O4/rGO(30 wt%) which has the best performance among other modified
electrodes, recorded in 0.1 M phosphate buffer solution (pH 7.4) at different scan rates
(Figure 4.26). It is found that in the range of 10-150 mV s-1
, both anodic and cathodic
peak currents increase clearly with the applied scan rate, implying that the
electrochemical kinetics is a typical surface-controlled electrochemical process.
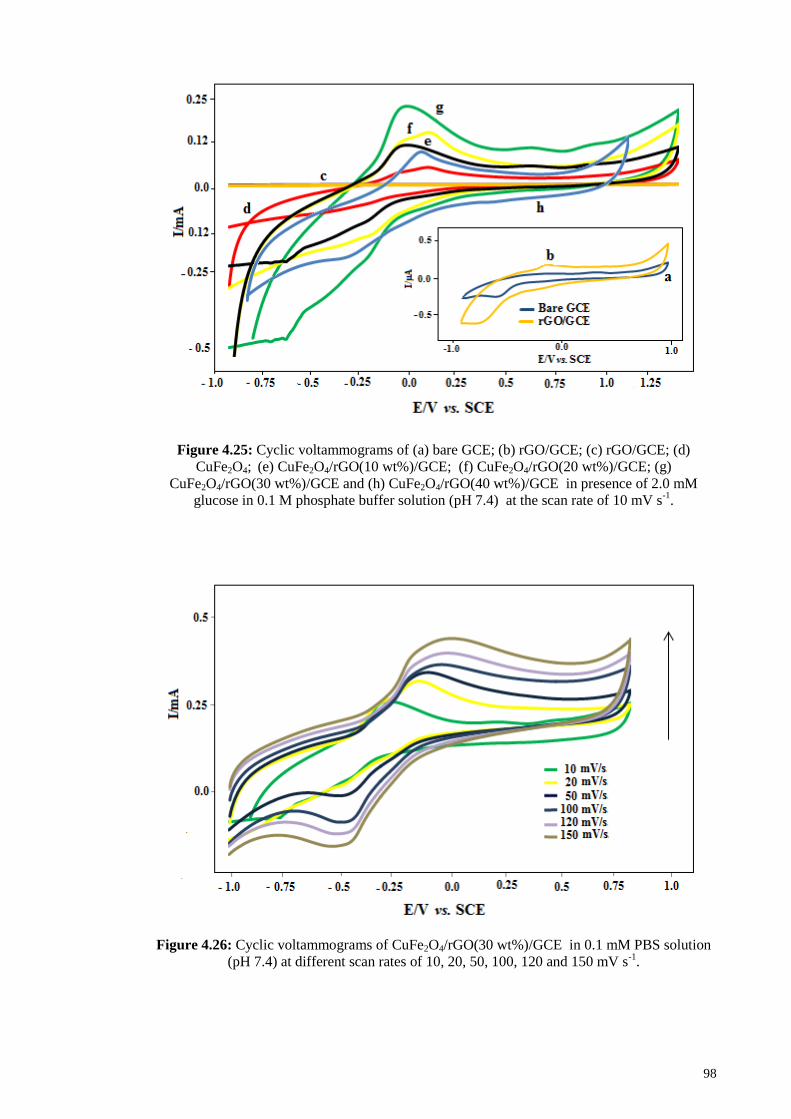
98
Figure 4.25: Cyclic voltammograms of (a) bare GCE; (b) rGO/GCE; (c) rGO/GCE; (d)
CuFe2O4; (e) CuFe2O4/rGO(10 wt%)/GCE; (f) CuFe2O4/rGO(20 wt%)/GCE; (g)
CuFe2O4/rGO(30 wt%)/GCE and (h) CuFe2O4/rGO(40 wt%)/GCE in presence of 2.0 mM
glucose in 0.1 M phosphate buffer solution (pH 7.4) at the scan rate of 10 mV s-1
.
Figure 4.26: Cyclic voltammograms of CuFe2O4/rGO(30 wt%)/GCE in 0.1 mM PBS solution
(pH 7.4) at different scan rates of 10, 20, 50, 100, 120 and 150 mV s-1
.
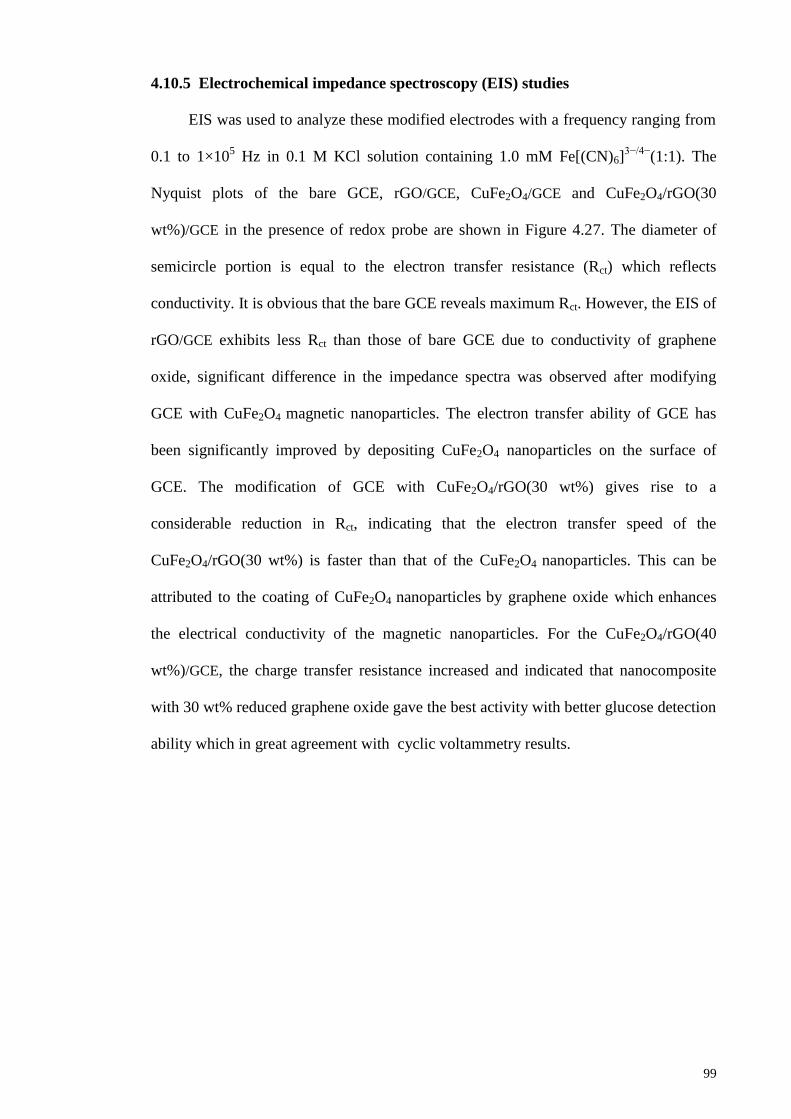
99
4.10.5 Electrochemical impedance spectroscopy (EIS) studies
EIS was used to analyze these modified electrodes with a frequency ranging from
0.1 to 1×10⁵ Hz in 0.1 M KCl solution containing 1.0 mM Fe[(CN)6]
3−/4−(1:1). The
Nyquist plots of the bare GCE, rGO/GCE, CuFe2O4/GCE and CuFe2O4/rGO(30
wt%)/GCE in the presence of redox probe are shown in Figure 4.27. The diameter of
semicircle portion is equal to the electron transfer resistance (Rct) which reflects
conductivity. It is obvious that the bare GCE reveals maximum Rct. However, the EIS of
rGO/GCE exhibits less Rct than those of bare GCE due to conductivity of graphene
oxide, significant difference in the impedance spectra was observed after modifying
GCE with CuFe2O4 magnetic nanoparticles. The electron transfer ability of GCE has
been significantly improved by depositing CuFe2O4 nanoparticles on the surface of
GCE. The modification of GCE with CuFe2O4/rGO(30 wt%) gives rise to a
considerable reduction in Rct, indicating that the electron transfer speed of the
CuFe2O4/rGO(30 wt%) is faster than that of the CuFe2O4 nanoparticles. This can be
attributed to the coating of CuFe2O4 nanoparticles by graphene oxide which enhances
the electrical conductivity of the magnetic nanoparticles. For the CuFe2O4/rGO(40
wt%)/GCE, the charge transfer resistance increased and indicated that nanocomposite
with 30 wt% reduced graphene oxide gave the best activity with better glucose detection
ability which in great agreement with cyclic voltammetry results.
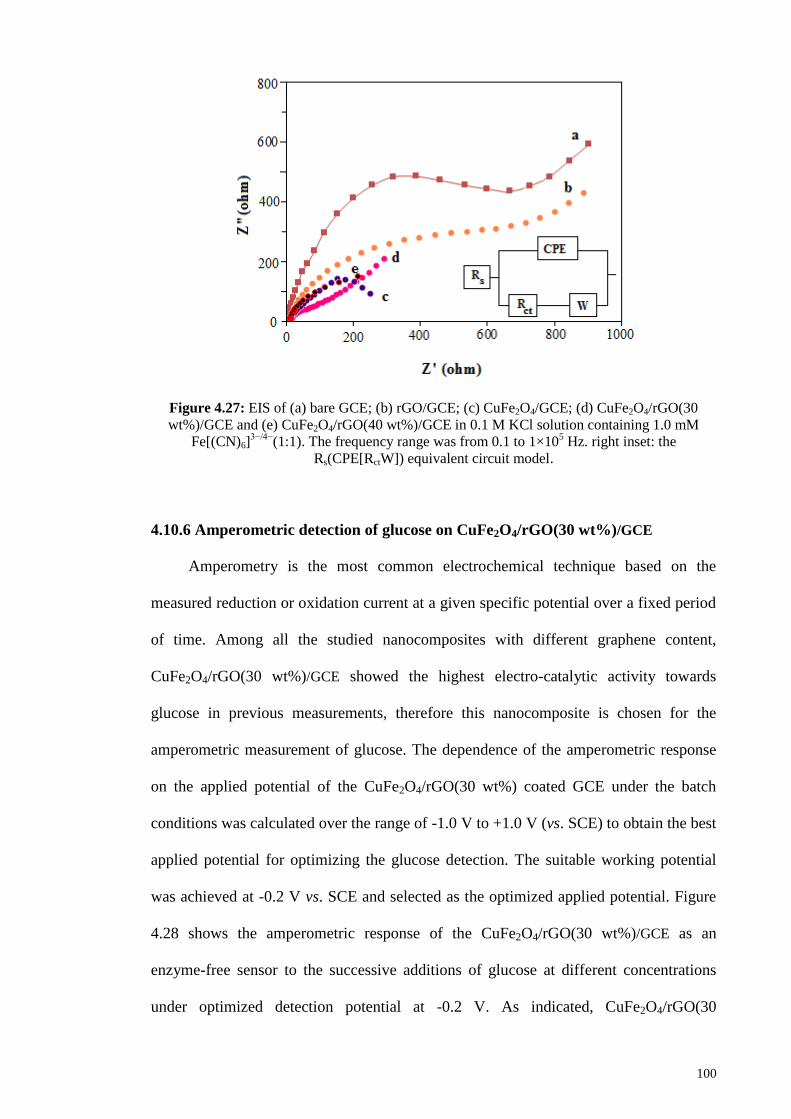
100
Figure 4.27: EIS of (a) bare GCE; (b) rGO/GCE; (c) CuFe2O4/GCE; (d) CuFe2O4/rGO(30
wt%)/GCE and (e) CuFe2O4/rGO(40 wt%)/GCE in 0.1 M KCl solution containing 1.0 mM
Fe[(CN)6]3−/4−
(1:1). The frequency range was from 0.1 to 1×10⁵ Hz. right inset: the
Rs(CPE[RctW]) equivalent circuit model.
4.10.6 Amperometric detection of glucose on CuFe2O4/rGO(30 wt%)/GCE
Amperometry is the most common electrochemical technique based on the
measured reduction or oxidation current at a given specific potential over a fixed period
of time. Among all the studied nanocomposites with different graphene content,
CuFe2O4/rGO(30 wt%)/GCE showed the highest electro-catalytic activity towards
glucose in previous measurements, therefore this nanocomposite is chosen for the
amperometric measurement of glucose. The dependence of the amperometric response
on the applied potential of the CuFe2O4/rGO(30 wt%) coated GCE under the batch
conditions was calculated over the range of -1.0 V to +1.0 V (vs. SCE) to obtain the best
applied potential for optimizing the glucose detection. The suitable working potential
was achieved at -0.2 V vs. SCE and selected as the optimized applied potential. Figure
4.28 shows the amperometric response of the CuFe2O4/rGO(30 wt%)/GCE as an
enzyme-free sensor to the successive additions of glucose at different concentrations
under optimized detection potential at -0.2 V. As indicated, CuFe2O4/rGO(30
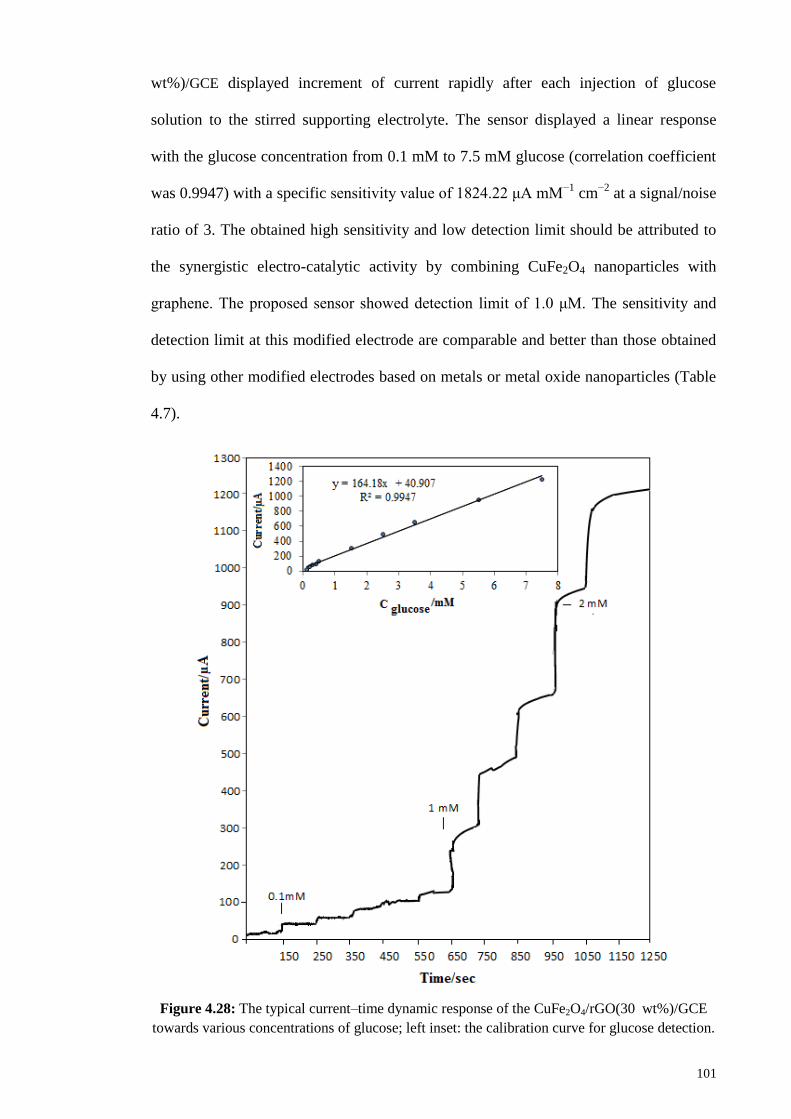
101
wt%)/GCE displayed increment of current rapidly after each injection of glucose
solution to the stirred supporting electrolyte. The sensor displayed a linear response
with the glucose concentration from 0.1 mM to 7.5 mM glucose (correlation coefficient
was 0.9947) with a specific sensitivity value of 1824.22 μA mM−1
cm−2
at a signal/noise
ratio of 3. The obtained high sensitivity and low detection limit should be attributed to
the synergistic electro-catalytic activity by combining CuFe2O4 nanoparticles with
graphene. The proposed sensor showed detection limit of 1.0 μM. The sensitivity and
detection limit at this modified electrode are comparable and better than those obtained
by using other modified electrodes based on metals or metal oxide nanoparticles (Table
4.7).
Figure 4.28: The typical current–time dynamic response of the CuFe2O4/rGO(30 wt%)/GCE
towards various concentrations of glucose; left inset: the calibration curve for glucose detection.
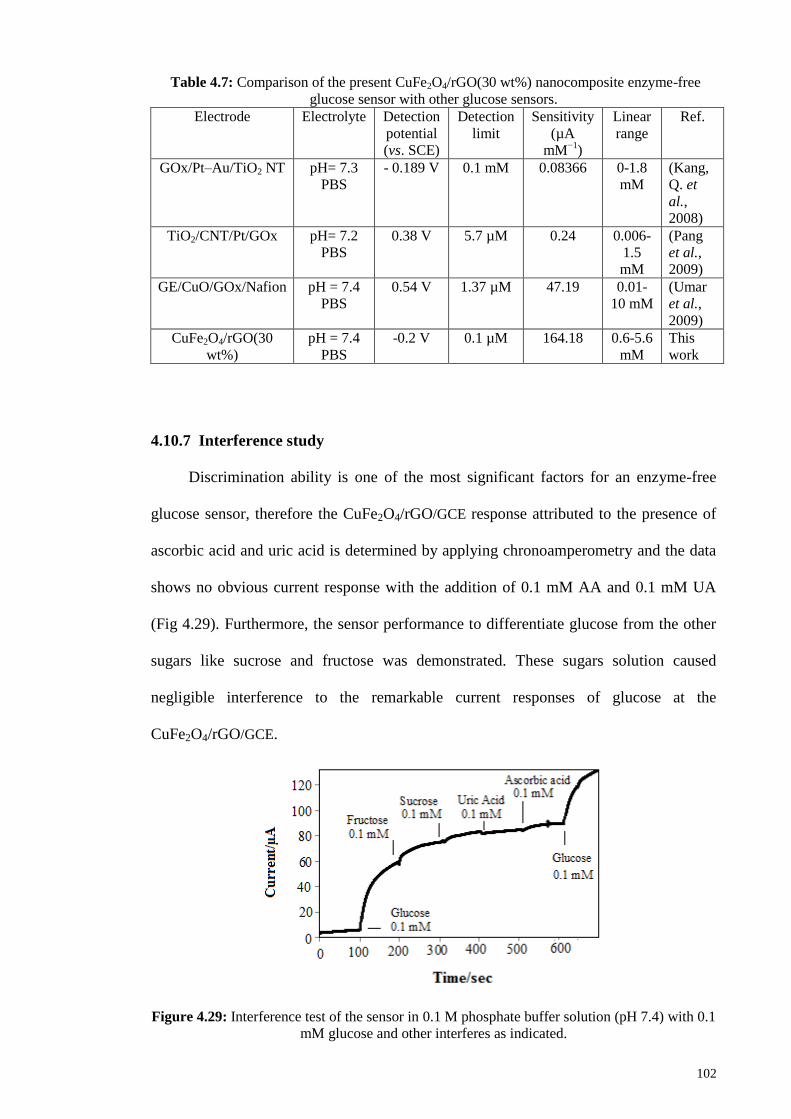
102
Table 4.7: Comparison of the present CuFe2O4/rGO(30 wt%) nanocomposite enzyme-free
glucose sensor with other glucose sensors.
Electrode Electrolyte
Detection
potential
(vs. SCE)
Detection
limit Sensitivity
(µA
mM−1
)
Linear
range Ref.
GOx/Pt–Au/TiO2 NT pH= 7.3
PBS - 0.189 V 0.1 mM 0.08366 0-1.8
mM (Kang,
Q. et
al.,
2008)
TiO2/CNT/Pt/GOx pH= 7.2
PBS 0.38 V 5.7 µM 0.24 0.006-
1.5
mM
(Pang
et al.,
2009)
GE/CuO/GOx/Nafion pH = 7.4
PBS 0.54 V 1.37 µM 47.19 0.01-
10 mM (Umar
et al.,
2009)
CuFe2O4/rGO(30
wt%) pH = 7.4
PBS -0.2 V 0.1 µM 164.18 0.6-5.6
mM This
work
4.10.7 Interference study
Discrimination ability is one of the most significant factors for an enzyme-free
glucose sensor, therefore the CuFe2O4/rGO/GCE response attributed to the presence of
ascorbic acid and uric acid is determined by applying chronoamperometry and the data
shows no obvious current response with the addition of 0.1 mM AA and 0.1 mM UA
(Fig 4.29). Furthermore, the sensor performance to differentiate glucose from the other
sugars like sucrose and fructose was demonstrated. These sugars solution caused
negligible interference to the remarkable current responses of glucose at the
CuFe2O4/rGO/GCE.
Figure 4.29: Interference test of the sensor in 0.1 M phosphate buffer solution (pH 7.4) with 0.1
mM glucose and other interferes as indicated.
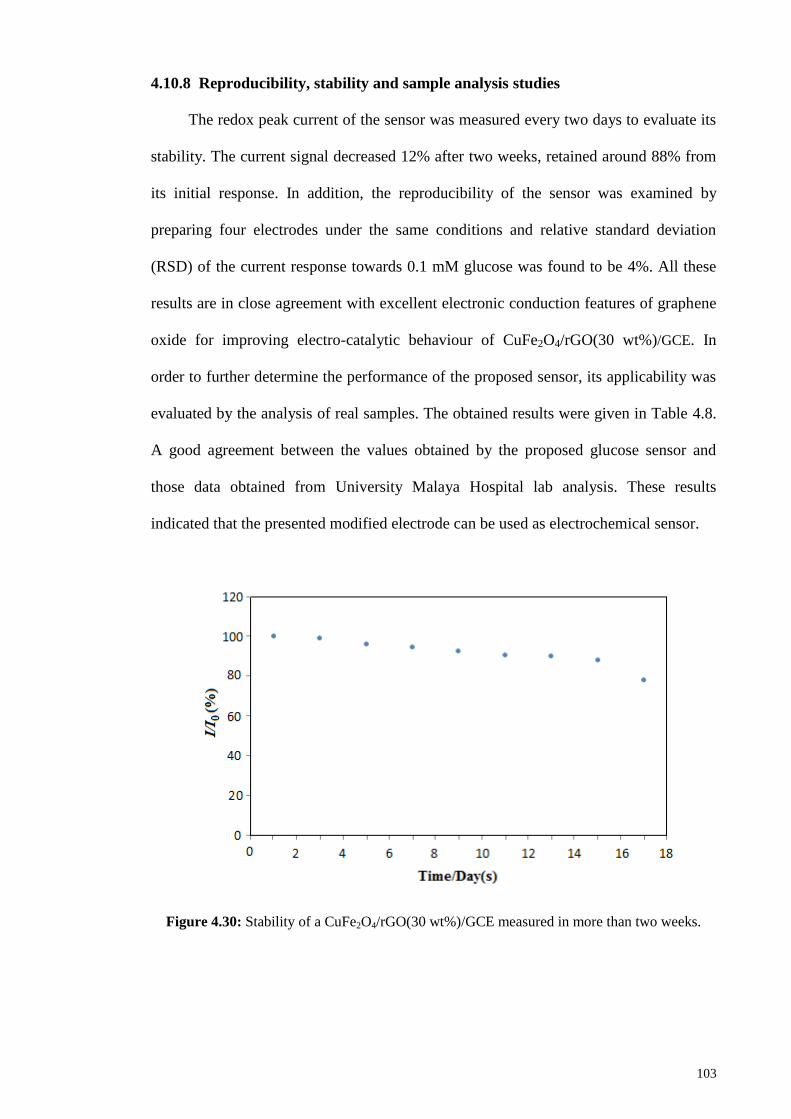
103
4.10.8 Reproducibility, stability and sample analysis studies
The redox peak current of the sensor was measured every two days to evaluate its
stability. The current signal decreased 12% after two weeks, retained around 88% from
its initial response. In addition, the reproducibility of the sensor was examined by
preparing four electrodes under the same conditions and relative standard deviation
(RSD) of the current response towards 0.1 mM glucose was found to be 4%. All these
results are in close agreement with excellent electronic conduction features of graphene
oxide for improving electro-catalytic behaviour of CuFe2O4/rGO(30 wt%)/GCE. In
order to further determine the performance of the proposed sensor, its applicability was
evaluated by the analysis of real samples. The obtained results were given in Table 4.8.
A good agreement between the values obtained by the proposed glucose sensor and
those data obtained from University Malaya Hospital lab analysis. These results
indicated that the presented modified electrode can be used as electrochemical sensor.
Figure 4.30: Stability of a CuFe2O4/rGO(30 wt%)/GCE measured in more than two weeks.
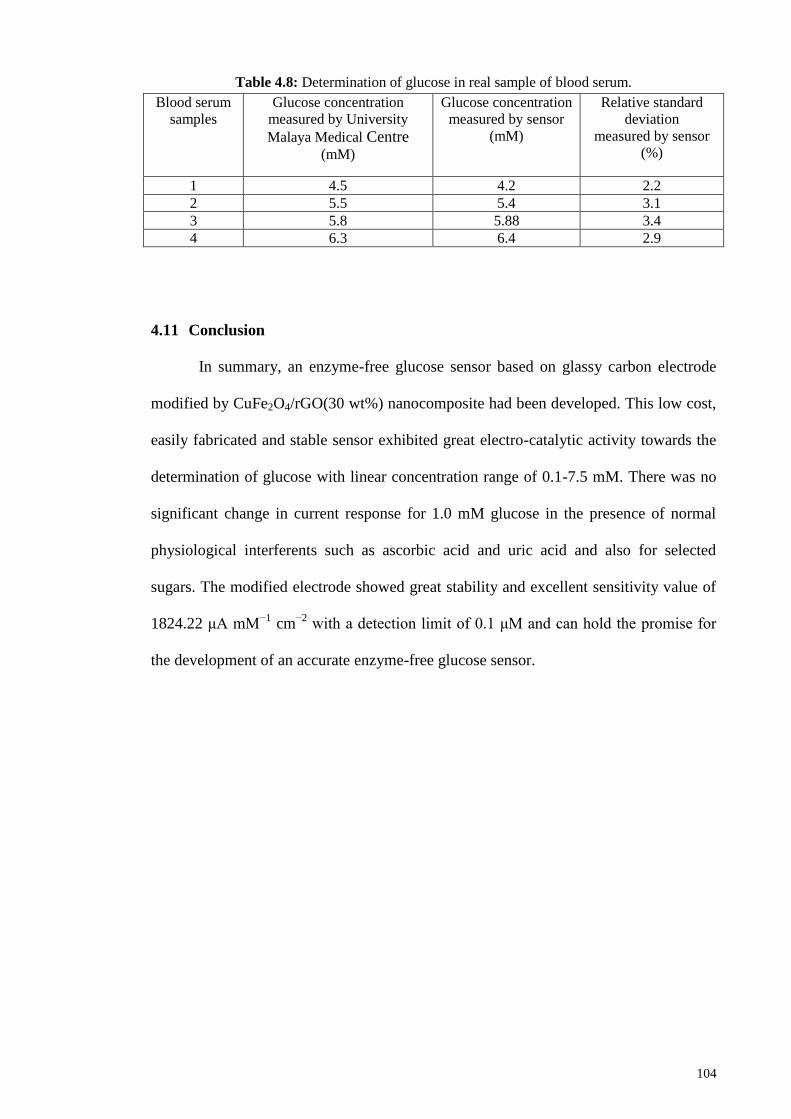
104
Table 4.8: Determination of glucose in real sample of blood serum.
Blood serum
samples
Glucose concentration
measured by University
Malaya Medical Centre
(mM)
Glucose concentration
measured by sensor
(mM)
Relative standard
deviation
measured by sensor
(%)
1 4.5 4.2 2.2
2 5.5 5.4 3.1
3 5.8 5.88 3.4
4 6.3 6.4 2.9
4.11 Conclusion
In summary, an enzyme-free glucose sensor based on glassy carbon electrode
modified by CuFe2O4/rGO(30 wt%) nanocomposite had been developed. This low cost,
easily fabricated and stable sensor exhibited great electro-catalytic activity towards the
determination of glucose with linear concentration range of 0.1-7.5 mM. There was no
significant change in current response for 1.0 mM glucose in the presence of normal
physiological interferents such as ascorbic acid and uric acid and also for selected
sugars. The modified electrode showed great stability and excellent sensitivity value of
1824.22 μA mM−1
cm−2
with a detection limit of 0.1 μM and can hold the promise for
the development of an accurate enzyme-free glucose sensor.
105
Part 4: Electrochemical sensing of glucose by reduced graphene oxide-zinc ferrite
4.12 Introduction
ZnFe2O4 magnetic nanoparticles/reduced graphene oxide nanosheets modified
glassy carbon (ZnFe2O4/rGO) as a novel system for the electrochemical glucose sensing
is reported here. Using a facile in situ hydrothermal route, the reduction of GO and the
formation of ZnFe2O4 nanoparticles happened at the same time to decorate the graphene
sheets by ZnFe2O4 nanoparticles. Characterization of nanocomposite by X-ray
diffraction (XRD) and transmission electron microscopy (TEM) clearly demonstrate the
successful attachment of ZnFe2O4 nanoparticles to graphene sheets.
4.13 Characterization of ZnFe2O4 and ZnFe2O4/rGO nanocomposite
4.13.1 Fourier transform infrared spectroscopy (FTIR)
Fourier transform infrared spectroscopy is a powerful technique for the
characterization of graphene based materials. GO, ZnFe2O4 nanoparticles and
ZnFe2O4/rGO nanocomposite were examined by FTIR. The peaks at 3410 cm-1
and
1743 cm-1
correspond to the stretching vibrations of O–H and C=O respectively, while
the vibration of carboxyl groups are found at 1620 cm-1
and 1278 cm-1
(Shen et al.,
2011). The obtained ZnFe2O4/rGO nanocomposite was also explored with FTIR. The
adsorption peak around 1570 cm-1
may be assigned to the stretching vibrations of the
unoxidized carbon backbone. Moreover the presence of absorption peak at 550 cm-1
can
be assigned to the stretching vibrations of the Fe–O bonds in tetrahedral positions
(Ramankutty & Sugunan, 2001). After the hydrothermal reaction, the most
characteristic peaks of GO disappeares which confirmed the presence of rGO in the
ZnFe2O4/rGO nanocomposite. Magnetic nanocomposites with different rGO contents
(10, 20 and 40 wt%) have also showed the similar peaks.
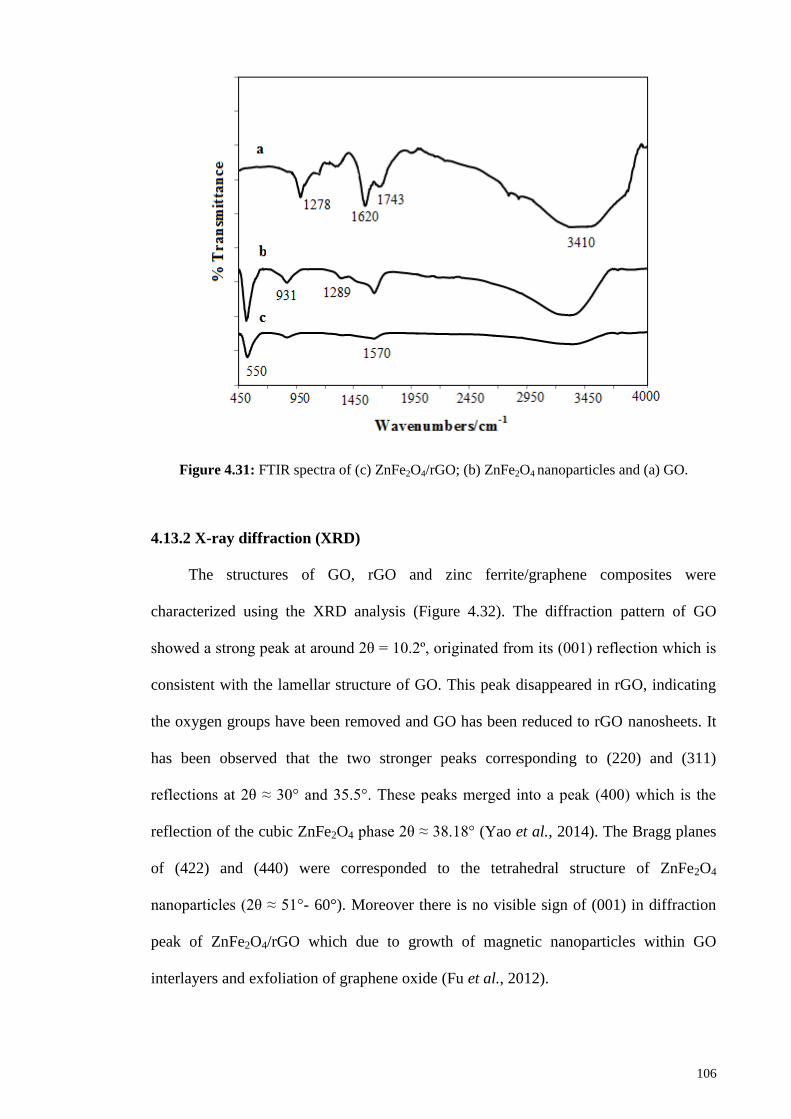
106
Figure 4.31: FTIR spectra of (c) ZnFe2O4/rGO; (b) ZnFe2O4 nanoparticles and (a) GO.
4.13.2 X-ray diffraction (XRD)
The structures of GO, rGO and zinc ferrite/graphene composites were
characterized using the XRD analysis (Figure 4.32). The diffraction pattern of GO
showed a strong peak at around 2θ = 10.2º, originated from its (001) reflection which is
consistent with the lamellar structure of GO. This peak disappeared in rGO, indicating
the oxygen groups have been removed and GO has been reduced to rGO nanosheets. It
has been observed that the two stronger peaks corresponding to (220) and (311)
reflections at 2θ ≈ 30° and 35.5°. These peaks merged into a peak (400) which is the
reflection of the cubic ZnFe2O4 phase 2θ ≈ 38.18° (Yao et al., 2014). The Bragg planes
of (422) and (440) were corresponded to the tetrahedral structure of ZnFe2O4
nanoparticles (2θ ≈ 51°- 60°). Moreover there is no visible sign of (001) in diffraction
peak of ZnFe2O4/rGO which due to growth of magnetic nanoparticles within GO
interlayers and exfoliation of graphene oxide (Fu et al., 2012).
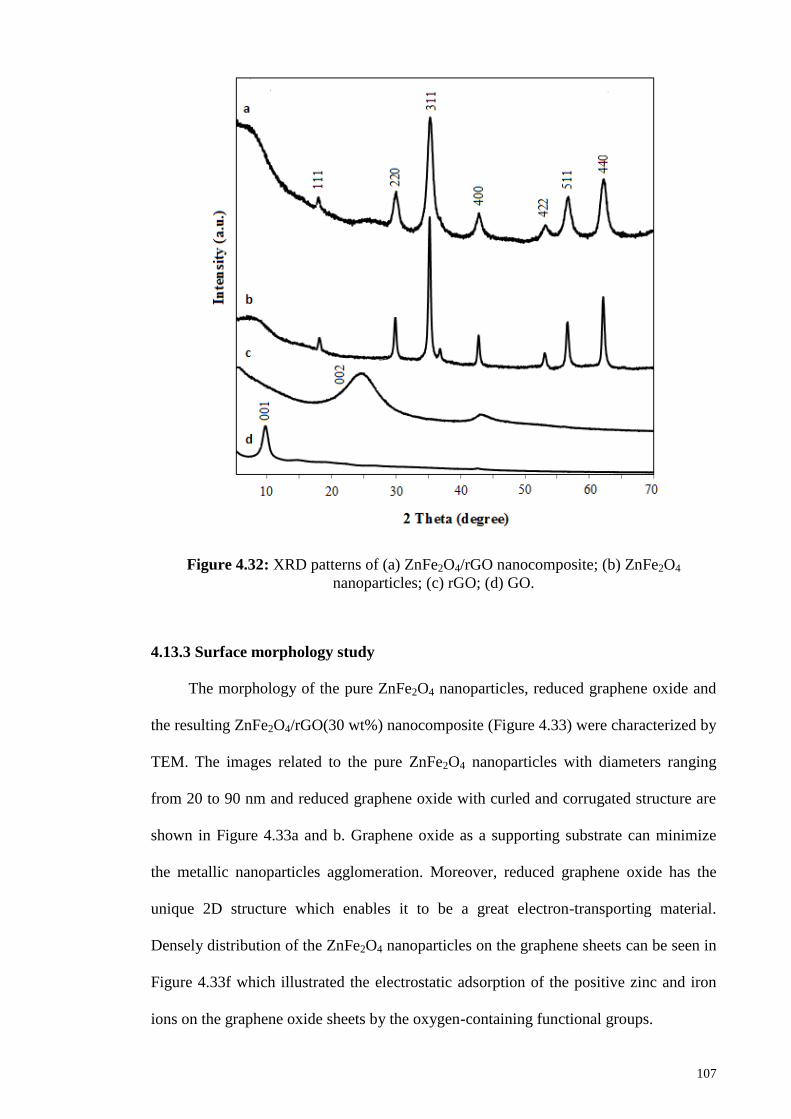
107
Figure 4.32: XRD patterns of (a) ZnFe2O4/rGO nanocomposite; (b) ZnFe2O4
nanoparticles; (c) rGO; (d) GO.
4.13.3 Surface morphology study
The morphology of the pure ZnFe2O4 nanoparticles, reduced graphene oxide and
the resulting ZnFe2O4/rGO(30 wt%) nanocomposite (Figure 4.33) were characterized by
TEM. The images related to the pure ZnFe2O4 nanoparticles with diameters ranging
from 20 to 90 nm and reduced graphene oxide with curled and corrugated structure are
shown in Figure 4.33a and b. Graphene oxide as a supporting substrate can minimize
the metallic nanoparticles agglomeration. Moreover, reduced graphene oxide has the
unique 2D structure which enables it to be a great electron-transporting material.
Densely distribution of the ZnFe2O4 nanoparticles on the graphene sheets can be seen in
Figure 4.33f which illustrated the electrostatic adsorption of the positive zinc and iron
ions on the graphene oxide sheets by the oxygen-containing functional groups.

108
Figure 4.33: The SEM images of (a) ZnFe2O4 and TEM images of (b) ZnFe2O4; (c and d)
reduced graphene oxide at different resolutions; (e and f) ZnFe2O4/rGO nanocomposite at
different resolutions.
4.13.4 Cyclic voltammetry studies
The electro-catalytic activities of the modified GCEs were investigated to detect
their responses to the oxidation of glucose in 0.1 M PBS solution in the presence of 2.0
mM glucose with scanning rate of 10 mV s-1
(Fig 4.34). There are no obvious redox
peaks in given CV responses of the bare GCE and rGO/GCE, indicating poor redox
activity of the selected electrodes. A strong peak appeared after modification of the
GCE with ZnFe2O4 nanoparticles confirms great glucose catalytical ability of this
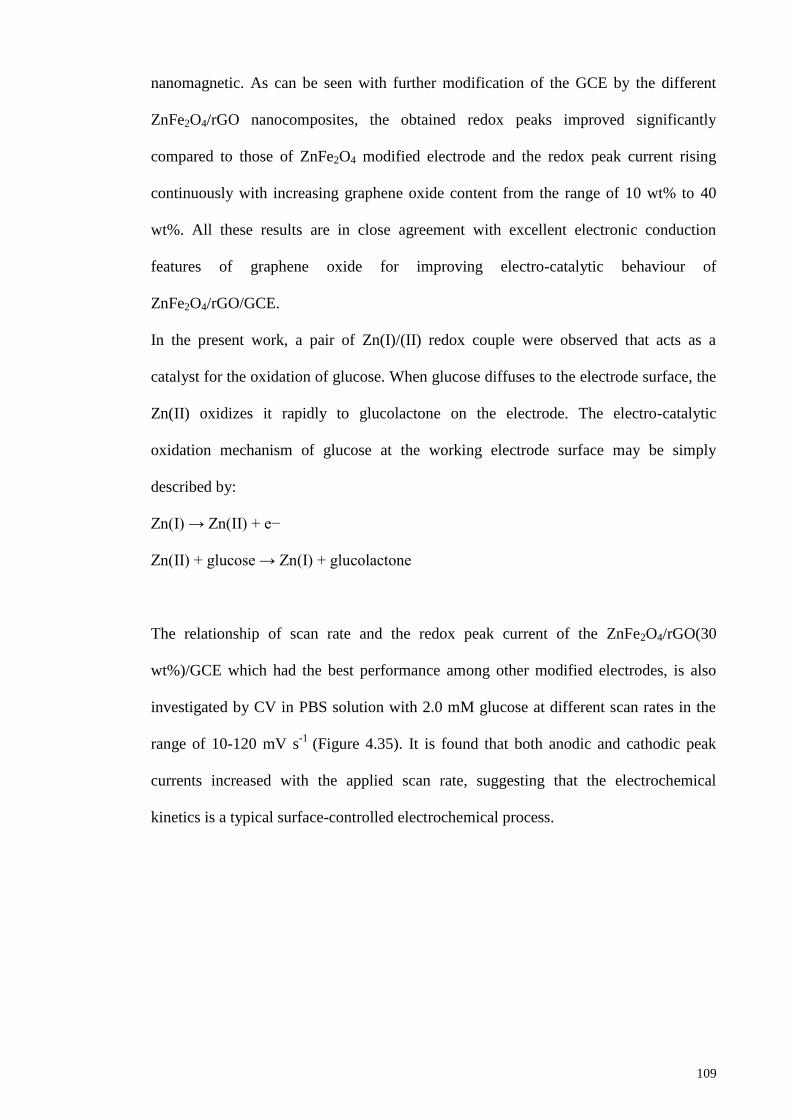
109
nanomagnetic. As can be seen with further modification of the GCE by the different
ZnFe2O4/rGO nanocomposites, the obtained redox peaks improved significantly
compared to those of ZnFe2O4 modified electrode and the redox peak current rising
continuously with increasing graphene oxide content from the range of 10 wt% to 40
wt%. All these results are in close agreement with excellent electronic conduction
features of graphene oxide for improving electro-catalytic behaviour of
ZnFe2O4/rGO/GCE.
In the present work, a pair of Zn(I)/(II) redox couple were observed that acts as a
catalyst for the oxidation of glucose. When glucose diffuses to the electrode surface, the
Zn(II) oxidizes it rapidly to glucolactone on the electrode. The electro-catalytic
oxidation mechanism of glucose at the working electrode surface may be simply
described by:
Zn(I) → Zn(II) + e−
Zn(II) + glucose → Zn(I) + glucolactone
The relationship of scan rate and the redox peak current of the ZnFe2O4/rGO(30
wt%)/GCE which had the best performance among other modified electrodes, is also
investigated by CV in PBS solution with 2.0 mM glucose at different scan rates in the
range of 10-120 mV s-1
(Figure 4.35). It is found that both anodic and cathodic peak
currents increased with the applied scan rate, suggesting that the electrochemical
kinetics is a typical surface-controlled electrochemical process.
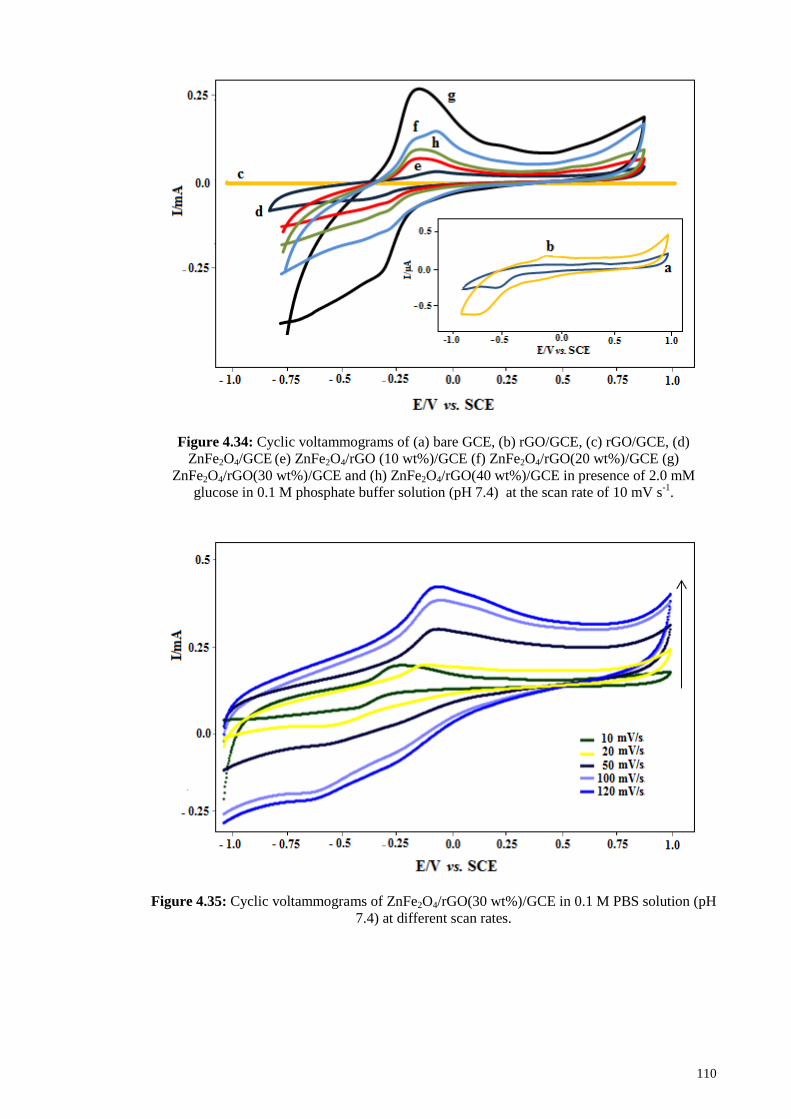
110
Figure 4.34: Cyclic voltammograms of (a) bare GCE, (b) rGO/GCE, (c) rGO/GCE, (d)
ZnFe2O4/GCE (e) ZnFe2O4/rGO (10 wt%)/GCE (f) ZnFe2O4/rGO(20 wt%)/GCE (g)
ZnFe2O4/rGO(30 wt%)/GCE and (h) ZnFe2O4/rGO(40 wt%)/GCE in presence of 2.0 mM
glucose in 0.1 M phosphate buffer solution (pH 7.4) at the scan rate of 10 mV s-1
.
Figure 4.35: Cyclic voltammograms of ZnFe2O4/rGO(30 wt%)/GCE in 0.1 M PBS solution (pH
7.4) at different scan rates.
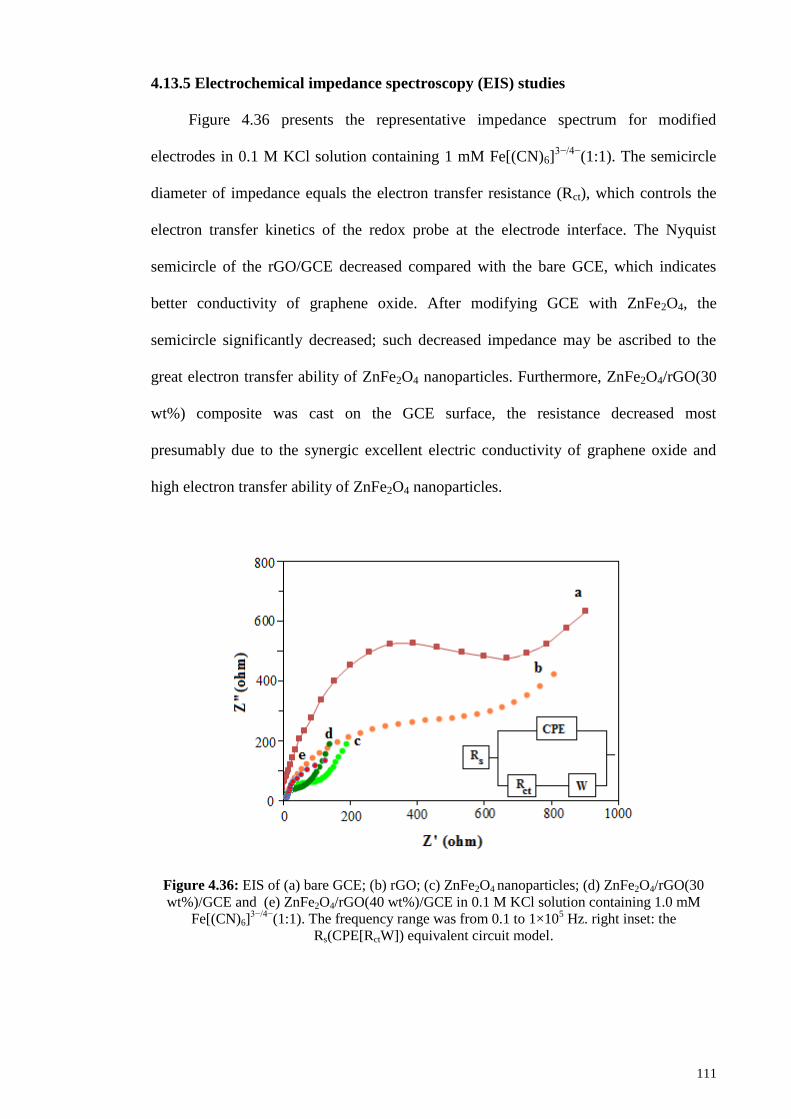
111
4.13.5 Electrochemical impedance spectroscopy (EIS) studies
Figure 4.36 presents the representative impedance spectrum for modified
electrodes in 0.1 M KCl solution containing 1 mM Fe[(CN)6]3−/4−
(1:1). The semicircle
diameter of impedance equals the electron transfer resistance (Rct), which controls the
electron transfer kinetics of the redox probe at the electrode interface. The Nyquist
semicircle of the rGO/GCE decreased compared with the bare GCE, which indicates
better conductivity of graphene oxide. After modifying GCE with ZnFe2O4, the
semicircle significantly decreased; such decreased impedance may be ascribed to the
great electron transfer ability of ZnFe2O4 nanoparticles. Furthermore, ZnFe2O4/rGO(30
wt%) composite was cast on the GCE surface, the resistance decreased most
presumably due to the synergic excellent electric conductivity of graphene oxide and
high electron transfer ability of ZnFe2O4 nanoparticles.
Figure 4.36: EIS of (a) bare GCE; (b) rGO; (c) ZnFe2O4 nanoparticles; (d) ZnFe2O4/rGO(30
wt%)/GCE and (e) ZnFe2O4/rGO(40 wt%)/GCE in 0.1 M KCl solution containing 1.0 mM
Fe[(CN)6]3−/4−
(1:1). The frequency range was from 0.1 to 1×10⁵ Hz. right inset: the
Rs(CPE[RctW]) equivalent circuit model.
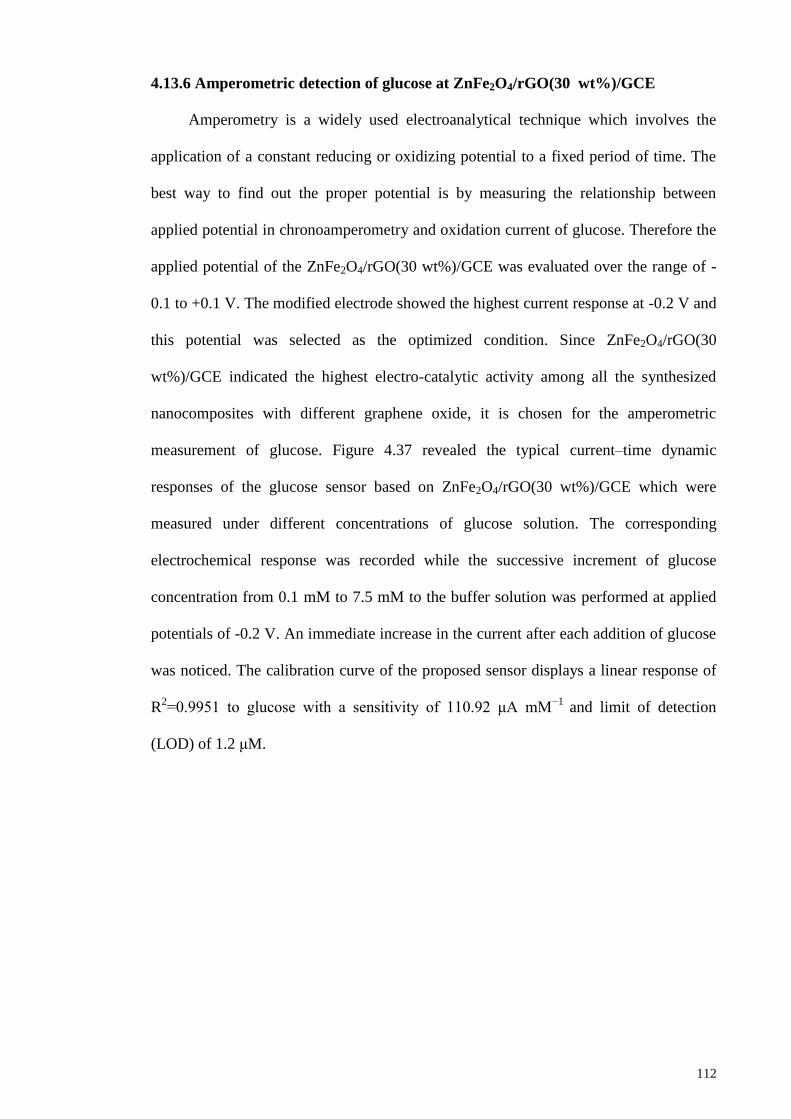
112
4.13.6 Amperometric detection of glucose at ZnFe2O4/rGO(30 wt%)/GCE
Amperometry is a widely used electroanalytical technique which involves the
application of a constant reducing or oxidizing potential to a fixed period of time. The
best way to find out the proper potential is by measuring the relationship between
applied potential in chronoamperometry and oxidation current of glucose. Therefore the
applied potential of the ZnFe2O4/rGO(30 wt%)/GCE was evaluated over the range of -
0.1 to +0.1 V. The modified electrode showed the highest current response at -0.2 V and
this potential was selected as the optimized condition. Since ZnFe2O4/rGO(30
wt%)/GCE indicated the highest electro-catalytic activity among all the synthesized
nanocomposites with different graphene oxide, it is chosen for the amperometric
measurement of glucose. Figure 4.37 revealed the typical current–time dynamic
responses of the glucose sensor based on ZnFe2O4/rGO(30 wt%)/GCE which were
measured under different concentrations of glucose solution. The corresponding
electrochemical response was recorded while the successive increment of glucose
concentration from 0.1 mM to 7.5 mM to the buffer solution was performed at applied
potentials of -0.2 V. An immediate increase in the current after each addition of glucose
was noticed. The calibration curve of the proposed sensor displays a linear response of
R2=0.9951 to glucose with a sensitivity of 110.92 μA mM
−1 and limit of detection
(LOD) of 1.2 μM.
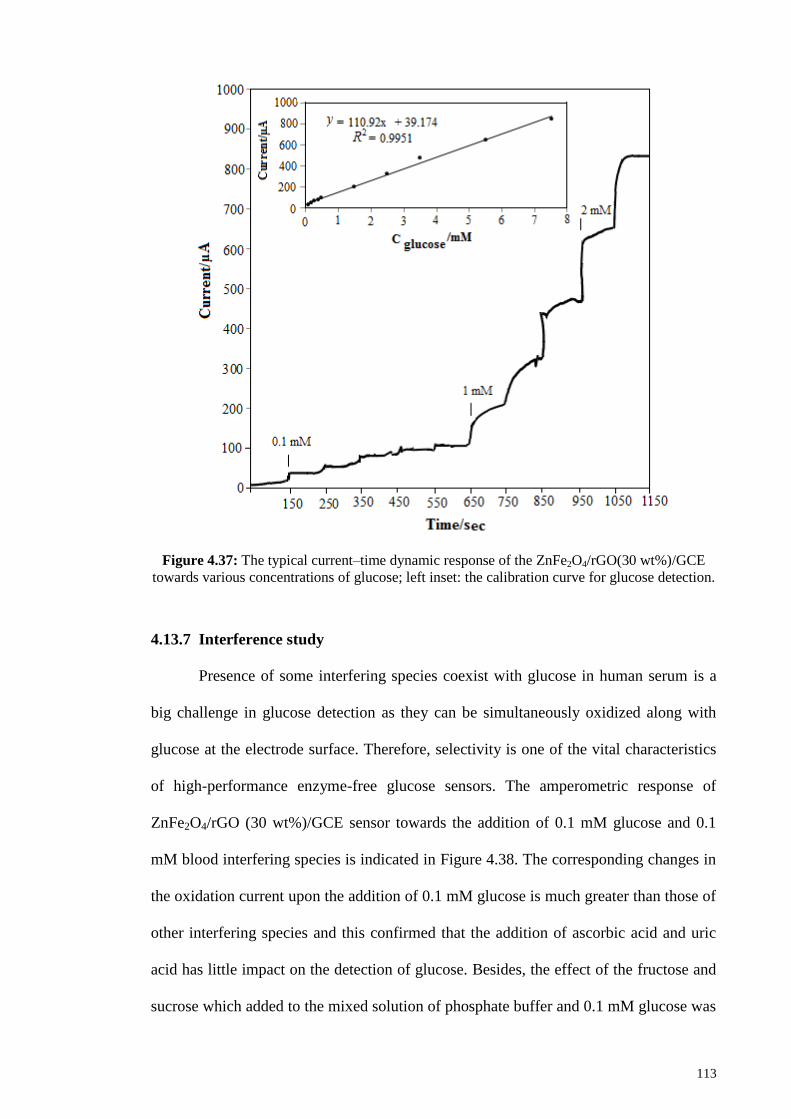
113
Figure 4.37: The typical current–time dynamic response of the ZnFe2O4/rGO(30 wt%)/GCE
towards various concentrations of glucose; left inset: the calibration curve for glucose detection.
4.13.7 Interference study
Presence of some interfering species coexist with glucose in human serum is a
big challenge in glucose detection as they can be simultaneously oxidized along with
glucose at the electrode surface. Therefore, selectivity is one of the vital characteristics
of high-performance enzyme-free glucose sensors. The amperometric response of
ZnFe2O4/rGO (30 wt%)/GCE sensor towards the addition of 0.1 mM glucose and 0.1
mM blood interfering species is indicated in Figure 4.38. The corresponding changes in
the oxidation current upon the addition of 0.1 mM glucose is much greater than those of
other interfering species and this confirmed that the addition of ascorbic acid and uric
acid has little impact on the detection of glucose. Besides, the effect of the fructose and
sucrose which added to the mixed solution of phosphate buffer and 0.1 mM glucose was
114
also tested and their current peak is found to remain almost unchanged. The sensitivity
and detection limit at this modified electrode are comparable and better than those
obtained by using other modified electrodes based on metals or metal oxide
nanoparticles (Table 4.9).
Figure 4.38: Interference test of the sensor in 0.1 M phosphate buffer solution (pH 7.4) with 0.1
mM glucose and other interferes as indicated.
Table 4.9: Comparison of the present ZnFe2O4/rGO (30 wt%) nanocomposite enzyme-free
glucose sensor with other Zn based glucose sensors.
Electrode Detection
potential
(vs. SCE)
Detection
limit Sensitivity
(µA mM−1
) Linear
range Ref.
ZnO nanotubes - 0.8 V 1.0 mM 21.7 0.05-12
mM (Kong, T. et
al., 2009)
ZnO nanonails - 5.0 µM 24.6 0.1-7.1
mM (Umar et al.,
2008)
ZnO hollow
nanospheres 0.8 V 1.0 µM 65.82 0.005-
13.15 mM (Fang et al.,
2011)
ZnFe2O4/rGO(30
wt%) -0.2 V 1.2 µM 110.92 0.1-7.5
mM This work
4.13.8 Reproducibility, stability and real sample analysis studies
Reproducibility and stability of the electrode are important parameters to evaluate
the performance of an electrochemical sensor. To study the reproducibility of the
sensor, four electrodes were prepared under the same conditions and relative standard
deviation (RSD) of the current response towards 0.1 mM glucose was found to be 4.1%.
Moreover the stability of ZnFe2O4/rGO(30 wt%) nanocomposite was investigated by
periodically recording its current response to 2.0 mM glucose (Figure 4.39). The

115
performance of modified electrode was investigated every two days and the sensor
retains around 88% of initial response after two weeks (I0 and I are the current response
of fresh sensor and the current response after storage respectively.). The good stability
could be attributed to the great composites compatibility. The overall performance
showed that this sensor displayed a good superiority in terms of sensitivity, selectivity
and linear calibration. In order to verify the reliability of the proposed sensor,
ZnFe2O4/rGO(30 wt%) nanocomposite was applied to the determination of glucose in
real sample of blood serum. 0.2 ml of the serum sample was added to 10 ml of 0.1 mM
phosphate buffer solution (pH=7.4) as testing solution for amperometric measurement.
The analytical results were shown in Table 4.10, implied that this electrode has the
sensing ability to be used to test on real human serum samples.
Figure 4.39: Stability of ZnFe2O4/rGO(30 wt%)/GCE measured in more than two weeks.
Table 4.10: Determination of glucose in real sample of blood serum.
Blood serum samples Glucose concentration
measured by
University Malaya
Medical Centre
(mM)
Glucose concentration
measured by sensor
(mM)
Relative standard
deviation
measured by sensor
(%)
1 5.56 5.82 4.32
2 8.01 8.24 4.22
3 7.53 7.85 4.81
4 9.60 10.22 5.12
116
4.14 Conclusion
In this study, the glucose sensor was fabricated by hydrothermally formation of
ZnFe2O4 nanoparticles into graphene sheets. GO prevented the aggregation of ZnFe2O4
nanoparticles without changing its electrical properties and also improved the electron
transfer. The synthesized ZnFe2O4/rGO nanocomposite was characterized by X-ray
diffraction and also characterized by transmission electron microscopy and their results
are consistent to one another. The fabricated electrode ZnFe2O4/rGO(30 wt%) displayed
excellent catalytic property to glucose in the range of the glucose concentrations from
1.0×10⁻²
to 7.5×10⁻²
M with sensitivity of 110.92 μA mM-1
. Moreover, the enzyme-free
glucose sensor showed good repeatability, reproducibility, selectivity and stability.
117
CHAPTER 5 : SUMMARY & FUTURE WORK
The goal for this work was to design high sensitive and selective enzyme-free
glucose sensors having the potential for glucose level detection. To address this, four
glucose sensors were proposed based on combination of magnetic nanoparticles,
polypyrrole and graphene oxide. Although many efforts have been tried for the
development of enzyme-free glucose sensors using various nanostructures of metal,
metal alloys, metal oxides and carbon nanotubes which displayed fast response, high
sensitivity, lower detection limit, better stability and lower cost, these sensors need to
improve in selectivity and using novel nanoparticles can realize this objective.
Irreversible aggregation of the magnetic nanoparticles which can affect the magnetic
properties was minimized by steric stabilization. This property made MNPs suitable to
be used as the sensing material. Polypyrrole and graphene oxide were candidates for
magnetic nanoparticles coating in this thesis and these two materials had improved the
surface area and also enhanced the stability via ionic interactions.
In this work, glucose level was determined by four proposed modified electrodes.
CuFe2O4 and ZnFe2O4 nanoparticles as selected magnetic nanoparticles showed good
detection ability towards glucose concentrations. Role of graphene oxide in improving
the sensing performance of selected nanoparticles was tested. The enhanced electro-
catalytic ability of CuFe2O4/rGO and ZnFe2O4/rGO modified electrode compared to
those of only magnetic nanoparticles modified electrode is considered to be the result of
a large surface area and high conductivity as well as fast electron transfer provided by
graphene sheets, confirming the important role of graphene sheets. The electro-activity
of CuFe2O4 and ZnFe2O4 nanoparticles modified by PPy were investigated and the
finding showed the considerable improvement in glucose sensing after modification.
These modified electrode were stable enough in electrochemical measurements which
118
possibly due to supporting matrix of PPy. All four prepared enzyme-free glucose
sensors showed good repeatability, reproducibility and selectivity towards glucose
detection. There were no significant changes of current response during the detection of
1.0 mM glucose in the presence of normal physiological interferents such as ascorbic
acid and uric acid and other selected sugars. All the fabricated sensors were further
evaluated their performance in the determination of glucose in real samples where the
results indicated the low RSD values which confirmed high possibility to use the
presented magnetic nanocomposites in future for clinical diagnostics. Compared to
graphene sheets, PPy revealed better influence electrical conductivity. CuFe2O4/PPy
nanoparticles displayed the highest glucose sensing performance among the other
fabricated sensors with a low detection limit of 0.1 μM and excellent sensitivity value of
164.18 μA mM-1
with linear concentration range of 0.1-7.5 mM.
Based on this work, future development should concentrate on further applications
of these magnetic nanoparticles in other diagnostic purposes. The conjugation of
magnetic nanoparticles with electrochemical sensing systems promises large evolution
in actual electro-analysis method.
119
REFERENCES
Aillon, K. L., Xie, Y., El-Gendy, N., Berkland, C. J., & Forrest, M. L. (2009). Effects of
nanomaterial physicochemical properties on in vivo toxicity. Advanced Drug
Delivery Reviews, 61(6): 457-466.
Association, A. D. (2014). Standards of medical care in diabetes. Diabetes care, 37(1):
14-80.
Baba, A., Taranekar, P., Ponnapati, R. R., Knoll, W., & Advincula, R. C. (2010).
Electrochemical surface plasmon resonance and waveguide-enhanced glucose
biosensing with N-alkylaminated polypyrrole/glucose oxidase multilayers. ACS
Applied Materials & Interfaces, 2(8): 2347-2354.
Baby, T. T., & Ramaprabhu, S. (2010). SiO2 coated Fe3O4 magnetic nanoparticle
dispersed multiwalled carbon nanotubes based amperometric glucose biosensor.
Talanta, 80(5): 2016-2022.
Bai, H., Li, C., Wang, X., & Shi, G. (2010). A pH-sensitive graphene oxide composite
hydrogel. Chemical Communications, 46(14): 2376-2378.
Bai, Z., Yang, L., Guo, Y., Zheng, Z., Hu, C., & Xu, P. 2011. High-efficiency palladium
catalysts supported on ppy-modified C60 for formic acid oxidation. Chemical
Communications, 47(6): 1752-1754.
Bakker, E., & Qin, Y. (2006). Electrochemical sensors. Analytical Chemistry, 78(12):
3965-3984.
Bakker, E. (2004). Electrochemical sensors. Analytical Chemistry, 76(12): 3285-3298.
Balamurugan, B., Sellmyer, D. J., Hadjipanayis, G., & Skomski, R. (2012). Prospects
for nanoparticle-based permanent magnets. Scripta Materialia, 67(6): 542-547.
Balandin, A. A., Ghosh, S., Bao, W., Calizo, I., Teweldebrhan, D., Miao, F., & Lau, C.
N. (2008). Superior thermal conductivity of single-layer graphene. Nano Letters,
8(3): 902-907.
Bamzai, K., Kour, G., Kaur, B., Arora, M., & Pant, R. (2013). Infrared spectroscopic
and electron paramagnetic resonance studies on Dy substituted magnesium ferrite.
Journal of Magnetism and Magnetic Materials, 345(48): 255-260.
Bao, S. J., Li, C. M., Zang, J. F., Cui, X. Q., Qiao, Y., & Guo, J. (2008). New
nanostructured TiO2 for direct electrochemistry and glucose sensor applications.
Advanced Functional Materials, 18(4): 591-599.
Bárcena, C., Sra, A. K., Chaubey, G. S., Khemtong, C., Liu, J. P., & Gao, J. (2008).
Zinc ferrite nanoparticles as MRI contrast agents. Chemical Communications
11(19): 2224-2226.
120
Barroso-Bujans, F., Cerveny, S., Verdejo, R., del Val, J., Alberdi, J., Alegría, A., &
Colmenero, J. (2010). Permanent adsorption of organic solvents in graphite oxide
and its effect on the thermal exfoliation. Carbon, 48(4): 1079-1087.
Batchelor, C., Du, Y., Wildgoose, G. G., & Compton, R. G. (2008). The use of copper
(II) oxide nanorod bundles for the non-enzymatic voltammetric sensing of
carbohydrates and hydrogen peroxide. Sensors and Actuators B: Chemical,
135(1): 230-235.
Baur, J., Gondran, C., Holzinger, M., Defrancq, E., Perrot, H., & Cosnier, S. (2009).
Label-free femtomolar detection of target DNA by impedimetric DNA sensor
based on poly (pyrrole-nitrilotriacetic acid) film. Analytical Chemistry, 82(3):
1066-1072.
Berg, J. M., Tymoczko, J. L., & Stryer, L. (2002). Glycolysis and gluconeogenesis.
Biochemistry. New York: W H Freeman.
Blinova, N. V., Stejskal, J., Trchová, M., Prokeš, J., & Omastová, M. (2007).
Polyaniline and polypyrrole: A comparative study of the preparation. European
Polymer Journal, 43(6): 2331-2341.
Bode, B. W. (2007). The accuracy and interferences in self-monitoring of blood
glucose. US Endocrinology, 2(4): 46-48.
Brady, S., Diamond, D., & Lau, K.-T. (2005). Inherently conducting polymer modified
polyurethane smart foam for pressure sensing. Sensors and Actuators A: Physical,
119(2): 398-404.
Bray, G. A. (2010). Fructose: pure, white, and deadly? Fructose, by any other name, is a
health hazard. Journal of Diabetes Science and Technology, 4(4): 1003-1007.
Bredas, J. L., & Street, G. B. (1985). Polarons, bipolarons, and solitons in conducting
polymers. Accounts of Chemical Research, 18(10): 309-315.
Cadierno, V., Gimeno, J., & Nebra, N. (2007). One‐Pot Three‐Component Catalytic
Synthesis of Fully Substituted Pyrroles from Readily Available Propargylic
Alcohols, 1, 3‐Dicarbonyl Compounds and Primary Amines. Chemistry-A
European Journal, 13(35): 9973-9981.
Cash, K. J., & Clark, H. A. (2010). Nanosensors and nanomaterials for monitoring
glucose in diabetes. Trends in Molecular Medicine, 16(12): 584-593.
Chatterjee, K., Sarkar, S., Rao, K. J., & Paria, S. (2014). Core/shell nanoparticles in
biomedical applications. Advances in Colloid and Interface Science, 209(45): 8-
39.
Chernyshov, A. S., Yuan, H., Valcu, B., Ajan, A., & Acharya, B. R. (2013). Recording
media with multiple bi-layers of heatsink layer and amorphous layer for energy
assisted magnetic recording system and methods for fabricating the same: Google
Patents. US8605555 B1.
121
Chung, C., Kim, Y. K., Shin, D., Ryoo, S.-R., Hong, B. H., & Min, D. H. (2013).
Biomedical applications of graphene and graphene oxide. Accounts of Chemical
Research, 46(10): 2211-2224.
Correa‐Duarte, M. A., Sobal, N., Liz‐Marzán, L. M., & Giersig, M. (2004). Linear
Assemblies of Silica‐Coated Gold Nanoparticles Using Carbon Nanotubes as
Templates. Advanced Materials, 16(23‐24): 2179-2184.
Cosnier, S. (2003). Biosensors based on electropolymerized films: new trends.
Analytical and Bioanalytical Chemistry, 377(3): 507-520.
Covaliu, C. I., Jitaru, I., Paraschiv, G., Vasile, E., Biriş, S.-Ş., Diamandescu, L., Iovu,
H. (2013). Core–shell hybrid nanomaterials based on CoFe2O4 particles coated
with PVP or PEG biopolymers for applications in biomedicine. Powder
Technology, 237(15): 415-426.
Dai, L. (2004). Intelligent macromolecules for smart devices: from materials synthesis
to device applications. Springer Science & Business Media.
Daniel, M. C., & Astruc, D. (2004). Gold nanoparticles: assembly, supramolecular
chemistry, quantum-size-related properties, and applications toward biology,
catalysis, and nanotechnology. Chemical Reviews, 104(1): 293-346.
Darshane, S. L., Deshmukh, R. G., Suryavanshi, S. S., & Mulla, I. S. (2008). Gas‐Sensing Properties of Zinc Ferrite Nanoparticles Synthesized by the Molten‐Salt
Route. Journal of the American Ceramic Society, 91(8): 2724-2726.
Eda, G., Unalan, H. E., Rupesinghe, N., Amaratunga, G. A., & Chhowalla, M. (2008).
Field emission from graphene based composite thin films. Applied Physics
Letters, 93(23): 233502.
Fang, B., Zhang, C., Wang, G., Wang, M., & Ji, Y. (2011). A glucose oxidase
immobilization platform for glucose biosensor using ZnO hollow nanospheres.
Sensors and Actuators B: Chemical, 155(1): 304-310.
Farrell, S. T., & Breslin, C. B. (2004). Oxidation and photo-induced oxidation of
glucose at a polyaniline film modified by copper particles. Electrochimica Acta,
49(25): 4497-4503.
Fenelon, A. M., & Breslin, C. B. (2003). The electropolymerization of pyrrole at a CuNi
electrode: corrosion protection properties. Corrosion Science, 45(12): 2837-2850.
Fox, R. C., Nguyen, L. T., Henshaw, L. R., & Yu, L. (2013). Effects of Size and
Concentration of Gold Nanoparticles on Diffusion Coefficient of Redox Species
Fe (CN) 64−
. ECS Electrochemistry Letters, 2(10): 40-42.
Franco, V., Blázquez, J., Ingale, B., & Conde, A. (2012). The magnetocaloric effect and
magnetic refrigeration near room temperature: materials and models. Materials
Research, 42(1): 305-342.
122
Fu, Y., Chen, H., Sun, X., & Wang, X. (2012). Graphene‐supported nickel ferrite: A
magnetically separable photocatalyst with high activity under visible light. AIChE
Journal, 58(11): 3298-3305.
Fumioshi Ishii, A. T., Shunichi Noro. (1984). Magnetic Microcapsules for in Vitro
Testing as Carrier for Intravascular Administration of Anticancer Drugs:
Preparation and Physicochemical Properties. Chemical and Pharmaceutical
Bulletin, 32(2): 678-684.
Fürjes, Ádám, M., Dücső, C., Zettner, J., & Bársony, I. (2005). Thermal effects by the
sensitive coating of calorimetric gas sensors. Sensors and Actuators B: Chemical,
111(112): 96-101.
Gaffet, E. (2011). Nanomaterials: a review of the definitions, applications, health
effects. How to implement secure development Nanomat\'eriaux: une revue des
d\'efinitions, des applications, des effets sanitaires et des moyens\a mettre en
oeuvre pour un d\'eveloppement s\'ecuris\'e. arXiv preprint arXiv:1106.2206.
Gao, Y., Li, Y., Zhang, L., Huang, H., Hu, J., Shah, S. M., & Su, X. (2012). Adsorption
and removal of tetracycline antibiotics from aqueous solution by graphene oxide.
Journal of Colloid and Interface Science, 368(1), 540-546.
Geim, A. K., & Novoselov, K. S. (2007). The rise of graphene. Nature Materials, 6(3):
183-191.
Ginsberg, B. H. (2009). Factors affecting blood glucose monitoring: sources of errors in
measurement. Journal of Diabetes Science and Technology, 3(4): 903-913.
Goldstein, J., Newbury, D. E., Echlin, P., Joy, D. C., Romig Jr, A. D., Lyman, C. E., &
Lifshin, E. (2012). Scanning electron microscopy and X-ray microanalysis: a text
for biologists, materials scientists, and geologists. Springer Science & Business
Media.
Gomez-Lopera, S. A., Plaza, R. C., & Delgado, A. V. (2001). Synthesis and
Characterization of Spherical Magnetite/Biodegradable Polymer Composite
Particles. Journal of Colloid and Interface Science, 240(1): 40-47.
Gründler, P. (2007). Mass-Sensitive Sensors. Chemical Sensors: An Introduction for
Scientists and Engineers. Springer.
Gul, I., Ahmed, W., & Maqsood, A. (2008). Electrical and magnetic characterization of
nanocrystalline Ni–Zn ferrite synthesis by co-precipitation route. Journal of
Magnetism and Magnetic Materials, 320(3): 270-275.
Guo, Y., Zhang, Y., Liu, H., Lai, S.-W., Li, Y., Li, Y., Zhu, D. (2009). Assembled
organic/inorganic p−n junction interface and photovoltaic cell on a single
nanowire. The Journal of Physical Chemistry Letters, 1(1): 327-330.
Gupta, D., Dutta, D., Kumar, M., Barman, P., Sarkar, C., Basu, S., & Hazra, S. (2014).
A low temperature hydrogen sensor based on palladium nanoparticles. Sensors
and Actuators B: Chemical, 196(68): 215-222.
123
Haetge, J., Suchomski, C., & Brezesinski, T. (2010). Ordered mesoporous MFe2O4 (M=
Co, Cu, Mg, Ni, Zn) thin films with nanocrystalline walls, uniform 16 nm
diameter pores and high thermal stability: Template-directed synthesis and
characterization of redox active trevorite. Inorganic Chemistry, 49(24): 11619-
11626.
Hankare, P., Jadhav, S., Sankpal, U., Patil, R., Sasikala, R., & Mulla, I. (2009). Gas
sensing properties of magnesium ferrite prepared by co-precipitation method.
Journal of Alloys and Compounds, 488(1): 270-272.
Huang, J., Dong, Z., Li, Y., Li, J., Wang, J., Yang, H., Li, R. (2013). High performance
non-enzymatic glucose biosensor based on copper nanowires–carbon nanotubes
hybrid for intracellular glucose study. Sensors and Actuators B: Chemical,
182(46): 618-624.
Hurst, S. J., Payne, E. K., Qin, L., & Mirkin, C. A. (2006). Multisegmented one‐dimensional nanorods prepared by hard‐template synthetic methods. Angewandte
Chemie International Edition, 45(17): 2672-2692.
Hyeon, T. (2003). Chemical synthesis of magnetic nanoparticles. Chemical
Communications, 100(8): 927-934.
Ikenaga, N. O., Ohgaito, Y., Matsushima, H., & Suzuki, T. (2004). Preparation of zinc
ferrite in the presence of carbon material and its application to hot-gas cleaning.
Fuel, 83(6): 661-669.
Indira, T., & Lakshmi, P. (2010). Magnetic nanoparticles—a review. Int. J. Pharm. Sci.
Nanotechnol, 3(3): 1035-1042.
Inzelt, G. (2012). Chemical and electrochemical syntheses of conducting polymers.
Conducting Polymers. Springer.
Janata, J. (1992). Chemical sensors. Analytical Chemistry, 64(12): 196-219.
Janata, J. (2001). Peer Reviewed: Centennial Retrospective on Chemical Sensors.
Analytical Chemistry, 73(5): 150 -153.
Janata, J. (2010). Principles of chemical sensors. Springer Science & Business Media.
Janata, J. (2002). Electrochemical Sensors and their impedances: a tutorial. Critical
Reviews In Analytical Chemistry, 32(2): 109-120.
Jiang, Zheng, Hong, R., Deng, S., Guo, L., Hu, R., & Liu, G. (2014). Folic acid-
conjugated Fe3O4 magnetic nanoparticles for hyperthermia and MRI in vitro and
in vivo. Applied Surface Science, 307(15): 224-233.
Jiang, J., Goya, G., & Rechenberg, H. (1999). Magnetic properties of nanostructured
CuFe2O4. Journal of Physics: Condensed Matter, 11(20): 4063-4078.
Jimenez, J., Sheparovych, R., Pita, M., Narvaez Garcia, A., Dominguez, E., Minko, S.,
& Katz, E. (2008). Magneto-induced self-assembling of conductive nanowires for
biosensor applications. The Journal of Physical Chemistry C, 112(19): 7337-7344.
124
Jin, G., Norrish, J., Too, C., & Wallace, G. (2004). Polypyrrole filament sensors for
gases and vapours. Current Applied Physics, 4(2): 366-369.
Jing, S., Xing, S., Yu, L., & Zhao, C. (2007). Synthesis and characterization of
Ag/polypyrrole nanocomposites based on silver nanoparticles colloid. Materials
Letters, 61(23): 4528-4530.
Johnson, R. J., Kivlighn, S. D., Kim, Y. G., Suga, S., & Fogo, A. B. (1999). Reappraisal
of the pathogenesis and consequences of hyperuricemia in hypertension,
cardiovascular disease, and renal disease. American Journal of Kidney Diseases,
33(2): 225-234.
Kang, Q., Yang, L., & Cai, Q. (2008). An electro-catalytic biosensor fabricated with Pt–
Au nanoparticle-decorated titania nanotube array. Bioelectrochemistry, 74(1): 62-
65.
Kang, X., Mai, Z., Zou, X., Cai, P., & Mo, J. (2007). A novel glucose biosensor based
on immobilization of glucose oxidase in chitosan on a glassy carbon electrode
modified with gold–platinum alloy nanoparticles/multiwall carbon nanotubes.
Analytical Biochemistry, 369(1): 71-79.
Karsten, S., Nan, A., Turcu, R., & Liebscher, J. (2012). A new access to polypyrrole‐based functionalized magnetic core‐shell nanoparticles. Journal of Polymer
Science Part A: Polymer Chemistry, 50(19): 3986-3995.
Kaushik, A., Khan, R., Solanki, P. R., Pandey, P., Alam, J., Ahmad, S., & Malhotra, B.
(2008). Iron oxide nanoparticles–chitosan composite based glucose biosensor.
Biosensors and Bioelectronics, 24(4): 676-683.
Kaushik, A., Solanki, P. R., Ansari, A. A., Ahmad, S., & Malhotra, B. D. (2008).
Chitosan–iron oxide nanobiocomposite based immunosensor for ochratoxin-A.
Electrochemistry Communications, 10(9): 1364-1368.
Kaushik, A., Solanki, P. R., Ansari, A. A., Sumana, G., Ahmad, S., & Malhotra, B. D.
(2009). Iron oxide-chitosan nanobiocomposite for urea sensor. Sensors and
Actuators B: Chemical, 138(2): 572-580.
Kellner, R., Mermet, J., Otto, M., Valcárcel, M., & Widmer, H. (2004). A modern
approach to analytical science: Analytical Chemistry. Wiley–VCH, Weinheim.
Kernt, M., Ulbig, M., Kampik, A., & Neubauer, A. S. (2014). Navigated Laser Therapy
for Diabetic Macular Oedema. European Ophthalmic Review.
Khan, K., Rehman, S., Rahman, H. U., & Khan, Q. (2004). Synthesis and application of
magnetic nanoparticles. Nanoparticles, Nanostructure Science and Technology, 1-
27.
Kim, S. H., Choi, J. B., Nguyen, Q. N., Lee, J. M., Park, S., Chung, T. D., & Byun, J. Y.
(2013). Nanoporous platinum thin films synthesized by electrochemical
dealloying for nonenzymatic glucose detection. Physical Chemistry Chemical
Physics, 15(16): 5782-5787.
125
Knežević, N. Ž., & Lin, V. S. Y. (2013). A magnetic mesoporous silica nanoparticle-
based drug delivery system for photosensitive cooperative treatment of cancer
with a mesopore-capping agent and mesopore-loaded drug. Nanoscale, 5(4):
1544-1551.
Kong, F. Y., Li, X. R., Zhao, W. W., Xu, J. J., & Chen, H. Y. (2012). Graphene oxide–
thionine–Au nanostructure composites: preparation and applications in non-
enzymatic glucose sensing. Electrochemistry Communications, 14(1): 59-62.
Kong, T., Chen, Y., Ye, Y., Zhang, K., Wang, Z., & Wang, X. (2009). An amperometric
glucose biosensor based on the immobilization of glucose oxidase on the ZnO
nanotubes. Sensors and Actuators B: Chemical, 138(1): 344-350.
Krull, I., & Swartz, M. (1998). Determining limits of detection and quantitation. LC
GC, 16(10): 922-924.
Wohlfarth, E. P. (1980). Ferromagnetic materials. Elsevier Science B.V.
Kumar, E. R., Jayaprakash, R., Devi, G. S., & Reddy, P. S. P. (2014). Synthesis of Mn
substituted CuFe2O4 nanoparticles for liquefied petroleum gas sensor applications.
Sensors and Actuators B: Chemical, 191(23): 186-191.
Kumary, V. A., Nancy, T. M., Divya, J., & Sreevalsan, K. (2013). Nonenzymatic
glucose sensor: glassy carbon electrode modified with graphene-nickel/nickel
oxide composite. International Journal of Electrochemical Science, 8(12): 2220-
2228.
Kurniawan, F., Tsakova, V., & Mirsky, V. M. (2006). Gold nanoparticles in
nonenzymatic electrochemical detection of sugars. Electroanalysis, 18(19‐20):
1937-1942.
Lange, U., Roznyatovskaya, N. V., & Mirsky, V. M. (2008). Conducting polymers in
chemical sensors and arrays. Analytica Chimica Acta, 614(1): 1-26.
Lata, S., Batra, B., Karwasra, N., & Pundir, C. S. (2012). An amperometric H2O2
biosensor based on cytochrome c immobilized onto nickel oxide
nanoparticles/carboxylated multiwalled carbon nanotubes/polyaniline modified
gold electrode. Process Biochemistry, 47(6): 992-998.
Law, W.-C., Yong, K.-T., Roy, I., Xu, G., Ding, H., Bergey, E. J., Prasad, P. N. (2008).
Optically and magnetically doped organically modified silica nanoparticles as
efficient magnetically guided biomarkers for two-photon imaging of live cancer
cells†. The Journal of Physical Chemistry C, 112(21): 7972-7977.
Lee, C., Wei, X., Kysar, J. W., & Hone, J. (2008). Measurement of the elastic properties
and intrinsic strength of monolayer graphene. Science, 321(5887): 385-388.
Lei, Y., Yan, X., Zhao, J., Liu, X., Song, Y., Luo, N., & Zhang, Y. (2011). Improved
glucose electrochemical biosensor by appropriate immobilization of nano-ZnO.
Colloids and Surfaces B: Biointerfaces, 82(1): 168-172.
126
Li, & Lin. (2007). Electrodeposition of gold nanoclusters on overoxidized polypyrrole
film modified glassy carbon electrode and its application for the simultaneous
determination of epinephrine and uric acid under coexistence of ascorbic acid.
Analytica Chimica Acta, 596(2): 222-230.
Li, & Lin. (2007). Glucose biosensor based on immobilization of glucose oxidase in
poly (aminophenol) film on polypyrrole-Pt nanocomposite modified glassy carbon
electrode. Biosensors and Bioelectronics, 22(12): 2898-2905.
Li, Liu, Ji, Jiang, J., Ding, R., Hu, Y., Huang, X. (2010). Ni/Al layered double
hydroxide nanosheet film grown directly on Ti substrate and its application for a
nonenzymatic glucose sensor. Sensors and Actuators B: Chemical, 147(1): 241-
247.
Li, Q., Fan, A., Lu, Z., Cui, Y., Lin, W., & Jia, Y. (2010). One-pot AgOAc-mediated
synthesis of polysubstituted pyrroles from primary amines and aldehydes:
application to the total synthesis of purpurone. Organic Letters, 12(18): 4066-
4069.
Li, Q., Xu, Z., Tang, W., & Wu, Y. (2015). Determination of Dopamine with a
Modified Carbon Dot Electrode. Analytical Letters, 48(13): 2040-2050.
Li, Y., Fu, J., Chen, R., Huang, M., Gao, B., Huo, K., Chu, P. K. (2014). Core–shell
TiC/C nanofiber arrays decorated with copper nanoparticles for high performance
non-enzymatic glucose sensing. Sensors and Actuators B: Chemical, 192(15):
474-479.
Li, Y., Yi, R., Yan, A., Deng, L., Zhou, K., & Liu, X. (2009). Facile synthesis and
properties of ZnFe2O4 and ZnFe2O4/polypyrrole core-shell nanoparticles. Solid
State Sciences, 11(8): 1319-1324.
Lin, X. M., & Samia, A. C. (2006). Synthesis, assembly and physical properties of
magnetic nanoparticles. Journal of Magnetism and Magnetic Materials, 305(1):
100-109.
Liu, Y. L., Liu, Z. M., Yang, Y., Yang, H. F., Shen, G. L., & Yu, R. Q. (2005). Simple
synthesis of MgFe2O4 nanoparticles as gas sensing materials. Sensors and
Actuators B: Chemical, 107(2): 600-604.
Liu, J., & Wang, J. (2000). A novel improved design for the first-generation glucose
biosensor. Food Technology and Biotechnology, 39(1): 55-58.
Liu, Y. L., Wang, H., Yang, Y., Liu, Z. M., Yang, H. F., Shen, G. L., & Yu, R. Q.
(2004). Hydrogen sulfide sensing properties of NiFe2O4 nanopowder doped with
noble metals. Sensors and Actuators B: Chemical, 102(1): 148-154.
Liu, L., Zhao, Y., Jia, N., Zhou, Q., Zhao, C., Yan, M., & Jiang, Z. (2006).
Electrochemical fabrication and electronic behavior of polypyrrole nano-fiber
array devices. Thin Solid Films, 503(1): 241-245.
127
Liu, J. F., Zhao, Z. S., & Jiang, G. B. (2008). Coating Fe3O4 magnetic nanoparticles
with humic acid for high efficient removal of heavy metals in water.
Environmental Science & Technology, 42(18): 6949-6954.
Liu, M., Liu, X., Ding, C., Wei, Z., Zhu, Y., & Jiang, L. (2011). Reversible underwater
switching between superoleophobicity and superoleophilicity on conducting
polymer nanotube arrays. Soft Matter, 7(9): 4163-4165.
Liu, X., Geng, D., Meng, H., Shang, P., & Zhang, Z. (2008). Microwave-absorption
properties of ZnO-coated iron nanocapsules. Applied Physics Letters, 92(17):
173117-173128.
Lu, G., Li, C., & Shi, G. (2006). Polypyrrole micro-and nanowires synthesized by
electrochemical polymerization of pyrrole in the aqueous solutions of
pyrenesulfonic acid. Polymer, 47(6): 1778-1784.
Lu, X., Liu, T., Zhai, T., Wang, G., Yu, M., Xie, S., Li, Y. (2014). Improving the
Cycling Stability of Metal–Nitride Supercapacitor Electrodes with a Thin Carbon
Shell. Advanced Energy Materials, 4(4): 994-1000.
Luo, J., Jiang, S., Zhang, H., Jiang, J., & Liu, X. (2012). A novel non-enzymatic
glucose sensor based on Cu nanoparticle modified graphene sheets electrode.
Analytica Chimica Acta, 709(25): 47-53.
Luo, L., Li, Q., Xu, Y., Ding, Y., Wang, X., Deng, D., & Xu, Y. (2010). Amperometric
glucose biosensor based on NiFe2O4 nanoparticles and chitosan. Sensors and
Actuators B: Chemical, 145(1): 293-298.
Mahmoodi, N. M. (2015). Manganese ferrite nanoparticle: Synthesis, characterization,
and photocatalytic dye degradation ability. Desalination and Water Treatment,
53(1): 84-90.
Mahmoodi, N. M., Soltani-Gordefaramarzi, S., & Sadeghi-Kiakhani, M. (2013). Dye
removal using modified copper ferrite nanoparticle and RSM analysis.
Environmental Monitoring and Assessment, 185(12): 10235-10248.
Majewski, P., & Thierry, B. (2007). Functionalized magnetite nanoparticles-synthesis,
properties, and bio-applications. Critical Reviews in Solid State and Materials
Sciences, 32(3-4): 203-215.
Malesevic, A., Kemps, R., Vanhulsel, A., Chowdhury, M. P., Volodin, A., & Van
Haesendonck, C. (2008). Field emission from vertically aligned few-layer
graphene. Journal of Applied Physics, 104(8), 084301-5.
Mano, N., & Heller, A. (2005). Detection of glucose at 2 fM concentration. Analytical
Chemistry, 77(2): 729-732.
Meng, L., Jin, J., Yang, G., Lu, T., Zhang, H., & Cai, C. (2009). Nonenzymatic
electrochemical detection of glucose based on palladium− single-walled carbon
nanotube hybrid nanostructures. Analytical Chemistry, 81(17): 7271-7280.
128
Molapo, K., Ndangili, P., Ajayi, R., Mbambisa, G., Mailu, S., Njomo, N., Iwuoha, E. I.
(2012). Electronics of conjugated polymers (I): polyaniline. International Journal
of Electrochemical Science, 7(3): 11859-11875.
Mujahid, A., Stathopulos, H., Lieberzeit, P. A., & Dickert, F. L. (2010). Solvent vapour
detection with cholesteric liquid crystals—optical and mass-sensitive evaluation
of the sensor mechanism. Sensors (Basel), 10(5): 4887-4897.
Naseri, M. G., Saion, E. B., Hashim, M., Shaari, A. H., & Ahangar, H. A. (2011).
Synthesis and characterization of zinc ferrite nanoparticles by a thermal treatment
method. Solid State Communications, 151(14): 1031-1035.
Novoselov, K., McCann, E., Morozov, S., Fal’ko, V. I., Katsnelson, M., Zeitler, U.,
Geim, A. (2006). Unconventional quantum Hall effect and Berry’s phase of 2π in
bilayer graphene. Nature Physics, 2(3): 177-180.
Paek, S. M., Yoo, E., & Honma, I. (2008). Enhanced cyclic performance and lithium
storage capacity of SnO2/graphene nanoporous electrodes with three-
dimensionally delaminated flexible structure. Nano Letters, 9(1): 72-75.
Palmisano, F., Zambonin, P. G., Centonze, D., & Quinto, M. (2002). A disposable,
reagentless, third-generation glucose biosensor based on overoxidized poly
(pyrrole)/tetrathiafulvalene-tetracyanoquinodimethane composite. Analytical
Chemistry, 74(23): 5913-5918.
Pandey, S., Goswami, G. K., & Nanda, K. K. (2012). Green synthesis of biopolymer–
silver nanoparticle nanocomposite: An optical sensor for ammonia detection.
International Journal of Biological Macromolecules, 51(4): 583-589.
Pang, X., He, D., Luo, S., & Cai, Q. (2009). An amperometric glucose biosensor
fabricated with Pt nanoparticle-decorated carbon nanotubes/TiO2 nanotube arrays
composite. Sensors and Actuators B: Chemical, 137(1): 134-138.
Park, S., Boo, H., & Chung, T., D. (2006). Electrochemical non-enzymatic glucose
sensors. Analytica Chimica Acta, 556(1): 46-57.
Park, S., & Ruoff, R., S. (2009). Chemical methods for the production of graphenes.
Nature Nanotechnology, 4(4): 217-224.
Paul Joseph, D., Venkateswaran, C., & Selva Vennila, R. (2011). Critical Analysis on
the Structural and Magnetic Properties of Bulk and Nanocrystalline Cu-Fe-O.
Advances in Materials Science and Engineering, 2010(8): 872-886.
Pei, S., & Cheng, H. M. (2012). The reduction of graphene oxide. Carbon, 50(9): 3210-
3228.
Perez, J. M., Simeone, F. J., Saeki, Y., Josephson, L., & Weissleder, R. (2003). Viral-
induced self-assembly of magnetic nanoparticles allows the detection of viral
particles in biological media. Journal of the American Chemical Society, 125(34):
10192-10193.
129
Periasamy, A. P., Yang, S., & Chen, S.-M. (2011). Preparation and characterization of
bismuth oxide nanoparticles-multiwalled carbon nanotube composite for the
development of horseradish peroxidase based H2O2 biosensor. Talanta, 87(5): 15-
23.
Pita, M., Abad, J. M., Vaz-Dominguez, C., Briones, C., Mateo-Martí, E., Martín-Gago,
J. A., & Fernández, V. M. (2008). Synthesis of cobalt ferrite core/metallic shell
nanoparticles for the development of a specific PNA/DNA biosensor. Journal of
Colloid and Interface Science, 321(2): 484-492.
Prilutsky, S., Schechner, P., Bubis, E., Makarov, V., Zussman, E., & Cohen, Y. (2010).
Anodes for glucose fuel cells based on carbonized nanofibers with embedded
carbon nanotubes. Electrochimica Acta, 55(11): 3694-3702.
Puntes, V. F., Krishnan, K. M., & Alivisatos, P. (2001). Synthesis, self-assembly, and
magnetic behavior of a two-dimensional superlattice of single-crystal ε-Co
nanoparticles. Applied Physics Letters, 78(15): 2187-2189.
Qian, L., Mao, J., Tian, X., Yuan, H., & Xiao, D. (2013). In situ synthesis of CuS
nanotubes on Cu electrode for sensitive nonenzymatic glucose sensor. Sensors
and Actuators B: Chemical, 176(12): 952-959.
Qiu, H., & Huang, X. (2010). Effects of Pt decoration on the electrocatalytic activity of
nanoporous gold electrode toward glucose and its potential application for
constructing a nonenzymatic glucose sensor. Journal of Electroanalytical
Chemistry, 643(1-2): 39-45.
Rahman, M. M., Ahammad, A., Jin, J. H., Ahn, S. J., & Lee, J. J. (2010). A
comprehensive review of glucose biosensors based on nanostructured metal-
oxides. Sensors (Basel), 10(5), 4855-4886.
Raj, C. R., & Ohsaka, T. (2003). Voltammetric detection of uric acid in the presence of
ascorbic acid at a gold electrode modified with a self-assembled monolayer of
heteroaromatic thiol. Journal of Electroanalytical Chemistry, 540(15): 69-77.
Rakshit, S., Patureau, F. W., & Glorius, F. (2010). Pyrrole Synthesis via Allylic sp3
C−H Activation of Enamines Followed by Intermolecular Coupling with
Unactivated Alkynes. Journal of the American Chemical Society, 132(28): 9585-
9587.
Ramankutty, C., & Sugunan, S. (2001). Surface properties and catalytic activity of
ferrospinels of nickel, cobalt and copper, prepared by soft chemical methods.
Applied Catalysis A: General, 218(1): 39-51.
Rao, C. e. N. e. R., Sood, A. e. K., Subrahmanyam, K. e. S., & Govindaraj, A. (2009).
Graphene: The new two‐dimensional nanomaterial. Angewandte Chemie
International Edition, 48(42): 7752-7777.
Raudsepp, T., Marandi, M., Tamm, T., Sammelselg, V., & Tamm, J. (2014). Influence
of ion-exchange on the electrochemical properties of polypyrrole films.
Electrochimica Acta, 122(15): 79-86.

130
Reddy, C. G., Manorama, S., & Rao, V. (2000). Preparation and characterization of
ferrites as gas sensor materials. Journal of Materials Science Letters, 19(9): 775-
778.
Reitz, E., Jia, W., Gentile, M., Wang, Y., & Lei, Y. (2008). CuO nanospheres based
nonenzymatic glucose sensor. Electroanalysis, 20(22): 2482-2486.
Ruan, C., Zeng, K., & Grimes, C. A. (2003). A mass-sensitive pH sensor based on a
stimuli-responsive polymer. Analytica Chimica Acta, 497(1): 123-131.
Safavi, A., Maleki, N., & Farjami, E. (2009). Fabrication of a glucose sensor based on a
novel nanocomposite electrode. Biosensors and Bioelectronics, 24(6): 1655-1660.
Sandhu, A., Handa, H., & Abe, M. (2010). Synthesis and applications of magnetic
nanoparticles for biorecognition and point of care medical diagnostics.
Nanotechnology, 21(44): 442001.
Santhosh, P., Manesh, K. M., Uthayakumar, S., Gopalan, A. I., & Lee, K. P. (2009).
Hollow spherical nanostructured polydiphenylamine for direct electrochemistry
and glucose biosensor. Biosensors and Bioelectronics, 24(7): 2008-2014.
Sathiwitayakul, T., Newton, E., Parkin, I. P., Kuznetsov, M., & Binions, R. (2015).
Ferrite Materials Produced From Self-Propagating High-Temperature Synthesis
for Gas Sensing Applications. Sensors Journal, IEEE, 15(1): 196-200.
Schedin, F., Geim, A., Morozov, S., Hill, E., Blake, P., Katsnelson, M., & Novoselov,
K. (2007). Detection of individual gas molecules adsorbed on graphene. Nature
Materials, 6(9): 652-655.
Schmidt, M., Kusche, R., von Issendorff, B., & Haberland, H. (1998). Irregular
variations in the melting point of size-selected atomic clusters. Nature, 393(6682):
238-240.
Seanor, D. A. (2013). Electrical properties of polymers. Elsevier.
Sekine, S., Ido, Y., Miyake, T., Nagamine, K., & Nishizawa, M. (2010). Conducting
polymer electrodes printed on hydrogel. Journal of the American Chemical
Society, 132(38): 13174-13175.
Shao, Y., Wang, J., Wu, H., Liu, J., Aksay, I. A., & Lin, Y. (2010). Graphene based
electrochemical sensors and biosensors: a review. Electroanalysis, 22(10): 1027-
1036.
Sharma, R., Lamba, S., & Annapoorni, S. (2005). Magnetic properties of polypyrrole-
coated iron oxide nanoparticles. Journal of Physics D: Applied Physics, 38(18):
3354-3367.
Shaw, J. E., Sicree, R. A., & Zimmet, P. Z. (2010). Global estimates of the prevalence
of diabetes for 2010 and 2030. Diabetes Research and Clinical Practice, 87(1): 4-
14.
131
Shen, H., Zhang, L., Liu, M., & Zhang, Z. (2012). Biomedical applications of graphene.
Theranostics, 2(3): 283-294.
Shen, J., Shi, M., Ma, H., Yan, B., Li, N., & Ye, M. (2011). Hydrothermal synthesis of
magnetic reduced graphene oxide sheets. Materials Research Bulletin, 46(11):
2077-2083.
Shi, J., Ci, P., Wang, F., Peng, H., Yang, P., Wang, L., & Chu, P. K. (2011).
Nonenzymatic glucose sensor based on over-oxidized polypyrrole modified Pd/Si
microchannel plate electrode. Biosensors and Bioelectronics, 26(5): 2579-2584.
Shi, W., & Ma, Z. (2010). Amperometric glucose biosensor based on a triangular silver
nanoprisms/chitosan composite film as immobilization matrix. Biosensors and
Bioelectronics, 26(3): 1098-1103.
Si, Y., & Samulski, E. T. (2008). Exfoliated graphene separated by platinum
nanoparticles. Chemistry of Materials, 20(21): 6792-6797.
Siegel, R. W., & Fougere, G. E. (1995). Mechanical properties of nanophase metals.
Nanostructured Materials, 6(1): 205-216.
Sim, H., Kim, J. H., Lee, S. K., Song, M. J., Yoon, D. H., Lim, D. S., & Hong, S. I.
(2012). High-sensitivity non-enzymatic glucose biosensor based on Cu(OH)2
nanoflower electrode covered with boron-doped nanocrystalline diamond layer.
Thin Solid Films, 520(24): 7219-7223.
Singh, S., Yadav, B. C., Prakash, R., Bajaj, B. & Lee, J., R. (2011). Synthesis of
nanorods and mixed shaped copper ferrite and their applications as liquefied
petroleum gas sensor. Applied Surface Science, 257(24): 10763-10770.
Singh, R., Verma, R., Kaushik, A., Sumana, G., Sood, S., Gupta, R. K., & Malhotra, B.
D. (2011). Chitosan-iron oxide nano-composite platform for mismatch-
discriminating DNA hybridization for Neisseria gonorrhoeae detection causing
sexually transmitted disease. Biosensors and Bioelectronics, 26(6): 2967-2974
Singh, R. P. (2011). Prospects of nanobiomaterials for biosensing. International Journal
of Electrochemistry, 2011 (2011): 484-514.
Skomski, R. (2003). Nanomagnetics. Journal of Physics: Condensed Matter, 15(20):
841-848.
Skoog, D., Holler, F., & Crouch, S. (2007). Principles of Instrumental Analysis.
Thomson Brooks/Cole: Belmont, CA.
Qu, S., Wang, J., Kong, J., Yang, P., & Chen, G. (2007). Magnetic loading of carbon
nanotube/nano-Fe3O4 composite for electrochemical sensing. Talanta, 71(3):
1096-1102.
Sounderya, N., & Zhang, Y. (2008). Use of core/shell structured nanoparticles for
biomedical applications. Recent Patents on Biomedical Engineering, 1(1): 34-42.
132
Stewart, S., Figueroa, S., Sturla, M., Scorzelli, R., Garcia, F., & Requejo, F. (2007).
Magnetic ZnFe2O4 nanoferrites studied by X-ray magnetic circular dichroism and
Mössbauer spectroscopy. Physica B: Condensed Matter, 389(1): 155-158.
Su, L., Jia, W., Hou, C., & Lei, Y. (2011). Microbial biosensors: a review. Biosensors
and Bioelectronics, 26(5): 1788-1799.
Sun, Y., Buck, H., & Mallouk, T. E. (2001). Combinatorial discovery of alloy
electrocatalysts for amperometric glucose sensors. Anal Chem, 73(7): 1599-1604.
Sundaram, R. S., Gómez‐Navarro, C., Balasubramanian, K., Burghard, M., & Kern, K.
(2008). Electrochemical modification of graphene. Advanced Materials, 20(16):
3050-3053.
Suryanarayana, C., & Norton, M. G. (1998). X-ray diffraction: a practical approach.
Cambridge Univ Press.
Sutka, A., Mezinskis, G., Lusis, A., & Jakovlevs, D. (2012). Influence of iron non-
stoichiometry on spinel zinc ferrite gas sensing properties. Sensors and Actuators
B: Chemical, 171(12): 204-209.
Szotek, Z., Temmerman, W., Ködderitzsch, D., Svane, A., Petit, L., & Winter, H.
(2006). Electronic structures of normal and inverse spinel ferrites from first
principles. Physical Review B, 74(17): 174431-174439.
Tamaddon, F., Farahi, M., & Karami, B. (2012). Molybdate sulfuric acid as a reusable
solid catalyst in the synthesis of 2, 3, 4, 5-tetrasubstituted pyrroles via a new one-
pot [2+ 2+1] strategy. Journal of Molecular Catalysis A: Chemical, 356(9): 85-89.
Teymourian, H., Salimi, A., & Hallaj, R. (2012). Low potential detection of NADH
based on Fe3O4 nanoparticles/multiwalled carbon nanotubes composite:
Fabrication of integrated dehydrogenase-based lactate biosensor. Biosensors and
Bioelectronics, 33(1): 60-68.
Tian, Prestgard, & Tiwari. (2014). A review of recent advances in nonenzymatic
glucose sensors. Materials Science and Engineering: C, 41(11): 100-118.
Tian, S. J., Liu, J. Y., Zhu, T., & Knoll, W. (2004). Polyaniline/gold nanoparticle
multilayer films: Assembly, properties, and biological applications. Chemistry of
Materials, 16(21): 4103-4108.
Tlili, A., Abdelghani, A., Ameur, S., & Jaffrezic-Renault, N. (2006). Impedance
spectroscopy and affinity measurement of specific antibody–antigen interaction.
Materials Science and Engineering: C, 26(2): 546-550.
Toghill, K. E., & Compton, R. G. (2010). Electrochemical non-enzymatic glucose
sensors: a perspective and an evaluation. International Journal of Electrochemical
Science, 5(9): 1246-1301.
Umar, A., Rahman, M., Kim, S., & Hahn, Y. (2008). ZnO nanonails: synthesis and their
application as glucose biosensor. Journal of Nanoscience and Nanotechnology,
8(6): 3216-3221.
133
Umar, A., Rahman, M. M., Al-Hajry, A., & Hahn, Y. B. (2009). Enzymatic glucose
biosensor based on flower-shaped copper oxide nanostructures composed of thin
nanosheets. Electrochemistry Communications, 11(2): 278-281.
Vijayalakshmi, A., Tarunashree, Y., Baruwati, B., Manorama, S., Narayana, B.,
Johnson, R., & Rao, N. (2008). Enzyme field effect transistor (ENFET) for
estimation of triglycerides using magnetic nanoparticles. Biosensors and
Bioelectronics, 23(11): 1708-1714.
Wang, J. (2006). Analytical Electrochemistry: John Wiley & Sons.
Wang, J. (2008). Electrochemical glucose biosensors. Chemical Reviews, 108(2): 814-
825.
Wang, K. & Dömling, A. (2010). Design of a Versatile Multicomponent Reaction
Leading to 2‐amino‐5‐ketoaryl pyrroles. Chemical Biology & Drug Design, 75(3):
277-283.
Wang, J., Thomas, D. F., & Chen, A. (2008). Nonenzymatic electrochemical glucose
sensor based on nanoporous PtPb networks. Analytical Chemistry, 80(4): 997-
1004.
Wang, Y., Zhao, H., Li, M., Fan, J., & Zhao, G. (2014). Magnetic ordered mesoporous
copper ferrite as a heterogeneous Fenton catalyst for the degradation of
imidacloprid. Applied Catalysis B: Environmental, 147(5): 534-545.
Wang, L., Gao, X., Jin, L., Wu, Q., Chen, Z., & Lin, X. (2013). Amperometric glucose
biosensor based on silver nanowires and glucose oxidase. Sensors and Actuators
B: Chemical, 176(5): 9-14.
Wang, S., Tan, Y., Zhao, D., & Liu, G. (2008). Amperometric tyrosinase biosensor
based on Fe3O4 nanoparticles–chitosan nanocomposite. Biosensors and
Bioelectronics, 23(12), 1781-1787.
Wang, X., Hu, C., Liu, H., Du, G., He, X., & Xi, Y. (2010). Synthesis of CuO
nanostructures and their application for nonenzymatic glucose sensing. Sensors
and Actuators B: Chemical, 144(1), 220-225.
Wen, J. G. (2014). Transmission electron microscopy Practical Materials
Characterization. Springer.
Wilson,G. S., & Gifford, R. (2005). Biosensors for real-time in vivo measurements.
Biosensors and Bioelectronics, 20(12): 2388-2403.
Wind, J., Smeekens, S., & Hanson, J. (2010). Sucrose: metabolite and signaling
molecule. Phytochemistry, 71(14): 1610-1614.
Wu, W., Hao, R., Liu, F., Su, X., & Hou, Y. (2013). Single-crystalline α-Fe2O3
nanostructures: controlled synthesis and high-index plane-enhanced
photodegradation by visible light. Journal of Materials Chemistry A, 1(23): 6888-
6894.
134
Xiang, C., She, Z., Zou, Y., Cheng, J., Chu, H., Qiu, S., & Xu, F. (2014). A room-
temperature hydrogen sensor based on Pd nanoparticles doped TiO2 nanotubes.
Ceramics International, 40(10): 16343-16348.
Xing, L., Rong, Q., & Ma, Z. (2015). Non-enzymatic electrochemical sensing of
hydrogen peroxide based on polypyrrole/platinum nanocomposites. Sensors and
Actuators B: Chemical, 221(9): 242.247.
Xu, Feng, & Shangguan. (2009). Preparations and photocatalytic properties of visible-
light-active zinc ferrite-doped TiO2 photocatalyst. The Journal of Physical
Chemistry C, 113(6): 2463-2467.
Xu, P., Han, X., Wang, C., Zhao, H., Wang, J., Wang, X., & Zhang, B. (2008).
Synthesis of electromagnetic functionalized barium ferrite nanoparticles
embedded in polypyrrole. Journal of Physical Chemistry B, 112(10): 2775-2781.
Xu, Z., Shen, C., Hou, Y., Gao, H., & Sun, S. (2009). Oleylamine as both reducing
agent and stabilizer in a facile synthesis of magnetite nanoparticles. Chemistry of
Materials, 21(9): 1778-1780.
Yallapu, M. M., Othman, S. F., Curtis, E. T., Gupta, B. K., Jaggi, M., & Chauhan, S. C.
(2011). Multi-functional magnetic nanoparticles for magnetic resonance imaging
and cancer therapy. Biomaterials, 32(7): 1890-1905.
Yang, Y., Jiang, J., Shen, G., Yu, R. (2009). An optical sensor for mercury ion based on
the fluorescence quenching of tetra (p-dimethylaminophenyl) porphyrin.
Analytica Chimica Acta, 636(1): 83-88.
Yang, C. H., Lee, H. J., Kim, Y. B., Han, S. J., Jeong, Y. H., & Birge, N. O. (2006).
Magnetoresistance in Fe and Cu co-doped ZnO thin films. Physica B: Condensed
Matter, 383(1): 28-30.
Yang, T., Li, Y., Zhu, M. Y., Li, Y. B., Huang, J., Jin, H. M., & Hu, Y. M. (2010).
Room-temperature ferromagnetic Mn-doped ZnO nanocrystal synthesized by
hydrothermal method under high magnetic field. Materials Science and
Engineering: B, 170(1): 129-132.
Yang, L., Ren, X., Tang, F., & Zhang, L. (2009). A practical glucose biosensor based on
Fe3O4 nanoparticles and chitosan/nafion composite film. Biosensors and
Bioelectronics, 25(4): 889-895.
Yang, X., Tu, Y., Li, L., Shang, S., & Tao, X. (2010). Well-dispersed chitosan/graphene
oxide nanocomposites. ACS applied materials & interfaces, 2(6): 1707-1713.
Yang, X., Zhang, X., Ma, Y., Huang, Y., Wang, Y., & Chen, Y. (2009).
Superparamagnetic graphene oxide–Fe 3 O 4 nanoparticles hybrid for controlled
targeted drug carriers. Journal of materials chemistry, 19(18), 2710-2714.
Yang, Y., Zhang, L., Li, S., Yang, W., Xu, J., Jiang, Y., & Wen, J. (2013).
Electrochemical performance of conducting polymer and its nanocomposites
prepared by chemical vapor phase polymerization method. Journal of Materials
Science: Materials in Electronics, 24(7): 2245-2253.
135
Yao, J., Liu, B., & Qin, F. (2011). Modular thermal sensors in temperature-gated
transient receptor potential (TRP) channels. Proceedings of the National Academy
of Sciences, 108(27): 11109-11114.
Yao, C., Zeng, Q., Goya, G. F., Torres, T., Liu, J., Wu, H., Jiang, J. (2007). ZnFe2O4
nanocrystals: synthesis and magnetic properties. The Journal of Physical
Chemistry C, 111(33), 12274-12278.
Yao, X., Kong, J., Zhou, D., Zhao, C., Zhou, R., & Lu, X. (2014). Mesoporous zinc
ferrite/graphene composites: Towards ultra-fast and stable anode for lithium-ion
batteries. Carbon, 79, 493-499.
Yousaf, A., & Ali, S. (2008). Why Nanoscience and Nanotechnology? What is there for
us?. J. of Faculty of Eng. & Technol, 5, 11-20.
Zaeslein, C., & Körner, W. (1982). Vitamins in the Field of Medicine: Editiones Roche.
Zeng, Y., Hao, R., Xing, B., Hou, Y., & Xu, Z. (2010). One-pot synthesis of Fe3O4
nanoprisms with controlled electrochemical properties. Chem Commun (Camb),
46(22), 3920-3922.
Zhang, & Li. (2004). Third-generation biosensors based on the direct electron transfer
of proteins. Analytical Sciences, 20(4), 603-610.
Zhang, Liu, Su, L., Zhang, Z., Huo, D., Hou, C., & Lei, Y. (2014). CuO nanowires
based sensitive and selective non-enzymatic glucose detection. Sensors and
Actuators B: Chemical, 191, 86-93.
Zhang, Ran, & Yi. (2009). Engineering magnetic properties of Ni nanoparticles by non-
magnetic cores. Chemistry of Materials, 21(21), 5222-5228.
Zhang, Wang, Lu, Su, J., & He, T. (2014). Influence of doping anions on structure and
properties of electro-polymerized polypyrrole counter electrodes for use in dye-
sensitized solar cells. Journal of Power Sources, 246, 491-498.
Zhang, Xu, Li, & Ma. (2009). Templated fabrication of NiFe2O4 nanorods:
characterization, magnetic and electrochemical properties. Solid State Sciences,
11(1), 113-117.
Zhang, Xu, S., Luo, Y., Pan, S., Ding, H., & Li, G. (2011). Synthesis of mesoporous
carbon capsules encapsulated with magnetite nanoparticles and their application in
wastewater treatment. Journal of Materials Chemistry, 21(11), 3664-3671.
Zhang, B., Liu, B., Tang, D., Niessner, R., Chen, G., & Knopp, D. (2012). DNA-based
hybridization chain reaction for amplified bioelectronic signal and ultrasensitive
detection of proteins. Analytical Chemistry, 84(12), 5392-5399.
Zhang, K., Zhang, L. L., Zhao, X., & Wu, J. (2010). Graphene/polyaniline nanofiber
composites as supercapacitor electrodes. Chemistry of Materials, 22(4), 1392-
1401.
136
Zhang, Y., Liu, Y., Su, L., Zhang, Z., Huo, D., Hou, C., & Lei, Y. (2014). CuO
nanowires based sensitive and selective non-enzymatic glucose detection. Sensors
and Actuators B: Chemical, 191, 86-93.
Zhao, G., Xu, J.-J., & Chen, H.-Y. (2006). Fabrication, characterization of Fe3O4
multilayer film and its application in promoting direct electron transfer of
hemoglobin. Electrochemistry Communications, 8(1), 148-154.
Zhu, Garcia-Gancedo, L., Flewitt, A. J., Xie, H., Moussy, F., & Milne, W. I. (2012). A
critical review of glucose biosensors based on carbon nanomaterials: carbon
nanotubes and graphene. Sensors (Basel), 12(5), 5996-6022.
Zhu, Lu, Li, M., Shao, Y., & Zhu, Z. (2009). Nonenzymatic glucose voltammetric
sensor based on gold nanoparticles/carbon nanotubes/ionic liquid nanocomposite.
Talanta, 79(5), 1446-1453.
137
LIST OF PUBLICATIONS AND PRESENTATIONS
1. Shahnavaz, Z., Lorestani, F., Woi, P. M., Alias, Y. (2014). Polypyrrole-ZnFe2O4
magnetic nanocomposite with core-shell structure for glucose sensing. Applied Surface
Science, 317(30): 622-629.
2. Shahnavaz, Z., Lorestani, F., Woi, P. M., Alias, Y. (2015). Core-shell–
CuFe2O4/PPy nanocomposite enzyme-free sensor for detection of glucose. Journal of
Solid State Electrochemistry, 19(4): 1223-1233.
3. Shahnavaz, Z., Woi, P. M., Alias, Y. (2015). A hydrothermally prepared reduced
graphene oxide-supported copper ferrite hybrid for glucose sensing. Ceramics
International, 41(10): 12710-12716.
Manuscript submitted
4. Shahnavaz, Z., Woi, P. M., Alias, Y. (2015). Electrochemical sensing of glucose
by reduced graphene oxide-zinc ferrospinels. Applied Surface Science.
Conference presentations
1. Shahnavaz, Z., Woi, P. M., Alias, Y. A nonenzymatic glucose biosensor based on
zinc ferrite nanoparticles. 6th
lnternational Conterence on Sensors, 27-29th
August 2013,
Malacca, Malaysia.–Poster presentation.
2. Shahnavaz, Z., Woi, P. M., Alias, Y. Core-Shell—CuFe2O4/PPy hybrid
nanocomposite enzyme free sensor for detection of glucose. International Conference
138
on Ionic Liquids (ICIL13), 11-13th
December 2013, Langkawi Island, Malaysia.–Poster
presentation.
3. Shahnavaz, Z., Woi, P. M., Alias, Y. Zinc ferrite-reduced graphene oxide
nanocomposite for non-enzymatic amperometric glucose detection. 3rd
lnternational
Conterence on Sensors on Advances in Engineering & Technology (ICAET), 26-27th
December 2014, Kuala Lumpur, Malaysia.–Oral presentation.
4. Shahnavaz, Z., Woi, P. M., Alias, Y. Hydrothermal synthesis of magnetic reduced
graphene oxide nanocomposite for electrochemical glucose sensor application. The 2nd
International Conference on Engineering and Natural Science (ICENS), 22-24th
July
2015, Tokyo,Japan.–Poster presentation.
Related Documents