Technisch-Naturwissenschaftliche Fakultät Enzymatic Reduction of Carbon Dioxide to Formate __________________________________________________________________________ Bachelor Thesis in Biological Chemistry Daniela Hiemetsberger Supervisor: DI Stefanie Schlager o. Univ. Prof. Dr. Mag. Niyazi Serdar Sariciftci Institute of Physical Chemistry, JKU

Welcome message from author
This document is posted to help you gain knowledge. Please leave a comment to let me know what you think about it! Share it to your friends and learn new things together.
Transcript

Technisch-Naturwissenschaftliche Fakultät
Enzymatic Reduction of Carbon Dioxide to Formate
__________________________________________________________________________
Bachelor Thesis in Biological Chemistry
Daniela Hiemetsberger Supervisor: DI Stefanie Schlager
o. Univ. Prof. Dr. Mag. Niyazi Serdar Sariciftci Institute of Physical Chemistry, JKU

Bachelor thesis
Hiemetsberger D., 2013: Enzymatic Reduction of Carbon Dioxide to Formate, BSc. Thesis in
English, 41 p., Institute of Physical Chemistry, Johannes Kepler Universität, Linz, Austria
Abstract This thesis presents the immobilization of the enzyme formate dehydrogenase in alginate
based matrices for sustainable, repeatable CO2 reduction. Different alginate containing gels,
modified with PEDOT:PSS are investigated for efficient CO2 conversion. The first method
presented is limited due to necessity of the co-enzyme nicotinamide adenine dinucleotide
(NADH). The second approach offers the opportunity for electrochemical application of the
enzyme containing systems and therefore to substitute NADH as electron provider. NADH is
replaced by direct electrochemical reduction of immobilized formate dehydrogenase enzyme
for CO2 conversion to formate using modified electrochemical electrodes. Production of
formate is shown for the enzymatic CO2 reduction in electrochemical and non-
electrochemical experiments. Products were analysed in ion chromatography. Electrochemical
measurements were performed in a one compartment cell using alginate covered Pt and
Carbon felt as working electrode. Cyclic voltammograms were recorded for electrochemical
characterisation. Results from CO2 saturated samples are compared to N2 purged setups to
proof product generation from CO2 reduction.
Abstrakt
Diese Arbeit präsentiert die Immobilisierung des Enzyms Formatdehydrogenase in Alginat
basierten Matrizen für eine nachhaltige, reproduzierbare CO2 Reduktion. Verschiedene Gele,
welche mit PEDOT:PSS modifiziert wurden, werden für eine effiziente CO2 Umwandlung
untersucht. Das erste vorgestellte Verfahren ist aufgrund der Notwendigkeit des Coenzyms
Nicotinamidadenindinukleotid (NADH ) begrenzt. Der zweite Ansatz bietet die Möglichkeit
für die elektrochemische Anwendung der enzymhaltigen Systeme und damit NADH als
Elektronenquelle zu ersetzen. NADH wird durch direkte elektrochemische Reduktion von
immobilisierter Formatdehydrogenase mit modifizierten elektrochemischen Elektroden
ersetzt. Die Produktion von Formiat für die enzymatische CO2 Reduktion in
elektrochemischen und nicht-elektrochemischen Experimenten wird gezeigt. Produkte wurden
mit Ionenchromatographie analysiert. Elektrochemische Messungen wurden in einer
Einkammerzelle mit Pt -und Carbonfilz als Arbeitselektroden durchgeführt. Zyklische
Voltammogramme wurden für die elektrochemische Charakterisierung aufgezeichnet. Um die
Produktion von CO2 zu überprüfen wurden Proben aus den CO2 gesättigten Setups und N2
gespülten Setups verglichen.

Acknowledgements
I am grateful to DI Stefanie Schlager for her excellent guidance in the laboratory. I also want
to thank her for the supervision and support of my bachelor thesis.
Many thanks to MSc Dogukan H. Apaydin who always answered upcoming questions and
helped me handling the analytical instruments.
I also would like to express my thanks to o. Univ. Prof. Dr. Mag. Niyazi Serdar Sariciftci for
giving me the opportunity to work at his institute.

Table of Contents 1. Introduction
1.1 Carbon Dioxide as Greenhouse Gas..........................................................................1
1.2 Carbon Capture and Storage.....................................................................................3
1.3 Carbon Capture and Utilization................................................................................4
1.4 CO2 conversion with enzymes..................................................................................6
1.5 Enzymes as catalysts.................................................................................................7
1.6 Immobilisation of enzymes.....................................................................................11
2. Experimental Part 2.1 Non-electrochemical experiments........................................................................13
2.1.1 Preparation of Alginate-Silicate Beads................................................................13
2.1.2 CO2 reduction experiments (Alginate-Silicate Beads) ........................................14
2.1.3 Preparation of Alginate Beads containing PEDOT:PSS......................................14
2.1.4 CO2 reduction experiment (Alginate-Silicate Beads containing PEDOT:PSS)...15
2.2 Electrochemical experiments...............................................................................16
2.2.1 Preparation of coated electrodes..........................................................................17
3. Results and Discussion 3.1. Non-electrochemical experiments.......................................................................18
3.1.1 Alginate-Silicate Beads........................................................................................18
3.1.2 Alginate-PEDOT:PSS Beads...............................................................................20
3.2. Electrochemical Experiments..............................................................................22
3.2.1. Alginate Carbon Felt Electrode...........................................................................22
3.2.2. PEDOT:PSS Alginate Carbon Felt Electrode.....................................................28
4. Conclusion ...................................................................................................................34 References............................................................................................................................35

1
1. Introduction
1.1 Carbon Dioxide as Greenhouse Gas
Nowadays, global warming is the major environmental issue worldwide1. This problem is
strongly correlated with carbon dioxide which accounts as main anthropogenic greenhouse
gas. The CO2 emission levels are increasing rapidly due to combustion of fossil fuels by
industry and transport. Further, deforestation interferes with photosynthesis and decreases
therefore natural CO2 regeneration.2 The world economies depend on fossil fuels as energy
source, which leads to an increase of CO2 emissions.3 Currently fossil fuel fired power plants
are responsible for 80% of total energy production worldwide, thus they are the largest source
of CO2 emissions, accounting for roughly 40% of total CO2 emissions.4
There is an urgent need to reduce atmospheric CO2 emissions as natural occurring
photosynthesis is not longer able to convert all the masses of CO2 which are produced
throughout the world.
The Keeling curve illustrates the rising atmospheric CO2 content in the atmosphere of the past
60 years. Continuous CO2 measurements from Mauna Loa, Hawaii (blue) and at the South
Pole (red) predict both a constant increase of the atmospheric CO2 level. Recently the amount
of CO2 in the earth’s atmosphere was determined at 393 ppm by the Mauna Loa Observatory
(see Figure 1).5
Figure 1: Constant increase of the CO2 levels from records from Mauna Loa, Hawaii (blue) and at the South Pole (red).5

2
Further, Figure 2 shows records of the Vostok ice core. The graph demonstrates that
temperature is parallel ongoing with increase of atmospheric CO2. Although the atmospheric
CO2 content was following fluctuation over time it is obvious that now the highest level ever
has been reached and there is no decrease of CO2 content expected, as it was observed in
former times. However, it is alarming that the CO2 concentration was increasing rapidly in the
last few years and it is proven that this correlates to the global warming that is proven by
melting glaciers and significant changes in nature and environment.6
Recycling of CO2 to useful fuels and organic molecules offers great potential to decrease
greenhouse gas emissions. Further CO2 offers high potential as carbon source and represents
therefore a source for sustainable energy.
There are several approaches to decrease atmospheric CO2. In this work we present the
chemical and electrochemical reduction of CO2 using enzymes as catalysts which will be
discussed in detail in section 1.4 (CO2 conversion by enzymes) and section 1.5 (Enyzmes as
catalysts).
Figure 2: Records of the Vostok ice core demonstrate the change in temperature and CO2 level in the last 400 000 years.6

3
1.2 Carbon Capture and Storage
One approach of decreasing atmospheric CO2 is Carbon Capture and Storage (CCS). CCS is a
combination of technologies to stabilize the CO2 concentration in the atmosphere while
maintaining carbon as the main energy source.
The CCS methodologies consist of three major steps: First the capture of CO2 from large point
sources, such as power plants and cement manufacturing facilities. In the next step this gas
mixture is liquefied and transported by pipeline or ship to the storage site. In the last step CO2
is injected into the storage site. The CO2 storage options comprise geological storage, ocean
storage and mineralization.3
A commercially attractive way of CO2 storage is the injection of CO2 into oil reservoirs to
enhance oil recovery (EOR).2 Further, EOR storage is also possible in deep unmineable coal
seams, with enhanced coal bed methane recovery (ECBMR) offsetting some of the costs of
storage. 7
Figure 3: Schematic view of a possible Carbon Capture and Storage chain (IPCC, 2005).3
In comparison to a power plant without CCS, a modern conventional power plant with CCS
could reduce CO2 emissions into the atmosphere by approximately 80-90%.2

4
However, the CCS concept is connected to high costs. The costs for a plant with CO2 capture
are higher due to increased investment costs, reduced plant efficiency, and increased
maintenance costs, as well as the costs for CO2 capture, transport and storage. In addition, the
environmental aspects also have to be considered as well as the risk of any leakage to the
surface.8
1.3 Carbon Capture and Utilization
Apart from Carbon Capture and Storage, Carbon Capture and Utilization (CCU) offers
favourable possibilities of addressing the CO2 problem. The aim of CCU is to convert CO2 to
fuel and other value-added products and simultaneously reducing atmospheric CO2. The
products obtained could supplement or replace chemical feedstocks in chemical,
pharmaceutical and polymer industries. Despite these approaches at the moment less than 1%
of global anthropogenic CO2 generated is utilized to useful products. The residual CO2 is
released to the atmosphere due to lack of economical technologies.1
CO2 is kinetically and thermodynamically stable, thus CO2 conversion reactions are
endothermic, which is a major difficulty in establishing industrial processes as any reaction
converting CO2 requires an energy input. Therefore, it would be reasonable to think about
renewable and especially excess energies as energy sources for CO2 conversion.2
Several approaches of CO2 utilization were presented by Aresta9,10 and George Olah11. They
investigated mainly the reduction of CO2 to several organic products and fuels like methanol.
Equation 1 depicts the standard redox potentials vs. normal hydrogen electrode for the
reduction of CO2 to different products in aqueous solution at pH 7, 25°C and 1 atm.
CO2 + e- → CO*- E0 = -1.90 V
CO2 + 2e- + 2H+ → CO + H2O E0 = -0.53 V
CO2 + 2e- + 2H+ → HCOOH E0 = -0.61 V
CO2 + 4e- + 4H+ → H2CO + H2O E0 = -0.48 V
CO2 + 6e- + 6H+ → CH3OH + H2O E0 = -0.38 V
CO2 + 8e- + 8H+ → CH4 + 2H2O E0 = -0.24 V
Equation 1: Standard redox potentials for CO2 reduction at pH 7 in aqueous solution vs. a normal
hydrogen electrode at 25 °C and1 atm.

5
However, CO2 is a stable molecule and indeed those potentials are higher in reality. Most
reactions require therefore high overpotentials for the reduction of CO2. To overcome the
thermodynamic barriers of CO2 reduction catalysts are necessary. They are used to lower the
overpotential by stabilizing the intermediate transition states between the linear CO2 molecule
and the intended product.12
In general, catalysis can be divided into two main application techniques: homogeneous and
heterogeneous. Homogeneous catalysts are in the same phase as the reactants in contrast to
heterogeneous catalysts which are in a different phase. The major advantage of heterogeneous
catalysts is the opportunity for the reusability of the catalyst and easier separation of catalyst
and product.
In the 1980’s electrochemical and photochemical approaches for the reduction of CO2 to CO
have been investigated by Lehn et al. The [fac-Re(2,2’-bipyridine)(CO)3Cl] complex was
used as an efficient homogeneous metal-organic catalyst for the electrocatalytic reduction of
CO2.13 It was applied in solution as well as with polypyrrole electrodes as demonstrated by
the group of Cosnier et al.14 Later, approaches of using such metal organic catalyst for the
photoelectrochemical and electrochemical CO2 reduction were done by the group of
Kubiak.15
Further pyridine was used as homogenous catalyst for CO2 reduction by the group of
Bocarsly. They investigated pyridine and its substituted derivatives as organic catalysts in the
electrocatalysis of CO2 redction to various products, such as formic acid, formaldehyde and
methanol, operating at low reaction overpotentials and yielding faradaic efficiencies of up to
22% for methanol production.16
Besides metal-organic complexes and organic molecules recent research also focuses on
biological systems as it was demonstrated by Li et al. The idea was to apply litoautrotrophic
microorganisms for the electrochemical production of formate from CO2 and H2O and its
conversion to higher alcohols.17 In a different approach Jiang et al. present the generation of
methane by methanogenous bacteria immobilized on carbon felt electrodes.18
This work focuses on another biocatalytic approach of CO2 reduction, which is the application
of enzymes and will be discussed in the following sections.
6
1.4 CO2 conversion with enzymes
Enzymes depict the ability of catalysing CO2 reduction at mild reaction conditions and to high
yields. Further, biocatalysts possess favourable properties such as biodegradability and
selectivity.
Already in 1976 the group of Ruschig et al. presented the reduction of CO2 to formate with
formate dehydrogenase and the co-enzyme NADH.19 Later, Kuwabata et al. show the
electrochemical reduction of CO2 using dehydrogenases as well but substituting the co-
enzyme NADH by chemical mediators.20 In another approach Aresta et al. used carboxylase
enzymes for the synthesis of benzoic acid from phenol and CO2.21 Obert and Dave presented
further the use of dehydrogenase enzymes immobilized in silica sol gel for CO2 conversion to
methanol.22 Adressing the substitution of NADH as well, Reda et al. showed the adsorption of
an electroactive enzyme on electrode surfaces to catalyze the efficient reduction of CO2 to
formate, mediated by methylviologen. The reaction requires only small overpotentials and
occurs under thoroughly mild conditions.23
In this work we concentrate on the formate dehydrogenase enzyme to proceed the 2e- CO2
reduction to formate. In the human body enzymes are responsible for the three step alcohol
oxidation to CO2. For CO2 reduction we try to mime this reaction in the counter direction to
reduce CO2 to formate using dehydrogenase enzymes. Dehydrogenases are enzymes that
transfer two hydrogen atoms from a reduced substrate to an electron acceptor. For this
reaction dehydrogenases require a so called coenzyme which will function as the electron
acceptor.24
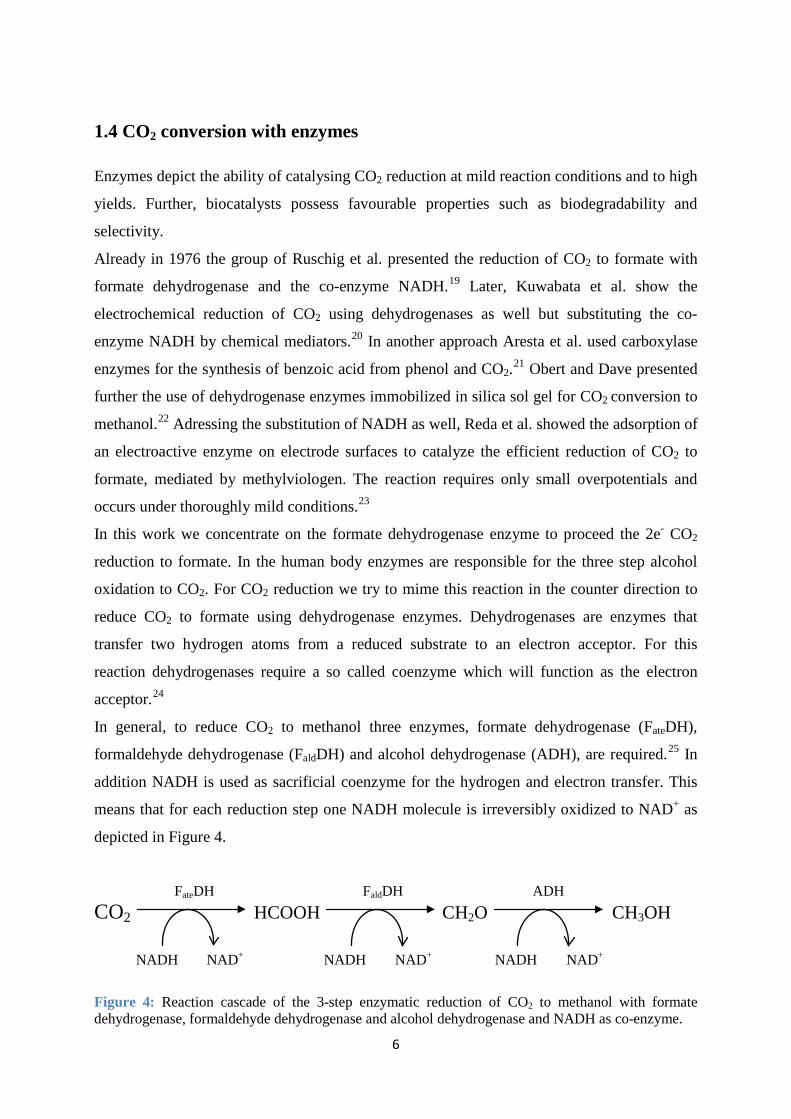
In general, to reduce CO2 to methanol three enzymes, formate dehydrogenase (FateDH),
formaldehyde dehydrogenase (FaldDH) and alcohol dehydrogenase (ADH), are required.25 In
addition NADH is used as sacrificial coenzyme for the hydrogen and electron transfer. This
means that for each reduction step one NADH molecule is irreversibly oxidized to NAD+ as
depicted in Figure 4.
FateDH FaldDH ADH CO2 HCOOH CH2O CH3OH NADH NAD+ NADH NAD+ NADH NAD+
Figure 4: Reaction cascade of the 3-step enzymatic reduction of CO2 to methanol with formate dehydrogenase, formaldehyde dehydrogenase and alcohol dehydrogenase and NADH as co-enzyme.

7
NADH regeneration, however, requires high energy inputs and increases therefore costs for
enzymatic CO2 reduction. In a new approach NADH can be substituted by direct electron
injection from an electrochemical system as shown in Figure 5. Similar approaches were
already done by Kuwabata and Reda.20,23
FateDH FaldDH ADH CO2 HCOOH CH2O CH3OH 2e- 2e- 2e- 2H+ 2H+ 2H+
Figure 5: Reaction cascade of the 3-step reduction of CO2 to methanol with formate dehydrogenase, formaldehyde dehydrogenase and alcohol dehydrogenase by direct electron injection.
In this work we show the comparison of NADH assisted processes of enzymatic CO2
reduction and experiments were NADH is substituted by a direct electron injection from an
electrochemical process. The latter offers the opportunity to substitute NADH and therefore to
decrease process costs significantly. To reduce reaction parameters we concentrate on the first
step of the reduction of CO2 to formate for the following work.
1.5 Enzymes as catalysts
In general enzymes are divided into six major groups according to the type of reaction they
catalyze (see Figure 6).26
Figure 6: Classification of enzymes into 6 major groups.26

8
Enzymes are biocatalysts that consist of a proteinic backbone with N- and C- terminus and an
active site, which can be a metal ion form for example Zn or Mg.27
Some enzymes require no chemical groups for their activity other than their amino acid
residues. Dehydrogenase, such as we are using in this work, as well as some other groups of
enzymes require sacrificial co-enzymes as energy donors. Possible co-factors are either
inorganic ions or complex organic molecules. Those cofactors can be a prosthetic group
which is tightly bound to the enzyme or a coenzyme which is released from the enzyme’s
active site during the reaction. Coenzymes transport chemical groups or rather charges,
substrates and formed products. However those co-enzymes are sacrificial and have to be
regenerated.27 Such regenerations require high energy inputs and are therefore difficult to
achieve. In natural system regenerations are performed by additional catalyzed cycles.
Generally, dehydrogenases use the coenzyme NADH, Nicotinamide adenine dinucleotide, as
electron acceptor.24
Figure 7: Structure of NADH (reduced form) and NAD+ oxidized form.28
The active part of NADH is the nicotinamide heterocyclic ring. At the beginning of the
reaction NADH is bound non-covalently by the enzymes and is released as its oxidized form
NAD+ after the reaction is finished. To be reusable for a reduction process NAD+ has to be
regenerated to NADH.
9
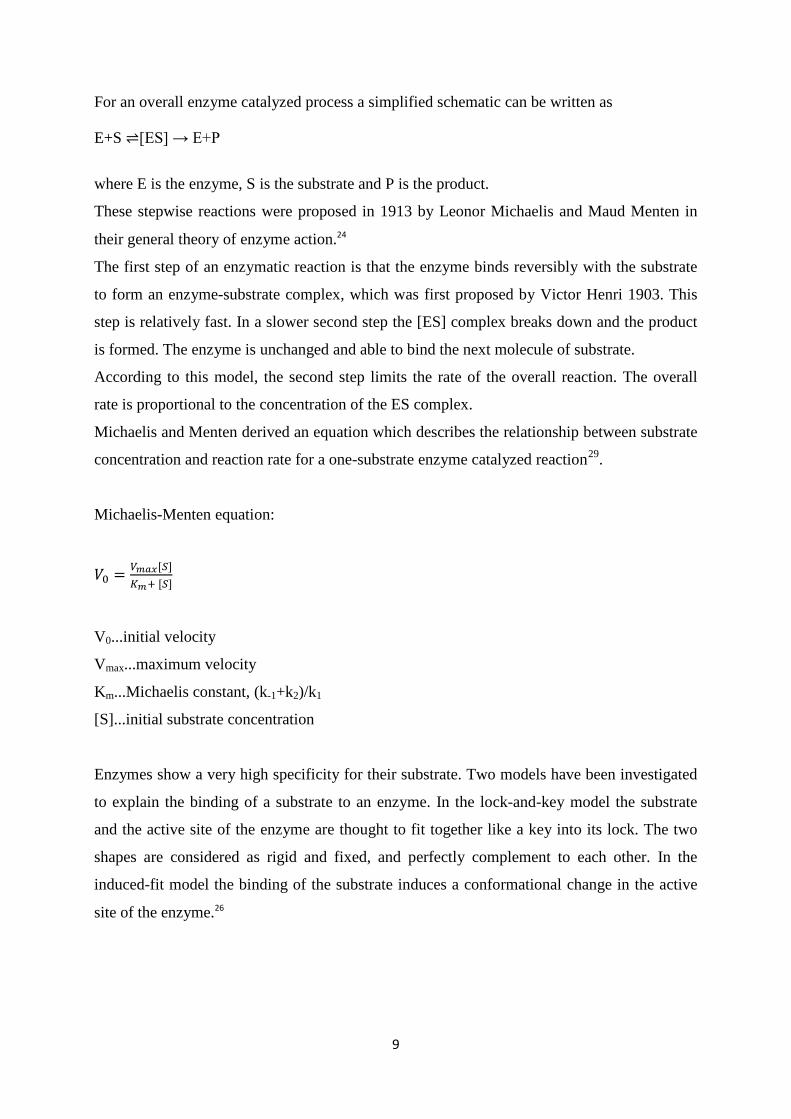
For an overall enzyme catalyzed process a simplified schematic can be written as
E+S [ES] → E+P
where E is the enzyme, S is the substrate and P is the product.
These stepwise reactions were proposed in 1913 by Leonor Michaelis and Maud Menten in
their general theory of enzyme action.24
The first step of an enzymatic reaction is that the enzyme binds reversibly with the substrate
to form an enzyme-substrate complex, which was first proposed by Victor Henri 1903. This
step is relatively fast. In a slower second step the [ES] complex breaks down and the product
is formed. The enzyme is unchanged and able to bind the next molecule of substrate.
According to this model, the second step limits the rate of the overall reaction. The overall
rate is proportional to the concentration of the ES complex.
Michaelis and Menten derived an equation which describes the relationship between substrate
concentration and reaction rate for a one-substrate enzyme catalyzed reaction29.
Michaelis-Menten equation:
𝑉0 = 𝑉𝑚𝑎𝑥[𝑆]𝐾𝑚+ [𝑆]
V0...initial velocity
Vmax...maximum velocity
Km...Michaelis constant, (k-1+k2)/k1
[S]...initial substrate concentration
Enzymes show a very high specificity for their substrate. Two models have been investigated
to explain the binding of a substrate to an enzyme. In the lock-and-key model the substrate
and the active site of the enzyme are thought to fit together like a key into its lock. The two
shapes are considered as rigid and fixed, and perfectly complement to each other. In the
induced-fit model the binding of the substrate induces a conformational change in the active
site of the enzyme.26

10
Figure 8: Binding methods of a substrate to an enzyme (a) lock-and-key model; (b) induced-fit model.26
For the utilization of enzymes it is essential to know that the three-dimensional conformation
of the enzyme has an important effect on the catalytic activity. The catalytic activity of the
enzyme is lost if the enzymes is denatured or broken down into its component amino acids27.
Not only the conformation but also the active center plays an important role in enzyme
catalysis. The active site of an enzyme is the part where the enzyme interacts with the
substrate to form a substrate-enzyme complex. The active center consists of two sites which
are lined with amino acid residues whose substituent groups binds the substrate and catalyze
its chemical formation.30 One site participates in the catalytic reaction whereas the other site
controls the substrate specificity of the enzyme.
Enzymes offer several advantages, but depict also some unfavourable characteristics. On the
one hand enzymes show the ability to catalyze a reaction under very mild conditions in
neutral aqueous solution at normal temperatures, pressures30 and pH values27. Moreover, they
possess a very high specificity for their substrate, which makes them especially suitable for
CO2 recycling. On the other hand, enzymes are unstable molecules, due to their proteinic
structure and they cannot be used in organic solvents or at elevated temperatures. Further,
synthesis of enzymes is complex and expensive. Therefore it is necessary to optimize
experiments towards reusability and stability of the biocatalysts.

11
1.6 Immobilisation of enzymes
As mentioned in section 1.4 applications of enzymes are limited due to high costs of enzyme
synthesis. To benefit from the advantages of enzymes such as high yield, selectivity and
biocompatibility those catalysts need to be separated from the product after reduction
reactions. In this work the idea was to combine favourable properties of enzymes and
heterogeneous catalysis. Immobilisation of enzymes in certain matrices provides reusability
and stability of enzymes.
Considering these facts for enzyme immobilisation it is necessary to retain the native structure
as far as possible. Consequently, immobilisation should be performed under very mild and
well-controlled conditions, as the catalytic activity is changed if the amino acid residues at the
active centre or the tertiary structure are altered.30
For enzymes following immobilisation techniques are known:
1. Carrier binding method: the binding of enzymes to water-insoluble carriers
2. Cross-linking method: intermolecular cross-linking of enzymes by means of
bifunctional or multifunctional reagents
3. Entrapping method: incorporation of enzymes into the lattice of a semipermeable gel
or enclosing the enzymes in a semipermeable polymer membrane where the enzyme
itself does not bind to the gel matrix or membrane.
Figure 9: Different methods for enzyme immobilisation a) carrier binding method, b) cross-linking method, c) entrapping method.30

12
As immobilisation matrices several materials have been investigated. Aresta et al. investigated
agar as well as polyacrylamide, pumice and zeolithe materials concerning stability and
activity of the carboxylase enzyme to be used for the synthesis of benzoic acid from phenol
and carbon dioxide.21 Further different kinds of sol-gels were investigated for the
immobilisation of enzymes. Obert and Dave presented the immobilization of dehydrogenase
enzymes for chemical CO2 reduction in silica sol-gel matrices.22 The most frequently used
technique for the immobilisation of enzymes is the encapsulation in alginate containing gels
like Heichal-Segal presented in 1995.31 Based on this idea the groups of Lu and Wu were
using a hybrid alginate silicate gel for the immobilisation of dehydrogenase enzymes.32 The
cross-linking of silica with the alginate matrix leads to a compact and porous composite with
good diffusion characteristics. This immobilisation matrix ensures the stability of the enzyme
without inhibiting the active site and makes it therefore reusable for several reaction
processes.

13
2. Experimental Part
All chemicals were used as received. Formate dehydrogenase (from candida boidinii,
lyphilized powder, 5-15 units/mg protein) was purchased from Sigma Aldrich. NADH,
Tetraethylorthosilicate (TEOS), Tris(hydroxymethyl)-aminomethan (TRIS) and PEDOT:PSS
were as well obtained from Sigma Aldrich. Concentrated Hydrochloric acid (37%) was
purchased from Fischer Scientific. The pH of the TRIS buffer solution was adapted with 1M
HCl to pH 7.64 according to the pH optimum of formate dehydrogenase between 7.5 and 8.5.
Products from CO2 reduction experiments were analysed by manual injection of liquid
samples in capillary ion chromatography (CAP-IC, Dionex ICS 5000, AS 19 analytical
column). Identification of the product in CAP-IC was done by using external standards with
different concentration of formate in buffer solution.
2.1 Non-electrochemical experiments
2.1.1 Preparation of Alginate-Silicate Beads
5 mg of FateDH were dissolved in 1 mL 0.05 M TRIS-HCl buffer and added to a mixture of
0.1 g alginic acid sodium salt in 4 mL 18mΩ water and 1.47 mL TEOS to obtain a
2% alginate solution.
For precipitation and to achieve high surface areas, the solution was slowly dropped into a
0.2 M CaCl2 solution with a 5 mL syringe to form beads of 2-3 mm diameter. Immediate
gelation could be observed. After 30 minutes of congelation the beads were filtered and rinsed
with 18mΩ water.
Figure 11: Precipitated alginate-silicate beads. Figure 10: Liquid gel matrix for
preparation of alginate-silicate beads.

14
2.1.2 CO2 reduction experiment (Alginate-Silicate Beads)
For the CO2 reduction experiment the alginate-silicate beads were put into a three-necked
flask containing 3 mL TRIS-HCl buffer of pH 7.64. Approximately 5-10 mg NADH were
filled into a small vial. The vial was connected to the flask via a tube and not added directly to
prevent NADH oxidation. After saturating the reaction cell with N2 NADH was added. For
proof of the activity of the enzymes and successful reduction of CO2 to formate the system
was purged with N2 and CO2 respectively after NADH addition. Before the reaction was
started and after about two hours of CO2 purging samples of the solution were taken. Samples
before and after the experiments were analysed and compared using CAP-IC.
2.1.3 Preparation of Alginate Beads containing PEDOT:PSS
The preparation of alginate beads with PEDOT:PSS was performed in the same way as for the
beads in section 2.1.1. For adding PEDOT:PSS to the mixture alginic acid sodium salt was
dissolved in 4 mL filtered PEDOT:PSS instead of 18mΩ water. Further steps were performed
identically (section 2.1.1).
CO2/N2 gas inlet and outlet
flask for NADH addition
three-necked flask containing beads in 3 mL TRIS-HCl buffer
Figure 12: Simplified setup used for the non-electrochemical experiments to purge alginate-silicate beads with N2/CO2. Consisting of a three-necked flask containing the beads, a flask for addition of NADH, a N2/CO2 inlet as well as a gas outlet.

15
2.1.4. CO2 reduction experiment (Alginate-Silicate Beads containing PEDOT:PSS)
CO2 reduction was performed as it was done for enzyme beads without PEDOT:PSS. Again
samples of the N2 purged system were compared to samples of the CO2 purged system before
and after the experiment by using CAP-IC analysis.
16
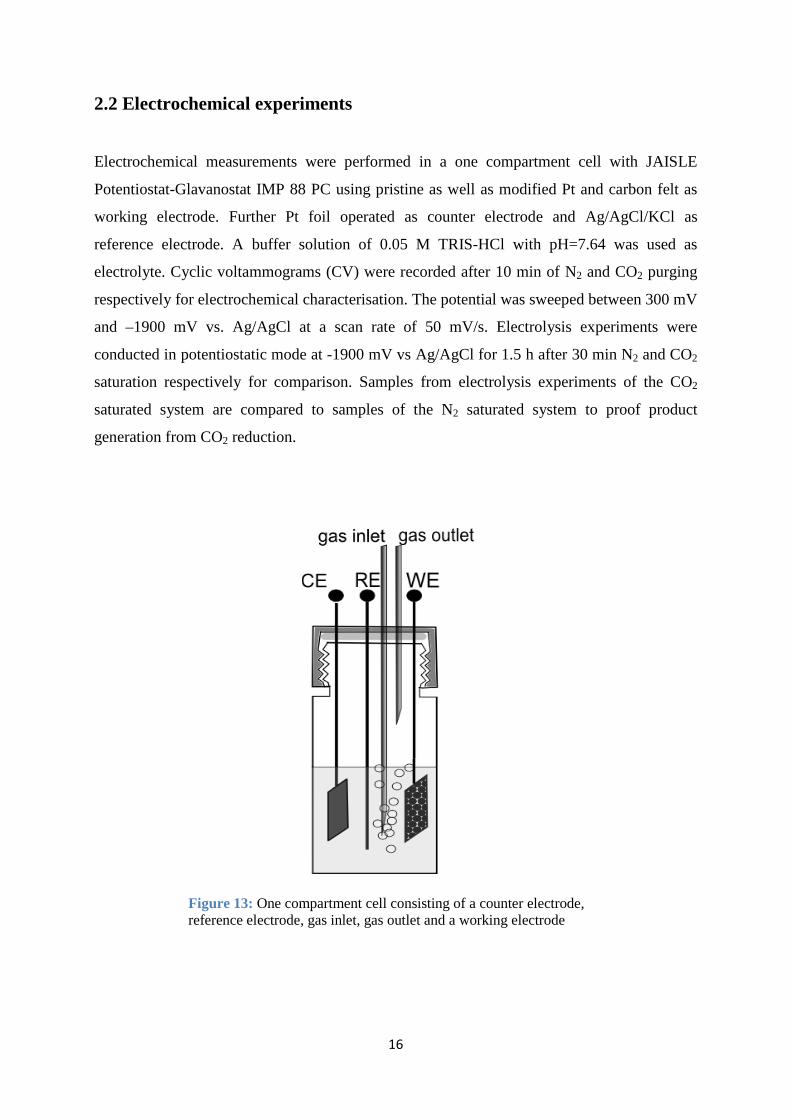
2.2 Electrochemical experiments
Electrochemical measurements were performed in a one compartment cell with JAISLE
Potentiostat-Glavanostat IMP 88 PC using pristine as well as modified Pt and carbon felt as
working electrode. Further Pt foil operated as counter electrode and Ag/AgCl/KCl as
reference electrode. A buffer solution of 0.05 M TRIS-HCl with pH=7.64 was used as
electrolyte. Cyclic voltammograms (CV) were recorded after 10 min of N2 and CO2 purging
respectively for electrochemical characterisation. The potential was sweeped between 300 mV
and –1900 mV vs. Ag/AgCl at a scan rate of 50 mV/s. Electrolysis experiments were
conducted in potentiostatic mode at -1900 mV vs Ag/AgCl for 1.5 h after 30 min N2 and CO2
saturation respectively for comparison. Samples from electrolysis experiments of the CO2
saturated system are compared to samples of the N2 saturated system to proof product
generation from CO2 reduction.
Figure 13: One compartment cell consisting of a counter electrode, reference electrode, gas inlet, gas outlet and a working electrode

17
2.2.1 Preparation of coated electrodes
For the immobilisation of enzymes on an electrode also alginate-silicate hybrid gels were
used. For a better adhesion on the electrode the viscosity of the alginate solution was therefore
increased to 4%. Experiments were conducted using pristine alginate-silicate sol-gels as well
as PEDOT:PSS modified gels.
The platinum or carbon felt, respectively, was alternately dipped into the alginate solution and
the CaCl2. After dipping into the CaCl2 solution the electrode was rinsed with 18mΩ water.
These steps were as long repeated until the electrode was fully coated. For complete gelation
of the alginate solution the electrode was immersed in the CaCl2 solution for 30 minutes.
Figure 14: Platinum working electrode coated with PEDOT:PSS-alginate matrix (black); platinum foil counter electrode and reference electrode Ag/AgCl/KCl

18
3. Results and Discussion
3.1 Non-electrochemical experiments
3.1.1 Alginate-Silicate Beads Graph 1 shows the comparison of samples after saturating the cell with N2 and CO2
respectively. At the characteristic retention time of formate at t=6.9 min a growing peak is
observed after purging the system with CO2. The small peak observed for the sample after N2
purging is also observed for water injections and is therefore attributed to device
contamination. The practical yield of formate is 7.38 ppm (0.16 mmol/L). To optimize the
yield of formate production duration of purging with CO2 can be increased as well as the
amount of NADH added, which are the limiting factors for formate generation (see Figure 4).
Graph 1: Comparison of IC measurements of alginate-silica beads containing FateDH. The red curve depicts the IC analysis after CO2 purging, the black curve indicates the IC analysis after N2 purging of the setup. At retention time t=6.9 min formate production is obvious for the CO2 purged system.

19
In Graph 2 the comparison of samples without enzymes is shown. Compared to Graph 1
formate peaks at retention time t=6.9 min are much smaller. Further for the peak of the N2
purged system similar peak areas are determined as for the peak of the CO2 purged system
and therefore correlate with impurity fluctuations of column and laboratory equipment. At
retention times t=5.5 min to t=6.3 min peaks indicate common contaminations of acetate and
fluoride from laboratory equipment such as syringes, filters and non-purified water. To avoid
these impurities for further experiments syringes and filters used were first rinsed with 18mΩ
water several times and then rinsed with the sample solution. For diluting samples and for
buffer solution as well ultrapure 18 mΩ water was used only.
Summarized, as expected for experiments without enzyme no formate peak increase can be
observed.
Graph 2: Comparison of IC measurements of alginate-silica beads without FateDH. The red curve depicts the IC analysis after CO2 purging, the black curve indicates the IC analysis after N2 purging of the setup.

20
3.1.2 Alginate-PEDOT:PSS Beads Also for the PEDOT:PSS modified alginate beads a peak at t=6.9 min in the CO2 purged
system is clearly visible as shown in Graph 3. It can be concluded that PEDOT:PSS does not
deactivate or even inhibit the active centre of the enzyme. The experiment yielded
approximately 2.8 ppm (0.06 mmol/L) of formate which is in the same order of magnitude
than determined for beads without PEDOT:PSS.
As expected the system without enzyme did not produce any formate (see
Graph 4).
Graph 3: Comparison of IC measurements of PEDOT:PSS beads containing FateDH. The red curve depicts the IC analysis after CO2 purging, the black curve indicates the IC analysis after N2 purging of the setup. At retention time t=6.9 min formate production is obvious for the CO2 purged system.

21
Graph 4: Comparison of IC measurements of PEDOT:PSS beads without FateDH. The red curve depicts the IC analysis after CO2 purging, the black curve indicates the IC analysis after N2 purging of the setup.

22
3.2 Electrochemical Experiments
3.2.1. Alginate Carbon Felt Electrode In Graph 5 the CVs of a carbon felt electrode modified with enzymes are shown. Compared to
the CV after N2 purging an increase in current density from -1500 mV vs. Ag/AgCl is
observed for the system after CO2 purging. This indicates reduction of CO2 at an overpotential
of 1.1V. Therefore electrolysis experiments were conducted in potentiostatic mode at -1.8 V
vs. Ag/AgCl.
Graph 5: Comparison of cyclic voltammograms of CF electrode with immobilized alginate containing FateDH. The black curve depicts CV after 10 min of N2 purging, the red curve shows the CV after CO2 purging with increase in reductive current.

23
Graph 6: Comparison of the measured current on the time of electrolysis. The red curve depicts the current of electrolysis after CO2 purging, and the black curve shows the current of electrolysis after N2 purging.
The chromatograms of samples after electrolysis experiments in Graph 7 shows a distinct
increased peak at the retention time of formate at t=6.8 min for the CO2 purged system
compared to the N2 purged system. This result shows for the first time that FateDH can be
addressed directly without requiring any sacrificial co-enzyme. Electrons are provided by the
electrode in the electrochemical system. Hydrogen is provided by the aqueous buffer solution.
This direct electrochemical reduction of CO2 by an immobilized enzyme gives the
opportunity for a highly selective CO2 conversion at decreased costs. For this process around
5.5 ppm (0.12 mmol/L) at 3.71 Coulombs were detected which corresponds to a Faradaic
efficiency of around 10%. The peak at t=6.0 min again correlates to acetate contamination.
Moreover, Graph 6 confirms the production of formate.

24
Graph 7: Comparison of IC measurements of carbon felt alginate electrode containing FateDH. The red curve depicts the IC analysis after CO2 purging, the black curve indicates the IC analysis after N2 purging of the setup. At retention time t=6.8 min formate production is obvious for the CO2 purged system.

25
In Graph 8 also for the pristine alginate electrode without enzymes a small reductive current
after CO2 purging was observed. Due to this result an electrolysis experiment as well as
CAP-IC analysis were performed which did not feature any CO2 reduction products. As
expected formate was not detected since there was no active enzyme used in the experiment.
Graph 8: Comparison of cyclic voltammograms of CF electrode with immobilized alginate containing FateDH. The red curve depicts CV after 10 min of N2 purging, the red curve shows the CV after CO2 purging with increase in reductive current

26
Graph 9: Comparison of the measured current on the time of electrolysis. The red curve depicts the current of electrolysis after CO2 purging, and the black curve shows the current of electrolysis after N2 purging.

27
As expected, Graph 10 shows no visible change of the formate peak. For this experiment no
enzymes were immobilized. The peak height of the formate peak is assumed to be increased
due to fluctuation problems of the conductivity detector used for the CAP-IC device.
Graph 10: Comparison of IC measurements carbon felt alginate electrode without FateDH. The red curve depicts the IC analysis after CO2 purging, the black curve indicates the IC analysis after N2 purging of the setup.
28
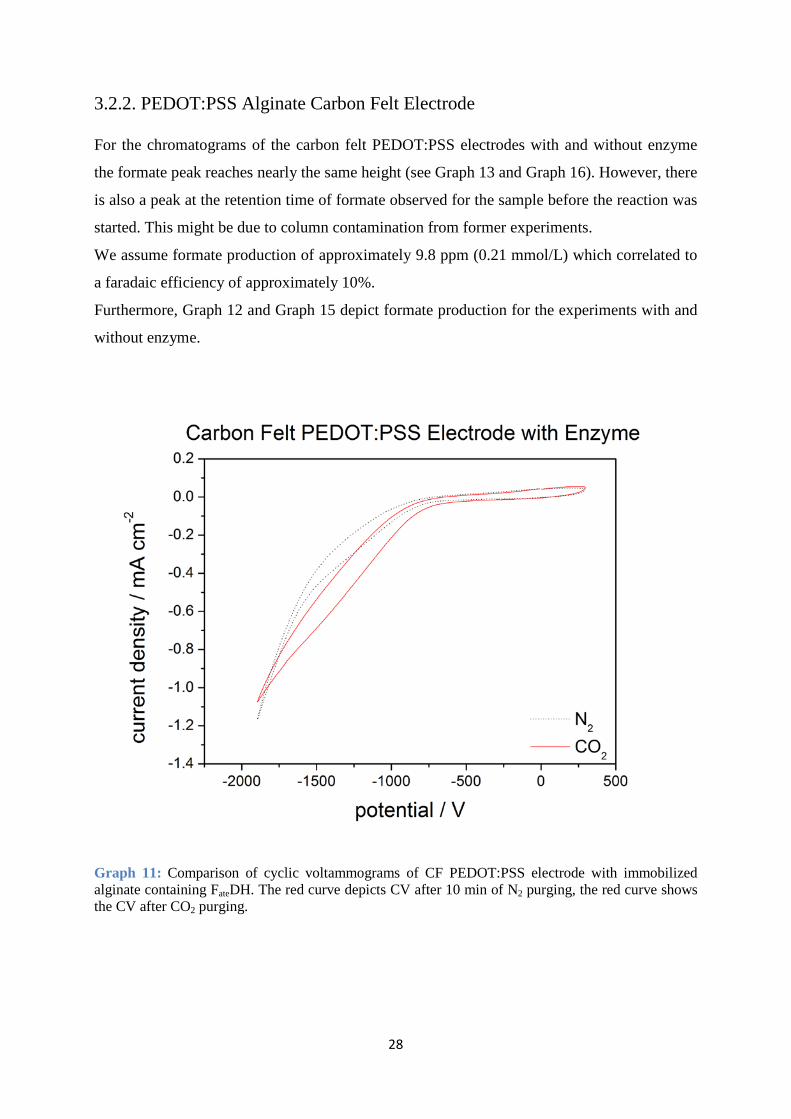
3.2.2. PEDOT:PSS Alginate Carbon Felt Electrode For the chromatograms of the carbon felt PEDOT:PSS electrodes with and without enzyme
the formate peak reaches nearly the same height (see Graph 13 and Graph 16). However, there
is also a peak at the retention time of formate observed for the sample before the reaction was
started. This might be due to column contamination from former experiments.
We assume formate production of approximately 9.8 ppm (0.21 mmol/L) which correlated to
a faradaic efficiency of approximately 10%.
Furthermore, Graph 12 and Graph 15 depict formate production for the experiments with and
without enzyme.
Graph 11: Comparison of cyclic voltammograms of CF PEDOT:PSS electrode with immobilized alginate containing FateDH. The red curve depicts CV after 10 min of N2 purging, the red curve shows the CV after CO2 purging.

29
Graph 12: Comparison of the measured current on the time of electrolysis. The red curve depicts the current of electrolysis after CO2 purging, and the black curve shows the current of electrolysis after N2 purging.

30
Graph 13: Comparison of IC measurements of carbon felt PEDOT:PSS electrode containing FateDH. The red curve depicts the IC analysis after CO2 purging, the black curve indicates the IC analysis after N2 purging of the setup. At retention time t=6.7 min formate production is obvious for the CO2 purged system.

31
Graph 14: Comparison of cyclic voltammograms of CF PEDOT:PSS electrode with immobilized alginate containing FateDH. The red curve depicts CV after 10 min of N2 purging, the red curve shows the CV after CO2 purging.

32
Graph 15: Comparison of the measured current on the time of electrolysis. The red curve depicts the current of electrolysis after CO2 purging, and the black curve shows the current of electrolysis after N2 purging.

33
Graph 16: Comparison of IC measurements of carbon felt PEDOT:PSS electrode without FateDH. The red curve depicts the IC analysis after CO2 purging, the black curve indicates the IC analysis after N2 purging of the setup.

34
4. Conclusion This work presents two different ways to convert CO2 to formate by using formate
dehydrogenase as biocatalyst. Non-electrochemical as well as electrochemical experiments
delivered formate generation from CO2 reduction experiments using immobilized FateDH.
These results support the approach of immobilizing dehydrogenase enzymes in hybrid
alginate-silicate sol-gel matrices as convenient method to immobilize enzymes and stabilize
them at the same time. The yields of formate generation of the non-electrochemical
experiments using pristine alginate-silicate sol-gels and PEDOT:PSS modified gels are in the
same order of magnitude. To optimize the yield of formate production duration of purging
with CO2 can be increased as well as the amount of NADH added, which are the limiting
factors for formate generation. Moreover, it can be concluded that PEDOT:PSS does not
deactivate or inhibit the active centre of the enzyme. However, PEDOT:PSS modified gels
still need to be improved by conducting further experiments with varying amounts of
PEDOT:PSS.
As a next step the CO2 reduction process using dehydrogenase enzymes has to be extended by
using the enzyme cascade with FateDH, FaldDH and ADH to obtain methanol.
The preliminary results of this work for the two electron reduction (one step) of CO2 to
formate using FateDH, show for the first that enzymes can be addressed directly without any
sacrificial mediator or co-enzyme needed. This offers the opportunity of NADH substitution
and provides therefore a highly selective way of CO2 reduction and sustainable energy
conversion. Experiments will be carried out further to investigate the influence of
PEDOT:PSS on enzymatic CO2 reduction using electrochemistry.

35
References
1 Boxun Hu, Curtis Guild, Steven L. Suib, Journal of CO2 Utilization 2013, 18-27 2 Kai Man Kerry Yu, Igor Curcic, Joseph Gabriel, and Shik Chi Edman Tsang,
ChemSusChem 2008, 1, 893-899 3 J.C.M. Pires, F.G. Martins, M.C.M. Alvim-Ferraz, M.Simoes, Chemical Engineering
Research and Design 2011, 89, 1446-1460 4 Brett P. Spigarelli, S. Komar Kawatra, Journal of CO2 Utilization 2013, 1, 69-87 5 R.F. Keeling, Science 2008, 319 6B. Chameides, Environmental Defense Fund, 2007,
http://blogs.edf.org/climate411/2007/06/29/human_cause-3/ 7 F. Johnsson et al, THERMAL SCIENCE 2012, 16, 655-668 8 Paul Johnston, David Santillo, Greenpeace Research Laboratories, University of Exeter,
Prince of Wales Road, Exeter, EX4 4PS 9 M. Aresta, Carbon Dioxide as Chemical Feedstock, 2010, WILEY-VCH Verlag GmbH&Co.
KGaA, Weinheim 10 M. Aresta, Carbon Dioxide Recovery and Utilisation, 2010, Kluwer Academic Publishers 11 G.A. Olah, A. Goeppert, G.K.S. Prakash, Beyond Oil and Gas: The Methanol Economy,
2009, WILEY-VCH Verlag GmbH&Co. KGaA, Weinheim 12 B. Kumar, M. Llorente, J. Froehlich, T. Dang, A. Sathrum, C.P. Kubiak, Annu. Rev. Phys.
Chem., 2012, 63, 541-569 13 J.Hawecker, J.-M. Lehn, R. Ziessel, Helvetica Chimica Acta 1986, 69, 1990-2012 14 S. Cosnier, A. Deronizer, J.-C. Moutet, J. Mol. Catal.1988, 45, 381-391 15 E.E. Benson, C.P. Kubiak, A.J. Sathrum, J.M. Smieja, Chem.Soc.Rev. 2009, 38, 89-99 16 E. Barton Cole, P.S. Lakkaraju, D.M. Rampulla, A. J. Morris, E.Abelev. A.B. Bocarsly,
J.AM.CHEM. SOC 2010, 132, 11539-11551 17 H. Li, P. H. Opgenorth, D. G. Wernick, S. Rogers, T.-Y. Wu, W. Higashide, P. Malati, Y.-
X. Huo, K. Myung Cho, J. C. Liao, Science 2012, 335, 1596 18 Y.Jiang, M. Su, Y.Zhang, G.Zhan, Y.Tao, D.Li, International Journal of Hydrogen Energy,
2013, 38, 3497-3502 19 U. Ruschig, U. Müller, P. Willnow, T. Höpner, Eur. J. Biochem., 1976, 70, 325-330 20 S. Kuwabata, R. Tsuda, H. Yoneyama, J. Am. Chem. Soc., 1994, 116, 5437-5443 21 M. Aresta, E. Quaranta, R. Libero, C. Dileo, I. Tommasi, Tetrahedron 1998, 54, 8841-8846 22 R. Obert, B. C. Dave, J.Am.Chem. Soc. 1999, 121, 12192-12193

36
23 T. Reda, C. M.Plugge, N. J. Abram, J. Hirst, PNAS 2008, 105, 10654-10658 24 T.D.H. Bugg , Introduction to Enzyme and Coenzyme Chemistry, 2nd edition 25 S.-w. Xu, Y. Lu, J. Li, Z.-y. Jiang, H. Wu, Ind. Eng. Chem. Res., 2006,45, 4567-4573 26 B.D.Hames, N.M. Hooper, Instant Notes Biochemistry, 2nd edition, 2000, BIOS Scientific
Publishers Limited 27 D.L.Nelson, M.M.Cox , Lehninger: Principle of Biochemistry 3rd editon 28 J. Koolman, K.H.Roehm, Color Atlas of Biochemistry, 2nd edition, 2005, Thieme 29 D.L.Nelson, M.M.Cox ,Lehninger: Principles of Biochemistry, 5th edition 30 Ichiro Chibata, Immobilized Enzymes – Research and Development, 1978 31 O. Heichal-Segal, S. Rappoport, S. Braun, Biotechnol. 1995, 13, 113-117 32 Y. Lu, Z.-Y. Jaing, S.-W. Xu, H. Wu, Ind. Catalysis Today 2006, 115, 263-268
Related Documents