Organisation for Economic Co-operation and Development ENV/WKP(2020)11 Unclassified English - Or. English 27 May 2020 ENVIRONMENT DIRECTORATE WHAT POLICIES FOR GREENING THE CRISIS RESPONSE AND ECONOMIC RECOVERY? LESSONS LEARNED FROM PAST GREEN STIMULUS MEASURES AND IMPLICATIONS FOR THE COVID-19 CRISIS - ENVIRONMENT WORKING PAPER N°164 By Shardul Agrawala, Damien Dussaux and Norbert Monti (1) (1) OECD Environment Directorate OECD Working Papers should not be reported as representing the official views of the OECD or its member countries. The opinions expressed and arguments employed are those of the authors. Authorised for publication by Rodolfo Lacy, Director, Environment Directorate Keywords: Stimulus package, environmental policy, policy evaluation, policy design, green growth JEL Classification: E61, E62, E65, O44 and Q58 OECD Environmental Working Papers are available at www.oecd.org/environment/workingpapers.htm JT03462172 OFDE This document, as well as any data and map included herein, are without prejudice to the status of or sovereignty over any territory, to the delimitation of international frontiers and boundaries and to the name of any territory, city or area.

Welcome message from author
This document is posted to help you gain knowledge. Please leave a comment to let me know what you think about it! Share it to your friends and learn new things together.
Transcript

Organisation for Economic Co-operation and Development
ENV/WKP(2020)11
Unclassified English - Or. English
27 May 2020
ENVIRONMENT DIRECTORATE
WHAT POLICIES FOR GREENING THE CRISIS RESPONSE AND
ECONOMIC RECOVERY?
LESSONS LEARNED FROM PAST GREEN STIMULUS MEASURES AND
IMPLICATIONS FOR THE COVID-19 CRISIS - ENVIRONMENT WORKING
PAPER N°164
By Shardul Agrawala, Damien Dussaux and Norbert Monti (1)
(1) OECD Environment Directorate
OECD Working Papers should not be reported as representing the official views of the OECD
or its member countries. The opinions expressed and arguments employed are those of the
authors.
Authorised for publication by Rodolfo Lacy, Director, Environment Directorate
Keywords: Stimulus package, environmental policy, policy evaluation, policy design, green
growth
JEL Classification: E61, E62, E65, O44 and Q58
OECD Environmental Working Papers are available at www.oecd.org/environment/workingpapers.htm
JT03462172
OFDE
This document, as well as any data and map included herein, are without prejudice to the status of or sovereignty over any territory,
to the delimitation of international frontiers and boundaries and to the name of any territory, city or area.

2 ENV/WKP(2020)11
Unclassified
OECD ENVIRONMENT WORKING PAPERS
OECD Working Papers should not be reported as representing the official views of the OECD or of its
member countries. The opinions expressed and arguments employed are those of the author(s).
Working Papers describe preliminary results or research in progress by the author(s) and are published
to stimulate discussion on a broad range of issues on which the OECD works.
This series is designed to make available to a wider readership selected studies on environmental
issues prepared for use within the OECD. Authorship is usually collective, but principal author(s) are
named. The papers are generally available only in their original language –English or French- with a
summary in the other language.
Comments on Working Papers are welcomed, and may be sent to:
OECD Environment Directorate 2 rue André-Pascal, 75775 Paris Cedex 16, France
or by email: [email protected]
------------------------------------------------------------------------------------------
OECD Environment Working Papers are published on
www.oecd.org/environment/workingpapers.htm
------------------------------------------------------------------------------------------
This document and any map included herein are without prejudice to the status of or sovereignty over
any territory, to the delimitation of international frontiers and boundaries and to the name of any
territory, city or area.
The statistical data for Israel are supplied by and under the responsibility of the relevant Israeli
authorities. The use of such data by the OECD is without prejudice to the status of the Golan Heights,
East Jerusalem and Israeli settlements in the West Bank under the terms of international law.
© OECD (2020)
You can copy, download or print OECD content for your own use, and you can include excerpts from
OECD publications, databases and multimedia products in your own documents, presentations, blogs,
websites and teaching materials, provided that suitable acknowledgment of OECD as source and
copyright owner is given.
All requests for commercial use and translation rights should be submitted to [email protected].

ENV/WKP(2020)11 3
Unclassified
Abstract
This paper evaluates green stimulus packages that were introduced in response to the global
financial crisis (GFC) of 2007-08 and draws lessons relevant for greening the recovery
from the Coronavirus (COVID-19) crisis. The paper underscores the importance of
building in policy evaluation mechanisms into green stimulus measures. It also provides
evidence that the implementation of sufficiently large, timely and properly designed green
stimulus measures can generate economic growth, create jobs and bring about
environmental benefits. However, there are also trade-offs between competing economic,
environmental and social policy objectives, which underscores the importance of proper
policy design.
The paper also highlights key differences between the GFC and the COVID-19 crises and
how these differences might influence the green stimulus in the present context. The public
health priority to prevent the COVID-19 crisis from worsening is to severely restrict many
economic activities that could escalate virus transmission. In this context, green measures
could initially have a “do no harm” orientation by maintaining vigilance against
environmental rollbacks and ensuring that any measures taken to address the crisis do not
inadvertently exacerbate environmental impacts. Green stimulus would become more
relevant as the recovery begins, but these measures would need to be adapted to current
social priorities such as the environment-health nexus, concerns about a “just transition”,
as well reflect shifts in social preferences. COVID-19 is also unfolding in a policy context
that is very different from 2007-08. Costs of renewable energy have witnessed dramatic
declines, while new environmental issues like resource efficiency and the transition to a
circular economy have risen on the policy agenda. These developments offer new impetus
and opportunities for greening the recovery in the wake of the COVID-19 crisis.
Keywords: Stimulus package, environmental policy, policy evaluation, policy design,
green growth
JEL codes: E61, E62, E65, O44, Q58
4 ENV/WKP(2020)11
Unclassified
Résumé
Ce papier évalue les plans de relance verte qui ont été introduits en réponse à la crise
financière mondiale (CFM) de 2007-08 et tire des enseignements pertinents pour rendre
plus écologique la relance économique en réponse à la crise due au coronavirus (COVID-
19). Le papier souligne l'importance d'intégrer des mécanismes d'évaluation des politiques
publiques dans les mesures de relance verte. Il montre également que la mise en œuvre de
mesures de relance verte suffisamment importantes, opportunes et bien conçues peut
générer une croissance économique, créer des emplois et avoir des effets bénéfiques sur
l’environnement. Cependant, le papier met en évidence des arbitrages entre des objectifs
économiques, environnementaux et sociaux concurrents, ce qui souligne l'importance d'une
conception adéquate des politiques publiques.
Le papier souligne également les principales différences entre la CFM et celle de COVID-
19 et la manière dont ces différences pourraient influencer le plan de relance verte dans le
contexte actuel. La priorité de santé publique pour empêcher l’aggravation de la crise de
COVID-19 est de restreindre sévèrement de nombreuses activités économiques qui
pourraient augmenter la transmission du virus. Dans ce contexte, les mesures de relance
verte pourraient initialement consister à "ne pas nuire" à l’environnement en maintenant la
vigilance contre l’assouplissement des réglementations environnementales et en veillant à
ce que toute mesure prise pour faire face à la crise n'aggrave pas involontairement les
impacts environnementaux. Les mesures de relance verte deviendraient de plus en plus
pertinentes à mesure que la relance économique s'amorcerait, mais elles devraient être
adaptées aux priorités sociales actuelles, telles que le lien entre l'environnement et la santé
et les préoccupations relatives à une "transition juste", et refléter les changements dans les
préférences sociales. La crise de COVID-19 se déroule également dans un contexte
politique très différent de celui de 2007-08. Les coûts des énergies renouvelables ont connu
une baisse spectaculaire, tandis que de nouvelles questions environnementales, telles que
l'efficacité des ressources et la transition vers une économie circulaire, ont pris de plus en
plus d’importance dans l’agenda politique. Ces évolutions offrent un nouvel élan et de
nouvelles possibilités pour rendre la reprise suite à la crise de COVID-19 plus écologique.
Mots clés: Plan de relance, politique environnementale, évaluation des politiques
publiques, conception des politiques publiques, croissance verte
Classification JEL: E61, E62, E65, O44, Q58

ENV/WKP(2020)11 5
Unclassified
Acknowledgements
This paper was authored by Shardul Agrawala, Damien Dussaux and Norbert Monti at the
Environment and Economy Integration Division of the OECD Environment Directorate.
The authors gratefully acknowledge comments from delegates of the OECD’s Environment
Policy Committee (EPOC), as well as a number of colleagues including Peter Börkey,
Enrico Botta, Nils Axel Braathen, Jean Chateau, Anthony Cox, Antoine Dechezleprêtre,
Nathalie Girouard, Tobias Kruse, Elisa Lanzi, Walid Oueslati, Andrew Prag, Ron Steenblik
and Frédérique Zegel. Editorial support by Katjusha Boffa is also gratefully acknowledged.

6 ENV/WKP(2020)11
Unclassified
Executive Summary
Concomitant with the announcement of policy measures to respond to the Coronavirus (COVID-
19) crisis there have been growing calls to ensure that such measures integrate responses to
address a number of pressing environmental challenges. These developments are reminiscent of
the widespread calls for greening the stimulus and recovery packages in the wake of the 2007-08
global financial crisis (GFC). Over 16% of all GFC related fiscal stimuli (totalling over half a
trillion USD) were directed at green activities targeting renewable energy generation, energy
efficiency in buildings, scrappage payments for vehicles with low fuel efficiency, clean
technology development support, mass transit, nature conservation and water resource
management. Many of these measures are also being proposed in the context of greening the
COVID-19 recovery.
This paper examines what can be learnt from available evaluations of the impact of the green
elements of stimulus packages introduced in response to the GFC that is relevant for the current
context. A second objective of this paper is to examine how contextual differences between the
current crisis and the GFC are also relevant for the orientation, design and timing of measures to
green the COVID-19 recovery.
Lessons on green stimulus from the global financial crisis
Despite the magnitude of the overall investment, and the fact that a dozen years have elapsed
since the GFC, this paper finds a remarkable dearth of evaluations of the macroeconomic, labour
market and environmental effects of the green stimulus measures. Available evaluations also
primarily tend to be ex ante, relying often on strong and, at times, opaque, assumptions. Ex post
evaluations are relatively scarce and face the difficult task of defining a suitable counterfactual
against which the impacts can be compared. A key lesson from the GFC is the need for
systematically building in evaluation frameworks with clear criteria and robust methodologies
into green stimulus measures in response to COVID-19. The distributional consequences of green
stimulus measures should also be more explicitly considered in such evaluations.
This paper provides evidence that the implementation of sufficiently large, timely and properly
designed green stimulus measures, which are well-embedded into domestic policy settings, can
deliver economic and environmental benefits. At the same time, the paper also reveals the
potential trade-offs between competing economic, environmental and social policy objectives.
These trade-offs call for whole-of-government co-ordination to identify and mitigate potential
divergence in the achievement of different policy objectives. Some green measures, for example
in the Korean Green New Deal of 2009, had a positive impact on the economic recovery but had
unclear environmental benefits. Others, like the US Car Allowance Rebate System or “Cash-for-
Clunkers” programme, contributed to reduction of CO2 emissions but had limited impact on
economic growth and had a cost per job that was significantly higher than alternate stimulus
measures. A more general lesson from the ex post evaluation of green stimulus measures during
the GFC is that proper policy design is critical to prevent rebound effects, limit market distortion,
and ensuring additionality of public funding by improved targeting. Flanking policy instruments
that target underlying environmental externalities are also key to delivering greater environmental
benefits from green stimulus investments.

ENV/WKP(2020)11 7
Unclassified
Tailoring green recovery packages to the specificities of the COVID-19 crisis
The broad lessons from the GFC remain relevant for greening the COVID-19 recovery. At the
same time, specific proposals to green the COVID-19 stimulus cannot simply be a “cut and paste”
from the GFC playbook. The current crisis, triggered by a global pandemic, is fundamentally
different. It has been accompanied by a very significant loss of human life which continues to
climb; a tremendous strain on public health and social infrastructure; and significantly higher
economic and social consequences worldwide that continue to unfold. While a key element of
past crisis responses was to give an adrenalin shot to jumpstart economic activity, the fundamental
public health priority to prevent the COVID-19 crisis from worsening is to severely restrict many
economic activities that could escalate virus transmission.
An immediate priority, therefore, is to deal with the public health aftermath of the crisis and its
continued toll on society. In this context, green measures could have a “do no harm” orientation
and include maintaining vigilance on any rollback of environmental standards, ensuring that any
scale-back or suspension of environmental management activities is temporary, and making sure
that support measures put in place to restart the economy do not inadvertently exacerbate
environmental damage.
Even when economies begin to recover, and they may do so on multiple speeds, society and
societal priorities could undergo a significant change as a result of the devastating aftermath of
COVID-19. These should be reflected in green stimulus measures as well. The nexus between
public health and the environment, for example, will likely be a much higher public policy priority
now compared with previous crises, especially given the emerging evidence of links between
COVID-19 vulnerability and environmental stressors like air pollution. Concern about the social
and distributional consequences is also likely to be paramount. Much more so than in the case of
the GFC, to recover from the COVID-19 crisis, policy objectives towards a “just transition” and
co-benefits of the health-environment nexus should be considered in green stimulus packages.
There could also be longer-term impacts of COVID-19 on societal preferences that could, in turn,
lower the public acceptatibility of certain green measures like mass transit, while increasing
demand for others, such as infrastructure for soft mobility. As growth picks up, governments will
also have to ensure fiscal consolidation. In this context, they should consider whether and how
environmental taxes and pricing of externalities can help create appropriate price signals as well
as contribute to the reinvigoration of public finances.
Finally, COVID-19 is unfolding in a policy environment that is significantly different from 2007-
08. The costs of key renewable energy technologies such as solar and wind have fallen
dramatically since 2010 compared to other energy sources, making large scale financing more
economically attractive. At the same time, measures such as green public R&D support could
now target technologies that complement renewables but might be further from the market, such
as energy storage. Another development since the GFC is the heightened attention to improving
resource efficiency and the transition towards a more circular economy. Shifting away from
unsustainable natural resource use would not only reduce environmental impacts and supply risks,
it could also create job opportunities, for example in recycling, processing of secondary materials
and repairing goods. Investments to support repairability, reusability, remanufacturing and
recycling, largely absent in the green elements of the GFC stimulus, should also be considered as
they can help support value creation and economic resilience. These developments offer new
impetus and possibilities for greening the COVID-19 recovery.

8 ENV/WKP(2020)11
Unclassified
Table of Contents
Abstract ......................................................................................................................................... 3
Résumé .......................................................................................................................................... 4
Acknowledgements ....................................................................................................................... 5
Executive Summary ..................................................................................................................... 6
Introduction .............................................................................................................................. 9
Elements of a green fiscal stimulus ....................................................................................... 11
Green stimulus .......................................................................................................................... 12
Review of ex ante and ex post evidence of green stimulus packages following the global
financial crisis (GFC) ................................................................................................................. 14
Evaluation of green components in recovery packages ............................................................ 15 Overall ex post assessment of green recovery packages........................................................... 25 Areas for future evaluation ....................................................................................................... 28
Lessons from greening the GFC stimulus ............................................................................ 30
Towards greening a COVID-19 recovery ............................................................................. 32
References ................................................................................................................................... 35
Tables
Table 1: Green stimulus measures and their anticipated effects .................................................. 13
Figures
Figure 1: Cost per job created (USD million) .............................................................................. 21 Figure 2: Phases of policy response during and after the COVID-19 pandemic.......................... 33
Boxes
Box 3.1. Ex post evidence on renewable energy support and job creation .................................. 17 Box 3.2. The effect of smart meters on energy consumption ....................................................... 19 Box 3.3. Designing public R&D subsidies and R&D tax credit .................................................. 23 Box 3.4. The economic benefits of investing in mass transit ....................................................... 24 Box 3.5. Potential trade implications of specific green stimulus measures ................................. 29

ENV/WKP(2020)11 9
Unclassified
Introduction
As the world confronts the COVID-19 pandemic, caused by a novel coronavirus, governments
are acting decisively to contain the public health crisis and its immediate social and economic
fallout. The fiscal commitments announced by governments are extremely large, with a primary
focus on providing liquidity to firms and income support to vulnerable households (OECD,
2020[1]). These responses are due to the unprecedented nature of the pandemic, how quickly the
disease has transmitted globally, and the very heavy toll it continues to exact in terms of lives
lost, strain on the public health infrastructure and other social services, partial unemployment and
job losses and other economic strain due to lockdown measures.
The containment measures to address the public health crisis are themselves having very
significant economic impacts. The OECD Interim Economic Outlook estimates that these
measures could result in a decline of economic activity of 15-35% in some countries and a
reduction in consumer spending by one-third (OECD, 2020[2]). Fiscal support measures are
expected to shift gradually to addressing the adverse impacts of containment to adapt to the
changing nature of the risk, notably from liquidity to solvency (OECD, 2020[1]).
The support measures will progressively be followed by the more conventional “fiscal stimulus”
to support investment and consumption if growth is anaemic. Finally, once growth rebounds, the
focus is expected to shift to fiscal and other measures to restore public finances (OECD, 2020[1]).
How and when countries transition from one stage to the next will be uneven given the differential
impact of the (COVID-19) pandemic and its timing, and depending upon evolving national
circumstances, all of which currently remain highly uncertain.
Concomitant with the announcement of policy measures to respond to COVID-19 there are also
growing calls to ensure that such measures integrate responses to address a number of pressing
environmental challenges as part of the eventual economic stimulus packages to put countries on
the path to economic recovery (IEA, 2020[3]; OECD, 2020[4]). In their 15th of April 2020
Communiqué, the G20 Finance Ministers and Central Bank Governors also “commit to an
environmentally sustainable and inclusive recovery … guided by a sense of shared, long-term
responsibility for our planet and citizens, consistent with the 2030 Agenda for Sustainable
Development, our national and local development strategies, and relevant international
commitments” (G20, 2020[5]).
These developments are reminiscent of the widespread calls for greening the stimulus and
recovery packages in the wake of the global financial crisis (GFC) of 2007-08. The case for “green
growth”, in fact, first gained widespread prominence following the GFC leading, among other
things, to the adoption of the OECD’s Green Growth Strategy in 2011 (OECD, 2011[6]). Indeed,
green elements featured quite prominently in a number of stimulus and recovery packages that
were implemented in the wake of the GFC, including in Korea, the United States, Japan, the EU
and its Member States, and the People’s Republic of China (China). It is estimated that
approximately 16.3% (USD 521 billion) of all fiscal stimuli were green stimulus activities
(HSBC, 2010[7]).1 In the case of Korea, according to one estimate, the share was much higher and
amounted to almost 80% of the stimulus measures in total (ILO, 2010[8]).
1 As cited in ILO (2010[8]). Countries included in the HSBC (2010[7]) report are: Argentina, Australia,
Canada, Chile, China, EU Member States, India, Indonesia, Japan, Korea, Mexico, Norway, Saudi Arabia,
South Africa, Thailand, the United Kingdom, and the United States.

10 ENV/WKP(2020)11
Unclassified
After a decade has elapsed since many of these measures were put in place, this paper examines
what can be learnt from evaluations of the green elements of stimulus packages that were
introduced in response to the GFC. Are there pointers in terms of target areas, the use of particular
instruments and flanking measures, based on existing evaluations of such programmes?
The second objective of this paper is to offer some preliminary insights into how these lessons on
greening the recovery are relevant to the current situation, taking into account both the
commonalities and key differences between COVID-19, where the economic crisis is triggered
by a global pandemic, and the global financial crisis.
The remainder of this paper is organised as follows:
Section 2 provides a brief overview of the toolkit of instruments that governments have used in
previous crises, with a focus on green stimulus.
Section 3 reviews available peer-reviewed and other published literature on the evaluation of the
green elements of the policy packages put in place in the wake of the GFC. Most of the evaluations
focus on the relevant green packages in specific countries, or certain elements of those packages.
A few studies do, however, compare certain green elements that were implemented across
multiple countries.
Finally, Sections 4 and 5 conclude with key headline messages from the evaluation in the previous
section and offer some observations about how these lessons could be relevant for the COVID-
19 crisis – given its critical aspects that makes it different in fundamental ways from past crises
of a financial and economic nature.

ENV/WKP(2020)11 11
Unclassified
Elements of a green fiscal stimulus
Despite the fact that fiscal stimulus is a widely accepted measure to counter an economic
downturn (together with other measures, most notably monetary policies like quantitative easing),
the question arises about the effectiveness and the possible unintended consequences of such a
stimulus. Thus, planning the timing and targeting of the stimulus package are of great importance
(Elmendorf and Furman, 2008[9]). As in the case of quantitative easing, fiscal stimulus should also
be temporary in nature. For instance, a permanent tax cut or spending measures without an end-
date may lead to an eventual increase in budget deficit and increased levels of sovereign debt
which, in turn, could restrain future investment.
Elements of a fiscal stimulus package can be categorised into unemployment benefits, transfers
to low-income households, infrastructure spending, tax cuts, as well as additional measures to
boost aggregate demand. The fact that the latter, miscellaneous, additional measures often take
up a large portion of the stimulus packages highlights that targeting is often very specific to the
economy in question. In addition, these packages frequently include not only fiscal components
but also monetary elements, such as loan guarantees, which complicates categorisation of other
stimuli. The differentiation between already existing fiscal packages and the further rescue efforts
in the context of a stimulus can be difficult to tease out as well.
Most short-term fiscal stimulus measures have been concerned with boosting household and
business spending through lowering taxes or providing tax rebates. These could target income,
payroll or corporate taxes. Another measure may be a direct transfer to households, such as food
vouchers, or the extension of unemployment benefits (either in time or in extent). Increased
government spending not only has the direct benefit of increasing aggregate demand but it can
also induce businesses to hire more workers to meet the increased demand and thus lower
unemployment.
However, there remains the question of the need to balance the focus between the short-term and
medium- to long-term policy measures and ensuring their effectiveness. While unemployment
insurance, as well as food vouchers, along with transfers can be highly effective in the short run
to boost demand, infrastructure and technological investments may not be as effective over a
similarly short time period. Such investments often require additional planning and
implementation, and therefore are seen as better for tackling recovery in the medium and long
run. Many green packages are characterised by significant infrastructure and technological
spending and therefore can constitute part of such a broader response.
Finally, as growth picks up, governments will also have to think about measures to ensure fiscal
consolidation and put strained public finances back on a more healthy footing. These measures,
if implemented too early, may cripple economic recovery by prematurely engendering strong
austerity effects that would reduce aggregate demand. On the other hand, fiscal stimuli must be
temporary in nature lest they affect long-term economic growth. Fiscal consolidation may include
measures such as increasing various taxes, cutting government spending, reducing social security
spending, or decreasing unemployment benefits and pensions. Distributional consequences of
these fiscal consolidation measures should also be carefully examined.
What emerges from this very brief overview is the need for concerted and circumspect planning
of fiscal stimulus packages. Well-targeted policies are essential to mitigate the worst impacts of
the economic downturn. However, the subsequent weak growth will require stronger public
investment. Such investment will be particularly fruitful in areas for which there are large positive

12 ENV/WKP(2020)11
Unclassified
externalities and in which under-investment is at risk of occurring due to market failures,
including the environment.
Green stimulus
A green stimulus can be defined as “the application of policies and measures to stimulate short-
run economic activity while at the same time preserving, protecting and enhancing environmental
and natural resource quality both near-term and long-term” (Strand and Toman, 2010[10]). Indeed,
the main aspect that differentiates a green stimulus from green policies in general is that it has the
potential to be implemented more quickly, and its aim is to specifically respond to economic
shocks, while also contributing environmental benefits (ILO, 2010[8]). Hence, stimulus measures
should focus on economic activity in the short-run. However, the most effective short-run
measures in terms of economic recovery often may not have an environmental aspect.
The typology of green stimulus measures is varied, and considerably tailored to the circumstances
in which they are deployed. Generally speaking, green stimulus can be either direct, that is,
spending is targeted at green activities and commodities, or indirect, where economic effects are
felt through price mechanisms, where environmental tax revenues can be used to stimulate
economic activity (green or not) by, for example, cutting labour taxes. Protection and restoration
activities, such as building retrofits, as well as investment in traditional physical and human
capital with an intention to significantly bring on environmental and climate change co-benefits,
can also be seen as green stimulus measures (Strand and Toman, 2010[10]). In addition, the most
common stimulus measures have been indirect –tax cuts, subsidies, as well as direct –
infrastructure and spending programmes. Strand and Toman (2010[10]) identify motor vehicle
taxes, tax exemptions for electric vehicles, and tax incentives for expenditures to improve the
energy efficiency of buildings, as possible tax instruments. For general spending, large-scale
support for R&D in low-carbon vehicles, cash-for-clunkers programmes, investment into
renewable energy, and infrastructure investments have been most prominent. Table 1 shows the
different categories of stimulus and their expected effect on growth, greenhouse gas (GHG)
emission reduction and other environmental benefits.
Ensuring that environmental aspects are incorporated into the fiscal stimulus is not only viable
but could also have major co-benefits. The underlying logic of using green stimulus, as opposed
to one that does not have an environmental component is that the former is seen to be a “win-
win” policy (Strand and Toman, 2010[10]). Introducing environmental aspects into the packages
allows governments to make progress towards long-term environmental objectives, such as the
transition to a low-carbon and resource efficient economy, while also providing a boost to
economic activity in the shorter term.
Nevertheless, the nature and timing of policy packages must be carefully chosen. The short-term
measures of the fiscal package should be fully focused on stabilising the economy and boosting
economic activity by helping the most vulnerable households, by supporting the unemployed and
by providing relief to small and medium-sized enterprises that are most at risk.
Short-term enactment of stricter green policies could potentially be seen as disconnected from
reality and from the immediate social needs created by the economic downturn. Conversely, it
can be tempting for governments and administrations to rush through environmentally damaging
projects because they are ready to create short-term employment or to roll back existing
environmental regulations. The green component of fiscal stimulus packages, given their
technological and infrastructural nature, will often be more pertinent in the medium and long-
term.

ENV/WKP(2020)11 13
Unclassified
Table 1: Green stimulus measures and their anticipated effects
Stimulus
Expected effect
Short-term
growth Long-term growth
GHG emission
reduction
Environment and
resource co-
benefits
Quickly implemented, labour-intensive activities
Non-hazardous
environmental
recycling and
clean-up
High Low or Medium Low High
Natural resource
monitoring and
policing
Medium or High Low Variable High
Energy efficiency
retrofits High Medium Medium Medium
Capital Investments in environmental and natural resources
Increased
renewable
electricity
production
Low Variable High Medium or High
Energy efficiency
improvements in
new capital
Low or Medium Low or Medium High Medium
Green transport
infrastructure,
including mass
transit
Low or Medium Low Medium or High Medium or High
Other programmes
Cash-for-Clunkers Medium Low Low Low or Medium
Power grid
expansion Low Medium or High Low or Medium Variable
Note: Adapted from Strand and Toman (2010[10]).

14 ENV/WKP(2020)11
Unclassified
Review of ex ante and ex post evidence of green stimulus packages
following the global financial crisis (GFC)
Assessments of the macroeconomic, employment and environmental effects of green stimulus
packages remain very limited. Available evaluations also primarily tend to be ex ante, relying
often on strong and, at times, opaque, assumptions. Studies use vastly different evaluation
methods, which makes direct comparison across studies difficult (Kammen, Kapadia and Fripp,
2006[11]).
One area of focus in ex ante evaluations of green stimulus measures is with regard to the impact
of such measures on jobs, as boosting employment is a key policy priority in the wake of a crisis.
The answer to this question, however, depends crucially on whether the employment effects being
measured relate to direct jobs, or if they include indirect and/or induced jobs as well. Direct jobs
can result from green investment in construction, installation, manufacturing, operations and
maintenance and other activities. Indirect jobs include jobs in upstream supplier industries, while
induced jobs gains or losses include economy-wide job reallocation effects (Harsdorff and
Phillips, 2013[12]).
Spreadsheet-type computations can be used to calculate direct employment impacts by
multiplying the ratio of employment per output by the additional output generated by the policy.
For example, the number of working hours per solar panel installed is multiplied by the number
of additional solar panels attributed to a policy supporting renewable energy sources. Total
working hours are then converted into full time equivalents. Input-Output (I-O) models,
meanwhile, are used to capture indirect employment effects. If a policy increases output in one
sector, it is possible to use I-O tables to measure the impacts on output for the upstream sectors.
Then, social and economic accounts are typically used to convert the change of output in change
of employment. I-O frameworks, for example, have often been used to compute the impact of
renewable energy development on job creation (Lambert and Silva, 2012[13]; Lehr et al., 2008[14];
Caldés et al., 2009[15]). They, however, fail to account for the dynamic, intertemporal general
equilibrium effects of policy and thus the possible reallocation of jobs between industries. The
latter can be analysed by computable general equilibrium (CGE) models that explicitly represent
the role that prices play in determining supply and demand for products, commodities, and
ultimately inputs such as labour (McCarthy, Dellink and Bibas, 2018[16]). These price mechanisms
reflect economic feedback processes that generate the net economy-wide employment effects that
take both job creation and destruction into account. However, as is the case with I-O models, CGE
models often have significant data requirements, as well as being computationally demanding
(Dixon and Jorgenson, 2012[17]). This paper presents employment effects as reported by the
reviewed ex ante assessments, which use different methods, assumptions and data sources that
are often not fully documented. Therefore, the ex ante estimates on employment creation cited
throughout the paper should be interpreted with caution.
Ex post assessments of green stimulus programmes and projects are even more limited in number
than ex ante assessments, and face a number of methodological challenges of their own. First,
there is a question of whether the green stimulus has been effective in terms of environmental and
jobs impacts. To address that question, it is necessary to identify a suitable control or
counterfactual against which any ex post environmental, labour market, or economic impacts of
green stimulus can be compared. The magnitude of stimulus packages also makes the construction
of the counterfactual more difficult. The greater the stimulus, the more sectors are targeted, the
more difficult it is to use non-targeted sectors as a control group because of the linkages between

ENV/WKP(2020)11 15
Unclassified
sectors in the economy. Many countries also triggered their GFC green stimulus programmes at
the same time, making cross-country comparison challenging.
There are also opportunity costs of public money spent. Some stimulus measures are more cost-
effective than others when their economic and environmental benefit per unit of public money
spent is higher. In practice, assessing cost-effectiveness is also very difficult as the stimulus
affects only a subset of the economic sectors or households and not all potential beneficiaries.
Moreover, some programmes may appear cost-ineffective in the short run but generate significant
long-run gains through learning-by-doing and economies-of-scale.
Finally, greening the fiscal stimulus implies the targeting of multiple policy objectives. This
further complicates policy evaluation as performance might vary across these multiple economic
and environmental dimensions, and over different time horizons (short versus long-term).
Following this overview of some of the complexities faced in evaluating the impact of green
stimulus measures, the remainder of this section reviews results from available ex ante and ex
post assessments, first at the programme level across different environmental policy areas and
then at the level of overall green recovery packages. This review mainly focuses on various fiscal
stimulus packages put in place after the GFC. The narrative is complemented by available ex post
evidence of the impact of similar measures that are relevant but not necessarily directly linked to
the GFC stimulus. Such examples are presented in boxes so as not to distract, but rather to
supplement, the overall green stimulus focussed narrative in this section.
Evaluation of green components in recovery packages
Renewable energy generation
For countries that implemented large green stimulus in response to the GFC, support for the
generation of electricity from renewable energy sources made up a large proportion of green fiscal
stimulus components.2 The main rationale for public support of renewable-energy projects,
beyond the twin-benefits created by a transition to a low-carbon economy and the possible net job
impact in the short run, is that unit production costs decrease over time and with scale (Strand and
Toman, 2010[10]). However, this rationale does not take into account that direct employment
effects are often smaller because renewable-energy projects do not necessarily lead to increased
domestic manufacturing, but rather to increased imports of equipment (Strand and Toman,
2010[10]).
The effect of USD 1 billion additional spending on renewable energy under the economic
stimulus package of the Federal government of the United States was simulated in an ex ante
assessment by Houser, Mohan and Heilmayr (2009[18]). The two schemes used for this simulation
are the production tax credit (PTC) extension for power generated from wind energy, biomass,
geothermal energy, municipal waste and hydropower, as well as increasing the investment tax
credit (ITC) proportional to the investment of renewable capacity. Houser, Mohan and Heilmayr
(2009[18]) found that the former would generate 39 100 jobs in the initial year and reduce CO2
emissions by 728 kilotonnes (kt) annually during the 2012-20 period. The latter would generate
2 Nevertheless, in the wake of the GFC, some countries like Spain experienced a drop in subsidies targeted
to renewable energy.
16 ENV/WKP(2020)11
Unclassified
33 300 jobs in the initial year, save USD 563 million in energy cost annually, and reduce CO2
emissions by 213 kt annually.3
There have also been ex post assessments of the green stimulus programmes in response to the
GFC. In the United States, solar electricity generation increased over 30 times from 2008 levels
by 2015, and wind generation increased more than threefold (Council of Economic Advisors,
2016[19]). A significant part of this increase is attributed to the 2009 American Recovery and
Reinvestment Act (ARRA) investments in the deployment of clean energy technologies, which
also helped contribute to dramatic cost reductions for those same technologies as part of a virtuous
cycle. For example, the overnight capital cost of utility‐scale photovoltaic (PV) systems fell from
USD 4.1/watt (W) in 2008 to USD 2.0/W in 2014—a decrease of 50%. Cost reductions for this
and other technologies resulted from a number of factors—including economies of scale,
technology learning, and new business practices—that were assisted by the widespread
deployment made possible by ARRA (Council of Economic Advisors, 2016[19]).
ARRA also contributed to the creation of 26 600 jobs in the first years of its implementation.
Official sources estimated that loan programmes targeting renewable energy systems and power
transmission systems led to an annual reduction of 8.6 megatonnes (Mt) of CO2 emissions. ARRA
stimulus programmes are positively correlated with growth in a number of renewable energy
technology patents issued by the US patent Office from 2009 to 2012 (Mundaca and Richter,
2015[20]), which was especially successful as patenting was facilitated by USPTO’s Green
Technology Pilot Program, accelerating the processing of green patents (Gattari, 2012[21]).
In addition, USD 46 billion of the USD 90 billion initial allocated to clean energy‐related
investments under ARRA leveraged over USD 150 billion in private and non‐federal capital
investment toward advancing the deployment of energy efficiency technologies (Council of
Economic Advisors, 2016[19]). The ARRA experience demonstrates that public financing can be
used to catalyse private investment without necessarily crowding out private finance. Clean
energy manufacturing tax credit, with a total tax expenditure cap of USD 2.3 billion, supported
183 manufacturing facilities with a co-investment of as much as USD 5.4 billion while Clean
Renewable Energy Bonds, by providing interest subsidies through the tax code, leveraged
investment in renewable power for public and quasi-public utilities (Aldy, 2012[22]).
As regards employment effects, there is some ex post evidence that investing in renewable energy
creates jobs, but studies also point to job destruction in other industries. Furthermore, subsidies
diverted towards investment into renewables, if directed towards other sectors, could potentially
lead to larger increases in employment (Box 3.1). These conclusions are more sobering than those
from ex ante assessments that point to significant job creation potential. This probably stems from
the general equilibrium effects of such policies not having been reflected in the ex ante estimates,
leading to an upward bias in the expected job impacts. In any case, the employment effects cannot
be viewed in isolation but in conjunction with the environmental benefits that renewable energy
deployment would entail.
3 The employment gains cited in this study are the direct jobs created multiplied by the Regional Input-
Output Modelling System (RIMS-II) multiplier. Unlike a CGE framework, the study does not capture
labour reallocation across sectors and the results should not be interpreted as net employment effects.
ENV/WKP(2020)11 17
Unclassified
Box 3.1. Ex post evidence on renewable energy support and job creation
Evidence from ex post studies analysing public support to renewable energy, not necessarily as part
of a green stimulus, is mixed regarding the impact of such measures on jobs.
Denmark is one of the countries with the greatest reliance on wind power relative to its full energy
mix. For the period 2001-2005, yearly wind energy subsidies amounted to approximately EUR 230-
350 million. In addition, there is substantial feed-in support via high electricity prices. However,
government subsidies towards wind power generation in Denmark have shifted employment from
more productive towards less productive sectors (Sharman, Meyer and Agerup, 2009[23]). This is
because, in terms of value added per employee, the energy technology sector underperformed by as
much as 13% compared with the industrial average over the period 1999-2006. Nonetheless,
subsidies contributed to net real job creation of up to 10% of total employment in the Danish wind
industry.
In the case of Spain, one study found that for each job created in the renewable-energy sector, two
other jobs were lost to the economy between 2000 and 2008 (Álvarez, Jara and Julián, 2009[24]). To
come to this conclusion, the authors compared the average annual productivity increase that the green
job subsidy would have contributed to the economy had it not been consumed for public financing.
This result also reflects the difference in energy production costs from renewables relative to
production costs based on other energy sources.
Studies analysing the feed-in-tariff in Germany report mixed results in terms of job creation. One
study highlights the importance of off-setting impacts such as job losses that result from the crowding
out of cheaper forms of conventional energy generation and from the drain on economic activity
precipitated by higher electricity prices (Frondel et al., 2010[25]). Another study based on macro-
econometric modelling capturing some general equilibrium effect suggests an overall positive net
employment effect of the expansion of renewable energy sources in Germany (Blazejczak et al.,
2014[26]).
Energy efficiency in buildings
Poor infrastructure can commit countries to high levels of emissions for long future periods due
to lock-in effects, as has been documented in various studies (Shalizi and Lecocq, 2009[27]; Strand
and Toman, 2010[10]; World Bank, 2010[28]). Hence, there are theoretical grounds for investing in
building energy efficiency.4 Investing in building retrofits as well as new energy efficient
buildings is also an interesting avenue for fiscal stimulus as it is labour-intensive and could
contribute to job creation in the near term.
In the wake of the GFC several countries included significant amounts of resources towards
energy efficiency in the larger stimulus packages. These included tax incentives, and grants for
investing in insulation, installation of energy efficient lights, and retrofitting buildings. In
Germany, subsidies for repairing residential houses amounted to EUR 3 billion. In France,
EUR 960 million were invested in renovation of housing and public buildings, altogether.
Austria’s stimulus package concentrated on the energy efficiency of public buildings, and also
4 There is, however, an interplay between the environmental benefits of investment in energy efficiency
and the share of renewable-energy sources in the energy mix.

18 ENV/WKP(2020)11
Unclassified
included tax reforms and stimulus packages that totalled EUR 100 million in energy-saving
renovation. In Korea, a stimulus package worth USD 6 billion was spent to improve the energy
efficiency of buildings. Canada’s stimulus package of USD 238.5 million promoted energy
efficiency improvements in residential buildings (ILO, 2010[8]).
In addition, investing in the installation of smart meters, providing feedback to energy consumers
in the expectation that they will reduce their energy consumption, has also been considered in
green stimulus packages. In the United States, the Smart Grid Investment Program, amounting to
USD 3.5 billion of public spending in the ARRA, helped to support the installation of 16 million
smart meters by 2016 (Council of Economic Advisors, 2016[19]).
One ex ante assessment indicates that infrastructure investments are well placed to yield both
employment and environmental benefits. A USD 1 billion stimulus on smart metering was
estimated to generate 40 000 jobs in the initial year, and lead to 207 kt of CO2 emission reduction
annually, as well as USD 918 million reduction in energy costs each year over the period 2012-
20. USD 1 billion of spending invested in retrofitting buildings used by the Federal Government
could have created 25 300 jobs in the initial year and reduce CO2 emissions by 547 kt per year
for the period 2012-20, whereas, the same amount spent on household weatherisation would have
yielded 25 100 jobs in the initial year, and reduce CO2 emissions by 441 kt annually over the
2012-20 period (Houser, Mohan and Heilmayr, 2009[18]).5
However, the ex post evidence regarding the evaluation of building energy efficiency stimulus in
response to the GFC is scarce. One example is for the United Kingdom, where USD 137.9 million
was allocated towards insulation and heating systems, with an additional USD 82.8 million spent
on energy efficiency measures through the Decent Home programme, whereby every GBP 1
invested in the programme generated GBP 1.46 in social value (Nottingham Trent University,
2013[29]).6 Estimates of the impact of these measures on jobs are however not provided.
Another ex post assessment was conducted by the Australian National Audit Office of the AUD
2.8 billion Home Insulation Program (HIP) that was a major part of the AUD 3.9 billion Energy
Efficient Homes Package announced in February 2009 to generate economic stimulus and jobs in
the construction industry. The audit concludes that HIP created between 6 000 and 10 000 jobs
but that these jobs were “shorter lived than intended”, while the energy efficiency benefits were
“likely to be less than anticipated” (Australian National Audit Office, 2010[30]). The audit
concludes that “overall HIP has been a costly programme for the outcomes achieved” and
underlines “the critical importance of sound programme design and implementation practices to
achieving policy outcomes” (Australian National Audit Office, 2010[30]).
Ex post assessments of investments in building energy efficiency beyond the specific context of
the GFC stimulus also offer a mixed picture. For example, recent empirical literature shows that
installation of smart meters can yield environmental benefits by decreasing in energy demand
with effects that can persist at least for several months; but there may also be unintended
consequences (Box 3.2).
5 See footnote 3.
6 In this study, social value captures the value of fewer home accidents, lower mental health issues, higher
school attendance, lower fuel bills, reduced carbon emission, lower crime, higher local employment, etc.
ENV/WKP(2020)11 19
Unclassified
Box 3.2. The effect of smart meters on energy consumption
There is econometric evidence that the information given by smart meters induce households to
consume less energy. An econometric study analysing the effect of real-time feedback to electricity
customers in Northern Ireland finds that the feedback results in 11–17% less electricity use and
that the associated CO2 emissions reductions are cost-effective (Gans, Alberini and Longo,
2013[31]). Another study using a random control trial on Google employees finds that access to
feedback leads to an average reduction in household electricity consumption of 5.7%. Energy
savings due to the feedback persist for up to one month (Houde et al., 2013[32]). However, the
narrowness of this population makes it difficult to generalise the result of the study.
A more recent OECD study reviews the existing studies in the real-time information on consumer
decision-making, as well as looks at the results of a study conducted in Ontario, Canada on a sample
of 7 000 households which were provided with a smart meter (Rivers, 2018[33]). This study
ultimately finds that there is a 3% decline in electricity use, sustained over a period of at least five
months, which can be attributed to the use of in-home displays (IHD). Given that the decline
appears to persist over time, the study provides some evidence that smart meters can be cost-
effective over a sufficiently long period.
Although the installation of smart meters is generally perceived as highly expensive, a recent cost-
benefit analysis (CBA) of the Smart Metering Implementation Programme in the United Kingdom
finds a total net present value of GBP 6 billion over 2013-2034, with a reduction of carbon
emissions by 45 Mt CO2 (UK Department for Business, Energy & Industrial Strategy, 2019[34]).
Smart-metering, however, can also have unintended consequences. A recent study using data from
a randomised-controlled trial on a sample of almost 2 500 Irish consumers examines the effect of
smart-metering and residential feedback on household investment behaviour (McCoy and Lyons,
2017[35]). The study shows that exposure to time-of-use pricing and information stimuli, while
reducing overall and peak usage, can also reduce investment in energy-efficiency measures within
the home by 7.5 percentage points. This result highlights the need to have consistent policy
measures in terms of investment in smart meters and building retrofits.
On the other hand, there is also some empirical evidence that the environmental benefits of
investments in energy efficiency improvements may not increase in proportion to the size of the
investment, or could be offset entirely, pointing to significant rebound effects in the behavioural
response of home owners.7
Such mixed results from the existing energy-efficiency programmes targeting buildings may be
more a consequence of the failure to account for behavioural responses to efficiency
improvements in policy design. Hence, investments in energy efficiency improvements may need
to be combined with measures such as dynamic data gathering on energy consumption to offset
any rebound effects in energy demand. The question arises more so on the right policy mix, which
7 For example, in a field experiment in Mexico, researchers found no detectable impact on electricity use
or thermal comfort arising due to insulation or energy-efficiency upgrades (Davis, Martinez and Taboada,
2018[72]). Another empirical study in Maryland, USA concluded that that large rebates for the purchase of
energy efficient equipment are not effective to reduce the energy consumption of households (Alberini,
Gans and Towe, 2016[71]).
20 ENV/WKP(2020)11
Unclassified
may require careful consideration and the rigorous review of existing evidence in combination
with clear ex ante and corresponding ex post assessments, where such are possible.
Scrappage payments for vehicles with low fuel efficiency
As a response to the financial crisis, several countries also put policies in place that provided
financial incentives to car owners to trade in their old, less fuel-efficient vehicles and buy new,
more fuel-efficient vehicles. These scrappage payments for vehicles with low fuel efficiency were
introduced in the wake of the GFC in many countries including Austria, Denmark, France, Italy,
Japan, Germany, the Netherlands and the United States (ILO, 2010[8]).8
The most evaluated scrappage scheme is the US Car Allowance Rebate System (CARS)
introduced in 2009, popularly known as the “Cash-for-Clunkers” programme. The CARS
programme provided eligible consumers a rebate of USD 3 500-4 500 when trading in an old
vehicle and purchasing or leasing a new vehicle and cost USD 2.85 billion in total (Li et al.,
2013[36]).
An ex ante simulation conducted in 2009 concluded that a USD 1 billion spending on the US
CARS programme would lead to the creation of 46 900 jobs, and reduce CO2 emissions by 1 113
kt per year for the period 2012-20 (Houser, Mohan and Heilmayr, 2009[18]). These estimates
suggest that the USD 2.85 billion programme would lead to the creation of 133 665 jobs and a
reduction of CO2 emissions by 3 172 kt per year.9
Ex post assessments of the CARS programme are more ambivalent. In the short run, the CARS
programme helped maintaining employment in the car sector by preventing the sales of new
vehicles to fall in the aftermath of the GFC. The programme provided rebates to 680 000
consumers (Li et al., 2013[36]), and led to roughly 500 000 purchases during the programme period
(Green et al., 2016[37]). The liquidity provided by the CARS programme was critical for
generating this large response from consumers (Green et al., 2016[37]). However, the overall
economic impact was muted by the fact that programme simply pulled 370 000 vehicle sales
forward as opposed to generating additional vehicle sales (Mian and Sufi, 2012[38]).
From an environmental standpoint, the CARS programme had a positive impact. An ex post study
estimated that the CARS programme reduced CO2 emissions by 9–28.2 Mt (Li et al., 2013[36]).
Nevertheless, the CARS programme was expensive given its impact on jobs and emission
reductions. The cost per job created under the CARS programme was USD 1.4 million, which is
much higher than alternative fiscal measures (see Figure 1) (Gayer and Parker, 2013[39]). In
addition, the cost per tonne of CO2 avoided of the CARS programme was estimated between USD
91 and USD 301, which is less cost-effective than renewable fuel standard (Gayer and Parker,
2013[39]). However, when compared to electric vehicle subsidies estimated to cost between USD
300 and 1 200 per tonne of CO2 avoided, the CARS programme is more cost effective.
8 In Germany, a scrappage payment of EUR 2 500 was provided to replace cars more than nine years old
with new cars meeting EURO4 emission standards. The Italian scrappage payment was up to EUR 1 500.
In France, the stimulus package promoted cars with low carbon emissions through a premium of EUR 1000
for vehicles emitting less than 160g of CO2. In Japan, the scrappage program provided between USD 1 100
and USD 1 650 for the trade of old cars for new more fuel-efficient cars (ILO, 2010[8]).
9 See footnote 3.

ENV/WKP(2020)11 21
Unclassified
Figure 1: Cost per job created (USD million)
Source: Gayer and Parker (2013[39])
In addition to the CARS programme, other scrappage schemes such as the French Prime à la casse
and the German Umweltprämie have also been evaluated (Pollitt, 2011[40]; OECD/ITF, 2011[41]).
Similar to the CARS programme, these schemes were successful at maintaining car sales. It was
estimated that scrapping premiums targeting low emission vehicles in Europe prevented car sales
from decreasing by 30.5% (Grigolon, Leheyda and Verboven, 2016[42]).10 Like in the US case, the
European scrappage schemes brought forward the purchase of new vehicles rather than generating
new purchases. For example, sales of motor vehicles in France also dropped significantly when
the scheme ended in 2010 (OECD, 2016[43]).
However, the environmental impact of the scrappage schemes implemented in Europe are mixed.
On the one hand, scrapping premiums targeting the purchase of low-emission vehicles were
successful at reducing the average fuel consumption of new purchased cars. An econometric study
by Grigolon, Leheyda and Verboven (2016[42]) estimates that targeted schemes in Europe
increased the fuel efficiency of new purchased cars by 3.6%. On the other hand, scrappage
schemes can generate rebound effects, wherein drivers of new, fuel-efficient cars drive longer
distances because they save money on fuel expenditure. Scrapping premiums also had unintended
environmental consequences. In Germany, lighter and smaller vehicles were traded in for
medium-sized ones (OECD/ITF, 2011[41]). The French programme was successful in imposing a
CO2 limit on new vehicles, as well as retiring older cars, but the lifetime NOX benefits were
limited because the share of new diesel vehicles in total new-car purchases was greater than in
the vehicles that were scrapped (OECD, 2016[43]). Over the longer run, such schemes could also
risk perpetuating car dependency and delay the shift to more environmentally friendly modes of
transport.
In addition, scrappage schemes face a number of challenges in terms of policy design. Scrapping
premiums distort markets without addressing the underlying market failures. They are also not
additional, but at times expensive substitutions for behaviour that would have happened anyway.
10 Non-targeted scrapping schemes were as good as targeted schemes to maintain car sales.
1.4
0.222
0.222
0.2
0.133
0.095
0.08
0 0.2 0.4 0.6 0.8 1 1.2 1.4 1.6
CARS programme
Full/partial expensing of investing costs
Reducing employee payroll tax
One-time social security payment
Reducing employer payroll tax
Increasing aid to unemployed
Reducing payroll tax for firms that add jobs
Cost per job created (USD million)

22 ENV/WKP(2020)11
Unclassified
For example, it has been estimated that 45% of the US CARS programme expenditure was
targeted at consumers who would have made the purchase even in the absence of the programme
(Li et al., 2013[36]). Moreover, these types of subsidies have distributional consequences as they
cause discrimination between sectors of activity and between consumers, for example to the
detriment of low-income households that cannot a buy new car even with the subsidy. Finally,
their cost-effectiveness is not high as their cost can escalate quickly. In France, the scrapping
premium cost more than EUR 1 billion rather than the EUR 220 million initially planned (OECD,
2016[43]).
Clean technology development support
Public support to technology development takes mainly two forms: direct government support to
R&D activities and tax incentive support to R&D expenditure. Evaluating these measures is
difficult as they can start bringing environmental and economic benefit only in the medium and
long run. Many governments provided support to clean technology development as part of the
response to the GFC (Pollitt, 2011[40]). For example, the United States and the EU provided
USD 4.8 billion support to carbon capture and storage (CCS) projects.
An ex ante simulation conducted by Houser, Mohan and Heilmayr (2009[18]) estimated that USD 1
billion spending on CCS demonstration projects under the ARRA would generate 28 500 jobs in
the initial year, reduce CO2 emissions by 342 kt annually, and save USD 225 million per year in
energy costs for the time period 2012-20.
Ex post, there is evidence that public support to CCS projects has overall not been successful so
far.
In 2009, the European Union launched the European Energy Programme for Recovery (EEPR) to
support key investments in the context of the economic crisis and in order to promote energy
transition. One fourth of the programme funding was aimed at subsidising six carbon capture and
storage projects for a total of EUR 1 billion of support. In 2018, only one project, providing
operational small pilot facilities for capture, transport and storage, was finished. Yet, half of the
planned support amounting EUR 424 million, was spent to support the projects. Three projects
were terminated prematurely due to the decision of the project promoter not to invest, one project
ended without completion and ROAD was the last remaining project (European Commission,
2018[44]).
The US experience was not successful either. ARRA authorised USD 3.4 billion support for CCS
research and design, commercial demonstration, implementation, and education. In 2016, the US
Department of Energy (DOE) returned USD 1.3 billion of the initial support to the US Department
of Treasury for four CCS projects that were funded by DOE under the ARRA and were not able
to advance given the ARRA funding timeframe (Council of Economic Advisors, 2016[19]).
This absence of success in CCS deployment within recovery packages reflects the significant
challenges faced by businesses that are introducing innovative, early‐stage energy technologies
to markets but also that carbon prices were too low during the 2009-2020 period and therefore
not pulling the market.
Nevertheless, not all CCS projects have been unsuccessful. A recent study analyses dozens of CCS
demonstration projects that have been under development and identifies key parameters for
success (Herzog, 2017[45]). First, successful CCS demonstration projects tend to occur in a region
with a significant oil and gas industry. Second, it is important that CCS projects have access to
carbon markets and electricity markets in addition to the Enhanced Oil Recovery (EOR) markets.
Third, a performance standard limiting the amount of carbon emissions from coal-fired power
plants allowed CCS to compete. Fourth, a well-designed regulatory environment to create business

ENV/WKP(2020)11 23
Unclassified
drivers is more successful than large government subsidies with little competition. The time limits
of ARRA and EEPR were seen as arbitrary and thus detrimental to success. By contrast, multiple
financing components and shorter timelines are key for effective CCS power projects. Finally,
power projects based on integrated gasification combined cycle (IGCC) technologies have had a
poor record because IGCC has proven to be uncompetitive with pulverised coal (PC) plants.
Notably, the low price of natural gas made IGCC less competitive.
To conclude, direct public R&D support can create risks associated with “picking winners”. To
minimise this risk, governments should encourage competitive selection of investments that are
likely to have the highest social return (OECD, 2010[46]). Well-designed public support can help
the development of clean technologies (Box 3.3).
Box 3.3. Designing public R&D subsidies and R&D tax credit
There is a rich literature available on the possible effects of public R&D subsidies. Government R&D
effort should focus on technologies that are upstream (or have a general purpose) and have a strong
public good component such as energy storage, smart grids, energy efficiency and infrastructure for
electric vehicles. For the public support to be effective, governments should implement
environmental policies that increase the cost of polluting activities (Dechezleprêtre and Popp,
2015[47]).
Yet the question arises on the optimal magnitude of public R&D support. Given that there is no
evidence of diminishing returns to energy R&D funding, there is still potential for increasing public
R&D support to develop low-carbon technologies (Dechezleprêtre and Popp, 2015[47]). The increase
in funding has to be gradual because the supply of researchers is fixed in the short run. In addition,
clean R&D subsidies have to be integrated in a coherent national research policy.
Well-designed R&D subsidy programmes can increase employment and productivity and private
R&D of targeted firms. In general, there is evidence that public R&D support may generate
employment in R&D activities (Afcha and García-Quevedo, 2016[48]) and increase the productivity
of firms (Cin, Kim and Vonortas, 2017[49]; Baghana, 2010[50]). Moreover, an econometric study using
data on German SMEs shows that R&D subsidies increased R&D spending of targeted firms during
the GFC (Hud and Hussinger, 2015[51]). While the existing empirical literature shows that the
effectiveness of public R&D subsidies is mixed and depends on the characteristics of the subsidy
programmes (Zúñiga‐Vicente et al., 2014[52]), recent econometric evidence shows that R&D tax
credit can generate statistically and economically significant effects on both R&D and patenting
(Dechezleprêtre et al., 2016[53]). For instance, over the 2006-11 period, aggregate business R&D in
the United Kingdom would be around 10% lower in the absence of the tax relief scheme.
Public transport
In light of the social distancing measures that have been put in place, public transport may have
to be rethought. Likely, in the short term (until an effective vaccine becomes widespread), public
transport will necessarily feature less prominently among the policy measures that could be taken
to tackle the unfolding economic downturn that the COVID-19 health crisis has caused.
Nevertheless, expanding public transport and greening it can a priori be seen as a highly effective
green stimulus measure.

24 ENV/WKP(2020)11
Unclassified
Ex ante, this is showcased by simulations that estimate that USD 1 billion additional spending on
mass transit would generate 34 500 jobs in its initial year, with an additional 87 kt of CO2
emissions reduced annually and USD 24 million saved per year in terms of energy costs for 2012-
20 (Houser, Mohan and Heilmayr, 2009[18]).
There is no ex post assessment of mass transit stimulus in response to the GFC but the economic
literature illustrates the economic benefits of public transport (Box 3.4).
Box 3.4. The economic benefits of investing in mass transit
Econometric analysis points to the possible effectiveness of expanding mass transit in job creation. In
the United Kingdom, a decrease of 10% bus travel times were associated with a 0.13-0.3% increase in
employment, ceteris paribus (Johnson, Ercolani and Mackie, 2017[54]). The extension of the San
Francisco Bay heavy rail system led employers close to the line to hire Hispanic workers from deprived
neighbourhoods (Holzer, Quigley and Raphael, 2003[55]). Many other studies using US data found a
positive relationship between public transport and individual labour market outcomes (Yi, 2006[56];
Ong and Houston, 2002[57]; Cervero, Sandoval and Landis, 2002[58]).
In addition, investing in transport infrastructure affects positively labour productivity and long-run
economic growth. An econometric study covering eighteen OECD countries from 1870 to 2009 found
that the social rate of returns to investment in public transport infrastructure exceeds its private rate.
A 10% increase in the share of the transportation infrastructure expenditure increases the labour
productivity of the OECD countries by 0.14 percentage points (Farhadi, 2015[59]).
However, to reiterate, public transit may require careful rethinking, and may only be a viable
green stimulus option once its role and safe use has been reimagined and implemented.
Nevertheless, in the long-term, the essential role that public transport plays in several economies
should be considered. Underinvestment and underutilisation of public transit would lead to
significant economic and environmental strains. Therefore, investing into the quality of public
transportation may indeed restore confidence towards this means of transport.
Nature conservation and water resource management
Other measures have also been taken in order to stimulate economic activity while improving
environmental outcomes. As has been pointed out by previous studies, non-hazardous
environmental clean-up, natural resource maintenance, monitoring and policing can be quickly
implemented and are labour-intensive activities (Strand and Toman, 2010[10]). There are some ex
ante assessments of the possible net job impact that such programmes may bring about. For
instance, the Korean administration projected that river and forest restoration of Korea’s “green
stimulus” package would create 334 000 jobs for a spending of USD 12 250 million, while
investment in dams in Korean rivers would create more than 16 000 jobs for a spending of
USD 684 million (Barbier, 2009[60]).
This review has been able to find ex post assessments of the Korean Four Rivers Restoration
Project that was part of the Korean Green New Deal (GND). The expenditure directed to water
and green transport infrastructure under the GND provided a short-term boost to activity and
employment but the environmental impacts of the Four Rivers Restoration Project were mixed
(OECD, 2017[61]). On the positive side, the Four Rivers Restoration Project reduced the number
of large floods, improved water quality and increased water availability. On the negative side, the
project induced algae blooms, reduced the population of certain aquatic species, and adversely

ENV/WKP(2020)11 25
Unclassified
affected the habitats of several other species (Four River Restoration Project Investigation
Evaluation Committee, 2014[62]; Board of Audit and Inspection, 2013[63]).
Overall ex post assessment of green recovery packages
Very few overall ex post assessments at the national green stimulus and recovery package have
been performed. This review has so far been able to locate only two “third party” ex post
assessments of national green stimulus packages in the wake of the GFC: i) US stimulus
programmes targeting renewable energy (Mundaca and Richter, 2015[20]); and ii) Korea’s Green
Economic Stimulus, with a focus on energy sector (Mundaca and Damen, 2015[64]). In addition,
the US Council of Economic Advisors published an evaluation of the clean energy investments
in the ARRA (Council of Economic Advisors, 2016[19]) and the EU Commission has mandated
their own evaluation of green elements of the recovery plans of nine European countries: Belgium,
the Czech Republic, Estonia, France, Germany, Portugal, Slovakia, Sweden, and the United
Kingdom (Pollitt, 2011[40]).11
Green Stimulus in the American Recovery and Reinvestment Act
It has been found that from a holistic perspective, the ARRA, passed in February 2009, was
successful in stimulating the renewable energy sector (Mundaca and Richter, 2015[20]). Projects
specific to ARRA were an important component of growth in renewable-energy capacity. It
proposed a clean energy and green component of USD 92 billion, of which USD 21 billion was
channelled towards renewable energy. Elements of the programme included: basic research
programmes, such as the Advanced Research Projects Agency – Energy (ARPA-E); production
tax credits (PTC) and investment tax credits (ITC); cash grants for renewable energy properties
(the 1603 program); a tax credit for clean energy manufacturing (48C); targeted loan guarantees
(the 1705 program); training programmes; and the Green Technology Pilot Program for faster
patent processing.
There is evidence, albeit imprecise, of the effectiveness of these programmes: renewable energy
capacity was increased by almost 27.1 gigawatts (GW) under the 1603 programme and 6.1 GW
under the 1705 program, and 3533 green patents had been processed by 2012. These numbers, of
course, do not account for what the developments would have been in a counterfactual scenario.
CO2 emission reduction was officially estimated at 8.6 Mt under the 1705 programme, while other
sources estimated that the combined effect of diverse renewable energies led to 34-270 Mt declines
in CO2 emissions compared with business-as-usual (BAU), highlighting the difficulties with
accurate estimation. Positive employment effects have been observed, and official estimates find
that 26 600 jobs were created under the ARRA RE and clean energy programmes (Council of
Economic Advisors, 2016[19]). There is some evidence that these jobs were of higher quality than
average, with salaries equal to USD 44 000 on average, much higher than the whole economy
average equal to USD 38 600 (Mundaca and Richter, 2015[20]). Nevertheless, such figures should
be viewed cautiously, as they do not take into account the possible destruction of jobs elsewhere
as a result of programme implementation.
Numerous methodological challenges have been identified when conducting ex post assessment
of ARRA. The main challenge was to estimate the causation and additionality of the stimulus
programmes due to the lack of data, lack of clearly defined policy goals and a straightforward
11 Pollitt (2011[40]) includes policies implemented in the United Kingdom, which was an EU Member State
at the time the study was conducted. The United Kingdom left the European Union as of the 31st of January
2020.

26 ENV/WKP(2020)11
Unclassified
counterfactual, especially for estimating employment effects (Mundaca and Richter, 2015[20]).
Some intangible benefits, such as policy learning, are even more difficult to measure.
The impact of Green Stimulus in the European Union12
EU Member States had made significant commitments towards green stimulus, at an average of
10% of the total package, ranging up to 33% of the entirety of the fiscal stimulus package. The
measures included investments in energy efficiency, investments in transport infrastructure,
vehicle scrappage schemes, investment in renewables and funds to support eco-innovation.
A study, using a combination of quantitative, qualitative and modelling frameworks, suggests that
the overall economic impact of these packages was relatively small, which was mainly due to the
fairly small share of green measures in the overall fiscal stimulus package (Pollitt, 2011[40]). The
findings of this paper are summarised below.13
Belgium’s national recovery plan included the following three green recovery measures:
investments towards improving the energy efficiency of households (EUR 140 million),
investments for households to purchase green technologies (EUR 20 million) and funding for
energy cost reduction (EUR 10 million). The Belgian stimulus package was relatively small in
scale, hence both economic and environmental impacts were found to be modest.
In the case of the Czech Republic, green measures totalled to around 33% of the total fiscal
stimulus. They comprised a EUR 900 million investment into improving the energy efficiency of
residential buildings in the form of subsidies for households. The Green Savings Program was
estimated to have led to a 0.4% per annum boost in GDP and the creation of 19 000 jobs (OECD,
2018[65]). Environmental impacts were estimated to be relatively small due to the energy intensity
of construction work and rebound effects. Long-term environmental benefits, however, were
deemed to outweigh short-term environmental impacts (Pollitt, 2011[40]).
Estonia’s green stimulus package was mainly focused on water management issues (EUR 153
million), green investments into energy efficiency improvements of buildings and wind energy
installation (EUR 44 million), as well as energy efficiency improvements for households (EUR 51
million). Despite being a small, open economy, economic benefits were estimated as having been
a 1% increase in GDP for 2008-09 and a small increase in employment.
France’s green policies were spread over investments in: improving the energy efficiency of
buildings (EUR 400 million), electricity infrastructure (EUR 600 million), transport infrastructure
(EUR 1.3 billion), and solar energy (EUR 300 million), a car scrappage programme (EUR 500
million) and funding towards low-carbon R&D (EUR 400 million). The package was estimated to
have had a large economic impact but its long-term environmental impacts are uncertain.
Germany implemented four green stimulus policies, namely investments in improving the energy
efficiency of buildings (EUR 3.3 billion), R&D support (EUR 500 million), a car scrappage
scheme (EUR 5 billion) and revisions of the motor vehicle tax (EUR 1.8 billion).14 The transport
policies boosted GDP by 0.6% in 2009, while environmental benefits manifested themselves in
reduced energy consumption and lower emissions. Germany’s scrappage scheme also had a
12 All the quantitative results cited in this subsection draw upon (Pollitt, 2011[40]).
13 Pollitt (2011[40]) considers policies implemented in the United Kingdom, which was an EU Member State
at the time the study was written. The United Kingdom left the European Union as of the 31st of January
2020.
14 This revision implied a short-run reduction of the tax that was planned to become more stringent over
time from 120 g CO2/km in 2009 to 95 g CO2/km in 2014 (Malina, 2016[73]).
ENV/WKP(2020)11 27
Unclassified
positive impact on other EU Member States. The first wave of the scheme led to an increase in car
imports from the Czech Republic, which contributed a 0.4 percentage point to the Czech
Republic’s GDP growth in 2009 (Maleček and Melcher, 2016[66]).
Portugal’s measures were directed at investment in renewables (EUR 145 million), improving the
energy efficiency of private buildings (EUR 100 million), smart meter installation (EUR 15
million), and car scrappage schemes (EUR 45 million). These measures resulted in positive, but
modest growth of GDP.
Slovakia’s four green measures supported energy-efficiency investments (EUR 10 million),
incentives for installing renewable-energy equipment by households (EUR 8 million), support for
energy efficiency and renewable-energy projects in the residential sector (EUR 93.5 million) and
car scrappage schemes (EUR 55.3 million). The economic impact of the measures was deemed to
be relatively large and led to modest reduction in energy consumption.
Sweden’s policies included the creation of a venture capital company that supports green
innovation (EUR 307 million), funding for R&D on advanced batteries (EUR 8.7 million), and
energy efficiency support (EUR 182.8 million). Sweden’s focus on research meant that much of
the benefits of its stimulus would be felt in the long run and would have considerable spillover
effects.
Finally, the United Kingdom15 implemented various energy efficiency programmes (GBP 215
million in total), flood defence measures (GBP 20 million), railway network extensions (GBP 300
million), offshore wind energy development (GBP 525 million) and support for low-carbon
vehicles (GBP 250 million). These measures were found to be small in size, which resulted in
fairly small economic impacts, estimated at a temporary boost of 0.1% of GDP in 2009.
Pollitt (2011[40]) suggests that larger stimulus packages, where local conditions as well as domestic
sectoral composition were taken into account, along with speedy implementation, was the most
effective policy formula for both economic, as well as environmental impact.
Another important finding from the above assessment is that co-ordinated green stimulus measures
delivered greater economic impact than green measures implemented by individual countries
separately. It was estimated that the short-term multiplier effects, the ratio of the boost to GDP to
the size of spending on the measures, from green investment ranged from around 0.6 to 1.1 at
national level, and up to 1.5 at European level.
The Korean Green New Deal
An ex post assessment of Korean GND found that overall, while the green stimulus programme
was successful in creating jobs and boosting economic growth, climate-related objectives were
not met within the allotted time frame (Mundaca and Damen, 2015[64]).
Compared with the baseline scenario of recession, higher unemployment in 2009 and export-led
recovery in 2010, the Korean economy recorded strong and consistent growth following the
announcement of the GND in 2009, with short-term employment boosted by 276 000 jobs in 2009
(OECD, 2010[67]). However, the GND may not have been the only factor contributing to growth,
and some have pointed to the Korean Won’s depreciation as a contributor towards increased
competitiveness and exports.
15 Pollitt (2011[40]) considers policies implemented in the United Kingdom, which was an EU Member State
at the time the study was written. The United Kingdom left the European Union as of the 31st of January
2020.

28 ENV/WKP(2020)11
Unclassified
That indicators of environmental performance, such as the energy intensity of GDP and the CO2
intensity of energy, were not significantly improved within this timeframe can be attributed to
several factors. First, the export-led growth in the semiconductor and electric appliance
manufacturing sectors, as well as the expansion of GND-linked infrastructure, may have been
particularly energy intensive. Second, electricity markets were characterised by regulated low
electricity prices, insufficient competition, and support to coal power generation (OECD, 2017[61]).
Similarly, some markets may have been characterised by important time-lags, such as the
implementation of a renewable energy portfolio standard, and a national emission trading scheme
(ETS), both of which went online at a later stage, in 2011 and 2012, respectively (Mundaca and
Damen, 2015[64]).
Mundaca and Damen (2015[64]) also pointed to the difficulties created by limitations associated
with causality and attribution, and asymmetric information. Hence it is important not to draw hasty
conclusions regarding the overall environmental effectiveness of the GND, as the lack of a
counterfactual and the considerable time-lags in the realisation of environmental performance may
mask the true effects of the policy.
Areas for future evaluation
A closer look at this overview reveals that there are also some critical aspects of green stimulus
programmes that have not formed part of existing evaluations. Particularly relevant for the
COVID-19 context is that most evaluation of green stimulus packages in the wake of the GFC that
are reviewed in this paper do not look at distributional consequences. This is potentially important
when beneficiaries of a green stimulus differ from the other economic agents bearing the costs of
the same stimulus. For instance, the German feed-in-tariff for solar panels and wind turbines
mostly benefited some homeowners and farmers but resulted in higher electricity prices paid by
all energy consumers (Frondel et al., 2010[25]). To achieve a “just transition”16, future ex ante and
ex post assessments will need to examine distributional impacts.
In addition, very few evaluations assess the international consequences of domestic green
stimulus. There is, however, other literature that stresses that some green stimulus measures could
risk becoming a form of green protectionism, generating higher costs at the global level but also
having significant spillover effects (Box 3.5). This further highlights the importance that countries
implement co-ordinated responses to economic crisis especially when their markets are
significantly integrated.
16 A just transition, as defined by the ILO, entails a shift to an environmentally sustainable economy which
contributes to the goals of decent work for all, social inclusion and the eradication of poverty (ILO,
2015[74]).
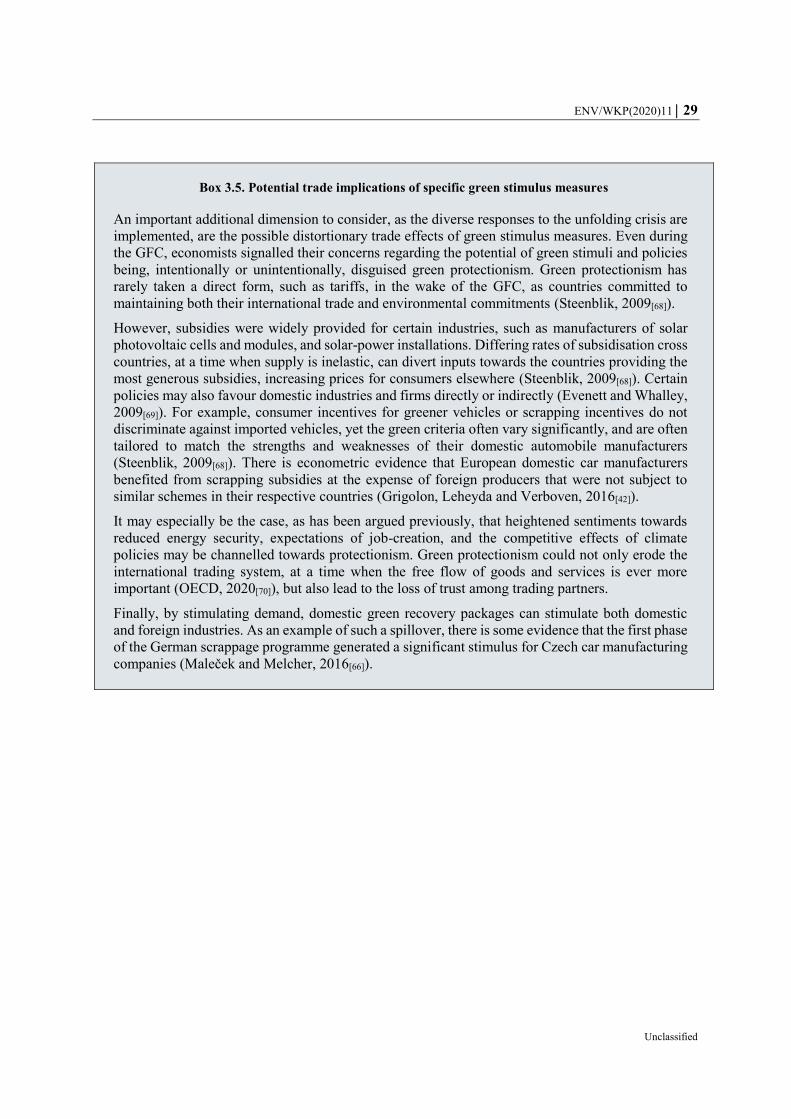
ENV/WKP(2020)11 29
Unclassified
Box 3.5. Potential trade implications of specific green stimulus measures
An important additional dimension to consider, as the diverse responses to the unfolding crisis are
implemented, are the possible distortionary trade effects of green stimulus measures. Even during
the GFC, economists signalled their concerns regarding the potential of green stimuli and policies
being, intentionally or unintentionally, disguised green protectionism. Green protectionism has
rarely taken a direct form, such as tariffs, in the wake of the GFC, as countries committed to
maintaining both their international trade and environmental commitments (Steenblik, 2009[68]).
However, subsidies were widely provided for certain industries, such as manufacturers of solar
photovoltaic cells and modules, and solar-power installations. Differing rates of subsidisation cross
countries, at a time when supply is inelastic, can divert inputs towards the countries providing the
most generous subsidies, increasing prices for consumers elsewhere (Steenblik, 2009[68]). Certain
policies may also favour domestic industries and firms directly or indirectly (Evenett and Whalley,
2009[69]). For example, consumer incentives for greener vehicles or scrapping incentives do not
discriminate against imported vehicles, yet the green criteria often vary significantly, and are often
tailored to match the strengths and weaknesses of their domestic automobile manufacturers
(Steenblik, 2009[68]). There is econometric evidence that European domestic car manufacturers
benefited from scrapping subsidies at the expense of foreign producers that were not subject to
similar schemes in their respective countries (Grigolon, Leheyda and Verboven, 2016[42]).
It may especially be the case, as has been argued previously, that heightened sentiments towards
reduced energy security, expectations of job-creation, and the competitive effects of climate
policies may be channelled towards protectionism. Green protectionism could not only erode the
international trading system, at a time when the free flow of goods and services is ever more
important (OECD, 2020[70]), but also lead to the loss of trust among trading partners.
Finally, by stimulating demand, domestic green recovery packages can stimulate both domestic
and foreign industries. As an example of such a spillover, there is some evidence that the first phase
of the German scrappage programme generated a significant stimulus for Czech car manufacturing
companies (Maleček and Melcher, 2016[66]).

30 ENV/WKP(2020)11
Unclassified
Lessons from greening the GFC stimulus
Recent calls for greening the response measures put in place by governments to the COVID-
19 crisis bear a striking resemblance to the measures that were called for and, in many cases,
implemented as part of the economic stimulus and recovery packages after the GFC. These
include investments in energy efficiency, green infrastructure, support for environment-
related R&D, and support for vehicle scrappage programmes, which have all been reviewed
in the previous section.
Building upon the evaluation presented in this paper, the following key lessons from the GFC
that are relevant for greening a COVID-19 recovery stand out:
Policy evaluation should be an integral part of green stimulus programmes
Despite financial outlays of over half a trillion USD, and over a decade after the GFC,
there is a remarkable dearth of assessments of the macroeconomic, labour market and
environmental effects of green stimulus packages. Governments should therefore define
clear policy objectives and build in ex ante and, in particular, ex post assessment
mechanisms into green stimulus measures for COVID-19. This would enable their effects
to be evaluated and monitored over time. Considering the heterogeneity in evaluation
techniques and practices across countries, there may also be value to sharing best
practices and working towards common methodological frameworks.
Green measures can deliver on near term economic stimulus priorities
Implementation of sufficiently large, timely and properly designed green stimulus
measures, which are well-embedded into domestic settings and leverage the strengths of
their respective economies, can generate economic growth and bring about environmental
benefits. The Korean Green New Deal of 2009 is a prime example of a significant, large
green stimulus that led to strong economic growth within a year of its implementation. In
the United States, the American Recovery and Reinvestment Act created quality jobs and
mobilised significant financing towards renewable-energy deployment, which
contributed to a reduction of CO2 emissions. In the European Union, green stimulus
measures contributed positively to GDP growth, and co-ordinated green stimulus
measures delivered greater economic impact than green measures implemented by
individual countries separately.
Whole-of-government co-ordination can help identify and mitigate potential divergence
in the achievement of different policy objectives
Greening the fiscal stimulus implies the targeting of multiple economic and
environmental policy objectives. Performance might vary across these dimensions and
over different time horizons (short versus long-term). There may also be trade-offs. For
example, in many cases investments aiming to improve energy efficiency were successful
at maintaining economic activity in the construction and in the automobile sector but they
suffered from rebound effects and delivered little net environmental gain. Conversely, the
support to renewable energy generation was successful at reducing the cost of renewable-
energy technologies but had little impact on economic growth. These trade-offs call for
whole-of-government co-ordination and establishment of clear criteria to identify and
mitigate potential divergence in the achievement of different policy objectives within
recovery packages.

ENV/WKP(2020)11 31
Unclassified
Proper design of green stimulus measures is critical
Stimulus packages such as scrappage payments removed inefficient vehicles from the
road but in some cases encouraged the purchase of cars emitting more nitrous oxide and
bigger cars. They also delivered limited additionality as in many instances they only
helped advance new car purchases that would have happened anyway. A more general
lesson from the ex post evaluation of green stimulus measures during the GFC is that
proper policy design is critical to prevent rebound effects, limit market distortion, and
ensure additionality of public funding by improving targeting.
Flanking policy instruments that fix underlying environmental externalities are key to
delivering greater environmental benefits from the green stimulus
This finding points to the fact that when green stimulus investments are assessed against
the dynamic backdrop of various market failures such as unpriced environmental
externalities, the environmental benefits could be offset or even nullified. To avoid this
outcome, environmental externalities must be taken into account and clear signals must
be sent to better align incentives.

32 ENV/WKP(2020)11
Unclassified
Towards greening a COVID-19 recovery
While the lessons from the GFC discussed in the preceding section remain relevant, the
specific proposals to green the COVID-19 response cannot simply be a “cut and paste” from
the GFC playbook. This is because there are a number of fundamental differences between
the current crisis, which is truly global in its extent, and its predecessors – most notably the
GFC – which were financial and economic crises that hit some regions of the world more
than others. The current crisis has been accompanied by a significant loss of human life,
which continues to climb; a tremendous strain on public health and social infrastructure; and
the significantly higher economic and social consequences that continue to unfold.
Further, while a key element of past crisis responses was to give an adrenalin shot in the
hope of immediately jumpstarting economic activity, the fundamental public health priority
to prevent this crisis from worsening is to restrict many economic activities that could
escalate virus transmission. There is also significant uncertainty over how long the period of
confinement will last, which in turn depends upon progress towards COVID-19 treatment
options, and eventually the development of a vaccine. The end of confinement and
resumption of economic activity will also be uneven across sectors and countries.
This new context and the unique characteristics of the COVID-19 crisis described above
underscore the need to take these special factors into account when planning both the timing
and the scope of the response. Figure 2 provides a schematic to conceptualise the phases of
the COVID-19 crisis and the (tax) policy response (OECD, 2020[1]). It provides also a useful
template to identify opportunities for greening policy responses.
At the time of writing, a majority of countries still find themselves in Phases 1 (immediate
response) or 2 (cushioning impacts and preserving capacity) of the crisis response. While
clearly the public health, social and economic concerns during these phases are paramount
to guiding the policy response, there are some environmental elements that merit attention.
First, while green measures only become relevant as part of stimulus measures in Phase 3
(recovery), and public health and social considerations will rightly dominate Phases 1 and 2,
one environmental priority during these two phases could be to do no harm. Meeting this
objective could include: i) vigilance against any rollback of environmental standards;
ii) ensuring that any scale-back or suspension of environmental management activities that
has resulted from confinement measures is temporary. For example, in the case of recycling,
ensuring that any suspension is time-bound, that households are better informed about
handling recyclables so as to minimise sanitary risk for collectors, and that recycling
activities are included among the priority sectors that are re-opened when containment
measures ease. Doing so is not only necessary from an environmental standpoint, but also
because the recycling sector is often dominated by small firms that work on thin profit
margins and could risk insolvency over the medium term; (iii) ensuring that support measures
in Phase 2 do not inadvertantly exacerbate environmental damage (for example certain
construction projects).
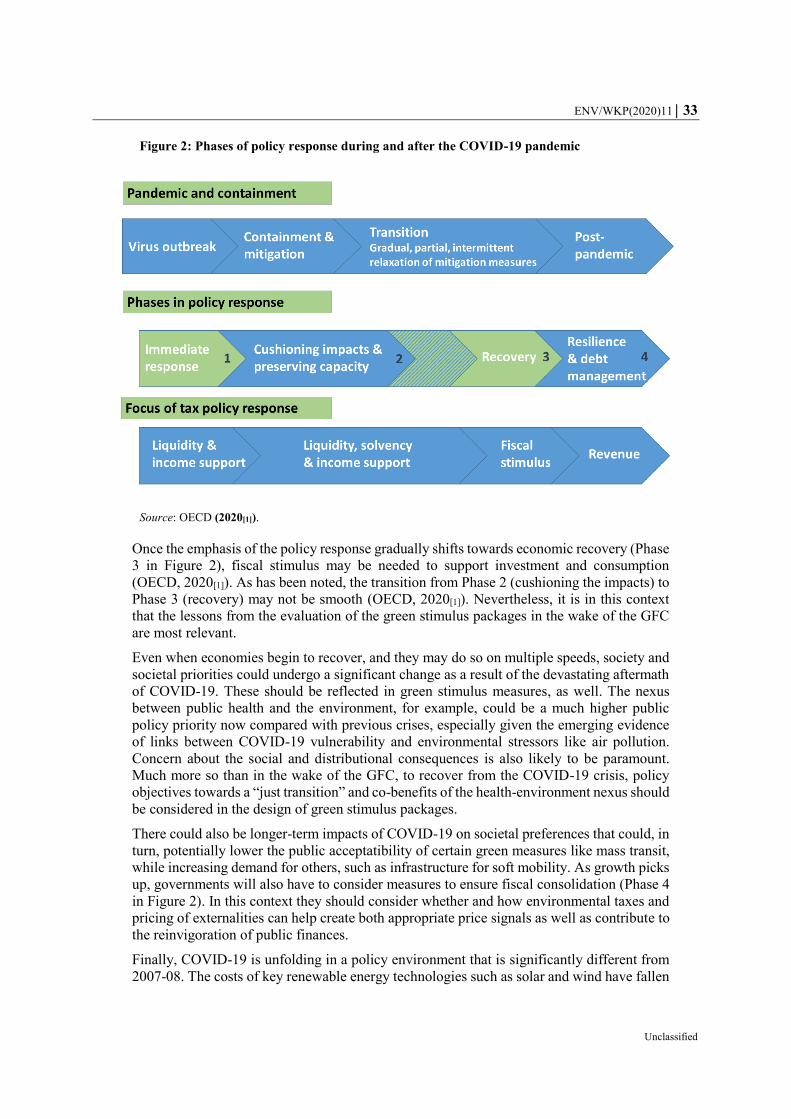
ENV/WKP(2020)11 33
Unclassified
Figure 2: Phases of policy response during and after the COVID-19 pandemic
Source: OECD (2020[1]).
Once the emphasis of the policy response gradually shifts towards economic recovery (Phase
3 in Figure 2), fiscal stimulus may be needed to support investment and consumption
(OECD, 2020[1]). As has been noted, the transition from Phase 2 (cushioning the impacts) to
Phase 3 (recovery) may not be smooth (OECD, 2020[1]). Nevertheless, it is in this context
that the lessons from the evaluation of the green stimulus packages in the wake of the GFC
are most relevant.
Even when economies begin to recover, and they may do so on multiple speeds, society and
societal priorities could undergo a significant change as a result of the devastating aftermath
of COVID-19. These should be reflected in green stimulus measures, as well. The nexus
between public health and the environment, for example, could be a much higher public
policy priority now compared with previous crises, especially given the emerging evidence
of links between COVID-19 vulnerability and environmental stressors like air pollution.
Concern about the social and distributional consequences is also likely to be paramount.
Much more so than in the wake of the GFC, to recover from the COVID-19 crisis, policy
objectives towards a “just transition” and co-benefits of the health-environment nexus should
be considered in the design of green stimulus packages.
There could also be longer-term impacts of COVID-19 on societal preferences that could, in
turn, potentially lower the public acceptatibility of certain green measures like mass transit,
while increasing demand for others, such as infrastructure for soft mobility. As growth picks
up, governments will also have to consider measures to ensure fiscal consolidation (Phase 4
in Figure 2). In this context they should consider whether and how environmental taxes and
pricing of externalities can help create both appropriate price signals as well as contribute to
the reinvigoration of public finances.
Finally, COVID-19 is unfolding in a policy environment that is significantly different from
2007-08. The costs of key renewable energy technologies such as solar and wind have fallen
34 ENV/WKP(2020)11
Unclassified
dramatically since 2010 compared to other energy sources, making large scale financing
more affordable and economically attractive. At the same time, green stimulus measures such
as public R&D support could now target technologies that complement renewables but might
be further from the market, such as energy storage and smart grids. Another development
since the GFC is the heightened attention among governments to improving resource
efficiency and the transition towards a more circular economy. Shifting away from
unsustainable natural resource use would not only reduce environmental impacts and supply
risks, it could also create job opportunities, for example in collecting recyclables, preparing
and processing secondary materials and repairing goods. Investments to support
repairability, reusability, remanufacturing and recycling, largely absent in the green elements
of the GFC stimulus, should also be considered as they can help support value creation and
economic resilience. These developments offer new impetus and possibilities for greening
the COVID-19 recovery.

ENV/WKP(2020)11 35
Unclassified
References
Afcha, S. and J. García-Quevedo (2016), “The impact of R&D subsidies on R&D employment
composition”, Industrial and Corporate Change, Vol. 25/6, pp. 955-975.
[48]
Alberini, A., W. Gans and C. Towe (2016), “Free riding, upsizing, and energy efficiency
incentives in Maryland homes”, The Energy Journal, Vol. 37/1.
[71]
Aldy, J. (2012), “A preliminary review of the American Recovery and Reinvestment Act’s
Clean Energy package”, Resources for the Future Discussion Paper, Vol. 12-03.
[22]
Álvarez, G., R. Jara and J. Julián (2009), “Study of the Effects on Employment of Public Aid
to Renewable Energy Sources”, Working Paper, Universidad Rey Juan Carlos, Madrid,
Spain..
[24]
Australian National Audit Office (2010), “Home insulation program.”, The Auditor General.
Audit Report No. 12 2010-11.
[30]
Baghana, R. (2010), “Public R&D subsidies and productivity: Evidence from firm-level data
in Quebec”, UNU-MERIT Working Paper Series.
[50]
Barbier, E. (2009), A Global Green New Deal: Rethinking the Economic Recovery, Cambridge
University Press.
[60]
Blazejczak, J. et al. (2014), “Economic effects of renewable energy expansion: A model-based
analysis for Germany”, Renewable and Sustainable Energy Reviews, Vol. 40, pp. 1070-
1080.
[26]
Board of Audit and Inspection (2013), Environmental Audit on Four Major Rivers Restoration
Program, Board of Audit and Inspection of Korea,
http://english.bai.go.kr/bai_eng/cop/bbs/detailBoardArticle.do?bbsId=BBSMSTR_200000
000004&nttId=14087&searchCnd=7&searchWrd=&searchBgnDe=&searchEndDe=&sear
chYear=&searchCate=&mdex.
[63]
Caldés, N. et al. (2009), “Economic impact of solar thermal electricity deployment in Spain”,
Energy Policy, Vol. 37/5, pp. 1628-1636.
[15]
Cervero, R., O. Sandoval and J. Landis (2002), “Transportation as a stimulus of welfare-to-
work: Private versus public mobility.”, Journal of Planning Education and Research,
Vol. 22/1, pp. 50-63.
[58]
Cin, B., Y. Kim and N. Vonortas (2017), “The impact of public R&D subsidy on small firm
productivity: evidence from Korean SMEs”, Small Business Economics, Vol. 48/2,
pp. 345-360.
[49]
36 ENV/WKP(2020)11
Unclassified
Council of Economic Advisors (2016), A retrospective assessment of clean energy investments
in the recovery act, Executive Office of the President of the United States.
[19]
Davis, L., S. Martinez and B. Taboada (2018), “How effective is energy-efficient housing?
evidence from a field experiment in Mexico”, National Bureau of Economic Research,
Vol. No. w24581.
[72]
Dechezleprêtre, A. et al. (2016), “Do tax incentives for research increase firm innovation? An
RD design for R&D”, National Bureau of Economic Research., Vol. No. w22405.
[53]
Dechezleprêtre, A. and D. Popp (2015), “Fiscal and regulatory instruments for clean
technology development in the European Union”, Energy Tax and Regulatory Policy in
Europe: Reform Priorities, Vol. July.
[47]
Dixon, P. and D. Jorgenson (2012), Handbook of computable general equilibrium modeling,
Newnes.
[17]
Elmendorf, D. and J. Furman (2008), If, when, how: A primer on fiscal stimulus, Brookings
Institution.
[9]
European Commission (2018), “On the implementation of the European Energy Programme
for Recovery and the European Energy Efficiency Fund”, COM(2018) 86 final.
[44]
Evenett, S. and J. Whalley (2009), “The G20 and Green Protectionism: Will We Pay the Price
at Copenhagen”, Policy Brief No. 14.
[69]
Farhadi, M. (2015), “Transport infrastructure and long-run economic growth in OECD
countries”, Transportation Research Part A: Policy and Practice, Vol. 74, pp. 73-90.
[59]
Four River Restoration Project Investigation Evaluation Committee (2014), Four River
Restoration Project Evaluation Report,
http://dx.doi.org/www.molit.go.kr/USR/policyData/m_34681/dtl.jsp?id=3860.
[62]
Frondel, M. et al. (2010), “Economic impacts from the promotion of renewable energy
technologies: The German experience”, Energy Policy, Vol. 38/8, pp. 4048-4056.
[25]
G20 (2020), G20 Finance Ministers and Central Bank Governors Meeting,
https://g20.org/en/media/Documents/G20_FMCBG_Communiqu%C3%A9_EN%20(2).pdf
.
[5]
Gans, W., A. Alberini and A. Longo (2013), “Smart meter devices and the effect of feedback
on residential electricity consumption: Evidence from a natural experiment in Northern
Ireland.”, Energy Economics, Vol. 36, pp. 729-743.
[31]
Gattari, P. (2012), “The role of patent law in incentivizing green technology.”, Nw. J. Tech. &
Intell. Prop., 11, vii., Vol. 11/2.
[21]
Gayer, T. and E. Parker (2013), An evaluation of the car allowance rebate system, Brookings
Institution.
[39]

ENV/WKP(2020)11 37
Unclassified
Green, D. et al. (2016), “Accelerator or brake? cash for clunkers, household liquidity, and
aggregate demand”, National Bureau of Economic Research No. w22878.
[37]
Grigolon, L., N. Leheyda and F. Verboven (2016), “Scrapping subsidies during the financial
crisis—Evidence from Europe”, International Journal of Industrial Organization, Vol. 44,
pp. 41-59.
[42]
Harsdorff, M. and D. Phillips (2013), “Methodologies for assessing green jobs”, ILO, Policy
brief, Feb. 2013.
[12]
Herzog, H. (2017), “Financing CCS demonstration projects: Lessons learned from two
decades of experience”, Energy Procedia, Vol. 114, pp. 5691-5700.
[45]
Holzer, H., J. Quigley and S. Raphael (2003), “Public transit and the spatial distribution of
minority employment: Evidence from a natural experiment”, Journal of Policy Analysis
and Management, Vol. 22/3, pp. 415-441.
[55]
Houde, S. et al. (2013), “Real-time feedback and electricity consumption: A field experiment
assessing the potential for savings and persistence”, The Energy Journal, Vol. 1, p. 34.
[32]
Houser, T., S. Mohan and R. Heilmayr (2009), “A green global recovery?: Assessing US
economic stimulus and the prospects for international coordination.”, Peterson Institute for
International Economics.
[18]
HSBC (2010), “Delivering the Green Stimulus”, HSBC Climate Change & Global Research. [7]
Hud, M. and K. Hussinger (2015), “The impact of R&D subsidies during the crisis”, Research
policy, Vol. 44/10, pp. 1844-1855.
[51]
IEA (2020), “Energy efficiency and economic stimulus”, IEA website,
https://www.iea.org/articles/energy-efficiency-and-economic-stimulus (accessed on
15 May 2020).
[3]
ILO (2015), “Guidelines for a just transition towards environmentally sustainable economies
and societies for all”, ILO website, https://www.ilo.org/global/topics/green-
jobs/publications/WCMS_432859/lang--en/index.htm (accessed on 13 May 2020).
[74]
ILO (2010), “Green stimulus measures”, EC-IILS Joing Discussion Paper Series No. 15. [8]
Johnson, D., M. Ercolani and P. Mackie (2017), “Econometric analysis of the link between
public transport accessibility and employment”, Transport Policy, Vol. 60, pp. 1-9.
[54]
Kammen, D., K. Kapadia and M. Fripp (2006), “Putting Renewables to Work: How Many
Jobs Can the Clean Energy Industry Generate?”, University of California, Berkeley.
[11]
Lambert, R. and P. Silva (2012), “The challenges of determining the employment effects of
renewable energy”, Renewable and Sustainable Energy Reviews, Vol. 16/7, pp. 4667-4674.
[13]
Lehr, U. et al. (2008), “Renewable energy and employment in Germany”, Energy policy,
Vol. 36/1, pp. 108-117.
[14]

38 ENV/WKP(2020)11
Unclassified
Li, S. et al. (2013), “Evaluating “Cash-for-Clunkers”: Program effects on auto sales and the
environment”, Journal of Environmental Economics and Management,,
http://dx.doi.org/10.1016/j.jeem.2012.07.004.
[36]
Maleček, P. and O. Melcher (2016), “Cross-border effects of car scrapping schemes: the case
of the German car scrapping programme and its effects on the Czech economy”, Prague
Economic Papers, University of Economics, Prague, http://dx.doi.org/10.18267/j.pep.567.
[66]
Malina, C. (2016), “The environmental impact of vehicle circulation tax reform in Germany”,
CAWM Discussion Paper, Centrum für Angewandte Wirtschaftsforschung Münster.,
Vol. 86.
[73]
McCarthy, A., R. Dellink and R. Bibas (2018), “The Macroeconomics of the Circular
Economy Transition: A Critical Review of Modelling Approaches”, OECD Environment
Working Papers, OECD Publishing, Paris, http://dx.doi.org/10.1787/af983f9a-en.
[16]
McCoy, D. and S. Lyons (2017), “Unintended outcomes of electricity smart-metering:
trading-off consumption and investment behaviour”, Energy Efficiency, Vol. 10/2, pp. 299-
318.
[35]
Mian, A. and A. Sufi (2012), “The effects of fiscal stimulus: Evidence from the 2009 cash for
clunkers program”, The Quarterly Journal of Economics, Vol. 127/3, pp. 1107-1142.
[38]
Mundaca, L. and B. Damen (2015), Assessing the effectiveness of the ‘Green Economic
Stimulus’ in South Korea: Evidence from the energy sector. In 38th International
Association for Energy Economics (IAEE) International Conference.
[64]
Mundaca, L. and J. Richter (2015), “Assessing ‘green energy economy’stimulus packages:
Evidence from the US programs targeting renewable energy”, Renewable and Sustainable
Energy Reviews, Vol. 42, pp. 1174-1186.
[20]
Nottingham Trent University (2013), “Nottingham City Homes: Decent Homes Impact
Study”, Social Return on Investment (SROI) report.
[29]
OECD (2020), COVID-19 and International Trade: Issues and Actions, https://read.oecd-
ilibrary.org/view/?ref=128_128542-3ijg8kfswh&title=COVID-19-and-international-trade-
issues-and-actions.
[70]
OECD (2020), From containment to recovery: Environmental responses to the COVID-19
pandemic, https://read.oecd-ilibrary.org/view/?ref=126_126460-1tg1r2aowf&title=From-
containment-to-recovery_Environmental-responses-to-the-COVID-19-pandemic.
[4]
OECD (2020), OECD Economic Outlook, Interim Report March 2020, OECD Publishing,
Paris, https://dx.doi.org/10.1787/7969896b-en.
[2]
OECD (2020), Tax and Fiscal Policy in Response to the Coronavirus Crisis: Strengthening
Confidence and Resilience, https://read.oecd-ilibrary.org/view/?ref=128_128575-
o6raktc0aa&title=Tax-and-Fiscal-Policy-in-Response-to-the-Coronavirus-Crisis.
[1]

ENV/WKP(2020)11 39
Unclassified
OECD (2018), OECD Environmental Performance Reviews: Czech Republic 2018, OECD
Environmental Performance Reviews, OECD Publishing, Paris,
https://dx.doi.org/10.1787/9789264300958-en.
[65]
OECD (2017), OECD Environmental Performance Reviews: Korea 2017, OECD
Environmental Performance Reviews, OECD Publishing, Paris,
https://doi.org/10.1787/9789264268265-en.
[61]
OECD (2016), OECD Environmental Performance Reviews: France 2016, OECD
Environmental Performance Reviews, OECD Publishing, Paris,
https://dx.doi.org/10.1787/9789264252714-en.
[43]
OECD (2011), Towards Green Growth, OECD Green Growth Studies, OECD Publishing,
Paris, https://dx.doi.org/10.1787/9789264111318-en.
[6]
OECD (2010), Macroeconomic policy: the exit from fîscal and monetary stimulus, In OECD
Economic Surveys: Korea 2010., https://doi.org/10.1787/eco_surveys-kor-2010-en.
[67]
OECD (2010), The OECD Innovation Strategy: Getting a Head Start on Tomorrow, OECD
Publishing, Paris, https://dx.doi.org/10.1787/9789264083479-en.
[46]
OECD/ITF (2011), Car Fleet Renewal Schemes: Environmental and Safety Impacts, ITF/FIA,
https://www.itf-oecd.org/car-fleet-renewal-schemes-environmental-and-safety-impacts.
[41]
Ong, P. and D. Houston (2002), “Transit, employment and women on welfare”, Urban
Geography, Vol. 23/4, pp. 344-364.
[57]
Pollitt, H. (2011), “Assessing the Implementation and Impact of Green Elements of Member
States’ National Recovery Plan”, Final Report for the European Commission, 20
September 2011, Cambridge Econometrics.
[40]
Rivers, N. (2018), “Leveraging the Smart Grid: The Effect of Real-Time Information on
Consumer Decisions”, OECD Environment Working Papers, Vol. 127,
https://doi.org/10.1787/6ad4d5e3-en.
[33]
Shalizi, Z. and F. Lecocq (2009), “Economics of targeted mitigation programs in sectors with
long-lived capital stock”, World Bank Working Paper, WPS, 5063.
[27]
Sharman, H., H. Meyer and M. Agerup (2009), “Wind Energy: The Case of Denmark”, Center
for Politiske Studier (CEPOS).
[23]
Steenblik, R. (2009), Green Growth, Protectionism, and the Crisis. Effective crisis response
and openness: implications for the trading system, eds. Evenett, J. Simon, Bernard
Hoekman i Oliver Cattaneo, London: Centre for Economic Policy Research, 249-263.
[68]
Strand, J. and M. Toman (2010), ““Green stimulus,” economic recovery, and long-term
sustainable development.”, The World Bank.
[10]

40 ENV/WKP(2020)11
Unclassified
UK Department for Business, Energy & Industrial Strategy (2019), Smart Meter Roll-Out:
Cost Benefit Analysis, https://www.gov.uk/government/publications/smart-meter-roll-out-
cost-benefit-analysis-2019 (accessed on 22 April 2020).
[34]
World Bank (2010), World development report 2010: Development and climate change, The
World Bank.
[28]
Yi, C. (2006), “Impact of public transit on employment status: Disaggregate analysis of
Houston, Texas”, Transportation Research Record, (1), 1986, pp. 137-144.
[56]
Zúñiga‐Vicente, J. et al. (2014), “Assessing the effect of public subsidies on firm R&D
investment: a survey”, Journal of Economic Surveys, Vol. 28/1, pp. 36-67.
[52]
Related Documents