65374.; EN VIRONOMICS A Financial Estimate of Entrironmental Pollution Control Find Abatement Schemes in Eloor-Edagar Industriai Belt CA. Antong under the supervision and guidance of Dr. K .C . Sanliaranaragaizan Thesis Submitted to Cochin Uniziersity of Science 2’-Ind Wechizoiogy for the award of the Degree of Doctor of Philosophy in Economics under the Faculty of Social Sciences DEPFIRTMENT OF FIPPLIED ECONOMICS ODOHIN UNIVERSITY OF SCIENCE HND TECHNOLOGY 1987

Welcome message from author
This document is posted to help you gain knowledge. Please leave a comment to let me know what you think about it! Share it to your friends and learn new things together.
Transcript

65374.;
EN VIRONOMICSA Financial Estimate of Entrironmental Pollution Control Find
Abatement Schemes in Eloor-Edagar Industriai Belt
CA. Antongunder the supervision and guidance of
Dr. K .C . Sanliaranaragaizan
Thesis Submitted to Cochin Uniziersity of Science 2’-Ind Wechizoiogyfor the award of the Degree of Doctor of Philosophy
in Economics under the Faculty of Social Sciences
DEPFIRTMENT OF FIPPLIED ECONOMICSODOHIN UNIVERSITY OF SCIENCE HND TECHNOLOGY
1987

CERTIFICATE
This is to Certiiy that the Thesis "Environomics - QFinancial Estimate of Environmental Pollution Control andfibatement Schemes in Eloor-Edayar Industrial Belt“ is abonafide record of research work done by Shri.C.fi. fintony undermy supervision and guidance. The thesis is worth submittingfor the award of the degree of Doctor o¥ Philosophy inEconomics.
University Campus Dr.H. . ranarayaCochinwéafl E22 Profes and HeadDate: ?/IBXB? Dept. of fippl. Economics

DECLRRATIDN
I declare that this thesis is the record of bonafideresearch carried out by me under the supervision oi Dr. H.C.Sankaranarayanan, Professor and Head of the Department offipplied Economics, Cochin University o¥ Science and Technology. I further declare that this has not previously ¥ormedthe basis oi ‘the award oi any degree, diploma, associateship,fellowship or other similar title of recognition.
University Campus C.fi. QNTDNYCochin~é82 622 Research ScholarDate: 7/l@fl9B7 Dept.o¥ fippl. Economics

ACKNOWLEDGEMENT
I owe a deep sense o$ gratitude to my Supervisor Dr.H.C.Bankaranaravanan, Pro¥essor and Head of the Department ofApplied Economics, Cochin University of Science and Technologyfor giving proper direction to this work through valuablesuggestions and constructive criticism. Dr. V. Karunakaran,exwvisiting Pro¥essor in the Department, was a perennial sourceof encouragement. Pro¥. fi.H. Gheevarghese o¥ the Department ofEnglish of the Union Christian College, filwave, was alwaysavailable with his valuable suggestions during the preparationof the manuscript.
I am thankiul to a number of individuals and institutionswho were sources of inspiration and were of help in the collect~ion of academic material and the clariiication and ampli¥icationof ideas. Some o¥ them listed below were of great help in theanahisis o¥ various aspects of the pollution problem o+ theproject area .
~ The Registrar, the Librarian and the Staii of the Centrefor Development Studies, Trivandrum; Ratan Tata Library,Delhi School of Economics; and the Jawaharlal NehruUniversity, Delhi,
- The Director and the Sta¥¥ o¥ the Ke'ala Forest ReserchInstitute, Peechi; the Librarian and the StaF4 of theHerala University, Trivandrum; and o¥ the John MathaiCentre, University of Calicut, Trichur,

_ ii ~ The Librarian and the Staff of Central Library; of the
Departments of Physics, applied Chemistry, appliedEconomics, Law, the Schools of Hanagement Studies, MarineScience, and Environmental studies of the CochinUniversity,
- The Scientists of the National Environmental Engineeringand Research Institute, and of the Herala State PollutionControl Board,
— Prof. M.K. Prasad, Environmentalist, and presently thePro-vice Chancellor of the University of Calicut; Hr.finil figarwal, Director, Centre for Science andEnvironment, New Delhi; and Mr. H.P. Unnikrishnan,wildlife Harden of Silent valley National Park, and ~
~ Prof. Neelakandan, Urnithologist, Mr. V.T. Padmanabhan,Environmentalist, and Dr. Rajah Surukkal, Dr. H.H.George, Dr. M.H. Sukumaran Hair, and Mr. P.J. James,Scholars,in their fields of higher learning.
I owe a special sense of gratitude to Dr. PVS Namboodiripad,Managing Director of the Hindustan Latex Limited, Trivandrum,for his immense help in preparing the schedule for the factorysurvey. Mr. D. Prasanth, Research Officer at the Herala StatePlanning Board, and Mr. D. Rajeev, Lecturer, Department of Lawof Cochin University were very helpful in the preparation ofschedules for the Household Survey, the Employee welfare Survey

~ iii ~and the Hospital Survey. Dr. Harikumar, Mr. fi.H. Rayindran andMr. Mathew George, Research Scholars at the Department ofapplied Economics were my willing companions on the surveytrips. I am thankful to the people o+ the Project Area, thedirectors and the staff of Hospitals and Clinics in the localityand the factory managements and the employees who have been kind
enough to welcome me to their places and answer my questions.
It is no exaggeration to mention that this work could nothave been completed without the enthusiasm shown and encourage~ment accorded to me by Dr. H.V. Hurien, Pro¥essor and Head ofthe Department of Economics, Union Christian College. In thisregard, I am also grateful to every member oi the teaching andnonwteaching iraternity of the Department of fipplied Economics.
Though my sentiments can hardly be conveyed through thedropping of names, I must mention my colleagues and students atU.C. College and my iriends at the University Campus ¥or allthat they have been to me during the period of this study.
and iinally, I am thank¥ul to M/s.Datalink ComputerServices, Ernakulam, for their efficient secretarial assistanceand neat and expeditious execution o+ the printing work.
C.fi. HNTDNY

C O N T E N T S
Pages
ACHNONLEDGEMENT i - iiiCONTENTS iv - viLIST OF TABLES vii - inCHAPTERS
I THE APPROACH 1 - 14Introduction 1Subject Matter 7Methodology 9Limitations 12Scheme of the Study 13II GLOBAL ENVIRONMENTAL AWARENESS 15 - 29Global Awareness 15Environmental Literature 16International Conferences 19Legislative Enactments 21International Agencies 22Follow-up Action 24III ENVIRONMENTAL PROTECTION IN INDIA 30 - 49
During Ancient Times SEThe Chipko Movement 32Environmental Protection in the Constitution 33Legislative Measures 34Enforcement Bodies 35The NCEPC and DOEn 36Other Co~Operating Agencies 39Under the Five Year Plans 4OSeventh Plan Proposals 42E¥¥ectiveness of Implementation 44IV ENVIRONOMICS SO - 66
Genesis of Environmental Problem 50The Regenerative Capacity of Earth SDThe Declining Assimilative Capacity of theEnvironment 52The Economic Problem 54Environomics 56Ecodevelopment and Environomic Planning 61Environmental Management 69

VI
VI.
VII.
":3-I-'1. -...'.I2..
COST ESTIMATION OF ENVIRONMENTAL PROTECTION 67 — 87
Direct Costs of Environmental Protection 68Pollution Damage Costs 68Damage Avoidance Costs 7OPollution Oantrol and Abatement Costs 7OPollution Prevention Costs 72Transaction Costs 73Indirect Costs o¥ Environmental Protection 75Impacts on Consumption and Production 76Impacts on Employment 77Impacts on Capital Supply 77Impacts on the Fiscal Ease o¥ Municipaland Regional Governments 78Impacts on International Trade and Balance o$Payments etc. 79who Nill Pay the Costs? BOPolluter"Pay~Principle S1Bene¥iciary~Pay~Principle B2Government-PavwPrinciple 83Cost and Benefit Optimality 86
THE STATE OF ENVIRONMENT IN ELOOR—EDAYARINDUSTRIAL BELT B8 - 132Project Area 88Geographical Features 9BThe Pathalam Bund 92Factories Surveyed 93Potential Pollutants 95Water Pollution in the Area 99Ground Water Quality of the Area 99Polluted Periyar River 1B1Condition o4 the Uembanad Backwaters 104Air Pollution 105Solid waste and Sound Pollution 1OBStorage and Disposal of Radioactive substancesin the area 10?Tables 6.1 to 6.21 114 IMPACT ANALYSIS 133 - 174Various Impacts of Major Pollutants 134Impacts on Human Health and welfare 135Impacts on Animals, Birds and Fishes 142Impacts on vegetation 145Impacts on Structures, Materials and Aesthetics 147Specific Impacts ldientified in the Project Area 149Impacts on People 15OImpacts on Domestic Animals 156Impacts on Agriculture '15?Impacts on Materials and Structures 162Tables 7.1 to 7.12 165 — 174

vi
VIII. FINANCIAL ESTIMATE
Package o+ Measures ProposedThe Financial EstimateEstimate oi Incremental RevenueIncremental Revenue Irom Bene+iciaries’
willingness to payIncremental Revenue from Damages AvoidedRevenue Irom Damages on Human Health AvoidedRevenue from Damages on Domestic Animals AvoidedRevenue from Damages on Crops AvoidedRevenue from Damages on Materials and Structures
avoidedIncremental Revenue from Damage Avoidance Costs
AvoidedIncremental Revenue from Additional Employment
CreatedEstimate of Incremental CostsDamage CostsDamage Avoidance CostsPollutian Control and Abatement CostsPollution Prevention CostsTransation CostsBenefit~Eost Analysis ResultsBene¥it~Cost Analysis TableTables 8.1 to 8.8
IX FINDINGS OF THE STUDY 281APPENDICES xANNEXURE8 xivBIBLIOGRAPHY xxviii
175
176179181
182183184185185
186
188
188189188198191
280
192‘194194196
197 2E8
286
xiiixxvii1.:-.,.° ‘Ll ' 1.:' .-s .r'\ 1 r'\

LIST OF TABLES
TABLES:
6.1 Factories Surveyed6.2 Pottential Pollutants6.? Concentration of Pollutants in the effluents6.4 Typical Mineral Concentrations for
Uncontaminated water
6.5 Ground water Quality in Eloor~Edayar Island6.6 Ground water Quality of Open wells at Eloor (1981)6.7 Volume of waste water Discharged by the
Industries into the River Periyar (1982-83)6.8 Quality of Pollutants discharged into the
River Periyar6.9 water Quality-Periyar Riverine System - 19886.18 Major Air Pollutants emitted by the Factories
in the Area6.11 Concentration of Certain Air Pollutants
6.12 U.S.National Ambient Air Quality Standards6.13 Range o¥ Uncontaminated and Hazardous
Air Quality Levels
6.14 Concentration of 802, N02 and Suspended
Particulates at Udyogamandal Area6.15 Concentration of S82 and Particulates in
the Area During January-March 1988
6.16 Concentration o+ SD; in Eloor-EdayarIndustrial belt
Pages:
114
115
116
117
118
119
128
125
126
127
128

viii
Humidity Range During Different Monthsin Herala
Radioactivity due to Effluents Released fromIRE During 1953~198@
Radioactivity Released from IRE During1953-1988
Radioactive Decay Series - Thorium 232
Radioactive Decay Series - Uranium 238
Health Impacts of some of the Major AirPollutants
Pollution Effects on VegetationImpacts on Human Health
Incidence of Diseases on People of Di¥ferent
Income groups
Incidence of cancer, Heart Disease and Rateof Mortality per 1@,DD@ population in IRE,
TCC, and ESIC (All India) 197@~S4.Relative Risks between IRE~TCC & IRE~ESIC
Summary Results of the Employee Survey
Incidence of Diseases in Employee Households
Domestic Animals Brought up by 106 Households
in the LocalityLand use Pattern in Agriculture in Ernakulam
District and the State (1977-78)
Percentage of Area under Major Crops to Total
Cropped Area in the LocalityMotor Vehicle Accidents in the State ~ 1978
128
129
165
166
167
168
169
169
17B
171
172
172
173
174

ix
Bene¥iciaries’ willingness to RayIncremental Revenue on the Basis of
Beneficiaries’ willingness to PayRevenue ¥rom Damages
Revenue from Loss of
Lost Avoided
Revenue from Damages
Avoided
Revenue from Damages
Revenue from Damages
structures Avoided
on Human Health Avoided
Income Due to workdays
on Domestic Animals
on Crops Avoided
on Materials and
Revenue from Damage Avoidance Costs Avoided.
197
197
198
198
199
199

CHAPTER - ;THE APPROACH
Introduction
Economic system is part of a larger ecosystem and man isonly one of the species of this system. The laws o4 nature are.common to all species. Han and the systems created by him arenot exempt from them. As per the law of conservation of naturematter and energy can neither be created nor be destroyed. Theresources drawn in the form of materials and energy from natureby its inhabitants must, therefore, inevitably return to natureas wastes. But the environment has the capacity to regeneratethose wastes back to useful inputs. In its capacity as resourcesupplier, supplier of goods and services, and waste assimilator,environment adopts its own ways and means to maintain earth'sregenerative capacity and the ecosystem in balance. The tragedyis that man disrupts the earth’s regenerating and balancingcapacity through massive resource~use and waste generation inproduction~consumption activities. when such disruption recklessly continues the resources gradually become extinct orexhausted and the environment gets polluted.
Till the beginning of the 28th century there was littleinterierence by man with nature's regenerative system. He wasable to coexist with nature and considered nature as an unlimited source of inputs, materials and energy. with the growth ofcities and the advent of industrialization man began to inter~{ere with nature and consequently nature started mani+estingsigns of deterioration in its cleansing powers. The continuous
....."'J-.......:..
boom witnessed after the world war II, with rising energy useand leaping material standards, brought in its trail newproblems. Air in big cities began to get pollutted byautomobile exhausts and industrial emissions which causedrespiratory diseases. Rivers and lakes represented the cynicsdescription: "if you fall, you don't drown, you dissolve”1.Landfills leaked poison into nearby aquifers. Certain wastesthat existed never before like plastics, radio-activesubstances, toxic chemicals, etc., were dumped into theenvironment which neither nature" could regenerate, nor couldmankind prevent their dangerous impacts on ecosystem and theoccupants. The wasteful over-use of resources lead to thedisappearance of several species and‘ several others to theverge o¥ extinction. At the present rate of extraction certainvital materials and minerals would be exhausted in the nearfuture. with the 1ow~skill in politico—economic artifacts andless knowledge in technology the amount of wastes per unit o¥production in developing countries is high. Moreover, povertygot recognized as the worst form of pollution. The pressurethat arose, when basic human needs were not met and when manendeavoured to satisfy those needs by any available means,could destroy the resource—base which man depended on for hisexistencez. In short, man's assault on nature became one ofthe most alarming problems of our time.
1. Barbara ward, Progress {or a Small Planet, Penguin Books,England, (1979), p.61.2. Essam El-Hinnawi and Manzur-U1~Haque Hashmi, (Eds.), Global
Environmental Issues, Tycooly International PublishingLtd., Dublin,(1982), p.4.

"Z"T O 20DJ
Nineteen sixties and seventies witnessed the emergence of alot of literature on environmental problems. They were largelyresponsible for creating and propagating environmental aware~ness among man all over the world. Consequently, a number ofinternational conferences and seminars were conducted and forums
met to discuss the dangers of the problems. The historic UnitedNation's Conference on Human Enviornment held at Stockholm in
1972 could evolve a comprehensive action-plan for the protectionof the global environment. This particular conference wasremarkably successful in contrast to most of the U.N. Conferences that followed it. It could attract the interests of thedeveloped as well as the developing countries. The Conferencehighlighted the need for sustainable husbanding of planetaryresources and their equitable sharing to foster development innon—industrial countries facing the problem of acute poverty andto prevent environmental degradation in industrialized countriesnot prudent in the use of technology.3 The United Nation'sEnvironmental Programme (UNEP) was established immediately after
the Stockholm Conference to impart factual information foreconomic development on a sound ecological basis. Most of thedeveloped and developing countries have enacted comprehensiveenvironmental protection laws and constituted implementationagencies. Guidelines have been drawn and agreements concludedbetween nations for the protection of the national and theglobal environment. Various international organizations andagencies are now on alert in this area. Their member countries
3. Ignacy Saches,"Environment and Development Revisited", inAlternatives — A Journal of world Policv, September 1982,p.383

_ 4 _
are required to fulfil certain environmental criteria beforereceiving development aids. To-date, however, none of thoseagreements or organziations taken singly or collectively hasdone more than nibble at the fringe of the larger crisis ofplanetary resources.“ The resolutions passed at international levels are quite general in nature as internationaldiplomacy and politics play a major role, and the agreemenentsreached are to be ratified by each national government beforebecoming operative.
India is one of the first countries to recognize the need toprotect the environment. The reverence for all things naturalis deep rooted in her culture and religion. The great ancientIndian works of art and literature contain innumerable examplesto illustrate human consciousness of the pristine glory andsylvan beauty of nature which provides man food, shelter andrecreation. Dur great rulers and writers of the past centurieshad recognised the need for protected forests and wildlifesancturies. But gradually with the growth of population,environment got neglected in the name of people’s basic needsand faster development. figain the ancient environmental spiritgot revived with the recent spurt in global environmentalawareness, especially after the Stockholm conference. As aresult, new and comprehensive environmental protection laws havebeen enacted. Pollution Control Boards, and Departments andMinistries of Environment have been established at the centre
4. David N. Drr and Marvin S. Soroos (Eds.), The GlobalPredicament: Ecological Perspectives on world Order,University of North California Press,(1979), p.7.

.....f_-‘-'_’.....
and in the States. Variuous environmental protection programmes adopted by them are being progressively implemented.However, the shortage of scientific and technical as well asother infrastructural expertise required to assess and preventenvironmental impacts is a serious impediment faced by thoseagencies.” The various programmes taken up during the pastfew years, more in the form of nucleating activities, would nowreceive a greater impetus in terms of investment and even morethrough co~ordinated expeditious implementation during theseventh plan.“
A closer observation of the state of Indian Economy revealsthat the country's resource base is not properly utilised.Land and water resources are ill-managed. The forests in thecountry are vanishing at a rapid pace. The relentless deforestation of hillsides and failure to protect land on the plainshave accentuated massive floods during the monsoon followed bydraught in summer. The country is losing large quantities oforganic fertilizers every year due to top soil erosion which ismore than that put in artificially. The destruction of thelife support system continues along the Himalayas and westernand Eastern Ghats as well as in many other parts of thecountry. The natural ‘genepool’ preserves and the flawlessbeauty of historic monuments are relegated to the second placein the name of development, industrialisation, irrigation
5. P.K. Sapru," Environment Administration: Structural andPolicy Issues in India", Management in Government, JanuaryMarch 1985, p.490.
6. Government of India (1985), Seventh Plan l985~9G, PlanningCommission, New Delhi, p-388.

_ 6 _
projects and oil and fertilizer plants. Industrial pollutionever mounts; major rivers are pollution loaded; and theatmosphere in the industrial cities is suffocating. Theplantations under the social forestry programme sponsored bythe world Bank and the United States Aid for InternationalDevelopment (USQIDJ are mainly meant for use in polyfibreindustries. As such, they cannot meet the shortage of fuelwoodand fodder in the country. Further, those plantations (especially eucalyptus) in dryland agriculture drain the soil of itsfertility and moisture and are inappropriate for dryland ecosystem where water is a limiting factor for biologicalproductivity.’ The forest denudation not only has undesirable ecological consequences but deprives the forest dwellers(adivasis) of food, fuel and fibre. The introduction ofmechanised boats has badly hit the traditional fisherman of hislivelihood along the country's vast coastal areas. Theresources of the country have not been nurtured to meet thebasic needs of the people, but exploited only for the benefitof certain sections of society. In fact, the current development in India can be described as the process by which the richand the more powerful reallocate the nation's resources intheir favour and modern technology is the tool that subservesthis purpose.” In that process the state of India's environment continues to deteriorate and the country is slowlybecoming a vast wasteland.
7. H.S. Dakshina Murthy," Politics of Environment”, Economicand Politicel Weekly, May 3, 1986, p.774.
8. Darryl D’Monte, Iemplee or Tombe? Induetry VersusEnvironment: Three Contraversies, Centre for Science andEnvironment, New Delhi,(19B5), p.26.

.....7 ..
In this context, it is timely and demanding to have undertaken a study of this nature in the area of economics andenvironmental protection.
Subject Matter
In a study of environment and economics the relationshipbetween ecology and economics has to be considered. wheneconomics deals with the well-being of the human household,ecology discusses that of the society of all living beings intheir surroundings. The ecosystem as well as the economicsystem draws life-requirements or resources from the earthlyenvironment, i.e., nature. Economic system, being the part ofa larger ecosystem, should not undermine the ecosystem balancein its attempts to increase human welfare. Economic growthmust aim at development in a protected environment improvingthe quality of life.
Environmental pollution and resource depletion are the twomajor offshoots of economic development. Pollution occurs whenwaste generation exceeds the assimilative capacity of theenvironment. when the resource~use rate exceeds nature'sreproductive rate, renewable resources become extinct. withexploitation, rather than rational utilization, non renewablesources are exhausted. There is yet another offshoot ofdevelopment, i.e., societal deterioration and this is accentu~ated by industrialization, urbanisation and population growth.Though the general framework, the ideas and the theoriesdiffer, both free market and Marxian economics in the past have

_ 3 _considered earth as a bottomless reservoir of resources and have
practised a reckless exploitation instead of a rational andoptimal use of the limited resources. Under the existing framework, the application of most of the prevailing theories ineconomics would often lead to the squandering of resources. Thepresent study is on the subject and scope of the emerging branchin economics, namely environmental economics or ‘environomics’.An attempt is also made to highlight the need to redefinecertain principles of the science of economics in the environmental context.
Many of the undercurrents in the ‘economic and environmental‘ issues can be gleaned through the case studies ofspecific projects or problem areas. As they are limited inscope such studies lend themselves to documentation andanalysis. By contrast, problems of larger magnitude and generalnature involving a very vast area, are far too diffuse, variedand complex to be easily studied and generalizations arrivedat.” Keeping this in mind environmental protection of E1oorEdayar industrial belt, the largest and the most polluted in theState of Herala is selected for a comprehensive study andgeneralization. This study analyses the financial, economic,social and political implications of the polluted environment inthe project area and various impacts of pollution and itscontrol and abatement measures aimed at protecting the environ~ment. A financial estimate is made accounting for differentcategories of costs and benefits involved in the abatement and
9. Darryl D'Monte,(19B5), Ibid, p.15

_ 9 _
control of pollution. And the economic feasibility of protecting the environment of the project area is established througha thorough benefit~cost analysis and preparing a comprehensivebenefit-cost analysis table.
The objectives o¥ the study are:1 To define environomics and discuss important issues and
problematics of this new branch of economics.
2. To conduct an ‘environmental impact assessment’ of EloorEdayar industrial belt considering the economic, social andother aspects of the problem.
a. To judge the economic feasibility o¥ protecting the environment of the project area by making a financial estimatetaking into account the various costs and benefits involvedin the process — and
4. To make available relevant data to the appropriateauthorities for decision making and implementing variousenvironmental protection measures in problem areas, thereand elsewhere.
Methodology
The present study is based on the premise that environmentalproblem is essentially economic. At the same time it is multidisciplinary. Source materials are drawn from various branchesof economics and other disciplines like physical and biological

_ 19 _
sciences, social sciences, engineering, medicine and law. Forthe purpose some of the centres of higher learning in thecountry have been visited; a large number of books and articlesdealing with environmental literature have been surveyed; andsome of the scientists and experts in the field have beenconsulted. There are a few studies conducted earlier in theproject area on some aspects of the problem. They have beenconsulted and the methodology adopted by them are improved uponin the present study. The financial estimation of environmentalprotection of the industrial belt is made in the study involvingsix stages. They are:
1. Identification of the harmful solid, liquid and gaseouspollutants emitted or present in the project area;
2. Assessment of possible and probable impacts of thosepollutants with the help of relevant literature.
a. Identification of the specific impacts of those pollutantson the living (men, animals, vegetation, etc.) and on thenon~living (materials, structures, aesthetics, etc.) in theE:'t|"'EEl.
4. Prescription of measures for the control and abatement ofenvironmental degradation in the area.
5. Estimation of incremental costs and benefits of protectingthe environment from disturbances or degradation; and

The
Presentation of a comprehensive ‘benefit~cost analysistable’ accounting for the protection of environment of theE.1l"Ec":'t.
data for the study were collected in the following manner:
The primary data were collected with the help of four surveyschedules.
i) Factory survey: to identify pollutants in the wastes,effluents and emissions thrown out of the factories.
ii) Household survey: to evaluate the impacts of pollutants
on the well-being of men and animals in the area and onthe vegetation, materials, structures and aesthetics.
iii) Employee Survey: to identify occupational healthhazards and other related matters, and
iv) Hospital Survey: to assess the health impacts ofpollutants on the people and animals.
These surveys were conducted with the help of appropriateschedules (given in annexures I through IV). The surveyschedules were prepared in an interlocking manner to checkthe validity of certain data as they were obtained from morethan one source.
The secondary data were collected from some of the earlierstudies conducted in the project area. In addition,certainreports and seminar papers on the subject that appearedduring recent years have been gone through. an extensive

survey of literature on the subject helped in assembling andanalysing the ideas and information thus collected;
Suggestions and expert opinion were obtained from theofficials of National Environmental Engineering and ResearchInstitute and the Herala State Pollution Control Board andfrom some of the leading environmentalists in the country;and
The benfit—cost analysis was made and ‘table’ presented ofenvironmental protection of the project area after afinancial estimate of incremental benefits and costsinvolved in the process.
Limitations of the study1' The non~quantifiability of most of the environmental aspects
has led to approximations;
Non availability of certain information on account of gapsin knowledge, especially with respect to the impacts of someof the pollutants;
Lack of cooperation from the side of the factory managementsin giving some of the details of their polluting activities;and
The inability to obtain certain information even fromofficial environment protection agencies which are eager toconceal rather than reveal the information.

_ 13 _
However, every possible attempt has been made to make thestudy successful. The officls and experts in the Herala StatePollution Control Board (KSPCB) and the National Environmental
Engineering and Research Institute (NEERI) have been consultedat every stage. Besides, the affected people of the localityand the activists of some of the major voluntary environmentalprotection organisations and movements in the area and in thestate have been frequently contacted.
Scheme of the Study
The present study consists of nine chapters including theintroductory chapter.
Chapter II makes a brief review of environmental literatureand examines various measures adopted at the global level toprotect the environment. The environmental problems oftentransgress national sovereignity and geographical boundaries.Therefore, attempts must be made at the national and international levels to protect the environment, the resources ofwhich are the common property of mankind. The protection of thenational environment from the ancient till the present forms thecontent of Chapter III. These chapters together provide abackground to understand the issues analysed in the subsequentchapters.
Carefully worked out theoretical framework is a pre-requisite for the successful study of a complex subject. Some of thetheoretical issues of ‘environomics’ are examined in Chapter IV.

..... .....
The theoretical issues involved in estimating the costs andbenefits of environmental protection constitute the theme ofChapter V.
The state of environment in Eloor-Edayar Industrial belt andthe impact analysis of pollution of the area are discussed inChapter VI and VII respectively. Chapter VIII makes thefinancial estimate of environmental protection of the projectE1|"E'Et.
And finally, Chapter IX presents the findings of the study.

CHRPTER - IGLDBQL ENVIRONMENTAL RNARENESS
Global Awareness
Earth, according to the present knowledge is the onlyhabitat for all life~forms including man. The photographs ofearth taken from spacecrafts present the vast dark void of spaceagainst which the earth is merely a small, green and blueoasis. The earth has neither boundaries nor rivers, onlyoceans, deserts, polar-caps, mountains, forests and driftingclouds blended in a unique mosaic of life. There could be noclearer demonstration of ‘spaceship earth’ and no more starkevidence that earth is the only possible habitat for man.‘ Inother words, ecological crisis transcends the relatively fixedboundaries between nations. The air spreads over nations. Thewater bodies are often multinational assets in the sense thatrivers flow through more than one country and the oceans, theseas and the lakes surround several countries. The pollution ofland resources is a concern for the countries affected and theentire world. The problems of oceanic pollution, internationalriver management, climatic disruption, protection of atmosphericozone levels, resource depletion, impending dangers of mountingbuild-up of lethal weapons etc., demand the emergence of newforms of institutions and radical changes in the prevailingconcept of national sovereignity. The global awareness ofenvironmental problems was increasingly created by the large
1. David N. Drr and Marvin S. Soroos (Eds.), The GlobalEgegleement: Ecological Pegepectivee on world Drdeg,University of North Carolina Press,(1979), p~4.

_ 16 _
number of environmental literature that has appeared in therecent past. It was eventually legitimized and quicklypropagated by various international conferences and organizations. Various international agreements and treaties concludedbetween nations, legislative enactments, and further follow-upactions were important moves in the right direction towards theprotection of global environment.
Environmental Literature
Apart from a few classic papers from earlier generations ofeconomists (Gray, 1912; Hottelling, 1931) with the static view.of natural resources complex (Ely and Nehrwein, 1949) anyidentifiable literature on resource~economics did not reallymake appearance until the 1959s (Allen, 1955; Scott, 1955;Ciriacv~Nantrup, 1956; Gordon, 1957) and much of this wasconcerned with conservation as a national target in an institutional setting rather than with the more general economicprinciples.‘ Rachel Carson's (1962) ‘Silent Spring’ is thefirst notable scientific work which created cumulative insightsin our understanding of environmental problems. It reveals thatnature is not an infinitelv expandable ‘spring cleaner’ for anydegree of waste in human societies, that waste disposal is notcost~free and that in order to maintain environmental standards
some would have to pay.3 In the last two decades the writingsin this area have become many and varied with
2. John Q. Butlin (Ed.), Economics and Resources Policy,Longman, London,(1981) p.33
3. Barbara ward, Progress for a Small Planet, Penguin Books,England,(1977), p.62.

_ 17 _
increasing focus on global concerns with attention directed tothe key issues of pollution as a central feature of contemporaryresource-use patterns (Jarret, 1966) and the seemingly unavoidable paradoxes of resource-ownership and access (Hardin, 1968;Dales, 1968). Barbara ward and Rene Dubos (1972) perceivedenvironmental problems from a global perspective within theirsocial, political and economic dimensions and touched upon theproblems in its totality. According to them, man requires todevelop a global state of mind as he has citizenship to twocountries, his own and the planet in the global phase of humanevolution. Barry Commoner (1972) finds social origins in thecrisis, and advocates a national ecological policy in a ‘democratic society' for every country with adhering importance toecological criterion rather than to profit maximization.Meadows et.al. (1972) are concerned with the finiteness of theresource supplies, Ehrlich et. al (1973) with population growthand Daly (1973) with intertemporal equity in resource-use.Mihajlo Mesarovic and Edward Pestel (1974) reject the pessimi~stic forecasts of Meadows and others and describe them asprophecies of a ‘doomsday’. They advocate organic developmentrather than ‘limited growth’ through developing a sense ofidentity with future generations. As opposed to writers likeMeadows, Ehrlich and their associates who hold pessimistic viewof environmental future by advocating zero population and zeroeconomic growth, some others have argued that throughtechnological advancement, within a century or two, mankindwould be, everywhere, rich and in control of the forces of

.....1B....
nature (Herman Hahn, William Brown and Leon Martel, 1976).“But in the foreseeable future, it seems, there are no technolo~gical fixes that can quickly erase the ecological crisis.Katherine Montague and Peter Montague (1976) demand restraint in
economic activities by moving into a stage characterized by adynamic equilibrium between human civilization and naturalenvironment.” E.F. Schumacher (1973) advocates moderation in
all activities, especially in the use of technology, industrialization and economic growth and highlights the need forintragenerational equity referring to the Gandhian saying that‘earth provides enough to satisfy every man's need but not forevery man's greed.'“ Larry Horn (1978) in his ‘Une StrawRevolution’, while describing Mazanobu Fukuoka’s natural farmingin Japan, maintains that by preserving the ecosystem balancebased on nature's dictum of mutual coexistence and survival ofall living things, peace and order on earth is preserved. fishokS. Guha (1981) maintains an evolutionary view of economic growth
and rejects the stage theories which visualize development interms of uniform sequence of stages in different countriesignoring the diversity of natural environments in which growthoccurs and the diversity of adaptation it induces.’ Accordingto him, the ‘rhythm’ of economic growth is essentially identical
4. Hahn Herman, Brown Nilliam and Martel Leon, The Next 2606Years, William Morrow, New York,(1976), p.1.
5. Frolov 1., Global Problems and the Future of Mankind,Progress Publishers, Moscow,(19B2), p.127.
6. Schumacher E.F., Small is Beautiful, Blond and Briggs Ltd.,Great Britain,(1973), p.26.
7. fishok S. Guha, fin Evolutionary View of Economic Growth,Oxford University Press, New York,(19B1), p.17.

_ 19 _
to the rhythm of evolution of species.9 Besides thosementioned above, there is a plethora of literature designated as‘environmental’ attracting the interests of the human societyand cautioning against man's reckless exploitation of globalenvironment.
International Conferences
Various international conferences were held during the pastfew decades to express the seriousness and the global concernwith environmental problems. But the environmental issues weremore pronounced in the Stockholm Conference (1972) [See Appendix2.1 on Stockholm Confernece (1972)) than in many of the others.The U.N. Conferences which focussed attention on the globalecological crisis date back to the 1948 conference on Conservation and Utilization of Resources held at Lake Success. Theyear 1957~5B was declared by the United Nations as the Geophysical Year. The conference on Biosphere was held at Paris in1968 and on Environment and Development at Founnex in 1971.7The Stockholm Conference was closely followed by the BucharestConference on Population (1974) and the Home Conference on Food
(1974) which recognized development as a multidimensionalconcept encompassing not only economic and social aspects of
national activity, but also those related to population, the useof natural resources and the management of environment.1°
B. Qshok S. Suha (1981), op. cit., p.16.9. David Orr and Marvin S. Soroos (1979), op. cit.,pp.6-7.10. Essam E1. Hinnavi and Manzur Ul—Haque Hashmi (Eds.), Global
Environmental Issues, Published for UNEP, by TycoolyInternational Publishing Ltd., Dublin, (1982), pp.1-16.

_ gm _
Environmental issues were implicit in the Conference of the Lawof the Sea which began in 1974 and at the special sessions ofthe General Assembly on Raw Materials in the spring of 1974 andthe Fall of 1975. Lima Conference on Industrialization (1975),Geneva Conference on Employment (1976), Vancouver Conference on
Human Settlement (1976), Buenos Aires Conference on water(1977), Nairobi Conference on Desertification (1977) and AlmaAtta Conference on Primary Health Care (1978) were all sponsored
by the United Nations and had the underlying ecological perspecitives.11
The U.N. Law of the Sea Conference held in April 1982, tenyears after the Stockholm Conference produced contrastingresults.13 The law of the Sea Conference was a negation ofthe spirit of Stockholm and consensus failed to emerge.Delegates from U.S.A. voted against the treaty while thedelegates from U.H., FRG, and the Soviet Union abstained. Intheir assertive arrogance a handfull of industrialized nationsdecided to go ahead with plans of appropriating sea-bedresources. The more recent conferences on New InternationalEconomic Order and North~South Dialogues too manifested areversal of the Stockholm spirit as developed countries were notwilling to share the global resources with the developingcountries.
11. Ibid
12. Ignacy Sachs, "Environment and Development Revisited",Alternatives ~ A Journal of world Policy, Sept. 1982, p.383.

Legislative Enactments
The development of international response to environmentalaffairs can be traced through several legislative measuresenacted by different countries of the world. The United Statespassed a comprehensive Environmental Protection fict and set upthe Environmental Protection figencv in 1969 followed by theResources Recovery fict, 1976 and more recently the ResourcesConservation and Recovery Act.13 In 1971, the FederalRepublic of Germany formulated an Environmental Programme andfollowed it up with a waste Disposal Law to co~ordinate thecollection and reuse of waste materials. In 1974, the BritishGovernment passed a new and enlarged Control of Pollution Billon the same lines and then set up a Waste Management AdvisoryCouncil. The French, in 19?5, introduced a law on wastedisposal and the recovery of materials. Japan has not onlydecided to devote more than two per cent of GNP to the elimination of pollution, but is concentrating more and more on its new"Keep Japan Clean Centre" and latest techniques of wastemanagement and recycling. In the Tenth Five Year Plan for theeconomic and social development of USSR a special section hasbeen introduced with comprehensive measures to protect theenvironment and to use the resources rationally. fibout half ofmore than 356 million Roubles allocated for the purpose goestowards the protection and rational use of water resources.1‘
13. Barbara ward (1979), op. cit., p.63.14. Yusuf J. Ahmed and Frank G. Miller (Eds.), Integrated
Physical. Socio-economic and Environmental Planning, UNEP,Tycoolv International Publishing Ltd., (1982), p.153.

"9"":..:..u:..
Though they lag behind developed countries to a large extent inthis respect, most of the developing countries are presently attheir right earnest in enacting various environmental protectionlaws and adopting resource conservation measures.
International Agencies*°Global concern to environmental issues can also be traced
through the formation of international organizations includingthe Food and Agricultural Organization (1945), the InternationalMeteorological Organization (1951), the United Nations Committeeon the E¥+ects of Radiation (1955), the Inter Governmental Haritime Consultative Organization (1958) and the United NationsEnvironmental Programme (UNEP) (1972). The UNEP was established immediately after the Stockholm Con+erence to impartTactual in¥ormtion for economic development on a sound ecological basis. The concept of ‘ecodevelopment' gained largercurrency through the UNEP. It was further refined andpublicised through the Cocoyoc Declaration of 1974 a¥ter theU.N. sponsored symposium jointly organised by the UNEP and theUNCTAD. The UNEP organised, in collaboration with its regionalcommissions, an important series of seminars in 1979-88 on thealternate resource-use pattern. "The world ConservationStrategy" published in 1988 by the International Union forConservation of Nature (IUCN), UNEP and the World wildlife Fund
15. (i) Richard Q. Carpenter, Balancing Economic and Environmental Objectivee: The Oueetion ie Still How?, East-NestCentre, Honolulu, Hawaii (1981), pp.175-188; (ii) worldBank/August 1978, Environmental Considerations for theInduetriel Development Sector, Washington D.C., pp.12-13.(iii) David Orr and Marvin S. Soroos (1979), UQ.Cit.,pp.5-18.

"rt!‘-3 '1'
is yet to be translated into specific national plans. The focusof this document is on "living-resource conservation" forsustainable development. The world Health Organisation (NHC)established guidelines for ambient air and water qualityconducive to health. The public awareness of the vulnerabilityof ecosystems and the limits to natural resources was increasedcontinuously through the reports of UNEP, the UNESCO, the Manand Biosphere Programme, the IUCN, the Dag Hammerskjold Founda
tion, the Club of Rome and other similar internationalorganizations.
Environmental Impact Assessment (EIA) is a condition forobtaining development grants or loans from the world Bank andthe United States Agency for International Development (USAID).The world Bank now insists on environmental assessment for all
major projects financed through the Office of Environment andHealth Affairs (OEHA). Questions about pollution, erosion,wildlife and health effects are to be answered before sanctioning major projects such as power plants, road construction andlarge dams. The emphasis is on disease, water supply, sanitation and industrial pollution. Besides UNEP, HHO, World Bankand other organizations mentioned above, the InternationalAtomic Energy Agency (IAEA), and the Organization for EuropeanCooperation and Development (OECD) are also engaged in activi~ties relating to environmental protection. All these inter~national agencies are currently associated with environmentalprotection either as their principal function or as an importantpart of their principal missions. The matters considered by
4
_ 24 _
those organizations are usually quite general in nature. Somedegree of international response is also evident in the growingnumber of treaties that directly or indirectly affect theenvironment including the Test Ban of 1953, Prohibition on OceanDumping in 1972 and 1975 as well as agreements to controlpollution in the Baltic and the Mediterranean.1b
Follow-up fictionEnvironmental awareness and the introduction of strict envi
ronmental control measures in some countries have encouraged the
development of eco-technologies, for example, "recycling andlow-waste and non-waste technologies".17 From an environmental point of view such technologies could lead to substantialsavings. In Norway, strict measures to control atmosphericpollution have led to innovation in the production of ferrosilicon which have reduced production costs by 8 to 12 percent. In Sweden changes in the pulp industry from sulphite tosulphate process and recycling of waste water have led toreductions in water consumption, production costs and wastesdischarged.
Despite the leading roles played by developed countries invarious international forums, conferences, committees andorganizations in the field of environmental protection, they areunwilling to share the global resources with developing
16. David Drr and Marvin S. Soroos (1979), op. cit., p.717. Essam El Hinnavi and Manzur Ul-Hague Hashmi (Eds.), (1982),
op. cit.,pp.B-1%.

countries. They all go ahead with plans of appropriating rawmaterials, energy, seabed resources, etc. for more than theirdue share. The developed countries use international forums toexert their economic and political power and to perpetuatetheir neo~imperialist domination over the less developedcountries. It is not surprising to find that the firstmanifestations of concern over global ecological degradationarose in the advanced countries and within the ruling class asthey began to feel the impact of actually and potentiallydecreasing availability of natural resources.13 while moun~ting environmental pressures from popular movements in the westhave resulted in a slowing down of environmental degradationthere, the resource squeeze has led to an intensification ofecological damage in the third world countries. For instance,several recent studies have shown that while depletion of forestcover in the US and Europe has declined sharply in the lastdecade, the very reverse is occuring in the third world.19Similarly, while inshore trawling has been banned in mostwestern countries it is pursued directly or encouraged forexport in the third world.2”
The scientific and technological revolution has brought in anew form of international division of labour. Earlier the‘centre’ or ‘metropolis’ specialised in manufacturing while the‘periphery’ specialised in raw materials. Now the developed
18 Raghunandan D., "Ecology and Consciousness", Economic andPolitical weekly, Vol. XXII, No.13, March 28, 19B?,p.548
19. Ibid29. Ibid

_ 26 _
countries (centres) are transferring some manufacturing units tothe less developed countries on account of environmental regulations and the ban on production and marketing of some of theharmful products in the former.21 For example, there is atrend to locate new capacities of the Japanese aluminiumindustries abroad due to environmental considerations togetherwith the availability of raw materials and cheap electric powerin the host developing countries. Difficulties in findingenvironmentally sound refinery sites have forced the petroleumindustry to look abroad as well, particularly to Indonesia. Inthe USA, a trend is emerging towards the relocation of industries producing asbestoes, mercury, pesticides and otherenvironmentally hazardous substances. For example, asbestoesfactories have been installed in Mexico and Brazil. The plantsin ferrous and non-ferrous metallurgy, primary oil refinery,toxic chemicals, etc. that have been built or are underconstruction in the less developed countries not only enable theimperialist powers to obtain the products produced by cheaplabour, raw material and energy but also to save a lot of moneyon environmental protection by pushing those pollutingentreprises outside their national borders. The people of thedeveloping countries have to shoulder all the after effectsproduced by the operation of such polluting industries.32This new form of imperialist exploitation reveals that the white
21. Details of relocation of hazardous industries in LDCs aregiven in Essam El-Hinnavi and Manzur Ul~Haque Hashmi (Eds.),(1982), o . cit., p.16.
22. Uma Devi S., International Economics, Institute of Corres~pondence Course, Herala University, p.17.

_ 37 _
man has always considered the coloured race lesser humans. Theless developed countries have also to pay a high price fortechnology transfer in terms of payments made to foreignspecialists, etc. The creation of artificial conflicts betweendeveloping countries and then the sale of army and militaryhardware are special features of the present strategy of neocolonialism.
Even the direct environmental programmes of the international organisations are framed with ulterior motives. Forinstance, the afforestations is encouraged with generous worldBank support, provided the trees are eucalyptus for poly-fibreindustry and not fodder or fuel yielding ones. Mono-cultures ofhigh yielding exotics are promoted while concern is expressed atthe depletion of native genetic stocks. Gene banks are maintained in the US and borrowers are discouraged while programmesare initiated covertly or overtly to destroy the nativegenepool. In this age of biological warfare of using food asweapon, control over seeds can even be used as a means ofdestroying a nation's or region's crops and compelling it intosubmission.23 But even without going into this aspect of thequestion, it may be said that economic profits which the seedstrade can bring constitute by itself an important enough motivating force for efforts to be made to manipulate its controland related information.3“ Germ plasm of plant varieties
23 Bharat Dogra, "Genetic Erosion of Plant Health", Yo ana3Dctober 16-31, 1986.
24 Ibid.

-33
are being taken out of the developing countries and later whenthe indegenous varieties have become extinct, these countrieshave to pay for seeds in a commercial purchase. Several thirdworld countries are now discovering to their dismay that thegerm plasm of new extinct plants can be obtained only from thegene banks of the developed countries.25
Similarly, international aiding agencies prescribe thepurchase of equipment, gadgets and the know~how from speci¥iedmultinational corporations or developed countries with theintension of helping them to Tind market for their products inless developed countries. They encourage consumerism which isthe worst and the latest menace to environmental protection andprudential resource use. Rulers of the third world countriesare told that the adoption of development pattern of developedcountries in toto would help to increase income and employmentin their countries and that they shut their eyes against thepolitical and economic domination of the developed countriesover their countries. They are persuaded and i¥ resisted theyare bribed. Not only the political leaders, but manyscientists, bureaucrats and technocrats of most third worldcountries occupying crucial positions have been so muchcorrupted by the high salaries and other carieerist opportunities provided by various organisations of the developedcountries, that it is possible for vested interests to get awaywith amazing acts of manipulations and cheating. The rulingclass o¥ the capitalist system are thus not unaware oi the

......‘;'-1;...
ecological problems, but their response is geographically selectand designed to perpetuate their dominance over the globe.2°
The developed countries, in Tact, behave on a liFe~boatethics according to which they are in the life-boats ofprosperity. They are not only unwilling to stretch a helpinghand to the less developed countries perishing in the vast oceanof poverty, but are also pushing them down when they show signs
of possible or better survival. If the developing countries arerescued from drowning in poverty ~ i.e., if they too adopt therate of resource use, consumption and waste generation ofdeveloped countries - they believe, all are doomed. The samelogic is more or less in a similar manner extended to thenational scene where the minority elites and the well—to-doconsider others as less human having right only to serve theformer. Similarly, it may be observed at the national scenethat the propertied and dominant classes exercising control overthe political and economic domains have ecological awareness o4a kind that relates to their interests in appropriating andprotecting the surplus generated.27
Having reviewed briefly the level of environmentalconsciousness and environmental protection efforts globally, thesame must be examined at the national level.
26. Raghunandan D., "Ecology and Consciousness", Economic andPolitical weekly, March 28, 1987, p.548.
27. Ibid.

CHQPTER - III
ENVIRONMENTAL PROTECTION IN INDIA
During Ancient Times
The ancient concept of ‘pancha bhooda’ (earth, water, fire,space and air) as essential constituents of life might haveevolved as the result of human consciousness on the interrelatationship between the biotic and abiotic things innature.‘ In Vedas, Epics and other works of art and 1itera~ture, there are innumerable examples to illustrate man'srealization of the need to protect the environment. fipprehen~sions on the consequences of irrational approach to nature hadrisen in Vedic times as reflected in the following passage:z
"Let what I dig from theeD Earth, rapidly spring and grow again,D purifier, let me not pierceThrough thy Vitals or thy heart”
35)(Griffith's translation of fidharva Veda, 12:1
The epic event of ‘palazhi madhana’ for ‘amrutha’ and othervaluables from the sea by a prolonged churning of the ‘milkocean’ produces ‘Halakoda visha’, a catastrophic form ofpollution. This depicts the lust for over exploitation ofnature and its after effects. In the ancient days of firyanhistory, Aryans used to worship with simple or complex rites,
1. U.K. Bopalan,"Environmental Consciousness”, Paper presentedat the World Environmental Day Seminar on Development andEnvironment, Cochin, June 5, 1982.
7 Raja Ramanna, Inagural fiddress, at the Environmental DaySeminar, Cochin, June 5, 1982.

Mitra (the sun), Varuna (the god of night or blue sky), Dyn (theday), Prithvi (the earth) and Agni (the fire). All of them areprevedic deities.
Manu, the ancient law giver who prescribed punishment forcutting trees, had pointed out possible salvation for those whohad planted trees. Kautilya’s ‘firthasastra’ (EBB B.C.) recognizes types of superintendents and refers to the protectedforests ‘abhayarnava’ where the wildlife is conserved.Recognizing the importance of the balance of nature as well asthe aesthetic and cultural values, Ashoka (242 B.C.) declaredthat wildlife should be preserved. He insisted that certainspecies of animals, birds, fishes and insects should not bekilled at all. fikbar (1256 A.D.) and other Mughal rulers hadintroduced exotic trees into this country to organize parks,gardens and avenues.3
Dur identification with nature is central to our culture.This can be seen in the so called forms of worship prevailing inthe country elevating mountains, rivers, oceans, wind, trees,and animals to the status of gods and goddesses. Some plantssuch as peepal, tulsi, bergard, oak, dhatara, kamal, etc., arerelated to gods and goddesses and their environment inculcatesmoral, spiritual and aesthetic values in the minds of people.‘
3. U.H. Gopalan, og.cit.4. K.B. Gupta and S.B. Malik, "Environment and its Relation to
Spiritual Education", in the First National EnvironmentalCongress, New Delhi, Dec. 28-33, 1982.
The Chipko Movement
However, the traditionally fostered environmental consciousness in India began to decline with the increase in populationand its congenial problems of food, housing and raw materials.Air, water and land began to be considered something to beconquered and exploited for the benefit of man. The Britishcolonialization was primarily interested in the exploitation ofnature and hence encouraged farmers to encroach upon forest landfor agricultural purposes. As a consequence of their policyvast areas of our forests were cleared and subsequently becamearid. This necessitated the establishment of conservancies, aconscious effort to improve the environment. However, theconservators proved to be inefficient in improving the terres~trial environment even though plantations and such otherprogrammes were initiated. Resources were over~exploited andenvironment denuded by the more powerful in the society.”
One of the glaring events relating to environmentalconsciousness and representing the spirit of ancient traditiontook place in a bisnoi village, Hhejadali near Jodhpur inRajastan, once a luxuriant forest where the desertification isrelentlessly marching ahead at present.“ It was in the year1736 that a noble lady by name ‘Amrithadevi’ who believed thatfelling of trees was against the tenets of her faith stiffly
5. Some of the major India's environmental Problems aredescribed in The State of India's Environment 1984-85: Thefiecond Citizens’ Re ort, Centre for Science and Environment,New Delhi,(19B5).
6. The event given here is described in U.K. Gopalan,(19B2),op.cit.

9'. cl
resisted Jodhpur Maharaja's agents who came to her village tocut down the trees for fuel and wood. Saying that a tree savedat the cost of one’s life is a good bargain, Amrithadevi clungto a tree prepared to be cut down by the wood cutters. She wasmercilessly axed to bits. The news began to spread and thepeople of Hhejadali and neighbouring villages flocked to theplace to protect the trees. In all, 363 people laid down theirlives on that fateful day. This spirit of sacrifice for thenoble cause of environment is reflected in the present ‘ChipkoMovement’ (tree hugging) started in the remote Chamoli Districtof U.P. in 1978. The movement encourages the people of theHimalayan hillsides to hug the trees and dares the contractors’axes to protect a fragile and vitally important ecosystem. Itis the moving spirit of Amrithadevi which is behind the numerousconservation movements and hundreds of voluntary organizationsfunctioning for the protection of national environment indifferent parts of the country at present. There are more than266 non governmental voluntary organizations functioning in thisfield as noted in the Seventh Plan document.7
Environmental Protection in the Constitution
Environmental protection is no longer a controversial issuein India. The Constitution of India has placed as one of theprimary responsibilities of the state, and the duty of everycitizen, the protection of the national environment. Article48% of Part IV of the Constitution which deals with theDirective Principles of State Policy reads:
7. Government of India, Seventh Five Year 1985-96, PlanningCommission, New Delhi, 1985, p~3DB

_ 34 _
"Protection and improvement of environment and safeguardingthe forests and wildlife:- the state shall endeavour to protectand improve the environment and to safeguard the Torests andwildlife of the country".
Similarly, Article 51A of Part IVA deals with Fundamental$Duties. Clause g’ of the article reads:
"It shall be the duty oi every citizen .... to protect andto improve the natural environment including forests, lakes,rivers and wildlife and to have compassion for living creatures”. These laudable articles of the constitution indicatethe importance of protecting the national environment.9
Legislative MeasuresThe overriding concern for ecological security and the
Constitutional directives have provided a strong base forenvironmental protection. There have been several laws enactedfrom time to time which are directly or indirectly related tothe protection of various aspects of the environment. (See theList of Acts in Appendix 3.1)” Among them, the more recentones are the Insecticides Act (1968), wildlife Protection Act(1972), water (Prevention and Control of Pollution) Act (1974),Water (Prevention and Control o+ Pollution) Cess Act (1977),Forest Conservation Act (1988) and the Air (Prevention and
8. From the address delivered by Justice K. Sukumaran (HighCourt of Herala) at the Environmental Day Seminar on June 5,1982, at Cochin.
9. Nag Chaudhari, Introduction to Environmental Hana ement,lnterprint, Naraina, New Delhi,(1983),pp.7~8.
Control of Pollution Act (1981). The Merchant Shipping(Amendment) Act (1982) amends the Merchant Shipping Act (1958)
and aims at protecting the territorial waters oi the countryfrom various kinds of sea pollution. All these legislativeenactments are meant to correct people from abberations. TheEnvironment (Protection) Act, 1986 is the most recent piece oflegislation which is more comprehensive and propose to removelacunae in the earlier Acts. It deals with environmentalprotection by the control and abatement of all kinds pollutionand proposes to prohibit all kinds of environmentally dangerousactivities in the country.
Enforécemnt Bodies
The Government of India established a Central Board for thePrevention and Control of Water Pollution after the enactment oi
the Water Act, 1974. Most of the State Boards came into beingimmediately after. After the passing of the Air Act, 1981,Herala State Board for the Prevention and Control of waterPollution was renamed as the Kerala State Pollution ControlBoard (KSPCB) and assumed the responsibility Tor preventing allkinds of pollution in the state. The basic tasks before theCentral Board and its counterparts in the states are: assessmentand control oi water and air pollution; assessment and controlof coastal pollution; development of professional expertise andtrained manpower, development of cost effective technologies forair and water pollution control and strengthening the institutional R & D support For pollution monitoring and control.1”
18. Government of India, Sixth Five Year Plan 1988~85, PlanningCommission, New Delhi, 1988, pp~343-351.

_ 36 c
The execution of the provisions of various environmental acts isthe responsibility of the concerned ministries at the Centre andthe States. The responsibility for coordinating various enviromental protection activities of different ministries, boards,departments and organizations is placed on the Central Ministerof State for Environmental Protection. The performance ofNational Environmental Engineering and Research Institute(NEERI) with its headquarters at Nagpur and regional centres indifferent parts of the country in the field of pollution monitoring and research has always been commendable. The roleplayed earlier by the National Committee on EnvironmentalPlanning and Co-ordination (NCEPC) and presently by theDepartment of Environment (DDEn) needs special mention in thiscontext.
The NCEPC and DOEn11
The NCEPC was established by the Government of India in 1972
with the major objectives of promoting research in the field ofenvironment and serving as a "think-tank" on environmentalpolicy matters. The research programmes of NCEPC had beenimplemented through the Indian National Man and Biosphere (MAB)
Committee and the Environmental Research Committee (EEC). About120 projects undertaken were spread over 14 major areas including tropical and subtropical forest ecosystems, ecologicalimpact of land use and management, impact of overgr‘zing onecology, water uses and ecological impacts, impact of fertilizers and insecticides on health, conservation of natural and
11. Ibid.

- 37 _
genetic materials etc. Investigations were conducted on thelong term ecological impacts of river valley Schemes in Idukki(fierala) and Beas-sutlej link (Punjab) and fertilizer projectsat Nhava Sheva (Bombay) and Rewas (Maharashtra). Other areas ofinvolvement by NCEPC include EBB TPA"DDT plant at Rasayani(Bombay), Nhava Sheva Port, DNGC‘s offshore drilling platform atNhava, and the Thal Vaishat fertilizer township. Studiesconducted on the environmental .aspects of the proposed linkbetween 81d and New Bombay, the Doon Valley, and the watersheds
of the rivers Sanga and Yamuna are particularly noted. Studieswere also made by NCEPC on the impact of Mathura Refinery on Taj
Mahal, setting up of the Naval Base Training School on theshores of Chilk Lake and establishing biosphere reserves inwestern Ghats spreading over to the States of Herala, Karnatakaand Tamil Nadu.
On the advice of the NCEPC, a National Fellowship Award on
Environmental Science was instituted by the Central Government.The Pitamber Pant Award, named after the first Chairman of NCEPC
is aimed at promoting excellence in environmental research. Asource—book could be brought out with specific information on
matters relating to the environment and a map prepared onimportant wetlands and wildlife in various regions of thecountry. The NCEPC initiated from time to time various programmes to create environmental awareness and to educate peoplethrough formal and informal means.
_ 33 _
In recognition of the need for a fresh and comprehensivelook at the administrative and legislative aspects of environmental protection, the Government of India constituted a "highpowered committee” in 1979 headed by the deputy chairman of thePlanning Commission. According to the recommendations of thecommittee (its report was submitted in September 1986) the DDEnwas established and the 26 member NCEPC was reconstituted and
renamed as the National Committee on Environmental Planning(NCEP) on April 1, 1981 with an extended life of two moreyears. es the area of activities of DDEn increased, there wasoverlapping in the functioning of NCEP and DDEn prompting the
-aGovernment to wind up the former on 31st March 19B3.1* Themain functions of DUEn identified are:—
1. to work as a nodal agency for environmental protection andeconomic development in the country,
2. to carry out environmental appraisal of developmentalprojects through other agencies/ministries as well asdirectly,
to take up the administrative responsibility for pollutionmonitoring and regulation,
4. to conserve critical ecosytstems designated as biospherereserves, and
S. to conserve marine ecosystems
12. Indian Express , fipril 1, 1983.

Other Cooperating figenciesERC and the Indian National MAB Committee have been
consistently co-operating with the activities of NCEP(C) andDDEn from the time of their inception. Earlier NCEP(C) and nowDUEn have been in constant contact with the Planning Commissionfor evolving the mechanism of assessing environmental implications of various development projects. Several other agenciessuch as the University Grants Commission (UGC), the Council forScientific and Industrial Research (CSIR) and the Department ofScience and Technology (DST) have been aiding a number of research projects in different sectors of the economy. Besides,there are hundreds of voluntary agencies, specialized institutions and university centres conducting research. They are inaction for the cause of environment in various parts of thecountry.
Under the bilateral and multilateral environmental program~mes involving joint projects, training, and transfer ofinformation, India has benefited greatly from internationalco~operation. The DDEn is the nodal agency for co-operationwith a number of international organizations such as the UNEP,International Union for Conservation of Nature (IUCN), SouthAsia Cooperative Environment Programme (SACEP) and International
Centre for Integrated Mountain Development (ICIMDD) and alsoparticipates in the environmental programmes of other inter~national bodies such as ESCAP, UHD, ILD, FAD, UNIDD, IPU,UNESCO, and world Bank. India has been a beneficiary oftechnical and financial assistance from those internationalagencies in the field of environmental protection.

_ 49 _
The use of earth observation satellites orbiting geosynchronous for land, atmosphere and ocean application ispraiseworthy.13 Since the launching of Bhaskara I and II,future plans of remote sensing technology for environmentalmonitoring have become highly prospective. One of the mainobjectives of INSAT series of satellites is to conduct studieson national environment. Indian Remote Sensing Satellite (IRS)is an approved project of the Department of space with launchschedule for 19S5~S6.(Schedu1e delayed). The data from IRStogether with foreign satellites (LANDSQT, ERR-I, SPOT, MUS-Ietc.) will be of significant use for application in the areasrelated to the country's environment.
Under the Five Year P1ans14
In India, some aspects of environmental protection havealways been included in the development programmes right fromthe initiation of the Five Year Plans. water supply andsanitation, soil and water conservation, energy, and forestrywere the areas of particular consideration. However, theconcern for the integration of environmental considerations inthe process of planning for development was for the first timeexplicitly articulated in the Fourth Plan. But the idea ofecodevelopment obtained full recognition only in the SixthPlan. Major activities in the area of environment on which work
13. For details, V.R. Rao,"Remote Sensing for Environment Monitoring, Present and Future Opportunities”, paper presentedin the National Environmmental Congress Dec. 28-36, 1982,New Delhi.
14. See details in the Fourth, Fifth, Sixth and Seventh FiveYear Plans.

_ 41 _
has been initiated or stepped up during the Sixth Plan included:water and air pollution monitoring and control, environmentalimpact assessment, natural living resource conservation, specialprojects on wildlife, ecological studies by the Botanical andZoological Surveys of India (BS1 & ZSI), ecodevelopment programmes, environmental reserach promotion, and environmentaleducation, training and awareness. The DDEn was set up at theCentre, and in the States; various instituions and ministrieswere constituted; and important environemtnal laws were enactedduring the period.
Minimum national standards for polluting discharges fromspecified industries were formulated and control measuresimplemented in a progressively stringent manner. A network ofabout 128 monitoring stations to check water pollution has beencreated. Zoning and classification of all the major rivers havebeen completed to provide a basis for water quality management.A river basin—wise inventory for Yamuna and Banga has been prepared to assess pollution load. Q 12~point strategy adopted forwildlife protection and development in October 1983, successfulimplementation of ‘project tiger’ and the establishment of thewildlife Institute of India are particularly noted. Preparatorywork has been done for setting up Biosphere Reserves in a fewcarefully selected and identified areas which have enormouspristine genetic diversities, for example, Nilgiri, Namdapha,Nanda Devi and Uttarkhand. In order to promote environmentalresearch nearly 460 research projects have been sanctioned tothe Universities, R&D institutions and non governmental

z 43 _
agencies. Research relevant to the integrated development ofthe western Ghats, Himalayan region and the Ganga basin has beeninitiated. Dne ‘Centre of Excellence’ has been set up at IISc,Bangalore to conduct studies on western Ghats’ problems.
Q computerized Environmental Information System (ENVIS) witha network of distributed information centres all over thecountry has been started. Q variety of ‘information products’have been prepared including a directory of non governmentalorganizations active in the field of environmental protection.The first National Environmental Congress and the first NationalConference of Legislators on Environment were held as part ofthe awareness building programmes. Various programmes onenvironmental education, training and awareness are launched,workshops conducted, and nationwide celebrations organized onthe World Environment Day (June 5) and during the Wildlife week.
Seventh Plan Proposalslfi
Environmental programmes taken up during the Sixth Five Year
Plan will receive a greater impetus during the Seventh Plan. Amajor programme on the ‘Prevention of Pollution of Ganga’ isundertaken in the Seventh Plan. A Central Banga fiuthroity hasalready been set up under the chairmanship of the PrimeMinister. A special programme is initiated for the control ofhazardous substances used in the country or imported for variousagricultural and industrial purposes. Efforts are under way todevelop ecotechnologies to make cost~effective waste recyclingand to procure useful inputs from effluents and emmissions.
15. Government of India, Seventh Five Year Plan 1985-96,Planning Commission New Delhi, 1985, pp*3B5-394.

- 43 _
Technical Cells for Environmental Assessment will be set up,attached to various ministries and departments. 9 NationalEnvironmental Monitoring Organization (NEMD) is proposed to beset up to synthesize environment-related information from everysector into a supporting framework for environemntal impactassessment. The actual data storage and dissemination would becarried out under the ENVIS. The NEMD would have to use profes
sional ezpertise and infrastructure within the IITs, Universities, the Survevs and other governmental and non governmentalorganizations.
During the Seventh Plan, work would be initiated ontaxonomic investigations and publication of Flora and Fauna ofIndia. The BSI and ZSI will take up joint programmes for theSurvey of Living Resources and Ecological Mapping incollaboration with NRSA and related agencies. The BSI wouldorganize at least four seed banks of Non-Agricultural EconomicPlants, at preset collected from the wild and under threat, asalso, Tissue Banks of Endangered/ Threatened Species of Plants.Those Banks would be backed by All India Co-oridinated Projects(AICPJ on Seed Biology and Tissue Culture with conservationtechniques. The ZSI will take up a major project‘on ButterflyFarming. Preparation of Red Data Books of Threatened/EndangeredPlants and Animlas will be an important programme of the BSI aZSI. works related to identification and inventorization ofLess Known Economic Plants and Animal Species as also SpeciesDriented Ecological Studies and identification of PollutionResistant Plants will receive priority.

-44Eco-task Forces of ex~servicemen will deal with critically
degraded, inaccessible and difficult areas in the country. TheEco-Development Camps will sensitise youngsters on theimportance of environmental conservation. The on~going fiction~Oriented Research & the Development and Extension Programme in
the Himlayan and Western Ghats regions would be extended to theEastern Ghats and Cauvery Basin. The Himalayan Institute of
Environment & _Development will become fully operational. Acentre for Environmental Education at fihmedabad and the one for
Hines’ Environmental Studies at Dhanbad are being set up. TheENVIS’ Documentation Centre will be strengthened to serve as aRegional Documentation Centre for South Asia. Through theInternational information systems such as INFDTERRQ, the Centre
would be linked to the global netwrok of enviromental informa\\/'
tion systems. Q major programme for the publication of environmental status reports, research and policy papers and journalsand news letters for the widespread dissemination of environmental information is envisaged.
For those and many other programmes, the Seventh Planenvisages an outlay of Rs.427.9l crores in the ‘environment andecology’ sector.
Effectiveness of ImplementationIt is necessary to focus upon the role of reasearch agencies
in the country who are the major source of information. Atpresent, the funds for environmental research in our contry aremainly concentrated in the offic¢ial agencies like the pollution

control boards, NEERI, Central Labour Institute, the NationalInstitue for Occupational Health etc. In theory, all theseagencies are autonomous, but their anotonomy is relative. They,supported by grants from the government cannot be expected tobehave differently, especially when the party to be confrontedis also a government undertaking. The ministries of agricultureand industry which are the main supporting bases of pollutingenterprises are more powerful than these boards and agencies andthe ministry of environment. A common complaint about pollutioncontrol practice is the nature of secrecy surrounding therelationship between the regulator and the regu1ated.1° Thepollution control officers believe in ‘family like’ cooperationwith the polluting enterprises since they believe that they canhandle the violator without resorting to confrontation.17
The rules issued under various acts focus on proceduralmatters. For example, the rules associated with the water andair acts illustrate the forms to be filled out by the pollutioncontrol boards for their annual reports, list the fees forparticular pollution tests, and give sample application formsfor concerned orders without describing how to make use of theinformation thus provided.‘° Minimum National Standards(MINAS) for water and air quality relating to industrial
16. Timothy D’Riordan and Ralph C d’Agre, Progess in ResourceManagement and Environmental Planning, John Wiley and Sons,New York, 1979, p~24B.
17. Ibid, p-24218. Susan G. Hadden, "Statutes and Standards for Pollution
Control In India”, Economic and Political Weekly Vol. XXII,No.16, April 18, 1987, p.71@

_ 46 _
operations are more often laid down after a bargaining betweenthe staff of the pollution control boards and the representatives of the industries. This process of fixing standards oftenmakes them unscientific and unfit for fulfilling the objectivesof pollution control. To cite an example, a representative ofthe fertilizer industry succeeded, after more than fifteenmeetings with the board staff, in getting a proposed standard of183 ppm ammonia in effluent raised to 158 ppm by suggesting thatthe industry would really like a standard of 260 ppm.19 Theindustries usually make attempts to win concessions on effluentstandards at the central and state levels and if the authorities
do not ~§EIia, they try to win more time for compliance andremain without compliance for several years. Further, theenforcement of whatever standards are decided upon is inhibitedby a severe lack of resources. Perhaps, in the absence of apolicy guidance on the proper balance between economic growthand environmental protection, those negotiations take place in avacuum and the results cannot be assessed because there is noyardstick against which to measure them.2”
The government simply does not have the machihery to playthe aribitrator in an environmental controversy. The DDEn ishopelessly over burdened and understaffed. Ideally, it shouldhave an officer in each ministry with whom it can liaise.21
19. Ibid23. Ibid.21. Darryl D'Monte , Ismplss or Tombs? Industry versus
Environmsnt: Thrss contraversies, centre for science andEnvironment, New Delhi(l985), p~219

_ 47 _
In the absence of such Coordination each ministry thinks that itis interfering in its affairs, and that environment is a newflanged notion which means‘ everything to everybody and has noclear~cut goals and objectives.22 The DDEn cannot and willnot initiate any enquiry on its own and is content with passingout judgement whenever it is called upon to do so. In thisrespect NCEP was better able to play the role of a watchdog and
2-3enlist the services of outside experts.
Similary, the pollution control boards are hampered by lackof real authority. While it is authorised, for example, tocompel the production of information about the environmentalimpact of any proposed activity, public or private, the board isnot empowered to issue regulations establishing a routinerequirement for the submission of required data. The board'seffectiveness, therefore, is wholly a function of the extent towhich it is able to elicit voluntary cooperation from otheragencies.=4
It should be emphasised at the outset, however, that traditional penal code provisions against creating nuisance, dispos~ing of refuse in a prohibited manner, and the like do not
(
constitute the sort of pollution control system which is
22. Ibid: Also see, Digvijay Sing, The Eco-Vote, Printice Hallof India Private Ltd; New Delhi, 1985, p-47.
23. Darryl D’Monte (1985), oe.cit., p~21924. Colin Macfindrews and Chia Lin Sien, Qevelooinq Economies and
the Environment: The South-Eeet fieian Experience, HcfirawHill International Book Company, Singapore, 1979, p-19

_ 43 _
essential to any genuine environmental management effort.25Society must somehow dispose off unwanted residual products ofdomestic, agricultural and industrial activities. It is thebusiness of the government to find economically feasible ways ofaccommodating this need while ensuring that productive resourcesare not wasted and public health is not jeopardised.2°
Further, it must be remembered that legislative effortscannot be fully confined to environmental agencies, but mustinclude all the offices of the government whose activities bearor might be brought to bear on the implementation of environmental policy.27 A variety of non environmental legislations,if properly used, might be of environmental importance. Forexample, it will be useful to examine the statutory means bywhich the government can create non penal economic incentives tomeet environmental objectives like waiving duty requirement inconnection with the import of pollution control equipment,allowing depreciation_ on capital investments in the developmentof eco~techniques, and encouraging the domestic production ofrelated equipment through approrpirate investment promotionprocess etc.2B
The pattern of resource use and management aspects ofenvironmental protection issues have so far received a low profile in the economic and political affairs of the state. Those
25. Ibid., p.2425. Ibid27 Ibid, pp.3B-3928. Ibid

- 49 _aspects are to be considered in a wider framework of economic
policies pursued by the goiernment. Definitely, economics andecology, and economics and environment are closely interrela~ted. This relationship has to be brought into focus in a studyon environmental protection. There is the need to integrateeconomic development, planning and resource management withenvironmental protection.

CHRPTER - I
ENVIRDNDHICS
Genesis of Environmental Problem
The genetic cause of environmental pollution and resourcedepletion must be located in the violation of the ‘law ofconservation’. according to this law, the resources used by theliving organisms in the ecosystem must return to nature. Someof them reach the environment as wastes through the excreta oforganisms, and the remaining when they die and decay. Similarlythe amount of waste residuals generated in the economic systemfrom the production~consumption processes-is essentially equalin physical weight to the amount of resources entering into theproduction consumption processes over a period of time.‘ Thewastes thus created are then rejected into the environmentalmedia-land, water or air ~ respectively as solid (wastes),liquid (effluents) or gaseous (emissions) wastes. Had the wastegeneration been continued uninhibited, our planet would by nowhave became a huge heap of wastes with all the resourcesexhausted but for the regenerative capacity of the earth.
The Regenerative Capacity of Earth
The regenerative capacity of the earth refers to the wasteassimilating activity of the environment. The waste~assimilation and then the regeneration into useful inputs take placethrough certain natural mechanisms inherent in the environmentduring ‘material circulation’ and ‘energy flow’. Economicsystem being the part of a larger ecosystem the basic flows in
1. Seneca and Taussig, Environmental Economics, Prentice HallInc., New Jersy, 1979, p.76.

nature~ material circulation and energy flow - are common toboth the systems.” In both systems, material flow is circularand energy flow is unidirectional.
The material inputs flow in a circle during which they aretransformed into outputs and wastes which are again convertedinto useful inputs and that circulation continues. The bacteriaand the organisms like blue-green algae, lichen etc., capable ofconverting the solid wastes into use¥u1 inputs are known asdegrader populations. Those degrader populations are theprincipal agents in the environment enabling it to act as the‘waste assimilator’. The highly specialised bacteria present inthe ecosystem are able to "fix" the nitrogen present in theatmosphere and convert it into nitrogeneous compounds essentialfor the survival o¥ living species. Once fixed in this way andused by plants and animals, denitrifying bacteria then releasethe nitrogen back into the atmosphere. This circular flow ofnitrogen through an ecosystem is only an example of a bio~chemical cycle. Others equally as vital occur for sulphur,carbon and so on.‘ The substitution of carbondioxide foroxygen during photosynthesis is only one of the environmentalmechanisms regenerating gaseous pollutants. Similarly, duringhydrologic cycle the liquid wastes get purified. These are onlysome of the instances of numerous ways and means known to usthrough which the regenerative capacity of the earth ismani¥ested. It may be noted that in economic systems a part of
2. D.N. Pearce, Environmental Economics, Longman, London , 1976,p.38.
Ibid, p.34.

the wastes may be recycled during production and consumptionbeiore allowing nature's regenerative capacity to becomeoperative.
as said earlier, energy Tlow is unidirectional. Energy onceused is not re~usable and is released as waste~heat and noise.But continued supply o4 energy is ensured as sun is the ultimateand infinite source of energy. In ecosystems solar energy istapped by plants and converted into glucose through photosynthesis. Some of this glucose in turn is used up by plantsduring the process o¥ respiration as the plants grow. Theplants or the primary producers, as they are called, become food{or the next category oi living beings, herbiyores,who again arefood for the next category, carniyores,including man in the‘food chain’. The energy thus {lows Trom primary producers toother living things, but this Ilow is never completed in acircle back to the primary producers. In economic systems,apart from this energy ‘inventoried solar energy’ such as coal,oil, gas, etc. are also sources oi energy as long as theirsupply exists. In any case energy once used is 1Dt reusable.
The Declining Assimilatiye Capacity of the Environment
Just as the environment can assimilate the wastes generatedin the system, the receptors oi wastes like plants and animalscan asbsorb a considerable amount oi it. "Q positive correla~tion with their adaptive organs ~ sematal structure of fossilplants (Laurophyllum bournse), sunken stoma oi Indian Tossilplants (Nipaneophyllus), aricular hair of grasses, passage of

higher animals, structure of nose and nasal channel of hair andnasal angle of man - and intensive selection pressure ofpollutants has been established.”4 But the environment asthe assimilator, and organisms, plants and animals as receptorsof wastes have limited capacity to withstand the wastesgenerated. The biodegrader populations and various purifyingmechanisms in the environmental media can remove only a limitedquantity of wastes. They have their natural limits. Similarlyit is important to note that the receptors of wastes have somedefinite threshold limit. For instance, "mammalian lungs canclear themselves of a surprising amount of debris; butgradually the ability to do so is cumulatively choked by thepersistant intake of ash, soot, and acid; and at some degree ofaccumulation the self cleansing powers are exhausted."5 Inother words, the regenerative capacity of the earth is limitedby the amount of wastes generated which should not exceed theassimilative capacity of the environment. In fact, the problem
of environmental pollution arises because "we are overburdeningthe environment through our activities by adding wastes intoair, water and land media in such quantities as to render theresources unsuitable for specific or established uses."“ Therate of waste generation exceeding nature’s regneration ratecauses a further decline in the assimilative capacity of theenvironment. This is because,
4. T.M. Das,"Programm§ of Environmental Scieggef, Paperpresented in the First National Environmental Congress, NewDelhi, Dec. 28~3@, 1982
5. Ibid.6. world Bank, Environmental Consideration for the Industrial
Development Sector, Nashington D.B., august 1??B, p.1.

1. the existing degrader population become less in number andother purifying mechanisms become incapable relative to theincreased wastes added to the environment;
2. the assimilative capacity of the existing degrader pouplations gets reduced and the regenerating mechanisms getexhausted; and
3. some of the existing degrader populations are chocked anddestroyed and purifying mechanisms disrupted due to theexcess of wastes.
There is, therefore, the need for practising moderation in theuse of resources and waste creation. If the level of output isnot adjusted in the economy, the level of assimilative capacityof environment will be shifted further downwards.
The Economic Problem
Various types of wastes discharged into the environment areeither non~biodegradable or biodegradable. The non-biodegradable wastes are not amenable to biological decomposition and thedegrader populations present in the environment cannot degradeand regenerate them into useful inputs. The biodegradablewastes have just the opposite features. Nevertheless, allsorts of pollutants have biological and/or economic impactsparticularly when the amount of wastes exceeds the assimilativecapacity of the environment. The problem is economic only whenthe act of pollution involves economic effects in the form of

_ 55
external costs. External costs are unintended costs passed onto the society through polluting activities. In other words,the physical or biological pollution unaccompanied by economiceffects may not give economic dimension to the problem. Theamount of wastes surpassing ‘the assimilative capacity of theenvironment is the necessary condition of the economic problemof pollution, but not the sufficient condition. The aversionfor the wastes and people's willingness to pay towards the costof alleviating the problem constitute the sufficient condition.The necessary condition being fulfilled, the sufficient oneoften follows eventually.
Besides waste-generation and environmental pollution withevery increase in population and production-consumption activities accompanied by economic growth, there arises the problemof resource depletion. Adopting everywhere the resource userate of a handful of developed countries, most of the renewableresources would become extinct and non-renewable resourcesbecome exhausted in the near future. For instance, if theentire world consumed at the U.S. rate of EB barrels per personper year, the global petroleum reserves would be exhausted infive years.’ Similarly, in 1975 every adult and child in theU.S. consumed 48,036 pounds of mineral matter alone quite apartfrom agricultural products and water.” In fact,the root causeof poverty in less developed countries must be traced not asmuch in population growth as in the cornering of a major shareof world's resources by the Nest. Their poverty is caused at
7. Darryl D’ Monte (1985), og.cit p.?8. Ibid

least in part by the economic domination of the rich countriesand continues to be overtly or covertly, under neo~imperialisticpolicies. No doubt, there is resource depletion with everyincrease in population, but the best contraceptive is development with a reordering of priorities accounting for intragenerational and intergenerational equity. Economic and socialjustice too demand that the global resources be reallocated andwealth and income redistributed between individuals/communities/
countries and that the same be allowed between generations tomaintain the "maximum sustainable yield” of the earth'sresource-base on a continuous basis.
Environomics
Environment defined as ‘a complex web of nature and therelatedness of its various components and structures’? is thesubject extensively treated in the science of ecology. Therelationship between ecology and economics has to be consideredin a study of environmental economics or environomics. Boththese disciplines have the same Greek root oikos meaning ‘house’or ‘household’. The household in ecology is the society of allliving beings. In economics the household is the society ofhumans. The Greek nemein in economics means ‘to manage’ and
logos in ecology refers to ‘science’. The management of societyfor the enhanced welfare of human beings with respect to theirwealth creating and wealth consuming activities is the subjectmatter o+ economics. The well~being of all living organisms intheir environment is the main theme in the science of
r
9. Kurt Dopfer, Economics in the Future, The Mac Millian PressLtd., Lodon, 1976, p.9.

ecology1° which makes an economic system the part of alarger ecostystem, and man only one of the species in theecosystem. This new branch, ‘environomics’ is based on thistruthful dictum and condemns all activities in human societywhich violate the natural laws governing the well-being of allcreatures in the universe. when man is engaged in activitiesfor enhancing his prosperity, in total disregard for theecosystem and environment, the net impact, in the long-run willboomerang against his own welfare.
Earth has in the past been commonly.considered as a bottomless reservoir of resources and mankind has so far worked out a
‘cow~boy economy involving a reckless exploitation of resourcesrather than a space-ship economy’ effecting the preservationand optimal utilization of limited resources. In a cow~boyeconomy success is measured in terms of the amount of produc~tion. But in a space~ship economy the criterion for success isthe maintenance in good order of the existing capital stocks ~earth's inhabitants and the life support system. In a spaceship economy, the ‘economics of scarcity’ is followed under~lying the principle, "to conserve, to maintain and to use anduse again"11 the natural resources. Most of the prevailingconcepts and theories of economics put into practice often leadto the squandering of resources. Revision in a number ofconcepts of long established acceptance is required. For
1%. Eugene Ddum, Fundamentals of Ecology, N.B. Saunders,Philadelphia, 1971, p.3.
11. fillen Cottrel, Environmental Economics, Edward ArnoldPublications Ltd., London, 1973, p.B.

example, ‘development’ needs to be redefined as an era ofscarcity; ‘conflict’ and ‘peace’ should be interpreted morebroadly to take into account the impact of present generationson the welfare of future generations; definitions of ‘crisis’and ‘catastrophe’ normally applied to social interactions needto be supplemented with the idea of man/nature interactions; andnew ideas of ‘dependence’ and ‘interdependence’ are needed todescribe relations on the planet where resources are unevenlydistributed.13 Like-wise most of the general economictheories need recasting in the new mould of spaceship economy.
For instance, until recently most of the economists consi~dered the concept of ‘externalities’ as an interesting intellectual footnote to the main body of economics. The externaldiseconomies or social costs of production~consumption processesby way of pollution incurred on society were not included intheir cost analyses. They believed that the equality ofmarginal cost and price (NC = P) under perfect competition wasthe ideal condition for optimal allocation of resources andoptimal production ensuring Fareto’s optimum welfare foreverybody. But when social marginal costs are added to MC, thetotal marginal cost price equality (THC=P) can be obtained onlyat a lower level of optimum production for a firm, and at higherprice and lower production in the case of industry. Under noncompetititve conditions like monopoly TMC=P is obtained at muchlower level of production and at much higher price than the case
12. David N.Urr and Marvin Soroos, The Global Predicament:Ecological Perspectives on World Order, The University ofNorth Carolina Press, U.S.fi., 1979, pp.9~1B.
may be under perfect competition. Here, one can observe thatnot only monopoly, but also the neglect of social costs makethe market economy unsuitable for optimum allocation ofresources and optimum production.
Similarly, environmental resources are considered as commonproperty shared by everyone but not cared for by anybody. Itis often held that if private property rights would be grantedto them, their possession by individuals would have preventedmost oi the environmental problems. But as Seneca and Taussinghave pointed out the appropriate social response to the commonproperty resource problem is not to convert common propertyinto private property.‘3 Considerations of justice andincome distribution demand that environmental resources andtheir services be transformed into public property or publicgoods. Moreover, ideally,the government is more suited to ownthe resources oi nature to provide socially optimal level ofresource use and environmental quality through various controlmeasures implying drastic changes in the politico-economicsystems in that ‘eventuality. In the same way, many moreinstances in the general framework of economic theories can bepointed out as demanding redefinition. Environmental economicsis a new branch in economics attempting to rede+ine economicsin the environmental context.
Environmental economics, for brevity, may be denoted as

_ 6B _
‘environomics’ which deals with the different economic aspectsof conservation of resources and the protection of qualityenvironment aimed at enhancing the quality of life and thewell~being of mankind. The quality of human life greatlydepends on environmental quality which ensures the well~being ofall 1ife~forms. Environmics is the economics of scarcity basedon the principle to maintain in good order the earthlyecosystem, its inhabitants, and their life-support systems.Different aspects of environmental quality such as pure air,fresh and clean water and uncontaminated land resources are all
economic goods or, in other words, they are items of scarcity.If any of those environmental resources is used for a particularpurpose and contaminated at any locality, that resource then isnot available for any other use. This involves a choice thathas to be made between alternative uses of environmentalresources. Environomics is also the study of society's choicesin the intertemporal allocation of resources. Intertemporal orintergenerational allocation of resources refers to deciding howmuch of the existing stock of resources should be designed fornow and how much should be left ‘in situ’ for the future.14Besides, this branch also deals with intratemporal or intragenerational equity in resource allocation and distribution ofincome and wealth. Since this new branch studies environmental
damages, protection and conservation as economic problems, itdraws sources from nearly all areas of specialization withineconomics as well as contributions from different intellectual
14. John A.Butlin (Ed.), Economics and Resources Policy,Longman, London, 1981, p.31.

-61disciplines.15 "Since environment with its components ofliving and non~living resources represents the most fundamentalbuilding blocks for national development and social well~being,environmental considerations should form an important element inthe criteria for setting developmental targets and assessingplan performance in all sectors. Further, environmental management should be integral to all development activities."1°
Ecodevelopment and Environomic Planning
Ecodevelopment means economic growth for enhanced human wel
fare in a protected environment. To advocate growth without anyregard for environment is madness just as to forsake economicgrowth for the cause of environment is unreasonable. Continuedeconomic growth is possible even if ecologically dangerousactivities are prohibited. In ecodevelopment, economic as wellas ecological- factors get equal consideration. Consequently aneffective ecodevelopment policy results in greater productionand quality environment. From the environmental point of viewdevelopment should be regarded as synonymous with improvement in
environmental quality, as both improve the quality of living.
Economic progress demands resources of the environment.when the environment is altered in our favour we have ecodeve
lopment and when such alteration results in upsetting the
15. Savage et.al., Economics of Environmental Improvement,Hugton Hiflin Company, Boston, 1974, p.4; Also see, Seneca &Taussing (1979), og.cit, p.6.
16. Government of India , Seventh Five Year Plan 1985-98.Planning Commission, New Delhi, 1985,p.3B7.

ecological balance we have environmental deterioration. Onecrucial characteristic of ecodevelopment is a beneficialalteration of environmental resources. The other importantcharacteristic of ecodevelopment is increased access of commonman to vital resources. These two characteristics have to gohand in hand.17 Further ecodevelopment does not follow anystage theories of growth ‘which visualise development in termsof uniform sequence of stages in different countries and ignorethe diversity of natural environments in which growth occurs,andthe diversity of adaptation that it induces.1”
when a vast majority of world population is living in utterpoverty and destitution the proposal for zero economic growthcanot be recommended. Advocating for the adoption of zeroeconomic growth even in rich countries may result in reducingtheir demand for import from less developed countries and theavailability of foreign capital funds for the development ofpoorer countries. Therefore raising the standard of living inless developed countries must come from the growth of totalworld output so that the developed and the developing countriesachieve economic advancement simultaneously. Moreover, it wouldbe easier to meet the demand for redistributive justice globallythrough economic growth everywhere since no one’s income has to
17. M.Taghi Farver,"The Interaction of Ecological and SocalSystems", in William H. Mathews (Ed.), Outer Limits andHuman Needs, The Dag Hummarskjold Foundation, Uppasala,1976, p.67.
18. Ashok. S. Ouha, fin Evolutionary View of Economic Growth,Oxford University Press, New York, 1981, p.17.

c 63 _be reduced in order to increase the income of others.19 AsJohn Q Butlin has pointed out, though quality of environment isa luxury which the rich can well afford, development is anecessity which the poor cannot do without.2°
The interaction o¥ man with nature requires proper directionto avoid the spill*over and over exploitation oi natural resources. Activities leit to individuals to meet their interests‘often do not reconcile. The reconciliation in this sphere canbe brought about only by the state. For this the state shouldengage herself in environomic planning. Environomic planningmay be defined as the planning process adopted by a country withthe objectives oi enhancing her citizens well~being andimproving and protecting the quality of environment on whichhuman well-being depends. It is a kind of intergrated planningcomprising ,the economic, social, technological, physical andsuch other aspects of improving the quality of li¥e. Thoroughlyworked out environmic planning programmes enable to maintain theecosystem and economic system in balance, to control environ~mental pollution and resource utilization, to provide the basicphysical and social needs oi human development and to promoteeconomic growth with equitable distribution of income and wealth— all of them are the requisites for ecodevelopment.
19. Edward Shapiro, flgcroeconomic final sis,(3rd Edn.),HocurtBrarcea Invsnoich Inc., New York, 1974, p.375.
2m. John A Butlin,(19B1),o .cit. p.28

Environmental Management
Environmental management, a term encompassing environmental
planning, protection, monitoring, assessment, research, educa~tion, conservation and sustainable use oi resources,is nowaccepted as a guiding factor ior national development.21 Themain objective of environmental management is to minimize theimpact of man’s activities on the physical and biologicalenvironment through a perspective of the ecosystem.22 Theadoption of effective environmental management policies andprogrammes makes continuous growth possible by restrainingecologically dangerous activities and through optimal utiliz~ation of resources. Since technology has brought fastereconomic growth and environmental problems along with it, manypeople maintain a hostile attitude towards advanced technology.But we require a technology iar superior to the one whichcreated ithe problems. Technology yet, is not developed enoughto abate and control the hazardous impacts oi radio~activewastes, insecticides, pesticides and many other toxic chemi~cals. Besides, ‘ecotechniques’ must be developed in future tocreate output with less scarce resource embodiment. Moreover,ekhaustible and renewable resources augmenting technologicalprogress enable per capita consumption oi natural resources to
Femai” CD”5t3”t'33 Meanwhile there is need {or layingodown
21. Government of India Seventh Five Year Plan 19B5~9B. PlanningCommission, New Delhi,19B5,p.385.
22. Yusuf J. Ahmad and Frank G. Muller (Eds.), IntegratedEhysical, Socio-economic and Environmegtgl Planning,Published for UNEP by Tycooly International Publishing Ltd.,Dublin, 1982, p.17.
23. U.Herry Smith, ggarcity and Growth Reconsidered: Resources{or the Future, The John Hopkins University Press, Baltimoreand London, l9??, p.43.

appropriate criteria and standards on pollutants emitted fromindustrial production and processing. The volume of pollutantsin the wastes, emissions and effluents should not exceed theprescribed standards and criteria. fippropriate legal measuresare to be adopted and implemented to arrest the criminalirresponsibility of the polluters for causing environmentaldamages. The environmental monitoring agencies may keep a
constant vigil on the fall—out of various economic activities ona continuous basis and initiate appropriate legal measuresagainst defaulters. Various social pressure groups and nongovernmental organizations (NGD) engaged in environmentalprotection activities are to be promoted and their demandsconceded. Measures are to be initiated to create environmentalawareness and to impart environmental education to the masses.Environmental education must be made an essential part of theacademic curriculum starting at school level to continue throughout higher learning.
fl very strict adherence to the standards and criteria in thebeginning might obstruct industrialization and economic growthin underdeveloped countries. what is advisable then would be theapplication of ‘best practicable means’ (bpm), according towhich preventive measures adofied are made progressivelystringent as technology advances and the economy develops. Asystem of accounting social costs (i.e., costs to the societydue to environmental damages, etc.) in the actual cost~pricecalculations of the producers must be adopted. They may begiven incentives bv the environmental law enforcing bodies and

_ 66 c
the governments to comply themselves with the laws framed forthe purpose. The recycling of wastes would help to withhold thewastes from entering the environmental media as long as possibleand to increase the regenerating capacity of the environment.Through recycling useful inputs are isolated from wastes Forfurther production-consumption purposes and the remainingresidues are further crushed to make themselves amenable todegeneration by the degrader populations. Q benefit~costestimation and analysis may be made before setting up everydevelopmental enterprise in order to strike a happy balancebetween the objectives of economic development and environmental
protection. Understanding at international levels must bereached under appropriate forums, and guidelines evolved on therational utilization o$ several renewable and non-renewableresources on a global basis. This is vital for the optimum useo+ resources that maintains nature's ‘maximum sustainableyield’. The issue of international disarmament is also releventhere. It is not merely that nuclear, chemical and biologicalweapons of war would, if used,represent the ultimate pollutionof environment, but the very production of armaments makes aheavy demand on materials and environmental resources.24 Ifthe vast resources used in the development of weapons aredirected to the cause of environment and economic developmentthere would be tremendous increase in the welfare o¥ the human
race. Adhering to these major guidelines, environmentalmanagement achieves economic development and prosperity withoutobstructing ecological balance.
24. John Q Butlin (1981), og.cit, p.29.

CHAPTER - 1COST ESTIMATION OF ENVIRONMENTAL PROTECTION
Environmental amenities like pollution~free air, fresh andpure water etc., are no more free goods. Society has to pay forsuch amenities in terms of economic or social costs. Economiccosts due to environmental pollution impacts on the society aregenerally measurable in terms of money, but social costs arenot. But both are real costs. We all know that every Form ofhuman activity causes some ¥orm' of contamination of theenvironment. But the problem attracts the economist only whensome cost is involved andfor when the people a¥¥ected arewilling to pay for environmental protection. But there areseveral di¥¥iculties in estimating the cost of environmentalprotection. This is owing to the involvement of both tangibleand intangible factors. Many o¥ the costs are not Tullyquantifiable. For instance, how can one estimate the cost ofdeteriorating health of the people in a locality caused by theradioactive wastes let out from a nearby factory? Or, how canone estimate the costs implied in the mental tension andpsychological depression of a person working under conditions ofsound o¥ very high decibels? fittempts to estimate the healthefiects of pollution by adding the medical bills and value ofthe production loss due to illness, will not give the truepicture. This is because some of the affected might be ill dueto genetic and hereditary reasons and also due to pollution.Thus an estimate of costs on account of pollution alone may beextremely difficult, if not impossible.

_ 68 _
The costs of environmental protection can be widelyclassified into two categories, viz.
1. direct costs and2. indirect costs.The direct costs are those incurred on account o¥ the
after-effects of polluting activities, whereas, indirect costsare the spill—over costs on the economy when the protectionmeasures are implemented.
Direct Costs of Environmental Protection
There are five broad categories of direct costs as givenbelow.‘ A briei explanation of each o4 the categories isnecessary to reveal the nature of the direct costs ofenvironmental protection.
1. The Pollution Damage Costs2. The Damage Avoidance Costs3. The Pollution Control and Abatement Costs
4. The Pollution Prevention Costs, and5. The Transaction Costs.
Pollution Damage Costs
They are costs due to damages already caused by pollutionsuch as blighted crops, ill~health, corrosion of materials andstructures etc. The blighted or damaged crops would mean loss
1. Descriptions o4 some of the direct costs may be referred toin:(i) Norld Bank/August, 1978, Environmental Considerations
{or the Induetriel Development Sector, Washington“D.C., 1978, pp.é9-BB.
(ii) Seneca and Taussig, Environmental Economice, PrenticeHall Inc., New Jersy, 1979, pp.11-16.

c 59 _
of income to farmers and higher food prices to consumers. Thismay result in the shortage of foodstuffs and raw materialswhich may have adverse impacts on the external balance ofpayments of a country. The pollution-caused illness may erodeproductivity, reduce workers earnings and raise the costs ofmedical care for all. The health-effects of pollution ondomestic animals are manifested by reduced longivity, increaseddeath rate, decreased productivity and yield. In the case ofwild animals this can lead to the extinction of species and thedepletion of forests. This, in turn, may cause serious andhazardous ecological changes. The accelerated deterioration ofproperty owing to pollution increases the maintenance andcleaning costs. For example, air pollution may cause paints topeel and thus to impose additional painting costs on the ownersof commercial and residential structures. Pollution of theatmosphere is likely to increase everybody’s cleaning bills aseverybody attempts to maintain standards of cleanlinessestablished in a less polluted age. Even the value of landedproperty may decrease in a heavily—po1luted area.
But much of the costs implied in a variety of damages arenot quantifiable at all. Such costs cannot be by any meansfully compensated, nor the damages completely repaired. Inmany instances we will never know how much welfare damages have
been caused by pollution and how many people are willing torestore quality environment. filso we cannot measure the entirewelfare damages the same way as we can measure damage avoidanceand pollution-prevention costs.

-- 3:55 -_
Damage Avoidance Costs
when the damages have already been created by the pollutingactivities, they are required to be repaired or avoided to themaximum possible extent by incurring private or public expendi~ture. Private expenditure usually takes the form of monetaryor non-monetary compensation paid to the people a{fected by thepolluting activities in the private sector. Money paymentsmade {or the medical treatment, employment given to the heirsof the deceased etc., would come under this type of costs. Thepublic expenditure takes the ¥orm of various types of clean~upprogrammes, compensation for damages to society, importing ofunpolluted drinking water ¥rom a nearby or a faraway place,resettling oi the people of the affected locality to apollution~free area etc. On failure of individuals or thegovernment to accept such costs,society can choose to avoid thedamages by undertaking some defensive or remedial actions. Thepeople of the af¥ected area may sell off their property andshi¥t their residence to a pollution~free area or make ¥requentvacations away from such areas. All those and similar costsincurred on pollution damage avoidance are grouped under thiscategory.
Pollution Control and Abatement Costs
Immediate prohibition of environmental pollution resultingfrom economic activities like production and consumption is animpossible and highly impracticable proposition. Moreover, ourtechnology has not been developed to that extent so as tocombat with some of the pollutants to result in zero toxicity.

_ 71 m
There¥ore, the best practicable means (bpm) suggest thatmeasures be adopted and devices be installed to control and toreduce the intensity of pollution to the possible minimumlevels without retarding production and economic growth. Asand when the technology advances, gradual reduction of pollution mav be possible for the achievement of the desired aim ofno pollution at the end. Till then we cannot wait doingnothing to solve the present problem.
The control and abatement costs of environmental protectionare the costs of resources devoted to reducing the amount o¥pollution. The costs incurred ¥or air pollution removal byadsorption, absorption, scrubbing, sedimentation etc.; forwaste water treatment by chemical coagulation, precipitation,carbon adsorption, reverse osmosis and lagooning; and for thesolid wastes treatment and disposal bv sanitary land fill,leachate control, grinding, and incineration are examples ofsuch costs.” Installations of such devices aim at reaching adesired level o¥ pollution intensity suggested by experts orreaching a safety standard specified by a law~enforcingauthority. The pollution control and abatement costs may alsoinclude the costs o4 adverse effects o4 environmentalprotection (indirect costs) on economic growth, employment andproduction.
2. Various pollution control and abatement methods arediscussed in world Bank/August, 1978, o .cit., pp;36-68.

Pollution Prevention Costs
This category of costs include all those incurred for thepurpose of executing the non~pollution policy. The costsincurred by any private or public agency to prohibit and toprevent pollution‘in toto’at the source are included in thistype of costs. For instance, the costs incurred by a localgovernment to treat fully its sewage before dumping it into ariver are pollution prevention costs. Expenditures ¥orinstalling air filteration system to contain fully the airpollutants from a particular process is another example o+ thistype of costs.
It may be noted here that we lack the technical know~how toprevent certain kinds of pollution. For example, the wastes,having long lasting adverse impacts on organisms, such asradioactive and nuclear wastes, pesticides etc., are beyond thereach of the known technology. The prevention of activitiesresulting in such wastes implies costs which are equal to theproducts foregone. Similarly, in some other cases we have theknow~how to prevent pollution. But the costs involved are sohigh that no agency ~ private or public - can a¥¥ord to bearthe costs of the required installations. An example of suchcases is the prevention of thermal pollution which is a form ofwater pollution caused by heat. Ne have the technology toprevent thermal pollution. But as Peter F.Drucker points out:"the heat produced while generating electricity might be used
3. Peter F. Drucker, Toward Next Economics and Dther Essa s,Allied Publishers Pvt. Ltd., New Delhi, 1981, p.28.

- 73 cin greenhouse and fishfarming or to punch ‘heat holes’ into alayer of cold air over such places as Los Angeles creating anupdraft to draw off smog. But they are long range projects.The increased costs are here and now“.3 However, theultimate target of any policy measure adopted for environ~mental protection is the total prevention of environmentalpollution.
Transaction Costs
They are the costs of the resources used in the research,planning, administration and monitoring for the control ofpollution. It is necessary to find out the extent of pollutionof the air, water and land resources before taking up measuresto control them. 9 body of experts from dif¥erent disciplinesis required to be appointed to conduct the monitoring work withrespect to specific projects in a locality, a state or thecountry. Much research studies including laboratory and in~field~outdoor experiments are to be made be¥ore establishingaccurately the extent of their contaminating impacts on theliving and the non~living. Considerable expenditure isinvolved in monitoring and research by way of the costs oflaboratory and other equipment. Payments as salary to theexperts and their assistants and for extensive travel fromplace to place to determine the spatial spread of pollution andits impacts etc., are the types of costs included in thecategory of transaction costs. The process of monitoring andresearch involves not just hit and run type of costs, but mustconstantly be incurred for ever~further research and

..... .....
investigation. Once the saiety standards o¥ pollution levelsare ¥ixed (¥or example, those o¥ the Indian StandardsInstitute~ ISI) laws are to be enacted and implemented and aset of machinery ¥or law enactment, adjudication and executionetc., is to be created. All oi them involve considerablecosts. Many a time, the polluters can be prompted to con¥ineto the standards only through legal measures for which lot ofadministrative expenses are implied. It is required that ahigh powered law~enforcing body for every locality, region andstate be established and made functional on a permanent basis.Since a happy trade~o+¥ between the objectives of rapideconomic growth and environmental protection is required allalong, it is necessary that an integrated economic planningcomprising an environmental planning be adopted. -The costestimate oi environmental planning need not be separately madeas there may be difficulties in doing so.
For the success of all these and similar measures, it isimperative that an awareness of the problem be created amongthe public, so that they can be always alert and become thecustodians of quality environment. Since we had neglected theenvironment ¥or so long in the past, the existing educationalsystem, social and ethical values etc., should be changed toadapt themseleves to the quality aspects of li¥e that can beenhanced through the protection of environment. An appropriateeducational curriculum involves considerable costs. For allthese purposes it is inevitable that a constant flow ofexpenditure be allowed to safeguard environment from

contamination and to effect control over the pollution alreadycaused.
Indirect Costs of Environmental Protection
environmental
categories ofare
the
mental
possibility ofeither
explanation ofrequiredadopted
environmental
People are now more aware of the adverse impacts oipollution on the economy and the variousdirect costs involved. But it seems that they
not as much bothered about the economic reprecussions orspillover costs resulting Trom the execution of environ
protection measures. Even when they know about thesuch adverse impacts and the indirect costs,
they ignore them or overlook and bypass them. Q briefeach of the main types oi indirect costs is
to evaluate the success of various protection measuresfor solving the problem. The indirect costs of
protection occur on account of:41. the impacts on consumption and production2. the impacts on employment
the impacts on capital supply4. the impacts on the fiscal and economic bases of
municipal and regional governments; and
5. the impacts on international trade and thebalance o4 payments etc.
details see: (i) Ismail Shariff,"Economic RepercussionsLimitations of Pollution“,(ii) Martin Pfaff,"Inter
Transfer Through Environmental Policy", in Hishra,Natraj (Eds,). Eegional Planning and National
Vikas Publishing House Ltd., New Delhi, 1978Also see, (iii) Eaumol and Dates, Economics,Policy and Quality o+ Life; Prentice Hall
pp.174-196
ForandRegionalUrs andDevelopment.pp.29B—314,EnvironmentalInc., N.J. 1979,

_ 76
Impacts on Consumption and Production
The implementation of pollution control measures is likelyto increase the cost of production of the polluting industries. This cost can be passed on to the consumers in the formof higher prices of the products. But the increase in pricemay cause substantial decrease in demand and production, depending upon the elasticities of demand and supply. The tastesand preferences of the consumers may be shifted in favour ofthe products of the non~polluting firms, because their pricesdo not change on account of pollution control. This rearrange~ment of the purchase of products will affect the structure ofproduction and employment. The production of the pollutingfirms will be considerably decreased, if not stopped. In theevent of closefdown, the resources engaged in the productionprocess will lie idle till the factors thus unemployed can befruitfully shifted to other firms. Thus the adoption of thepollution control measures can affect the structure ofproduction both in the polluting and non-polluting firmsleading to an imbalance in the demand and supply of resourcesand to a shift of resources from one use to another. Theincrease in costs and decrease in demand and production lead toserious ramifications throughout the regional economy. Itsconsequences mav also be felt outside the region. The changesin the interregional and intraregional structure of consumptionand production must be considered when environmental protection
measures are adopted and implemented at regional levels.

Impact on Employment
The adoption of environmental protection measures leads toa shifting of resources from one industry to another. It alsohas important consequences in the factor markets, especially inthose of capital and labour. Both high salaried and lowsalaried workers may find their jobs threatened. Fear ofunemployment and loss of income seem to be felt more heavilyamong lower income groups. when environmental interests haltor slow down the construction of a refinery or an airport, theprotests against the lost jobs usually come from blue collarworkers or the jobless. A worker who has lost a job in apolluting industry need only remain unemployed for as long as aperiod as it takes to find a job in another industry. But eventhe temporary unemployment can have serious financial andpsycholgocial effects on a family, particularly, if it haslittle accumulated savings. Moreover, by the very nature ofindustrial activity, changing of one job from another overnightis nearly impossible. It is because such changes cannotgenerally be accomplished without a programme of retraining.
Impacts on Capital Supply
The capital supply is a prerequisite for regional development. Nhen the cost of production increases and the profitdecreases the capital may move from polluting industries tonon~po1luting ones. The shareholders may not be ready forsharing the added costs on account of environmental protec~tion. Further, when the existing productive capital has to bewritten off faster to give way for environmentally favourable

W 73 _
production equipments, the climate for investment will beworsened and is likely to have serious impacts on the long runcapital supply to the region. The repercussions on the capitalmarket will be more severe when one region implements theprotection measures, while others do not or when the regionsapply different levels of stringency with respect to pollutioncontrol. Thus the implementation o¥ the environmental protection measures can have serious consequences on the capitalsupply and there¥ore, on the overall economic developmentobjectives of the region.
Impacts on the Fiscal Base of Municipall Regional GovernmentsThe region or a municipality which is greatly dependent on
a particular industry For its tax revenues encounters significant reduction in their revenue from corporate and other taxeswhen a cut-down in production or an out-right shutdown of theplants occurs. The curtailment of production and employment isbound to afiect the tax base of municipal and regional governments. Therefore, they are likely to resist the implementation of environmental protection programmes or a set ofpolicies may be adopted which will smoothen the transitionalprocess. Before adopting various measures of environmentalprotection, the Tiscal eifects of their implementation must beestimated. Such an estimate may also account for changes inthe structure of consumption and production and for the derivedchanges in the employment oi capital and labour.

Impacts on International Trade and Balance of Payments etc.Just as environmental pollution can cross the geographic
boundaries, so can the impacts of environmental protection.The higher product prices of the polluting industries onaccount of pollution control expenses will mean less competi~tive exports in the world market and more purchases from abroadby the domestic consumers. Under normal conditions, this willresult in a deterioration in the country’s balance ofpayments. In this context, the imposition of the pollutioncontrol measures within a country which raises costs, issimilar in its effects on international trade,to a revaluationof the country's currency or to an imposition of tariff anddevaluation of the currency by other countries,or all of them.
The depressed demand for domestically produced commodities
will lead to a decline in incomes which is accentuated by themultiplier process of income determination. The net outcome ofall the forces involved is difficult to evaluate. But theimpacts on income and the balance of payments of a nation thattakes up unilateral pollution controls will be clearly manifested.
It is counter—productive to penalise a nation that istrying to control pollution by allowing its industry to sufferin international competition. Yet this is the situation we areconfronted with, primarily because of the absence of anymeaningful international co-ordination of environmental protection measures. It is very idealistic to believe that all the

_ BB _
industrial centres are going to suddenly converge on a multinational pollution control policy. However, some significanteconomic benefits may be realized for the country which takesthe initiative in controlling pollution. Its initial technological lead coupled with growing concern over pollution theworld over, might lead to substantial receipts in the balanceof payments in the form of export of pollution abatementequipment and know-how. But the primary goal would be toupgrade and maintain the quality of the earth's environment.
who will pay the Costs?es already pointed out, various types of direct and
indirect costs are involved in environmental protection. Butwho shall bear the burden of payment towards the costs ofenvironmental protection? The answer is: all of thoseconcerned, the polluter, the beneficiary and the government.Since the polluter (either the producer or the consumer) is theaccused in creating the problem, it may be argued that he mustbear the costs. Once the environmental protection measures areimplemented, the benefits of improved environmental amenititiesare accrued to the people of a particular locality. Therefore,it may also be held that the beneficiaries must pay for thecosts incurred for providing the benefits thus received. Atthe same time, the government cannot keep aloof as a nonparticipating observer in this affair as the control measuresrequire developed technology and huge expenditure which neitherthe polluter nor the beneficiaries are able to undertake.

_ B1 _
ficcordingly, we have three principal lines of argument withrespect to who shall bear the costs oi environmentalprotection. They are:
1. The Pol1uter~Pay-Principle(PPP)2. The Beneficiary~Pay-Principle (BPP) and-r9. The Bovernment~Pay~Principle (BPP)
Polluter-Pay-Principle (PPP)PPP states that the economic agent causing environmental
deterioration, viz., the polluter, must bear the whole of theexternal costs arising from his activities. This principleadvocates the payment of compensation to the affected people inthe deteriorated environment. In its narrower sense, the PPPaims at allocating the costs ’ex»post-facto’, that is, afterthe environmental damages have already taken place. That doesnot imply a non-polluting~princip1e. But in its broader sensePPP contains both the rule for the allocation of external costsin case of damages already caused as well as an injunctionagainst environmental damages.” But how will the polluterspay the costs?
It is suggested that environmental protection costs can bepaid from the business profit of the polluter. But as Peter F.Drucker has pointed out, such costs will be much more than thesum of all profits a¥ter taxes are paid. This is particularly
5. Martin P¥a¥¥,"International Transiers through EnvironmentalPolicy",in Mishra, Urs and Natraj (Eds.), figgional Planningand National Develo ment, Vikas Publishing House Ltd., NewDelhi 1978, p.298

_ B2 _
so when the control devices imply developed technology and thecosts become exorbitantly high. He points out the fallacy ofthis suggestion by citing the fimerican case: "After taxes, theprofits of all fimerican business in a good year come to sixtyto seventy billion dollars. find mining and manufacturing ~ themost polluting industries - account for less than half ofthis. But at the lowest estimate, the clean up bill even forjust the most urgent jobs will be three or four times as largeas all business profits".b
Beneficiary—Pay-Principle (BPP)The BPP states that the beneficiaries must bear the cost of
environmental protection. This means that the polluting firmsare to be paid the costs of pollution prevention and controldevices installed by them. But the payments are not directlypaid to the polluters, but through taxes to the government.Or, the beneficiaries may be indirectly paying the costs byconsuming the products of the polluter. But passing the burdenof costs from polluters to the consumers through increasedprices of the products implies interregional imbalances amongthe beneficiaries. This is because, first, the consumers ofthe products may not be the people who are benefiting from theincreased environmental amenities. The products may beconsumed by the people outside the region, whereas the benefitsare accrued to the people of the region only. Second, theconsumers and the beneficiaries are the same people; if that isso the above mentioned interregional imbalances may not occur.
6.7 Peter F. Drucker, 1981, op. cit., p.26

_ B3 _
find third, only some of the consumers are the beneficiaries,while others are not. Due to such discrepancies, as MartinPfaff suggests, "before policy measures are recommended thatwould lead to these kinds of interregional imbalances amongbeneficiaries and those who pay the costs, an estimate of thedegree of imbalances would have to be made"7
fit the same time, BPP does not mean the bearing of the costsof environmental protection by the beneficiaries to the fullextent. If the beneficiaries are paying for the costs fully,this would amount to a ‘non-prevention-principle’ because, evenin the absence of any sort of environmental protection, theentire social costs of pollution are borne by them.
Government-Pay-Principle (BPP)
The government can adopt various measures to help in thepayment of environmental protection costs. Besides legalimpositions, various instruments of explicit and implicittransfer payments can be adopted for this purpose. Thesetransfers can be in cash or in kind. Explicit transfers in cashmay be made to the polluting firms as an incentive to implementenvironmental protection measures. Such transfers may take theform of operation subsidies, research and development subsides,capital grants, general aids and cost sharing between regionalauthorities and the industrial organisations. Generally, suchexplicit regional transfers are adopted depending upon thespecific situations of the region, its financial resources, the
7. Martin Pfaff, op.cit., p.298.

_ 84 _
structure of the industry and so on. The explicit transfers inkind consist o¥ provisions like ¥ree waste treatment facilitiesout of general tax revenues. In this case, the firms would haveaccess to waste treatment facilities without having to pay {orit.
The implicit transfer payments are in the +orm o¥ publicgrants (indirect subsidies) that are conveyed through nominalmarket transactions. For example, the government arrangesconcessional leasing or concessional loans, to a particular ¥irmat prices below the going market rates: The grant element insuch a policy consists in the difference between the presentvalue o+ the actual leasing or payment made and the value of thepayment required, i4 the market leasing or lending terms wereapplied.
another method oi conferring the implicit public grants isthrough the regional tax system. For example, a hidden subsidymay be conveyed to tax payers by way of allowing tax deductionsand accelerated depreciation to compensate for the costs ofenvironmental protection. The subsidy element in this can becomputed as the dif¥erence between the tax liability in theabsence of deductions or accelerated depreciation and theirpresent values.
The implicit public grants may also be conveyed throughregional administrative measures. For example, relaxingpollution standards by the regional public authority, in a way,

H 35 _
conveys an economic benefit. The grant element implicit in suchmaeasure is simply the difference between the production costsbefore and after the relaxation of the standards has takenplace.
It is suggested that the government may raise the fundrequired for paying the environmental protection costs through areduction in defence spending. In this age of competitivelyincreasing build~up of weaponry with sophisticated weapons thatcan annihilate the entire humanity, this suggestion seemsapparently stronger. But a thorough’ examination of thispossibility would reveal that this proposal is false and highlyimpracticable. Dn this,Peter F. Drucker, with reference toU.S.defence spending, writes, "of the six or seven per cent ofour national income that now goes for defence, a large part isthe cost of past wars, that is veterans pensions and disabilitybenefits. Even when we could or should cut defence spending thepeace dividend is going to be one or two per cent of nationalincome at best”.9 In the case of India too, Drucker’s statement is true. Our defence expenditure comes to nearly 5% of theGNP in 1987-88. Of this, only less than 53 per cent goes to theactual defence build~up9 and this forms only a fraction ofwhat is required for environmental protection of the entirenation. But this is no excuse for not reducing arms build upand defense expenditure throughout the world.
8. Peter F. Drucker, 1981, op.cit. p.35.9. Arun Ghosh,”The 19B7~B8 Budget: A Birds-Eye View of Central
Expenditures", Economic and Political weekly vol.xxii,No.15, épril 11, 1987, p.663.

_ 36 _
Cost and Benefit OptimalityAll the costs of environmental protection are the "benefits
foregone" in the sense that the resources spent on environmentalprotection could have been used elsewhere in the absence of theproblem. Similarly, the benefits accrued by way of addedenvironmental amenities are the "costs avoided" (for eg.damagesaverted) in the sense that a reduction in damages is achievedthrough environmental protection. Therefore, just as we havedirect costs due to environmental pollution, we have directbenefits from protecting the environment such as, benefit fromdamage costs avoided, from damage avoidance costs avoided, frompollution costs avoided and from transaction costs avoided orreduced.
when development projects are undertaken it is necessary tosee that benefits accrued from them are not less than the costsinvolved in the efforts to execute them. If the projects havealready been executed, measures to protect the environment mustcreate positive benefits as against the cost of implementingthem. In any case, the costs and benefits optimality concept inthe context of environmental protection speaks of striking abalance between the incremental costs and incremental benefits
from the attempts to protect the environment as to maximize thetotal benefits of environmental protection against the totalcosts. It is only at the equality of marginal costs andmarginal benefits that the resources will be used in aneconomically~efficient manner to bring about the optimal levelof environmental pollution abatement and control. Various

_ 37 _
measures and policy instruments must be implemented to bringabout the desirable level of environmental protection (ie.desirable level of pollution) at that equality. And if thecharges are set and the standards are fixed to protect theenvironment at this optimality level, we can expect to achievethe professed goal of creating protected healthy environment.
The objective of a financial estimate of environmentalprotection is Principally the evaluation of trade offs betweencosts and benefits involved in that process. There are severalstages in the financial estimation of environmental protectionin a specified area or locality (Stages are listed in Ch.I, SeeP.1B). The state of environment in Eloor-Edayar Industrial beltis enquired into in the next chapter as it is the first stage inthe financial estimate of environmental protection of that area.

CHAPTER - _ITHE STRTE OF ENVIRONMENT IN
ELUDR-EDAYAR INDUSTRIAL BELT
The Project Area
The area selected for study is Eloor~Edayar Industrial beltin the State of Herala. This is located in the middle of theState on the western coast. The area forms part of ErnakulamDistrict and falls under the jurisdiction of the Greater CochinDevelopment Authority (GCDA). The factories in this belt aresituated on the banks of both Eloor and Edamala branches ofPeriyar River. Both these branches which form the Eloor-EdayarIsland empty into the Vembanad Estuary at a distance of aboutone Kilometre from there. The island has a total area of 11square kilometres and has the two branches of the longest riverof the state on all sides with Vembanad Estuary on the west asshown in Maps 5.1 and 6.2. These branches, especially the Eloorbranch, also form a number of small islands as they join theestuary.
The Eloor branch is broader and straighter. It is into thisbranch that most of the industries discharge their effluents.The Edamala branch is narrower and curved and it is in thisthat the water intake points of most of the industries arelocated. The intake points are protected from saline intrusionby a bund at Manjummal. Tidal effect is comparativelypronounced in the Eloor branch as it is broader and straighter.The thrust of the tidal effect obstructs the flow of Periyarriver in this branch and the fresh water flow is mostly directed

. . I
M _om¢om
JDEHZDU zoH+:44om
mwqpm ¢._¢mm:.,_
u mumnom
I-n|nIIlI'I'IIoII|I|II
I!
. znumfiunu .
.VHUMwH§UHLfi» mwTfh
2. I?
H :0 ..:._¢E
Z
\&mmm<:«._§
mmub. ~a_:u~&
..m:.:: 52.6 mmum .
mmio 322 \md2u.m.. K .mm&EL2 S_Ez<...0._l\\ %.
«nm_mEv.oa E <o2Em
m>§:<o
mv_<.h2~ Qmz.
. AI
ow»
.:7/..«av
>

..... .....
through the Edamala branch at the branching point below theMarthandavarma Bridge.
Geographical Features
The project area is situated adjacent to Cochin city at anelevation of three metres above sea level with longitude76°2B’E and latitude 9°45’N.1 Being a coastal area, it hasmoderate climate. The prevalance of peculiar meteorologicalconditions such as heavy rains and longer duration of sunshinein this tropical region contributes to an effective naturaldispersal of air pollutants. The average annual rainfall is3235 mm. varying between 2157 mm and 4525mm”.
The strong south westerly sea winds during the monsoonmonths of June, July and August and the north westerly sea windsduring October and November also play an effective role in thedispersal of the pollutants. Perhaps, the dominant windsdirected to the east save the dwellers of Cochin city from muchof the hazards of air pollution by spreading the air pollutantsaway from the city. The humidity in the area varies between 56and 953 and the temperature between 26°C and 35°C“
1. The Kerala State Pollution Control Board, Environmentalstatus Report on Greater Cochin~Kerala, Trivandrum,(19B2),p.26.
Ibid, p.4.3. George Mathai Tharakan, Comparative Study of Air Pollution
in Eloor-Edavar Industrial Belt, School of ManagementStudies, University of Cochin,(197é), p.36.
4. Kerala State Pollution Control Board,Environmental Statusfigport on Greater Cochin. Herala,(1SB2). p.4.

C\\
A4u¢xV .Q»4 m4¢uHzm:u aza mQHu¢ ¢4¢mmxAguhw .mp4 »z¢¢zou mzHm:Hu¢¢:z¢z m4¢uH=mIu mmouz¢>¢mp.4Hu:w .Q»4 mmmzfi m~m>4¢H¢u amhmzs
mmmuv .mp4 uzH~ Hz¢2Hm ouzHzoum4umV .o~4 m4¢uHzm:u m¢>Hmm¢Auukv .mp4 mqmumzmxu zHIuou mmouz¢}¢mH
--vl‘~Ir-"J'=1‘LI'J~Of“~030‘
. .4H:w .mh4 mmmHuH»mmmzH zqhmamzmz An.mmHv .mp4 m:hm¢w wmqm zqmazw mm:..:r: 5: m§2.._§¢E 3355 9,2 $mN3:.fi.: 8V_| N\.V\.Vmm>m>.m:m. mmfimopucu & mum
M0
->
. :§§_z<2_m% N .. dE. 223 A¢0 Q‘ A wJ .m,¢<t& Bzozfim W 00 M
» p.2 , Iv
Q/u\:w_
, \
.n~1;,uwu.mw H ~m,urx»»u;mfimww:.wu.n.nu.a.mm
Nlfl m¢:

W 93 _
Generally soil is disturbed in the low lying areas on thebanks along both the branches of the periyar river. Frequentflooding during the monsoons was common in this area prior tothe construction of Idukki Dam in 1975. Even now, during thepeak of the monsoons, deposition of salt and clay along thebanks is not uncommon.
The Paathalam Bund
Periyar, as the very name suggests, is the longest among the44 major rivers in the state with a running course of 244kilometres. It has its origin in the western Ghats and entersthe project area at Always below the Marthandavarma Bridge. Theriver is perennial and the ¥low diminishes considerably duringthe dry months, February to May. However. the WatEF di5ChaVQ9is sufficient to maintain the normal ilow characteristics evenduring the dry months.”
But un¥ortunately, during March 1982, there was a totaldisruption of the normal flow pattern due to very low waterlevels in Periyar because o4 the drought conditions. Reverseflow in the Eloor branch during uptides carried the saline wateralong with the pollutants discharged ¥rom the factories, up tothe Marthandavarma Bridge and sometimes even beyond. It wasthen emptied into the estuary through the Edamala branch. Thiscould virtually contaminate the water intake points of the
S. Jolly Joseph, A survey o¥ Ground Water in Eloor-EdaxarIndustrial Belt, Dept. of Applied Chemistry, University ofCochin,(1982), p.51

...g*'_:!;.....
factories in the area. The industrial pollution load was thuscirculating the island creating a lot of environmental problemsand posing a threat to the industrial water supply.
To protect the water intake points irom Turther contamination by the saline upward flow a temporary earthen bund wasconstructed at Paathalam near Udyogamandal in the year 1982. Itcould prevent the saline intrusion, but precipitated a lot ofserious ecological, economic and political issues. The conse~quences were collectively termed as the Paathalam Bund Episode.The surface water quality during the period o4 the episode wasmonitored by the Kerala State Pollution Control Board (KSPCB).The Board has found an alarming increase in pollution load withrespect to all the selected quality indicators.” Though, itwas considered an episodic issue then, it continued to be arecurring issue, since the water level could not be regulated bythe trailrace waters from the Edamalayar Project as expected.
Factories Surveyed
filtogether 9 Tactories were surveyed in the area {or thepurpose of the present study. The schedule used for interviewing the executives oi those Tactories +or collectingrelevant information is given in finnexure-—1. The factories arelisted in table é.1 with speci+ications such as years o¥ esta~blishment and commencement of production, nature of ownership,type o¥ industry, and their location. Their geographicallocations are marked in Map &.2.
6. For details, see, HSPCB, Episodal Pollution Caused by a Bundficross Perivar, Q case Study, Trivandrum,(19S2).

- 94 _
The first three factories in the list, namely Fertilizersand Chemicals Travancore Limited (FACT), Indian Rare EarthsLimited (IRE) and Hindustan Insecticides Limited (HIL) arecentral government-owned industrial units. The fourth,Travancore Cochin Chemicals Limited (TCC) is owned by the Kerala
State and the ninth, Kerala Acids and Chemicals Limited (KACL)is a Public Limited Company. The remaining four, namely, PeriyarChemicals Limited (PCL), Cominco Binani Zinc Limited (CB2),United Catalysts India Limited (UCIL) and Travancore ChemicalsManufacturing Company Limited (TCM) are major private limitedCompanies. The last in the list (HACL) has only recently becomefully operational and therefore could not be subjected to adetailed study except for finding out the potential pollutantsfrom the nature of the raw materials used in the productionprocess. A major industry located in the project area, viz.Indian Aluminium Company (INDAL) is excluded from the study as
this is a non polluting industry unlike others. This industrialunit only cools water and causes no appreciable water pollution.7 Though INDAL emits air pollutants such as flourine,CD2, Carbon dust, arsenic particles, their magnitude is considered to be insignificant.
The factories, FACT, IRE, HIL and TCC are situated atUdyogamandal in Eloor on the southern bank of the Eloor branchof the river. The PCL, CB2, UCIL and HACL are located atBinanipuram in Edayar on the northern bank of the Eloor branch.
7. Herala State Planning Board, Economic Review~19B2Triyandrum, Section 9.47.

TCM is at Manjummal, on the eastern bank of the Edamala branch.The FACT is a fertilizer unit; HIL is an insecticides unit; IREand CB2 are ore processing industrial units; and all others arechemical industrial units.
The study covers about one third of all major industries inHerala (i.e., 9 out of 31) which include 68 per cent (6 out of18) of all major chemical industrial units in the State.9
Potential PollutantsTable 6.2 shows the potential pollutants let out by each of
the factories by way of effluents, emissions and solid wastes.These pollutants from the respective factories are noted downafter consulting the experts in the State Pollution ControlBoard and the National Environmental Engineering and ResearchInstitute (NEERI). They are harmful in many ways to life andproperty and to vegetation and animals, if not controlled.
Free ammonia, ammoniacal nitrogen, phosphate (P205), P204,Flourides, PH, suspended solids, CDD, Hexavalent Chromium andZinc are the pollutants contained in the effluents from FACT.The effluents from IRE contain flourides, phosphates, P204,P”, radio-activity,” COD and suspended solids. The insecti~cides such as DDTand BHC, P”, suspended solids, and CDD arethe major polluting elements in the effluents flowed from HIL.
8. Ibid9. Storage and disposal of radiactive substances at IRE in the
project area are discussed separately in this Chapter.

- 96 _
water pollutants such as mercury, free chloride, sulphidessolids, zinc, P“ and EDD from TCC; BUD, EDD, P”, suspendedsolids, oil and grease and sulphides from PCL; Zinc,acidicchemicals, P“, and suspended solids from DB2 and hexavalentchromium, P“, suspended solids, copper, iron and zinc fromUCIL also contribute to the contamination of water bodies in the
area. The effluents from TCM contain copper, salt (NQCL),hexavalent chromium and zinc.
Some of the above said pollutants exist in effluents only intraces (eg.copper, chromium etc.). Other pollutants existEbnsiderable amounts of which a few exceed the desirable andpermissible limits, even after treatment. For a few of thepolluting elements such as DDT, BHC, mercury and radio-activewastes there does not exist treatment technology and methods of
control,and even an insignificant amount of such pollutants cancause hazardous and long lasting effects on living organisms.
Neither the public agencies and their reports, nor thefactories themselves do reveal exactly the extent of pollutantscontained in the effluents and their intensities. The publicagencies like the Pollution Control Board and NEERI are reluctant to make known the intensities of pollutants presumably onreasons such as the confidential nature of the subject and theupkeep of their good relation with the factories, which is perhaps necessary for them to function smoothly with the cooperation of the factory management. On the other hand, thefactories are unwilling to impart such information because such

_ 97 _
revelations may hamper their interests and obstruct the smoothrunning of the factories in due course. Anyhow this is adelicate area. The reluctance in the part of the differentagencies, vi:., KSPCB, NEERI and the factory managements makesit difficult to expose the true nature of the polluting activities of the factories.
The intensities of the pollutants in the effluents beforeand after treatment as per the information supplied by thefactory managements are shown in table 6.3. It shows that thevalues of most of the parameters conform to the standards prescribed by the Indian Standards Institute (ISI) and/or by thePollution Control Board. (Standards are the legally permissiblemaximum content of pollutants in the effluents). But thevisible and felt impacts of those pollutants on life, materialsand vegetation in the area from the use of the polluted waterreveal that many of the pollutants far exceed the legal limits.
The annual report of the HSPCB for the period 1979-80 speaksof the seriousness of some of the water pollutants from thefactories in the area. But the report does not give the intensity of the pollutants. ficcording to the report, the majorindustrial units contributing to water pollution in the area areTCC, FACT, IRE, HIL and CH2. "The discharge of wastes frommajor chloroalkaline industry, viz. TCC, contains mercury. Thedischarge of effluents from IRE shows the presence of radioactive materials. The wastes thrown into the river from HILcontain DDT, BHC and other insecticides. All these make the

_ 93 _
pollution in this river (Periyar) more serious. The reasons forthe contamination of this river with ammonia, flouride, phos~phate, etc., are due to the effluents from FQCT. The zinccontaining effluent discharged from the DB2 further aggrevatesthe pollution prob1em.1”
Suspended particulates, oxides of nitrogen, sulphur andcarbon, chlorine, hydrogen chloride, acid fumes,ammonia,flourine and other flue gases are the major air pollutantsemitted by the factories in the area. Eventhough, the fiir(control and Prevention of Pollution) fict, 1981 has beenenacted, the Board is yet to take up and execute measures tocontrol air pollution. Therefore no factory in the area hasadopted effective measures to restrain air pollutants on aregular basis. Since there was not any compulsion to controlair pollution, some of these factories were converting theirwater pollutants into gaseous form to escape from the clutchesof laws regarding the control of water pollution. However, thismay not be possible when the Air fict, 1981 is fully enforced.
Solid wastes disposed from these factories are not ofconsiderable quantities. The harmful effects from the solidwastes discharged are less significant compared to those fromwater and air pollutants in the area.
In India we do not have any legal enactment to control soundresulting from industrial processing and related activities.
16. HSPCB,Annu§l Report 1979~19B@, Trivandrum, p.12.

6 3746_ 99 _
Therefore no attempt has so far been made by any of these factories nor by any other agency to monitor and to assess the extentand the impact o4 sound produced by these Tactories around thelocality. The sound levels in the factory premises and in theirrespective surroundings are observed to be oi alarmingly highdecibels, especially in the case of FACT and TCC.
Water Pollution in the Area
Due to the heavy load of various pollutants from the factories, the ground water in the area is polluted. In the riverPeriyar, especially at its lower reaches the pollution oi wateris serious. The condition of the Vembanad backwaters is nonethe better. It may be noted that none of the Tactoriespresently studied let out their effluents directly into thesea, or into any lake, or into any public sewage system; butonly to the river Periyar.
Ground Water Quality of the Area
The uncontaminated natural water contains {ixed range ofmineral concentrations as shown in table 6.4. Some of thestudies conducted on the quality of ground water in the areashow that the values of the parameters exceed not only in theirnatural contents but also the legal limits prescribed by ISIand;or KSPCB. For example, a study conducted by the Departmentof fipplied Chemistry, Cochin University in 198211 revealed
11. Jolly Joseph, A Survey of Ground water in Eloor-EdayarIndustrial Belt, Dept of Chemistry, Cochin University(1982), pp.S@-55,

- 180 that the quality of the ground water in the Eloor—Edayar islandis poor. The study altogether covered 11 wells spread over theisland and values obtained ¥or the parameters show that themineral contents exceed those present in natural water. filso,the values “oi some of the parameters cross the permissiblelimits prescribed by HSPCB ior the surface uncontaminated water¥or drinking purpose. Values of the parameters obtained and the
A._
permissible limits are shown in table 6.5.
Similarly, the findings of yet another study made by KSPCEand the Department of Science and Technology in co-operationwith the Global Environmental Monitoring Programme (GEMS) of the
world Bank reveal that the values oi most of the parameters suchas P”, total coliiorm, iaceal coliiorm, Dissolved oxygen (DU)Biological Oxygen Demand (BUD), Chloride, hardness, and alkalinity exceed the permissible limits. The monitoring results ofopen wells at Eloor (in 1981) are shown in table 6.6.
In short, the ground water in the area is highly polluted.The presence of excess minerals and other elements which determine the quality of water_reveals this iact. The ground watertowards the low reaches of Eloor and Edamala branches andtowards the estuary is aiiected by salinity, as well asindustrial discharges. But, near the industrial water intakepoints and towards the main land, the ground water is lessafiected and do not often reach this level of contamination.
~ 181
Polluted Periyar RiverIn the state there are about 158 large and medium scale
industries discharging their trade effluents. It is estimatedthat about 5888 lakh litres of trade effluents are being dumpedinto the State's water bodies such as rivers, lakes and tidalwaters every day. Of this, 48.5% of the wastes are from chemical industrial units containing chemical pollutants and48.3Zfrom industries letting out organic pollutants. Hone than 11%(11.2%) represent wastes from engineering industries.12 ThePeriyar river alone receives the maximum quantity of industrialeffluents, ’i.e., about 2425 lakh litres13 per day and almosthalf of this originate from the industries situated in theEloor-Edayar industrial belt. That is, the industrial effluentsfrom these industries alone constitute more than 38 per cent ofall such effluents created in the state in a day.
Periyar being the only river in the region a major portionof the industrial pollution load of the region is borne by thatriver. During the year 1982-83, all the industries in the areatogether discharged more than 1828 lakh litres of effluents perday into the river.14 The details of waste water generatedand the percentage of treatment in the case of each of theindustries are shown in table 8.7. The levels of treatment ofthe pollutants from these factories vary from 58 per cent to 98
12. KSPCB, finnual Report, 1979~88-,Trivandrum, p.11.13. Ibid.
14. The State Planning Board, Economic Review, 1982, pp.238-23?.

- 162 ~
per cent. It is true that in 1974~75 (when the state board forpollution control became operational) waste water was not treated by any of these factories, whereas at present it is treatedat least partially before being discharged into the river.
Since the effluents are not fully treated, several tonnes ofpollutants reach the river every year.1“ Details of theamount of various pollutants reaching the river is given intable 6.8. The 26185.96 lakh litres of waste water from theseindustries reaching the river contains about 1757 tonnes ofsuspended solids, 13.838 tonnes of HUD and 966.425 tonnes of COD
per year. Periyar river also receives from the effluents toxic,biomagnifiable and biochemical substances such as 2666 Hg. ofmercury, 1476 Hg of hexavalent chromium, 16695.46 Hg. of zinc,327 Kg of copper, 256 tonnes of flourides and 36,666 Hg of ironper year. The pollution load of phosphates, free ammonia andammoniacal nitrogen from these industries amount to 869 tonnes,685 tonnes and 2512 tonnes respectively during a year.
Due to this heavy load of pollutants, Periyar river in thearea is considrably polluted. The State Pollution Board hasbeen thoroughly monitoring the river under a project funded bythe Department of Science and Technology. The monitoringresults at eight stations in the river in the area and theadjacent localities during the year 1986 are shown in table
15. The quantity of various pollutants reaching Periyar Riverduring a year is obtained from, Environmental Status Reporton Greater Cochin.(19B2), pp.36~31.

~ 133 ~
5.9. fis can be seen, the values of all parameters in the upperreaches of the river are normal. The quality of water in theportion of the river {lowing through the project area is verypoor due to the wastes discharged into it from the industriessituated in the Eloor~Edayar belt. The worst p“ record was aslow as 2.8 (highly acidic) and the Dissolved Oxygen content, was6.93 mg/l. The B.D.D oi the river water went upto 16.2 mgfi.Concentration of pollutants like ammoniacal nitrogen was as highas 46 mgfl. and phosphate was 15.8 mgfl.16
In addition to the industrial pollutants another gravedanger posed to the river is the bilogical pollution due tourbanisation of the Greater Cochin Area and the rapid growth ofMunicipalities like Rlwaye, Perumbavoor etc. on the banks of the
river upstream above the industrial belt.*? Raw gewageg {ramthese municipalities containing the released storm water,effluents Trom markets and hospitals, blood and carcasses fromslaughter houses etc. are directly let out into the river without anv treatment as these municipalities do not have any plantfor sewage treatment at all. One of the main outlets forsewage from filwaye is just 258 metres away from the pumpingstation Tor drinking water supply to Greater Cochin. with localbodies polluting the river in this manner the social concious~ness of the general public has deteriorated to the extent thatthe people living along the river dump their garbage into the
16. Ibid., pp.6~717. P. Venugopal, "Polluted Flows the Perivar”, Indian Express,
Dec.é, 1986. Also see, Seminar Papers, National Seminar on"Save Periyar" conducted at Always on 7th Dec. 1986.

- 164 ~
river. Almost every day there are press reports indicating thepresence of live thread like worms in the drinking watersupplied to the millions of the Greater Cochin area. Besides,the agricultural wastes from farms all along the river and soilcontaining residues of fertilisers and insecticides of varioustypes must be flowing into the river in considerable amounts.
while chemical and bilogical pollution of the river isgrowing day by day, the problem is aggravated by two morefactors. (1) large scale lowering of the river bed by theremoval of sand for filling low lying areas and buildingconstruction and the reduced flow of water by the constructionoi dams upstream. with the lowering of the bed level of theriver and reduced tlow from upstream, the reverse flow from thesea at the high tides, as mentioned earlier, carries all thechemical and bkflogical pollutants upto or even above the mainwater supply pumping station at filwaye.13 During summer, thewater is so polluted that people are afraid to take bath in theriver. Still, people have to drink this water in Cochin and thesurrounding towns.
Condition of the Vembanad Backwaters
The Vembanad backwaters into which the river Periyar empties
itseli lies at the west of the project area and covers a signiw¥icant area of the western part oi Greater Cochin. The backwaters are connected to the sea at two places in Greater cochin,
18. P. Venugopal, "Pollution Seeping into Drinking water Too"Indian Express, Dec. 12, 1986.

at Cochin and Crangannore. The entire backwater stretch issaline during summer. But with the onset of the monsoons, thesalinity decreases drastically. The total dissolved oxygen inthe backwaters comes down to 166 mg/l. during the monsoon season
from values as high as 53750 mg/l during the summer season.19Thus normally, during the monsoons the entrie stretch of thebackwater becomes a fresh water lake.
But, the above mentioned and similar pollution load reachingthe backwaters through the river together with that from other?8 million litres of effluents per day flowed directly fromvarious other industrial units causes serious pollution of thebackwaters.2” Besides, pollution of the backwaters is alsocaused by husk ~ retting and agricultural wastes. Consequently,during recent times fish kills in Vembanad backwaters arereported several times during a year. The life and health ofall living organisms in it are affected.
Air Pollution
The atmosphere of the area and of the surrounding places ispolluted due to industrial emissions. Every factory in the areacauses pollution of air in varying magnitudes. Table 6.10 showsthe major air pollutants emitted by the factories, the averageheight of the stacks and the volume of such pollutants discharged during a year. The volume of sulphur and ammonium compounds
19. HSPCB,Environmental Status Report on Greater Cochin,1982,Z‘p.o
EB. Ibid.

- 186
discharged is very high. Q large amount of carbon dioxide isalso let out. The extent of chlorine disposed o¥¥ into the airby certain Factories in the area also causes serious problems ofair pollution in and around the project area.
The concentration of some of the air pollutants in theproject area have been studied by George Hathai Tharakan in1976. The monitoring results of sulphur dioxide, sulphuric acidmist, ammonia and ammonium compounds and suspended particulate
matter obtained when the experiment was conducted for each ofthem at three stations in the premises o¥ CB2 Tor a month aregiven in table 6.11. The average range of values obtained inthe case of all these parameters exceeded the permissiblelimits. (The permissible limits are shown in tables 6.12 and6.13)
Similarly, the study conducted by NEERI31 on the conditionof atmosphere over Cochin city included Udyogamandal (Eloor) asone o¥ its monitoring stations. The values obtained for para~meters like sulphur dioxide, nitrogen dioxide and suspendedparticulate matter (summarily given in table 6.14) exceed thedesirable limits of pollution oi the atmosphere around theEloor~Edayar belt. Yet another set o¥ data obtained TromNEERI22 gives the monitoring results (during January-March
21. National Environmental Engineering and Reasearch Institute,National fiir Quality Monitoring Net work, Air Quality inSelected cities in India, Nagpur(1978~79), pp.78~81
22. U.T. Padmanabhan,“The Number Game: 9 sutdy of OccupationalHealth Hazards at IRE, filwave”, Economic and Politicalweekly, March 8-15, 1986.

~ 197
1986) of the average concentration of S02 and suspendedparticulate matter at Eloor. One of the sampling stations waslocated at half a kilometre north of FACT. The average concentration of S02 reached a $our~hourly maximum of 423 ug/m3and a day's maximum of 159 ug/m3. Similarly the average forsuspended particulate matter had reached 186 ug/ma of maximumand as high as the arithmetic mean (AM) of 173 ug/m3 (Seetable 6.15) during the period.
Another study by P.V.S. Namboodiripad on the concentrationof sulphur dioxide in the area obtained certain alarming results(see table 6.16). "It can be seen that the value of S02 hasgone as high as 766 ug/m3 in this area which is perhaps thehighest in the world. It can be said that only rarely oroccasionally does the level reach such a high measure. Theaverage comes to more than 330 or 486 ugfma. Even this wouldbe one of the highest in the world"23
There is a close relation between relative humidity\and theconcentration of polluting gases. Relative humidity is de¥inedas the partial pressure of water vapour in air divided by thevapour pressure of water at a given temperature.24 when thehumidity is low in the atmosphere, the gases can immediately gohigh and get dispersed to Tar off places. The concentration of
23. P.V.S. Namboodiripad,”The Air we Breathe",paper presented inWorld Environmental Day Seminar, at the School ofEnvironmental Studies, University of Cochin, Cochin, June 5,1982.
24. George Mathai Tharakan,(1976), og.cit p.36

~ 168
the gases becomes very high in highly humid periods of theyear. Therefore the difference in humidity will help us tounderstand the severity of the problem during the rainy monthsin Herala. The humidity range during the different months aregiven in table 6.17. The high concentration of polluting gasesin high humidity has its serious effects in the immediatelocality around the Eloor~Edayar industrial belt.
Similarly, fog formation is a regular feature during therainy season in this area. The smog (smoke and fog) oftencovers the atmosphere of an area with a radius of 3 to 5kilometres from the Eloor~Edayar belt and sometimes goes even
beyond (Vypin, Parur, filwaye, Thrikkakara, Palarivattom, etc.
are affected places). This can cause serious health hazards onhumans and animals and damage to crops and materials.
Solid Wastes and Sound Pollution
Solid wastes disposed off from the factories in the area arenot of considerable quantities except in the case of FQCT wherechalk and gypsum are the major items. (The case of IRE isdiscussed separately). These wastes are careied to a distantwharf area and used for filling the low lying lands there.Other wastes from the factories such as saw dust, floormoppings, gunny bags, packing materials, suspended solids,Calcium Carbonate, barium sulphate, silica, iron dust, mud etc.,are disposed off mostly into the factories’ own land to fill thelow lying lands and in the case of some of the factories theyare flowed into the effluent streams. The problem of solid

~ 189 ~
waste disposal in this area is less serious compared to that ofwater and air pollutants.
Noise is a purely dis¥unctional consequence of ourtechnology. fibove a certain level sound can be harmful evenwhen it is not consciously being heard and directly affects ourphysical and emotional well being.2” fis mentioned earlier,there has not so far been made any attempt by any of thefactories nor by any other agency to monitor and assess theextent and the impact of sound produced by the factories in thelocality.
Qterage and Disposal of Radioactive Substances in the Area
The Udyogamandal unit of the IRE is the single and majorproducer of radioactive substances in the project area. IRE, anundertaking o+ the Department of fitomic Energy (DAE) is engagedin the processing o¥ monazite sand found in abundance in Heralaand Tamilnadu coasts. The plant has a processing capacity of4280 tonnes a year. The main products of IRE are Thorium, rareearth chloride (RE Chloride) and Zirconium. Mainly because ofthe prohibitive provisions of the fitomic Energy Act of 1962, noserious attempt has been made for the repeated measurement ofradiation level (concentration level of radio nuclides) with thehelp of sophisticated gadgets by any researcher, individual or
25. Joseph Julian, Social Problems, Prentice Hall Inc., NewJersey,(19B@), p.548

- 118 ~
organization. Recently, studies by V.T. Padmanabhanfib on thepotential threat of serious radioactive pollution of the areairom the storage of the ¥actory’s main products and the disposalof radioactive wastes within the factory compound are noted byenvironmentalists and the public at large both in the countryand abroad. The main product, thorium oxide, is stored in asilo attached to the factory and the bye-product/wastes in RCCbarrels are burried in the factory compound in concrete trenchesall of them containing highly radioactive elements, though invarying bacquerels (bq)87
An estimated 11,888 tonnes of monazite was processed at IREduring 19S3~é1 to yield an estimated 12,876 tonnes oi RECholride, of which 3718 tonnes were exported as per customs
26. See 1. Radmanabhan, V.T. Durantiathinte Noott§ndile:u (inMalayalam), Pushtaka PrasadhakaSangham, Pandalam, Kerala, 1985.
2. [he Number Game — A study oiOccupational-Health Hazards atIRE. filwaye, Herala SasthraSahithya Parishat, 1988.
3. "The Number Game - A study ofDccupational Health Hazards atIRE, filwaye”, in Economic aggPolitical weekly, March 8~1S(Nos.18 and 11), 1986.
and 4. "fill within Limits: Radio activewaste Disposal at IRE“,in Economicand Political weekly, Feb. 28(No.9) and March 7 (No.18), 1987.
27. Radiation is emitted during the transformation (disinte~gration) of a radioactive substance. The unit of measuringthe rate oi transformation is becquerel (bq.) which denotesone distintegration per second.

~ 111 ~
statistics.29 During the priod of 1962-85 an estimated 75,388tonnes of monazite were processed to yield a proportionate REChloride and radio active wastes at the rateflof one barrelful o+waste for every ten tonnes of monazite processed.29 As o¥now, nearly 5888 barrels of radio active solid wastes are buriednear the factory. The solid wastes contain uranium 238, mesothrorium, barium sulphate and sodium chloride.39
It is reported that many of the R.C.C. barrels are brokeneven beiore being placed in the trench which is said to be builtwith concrete using poor quality cement.3* The areasurrounding the disposal site has a high population density withan occupancy rate of 28,888 persons per square kilometre becauseof the presence oi the factories and the residential complexes.Less than 38 metres away ¥rom the disposal site is a sulphuricacid plant complex of the FACT with an installed capacity of 788tonnes oi sulphuric acid per day. It is an admitted fact that aquarter of a tonne of sulphuric acid is lost as leakage everyday. In this way, hundreds o¥ tonnes of acid must have leaked
into the ground which can damage the trench and the barrels asthe acid was there even be¥ore IRE decided on the disposal
28. Padmanabhan, V.T.,”Rll within Limits: Radioactive wasteDisposal at IRE”, in Economic and Political weekly, No.9,Feb. 28,1987, pp.38B~81.
29. Ibid.38. Ibid.
31. Padmamabhan, V.T.,”fill within Limits: Radioactive wasteDisposal at IRE"in Economic and Political weekly. No.18,March 7, 1987, p.428

— 112 —
site. Further, being close to the perennial river, there isunderground water the year round near the trench. Even duringthe summer , half the concrete trench would be immersed in waterwhich is acidic. The main product, thorium oxide in the form oia fine powder is stored in a silo built with plastered walls androo¥ed with asbestoes sheets. R crack is Tound on the wallfacing the river (Eloor Branch). The possibilities, like damageo¥ a dam upstream, a flood, a terrorist’s bomb, a cyclone or astorm can not be ruled out outright. And, if contaminated,forthousands of years, the river Periyar would have to be totallyabandoned.
According to sources inside IRE, earlier the waste was towedaway in boats for dumping in the firabian Sea somewhere near
Cfifihifi-33 Radioactive elements are also released along withliquid effluents directly into the river Periyar. As the ¥lowchart o¥ the IRE shows, there is only one stage in the processwhen water is used in significant quantity ~ leaching of slurrycontaining thorium, uranium and rare earths to remove thephosphate content. But water is also used for Tloor washingwhich is done at Trequent intervals. The ef¥luent treatmentplant was set up only during the year 1986. Even this does notdeal with the entire effluents discharged from the shop floor.It seems that HSPCB is not aware of the discharge point of IREat its Southern boundary which drains off water from the Tloorwashing. It is a fact that the pollution control Board does not
32. V.T. Padmanabhan, "#11 within Limits: Radioactive wastesDisposal at IRE", Economic and Political weekly, Feb. 28,1987, p.381

~ 113 ~
have either gadgets or expertise for measuring radioactivity.It is estimated that the total amount of uranium so ¥ar lost tothe marine ecosystem from IRE is well over 7@ tonnes, an averageloss o4 1.5 tonnes every year.33 During 1953-89, an estimated3,367 tonnes of solid wastes might have escaped into the river.The thorium and uranium content o¥ this quantity works out to573.4 and 6.74 tonnes respectivelv.34 Tables 6.18, 6.19, 6.23and 6.21 give details of the total quantity of radio activityreleased from IRE during 1953-89, their radiation potential andHalt Lifexfi of Uranium and thorium elements.
33. V.T. Padmanabhan, Economic and Political weekly, March 7,og.cit, p.423
34. V.T. Padmanabhan, Economic and Political weekly, Feb. 28,og.cit, p.383
35. A half liie is the length of time during which half theatoms of an element under consideration have disintegratedor decayed to attain stable form and yet another hal¥ lifeis required to decay the hali of the remaining half of atomsand so on.

Aemgzaflcmcfimv
Lm>mnmHmeezmcmz
not:not:
.emL=a«:m:fim.
;m>um
not Inot:
AHmu:msmmo>u:.
goofim
fimuwemcufimufiemgufimufiemzumcwmnmmuogm mumHmuwemnuHmuflsmnuHmu_em:umcflmnmmuoga mgokm~«_«ygm¢
u»4 u__n=mmum>«Lmm”_m> “Ln.mum>gLmmum>«Lmmcflxmygmuczmfimhmm *o .u>om
nounIon:
mcfixmugmncsm“n:H +o .y>om
nmcowmmmeeou acflmm
m¢oHsh».fimofi
m¢ofimeofiwow“
.4u¢mv
.uy4 mfimuwemcu ¢ mn«u¢ mfimgmu.u»4 ..ou a:_L=uum+:cmz
mfimugsmcu mLou:m>m;»
.=u~V
A4Hu=..uy4 m_u=H mpm>_mHmu umyficn
.Nmu.
.uu4 u=_N _:m=_m oucweouAgog. .uy4 mfimufiemzu .m>«hmm
.uu~. cg;m_muwemnu :«cuounmLoucm>mg».4H:..u»4 mmuMu“yumm=_ :mym=u:_:.mm_V .u#4 mcugmm mkmm cmflucm.»u¢¢V .u~4 mLou=m>mL»
fimufiemcu ucm mummflfiflugmu
>gum:uc~+0 mu>~
aficmgmczo+o mgzumz
cowuuzuoga+o ucmsnmucmseou+o ;mm>
ucmezmufiflnmumm+o Lmm>
um>m>L:m mmmgouumu
~.¢
: m4m¢~
¢
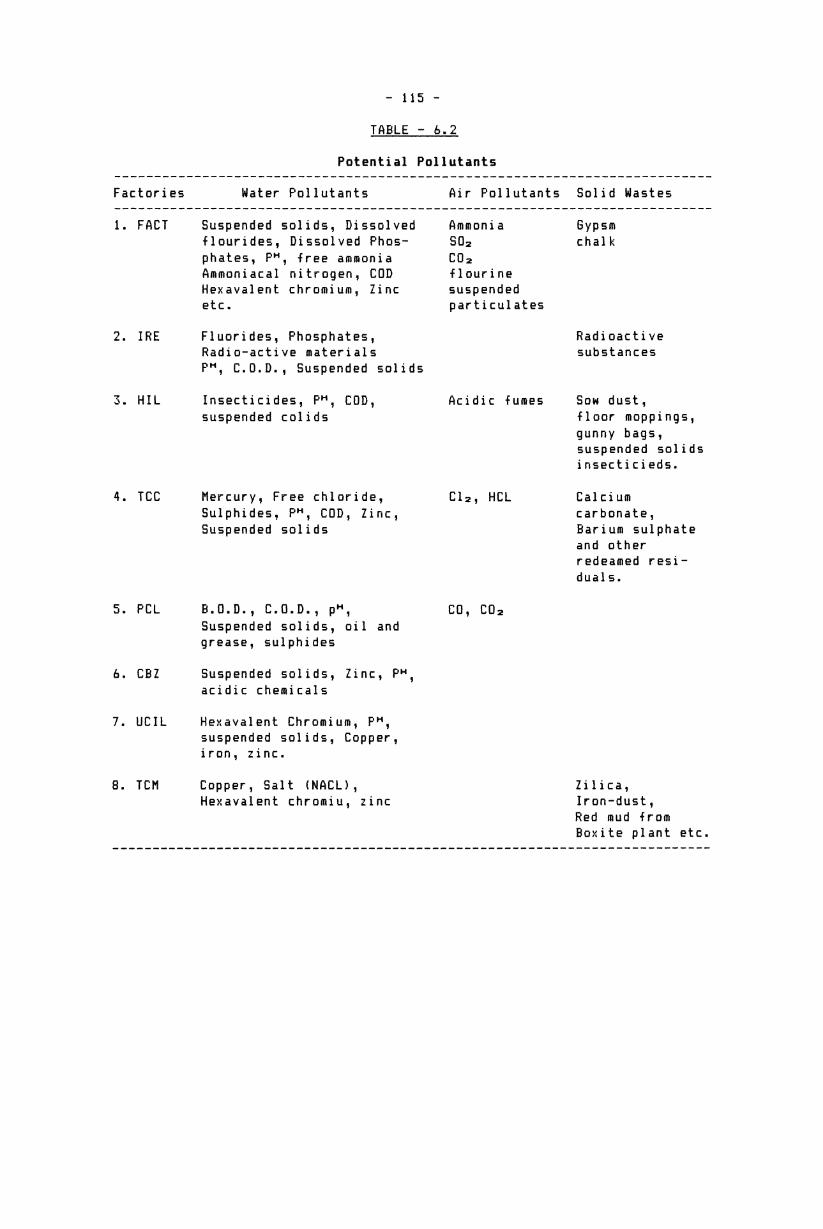
TABLE - 6.2
Potential Pollutants
Factories Hater Pollutants Air Pollutants Solid Wastes1. FACT Suspended solids, Dissolved Ammonia Bypsm
flourides, Dissolved Phos- S02 chalkphates, P”, free ammonia CD2Ammoniacal nitrogen, COD flourineHexavalent chromium, Zinc suspendedetc. particulates
2. IRE Fluorides, Phosphates, RadioactiveRadio-active materials substancesP“, C.D.D., Suspended solids
3. HIL Insecticides, P”, CDD, Acidic iumes Sow dust,suspended colids floor moppings,gunny bags,suspended solidsinsecticieds.
4. TCC Mercury, Free chloride, C12, HCL CalciumSulphides, P“, CDD, Zinc, carbonate,Suspended solids Barium sulphateand otherredeamed residuals.
5. PCL B.0.D., C.0.D., p”, CD, CD;Suspended solids, oil andgrease, sulphides
6. CBZ Suspended solids, Zinc, P",acidic chemicals
7. UCIL Hexavalent Chromium, P“,suspended solids, Copper,iron, zinc.
8. TCM Copper, Salt (NACL), Zilica,Hexavalent chromiu, zinc Iron-dust,Red mud fromBoxite plant etc.

- 116
Table - 6.3
Concentration of Pollutants in the Effluents
Before After StandardFactories Hater Pollutants treatment treatment (ISI/KSPCB)
FRET P” 5 - 9.5 Within limits 5.5 - 9.6Free Amonia 766 ppm " -Ammoniacal Nitrogen 666 ppm " 56 mg/1Dissolved phosphate 4666 ppm " 2.6 mg/1Dissolved flourides 3666 ppm " 2.6 mg/1Suspended solid 26,666 ppm " 166.6 mg/1
IRE
HIL Insecticides -- 1 - 2 ppm zeroP” 3.5 to 6.6 7.6 - 8.6 5.5 - 9.6Suspended solids 866 ppm 75 ppm. 166 mg/1
TCC Mercury 9.1 mg/l o.oo5 mg/1 o.o1 mg/1P" 4.5 - 11.6 6.6 - 8.6 5.5 - 9.6Suspended solids 666 mg/1 56 mg/1 166 mg/1
PDL Suspended solids 156 mg/1 56-B6 mg/1 166 mg/1CBZ
UCIL Suspended solids 266 ppm 36-66 ppm 166 mg/1TCM .Copper 16 ppm. 1 ppm. 3 mg/1.Salt (NACL) negligible
Note: mg/1 = milligrams per litre.
ppm = parts per million.
P” = measure of acidity or alkalinity; P" zero to 7 means thewater is acidic and P” 7 to 15 means alkaline.

- 117
TABLE - 6. 4
Typical Hineral Concentrations forUncontaninated Hater
ChemicalComponent
Calcium
Magnesium
Sodium &Pottasium
Biocarbonate
Chloride
Sulphate
Nitrate
Iron
Silica
Carbondioxide
PH
Expressed35
CaCD3 (mg/1)
Na (mg/1)
Cato; (mg/1)
C1 (mg/1)
S04 (mg/1)
N (mg/1)
Fe (mg/1)
Sifiz (mg/1)
CaCD3 (mg/1)
Rain
U1
1%
6.1
Natural water TypesSoft Soft Hard HardSurface Surface Surface Surface
CaCD3 Equi(mg/1) 16
184
Source: world Bank/fiugust 1973, EnvironmentalIndustrial Development Sector. Washington, D.C.
Consideration1978, p.182.
for the

- 118
TABLE - 6.5
Bround Hater Quality in Eloor-Edayar Island
Permissible limit(KSPCB)
pH
Total hardness as CaCD3
Chloride
Sulphate
Nitrate
Flouride
Suspended solids
17.5 - 127 mg/1
19 — 142 mg/1
1.3 - 54 mg/1
3 — 31.4 mg/1
o.2 - 2.33 mg/1
98 - 466 mg/1
Standard not prescribed
1.0 mg/l
2.6 mg/1
Standard not prescribed
2.6 mg/1
3m mg/1
Source: Compiled from Joll Joseph, "A Survey of Ground water in EloorEdayar Industrial elt", Project Report. Department of AppliedChemistry, Cochin University, 1982, p-52.

- 119
TABLE - 6.6
Ground Water Quality of Open Hells at Eloor (1981)
Values Permissible limitsParameters Minimum Maximum (KSPCB)
P" 5.2a 6.85 5.5 - 7.9aTotal Coliform 160 559% *5B
(MPN/139 ML)
Feacal Coliform 90 126% *5B(HPN/IE6 ML)
Dissolved Oxygen 2.06 4.2 *prescribed minimum(mg/1) 5.8 mg/1.Biochemical Oxygen 6.216 2.66 30 for 5 days atdemand (B.U.D.) (mg/1.) 26°C maximum.Chloride (mg/1) 12.6 132.6 1Hardness (mg/1) 13.2 212 *142Alkalinity 8.6 13.2 7.66Source: KSPCB, Environmental status Report of Greater Cochin, op.cit.
Kerala 1982.
* New York State Surface Water Standards; See World Bank/August 1978op.cit. p.99 and p.162.
Permissible limits for parameters against asteric mark have not beenprescribed by KSPCB in the case of drinking water.

TABLE - 6.7
Volume of Haste Hater Discharged by the IndustriesInto the River Periyar (in 1982-83)
Name of Source of Waste Htr Z of treat- Waste Ntr Z of treat- Waste Wtrthe water generated ment in generated ment let outFactory intake in 1974-75 in 1974-75 in 1982-83 into
(000'ltr/day) (000’ltr/day)
1. FACT Edamala 61,000 0 61,000 50 Eloorbranch branch2 IRE Edamala 4,586 0 4,5B6_ 90 Eloorbranch branch3. HIL Edamala 245 0 325 90 A Canal whichbranch Joins Eloor
branch
4. TCC Edamala 10,200 0 10,200 50 Eloorbranch (An extensive branchtreatment planproposed)
5. PCL Factory's 120 0 120 B0 Eloorown well (partially branchtreated)
6. CH2 Edamala 23,150 0 23,150 60 . Eloorbranch branch7. UCIL Edamala 2,800 0 2,800 -- Eloorbranch branch8. TCM Edamala 655 0 655 -- Eloorbranch branchTotal volume o1effluents discharged 1,02,756 1,02,756
Source Government of Kerala, Economic Review 1982. State Planning Board,Trivandrum, 1983, pp.238,239.

Aumfiwneouv ~msm.aq .»Mu.mo .mmm~ .:fi;uou Lmymmgm +o ugonmm msumum Hmucme:oL“>:m .mummx umugsom
.m>oam :zo;m.mm mgmzuo ucm Lmm>\ox nmmugmaaou .Lmm>\ax onwfi uenfieouzu u:m~m>mxm:
.>\ax o¢.mossH uu:_~ m.mm>\ox seam ">L=u.mz nu u«¢.sso mmm.mH ~ms.nm~fi ¢a.nmH¢m _m.op
hmm>\mx e¢.m¢fi "u:M~
.mm>\ax mm ueafieogcu u:m~m>mxm: ms.nums.e mH~.H_ mms._ mH¢._ ms.mmm :0»
.gmm>\ox sss.sm "saga .Lmm>\ax mum ugmnaauLmm>\a; smem uu:w~
.mm>\ox efim uesgeogzu acmfimpmxmz ~o.n m~.~_ ~m.m m¢.nm ss.o- ¢_u=..mm>\a¥ sewn ucM~ nu nu nu wee.» mo.¢¢m Nmuu u s¢.m mo.m¢ m¢.s~ mo.fi_ sm.m¢ Jug.hmm>\mx seam ">.=u.m: ¢.a-¢.h ¢m.smm u- ~m.nmm ss.¢smm ugh.um.=mmme yo: .mmufiufiHumm=H m~.¢ s~.m nu ¢s.m se.n¢ 4H:
.m_nMaM_am: u u=_N mLmm>\ax seams ".ou¢ s.mfi-o.m ~¢.mm nu ~m.- s~.ms~ um_
Lmm>\mx sssmfimm ucmmogufiz Hmumficoeec.Lmm>\ax sssmme "mfi:oss¢ mm»;_mm>\og esscms Henna mgmm>\ux ssssmmnu
.mm>\ax m~_~ uezfieogsu ucm_m>mxm: mo.hnm~.m s~.mmm uu os.emm~ ss.mmesm »u¢uALmm> Agmma ..>\mm::ou. .;mm>\mL»~ >;ouumu
.Lmm>\mox. mgmumemgma gwzuo ucm mmucmumnsm AmomLm>m. xmmccou. xmmccouv mufifiom ssssssfiv may
manmfisezuumuowa ncm umM+_comeofin .uflxo» rm .o.o.u .n.o.m nmucmamam Lmum: Lmummz +o memz
Lm>w;mm Lm>_m ms» aucw umugmzumwo mucmuagfiom wo >uMu:m=a
m.o n m4m¢p
n —- n

.mm.a .u«u.mo .mmo_ .uLoamm maumum ~mu:ms:uL~>:m .mummm umuusomm.s m.s seam s.m ofi sm.s m.~ m.¢ ss¢.n m.m~ m.ofi sm.s 9.“ a.m Hmeesficmz .mme." ¢.s s.om s.m ¢.m fis.s s.m mm.s ¢mm m¢ m.¢ m.s m¢.~ ms.“ >.mmmmsmHm£ .~n.m “.9 seam m mm s_.s e.“ ~.¢ s~n.m mm ¢.- ea ¢.n m.¢ .m>mum .om.mfi se.a saw» ~_ c¢ m.s n.m m.m mmm.ofi nee m.n m.s w.~ m.m Looflu .m
-- -- saw m.¢ o.m _.a m~.m ~o.m m.¢oe mg g.“ m.s ~.m _.n m.m;o;u .¢m.s m.s am e ~.m mfi.s ».m ~.e ¢.esm an M.“ m.s ~.m ~.e m>=.uo;~ .m-- -- ~_ 5 fi.m “.9 s.m mm.“ as as e.m s.“ m.» ¢.o em_mocmem>fi.mz .~
-- -- m“ s_ m.m mum.“ mm.n ~.c s¢_ no N.“ N.“ mm.n m.» _:o;u=.m;u .fi
--m.._---fl_._,..---m.....---§----m.L----E----m._.w---§.. ..... -3 .... -3... ..... -m__..---m.:._---M,.M_._.._---§ .................. -._\ae. .fi\me. ._\ae. =mao.~H= =ma>xo .~\os. mufifiom .~\osVm>mu m In mcofiumpmmumcnmozm mmufognu fimuwcoem ~33. umzommg umiommzu 2&3. .a.o.m ocfoficoz
smog : emum>m m:gum>mm ;m>~Lmm u >um~m:a gmumz
0.0 n m4m¢»
u mm“ 1

-123TABLE - 5.19
Major Air Pollutants emitted by the Factories in the Area
Estimated volumel AverageNumber of year in metric height ofAir Pollutants stacks tonnes the stacks
1. Sulphur dioxide 12 ) 55') Above 250%2. Sulphuric acid fumes 14 ) 50'3. Ammonia 11 ) 46’) Above 30664. Flourine B ) 46'5. Carbondioxide 23 56660 35'6. Chlorine 5 Above BSA 35'7. Hydrochloric acid fumes 8 - - - 60'B. Flue gases such as 16 - - - 38‘
N2,H2D, EtC.
Source: George Hathai Tharakan, Comparative Study on Air Pollution in theEloor-Edayar Industrial Belt, Project Report, University of Cochin,1976, Chapter III.
TABLE 6.11Concentration of Certain Air Pollutants
Major Air Pollutants Average Concentration During a Month
Sulphur dioxide [email protected] - B.074 ppm.Sulphuric acid mists 15.68 - 26.53 ppm.Ammonia & Ammoniacal compounds 28.8 - 3b.E@ ppm
Suspended particulate matter 31.15 mg/1 - 1.97 mg/l.
Source: George Mathai Tharakan, (1976) op.cit (adapted).

- 124
TABLE - 6.12
U.S. National Ambient Air Quality Standards
Particulate Annual geometric 75 ug/m3 66 ug/m3matter mean 24 hours 266 ug/m3 159 ug/m3Sulphur Annual arithematc BB ug/m3 (6.93 ppm) - Oxides mean
24 hours 365 ug/m3(B.14 ppm) - 3 hours --- 1330 ug/m3(B.S ppm)Carbon 8 hours 16 mg/m3 (9 ppm) 16 mg/m3 (9 ppm)monoxides
1 hour 40 mg/m3(35 ppm) 48 mg/m3 (35 ppm)Nitrogen Annual arith- 160 ug/m3 196 ug/m3dioxides ematic mean (2.65 ppm) (0.95 ppm)
Photo chemi- 1 hour 160 ug/m3 (2.68 ppm) 166 ug/m3 (0.68 ppm)cal oxidants
Hydrocarbons 3 hours 166 ug/m3 (B.24 ppm) 166 ug/m3 (6.24 ppm)(non-methane) (6 to 9 am)
Source: world Bank/August 1978 p.cit. p.16

TABLE 6.13
Range of Uncontaninated and Hazardous Air Quality Levels
Contaminants Uncontaminated Hazardous to humans
CD 0.03 ppm ( 50 ppm (90 minutes)( 10 ppm ( 8 hours)
N02 4 ppb 0.06 ppm (mean 24 hours)ND 2 ppb - - HCCH4 1 - 1.5 ppm 500 ppm (aliphatic)
(alicyclic)
Other HC 0.1 ppm ( 25 ppm (aromatic)( 0.06 ppm (HDHC)( 0.25 ppm (ndroloin)( 50 ppm (Acetaldehyde)
802 0.002 ppm 0.04 ppm03 0.1 - 0.05 ppm 0.3 ppmParticulates 10 - 60 ug/m3 80 - 100 ug/m3
Source: World Bank/August, 1978. 0p.cit. p.98.

TRBLE - 6.14
Concentration of 902, N0; and Suspended Particulate:at Udyogaaandal Area
Average Concentration of Biven Parameters (in uqlm?)Month 502 (every 16th N02 (once a month Suspended Particu(1979) day, 24 hours 24 hours) latesJanuary -- -- -February 199 B 153March 34 10 112fipril SS 28 15%May 53 26 144June 2B6 13 194July 211 13 156August 94 18 195September -- -- -Source: Government of India ‘Air Quality in Selected cities in India 1978-79.
NEERI, Nagpur, 1980, pp.78,79 and 81.

- 127
TABLE - 6.15Concentration of S02 and Particulates in the Area
During January - March 1986Unit: Ug/m3
Month/ Total 502 Days Suspended particulate matterYear Samples 4hrly Max. Max. AM Max AM
Jan 198% 3 423 15% 76 186 173Feb 1986 2 6B 38 24 161 145Mar 1986 3 177 63 39 115 1B1Notes: Sampling irequency: every 10th day - 24 hours.
AM = Arithematic Mean.4 hrs. Max = Maximum recorded in 4 hours. in the month.Days max = Maximum calculated for 24 hours. in the month.
Source: NEERI, (Date received from WHO vide letter No.1CP, DB3 datedOctober 5, 1984), quoted in V.T. Padmanabhan, the Number Gamein Economic and Political Weekly. March 8-15, 1986 o .cit.,p.452.

e 128
TABLE - 6.16
Concentration oi SD; in Eloor-Edayar Industrial Belt.
Unit: ug/m3
3rd September 5th October 28th November 26th DecemberTime 1978 1978 1978 19781st four hours 425 788 191 2922nd {our hours 97.5 177 372 1483rd four hours 83 21 288 1134th {our hours 51.2 12 28 455th four hours 62.1 Spoiled 25 986th four hours 557.5 225 12 195
Source: P.V.S. Namboodiripad, "The Air We Breath", Paper Presentedin World Environmental Day Seminar, June 5, 1982, Cochin.
TABLE - 6. 17
Humidity Range During Different Honths in Kerala
Months Humidity rangeJ 58 - 78F 68 - 72H 58 - 67A 68 - 73M 61 - 85J 69 - 93J 78 - 93A 88 - 95Source: George Hathai Tharakan, (1976), 8p.cit. p.36

- 129
TABLE - 6.18
Radio Activity due to Effluents Released FromIRE During 1953 - 1988
Quantity RadioactivityElement tonnes Eiga bq.per mt. Total activity}i.';.?II.‘.}I§7.z """"""" ‘2,}};fI. """""""""" "IQ; """" ';§},f2&;2fE.;'2'§}§Z{2E{"Hesothorium I 2732.48Radiothorium 2732.40Uranium.238 6.73 12.38 b.73xl2.38 = 82.83Uranium II 82.83Radium 226 82.83Radium D 82.83EQEQI”EQQIQQEEIL§£;'§E.'I§§;;'i;Z.f.§;§'J.;£E§E'£;}.'E.; """""""""""""" '§§E:.§'EE.§'"
Biga bq = One billion Becquerel.
Source: Padmanabhan V.T., “A11 Within Limits: Radioactive Waste Disposalat IRE", in Economic and Political Weekly, No. 9, Feb 28, 1987p.382.

TABLE - 6.19
Radioactivity Released fro: IRE During 1953 - 1980
Uranium238
Uranium234
Radium226
Radium210
Thorium232
Hesothorium
Radiothorium
Half lifeyears
4C5billion
248000
1617
18billion
6.75
1.90
P E R I O D1953-61 1962-69 1953-80Activity Quantity Activity Quantity ActivityBiga.bq. tonnes Giga.bq. tonnes Biga.bq.
194.34 0.76 624.35 6.7 82.80
194.34 -— 624.35 -- 82.80
194.34 -- 624.35 -- 82.80194.34 -- 624.35 -- 82.80--- -- -- 673.40 2732.40
6414.80 -- 20608.56 - 2732.406414.80 -- 20608.56 - 2732.40
12839.60 41217.12 8197.20
Economic and Politicgj Weekly. Feb.28, 1987Source: V.T.Padmanabhan"oQ.cit", P-382.

TABLE - 6.28
Radioactive Decay Series - Thorium 232
:1:1:1111:21:-—1ax11¢-:12-—n—-—-11:21;-n1c::::::1:nu—n111:11:u—nu-3113-112::::c—:1—nc-9:-:::::::::2;::Element
Thorium 232 232Mesothorium I 22Hesothorium II 22Radiothorium 228Thorium X 22Thoron (gassions) 228
Thorium A 216Thorium B 21Thorium C 21Thorium C‘ 21Thorium C" 288Lead 288
14 billions yrs.
6.75 years
6.1 hours
1.9 years
3.6 days
54 seconds
8.16 seconds
18.68 hours
68.58 hours
8.888888 seconds
3.7 minutes
Stable
Alpha
Beta
Beta
Alpha
Alpha
Alpha
Alpha
Beta
Alpha
Beta
Beta
Source: V.T. Padmanabhan,"op.cit“ p-383.
Economic and Political

-132TABLE - 5.21
Radioactive Decay Series: Uranium 238
Element Automic Number Half Life Type of Radioactivity13255.11"? ”””””” "£1; """" "3.'«3;1I§I{{;.I';.?;f """"""""" "£1.53; """""""""" "
Uranium X 234 24 days BetaUranium Z 234 6.7 hours BetaUranium II 234 248888 years AlphaIonium 238 88888 years AlphaRadium 226 1617 years AlphaRadon (Gas) 222 3.8 daus AlphaRadium A 218 3 minutes AlphaRadium B 214 27 minutes BetaRadium C 214 28 minutes Alpha/BetaRadium C1 214 8.8884 seconds AlphaRadium C“ 218 1.32 minutes BetaRadium D 218 23 years BetaRadium E 218 5 days Alpha/BetaRadium F 218 138 days AlphaRadium E" 286 4.2 minutes BetaLead 286 Stable -Source: V.T. Padmanabhan, in Economic and Political weekly. Feb.28, 1987,
“op.cit" P.383.

CHAPTER - VII
IHPHCT ANALYSIS
The state of environment in Eloor-Edayar industrial belt wasthe topic of discussion in Chapter six. The major harmfulpollutants present in the area, as identified by the factories,the Board and various other agencies, had been pointed out inthat chapter. As is made known, pollution in our study area isboth natural and man made. Pollution caused by natural forcesimplies, mainly the salinity intrusion. The salinity intrusioncauses hardships and financial losses to the people and theindustries in the locality by way of contamination of the riverand ground water and the industrial water intake points. Even abund constructed at Paathalam to protect the.industrial watersupply points from salinity intrusion, caused further hazardsand problems as described earlier. Here is a rare example for,protection or no protection of the environment creating problemsassociated with it.
The man made pollution in the area through effluents, emis~sions, solid wastes and sound is caused by industrial productionand processing. The categories of contaminants which can havedeleterious effects on water quality include acidity or alkalinity (PH), coloured matters, heated liquids, toxic chemicals,suspended and floating materials, biodegradable and non~bio~degradable organic matters, mineral salts, algal nutrients,foaming agents and bacteria and viruses. The residues, flowedthrough the effluents, of mercury, pesticides such as DDT andBHC, and radio-active wastes do not get treated, nor do we have,at present, any feasible treatment technology for the purpose.

- 134 —
The specific air contaminants produced by industrial production and processing are numerous and will depend upon theindividual operation or activity involved. The most common aircontaminants originating from industrial operations in thelocality are ammonia, oxides o¥ sulphur (S03) and nitrogen(Nflxl, hydrocarbons, carbon monoxide, carbon dioxide,particulate matter o+ carbon origin, particulate matter o+ dustorigin, ¥luorides, chlorine and various organic solvents. Thesolid wastes polluting the environment are the radioactivesubstances containing Uranium 238, mesothorium, barium sulphate,and sodium chloride, gypsum and chalk; packing materials such ascartons, boxes and plastics; tyre residuals, cans and ash resulting from burning; rubble from demolitions; slag heap fromsmelting and other operations; partially concentrated organicsludges from various industrial processing; waste oil andgrease; and stored or discarded unusable materials such asvehicular junk, parts of machinery, oil drums and similaritems. all these pollutants oi di¥¥erent categories are presentin the environment of the area in varying quantities and di+¥ering intensities. Sound is yet another category of contaminantsdeteriorating the quality of the environment in the immediatevicinity o4 the factories.
Various Impacts of Major Pollutantswhen many types of polluting substances are discharged into
the environmental media their quality is degraded to such anextent that their beneficial uses are no longer possible. Noone industrial unit discharges all types of pollutants but the

discharges even in small amounts from different units puttogether can cause irreparable harm. The various impacts ofmajor pollutants are classified as:
1. Impacts on Human Health and welfare;2. Impacts on animals, birds and fishes;3. Impact on vegetation; and4. Impact on structures, materials and aesthetics.
Each of the above categories of imp~.' are briefly discussedbelow:
Impacts on Human Health and Welfare
Polluted water and air, solid wastes and sound, adverselyaffect human health and welfare. Various diseases are caused inpeople directly when they drink polluted water, and indirectly,when they consume life forms grown in such water. Human healthdepends upon the quality of air breathed; and widespread andserious health hazards are associated with poor air quality.Solid wastes produce adverse health impacts by breeding disease
carriers such as rats, mosquitoes and flies, or by contaminatingthe ground and surface waters through leaching and run offduring rains, and by polluting the air through noxious gasesemanating from the heap of such wastes. Similarly sound above acertain level can cause physical and mental ill health.
The presence of organic pollutants in water poses a hazardto public health. In developing countries water borne diseaseslike cholera, typhoid, dysentry and gastroenteritis are very

* 136 common due to the reckless use of water.‘
Exposure to extremely low levels of environmental metalcontaminants such as cadmium, lead, arsenic, copper and theircompounds over long periods can cause permanent ill effects onhealth.” For instance, cadmium is a respiratory poison andcontributes to high blood pressure and heart disease. Lead andlead compounds are abortificients and cause a high rate ofmiscarriages. Lead compounds can also affect skin, gastrointestinal tract, lungs and central nervous system and causelead encephalopathy and lead neuropathy in children. Similarly,arsenic compounds are believed to cause cancer of skin, lungsand liver and may afflict abnormalities in offsprings. Andslightly higher concentrations of copper in drinking water cancertainly render the affected more sensitive and this issuspected to be the cause of certain types of diarrhoea.
One reason why the persistent pollutants such as mercury,pesticides and radio~active wastes pose slow but serious andlong lasting problems on health is the process known asbiological magnification.“ Biological magnification means
/
1. K.C. Sankaranarayanan and V. Karunakaran, "Economic Growthand Environmental Quality", Southern Economist, Vol. 22, No.4, June 15, 1983, p.11. 1
4. Pollution impacts of cadmium, lead, arsenic, copper andtheir compounds are referred to in D. Chakraborti and R.Chakravorty, "Chemicals Pollute Environment", ScienceReporter, August 1983, CSIR, New Delhi, pp.44S—447.
a. Joseph Julian, Social Problems, Printice Hall Inc., NewJersy, (1986), p.541

~ 137 ~
that the concentration of a given substance increases as itascends in the food chain. People who live along the river,inject and store these pollutants with the water they drink andthe fish and other local food they eat. Mercury poisoning leadsto impairment of vision and muscles, and in many cases causesconvulsions, madness, paralysis, coma and death. Exposure toHgCl2 results in the accumulation of mercury into kidney whichis the primary target organ.‘ Mercury, which reacts withoMygen—free mud of the lake bottoms, is capable of beingconverted into a highly toxic form of mythyl mercury and findsits way into man through his consumption of poisoned fish.”
The persistent organochlorine pesticides affect the centralnervous system, reproduction, cardiac metabolism and extensivemascular degeneration causing cancers, birth defects andsterility. An DXFQM study in a few villages in Harnataka in1977 revealed that pesticides had been the reason for a mysterious disease with intermittent pains in the limb and kneejoints which later became so continuous that some could hardlystand up.‘ Twenty five years ago Rachel Carson published"Silent Spring" and warned us in no uncertain terms: "It is ouralarming misfortune that so primitive a science (appliedentomology) has armed itself with the most modern and terribleweapons and that in turning them against insects has also turned
4. L.E. Hinde Jr. and N.C. Loring, The Effects of Men Ma eEnvironment on Health end Behaviour, Castle HousePublications Ltd., Atlanta, USA, (1979), p.B
5. Ibid.6. N.N. Sachidanand, "The Growing Pesticides Hazards", The
Hindu , June 24, 1983.

- 138
them against the earth."7 A large number of pesticides havebeen found to produce one or more of the following problems inman and animals: cancer, congenital deformities, liver andkidney damages, vomiting, ulcer, cholinesteras inhibition,deleterious effects on the central nervous system, sterility,leukaemia, convulsions, etc.” It is reported that there arean estimated 3,7S,B8B cases of human poisoning by pesticides indeveloping countries every year with some 18,888 deaths.”There has been a callous neglect and disregard of the health ofthe people of India with regard to policies concerningpesticides import, manufacture and use. Pesticides which arebanned or highly restricted in developed countries are beingimported to India and also being manufactured locally.1° Itis shocking to notice that HIL produces insecticides which arebanned for use or sale (eg. DDT, endosulphan, etc.) in most ofthe developed countries.
among the presistent pollutants radio~active substances aremost dangerous. The radio~active isotopes retain their potencyfor many years and even centuries with an increased potentialfor damages to human health in terms of higher incidence of
7. Carson Rachel, Silent Spring, Fawcett Publications Inc.,Greenwich, Connecticut (1962), p.262.
8. FAD, Pesticides Residues in Food: 1982 Evaluations, Plantproduction and Protection Paper 49, Rome (1983), pp. 1~427,.
9. Almeida, N.F., "The Dangers and Precautions", world Heslth,August/September 1984 pp 18~12 referred to in Economic andPolicitel Weekly, March 28 (No.13) 1987. pp. A23-28.
18. Dinesh Mohan, "Food vs Limbs: Pesticides and PhysicalDisability in India", Economic end Politicel Weekly, March28, (No.13), 1987 pp. A23~28.

- 139 —
cancer and genetic defetcs. Health effects of radiation areclassified into two: Stochastic and non~stochastic. Stochasticeffects are "those for which the probability of an effect occurring rather than its severity is regarded as a function of dosewithout threshold. Non stochastic effects are those for which athreshold may therefore occur.“11 According to the International Commission on Radiological protection which recommendsthe standards for radiation, cancer and genetic disorders arestochasitc effects.12 Bofman, an authority on radiation andhealth, considers genetic effects as non-stochastic.13 Otherdiseases caused by radiations are impairment of fetility,haematological deficiencies, cataract of lens, non malignantdamage to skin etc. There are some medical resarchers whostrongly feel that radiation causes heart diseases also. Allthat is needed to trigger the process of carcinogenesis isdamage to a chromosome or gene of a single cell. There arebillions of cells in the human body and each cell has 46chromosomes and 2S,@@@ to 1,BB,@@@ genes (cells in gonads and
ovaries have 23 chromosomes). any alteration of the deoxy—riboneucleic acid (DNA) which is the information base for theenormous biochemical capabilities of the cell, includinginstructions for carrying out the process of cell reproductioncan lead to loss of cellular control or cellular regulation.This loss of control results in proliferation of cells leading
11 ILD, Encyclogaedia of Occupational Health and Safet ,Vol.11, Geneva, (1983), p.186?
12. Ibid.'—I'a. Gofman John, w., Radiation of Human Health, Pantheon Books,
New York (1983), p.404

- 140 to the formation of a tumour.1“ If the insult is directedagainst a cell in gonad or ovary, the effect is transmitted tothe next generation. The cell death through radiation leadsalso to impairement of fertility. It is also noted that thenumber of harmful genes carried in the permanent genetic loadmaterial of a generation is undoubtedly much larger than wouldappear from the number of live-born offsprings with visibledefects and that increasing the genetic load may not haveimmediate dramatic results.15
Increase of acidity in water with P” values less than 6and increase in alkalinity with P” values more than 8 areconsidered as injurious to human health. Oxides of sulphur andnitrogen react with atmospheric oxygen to form their respectiveacids. They directly or through rain acidify the soil, andsurface and ground waters progressively. The acidic waterdissolves metals in the soil and moves to the ground watercasuing its pollution. Therefore polluted ground water has allhealth impacts of metal poisoning.
Sulphur dioxide attacks lungs and other parts of the respiratory system and causes pulmonary diseases in man. Nitricoxide reduces the oxygen carrying capacity of blood and nitrogendioxide damages lungs and causes eye irritation. Carbon
14 Bertell Roosalie, Handbook for Estimating Health Effectsfrom Exposure to Ionisino Radiation, Institute of Concernfor Public Health, Toronoto Canada, Ministry of Concern forPublic Health, Buffalo, USA and International RadiationReseeach and Training Institute, Burmingham, U.H. 1984, p.55
15. Ibid.

— 141 ~
monoxide affects body metabolism due to its higher affinity tohaemoglobin; and inflicts headaches and retards physical andmental activities at higher concentrations. Hydrocarbons areable to unite with the oxides of nitrogen through reaction insunlight to produce the phenomenon of smog. Visibility problemsand breathing difficulties are the two major results of smog.when combined with carbon monoxide emissions it constitutesserious health hazards. Also some hydrocarbons present in theair are suspected to cause cancer.1“
Air pollutants such as ammonia, chlorine, flourine and theircompounds are also well known for their adverse health effects.Even small amounts of ammonia affect the conjunctiva of the eyeand cause cough in high concentrations. Similarly, chlorineaffects the respiratory tract with symptoms of choking andsuffocation. Higher concentration of chlorine causes burningpain and a sense of constriction of the chest aggravated bycoughing. Small concentrations cause continuous headache andepigastric pain. In severe cases chlorine causes pulmonaryocdeman and pneumonia along with skin irritation.17
Absorption of minute fractions of flourine causes nausea andvomiting, abdominal pain; salivation, puritas and diarrhoea.Being a highly reactive substance fluorine rarely affectsdirectly but through its compounds. Hydrogen flouride even insmall concentrations attacks larynx and trachea giving rise to
16. D. Chakraborty and R. Chakravorty (1983), o . cit, p.44617. Ibid

- 142 ~
cough and haemophysis. High concentrations can cause evenrespiratory paralysis. The ultimate result is slow ulcerationof gums, mucosa, larynx, bronchitis and conjunctivitis.19(Major health impacts of some of the air pollutants are given intable 7.1)
Sound, if allowed to be transmitted above 80 decibels, is asharmful as poisonous gases. It can inflict psychological,physical, nutritional, phylogenic, pathological and neurologicaldamages. Sound above 88 decibels can cause permanent deafnessand above 15@ decibels can be fatal.1” Employees of thefactories become victims of sound induced deafness and suffergreater hearing losses with advancing age. Also, noise above acertain level significantly contributes to the tension level ofdaily life, sometimes even precipitating stress related illnesssuch as peptic ulcer and hypertension. Noise may also contribute to cardiac and cirulatory diseases and it may culminatewith other stresses.2°
Impacts on Animals, Birds and FishesAnimals have differing threshold limits to pollutants from
man. In all other respects the impacts of various pollutants onanimals are similar to that on man. Therefore a lengthydescription on such impact is not made to avoid repetition. In
18. Ibid
19. News Report, Indian Express, July 39, 1983, p.5EB. DEED, The State of Environment in DEED Member Countries,
Paris (1979), p.114; Also see, Joseph Julian, 1986, op.cit., p.546
-143
the absence of discretionary selection powers in animals theyare more quickly affected by various types of pollutants thanman. Further, animals are affected not only through theconsumption of polluted water and the breathing of contaminatedair, but through food also due to the deposition of contaminantson vegetation and forage.
Pollutants can destabilize an aquatic ecosystem when theycontaminate water bodies. Disturbances in aquatic environmentin many ways can impair the health of organisms living in waterand may lead to large scale fish hills. The effluents discharged from factories are often hot enough to cause temperaturechanges in the receiving stream. Rapid changes in temperatureare extremly dangerous to aquatic life and when the optimumrange of temperature in water bodies is violated the organisms
move to another location or die; and also, interrupt the regularspawning~migration involved in the biological cycle of manyfishes.21
Drganic matters discharged into the water courses increasethe biochemical oxygen demand (BOD) in the process of degradingthem and thereby deplete the dissolved oxygen (DD) supply inwater. The depletion of dissolved oxygen results in a change inthe composition of organisms that inhabit a stream. when thedissovled oxygen level drops below approximately 5 mg/l, themore desirable species of fish such as trout and bass leave thearea and coarser types predominate. Below an oxygen demand
21. E. Joe and Middle Brooks, Industrial Pollution. Vo;.I. JohnWiley and Sons, New York (1979), pp.1-2

~144 ~
level of approximately 2 mg/1 fishes disappear and theenvironment shifts towards anaerobic species.22 Similarly theaddition of nutrients such as phosphorous, nitrogen and traceelements can‘ result in excessive algal growth and when thisgrowth dies, it can exert a higher oxygen demand which may causefish kills as well as produce unpleasant odours and tastes.33
Floating solids, grease and scum are unsightly and canaffect aquatic characteristics such as oxygen transfer and lightpenetration. Solid sediments can form sludge blankets whichdecompose and produce odorous gases and floating mats on thesurface of the water body. Blankets of solids also interferewith the natural organisms which live attached to the bottom ofthe water bodies. Fish hatching is also impeded by solidsediments. Suspended solids can retard the growth of aquaticvegetation necessary for the survival of other life forms in thestreams and lakes.2“
Air pollutants like oxides of sulphur and nitrogen can alsoharm fishes and other aquatic organisms through acidification ofwater. acidified water dissolves toxic metals and causes metal
lic poisoning, of the fishes. Fishes have often been found tohave disappeared completely in acidified water bodies. Studieshave shown that all normal aquatic life forms are distroyed at
H |'.} I--I U" H. [1
t--J lI.- 1 I--I E!’ 1.: . EL
I") -F‘-‘v I--! U’ 5 CL

-145
p“ values less than S and damages start at p“ less than6.5.25
Birds are affected through polluted water and air, and byfeeding on contaminated food. Ordinarily, various impacts ofpollutants on birds are of less immediate concern except whendomestic birds like fowls and ducks etc. are affected. It isknown that feeding on food contaminated by persistent pollutantscause eggs to develop thin shells that constantly break beforehatching.2“ But generally, the impacts of pollutants on birdsare similar to those on man and animals.
Impacts on Vegetation
Pollution renders water unsuitable for irrigation. Thecombination of low PH water in the soil creates a situation inwhich the trees may absorb much of its nutrition. Theconsequence is that the tree loses vitality and becomes highlysusceptible to injury by other external factors. It is easy tosee then, that the tree is sick. First the needles turn brownand fall off at the top of the tree. The tendency to shedneedles spreads over the whole tree. Next, branches break awayand even the top of the tree may snap off. Trees thus attackeddie slowly but surely. Further, through the acidification ofthe soil and surface waters, important plant nutrients such aspotassium, magnesium and calcium are leached out of the ground
25. National Swedish Environmental Protection Board, SwedishMinistry of Agriculture, Acidification: A Bottomless Threatto our Environment, Solna (1983), pp.23-24
26. Joseph Julian (198m) o . cit, p.529

~ 146
and are thus lost to trees and plants. Similarly, the damagesby the acidification of moisture in the atmosphere begin on thefringes of a collection of trees. Scraggy trees and those thatsoar high above their fellows are the first to be attacked.37
Pollutants which are known as photo~toxicants are sulphurdioxide, peroxy acetyle nitrate and ethylene. Df somewhatlesser severity are chlorine, hydrogen chloride, ammonia,mercury and oxides of nitrogen. Sulphur dioxide of the firstlist and all in the second list are present in the area.Generally, gaseous pollutants enter the plants with air throughthe stoma in the course of normal respiration. Once in the leafof the plants, pollutants destroy chlorophyll and disruptphtosynthesis.29 Damges can range from a reduction in growthrate to complete death of the plant.
Damages to plants caused by sulphur dioxide occur at levelsfar smaller than those at which humans are noticeably affected.Some crops such as alfalfa have shown physiological disorders atlevels as low as 6.02 to B.@5 ppm. A number of vegetablesfruits, nuts, and forest crops are also sensitive to sulphurdioxide at such low levels of intensity. Sulphur dioxide, whenit reacts in atmosphere, can gradually change into sulphateswhich affect several plant functions such as growth, photosynthesis and respiration.29 The direct affects of the oxides
27. National Swedish Environmental Protection Board (1983), op.PUB!ES. Seorge Mathai Tharakan, op. cit. (1976) Chapter IV.29. Ibid.,

~ 147
of nitrogen on ecosystems are not as large as those of theoxides of sulphur or phtochemical oxidants at similar concentrations. It is the role of oxides of nitrogen in the formation ofphotochemical oxidants that present grave concern, and that isconsidered the most harmful of the air pollutants affectingcrops and plants.3° adverse impacts of chlorine, hydrogenflouride, ammonia, mercury and sulphuric acid mists are given intable 7.2.
Pesticides and fertilizers damage plants in a severe mannerby killing the earth worms, nature's manure manufacturers.Solid wastes kill the valuable and rare vegetation by thedumping of junk, oil, rubble, and similar materials. It candestroy grasses and cause siltation of soil by inundating theland with run off water.
Impacts on Structures, Materials and AestheticsThe discharge of industrial contaminants to the water medium
can produce general effects causing water to appear aesthetically undesirable. Water which appears polluted is never fullyused resulting in the general degradation of the area. Pollutedwater causes or increases corrosion of all types of materialswith which water comes into contact. It can lower the land useand monetary values of land surrounding the water. Wastes inthe water encourage the growth of undesirable bilogical life,often in excessive quantities, to interfere with the domesticand recreational uses of water for bathing and boating etc.
am. Ibid.,
- 148 —
Above all, pollution makes water unsuitable for industrial use.acidification of lakes and water courses can exert an iniluenceon the rate o4 corrosion su¥fered by metallic materials; forexample, sluice gates, cement dams, and piping in power stationsand road culverts made of galvanized steel and cast iron pipes,concrete Toundations and lead jacketed cables. They represent alot of invested capital and any corrosion that occurs isthereiore o4 importance.
The air pollutants can affect materials by soiling orchemical deterioration. High smoke and particulate levels areassociated with soiling oi clothing and structures. Very smallparticles in the air have a great ability to scatter visiblelight. This makes the air hazy. Such haze can afiect theclimate, most noticeably in the industrial areas. Atmoshpericcorrosion oi important materials is the very well documentede+$ect o¥ air borne sulphur compounds. In this respect otherpolluting gases play only a subordinate role. Among thematerials that are liable to suffer damges are unprotectedcarbon, steel, copper materials, nickel and nickel plated steel,aluminium materials, stainless steel, steel painted with rustresistants and sand stone and limestone. They can also dodamage to plastics, paper, leather, textiles, plaster andelectrical contacts.31
31. Elliott H. Blaustein, Pose T. Blaustein and Peter Breenleai,Your Environment and You: Understanding the PollutionProblem, Dcceana Publications Inc., Dobbs Ferry, New York,(1974), pp. 115~125

-149
Solid wastes also produce adverse-impact on land as theformerly used land has now become a waste land by storing orburning of industrial waste products. Solid wastes can producethe general non-aesthetic effects of bad odours such as the one‘caused by the decomposition of organic matters from storedsludges or oil. Fires and explosions may also be caused byimproperly stored building materials, oils etc.
It is possible to calculate with a fair degree of accuracywhat the corrosion of technically important materials andstructures cost in term of cash. But a problem of a differentkind is the corrosion damge to irreplaceable objects and monu~ments of cultural value that are made of sandstone or limestone. Nhen such relics of the past are destroyed, it is notonly a loss to the country concerned, but it is also somethingthat detracts from the common cultural heritage of all.
Specific impacts Identified in the Project AreaThe project area has all sorts of public activities.
Residential areas and public places like schools, hospitals,temples, churches and mosques are all situated scattered apartfrom various industrial and commercial units. The reduction inthe quality of environment through contaminated water, pollutedatmosphere, pollution by solid wastes and by sound can causeuntold adverse consequences on people, domestic animals, fish,agriculture, materials and structures of the area.

Impacts on People
The ground water in the area half a kilometre inland on bothsides along the one kilometre stretch of the Eloor branch ispolluted. This area measures one and a half square kilometresinhabited by approximately 2100 people and 322 households on37.5 hectares of land.32 The well water here is unsuitablefor domestic consumption and therefore, the people of the areaare required to depend on public water supply. The river waterpollution has affected the households of more than 5% fishermenengaged in fishing activities along the river in this areaalone. They are now displaced and must find out alternativejobs since the branch does not contain fish in large quantityand the fish has become poisoned. The river water is notsuitable for bathing and irrigation. The people of the areahave complained of hair~loss and skin diseases when they bathedin the river. They have also revealed that some fishermen areengaged in fishing activities in the river and they sell offtheir catch at far away places to people who do not know thatthe fish is poisoned.
The area with a 5 kilometre radius around the industrialbelt suffers from serious air pollution. The impact of airpollution on people and resources in the area between S and 1%kilometers around the industrial belt is considerable only at
32. The Density of population in the area is considered as 1396which is the average of that of Parur Taluk and filwaye Talukin which the affected area is spread. Density of Population:Parur Taluk = 1674
Alwaye Taluk = 1119Source: Census of India 1981, Government of India, 1982

certain times and beyond this, the problem is insignificant.Therefore the impacts of air pollution on an area (3.14 x 5 K 5)78.5 square kilometres inhabited by approximately (78.5 K 1396)189586 people and (189586/6.5) 16859 households on (78.5 x 25)
1968.5 hectares of land are required to be studied.
In the present study, 188 households in the area with 652people are surveyed under the household survey. Those households have been selected at random from three panchayats overwhich the affected area is spread. The three panchayats areEloor, Halamassery and Kadungallore. Of the households surveyed35 belonged to low income group (yearly income upto Rs.6888) 38households belonged to lower middle income group (betweenRs.é881 and 12888), 25 households belonged to upper middleincome group (between Rs.12881 and 18888) and 18 householdsbelonged to high income group (Rs.18881 and above). The number
of people studied are 235 from low income, 192 from lower middleincome, 167 from upper middle income and 58 from high income
group. Table 7.3 gives the details on the impacts of environ~mental pollution on the health of the people of the area withinformation such as various income groups, households surveyed,number of people affected and the percentage of affected peopleto the total population surveyed. It was found that approximately 47 per cent of the people surveyed are suffering from oneor more diseases identified in the area. health impacts on lowand middle income groups are considerably higher than that onthe high income group of people.

The diesases identified in the area are cough and bron~chitis; breathing trouble and asthma; headache; stomach pain,gas trouble, vomiting and loss of appetite; fever, shivering andbody pain; eye irritation; children's T.B.; and various skindiseases. The percentage of people affected by these diseases(except for children's T.E. and skin disease) in various incomegroups are given in table 7.4. Approximately, 7.54%, 13.84%,11.982 and 18.842 of the people are affected in low, lowermiddle, upper middle and high income groups respectively. About44% of the people are suffering from one or more diseasesidentified and given in the table.
Many complaints have been received by local panchayatauthorities, Ernakulam Collectorate and also by some of thecompanies directly, from the people of the area pointing to thehealth hazards caused by the careless emission of pollutants.Several asthma and T.B. patients have requested some of thecompanies at least to have high stacks so that the pollutantsmay get dispersed more efficiently reducing their harmfuleffects. Doctors in the area are of the opinion that there is avery high incidence of these diseases in this locality comparedto other localities having no environmental pollution. Theresults of the hospital survey could not be used to arrive atany definite conclusion. A disease~wise classification of casesof illness in the area could not be made scientifically, mainlydue to the improper maintenance of hospital records and lack ofuniformity in the process. Maintenance of records is perhapsnot meant for any further scrutiny by any researcher or anybody
u""'I'‘nu- ldfl
else. However, the interviews and discussions with some of thedoctors in the area were very useful in understanding theseriousness of the problem. They expressed with certainty, theview that cases of children's T.B., eye diseases and asthma inthe locality can be attributed only to atmospheric pollution.They have advised some of the patients in the locality to shifttheir residences if they wanted a permanent cure for theirillness. During the survey 11 households voluntarily expressedtheir readiness to move from the locality to any far away place,the moment they can sell off their property at a remunerativeprice. It was particularly noted that many people in thelocality, especially of the low income group, have not undergoneany medical check up and they do not know from what all diseasesthey suffer.
People of the locality have organised‘dharna’against theproblem, several times during the last few years before thecompanies, collectorate and panchayat offices to redress theirgrievances. The result was, so far, not positive. They alsowonder why one of the companies which has a high stack does notuse it for emitting polluting gases prefering to use low stacksinstead.
During the factory survey some of the employees revealedthat,in the course of the previous year, they had to run awayfrom their offices more than three times due to the leakage ofSD; or NH; from some of the factories. They suffer from allthe diseases mentioned above and they are of the opinion that

— 154 ~
the factory workers su¥fer from hearing problems with advancingage due to sound pollution. In their opinion, the +actorieshardly go beyond propaganda in their pollution control effortsand they accuse each other for the problem.
Of late, it has been observed that Cochin city is occasionally enveloped by a mist like Tormation. The School of Environment Studies of Cochin Uninversity has reported that such mistlike iormations contain ammonia, the concentration of which attimes rises above the toxic level. Those who pass through thismist~like formation very o¥ten complain of a Toul smell, burning
sensation in the eyes and breathing difficulties.33 Anexperiment conducted by the Department of Physics of CochinUniversity using laser beams revealed that the concentration ofair pollutants in the area is most intense during night between12 pm and 3 am.3“
In a letter addressed to the Prime Minister, Pro+. K.V.Thomas (M.P. Trom Ernakulam) alleged that 14 workers of IRE diedo4 cancer between 1978 and 1984 (letter to the Prime Ministerdated April 19, 1985). The Prime Minister in his reply promisedto examine the issue (Prime Minister's letter dated April 23,1985). Earlier, in a memorandum addressed to the Prime Minister
55. H.C. Sankaranarayanan and V. Harunakaran,”Economic Growth 8Environmental Quality,"Southern Economist, June 15, 1983,pp.11~12.
34. M.K. Satheeshkumar & C.P.S. Vallabhan, A Photoacoustic seup {or Atmospheric Attenuation Studies Using He Ne LazerEgam, Dept. of Physics, University of Cochin, Kerala, 1985,p.52 .

- 155 ~
all the recognised trade unions of IRE had pointed out that thehigh incidence of cancer among workers can be attributed toradioactivity (memorandum to the Prime Minister undated).35The study conducted by V.T. Radmanabhan on the incidence ofcancer, heart diseases and mortality rate among IRE workers incomparison with T.C.C; workers and employees registered atEmployees State Insurance Corporation (ESIC) reveals thatincidence of cancer, heart disease and total mortality among IREworkers are respectively 4.62, 2.24 and 2.72 times larger thanthat among T.C.C workers. The incidence o¥ cancer and heartdiseases among IRE workers are respectively 6.77 and 2.72 timesmore than that among employees registered with ESIC (see Tables7.5 and 7.6). Further the study points out that the incidenceo4 sterility among IRE workers and genetic disorders among theiro¥¥springs are seemingly higher than their spontaneous occurence
in the general population.3°
The employee wel¥are survey conducted in 125 employeehouseholds containing 131 employees of the Tactories o¥ the area- all residing in the project area - was aimed at ¥inding outthe occurrence o+ various diseases among workers and their¥amily members. The summary results of the survey are given intable 7.7. As the table reveals more than 36 percent o¥ theemployees are aiiected by one or more diseases listed in table7.8. DI the 812 members o4 the employee households, more than39 percent are the victims of those diseases. Children are the
35. V.T. Padmanabhan,Economic and Political weekly, Marco B-15,(19BS),pp.449-51

worst hit and they are suffering mainly from respiratory and
skin diseases, genetic disorders and primary complex. Thirtyeight percent of the children and 27.5 percent of the grown-upsincluding employees of the households are affected by one ormore diseases. Details of occurrence of various diseases amongemployees, children below 15 years and grown ups other thanemployees and their respective percentages to the totallyaffected and to the population of the households etc. are givenin table 7.8. Further, during the survey it was noticed that insome households all members were suffering from asthma and insome others all members were suffering from skin diseases likeallergic itching and black spots or white patches all over thebody. The occurrence of genetic disorders among childrenreported during the survey are photo~dermatitis, congenitalcardiac disease, weakness of limbs, malformation of one side ofthe face and mental retardation. About 15 cases of abortionwere reported from those households during the survey. Some ofthe incidences particularly noted were:one woman had abortionfour times and each time after four months of pregnancy; firstpregnancy getting aborted was a usual occurrence in some cases;two women suffered from abortion twice; menstrual irregularitiesare reported in some; one woman gave still birth thrice; andpremature birth was reported in one case.
Impacts on Domestic Animals and Fishes
The 1B@ households as per the household survey, bring uptotally 379 domestic animals including birds. Only three typesof domestic animals are found to be maintained in the locality.

Table 7.9 gives particulars on the number of domestic animalsbrought up by different income groups in the affected area. Onthe basis of survey results the total livestock population inthe affected area in three panchayats is (379 / IBB x 16859)about 63895, including birds. Fowls exceed the cattle and goatsin number. The households presently surveyed do not keepbuffaloes and ducks as there is no unpolluted water bodies inthe locality.
The domestic animals in the area suffer from conjunctivitis,bronchitis, skin diseases and various gastro~intestinaldisorders. A high incidence of death of animals has beenreported during the survey. Veterinary doctors have pointed outthat the main reason for frequent animal deaths in the area ispollution through feed and through the breathing of the pollutedair. es was observed during the survey, the high income groupof people are more careful about maintaining, and treating theirlivestock as soon as the symptoms of illness are noticed.
In the immediate locality there is only one Veterninaryhospital at Eloor. The doctors there firmly believe that thehigh rate of abortion and infertility seen in cows is because ofthe problem of pollution from fluorine and fluorides. Accordingto them the number of cattle attended to during diseases is lowpartly due to lack of adequate hospital facilities and partlydue to carelessness of the people. In their opinion moreinformation could be obtained with a detailed investigation.

~ 158
In recent years, there has been a number of newspaperreports about fish mortality due to water pollution in thebackwater and the Periyar river near Eloor-Edayar industrialbelt. In a paper presented at the Seminar on "Status ofEnvironmental studies in India" held in March, 1981, atTrivandrum, the School of Environmental Studies, CochinUniversity has pointed out that +ish mortality in the waters inand around Greater Cochin area is caused by the presence ofammonia as well as mineral acids contained in the e++luentsdischarged from the industrial belt. It has also been pointedout that the quality o+ Iish has deteriorated considerably inthese polluted waters.37
It is urgently required that strict measures are adopted tokeep the level o¥ industrial pollution of the Vembanadu Lakewithin prescribed standards to save the rich Iish ¥auna of thelake. According to the "Studies on Systematics and Biology ofthe Fishes in Vembanadu Lake” by Dr. B. Madhusoodana Kurup ofthe Department oi Industrial Fisheries of Cochin University, theEloor~Varapuzha region of the lake has already been turned intoa barren area for fish due to the discharge of industrieale+¥luents.33 The study points out that mass mortality offishes is encountered during the pre~monsoon period and this maybe due to the reduction of water discharge {rem the adjoiningrivers with the result that the effluents from the factories do
37. Dr. H.C. Sankaranarayanan & V. Harunakaran, SouthernEconomist, June 15,1983, op.cit p~12.
38. News Report, "Check Pollution to Save Vembanad Lake", inIndian Express , July 18, 1982, p.3.

not get diluted and washed away as in the monsoon season. Highlevels of mortality were observed among Tish species likeanchovies (kozhuva), cat fishes (koori), pearlspot (karimeen),glassy perchlets (nandan), barbs (parel) silver biddies(prachil), sprats (soochi~kozhuva) and half beak (murashu). Thepollution of water bodies also interrupted the regular spawningmigration involved in the biological cycle of many fishes o¥Tresh water and estuarine species.37
Impacts on AgricultureThe impacts of environmental pollution Trom the industrial
belt spreads to an area o¥ (78.5 H 25) 1962.5 hectares oi land.The net area sown is 77.61 percent o4 the total geographicarea. Since 38.43 per cent of the total geographic area is sownmore than once a year, the total cropped area exceeds the geo*graphic area by 8.84 per cent as per statistics on agriculturalland use pattern in Ernakulam District.4° Accordingly, thetotal cropped area affected in the locality is (19b2.S H 188.4 /188) 2128.285 hectares. Land use pattern in agriculture withdetails of net area sown, area sown more than once a year, totalcropped area and their percentages to total geographic area inthe district and in the state is given in table 7.18.
In table 7.11 the percentages of areas under food crops andnon food crops, net area sown and area sown more than once a
39. Ibid
48. Government of Herala Season & Crop Report of Kerala State,1977-78, Directorate of Economics and Statistics,Trivandrum,(1982), p.38.

- 168
year respectively to total cropped area are given. About 65.26per cent of total cropped area is allocated for food crops and34.74 percent for non food crops. Net area sown is 71.83 percent and area sown more than once is 28.17 per cent of thecropped area.41 Accordingly, in the locality, of the 2128.285hectares of cropped area, about 1383.7 hectares are used forfood crops and 736.585 hectares for non food crops. Net sownarea is 1523 hectares and area sown more than once a year is597.285 hectares.
Major crops cultivated in the area are paddy; coconut; fruit
trees like banana, mango and jack; tapioca and vegetables; andpepper and ginger. These crops together occupy 1735.829hectares which is 81.83 per cent of the total cropped area.among other crops which occupy 18.17 per cent of the croppedarea, arecanut consumes the largest portion of land, specifically 2.14 per cent of the cropped area. Crops like rubber,tea, coffee, betel leaves etc., which are included among othercrops occupy only a small portion of land. The area used formajor crops in the locality and their respective percentages tototal cropped area are also given in table 7.11
we can observe in the area plants of different crops atvarying stages of destruction. "The damages range frombleaching of the leaves and turning of the green colour toyellowish brown, to total snapping off and drying off of thetrees. The trees that soar high above others are found most
41. Ibiq
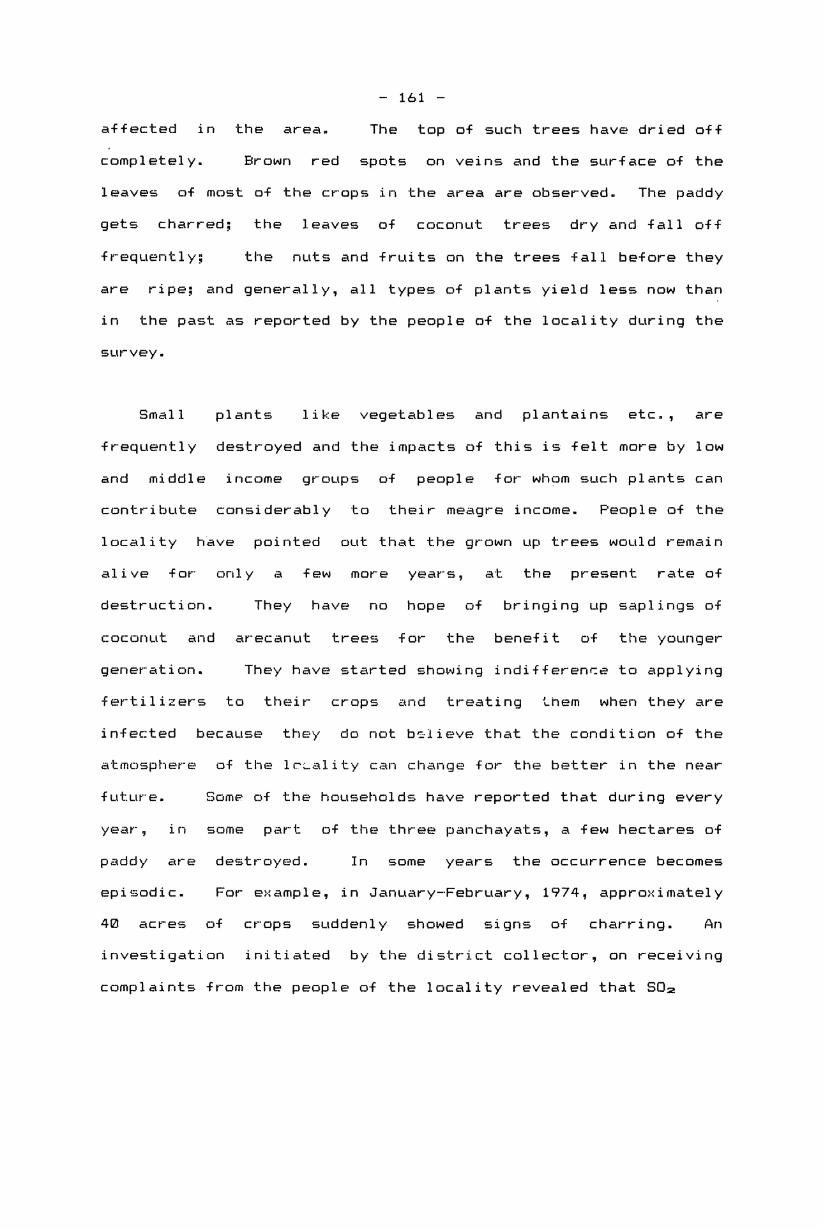
- 161 ~
affected in the area. The top of such trees have dried o¥¥completely. Brown red spots on veins and the surface o¥ theleaves of most of the crops in the area are observed. The paddygets charred; the leaves oi coconut trees dry and fall o¥¥frequently; the nuts and Truits on the trees Tall before theyare ripe; and generally, all types of plants yield less now thanin the past as reported by the people o4 the locality during thesurvey.
Small plants like vegetables and plantains etc., areTrequently destroyed and the impacts of this is ielt more by lowand middle income groups of people for whom such plants cancontribute considerably to their meagre income. People oi thelocality have pointed out that the grown up trees would remainalive for only a few more years, at the present rate ofdestruction. They have no hope o¥ bringing up saplings ofcoconut and arecanut trees for the benefit of the youngergeneration. They have started showing indi¥ference to applyingfertilizers to their crops and treating them when they areinfected because they do not believe that the condition of theatmosphere of the locality can change for the better in the nearfuture. Some o¥ the households have reported that during everyyear, in some part of the three panchayats, a few hectares ofpaddy are destroyed. In some years the occurrence becomesepisodic. For example, in January~February, 1974, approximately4@ acres oi crops suddenly showed signs o+ charring. Aninvestigation initiated by the district collector, on receivingcomplaints from the people of the locality revealed that S02

of FACT and Chlorine of TCC were responsible for the dam—age.“2 To cite a more recent example, hectares of paddyfields in Eloor Panchayat were suddenly destroyed due to a heavyaccidental emission of SD; from FQCT on September 1, 1983.The collectorate officials supervised a detailed survey forassessing damages caused by this accident. Their roughassessment revealed that damages on crops alone amounted to ahuge loss. The official report is yet to be published. Inshort, agriculture in this locality can be said to be agambledepending on the success and failure of factory stacks andmachinery engaged in industrial production and processing.
Impacts on Materials and StructuresVisibility reduction and fog formation are two serious
effects noted in this area. In rainy season visibility in theroads of Eloor is very poor. Most of the motor vehicles havetheir head lights on even in day time during this season.People cannot recognize each other even at a distance of 2%feet, at times. Similarly, fog formation which is a regularfeature during rainy season spreads to a distance in radius from3 to 4 kilometres. It is known that the number of road accidents is rgreater in the Ernakulam District than in any otherdistricts in the state. This may also be due to atmosphericpollution of the area.
42. N.S. Mony, Primary & Interim Report on Paddy Charring inEloor (1976), in George Mathai Tharakan, op. cit Chapter IV.

-—1e..‘3:-—
Causes of motor vehicle accidents in Herala are classifiedas.43
1. Fault oi driver o+ motor vehicle.2. Fault of driver of the other motor vehicle.3. Fault of cyclists.4. Fault o+ pedestrians.5. Mechanical defects.6. De¥ective road surface.7. Bad weather conditions.8. Other causes.9. Causes not known. fitmospheric pollution is not
considered as one of the reasons for accidents in of+icialrecords, as it is not a common cause for accidents in all thedistricts. ficcidents due to polluted atmosphere may beconsidered under the last three categories of causes listedabove; namely, due to bad weather conditions, other causes, andcauses not knowny
Table 7.12 gives some important in¥ormation on motor vehicleaccidents in the state, Ernakulam district (which reports thegreatest number o¥ accidents in the state) and Idukki district(which reports the smallest number of accidents) during 1978.The number of accidents and casualities are the highest forErnakulam District. The number o$ accidents and casualities due
to causes including environmental pollution is also the highestfor this district.
'7"4. Government of Kerala, Industries and Industrial Labour &Infrastructure, Transport and Industries Division, StatePlanning Board,Trivandrum, June(19B@), p.285.

~ 164 ~
The problem ‘o4 corrosion in the area is serious. Residentsof more than 70 per cent of the households surveyed reportedthat they are required to plaster and/or whitewash their housesevery year. This requirement in other places is normally onlyonce in three or more years. Their iron gates, window bars,grills and door locks etc., get rusted quickly and they arerequired to repair and paint them frequently. Some of themshowed the worn out electric contacts in their houses whichwere constructed not even 16 years ago. The cost per householdof different income groups incurred on maintenance of structuresand materials is considerable.

- 165
Table - 7.1
Health Inpacts of some of the Hajor air Pollutants
1. Total suspendedparticulates (TSP)
2. SulphurdioxideS02
3. Carbon-Monoxide(CD)
4. Photo-chemicalDxidants (0,)
Nitrogen-dioxide(N02)
U1
6. Hydro Carbons(HC)
Directly toxic effects or aggravation of the effects of gaseouspollutants; aggravation ofasthma or other respiratory orcardio-respiratory symptoms; increased cough and chest discomfort; increased mortality.
Aggravation of respiratorydiseases including asthma,chronic bronchitis and emphysema,reduced lung function; irritationof eyes and respiratory tract;increased mortality
Reduced tolerance for exercise,impairment or mental functionimpairment of foetal development,aggravation of cardio-vasculardiseases.
Aggravation of respiratory andcardio-vascular illnesses;irritation of eyes and respiratory tract; impairment ofcardio pulmonary function.
Aggravation of respiratory andcardio vascular illness andchronic nephritis
Suspected contribution tocancer
U.S. NationalAmbientsstandards(in Ug/m3)
Primary:Annual = 75
24 hour =26BSecondary:24 hour =15@
Alert:24 hour =375
Primary:Annual = 8624 hour = 365Alert:24 hour = BBB
Primary:8 hour
II II
I S S S S
1 hour 4@,B@BAlert:8 hour =17,BBO
Primary:1 hour = 160Alert:1 hour = 260
Primary:Annual = IBBAlert:24 hour = 2821 hour =1l3@
Primary:3 hour = 160
World Bank/August 1978, Environmental Considerations for theIndustrial Development Sector, Washington D.C. pp.2-5
Source:

- 166
Table - 7.2
Pollution Effects on Vegetation
Pollutants Symptoms Maturity of Injury Thresholdleaf affected Part of Vol. Sustainedleaf exposure
affected (ppm)
Sulphur- Bleached spots, bleached Middle aged MissophyllDioxide areas between veins, most sensi- cells 0.03 8 hours
chlorosis, insect injury tive & Oldestwinter and drought condi- leaves sensitions may also show tivesimilar markings
Hydrogen Tip and margin burn, Youngest Epidermis O.1 5 weeksFluoride devarfing leaf abscission leaves most and Hisso-(ppb)
narrow brown and red band sensitive phyll cellsseparates necrotic fromgreen tissue
Chlorine Bleaching between veins, Hature leaf Epidermis O.1 2 hourstip and margin burn, most sensi- andleaf abscission tive Missophyll
cells
Ammonia Cooked green appearance Mature Complete 2O 4 hoursbecoming brown or green leaf most tissuedrying, overall blacken- sensitiveing of some species
Hydrogen Acid type necrotic Oldest Epdermis S-IO 2 hoursChloride lesion, tip burn on leaves most and misso
fir needles; leaf margin sensitive phyll cellsnecrotis on broad leaves
Mercury Chlorosis and abscission, Oldest Epidermis 1 -brown spotting yellowing leaves mostof veins sensitive
Sulphuric Necrotic spots on upper All All -- -acid surface smilar tocaustic or acidic compounds, high humidityneed.
Source: Sterm, Hohless, Bonbel and Lowry, Fundamentals of Air Pollution,Academic Press (1972), pp. 116-117.

- 167
Table - 7.3
Impacts on Human Health
Serial Income No. of No. of People PercentageNumber Group households people suffering of affected
surveyed surveyed from one people toor more the totaldiseases surveyed
1 Low 35 235 97 41 28(Yearly incomeless thanRs.6,000/-)
2. Lower Middle 30 192 108 56.25(betweenRs.6001 & 12000)
3. Upper Middle 25 167 65 38.92(betweenRs.12001 &13000)4. High 10 58 32 55.17(Rs.1B001 &above)
Total - 100 652 302 471(approximate
average)

- 168
Table 7.4
Incidence of Diseases on people of Different Incone Groups
81. Diseases Number of people affected and their percentageNo. --------------------------------------------------------- -Low income Lower Middle Upper Middle High Income
group income group income group groupNo.of /age No.of Zage No.of Zage No. of Aagecases of cases of cases of cases ofiden- aff- iden- aff- iden- aff- iden- afftified ected tified ected tified ected tified ectedpeope peope people people1 2 3 4 5 6 7 8 9 18
1. Coughl 32 13.62 42 21 88 41 24 55 18 17.24Bronchitis
2. Breathing 36 15.32 45 23.44 28 11.98 11 18.97trouble/Asthma
3. "Headache 12 5.12 42 21.88 27 16.17 18 18.974. Stomach painlGas trouble/ 8 3.48 15 7 81 3 1.8 4 6 98
Vomittinglloss ofappetite
5. Chest pain 8 3.48 3 1 56 22 13 17 5 8.626. Fever/Shivering 12 5.12 18 9.38 28 11.98 2 3.45
body pain
7. Eye-irritation 16 6.88 21 18.94 7 4.19 2 3.45
Total 112 7.54 186 13.84 148 11.98 44 18.84Average Average Average Average
11:11:111:111cur:-1:-n:u—:1c-—n-—-—c-—-—-1:1:unju-:1-c—u—.n—n—u:-1-1:11q-«$16111:11--n1:;:;:1::::::11;:

- 169 —
Table - 7.5
Incidence o{ Cancer, Heart Diseases and Rate of Mortalityper 10,000 Population in IRE, TCC and ESIC (All India), 1970-84
Cancer Heart disease Total MortalityUnit Population Nos Rate per Nos. Rate per Nos. Rate per10,000 10,000 10,000IRE 262 11 420 B 305 21 802TDD 440 4 91 6 136 13 295ESID 69.68 lakhs 6.2 62 11.12 112 NA NA
per 1000 per 1000
Note ESIC date pertains to 1969-70 to 1983-84.Mortality date of ESIC not available
Source: V.T. Padmanabhan, Econogic and Political weekly. March 8-15, 1986,op.cit., p-450.
TABLE - 7.6
Relative Risks Between IRE-TCC & IRE-ESIC
SI Diseases Incidence per 10,000 Relative RisksNo. IRE TCC ESIC IRE/TCC IRE/ESIC1 Cancer 420 91 62 4.62 6.772. Heart diseases 305 136 112 2.24 2.723 Total Mortality 802 295 NA 2.72 NA.Note‘ Relative risk is the ratio between the incidence among exposed and
incidence among non-exposed.
Source: V.T. Padmanabhan, Economic and Political Weekly, March 8-15, 1986,op.cit., p.450.

- 17B
TABLE - 7.7
Summary Results of the Employee Survey.
31. Total Members Percentage of affectedNo. Coverage members affected to the total
1. Employee Households 125 58 46.4Surveyed
2. Population of the 812 246 36.3Households
3. Employees of factories lol 42 32.1in the households
4. Children below 15 216 82 38.0years
5. _§;oup§;ups other 465 122 26 2than employees
U16. Brown-ups including 596 164 27.the employees

.:o«umu«+wmmm~u mws» cw umucaou mg gmneme nmuum++m
ms» cw mmmmmfiu ucmcfisou mco >Hco uzm .mmm:~H« man can» mgos eog+ o:MLm++:m ma >ms Lmneme umuum++m :¢ "muoz
.ssfi x mam \.coflpmfizaou.mHm. flags» nu umyum++mcowymfizaog Hmuou mg“ +0 xm.sm u s.m_ + fi.sfi + m.m *u mmmycmukmm
.m_mVcofiumfiunaoa Hugo»
ms» +o Nm.sm Nssfi own xssfi mm“ xss_ mm xss_ m¢ flags»m.“ o.mm we ¢.¢m m¢ m.¢H cg o.Hfi m m.m;po .na.a m.m N - - m.m m - - xm_aeou >hmeM.m .eu.m m.~fi m¢ ¢.mm fim s.fifi 0 fi.~ m uwymcmm .mH.“ h.m 9 ~.¢ m u I m.» w fimcwummycfl .¢m.¢ m.m~ ¢m n.s~ mfi m.o~ efi ¢.~# m cfixm .m_.m m.e nfi ¢.¢ n ~.m m _.o_ m “Lam: .m
9.9 5.9m mn m.sm mm m.~m Hm m.a¢ mg >Lopm_flammm .H
.ssfi .95“x mm“ \. x mm \.
umyum++m umuum++m x m¢ \.
.33“ .59“ >HHmu >_fim» um~um+*mx m_m \. o¢m\_. -9» mg“ no» ms» >H~muco_um~:aoa nmuum++m on mom» umuu my mum» nmuu now mgy
amuop nu >~Hmu scmugmm nw++¢ ucmuhmm um++¢ my mumu umuu
nm~um++m sou mg» m.mneme uuuuuuuuuuuuuuuuuuuuuuuuuuuu an -=mu.mm um*+¢ mmmmmmfla .~m
we mam» my mama umuum++m mmm>o~qsm cmzu mLmm> mg uuuuuuuuuuuu nu
cmugmm ucmugmm may +o amuoh gmzuo maauczogm zofimn cmgufificu mmm>o~aem
muaocmmnoz um>o~aum cm mmmmmmma we mucmuwucu
m.~ mfinmh
n “ma 1

TABLE - 7.9
Domestic Animals Brought up by 188 Householdsin the locality
Sl. Income GroupNo. of Households Fouls Cattle Goats Total
1. Low GD 18 25 1152. Lower Middle 108 21 9 1383. Upper Middle 48 28 15 754 High 43 4 4 51};£;I """"""""""""""""""" “£91 """""" "Q; """"" -2.; """"" 393""
TABLE - 7.18
Land use Pattern in Agriculture in Ernakulam Districtand the State (1977-78)
S1. Ernakulag District Keralg StateNo. Details Area Percent- Area Percent(hectares) age (hectares) age
1. Total Geographic Area 23531? 188 3885497 1882. Net Area Sawn 182622 77.61 2281269 56.653. Area Sawn more than 71687 38.43 722535 18.68
once a year
4. Total cropped area 254229 188.84 2923884 75.25
Source: Government of Kerala, Season and crop report of Kerala State1977-78, Directorate oi Econonmics and statistics, Trivandrum, 1982,pp. 37-38.

173
TABLE - 7.11
Percentage of Area Under Hajor Crops to TotalCropped Area in the Locality
Details Area Percentage to total(hectares) cropped area.
Under food crops 1385.7 65 26Under non-food crops 736.585 34.74Total cropped area 2128 285 188
Net Sown 1523.88 71.83Sown more than once a year 597.285 28.17Total cropped area 2128 285 188Under major crops in 1735.829 81.83the locality
Such as:1. Paddy 827.759 39.842. Coconut 477.912 22.543. Fruit trees like banana, 194.642 9.18
mango, and jack
4. Tapioca & Vegitables 155.841 7.355. Pepper & Ginger 78.875 3.726. Others 385 256 18.17
Source: Percentage given in the last column refer to Ernakulam District;compiled Trom Sggson and Crop Report of Keralg State. 1977-78:Directorate of Economics and Statistics, Trivandrum, 1982, pp.38-42.

- 174
TRBLE - 7.12
Motor Vehicle Accidents in the State - 1978
81. Details of State District Ernakulam Dt. Idukki Dt.No. accidents average ----------------------------- -
1. Total no. of vehicle 7818 638 1877 15.35 128 1.8accidents
2. Number of persons 1857 96 136 12.87 39 3.69killed
3. Number of persons 7514 683 1175 15.64 246 3.27injured
4. Number of accidents 526 48 78 14.83 9 8.17due to causes 7, 8and 9 (includingatmospheric pollution
5. Casualities in 642 58 95 24.79 28 3.12accidents due tocauses 7,8 and 9
1. Persons killed 79 7 18 12.66 3 3.82. Persons injured 563 51 85 15.18 17 3.82
Source: Compiled Irom, Industries and Industrial Labour and Infrastructure,Transport and Industries Division, State Planning Board, Trivandrum,June, 1988, p.285

CHAPTER - VIII
FINANCIAL ESTIMATE
Environmental distrubances have, today, become an inevitableconcomitant of the development process. But advances in tech—nology have made it possible to minimise such disturbances. Inorder to ensure optimum environmental quality in a specifiedarea, the economic feasibility of adopting various environmentalprotection measures are to be examined. For this purpose, thetrade offs between benefits and costs involved in the processare evaluated in financial terms.
The role of benefit-cost analysis in decision making,especially in the context of- project evaluation, is widelyrecognised as important. It has its practical importance notonly in project evaluation, but it also has a bearing on suchareas as investment planning, taxation, commercial and development policies, environmental impact assessment etc. Benefit-costanalysis consists simply of the work necessary to present adecision taker with the information which he requires in order
to take a’decision. when appropriate schemes are selected froma proposed package of measures for implementation, the estimation of incremental revenue and incremental costs is necessaryto asses the economic feasibility of such a programme. Variousstages are involved in this process of financial estimation ofenvironmental protection of a specific area or locality. As per:those stages listed in Chapter I, the harmful pollutants emittedor present in the project area have been identified, impacts ofthose pollutants have been analysed; and the specific impacts of

~ 176
those pollutants have on the living and the non living havealsobeen identified. A package of measures for the control andabatement of environmental pollution of the area is to beproposed before making an estimation of benefits and costs ofprotecting the environment of the area and before presenting acomprehensive benefit~cost analysis table.
Package of Measures Proposed
Controlling the discharge of contaminants may be accomp~lished through a number of techniques ranging from in-plantchanges in production methods to the installation of equipmentdesigned to remove or reduce specific pollutants or change thecharacteristics of the wastes. Change in the process oroperation with respect to water pollution control aims atreducing the volume and strength of waste water. This can bebrought through neutralisation and equalisation and apportioningof pollutants in different effluent streams. Suspended solidsin the effluents may be removed through the methods likesedimentation, flotation and screening. Colloidal solids can beremoved through chemical coagulation and adsorption. some ofthe accepted methods for the removal of inorganic dissolvedmaterials in the waste water are precipitation, ion exchange,carbon adsorption, reverse osmosis and evaporation. For organicdissolved materials, the treatment methods are lagooning,biodisc treatment, spray irrigation etc. The techniques ofanaerobic digestion, deepwwell injection, and foam phase separation can also be used for this purpose. Likewise, bacteria and

— 177 ~
micro organisms can be removed through chlorination, ozonationand ultraviolet radiation.‘
The method suggested everywhere in the world for the controlof air pollution is increasing the stack heights to facilitatethe removal of impacts from the immediate locality and thedispersal of pollutants to further dilution. Gases can bepurified to remove contaminants either by adsorption, absorptionor some type of chemical process usually catalytic conversion.Particulates in the emissions can be removed by adopting any ofthe methods such as filteration, sedimentation, centrifugalseparation, electrostatic precipitation or wet scrubbing.Sanitary land-fill, leachate control, shredding and incinerationare some of the methods that can be used for the treatment anddisposal of solid wastes.2 In—plant techniques for thecontrol of sound pollution may be adopted. Such techniques ofeconomic feasibility are yet to be developed. For the timebeing, trees and plants can be used as effective check againstsound. Planting of more trees, vi:., neem, casurina and thelike, around the industrial units helps to reduce noise levelssignificantly.
Many of the above stated treatment methods and techniquesinvolve the application of advanced technology and imply a hugeexpenditure. It may be mentioned here that we do not have the
1. For details on control techniques, see, World Bank/August1978, Environmental Consideration for the IndustrialDevelopment Sector. Washington D.C. 1978, pp. 36-68
2. Ibid.,
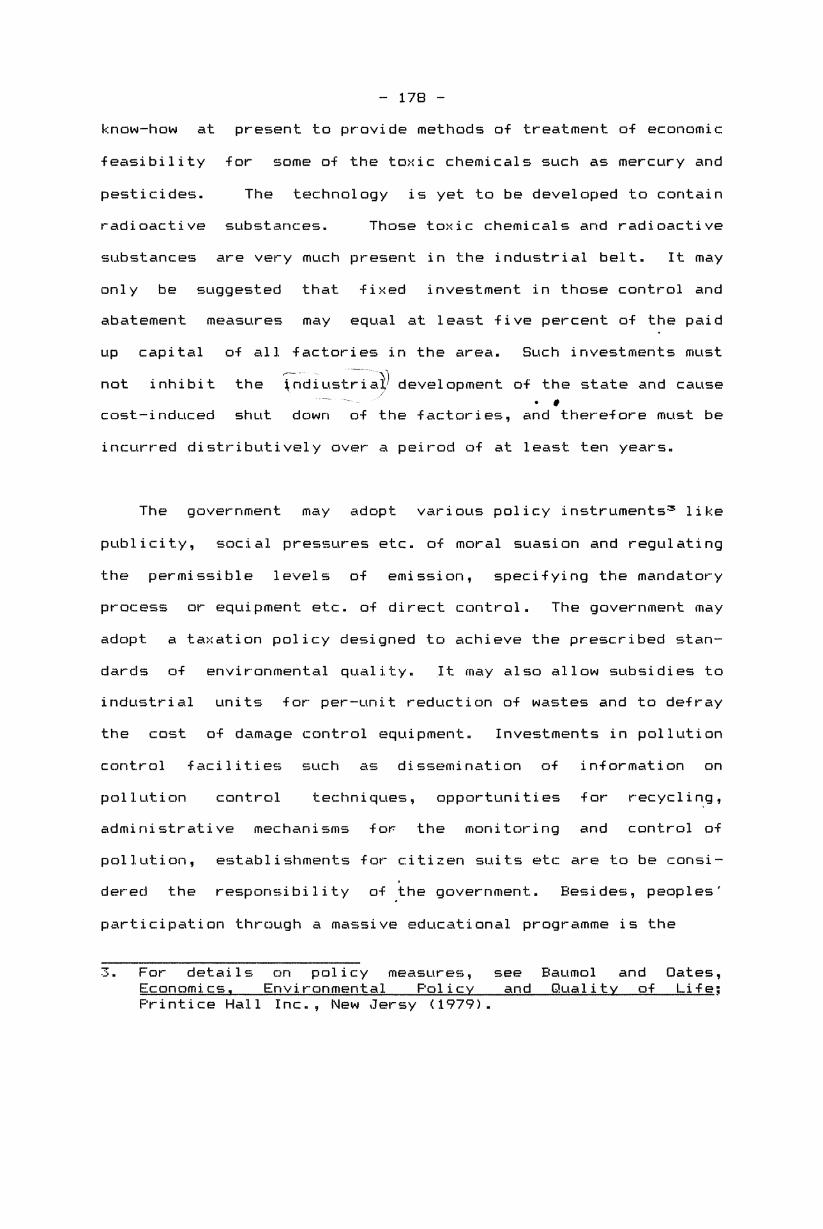
- 178 know~how at present to provide methods of treatment of economic
feasibility for some of the toxic chemicals such as mercury andpesticides. The technology is yet to be developed to containradioactive substances. Those toxic chemicals and radioactivesubstances are very much present in the industrial belt. It mayonly be suggested that fixed investment in those control andabatement measures may equal at least five percent of the paidup capital of all factories in the area. Such investments must
.. --».__..,._
not inhibit the indiustriaw development of the state and cause" "”“‘ ‘ ‘'\~ .. "'/ . .cost-induced shut down of the factories, and therefore must beincurred distributively over a peirod of at least ten years.
The government may adopt various policy instruments‘ likepublicity, social pressures etc. of moral suasion and regulatingthe permissible levels of emission, specifying the mandatoryprocess or equipment etc. of direct control. The government mayadopt a taxation policy designed to achieve the prescribed stan~dards of environmental quality. It may also allow subsidies toindustrial units for per~unit reduction of wastes and to defraythe cost of damage control equipment. Investments in pollutioncontrol facilities such as dissemination of information onpollution control techniques, opportunities for recycling,administrative mechanisms for the monitoring and control ofpollution, establishments for citizen suits etc are to be considered the responsibility of the government. Besides, peoples’participation through a massive educational programme is the
3. For details on policy measures, see Baumol and Dates,Economics. Environmental Policy and Quality of Life;Printice Hall Inc., New Jersy (1979).

~ 179 —
most effective guarantee against environmental pollution. Inthis context, the role of voluntary agencies, reasearch bodiesand university centres in monitoring and research, and forcreating more awareness among people of. the locality is ofgreat importance, though they involve considerable expenditure.
The Financial Estimate
In this financial estimate, the incremental benefitsaccrued and the incremental costs involved in the execution ofvarious environmental protection schemes are evaluated.Therefore the estimate consists of two parts:
1. Estimate of incremental revenue; and2. Estimate of incremental costs.
The following assumptions are made in the estimation ofincremental revenue and incremental costs of environmentalpollution control and abatement schemes in Eloor-Edayarindustrial belt.1. The households in the area are classified into low, lower
middle, upper middle and high income groups in the ratio3S:3B:75:l@
in Only twenty five percent of income loss due to diseases inthe area are attributed to environmental pollution.
a. The possibility of accidental emission of pollutants fromthe factories in the area and, subsequent and unforeseen

- lBB ~death of animals and humans and damages to crops etc. arenot accounted for.
Only ten percent of the monetary value is attributed tocasualities by various reasons including environmentalpollution (ior instance, motor vehicle accidents).
Items which cannot be converted into money terms are keptoutside this estimate (for example, loss oi life due tomotor vehicle accidents caused also on account oi badweather conditions and atmospheric pollution).
All industrial units in the area would spend an amount equalto at least five per cent of their paid up capital on pollu
and abatement by installing required equipmenttion controlor adopting appropriate processing techniques etc in theirunits.
The Kerala State Pollution Control Boaord would spend atleast one half of the budget expenditures allocated to it+or improving the quality of environment o¥ this areaconsidering that most of the industrial pollution load andmore than fifty per cent oi the total pollution loadoriginate or are concentrated in this area.
The expenditure on various environmental protection measuresincurred in the area are spread over a ten~year period withthe objective of bringing down pollution to optimum level bythe end oi this period.

— 181 ~
9. A social discount rate oi ten percent per annum isconsidered and the calculations are made using, PV =X{(1+r)"~1}/r, where, PV is the present value of X, X isany estimate of cost or benefit of the initial year, n isthe number o+ years, and r is the social discount rate. rtakes plus or minus sign when the estimate is made respec~tively at an increasing rate or decreasing rate, as the casemay be. Accordingly, it is found that the present value ofX becomes 15.9374246X at an increasing rate and 6.5132 5599K
at a decreasing rate of ten per cent per annum by the end often years. For nine years, they are respectively13.S7947691X and é.12S79511X ; and so on.
Estimate of Incremental Revenue
Incremental revenue on account of the Iollowing {actors areworked out:
1. Incremental revenue from the beneficiaries’ willingnessto pay towards the protection o+ the environment;
2. Incremental revenue ¥rom damages avoided;
3. Incremental revenue Irom damge avoidance costs avoided,and
4. Incremental revenue {rem additional employment created.
The procedure adopted for the estimation of incrementalrevenue on the above items are brie¥ly illustrated below.

~ 182
Incremental Revenue from Beneficiaries’ Willingness to PayAltogether 160 households were surveyed (under the household
survey) in the project area in order to find out beneficiaries’"willingness to pay” towards the protection of the environmentof the area. the households were selected at random in theproportion 3S:3@:25:lB, respectively, from low, lower middle,upper middle and wigh income groups. In order to counter thebeneficiaries’ tendency to underestimate the amount they arewilling to pay and to overestimate the damages and to demandcompensation in consequence, an "adjusted measure" ofwillingness to pay is calculated. The "adjusted measure" ofwillingness to pay or "the effective willingness to pay" is theaverage of compensation demanded and willingness to pay of thehouseholds.
The results of the survey with details such as number ofbeneficiary households, number of people benefited, compen~sation demanded, willingness to pay and effective willingness topay - all per households per year in the case of the last threeitems - are given in table 8.1. The effective willingness topay is calculated to be Rs.477.4B for low income group andRs.584 for lower middle income group per household per year.The households in the upper middle and high income groups showed
their average yearly willingness to pay as Rs.768.5B and Rs.828per household respectively.
There are about 16869 households in the affected area of

~ 183 ~
78.5 square kilometers with more than 189588 beneficiaries.“Classifiying the entire households into different income groupsin the ratio 35:3@:25:18 and multiplying the households in eachincome group with the respective average (effective) willing»ness to pay per household, the total incremental revenue on thebasis of beneficiaries’ willingness to pay is obtained. Table8.2 gives the estimate of incremental revenue on the basis ofbeneficiaries’ willingness to pay in the project area. Thetotal incremental revenue from the beneficiaries in the entirearea is thus obtained as Rs.184.B6 lakhs per year. Assuming asocial discount rate of ten per cent per year, the incrementalrevenue in this respect would amount to Rs.1658.49 lakhs duringthe next ten years.
Incremental Revenue from Damages Avoided
Incremental revenue from damages avoided as the result ofthe execution of various environmental protection measures iscalculated on the following accounts:
1. Revenue from damages on human health avoided;
2. Revenue from damages on domestic animals avoided;
a. Revenue from damages on agricultural crops avoided; and4. Revenue from damages on materials and structures
avoided.
4. The population of the project area with 5 kilometers radiusaround the industrial belt is calculated to be 189586 basedon the average density of population as per 1981 census ofParur and Always Taluks to which the affected area isspread. The number of households are 16859 as the averagemembership of a household is 6.5. These figures are usedin the classification of households and population invarious income groups as given in the tables appended.

- 184 *
Revenue from Damages on Human Health Avoided
Various diseases result in a decrease in the productiveefficiency of the people, though they are not the only causes.In the asbsence of illness it is assumed that people of the areacould have earned at least 25 per cent more than their presentincome. Only 25 per cent of such loss of income is attributedto diseases caused by environmental pollution. accordingly,loss of income due to environmental pollution on housheolds ofdifferent income groups is claulated as given in table 8.3. Thetotal income loss per year thus estimated for the entireaffected area is about Rs.lB1.16 lakhs. when environmentalprotection sehmes are progressively implemented, there will bedecline in the damages on human health and in the loss of incomedue to decreased efficiency. Therefore, the benefits obtainedon account of damages on human health avoided in subsequentyears will also show a decline every year over the previousyear. Considering this, the total revenue accrued from theentire area on account of damages on human health avoided forthe next ten years is worked out as nearly Rs.é5B.8é lakhs.
During the survey, information on the number of workdayslost due to illness could be obtained. On the basis of suchinformation it is possible to calculate the average loss ofincome due to workdays lost per household per year in each ofthe income groups. Assigning only 25 per cent of income onworkdays lost to diseases caused by environmental pollution, theestimate of loss of income in this respect avoided for the

entire area is obtained and is shown in table 8.4. Yearlyincremental revenue from "workdays lost" avoided is approximately Rs.2D.43 lakhs and this would become nearly Rs.133.@7lakhs during the next ten years at a social discount rate oi tenper cent per year.
Thus the toal incremental revenue accrued from damages onhuman health avoided during a ten year period would be approximately (o58.Bo + 133.97) Rs.?9l.93 lakhs.
Revenue from Damages on Domestic Animals Avoided
In a similar manner incremental revenue from damages ondomestic animals avoided is calculated as shown in table 8.5.Illness decreases yield and hence income irom domestic animals.Income obtained from domestic animals per household on averagein different income groups is calculated {rem the surveyresults. Loss of income due to diseases is considered as only25 per cent o¥ the income from domestic animals and only 25 percent of such loss is attributed to environmental pollution. thetotal revenue from damages on domestic animals avoided is esti~mated around Rs.9.l3 lakhs per year. And the total revenueincrementally obtained in this respect during the next ten yearson progressively implementing environmental protection measuresis estimated as approximately Rs.59.4B lakhs.
Revenue from Damages on Crops Avoided
It was possible to ascertain the yearly average income fromagriculture per household in each income group from the

~ 186 ~
household survey. The reduction in the expected income due toenvironmental pollution per household could also be calculated.“ On the basis oi such information, the total loss ofincome from agriculture of all income groups due to environ~mental pollution is estimated {or the area as nearly Rs.226.3Blakhs per vear as shown in table B.o. The incremental revenueon account of damages on agricultural crops avoided duirng thenext ten years is estimated as around Rs.1474.47 lakhs.
Revenue ¥rom Damages on Materials and Structures Avoided
From the household survey it was also possible to calcuateyearly average expenses per household on maintenance of thehouses and other structures and materials in each of the income
groups. During the survey it was revealed that, on average thehouseholds were spending yearly an amount which in other localities would have been enough for three years. accordingly, 2/3rdo+ the average maintenance cost is attributed to the environmental pollution o¥ the area. There¥ore the revenue accrued byenvironmental protection +rom avoiding damages on structures andmaterials in the area is worked out to be around Rs.32.61 lakhsas given in table 8.7. And {or a ten year period this wouldamount to Rs.212.42 lakhs.
5. Actual and expected income ¥rom agriculture of every house~hold were noted down during the survey. The di¥+erencebetween them is taken as the "reduction in expected income”oi the household which is fully attributed to pollutedenvironment. According to the people o+ the area, in theabsence of pollution, there would not be any other causefor reduction of income irom agriculture with the existingmethods of production and the pattern of fertilizers,pesticides and other resources used in the area.

_ 137 M
Further, as discussed earlier, the number of motor vehicleaccidents and the casualities are the highest in ErnakulamDistrict. There occurred S26 accidents in which 85 people wereinjured and ten killed during the year 1978 in the districtcaused by reasons including deterioration of the environ~ment.° Attributing only ten per cent of the monetary value ofthe casualities to environmental deterioration of the area, theincremental revenue accrued Trom such casualities avoided can be
calculated. fissuming the above Tigures of casualities as yearlyaverages and assuming a loss oi Rs.S@ per day per persona+fected or killed in the accidents, the incremental revenue inthis respect for a person year of 2?? days would be nearly (56 x272 x 95 I 10) Rs.1.29 lakhs per annum. end for a ten yearperiod it would amount to around 8.42 lakhs, conducting at asocial discount rate o¥ ten per cent per annum.
Similarly by assuming a loss o¥ Rs. 1 lakh per accident dueto damages on vehicles and attributing ten per cent of this toatmospheric pollution, revenue accrued by avoiding accidentswould be (16600 x 526) Rs.S2.6 laksh per year. For the next tenyears it would cumulatively increase at a ten per cent socialdiscount rate to approximately Rs.342.S9 lakhs. Thus the totalincremental revenue from motor vehicle accidents avoided byenvironmental protection of the area during the next ten yearswould be around (8.42 + 342.5?) Rs.3S1.B1 lakhs.
6. It is widely known that in the national highway No.47between Palarivattom and Alwaye, a large number of motorvehicle accidents and casualities occur every year. Thisdistance in the highway falls in the project area.

~ 188 M
Incremental Revenue from Damage Avoidance Costs Avoided
Various damages caused in the area by environmentalpollution are removed or avoided by incurring expenses onmedical treatment of the affected people, treatment of theaffected animals and treatment of the affected plants andcrops. when various environmental protection schemes areimplemented such expenses can be progressively reduced andgradually avoided. The revenue accrued by avoiding such damageavoidance costs can therefore be calculated as shown in table8.8. Only 25 per cent of such damage avoidance costs areattributed to environmental pollution becapse many of thedamages might have occurred also due to other reasons. It isestimated that incremental revenue on account of damage avoi~dance costs avoided would be nearly 32.75 lakhs per year and fora ten year period at ten per cent social discount rate it wouldapproach Rs.213.32 lakhs.
Incremental Revenue from Additional Employment Created
Capital expenditures by way of control and abatement costs,social afforestation in the immediate locality around thefactories, impacts prevention costs of polluted drinking waterand contaminated atmosphere, and transaction costs do have thepotential for additional employment generation. Such expendi~tures are of the order of Rs.788 lakhs, Rs.1B.41 lakhs (seepages 188‘ e 189), Rs.48.28 lakhs (see page 198), and Rs.478.l2laksh (see page 191) respectively on the stated items. As perofficial statistics the capital~labour ratio of the industrialsector for the district of Ernakulam is Rs.4S,5B8, and the

~ 189 ~
average of wages, salaries and other benefits per employee inthe industrial sector in the district is Rs.12,2BB.7Accordingly the total capital expenditure of about Ps.131é.73lakhs would create approximately 2894 employment opportunities.And the income by way of additional employment would be aroundRs.353.Bé lakhs during the ten year period.
Estimate of Incremental Costs
In an estimate of incremental costs of environmental protection of the area, the expenditures required for implementingvarious control and abatement schemes are oi prime importance.Till the pollutants are made to conform to the prescribedstandards, the damage and damage avoidance costs would continueas major items in the estimate of environmental protectioncosts. Since the suggestion is {or implementing various pollution control and abatement schemes over a period of ten yearsthe cost involved in monitoring, research and administration —transaction costs ~ must also be included in this financialestimate. Accordingly, the incremental costs on account oienvironmental protection of the area are estimated under thefollowing heads:
1. Damage Costs2. Damage Avoidance Costs3. Pollution Control and Abatement Costs4. Pollution Prevention Costs - and5. Transaction Costs
7. Government of Herala, Bureau of Economics and Statistics,Industrial Statistics Unit, Annual Survey oi Industries,Kerala State 1977~7B, Trivandrum, June 1978, p.30.

~ 196 ~
Damage Costs
Damages on people, domestic animals, agricultural crops,materials and structures have already been discussed inconnection with the estimate of incremental revenue on accounto4 those damages avoided by environmental protection of the areaduring the next ten years. The approximate money values ofdamages on people and domestic animals were estimated to beRs.791.93 lakhs and Rs.59.4B lakhs, respectively. The damageson agricultural crops were estimated around Rs.1474.47 lakhs.as has been found in the estimate, the people of the area arealso required to bear the maintenance costs on materials andstructures of the order of about Rs.E12.42 lakhs. It could alsobe estimated that damages due to motor vehicle accidents in thedistrict attributed to environmental pollution of the area wouldcome around Rs.3S1.B1 lakhs. Thus the total o¥ damage costsidentified in the context of environmental protection of thearea would amount approximately to Rs.2889.31 lakhs for theperiod of ten years, estimated at a social discount rate of tenper cent per annum.
Damage Avoidance costs
The damage avoidance costs are those incurred by way o¥expenses on medical treatment of the aifected people anddomestic animals and by the treatment o¥ the a¥fected plants andcrops. The costs incurred by the people o4 the area foravoiding damages in these respects total nearly Rs.213.32 lakhs,when we consider a ten per cent social discount rate for aperiod oi ten years.

~ 191 Pollution Control and Abatement Costs
The factory survey has revealed that during the past tenyears, the nine factories in the area together have made aninvestment of the order of Rs.31@ lakhs in various schemes ofenvironmental pollution control and abatement includingrecurring expenditures. Besides, the factories have beenpaying more than Rs.7.S lakhs per annum as water cess to theState Pollution Control Board (HSPCB) since the enactment ofthe water Bess fict of 1977.
The factories together have a paid up capital of approximately Rs.15éBB lakhs and employ about 12,250 people. It isproposed. that these factories make fixed investment of five percent of the paid up capital in various control equipment andabatement schems during the next ten years. This would costaround Rs.78B lakhs. Assuming five per cent of this as recur~ring costs including depreciation, the estimate of recurringcosts on control and abatement measures for the next years atten per cent social discount rate would be about Rs.é2l.Sélakhs. Thus the total costs on control and abatement measures
at the factories would amount to approximately (7B@ + 621.56)[email protected] lakhs during the period.
It may be observed that about one third of one squarekilometer area around the factories is without any sort ofvegitation. A social afforestation programme of planting treesof selected species many be suggested as a measure of controland abatement of pollution (especially sound) in the immediate

-- 1 92locality. About 256% trees may be planted in a hectare incur
ring a cost of about Rs.5@ per tree_during the initial year,towards planting, manure, protection staff, etc. which amount toapproximately [email protected] lakhs. Further, Rs.1@ per tree per annummay be spent towards the upkeep of the trees and the maintenanceof the programme, costing around Rs.2.83 lakhs and for theremaining nine year period it would amount to around Rs.2 .28lakhs at a social discount rate of ten per cent per annum. Thusthe total cost of social afforestation of the said area comesnearly to (10.41 + 28.28) Rs.3B.69 lakhs during the ten yearperiod.
Pollution Prevention Costs
There are two types of prevention costs identified andestimated in the context of environmental protection of theproject area. They are those incurred on preventing the damageson people due to polluted drinking water and due to pollutedatmosphere. The public water supply cannot, perhaps become aperfect substitute for the fresh and pure ground water. Aspointed out earlier about 322 households inhabiting one and ahalf square kilometer in the project area are seriously affectedby the polluted ground water. It may be proposed that theimpacts of polluted drinking water may be prevented byinstalling water purifiers in the households of that area with afixed investment of Rs.35DB per household and a recurring costof Rs.25B per houehold per year. Similar expenditures may bemade for installing air purifiers in the households of about oneand a half square kilometer area around the industrial belt.

~ 193
For these measures, the households may be assisted by thegovernment or the factories or the financial institutionsthrough an appropriate programme. Both these pollution damageprevention measures” together require Rs.7BUD by way of fixedinvestment per household and Rs.5@D per household per year asrecurring costs. The total of the fixed investment for thehouseholds in the said areas comes around (7890 x 322 Rs.22.54
lakhs and the recurring costs, nearly 25.66 lakhs, estimated ata social discount rate of ten per cent per annum during thenext ten years. Thus the incremental costs in this account ofpreventing damages from contaminated water and pollutedatmosphere in the most affected areas of the project area arecalculated to a total of, approximately, (2x.o4 + 23.66)FIE. 48.. EU lalzzhs.
Many people in the locality have suggested that theeffluents of different factories may be combined and pumpedthrough a pipe of enough size to the outer ocean so thatvarious impact of water pollution in the locality could altoge~ther be prevented. A detailed investigation is required on thefeasibility and desirability of such a programme. It is fearedthat it may produce devastating effects on the marine ecosystemand destroy its rich fauna. the cost estimate of any suchprevention measure is, therefore, not included in the presentstudy.
8. These measures do not prevent pollution at the source.They are partial measures as they are effective to checkadverse impacts of pollutants in the water and air only ifthe people are confined to their homes, but provide greatrelief to the children and the aged in the households.
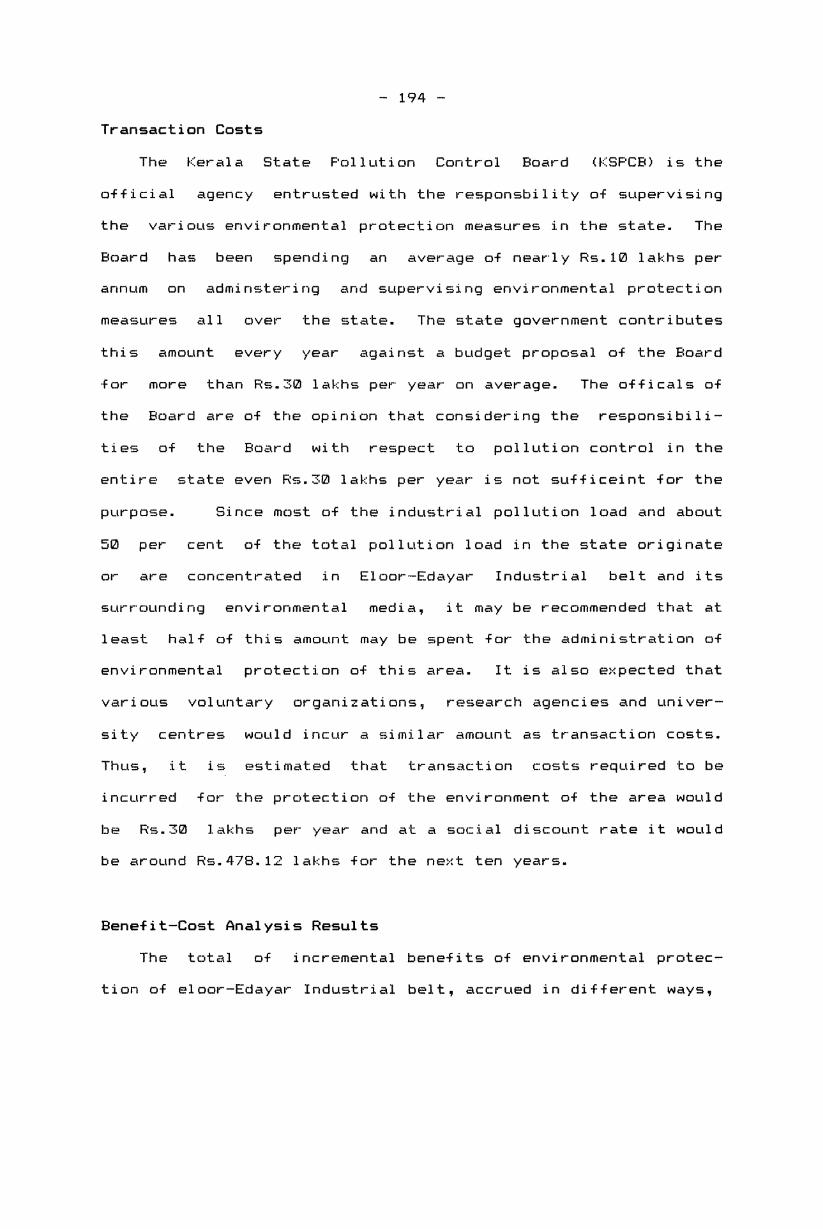
~ 194 ~
Transaction Costs
The Herala State Pollution Control Board (HSPCB) is theofficial agency entrusted with the responsbility of supervisingthe various environmental protection measures in the state. TheBoard has been spending an average of nearly Rs.1@ lakhs perannum on adminstering and supervising environmental protectionmeasures all over the state. The state government contributesthis amount every year against a budget proposal of the BoardFor more than Rs.3B lakhs per year on average. The officals ofthe Board are oi the opinion that considering the responsibilities oi the Board with respect to pollution control in theentire state even Rs.3@ lakhs per year is not sufficeint for thepurpose. Since most o¥ the industrial pollution load and about50 per cent of the total pollution load in the state originateor are concentrated in Eloor~Edayar Industrial belt and itssurrounding environmental media, it may be recommended that atleast half of this amount may be spent for the administration ofenvironmental protection of this area. It is also expected thatvarious voluntary organizations, research agencies and univer~sity centres would incur a similar amount as transaction costs.Thus, it is estimated that transaction costs required to beincurred for the protection of the environment of the area wouldbe Rs.3B lakhs per year and at a social discount rate it wouldbe around Rs.47B.12 lakhs for the next ten years.
Benefit-Cost Analysis ResultsThe total o¥ incremental benefits of environmental protec~
tion of eloor-Edayar Industrial belt, accrued in dif+erent ways,

is approximately Rs.5114.18 lakhs and the total of incrementalcosts is around Rs.S@é9.2B lakhs. Bene+its would exceed costs
while implementing the suggested package o+ measures by Rs.44.9B
lakhs. Though these figures reveal approximations only, theyclearly indicate the trend in ¥avour of the decision maker toadopt the programme o+ environmental protection of the projectarea as its economic feasibility is established. The estimateso¥ incremental bene¥its and incremental costs of environmental
protection of the area are summarized in the benefit-costanalysis table given below.

s~.¢Hsm m.mou H~H=m.m_u=H _~HoH H m_.¢__n mH_Hm=mm _.H=m.m_u=H Hmyop
~H.m~¢ mumou =a_.umm=m_» .m Ha~.m. mumou =o_H=m>m.¢ =aHH=H_om .¢ H
n~.s¢¢_ m.mou H=mum.mp¢ » _o_H=ou =oHH=HHo¢ gage» H ¢a.mnn um.m.m=mm H=m.>oHg.u _m=aHH_u=¢ Ha H==ouu¢ ca .¢
me.mm ma-m.oo.a =oHumumm.o*+m Hawuom m Hog H
em.Hs¢_ mmHHo.um+ mgu >a mmamgum m=oH_a> co H ~m.mH~ umuHc>m mymou mu=muHa>¢ mmamama we u\¢ co .m
mumou «am-mumnc can Ho_H=ou =o_H=HHom .m H
H Hm.ammm =muHa>m mmamama ao.+ mHH*m:mm HmHo~
~n.mH~ m.mau mu=muHa>¢ mmmmama .m H _s._nm umuHo>m
H mmHHHHm=mmu H m»=mu_uum cu use mmomumo_m.amm~ mumau manage Hmaop H ~¢.~H~ um=Ho>m mm.=~u=.um\m_m_Hm#mn =o mmamamaH ~¢.¢~¢H umuHa>m mao.u co mmamumeHa._nm mm_»_Hm=mmu nan mucmumuum cu man H m¢.on umu_o>m mHmu_=m u_Hmm.ou an mmomamo~¢.~_~ mm.=uu=.um ucm m_mH.mHma as H ~s.mm umuHo>m Hmog m»muH.o3n¢.¢~¢_ mno_u Hm.=H~=u_Hom co H em.mme cmu_a>m ;uHmm; cmuzg =a mmomama
m¢.om mHm.H=m uwummaou ca H umuHa>¢ mmamamo +9 H==ouu¢ co .m
~=.mmH HmaH mH~uH.c= my man H
¢m.mm¢ ;HHmm: =m.=; ca H ¢¢.mmeH Hag cg mmm=a=_H__3
mumou momama H H. . .mm.Hm_u_*m=mm we H==nuu¢ as .HH H H.az H H H H.azm;HmH .mm H m;HmH .mm H m-mu_ H.Hm H m;HmH .mm H m;HmH .mmH mamHH H.Hm
mhmou H¢_zm=mmu=_ H mpfimmzmm H¢Hzw=u¢uzH
m_.~_ m_m>_.=¢ .mou-._Hm=mm
u cm" u

eweewe nmnn.ene.
sn.emmwnnne
ns.mnnnem_nm.emmemmmns.~enmne~
nn.m~mnm.mnens.nmmnn.een
ene: .ewennee eween .nwennez ewenn .menn .e
..mm. m::m>meamucweweuce
emm> ema nflogmmaozemu >mn on mmm:en wnweenwm -nee_.ee w>ewnwwem
mugnnmmzon>emeue+w:mn+a emnssz
mnflonmmzon
wo coeaeoaoem
xmm cu mmm:a=wH_M3 mmMemeu_+m:mm +9 mmmmm may no m::m>mm amucmameuca
~.m u unmee
nn.mmmnm.nnees.nmmmn.een
nn.enesn.me_n_.mee
nn.meeenn.nemesn.nmn_
mm.mnm
l.l"ZI
|'."~l
meouce nae:queen meoucemfluuee Luau:azoem meoucwmeuuee emzngaaoew meuu:H 2o;
new enn.ne.wennn.me.wenew enn.m .wennn.m_.wenew ennn .wennnw.we nnen
..mm. emm>
emu ufionmmsoz ema >mammm:a:e_He3 +o menmmmenmumzmuw ea m>eaum++m
.emw>\.mm.nfionmmnozemu >ma onmmmcmceflfiez
.Lmw>\mm.nfionmmaon
emn umncmemucoeummcmueou
mufiozmmzoz>emeuM+m:mn
+o emnezz
mmeemeue+m:mn
+0 emnesz
mu_o;mm=o:
wen en
enenwneeewwwee
mnaonmmaoz
wee +o
meouce >~emm>
xmm on ocwgamz mm_em_um+mcmm
.e.m n unnee

ugogwmzoz Lma menus“ >HLmm> momLm>m u umofi >muxLo3 m +o meoucfi mumLw>¢ "muoz
Amnxmfl m¢~m¢.am. A Law» gun umufio>m umofi m>muxLo: coo¢Hm¢sm.mm A menus“ wo mmofi eon» m::m>mL Hmucmemgucw Hmao»
nsmsom ewe, mo._mm ~¢.ema ma coax .¢mmmhae mfim¢ m¢.moH oh.Heo N“ m~nu_z Luau: .mfimmfifim mmsm ~o.s¢_ sm.mem N“ mfinufiz Lwzo4 .m
ems¢¢m seam em.fi¢ ¢¢.mofi mfi :04 .fi
mmgm ms» cg umufi mmgm ucogw>:m on man A.mmv mufiozwmzon Lwa Lam» Lma
m>mn gun: on man :_ mu_o; ymofl m>rmngga: +o umofi m>mn xgoz up man ufiozmmsoz Lma q=o.o msoucm .ozmeoucw +o mmo4 ummsox +o.oz menus“ +o mmo4 meoucw +o mmo_ >~Lmm> umoa mxmuggoz .Hm
umu_o>¢ aumng m>mux;o3 nu ma: manucm +0 mmo4= aoL+ m:cm>mm
.¢.m n m4m¢h
Am;xm_ m«mmfi.HsH.
mfimmfifisfi .mm umnfio>m zyfimmn co mmmmemu eog+ m::m>mL ms» +o amuoh
mhmmfimm omo_ sn.mfimfi swam sssfim god: .¢monfimom mfimq sm.~mo smmm sssmfi mfiuuflz .maa= .mnN_m¢mm amen sm.m¢m swam assa m_uufiz .m:o4 .m
aamosH_ seam am.~m_ ems seam 304 .H
..mm. :oflp=_Hoa
A.mm. cuflmmc :0 mmgm Hmu:ms:o;«>:m >3 A.mm. A.m:. uflocmmsoz mnaocmmzon
mmamemu cu wsu ms» cfi mugs; uwmamu mmmwmgn on mmmmmfiu cu wan gmn menus“ may +0 .02msoucg +0 mung ummsoc +o.oz mun meoucw +o mmog maou:H wo mmog mmmLm>m >~Lmm> azogm maoucH .~m
umuwo>¢ sugmmz cans: =0 mmmmuma flDL+ m::m>mm
m.m I m4m¢»
- mo“

sn““n““ns Amusmesnsn“>sm n“ man menus“+n mun“ +n m“me““mm
Amsxm“ mmm.mm~.
ee.mm_mmemm
ee.emem“““ne.emm“m¢mee.m“me~m“
A.ms.
A smm> smn mmsm ms“ s“ nmu“nm>m mnnsu soA mmomemn ens+ mnsm>ms “m“smemsus“ “m“ne
mmsm ms“ s“
mn“nsmmnns +n smnenz
mo.es.
meuusum“se.m“s“
A.mm“smm> sms u“nsmmnnssms sn““n““nn “m“smeusns“>sm nu mnu menus“nmuumnxm s“ sn““unnmmnmn“n>¢ msnsu sn mmmmema ens»
o.m
mums“
A.ms.
mese.emo“ ““.¢ee“
n“nsmmnnssmn ms=““nu“smm ens»menus“ mmmsm>m >“smm>
mung“: swag:muse“: smzou
A mmsm ms“ s“ smm> smn nmn“n>m m“me“sm u““mmennsn mmmmemn ens+ mnsm>ms Amusmemsus“ “mune
no.¢Ammm
ee.mmeoomom.eomAmm
em.“ee“n
se.em¢se.me
m“.esmns.e¢esm.mm¢e¢.¢““
muse“: swan:mute“: smznu
ms“ s“ sn““n““nn“m“smesns“>sm n“
mnn m“me“sm ens+ mn“nsmm=ns
amenus“ +0 mmnu
mmsm
men an+0 smnenz
mn“nsmmnns smnLmu.sn““n““nsnu man mun“menus“ mumsm>¢
A.me.
m“me“smu““mmenn
A.msu
m“me“sm+n eumme onens+ menu mun n“nsmmnnsus“ +n mmn“ sms menus“ +n
me“ +n Ammo“
mmn“ mamsm>¢nmn“n>¢ m“mn“ssc u“ummuno sn mmamama
n.m
mums“
so“ I
mmmmm“n n“man n“nsmm:nssmn menus“ +nmmn“ mumsm>¢
A.ms.
mn“nsmmnnssmn m“meu“sm u““mmennens» menus“mmmsm>m >“smm>
nnnsm menus“
.nz.“m
uns+ m=sm>mm
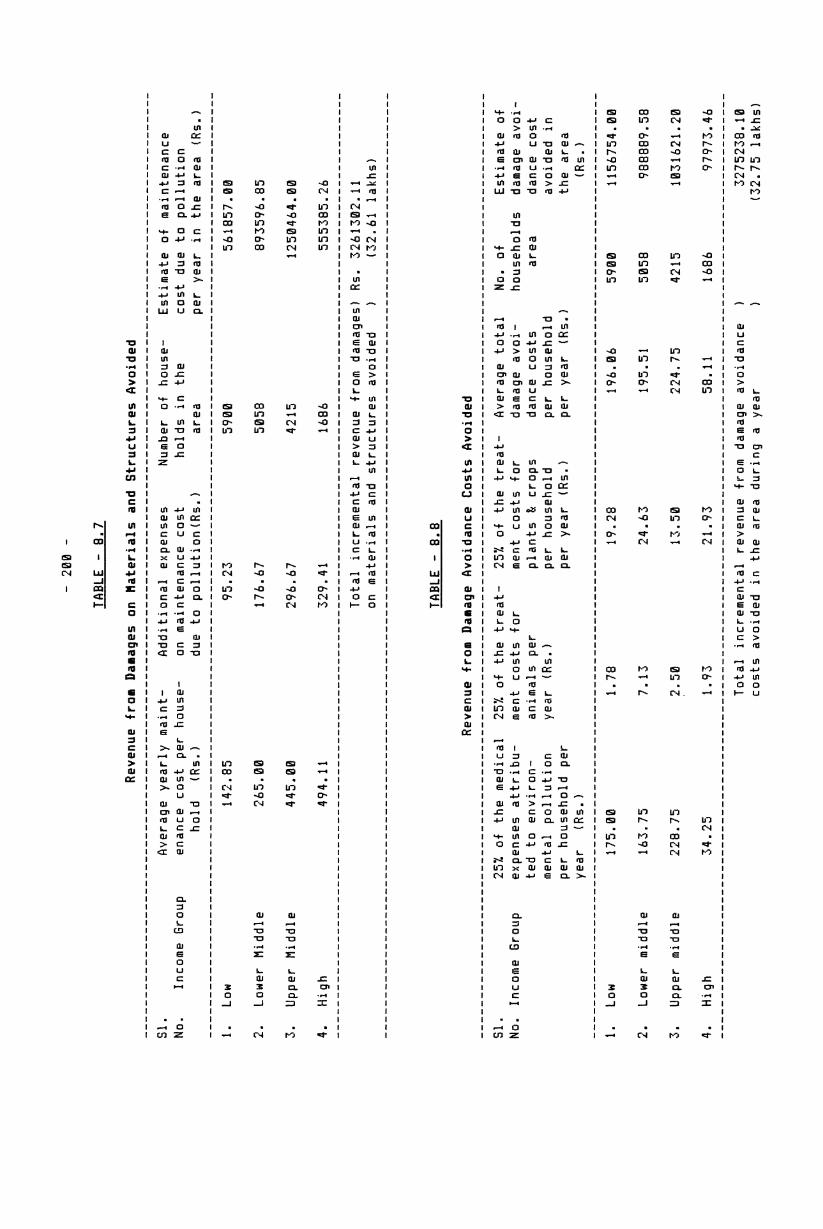
Amcxmfi mm.mmv A ham» m mcwgau mmgm mcu cw umuflo>m mumousfi.mmmmnmm . mu:mufio>m wumsmu EDL+ m::m>mL fimucmsmgucfi Hmuo»
o¢.m~m~o «meg H_.mm mm.Hm mo._ mm.¢m ;a_= .¢sm.fi~o_mafi mfim¢ mn.¢qm sm.m~ am.m m~.mum mfinufia Luau: .mmm.ommmmo amen _m.mo~ m¢.¢m m_.~ m~.m¢_ m_unfle Lm3o4 .u
es.¢mnenfiH seam os.oo_ mm.mfi m~.fi ss.m~« :94 .H
fi.mm. ..mm. Lmm>mmgm ms» ..mm. Lmw> Lma ..mm. Lam» Lma Lma uaoammzoz Lmacw umuMo>m nfionmmzon Lma nfiocmmaon Lma ..mm. Lmmx comuzfifloa Hmpcmeumou mucmu mmgm mumou mucmu maogu a mgcmfiq Lwa mfimeficm ::oLw>:m op um»
ufio>m mmmamn mumozmmzon uMo>m mmmemn Lo» mumou acme Lo» mumou yams aznfiguum mmmcmaxm azogm msou:H .oz+0 mgmewumm +o .oz Hausa mmmLm>¢ uummga mg“ +0 Nam uummgu ms» +9 xmm Hmufiume mg» +o Nmm .Hm
nmuwo>¢ mumou mu:mu_o>¢ mmmama sou» m::m>mm
m.m u u4m¢»Amzxma ~o.mmw . umuwo>m mmgzuuagum new mfimfigmume co~fi.msm«emm .mm Ammmmemu EOL+ m:cm>mL flmacmemgucfi Hmuop
em.mmmmnm emo_ _¢.omm -.¢o¢ now: .¢ss.¢c¢smm~ mHm¢ ne.¢om ss.m¢¢ manna: gmaaz .mmm.eommom mnsm h¢.¢nH ss.m¢m mafia“: puss; .m
sa.~mm~em seam mm.mm mm.m¢fi 30; .fi
~.mm. mmgm ms» cw ;mm> gun mmgm ..mm.:nwp:H~oa my man A.mm. nan;
:n_u:~Hoa up man ymou may cg mafia; umou mucmcmycwwe cu ummsoz Lma umou mucmcm asogm meou:H .ozmucmcmwcflms +o mymefiumm sumac; +o Lmnezz mmmcmuxm ~mcofiu_uu¢ uuawma >~Lmm> mmmgm>¢ .fim
umuMo>¢ mmgauusgum ucm mumwgmumn co mmmmuma non» m::m>mm
n.m I m4m¢»

CHAPTER - I
THE FINDINGS
Man is only one of the species of a rich and complexecosystem. Any system that he has created or the system hebelongs to is merely a part of this larger system. Hence heshould not overexploit the finite resources neglecting thewel¥are of other species. He should keep in mind the fact thatany of his activities that lead to the extinction or exhaustionof other species or resources will ultimately boomarang on hisown welfare.
In the past, the earth was considered as an iniinite reservoir o¥ resources. This resulted in reckless exploitation ofthe earth. People took the attitude of a "cow—boy economy”rather than a "spaceship economy".* Besides this conceptualiallacy, population and economic growth are responsible foraccelerated increase in resource use rate all over, resultingrapid depletion of natural resources and serious environmentalcontamination. Environmental pollution renders the resources ofenvironmental media unsuitable {or specific and establishedl-lE':E-355.
Eloor-Edayar Industrial belt which is located on theperipheries of the Ernakulam district is considered to be the
* In a cowboy economy success is measured in terms o¥ theamount of production; but the criterion for success in aspaceship economy is the maintenance of the existingcapital stock in good order. In the spaceship, theprovisions ~ earth's inhabitants and the life supportsystem - are to be conserved and allowed to regenerate toensure that they last for ever. Their reckless use, as ina cow~boy economy, will be disastrous.

- 262 ~
industrial capital of Herala. The industrialists in this areabehave as if they have perpetual rights over the area to doanything. They dump tonnes of toxic chemicals, acids, radioactive substances, metal residues, obnoxious gases and otherpollutants in the environmental media of the area. These toxic(airborne as well as earth bound) pollutants endanger not onlythe lives of the present (both plant and animal) generation butthe future ones also. Fishes die along the coast, plants andcrops wither, cattle imbibe deadly poisonous substances, anddrinking water is contaminated - all due to the activities ofthe factories located in this region. Thousands of people inthe area are denied of fresh air and drinking water. Pollutants from industrial units seep into the water and consequentlywater in the area becomes unsuitable Tor human and animalconsumption. The factories on the banks of the river treat theriver as a sewer. Heavy loads of pollutants are flushed intothe river. This pollutants reach the Vembanad backwatersthrough the river and convert it into an aquatic desert. Theseriousness of the pollution problem in the region can berealised {rem the iact that breast*¥eeding children may gettraces of DDT from their mother's milk.
Our study leads to the Tollowing conclusions:1. The environment o¥ the project area is heavily polluted.
Natural reasons and human activities are behind it. Thepollution caused by natural Torces implies principally thesalinity intrusion into the river contaminating the waterintake points of the factories. The manwmade pollution in

—- 22932: ~
the area is mainly caused by effluents, emissions, solidwastes and sound from industrial production and processing.
The various industrial contaminants seeping into the groundhave contaminated the ground water rendering it unsuitablefor consumption, especially in places at the lower reachesof the Eloor branch of Periyar flowing through the projectE-l|"'Eél.
The dumping of thousands of tonnes of toxic chemicals, metalresidues and other biomagnifiable wastes into the riverPeriyar has made it virtually a sewer and Vembanadbackwaters an aquatic desert.
The- factories cause atmospheric pollution in an area ofabout five kilometer radius around the industrial belt.
Mercury, insecticides and radioactive substances are amongthe major pollutants let out by the factories of the area.These are neither treated nor is there any know-how fortheir treatment. The consequences can be disastrous to allforms of life of the area, now and in times to come.
There are serious adverse impacts of pollutants on thehealth and welfare of the humans and domestic animals, oncrops and other vegetation, and on materials and structuresof the area.

In
~ BB4 *
Besides the social costs of environmental pollution onaccount o¥ reduced welfare, longevity and productivity, thepeople of the locality have to bear the economic losses dueto ill~health and loss of income, and increased expendituredue to blighted crops and corroded materials and structuresof the area.
The incidences of respiratory, heart, genetic and skindiseases are highly Treguent among the residents o¥ thearea; the children in the households are worst hit; andabout 49 to 45 per cent of the people of the project areaare suffering Trom one or more diseases induced or accentuated by the pollutants let out Trom the factories; and ~
The environmental protection o¥ the project area iseconomically Teasible when appropriate measures are adoptedto achieve the desired goal o¥ optimum environmental qualitywithin a period of ten years. The economic Teasibility hasbeen established as the projected incremental bene¥itsexceed the incremental cost of such a programme.
the light o4 the present study, the following recommendations are made to improve the situation:
It is important to develop ecotechnigues to create outputwith less scarce resource embodiment. Exhaustible and
0'
renewable resource augmenting technological progress enableper capita consumption of resources to remain constant. The

recycling of waste of all factories may be considered as aninterim measure.
Various social and economic costs due to environmentaldamages are to be included in the actual cost~pricecalculations of the producers.
Measures are to be adopted to arrest the criminal irresponsibility of the polluters for causing environmental damages.
Various social pressure groups and non-governmental organi~sations engaged in environmental protection activities areto be promoted and their demands conceded.
It is necessary to initiate appropriate measures to createenvironmental awareness and to impart environmentaleducation to the masses. Environmental education must bemade an essential part of the academic curriculum startingat school level to centinue throughout higher learning.
The attitude of the government relating to environmentalproblems must be guided by ‘life and death’ rather than ‘lawand order’ considerations.
The official environmental protection agencies must be givenexecutive powers to prosecute the polluters even when theculprits are public sector enterprises.

~ BB6 *‘
Adoption oi a compromise formula a¥ter discussions betweeno¥$icial agencies and polluting enterprises while fixingstandards and criteria is totally unscientific and undesirable; and
The polluting enterprises must be compelled to spend a de+i—nite portion of their paid~up capital or the sales turnover4or the prevention of pollution and the protection ofenvironment every year.

Agpendix - 2.1
T e United Netione Conference on Human Environment held etStockholm in 1972
United Nations Conference on Human Environment was held in
1972 at Stockholm to evolve a comprehensive action-plan for theprotection of global environment. The consensus at Stockholmcentered around the principles and the code of conduct governingenvironmentally sound development and international arrangementsconducive to it. The Stockholm conference highlighted the needfor the sustainable husbanding of planetary resources and theirequitable sharing to foster development in non~industria1 coun~tries facing the acute problem of poverty and to prevent thedegradation of environment in industrialized countries, notprudent in the use of technology.‘ It could legitimize theenvironmental concern by putting it within an enlargedperspective of international relations and co~operation.
The Conference identified six priority areas and threefunctional tasks for the United Nations Environmental Programme(UNEP).2 The six priority areas are:~1. human settlement, health, habitat and well-being;2. land, water and desertification;a. trade, economics, technology and transfer of technology;4. oceans;
1. Ignacv Sachs, "Environment and Development Revisited",filternativee ~ 9 Journel of word Policy, Sept.1982, p.383
2. Gladwin Hill, "U.N. Environmental Efforts : A Start, A LongWay to So" flew York Timeeg Dct EB, 1975, pp.1-4-Cf. Baumoland Dates, Economice, Environmental Policy and Uuelitv ofLife; Prentice Hall Inc., New Jersv (1979), p.296.

5. conservation of nature, wild-life and genetic resources; and:6. energy.
The three functional tasks are:~1. environmental assessment: "earth watch";2. environmental management; and
a. supporting measures : information, education. training, andtechnical assistance.
The action plan evolved in the Conference with thesepriority areas and functional tasks provided guidelines to makedevelopment socially equitable, environmentally sustainable andeconomically viable. Towards development, the Conference broughtout a balancing "ecodevelopment approach". That is, the conference held that development should proceed unobstructed exceptfor improving and protecting the environment side by side.3In contrast to various other international Conferences,Stockholm could attract the interests of developing and thedeveloped countries alike and all of them were involved activelyto reach at a consensus in the proceedings.

1897
1995
1912
1917
1919
1?19
IP23
1927
1946
1947
1948
1949
1951
1953
1958
1958
1963
1964
1958
xiiAPENDIX - 3.1
List of Acts for the oortection of Indian environmentsince 1897.
Indian Fisheries Act.
Bengal Smoke Nuisance Act.
Bombay Smoke Nuisance Act.
Mysore Destruction by Insects and Pests Act.
The Poison Act.‘Andhra Pradesh Agricultural, Pest & Diseases Act.The Indian Boilers Act.The Indian Forest Act.
Bihar Nastelands Act (Reclamation, Cultivation andImprovement)
(Regulation and Development)Mines and Minerals Act
The Factories Act (Pollution and Pesticides).
Andhra Pradesh Improvment Schmes Act (Land Utilization).
Industries Act (Development & Rgulation).Drissa River Pollution s Prevention Act.
Assam Agricultural Pests and Disease Act.Prevention oi Food Adulteration Act.U.P. Agricultrual Pests and Disease Act.Acquisition o+ Land Ior Flood Control and Prevention ofErosion Act.
River Boards Act.
Ancient Monuments and Archeological Sites and Remains Act.
Herala Agricultural Pests a Disease Act.Atomic Energy Act (Radiation Protection Rules 1971).Gujarat Smoke Nuisance Act.
Delhi Restriction o¥ Land Uses Act.The Inseticides Act.

1969
1979
1972
1974
19?é
1977
1983
1986
xiii
Maharashtra Prevention of water Pollution Act.
Merchant Shipping (fimendment) Qct. (harbour and CoastalWater, Dumping oF Oil etc.).wildlife Protection fict.water (Prevention & Control of Pollution) Act.
Urban Land fict (Ceiling & Registration).Hater Ceae (Prevention and Control of Pollution) Act.Air (Prevention and Control of Pollution) Act.The Environment (Protection) fict.

ANNEXURE I
FORMAT OF THE SCHEDULE.FOR THE FACTORY SURVEY
1.8 Introduction
1.1 Factory visited . . . . . . . . . . . . . . . . . . . . . . . . . . . ..
1.2 Personnel Contacted . . . . . . . . . . . . . . . . . . . . . . . . ..
1.3. Location of the Factory . . . . . . . . . . . . . . . . . . . . ..
1.4 Year of Establishment . . . . . . . . . . . . . . . . . . . . . . ..
1.5 Year of Commencement of Production . . . . . . . . . . . . . . . . . . . . . ..
1.6 Ownership of the Factory : Private/Public/Joint/Cooperative.
1.7.6 Cagital:
.1 Share Capital : Rs . . . . . . . . . . . . . . . . . . . . ..
.2 Paid up Capital : Rs . . . . . . . . . . . . . . . . . . . . ..
.3 Working Capital : Rs . . . . . . . . . . . . . . . . . . . . ..
1.8.3 flgmber of Employees:
.1.Number of Daily wage earners . . . . . . . . ..their pay Rs.....per day
I‘-J .6 Number of salaried people:
I’-J .1 Below Rs. 5&3 . . . . . . . . . . . . . . . . . . . ..
I‘-J .2 Between Rs.5@l & Rs.1@fl@ . . . . . . . . . ..
I’-J .3 Between Rs.1BB1 & Rs.15B@ . . . . . . . . ..
I'-J .4 Rs.15@l & above . . . . . . . . . . . . . . . . . . ..
1.9.@ Please give the following details:
Main Designed Rated Achieved Cost By products Cost perProduct Capacity capacity capacity per unit (HT) Unit (HT)(MT*) (HT) (MT) (HT)

I“-J
P‘-J r-
l'°-.3 I’:-J
I’-J I2.-J
2.4 D
X‘!
Hater Pollution - Effluent Treatment and Disposal
Quantity of water consumed per day: . . . . . . .......Ki1olitres.
Total Cess paid during a year : Rs . . . . . . . . . . . . . . . . . . . . . . . ..
Cost involved for the installations (eg: watermeters, powerconsumption etc.) as per regulations under the Cess Act:
Rs . . . . . . . . . . . . . . . . . . . . . . . . . . ..
Please give the following details:
Purpose for which wateris consumed
Quantityconsumed (Zage)Industrial cooling,sprayingin mine pits or boiler feed
Processing whereby watergets polluted and the pollu I’-J
tants are easily biodegradable11:11::::::1:no~c—ca:-—u—:-1—-a-uu—-c—¢n:—--—-¢nu—¢—:1—--nun:-1-—-—:a—u——-one-n:::n.n-—-——n.-can-:—-112111111111:
Processing whereby water getspolluted and the pollutants are l'-.J
not easily biodegradable andare toxic
I‘:-J I’-J I’-J I‘:-J
I’-J IIIII I SO‘-LI1-II:-IL.-ll-.Jn---S
IL.-I |’~.'.| 3-4
.16
water supplied to other factories: . . . . . . . . . . ..liters per dayCharge (rate) for which water is supplied . . . . . . . . . . . . . . . . . ..Do there exist any effluent treatment system? YES/NDIf No, please give the reasons:~Shortage of financeabsence of proper technologytreatment plant is yet to bethere is no waste waterthere is no pollutant in the waste waterother reasons, if any . . . . . . . . . . . . . . . . . . . . . . . . . . . . . . . ... . . . . . . . ..If YES, please specify which of the following treatment methods isfollowed:Recycle and fully recoverRecycle, partially recover and disposalRecycle and disposal
8 Please give the following details of effluent treatment:
installed
Details of the treatment5
Date ofinstalling
Investmentystems incurred (Rs.)

xvi
2.11.6 what are the major water pollutants:
I”-J I I--5 Co-I
l*~.‘| I---- 4:
If No, what are the
Whether
Permissblelimits
Intensity beforetreatment
Intensity aftertreatment
Are the existing systems functioning satisfactorily ? YES/NU
reasons? . . . . . . . . . . . . . . . . ... . . . . . . . . . ..
the measure (intensity) of pollutants are reduced to thedesigned/permissibale standard? YES/ND.
I“-J
.1
I"-J
L-4
UI
Products recovered
.15.B If No, what are the reasons:
Poor design
Hal-operation
Uld plant
Poor maintenance
No reason
Absence or proper technology
Any other:.... . . . . . ...........
Please specify whether any useful products are recovered from theeffluents, methods to recover them, cost involved and the uses ofthe recovered products:
Method ofrecovery (Rs.)
Uses of the recoveredproducts

xvii
2.17.8 If any, please specify the improvements required for the presenteffluent treatment systems:
New Period of Probable Standards to which the levelProposals implementation costs (Rs.) of pollutants will confirm toPollutants Standards
2.18.0 Number of employees in the treatment plants:
.1 Number of daily wage earners: . . . . . . . . . ...their pay......per day
.2.B Salaried people:
.2.l Below Rs.5BB . . . . . . . . . . . . . . . . . . ..
l"-J .2 Between Rs.SB1 & Rs.1BBB . . . . ... . . . . . . . . . . ..
I‘-J .3 Between Rs.l@Bl & Rs.l5flB.. . . . . . . . . . . . . . .....
.2.4 Rs.1S@1 and above . . . . . . . . . . . . . . . . . . . . . . . . . ..
.6 Total number of employees in the treatment plants:(.«--I
2.19 Where to the effluents are finally let out: . . . . . . ... . . . . . . . ..
2.22.6 Do you have any regular inspection of the effluent standard by anyagency/authority 2 YES/N0.
2 28.1 If YES, name the agency/authority . . . . . . . . . .... . . . . . . . . . . . . . . ..
2 26.2 Periodicity of inspection: daily/monthly/quarterly/yearly.
2.26.3 Remarks if any . . . . . . . . . . . . . . . . . . . . . . . . . . . . . . . . . . . . . . . . . . . ..
2.21 Effluent treatment plants are designed by . . . . . . . . . . . . . . . . . ..
3.9 Air Pollution Control and Treatment:
3.1 How many stacksfchimneys are there in your factory? . . . . ..Nos.
3.2.@ Please give the following details of chimneys/stacks:
Plants Heterials of Hight Diameter Quantity ofconstruction gas emission

3.3.3 Kindly
xviii
furnish the details regarding the nature of airpollution:
following
Source & Pollu- Quantity of Concentration Ground leveltant gases emission pollutants concentration(M3/hr.) (Hg!H3) (Hg/H3)
L4 3
IL-I u
U‘[.fl-t=I|;.-.|l‘-.Jt-
.6.0IL-4
Do you treat your waste gases? YES/NO.
If No, please indicaste the reasons:
Shortage of financeabsence of proper technologyTreatment plant is yet to be installedNo pollutants in the gas emittedPollution is not upto a significant levelOther reasons, if any . . . . . . ... . . . . . . . . . . . . . . . . . . . . . . . . . . . . . . . . ..
If YES, specify which of the following treatment method is adopted:.l recycle and fully recover
'3.-‘-I
L-«I I’-._J
recycle, partially recover and disposalrecycle and disposal
.7.fl Also, give the following details:
Permissiablelimit
Concentrationlintensity ofpollutionafter treat
ment(mg/H3)
Concentrationfintensity ofpollution be
fore treatment(mg/M3)
1::::&::1:i1u—-——n:u-11-:-1:—-2-1:-2-——o-nuz-—-:--—::-u1::c—n:nu:1:11in-uzju-nu:&:1n::c-.1.-211:1:111121

xix
3.? fire the existing treatment systems functioning satisfactorily?YESXND
3.1% If No, what are the reasons: . . . . . . . . . . . . . . . . . . . . . . . . . . . . . . . . . . ..
3.11 Whether the intensity of pollutants are reduced to thedesigned/permissible standard? YES/ND.
3.12.3 If No, what are the reasons:
Poor designHal-operationOld plantPoor maintenanceNo reasonAbsence of proper technologyIf any other... . . . . . . . . . . . . . . . . .. . . . . ... . . . . . . . . . . . . . . . . . . . ..*-«J U‘ [J1 -PI l:,.°.I I"-J H
3.13.6 Please specify whether any useful products are recovered from theemissions, methods adopted to recover them, cost involved and the uses ofthe recovered products:
products Hethod of Recovery Cost Uses of the recoveredrecovered products
3.14.6 Please specify the improvements required for the present wastegases treatment systems:
lmprovements Probable Period of Standard to which the level ofrequired cost implemen- pollution will confirm to.tation ----------------------------- -
7.15.6 No.of employees in the air pollution control activities:
Number of daily wage earners: . . . . . . . . . ..their pay Rs. ...per dayNumber of salaried people:Below Rs.5@@ . . . . ... . . . . . . . . . ..Between Rs.5@1 & Ps.lB@B . . . . . ..........Between Rs.1BB1 & Rs.l5fi@ . . . . . . . . . . . . . . ..Rs.15B1 & above . . . . . . . . . . . . . . . . . . . . . . . . . ..r-J I"-J I‘-J I‘-J I‘-J r- -ta IL-'-I |'~.] r- S

3.16.3agency/authority ? YES/NO
Do you have any regular inspection of air pollution standard by any
1 If yes, name the agencyfauthority . . . . . . . . . . . . . . . . . . ..2 Periodicity of inspection. . . . . . . . . . . . . . . . . . . . . . . . . . ..
3.17 Air pollutant treatment plants are designedby:............. . . . . . . . . . . . .... ... . . . . . . . ... . . . . . ...4.8 Solid waste Treatment and Disposal:4.1 Do you have a solid waste treatment system? YES/NU4.2. If No, please give the reasons
There is no solid waste in the production process.2 Solid waste does not contains polluting elements.3 No treatment system exists.4 Treatment system is yet to be installed.5 Absence of technology.6 finy other . . . . . . . . . . . . . . . . . . . . . . . . . . . . . . . . . . . . . . . . . . . ..
4.3 Kindly furnish the following details:Solid waste contents Pollutants Concentra- Concentra- Permi
tion before tion after ssibletreatment treatment limit
.1 --------------------------------------------------------------- -
.4 --------------------------------------------------------------- -
.5 --------------------------------------------------------------- -
.6 --------------------------------------------------------------- -
4.4 Quantity of solid waste:..............tonnes per day.4.5 Total cost of waste treatment and disposal:Rs.....per day4.6 Briefly describe the method of treatment & disposal: . . . . ..
4.7 whether there is any useful products recovered form the solidwas YES/ND4.8. If YES, give the following details.Products Method of Cost Income from the Uses of therecivered recovery (Rs.) sale of recovered recoveredproducts products
.1 ------------------------------------------------------------------- -
.2 ------------------------------------------------------------------- -
.4 ------------------------------------------------------------------- -
.5 ----------------------------------------------------------------------- -
.6 ------------------------------------------------------------------- -4.? Responsibility of the solid waste disposal is of 4: Municipality}Hanagement/ any other agency . . . . . . . . . ... . . . . . . . . . . . . . . . . . . . . . . . . . . . . ..4.1B.@ Nature of location where the solid waste is finally disposed to:
.1 Factory’s own land
.2 Private property
.3 Governments property
.4 Any other . . . . . . . . . . . . . . . . . . . . . . . . . . . . . . . . . . . . . . . . . . . . . . . . . . ....5.B Noise Pollution Control:5.1 What is the noise level near the factory . . . . . . . ..decibels5.2 Permissible limit/accepted standard . . . . . . . . . . . . ..decibles

XXI
5.3.8 Cases of disablencess observbed due to excess of noise:5.3.1 temporary: . . . . . . . . . . . . . . . . . . . . . . . . . . . . ... . . . . . . . . . . . . . . . . ... . . . . ..
4 3 2 Permanent:..... . . .. ........ . . . . . . . . . ... . ........... .5.4.@ :i;;;.1£;;';&é£.;é'££.';r3;£;',3.3{;.é'.3.;ii.1£{£.£.§l """""""""5.4 1 machineries or equipment installed and their cost: . . . . . . . . . . . . . . ..
= 4 2 '£«;.iL.;;i'i.'.;;L..1;;,'AiéfiiéilliIIIIIIIIIIIIIIIIIIIIIIIIIIIIIIIIIIIIIII6-B é;;;;;i.A;;i;;;; . . . . . . . . . . . . . ... . . . . . . . . . . . . . . . . . . ... . . . . . . . . . . . ..
6.1.9 If any, please give the unexpectedfnew pollutants resulting from thetreatment of pollutants:
New pollu- Level of Pollutants Level of New Pollutants Level Anytants from pollution resulting pollution from the solid of pol- otherthe water from the waste treatment lutiontreatment gas waste
treatment
6.2 What are the methods adopted to treat the resulting new pollutants andwhat is the cost incolved?
6.3 Do any other factory's effluentsfemissions cause deterimental impact onyour functioning ? YES/NO
6.4 If YES, please give the following details:—
Name of the Pollutants How they affect your functioningfactory (& cost involved)1 1 Haterials/Products:2 2. Personnels directly or
indirectly3 3 figriculture:3} """"""""""""""""""""""" "}i"$.I§..I;I;I """"""""""""""""""""""" "
73 """""""""""""""""""""""" "é"'£{,I;";£§;EI """"""""""""""""""""""""" "
;fé."""mI;£"';.?;"{§;"E;.;;.§{;;";{.';«§;;{;.§T;'"Q55;"ELI;';;;J;'£?;§{;..TI;’££.cost)................. . . . . . . . . . ... . . . . . . . ... . . . . . ... . . . . . ...............
6.6 Please indicate the Zage of increase in cost due to the expenditures onpollution control schemes . . . . . . . . . . . . . . . . . . . ..
6.7.8 Please give the following information

Percentage of
Increase in costdue to pollution
Cost of production whenthere is no pollution
Products control measures adopted contrtol increase.1 ----------------------------------------------------------------------- -
.4 ----------------------------------------------------------------------- -
.S ----------------------------------------------------------------------- -
.6 ----------------------------------------------------------------------- -
.7 ----------------------------------------------------------------------- -
.8 ----------------------------------------------------------------------- -
.9 -------------------------------------------------------------------------- -
.16 ----------------------------------------------- -- --------------------- -6.8.6 Impact of increase in production cost on demand and the sale of the
products:.1 Quality sold remain unchanged.2 Quantity sold gets reduced by....................per cent..3 Quantity sold is increased by.... . . . . . . . . . . ......per cent..4 finy other possibility......... . . . . . . . ................ . . . . ..
6.9 Do you think that a joint effort by all (or more than one)factories in the locality will greatly save the cost of pollutioncontrol? YES/ND
6.15.8 If no, please give the reasons:.1 A joint effort is not possible.2 Other factories are not willing.3 That may adversely affect competition in the field of production &
sale.4 Cost of production will be more than that at present5 Any other..... . . . . . . . . ... . . . . . .......... . . . . . . . ... . . . . . . . . . . . . ..
6.11 B If your answer to question No.6.9 is YES, please give the following
Suggestions for a jointtreatment system
information regarding the advantages of a joint treatment system:
Zof reduction incost/benefits
.1 l.ln the cost of3 """""""""""""""""""""" ",§.?;;.§.Z{{3.§ """""""""""""""""""""" ”
1?. """""""""""""""""""" ";?."E;;{{;I'{.IJ;;{.I;.1.'£ """""""""""""""""""" "TI; """""""""""""""""""""""""""""""""""""""""""""""" "TE, """""""""""""""""""""" '%"'é;;I;I';;};2£Z;};' """""""""""""""""""""" "
I. """""""""""""""""""""""""""""""""""""""""""""""""""""" "’3 """""""""""""""""""" TI{.;;”;£fi;.? """"""""""""""""""""""""" "
6.12 Increase in export prices due to treatment expenditures .........percent.

7.
.16
B
F-J
xxiii
Does this increase in cost causes severe consequences on yourcompetition in the loreign market ? YES/NDIf IIIIIIIIII I I I I IIIIIIIIIIIIIIIIII
Honey spent by R& for designing and installing the treatmentsystems:Yearly (at present) Rs . . . . . . . . . . . . . . . . ..Total expenditure incurred so far Rs........ . . . . ... . . . . . . ..
Do you have a separate department for environmental protection andpollution abatement? YES/ND

Annexure II
FORMAT OF THE SCHEDULE FOR THE HOUSEHOLD SURVEY
1. Head of the Household
2. Name of the Household
3. Panchayath : Hard:4. Number of members in the
Household
5. Details of the Household members :
Name Relationship with Educational Employment Monthly incomethe Head of the qualification wages/Salaries
Household
Name Casualty or temporarily Cantinuing Number of workdays losteffected diseases diseases due to diseases during
last one yearizjjjijjrxij-—--an--nun:1un--n—n:::--:.:¢.-:unn::oa—--—-:--oi.-nu:3...-.2-—:—-—-:11--11----:1-—::::::::j:::
7. Last years total medical expenses.(Rs.): . . . . . . . ... . . . . . . . . . . . . . . . . . . ..
8. Amount received from the employer towardstreatment during the last one year.(Rs.): . . . . . . . . . . . . . . . . . . . . . . .......
9. Land holding of the household : . . . . . . . . . . . . . . . . . . . . . . . ..
Land (Purayidam) . . . . . . . . . . . . . ..Hactares . . . . . . . . ..Ares:.........
Field (Nilam) ..... . . . . . . . .. Hactares . . . . . . . ..Ares: . . . . ......
Total . . . . . . . . . . . . . . . .. Hactares............Ares
16. Details of Cultivation.1:1:11:1:11:12--——-11:1:-—-—-—::—-u——oo—::—-1:::n—g—-:-njun-:-a--—nc-n-pa-o—n--1-—n¢n—n:nu—::c—:1-::1::::x:::
Crops Area under Cultivation Yeardly Crops Area under Vearly(In come) Cultivation (In come)
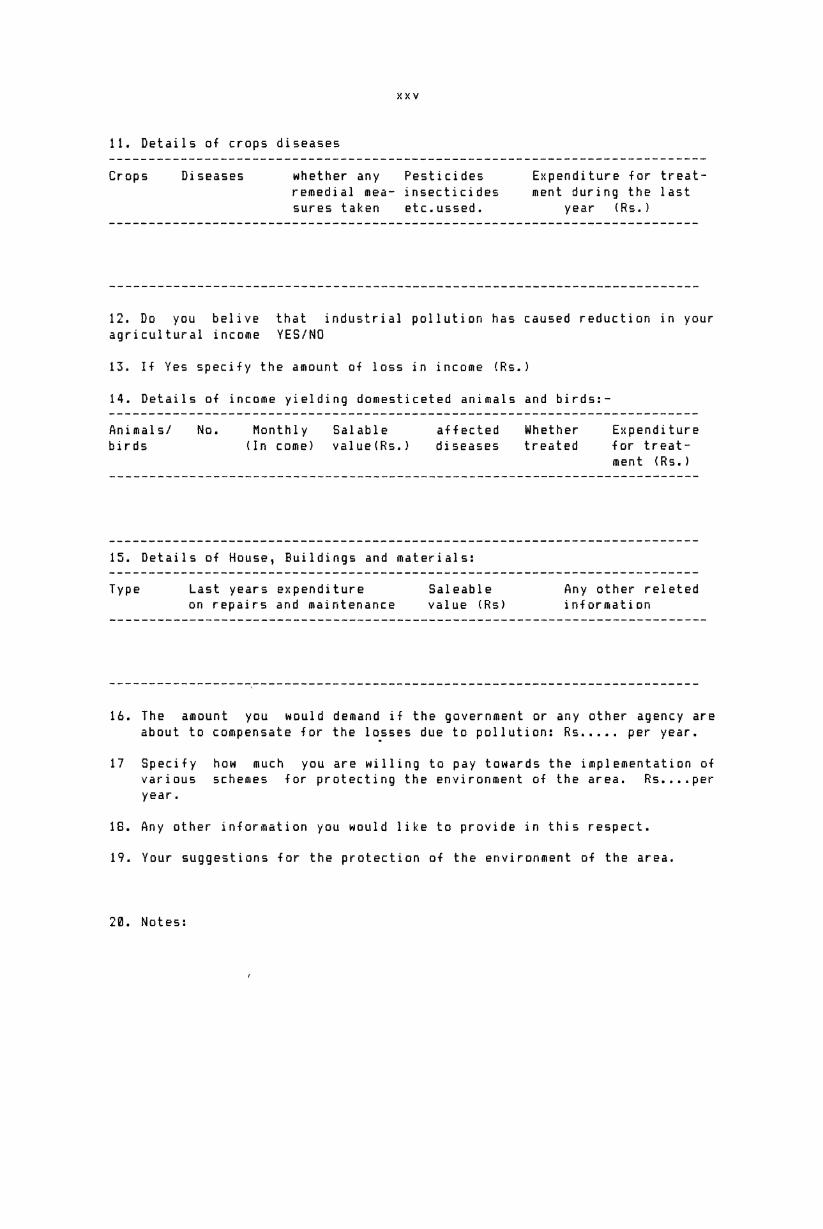
XXV
11. Details of crops diseases
Crops Diseases whether any Pesticides Expenditure for treatremedial mea- insecticides ment during the lastsures taken etc.ussed. year (Rs.)
12. Do you belive that industrial pollution has caused reduction in youragricultural income YES/NO
13. If Yes specify the amount of loss in income (Rs.)
14. Details of income yielding domesticeted animals and birds:
Animalsl No. Monthly Salable affected Whether Expenditurebirds (In come) value(Rs.) diseases treated for treatment (Rs.)
Type Last years expenditure Saleable Any other reletedon repairs and maintenance value (Rs) information
12:1:1:211:-nuu—c—-o1u—a-—a—:—---o—-—n:-—u-n-no-—-—c——-:n—n—---nu-unnu--n-nano-u—-u—:-——n—.1u—-—-—c—u-—-us:-1-::2:11:111:
16. The amount you would demand if the government or any other agency areabout to compensate for the losses due to pollution: Rs..... per year.
17 Specify how much you are willing to pay towards the implementation ofvarious schemes for protecting the environment of the area. Rs....peryear.
18. Any other information you would like to provide in this respect.
1?. Your suggestions for the protection of the environment of the area.
23. Notes:

ANNEXURE IIIFORMAT OF THE SCHEDULE FOR EMPLOYEE WELFARE SURVEY
l.Introduction1. Name
Age and marital Status :I"-J
a. Nature of employment4:: Name of the factory
Years of serviceU1
6. Monthly salary-4 Place of residence :8. Distance from the factory :
II. Occupational and Health Aspects
?. Have you been on medical leaveduring the last five years
lb. How many days a year
11. Reasons for leave
12. Period of hospitalisation :13. Are you a patient of (and how long):
a. Asthma F. Cancerb. Tuberculosis g. Hearing troublesc. Bronchitis h. Eye troublesd. Skin disease i. Any other2. Genetic disorders
14. Give the detils if any of your family members are suffering fromany of those diseases.
15. Costs of treatment duringthe last year
16. Amount claimed for reimbursement and the amount obtained
id. Have there been any accients in your factory or in the neighbouringfactories in the recent past ? If so, give details:
Factory Nature of Consequences Remedical measuresaccidents adjusted
24. State your comments on the environmental pollution of Eloor-EdayarIndustrial belt
25. Propose your suggestions
26. Notes:

"mmyozo.mLo~uou nu“: cofimmsumflu ms“ +0 mmpscfizmgmzpocfixmHmcfiummpcfiuflumcmmugmmxxgoumgfiammm"»:maummLu Lo» umuhoamg mpcmfiumm +o .ozn..mm> "mac: mEwm.__:z\uw::u\.Hm..Zamo_._ m:.Z +0 memz
>m>m=m 4¢»~mmo: uzp mom m4=am:um
u:» no »¢:mog>~ n mmaxuzzc

BIBLIOGRAPHY
ARTICLES:
finil figarwal, “Policies oi Environment”, The Illustrated Neeklvof India, Sept 1, 1985.firun Ghosh, “The 19G?~GB Budget: Q Birdsweve View of CentralExpenditures", Economic and Politicel weekly, fipril 11, 1987.Bharat Dogra ,”Ge1etic Erosion of Plant wealth" Yojana October1é"31, 1985.
Chakraborti D. and Chakravorthv R.,”Chemicals PolluteEnvironment”, Science Reporter. August, 1983.
,Dakshina Hurthv H.G., “Politics of Environment”, Economic andPoliticel weekly. May 3, 1986.Das T.M., "Programme oi Environmental Science,“ paper read inthe Firet Netionel ’1vironmental congress, New Delhi, Dec.EBMSB, 1982.
Dilip K. Biswas, "Environmental Programmes o+ the Government oiIndia”, paper fiFE5E1tEd in the Conference of Hon GovernmentalOrganisations working on Environmental protection Marc: 11~13,New Delhi, 1982.
Dinesh Hohan, "Food Us Limbs: Pesticides and Physical Disabilityin India”, Economic end Politicel weekly, March 28, 198?.Gadgil R.L., “Tolerance of Heavy Metals and the Reclamation oiIndustrial waste", Journal oi applied Ecology vol.o, 1959.Gopalan U.K., Environmental Consciousness , paper presented atthe world Environmental Dev Geminer on Development andEnvironment. Cochin, June 5, 1982.
Gordon R.L., "Q Re~interpretation of the Pure Theory o?Exhaustion”, Journal oi Politicel Economy ?5, pp.2?4-85, 195?.Gray. L.C., "The Economic Possibilities of Conservation”,Duarterlv Journel oi Economics, 32, pp.B2~9S, 1912.Gupta H.B. and Halik G.B., “ Environment and its relation toGpirit*al Education”. in the iire Hetionel Environmentalcongress, New Delhi, Dec.2B~3B, 1982.
Hansen J.fi.,”Towards an Ecologically Based Economic philosaphy",Environmental conservation. vol.4., 1977.Hardin Garrett, “ WE Tragedy of the Commons”, Gcience 1&2,pp.1243~4B, 1968.

Hottelling H., “The Economics oi Exhaustible Resources”, Journalof Political Economv, 39,pp.13?~75, 1831.
lgnacy Saches, “Environment and Development Revisited",elternatives ~ 8 Journal of Norld Policv, September 19“2.Jagdish Eahadur, “Environmental problems in Developing Hvmalavanwater Resources", Yojana, November 1é~38, 1988.
Jyoti H. Parikh, " Environmental Problems in India and PossibleTrends in iuture“, Environmental Conservation (quarterly) Vol.4,182?. ’Leelakrishnan P. and Ohandrasekha*an N.8.,”Prevention andcantrol oi water pollution. Need to Make Law Efiectivez, paperpresented at the National seminar on prevention and Control oiflater Pollution: Problems and Pers ectives, Udvogamandal(Kerala), October 1é~1?, 1881.Narqaret R. Biswas, "figricultural Productions and Envi*onment: 8Review”, Environmental Conservation. vol II No.3, 1984.Martha N. Gilliland, "Q conceptial Framework for Environmentalprotection”, Environmental Management Vol.8, No.6, November,1984.
Namboodiripad P.U.8., "The fiir Ne Breathe”, paper read at theworld Environmental Dav Seminer, Cochin, June~5, 1982.Nammalwar P., "Pesticides Pollution in Narine Environment”,Science Re orter September, 1884.News Reports, The Economic Times, February 12, 1882 and Nov.
1985.
‘he Hindu, October 24, 1982, Julv 24 and December13, 1883, Narch 31, 18“S and July 2, 1985.The Hindustan Times October 18, December 12, and13 1985, and Februarv 1?, 1988.
Indian Express, fipril 1 July 18, and fiugust 1,1882, epril 1, Julv 18, and 38, 1883, September 4,1984, March LE, September 18 and 26, 1886.[he Times oi India, Julv 28 a 29, 1982, fipril 4,1983, Pebrvarv 28, 21, and Julv 2?, 1885, January2? and November 5 8 8 1886.
‘J
Osman H.K.(198&), ”E¥$ects of Environmental Pollution on Health”paper read at the National Seminar on “Save Periver”.fissociation For Environmenta protection, filwave, December 7,1286.

Padmanabhan v.T., “The Number Game w e Studv of OccupationalHealth Hazards at l.R.E., filwave”, Economicsand Political weeklv, March 8»1S, 1886."all within Limits: Radio active wasteDisposal at l.R.E.~I”, Economic and Politicalweekly, Feb.28, 198?.“all within Limits: Radio active wasteDisposal at I.P.E~II“, Economic and Politicalweeklv, March ?, 188?.
Raghunandan D., "Ecology and Conseiousness“, Economic andPolitica weekly, March 28, 188?.Raja Ramanna, Inagural address at the world Environmental Davfieminer on Development and Envi"onment, Cochin, June 5, 1982.
Rao U.R., “Remote Sensing {or Environment Monitaring: Presentand Future Opportunities", Paper read in the First NationalEnvironmental Congress, Dec. 28"3W, 1982.
Robert P. Lamb and Seiiulazis L.Miles, “Population andDevelopment: Envi“onmental Perspectives”, ErvironmentalConservation, volwll, No.3, autumn, 1884.
Sachitanand H.N., “The Growing Pesticides Hazards”, HinduDaily, June 34, 1883.Sankaranaravanan H.C. and Harunakaran v., fidaguacv o¥ Tools andtechniques in Evaluating Envrionmental Impact“, The NationalEnvironmental seminar, January 1a~1s, Cochin, 1883.
Sankaranaravanan H.C. and Karunakaran v., "Economic Growth andEnvironmental quality”, 8outhern Economist,_June 15, 1883.
Sapru P.H., “Environment fidministration: Structural and PolicyIssues in India“, Management in Government, January-March,1985.
Shvnama C.8. and Balakrishnan H.P., "save perivar which way toProceed”, paper read at flational seminar on “Save Perivar”,association ¥or Envrionmental protection, filwave, Dec.?, 1986.Subhash Chandre Sarkar, “Envrionmental planning must subserveDevelopment”(Review), Commercg, February 15, 1986.
Sukumaran K., (justice, Herala High Court) address Deliveredat the world Environment dar seminar, Cochin, June 5, 1982.Susan 8.Hadden, "Statutes and standards ior Pollution Controlin India”, Economic and Political weekly, fipril 18, 198?.

-.2 -._.- s: '-H 1'1» 4''. :'s 1 -~
Taghi Farver H., "The Interactions oi Ecological and socialsystems“, in William H. Mathews (Ed.) Outar Limits and Humangages, The Dag Hummarskjold Foundation, Uppasala, 19?é.
Trinif Ranjan Hitra, “Economics and Ecology of Man”, paperpresented at the First National Environmental Congress, Dec.28*30, New Delhi, IEBE.
Uma Devi S.,”International Economics”, nstituta oi Corra§pon~dence course, Kerala Universitv, 1985.venugopal P., "Polluted Flows the Perivar“, Indian Ekpreaa,Dec.o, IBBB.
venugopal P., ” Pollution seeping into Drinking Nater_Too“,Indian Express, Dec.12, 198$.
BOOKS:
nllen Cottrel, Environmental Economics, Edward firnoldPublications Ltd., London, 19?B.fillen S.N., Conaervino Natural Reaourcas: Principles andEgactica in amDemocrac , NcGraw Hill, New York, (1985).
eshok. S. Guha, an Evolutionary viaw of Economic Growth, OxfordUniversitv Press, New York, 1981.
fivres and Hneese, Economica and tha Environment, John HopkinsPress, Baltimore, U.S.fi., 1969.Barbara ward Erogress for a Small Planet, Penguin Books,England, 1979.
Barbara ward and Rene Dubos, Onlv Ona Earth: Tha_Care anda SHaintenance of mall Plantet, Norton, New York, 1972.
Barry Commoner, The Closing Circla, Bantam Books, New Vork,l9?2.
Baumol and Oates, Economica, Environmental Policy and Oualitvoi Liie, Printice Hall Inc., New Jersv, 19?9.Bertell Roosalie, Hand book {or Eatimating Haalth Effecta TromExposure to Ioniaing Radiation, Institute of Concern Tor PublicHealth, Toronto, Canada, Ministry oi Concern for Public Health,Bufmalo, USQ and International Radiation Research and T'ainingInstitute, Burmingham, UK, IBB4.
Bertelmus Peter, Environmant and Develoament, Allen and Unwin,Boston, 1986.
Brian Goodall and findrew Kirbv (Eds.}, Resources and Planning,Pergamon Press Ltd., Oxford, 19??.

-:'.:°." ' .....~- 3''; 1''; .:'$ 1 1
Centre Tor Science and Enviroinment, The State of India'sEnvironment 19S4~S5: The Second Citi:en’e Report, Centre TorScience and Environment, New Delhi, 1985.
Charles Cooper, Economic Eveluction end the Environmegg Hodderand Stonghtan, London, 1981.
Ciriacv~Nantru Resource Conservation: Economics and Policy.7 ‘J .......... _. '.|University oi California Press, Berkelv, 1956.Colin Nacfindrews and Chia Lin Sien, Developino Economies andgee Environment: The South~Eeet fiegen Exgegience, NcGraw HillInternational Book Company, Singapore, 19?9.
Dales J.H., Pollution, Prooertv and Prices, University ofToronto Press, Toronto. IRSB.
Dalv Herman E (Ed.), Toward a Steedv Sta e Economy, N.H.Freeman, San Francisco, 1973.
Darryl D’Nonte, Iemplee or Tombe? lnduetrv Versee Environment:Three ContreversgesJ_ Centre {or Science and Environment, NewDelhi, 1985.
Das Gupta fi.K., [fie Economics of fiueteritv, Cxiord Unive*sityPress, New Delhi, l9?S.David N.Urr and Narvin S.Soroos (Ed.), [fie Slobel Predicament:Ecological Perspectives on world Urder, iiversitv of NorthCaliiornia Press, U.S.fi., l???.Digvijay Sing, Ifie Ecomvote, Printice Hall of India Pvt. Ltd.,New Delhi, 1985.
Dominic Alheritiere, Environmental Impect Assessment andfioriculturel Develo'ment, FRO, Rome, 1982.
Donald R. Kelly et.al., The Economic Super Powers end theEnvironment ~ the U.S.fi.t1e .S.S.R.and Je“an, N.H. Freeman andCompany, San Fransisco, 1R?é.
Edward Shapiro, flecroeconomic fiielysis, 3rd Edn., HocurtBrarcea Invsnoich Inc, New York, 19?4.
Ehrlich Paul and Ehrlich Anne H., Populetion. Resources,Environment 2 Issues in Humen Ecoloov (2nd Ed.), Freeman, SanFransisco, 1?72.Elliott H. Blaustein, Rose T. Blaustein and Peter Sreenleai,Your Environment end You: Understandino the Pollution Problem,Ucceana Publications lnc., Dobos Ferrv, New York, 19?4.Elv R.T. and Nehrwein G.S., eend Economics, University oiNisconsin Press, Madison, lR4@.

""' 3-i 3-1 X 1 1 1 ""'
Eric fishbv, Beconciling Man with the Environment, DxiordUniversity Press, New York, l??B. 'Eric L. Hyman, The_yses, Veliditv end Reliability of PerceivedEnvironmental Quelitv Indicetorei East~Nest -ivironment andPolicy Institute, Honolulu, Hawaii, 1981.Eric P Echolin, Down to Earth: Environment and Human Needs,Pluto Press, London, IPBE.Essam ElwHinnawi and Manzur U1wHaque Hashmi(Ed.}, GlobalEnvirggmental IssueeJ Tvcoolv International Publishing Ltd.,Dublin, IP82.
Eugene Ddum oi Ecoloov, N.B.Saunders,, FundamentalPhiladelphia, 19?‘.
If!
Fedosevev P., Social Problems of Man’s Environment: where MeLive and work, Progress Publishers, Moscow, IPBI.Food and egricultural Organisation iFAD), Pesticides Residuesin Food : 1982 Evaluetione, plant production and protectionpaper 4?, Home, 1983.
Frolov I., Globel Problems and the Future of Mankind, ProgressPublishers, Moscow, IPBE.
Barret Hardin and John Baden (Eds.), Managing the Commons, H.H.Freeman and Companv. San Fransisco, IP33.
Gerald M. Martin et.al., Environmental Coneideretione forBiomee Enerov Development. East~Nest Environment and PolicyInstitute, Honolulu, Hawaii, 1?B1.Gofman John N., Radiation of Humen Heelth, Pantheon Books, NewYork, 1983.
Gordan E Beanlands and Peter N. Duinker, en EcologicalFramework for Environmentel Impect eesessment, Institute {orResou*ce and Environmental Studies, Delhousie University,Halifax, Nova Scotia, Canada, 1983.
Borden L. Bradv and Blair T. Bower, fiir Qualitv Management:Quantifying Begeiits _L Eastmwest Environment Policy Institute,Honolulu, Hawaii, 1?81.
Herman Hahn, William Brown and Leon Martel, The Next EEBBears, Nilliam Morrow, New York, 19?6.
Hinde L.E. Jr. and Loring w.c., The Eiiecte of ManmadeEnvironment on Health and BeQeg;ge§,_Castle House PublicationsLtd., fitlanda, u.s.a., 19?9.International Labour Organisation (ILD), Encvclopaedia ofUccupationel Health and Saftv, volwll, Geneva, IPBE.

IUCN, Qgggeggation of Ecolooical Processes, Commission onEcology ~ paper 8, IUCN, 1984.
James Bridgeway, The politics of Ecology, E.P. Dutton & CompanyInc., New York, 1979.
Jarret H. {Ed.), Environmental Qualitv in a Growing Economy,John Hopkins Press, Baltimore, 1966.
Joe E. and Middle Brooke, Industrial Pol1ution~vol.I, JohnWiley and Sons, New York, 19?P.
John Q. Butlin (Ed.), Economics and Resources Policy, Longman,London, 1981.
John E. Heer and Joseph D Hagertv, Environmental fissessmentsand Statements, van Nostrand Reinold Company, New York, 197?.
John H. Duiius, Environmental Toxicoloov, Edward srnoldPublishers Ltd., London, 1?BG. 'John M Edington and finn M. Edington Ecoloov and EnvironmentaLPlanning, Chapman and Hall Ltd., Londan, 197?.
Joseph Julian, Gocial Problems, Printice Hall Inc. New Jersey,1989.
Katherine Montague and Peter Montague, No world without End:The Threats to Our Biosphere, Pulman, New York, 19?é.
Kenneth E.F. watt et.al. The Unsteady State: Envi*onmentalProblems, Growth and Culture, "East~Nest Centre, TheUniversity Press of Hawaii, Honolulu, 1??7.Kerry Smith v., Gcarcitv and Growth Reeonsidered: Resources forEuture, the John Hopkins University Press, Baltimore, 1979.Hneese, Economies and Environment, Penguin Education Series,London, 1??7.
Krister Hjalte et.al., Environmental Policy and NeltareEconomics, Cambridge University Press, Londan, 1??7.
Kurt Dop§er (Ed.), -oonomics in the Future, the MacMillianPress Ltd, London, 19?é.Larrv Horn (Ed.}, The Dne~Straw Revolution, Rodale Press,Emmaus, 1?7G.
Lowe J. Lewis D and fitkins M, Total Environmental Cont"ol: TheEconomics o¥ Crosswfledia Pollution Transier, Pergaman Press,New York, 1?G2.
Malcolm Slesser, The Politics oi Environment: Q Guide toscottish Thought and fictian, George fillen and Unwin Ltd.,London, 19?2.

Mann R.E., Envifionmental Impact fissessment, SCOPE, John Nileyand sons, New York, 19?v.
Marshall I Goldman, Ecology and Economics, Printice Hall Inc.New Je*sy, 18?”aJan‘
Maynard M. Huischmidt et.al., Environment, Natural Syatems andDevelopment, the John Hopkins University Press, Baltimore,1983.
Meadows Donnella H., Meadows Dennis L., Randers Jorgen andNilliam Behrens, The Limita to Growth, Signet, New York, 1972.Michael Radclift, Developmant and tha Environmental_Crises,Mithuen & Company Ltd., London, 1884. ‘
.rovic and Edward Pestal, Mankind at the TurningMihajlo MesaP. Dutton, New York, 18?4.Point, E.
Mishan E.J., The Economic growth Debate: fin assessment, Georgefillen and Unwin Ltd., London, 19??.
Nag Chaudhari, Introduction to Environmagtal ManagementaInterprint, Naraina, New Delhi, 1983.Nijkamp P. (Ed.), Environmental Economica - Vol I Theflries,Martin Nijhoit Social Science Division, Leiden, 1878.DECD, The State of Environment in UECD Member Countries, Paris,1988.
DECD, Environmental Policis {or the 1888s, Paris, 1986.Padmanabhan V.T., Duranthathinte Noottandilaku (in Malayalam),
Pusthaka Prasadhaka Sanghom, Pandalam,Kerala, 1985
e Nunmber gama 8 St 4 Occupational1 th Haaards ct R.E., filwayad Herala
Pearce D.N., Environm n_al Economics. Longman, London and NewYork,l97o.
Pearce D.N £Ed.), The Valuation of Social Cost, George fillenand Unwin, London, l8?S.
Peter F. Drucker, Toward Next Economica and Dthar Essays,fillied Publishers Pvt. Ltd., New Delhi, 1981.Pigu fi.C., [ha Economica oi welfare, M.C.Millian and Co.Ltd.,London, 1832.
Rachel Carson, Silant Spring, Fawcett Publications Inc.,Greenwich, Connectient, 1862.

Raymond F. Dasman, The Coneervetion filternetive, John Wiley andSons Inc. New York, lR?S.
Richard Q. Carpenter, Balancing Economic end EnvironmentalUbjectivee. The Queetion is Still How?, East~west Centre,Honolulu, Hawaii, lR8l.
Richard Lecomber, Economic Growth versus the Environment, JohnNiley and Sons, New York, 19?S.
Richard Q Nusgrave and Peggy B Nusgrave, Public Finegee, Ifigegxend Precticee, McGraw Hill Inc. New Delhi, 1986.
Savage et.al., Economics o¥ Environmental Improvement, HustonMiilin company., Boston, l9?4.Schumacher E.F., Small ie Beautiiul, Bland and Briggs Ltd.,Great Britain, lP?3.Scott fi.D., Netural Reeourcee, The Economics o4 Coneervation,~University of Toronto Press, Toronto, 1955.
Environmental Economice, Printice HallGeneca and Tauss1
9Inc., New Jersy, ?~.3-I
iP .Seymour J. Rubin and Thomas R Graham (Ed.), Environment andTrade, fillenheld Usmun Co. Publishers Inc., New Jersy, IP82.Sharma R.C., Environmental Education, Metropolitan Book CompanyPvt. Ltd., New Delhi, 1PBo.
Shekhar_ Bing, ‘Environmental policy in India, Indian Instituteof public fidm1fi1StFat1mH, New Delhi, IP82.
Sreekumar U (Ed.), Nedinu Chernne Sangethikevidye (inMalayalam), Herala Gasthra,Bahitya Parishat, Trivandrum, 19?8.
Sterm Nohless, Bonbel and Lowry, Fundamenteie oi fiir Pollution,ficcademic Press, U.S.fi., 1R?2. ‘Thapar Romesh, lee Haegewepd the want: Thouohte on the Future,Urieit Longman, New Delhi, 1978.
Thomas D. Crocker and Rojers Q.J., Environmental Economics, theDryden Press Inc. Hinsdale, Illinois, 19?1.Timothy D’Riordan and Ralph C. d’figre, Progress in Reeourceflenagement end Environmegtel Plennino, John Wiley and Sons, NewYork, 19?9. 'Urs and Natraj (Eds.), Regional Planning and NetionalDevelopment, vikas Publishing House Ltd., New Delhi,1R?B.
Ursul fi.D. {Ed.) , Piiloephy end the Ecological Problems_eiCivilization, Progress Publishers, Noscow, IP81.

~ xxxvii W
victor P.A., Pollution: Economy and Environment. fillen andUnwin, London. 19?2.
Nilliam H. Mathews (Ed.l, Gutar Limita_and Human Naeds, The DagI Hammarskjold Foundation, Uppusala,
1976.
Critaria {or Salacting eooooriatg_flgthods {or Environmaggal fissessment,East~Nest Environmental and PolicyInstitute. Honolulu, Hawaii, 1986.
world Bank, Environmental Consideration for tha InduatrialDevaloomant Sector, Nashignton D.C, 19?G.
Yusui J. fihmed and Frank G. Niller (Eds.),IntergrataQmPhvsical,Gocio~Economic and Environmantal Planning, UNEP, TvcoolvInternational Publishing Ltd., Dublin, 1982.
REPORTS:
George Hathai Tharakan, "Comprative Studv oi sir Pollution inEloor~Edavar Industrial Belt”, Project Raport School oiManagement Studies, University of Cochin, 197a.
Government oi India, fiir Qualitv in selected Citiea in India£197B~79), the National EnvironmentalEngineering and Pesearcs Institute (NEEPI)Nagpur, IQBG.
Census oi India 1981, Census CommissionNew Delhi 1982.
Fourth Fiva Year Plan (19?@—?5), PlanningCommission, New Delhi.
Fifth Fiva Vaar Plan (19?r~G@), PlanningCommission, New Delhi.
Sixth Fiva Year Plan (198G~85), PlanningCommission, New Delhi.
Gevanth Fiva Year Plan (IGGS-98). PlanningCommission, New Delhi.
Government o¥ Herala, finnual Paoort 19?9~G@, The Kerala State‘ Pollution Control Board, Trivandrum,IPGI.
annual survev of Industries, Herala State1???~?§, Industrial Statistical Unit,Bureau oi Economics and statistics,Trivandrum, 19?8.

~ Mxxviii ~
Governent o¥ Herala, Economic Review 1988, The State PlanningBoard, Trivandrum, 1981.
Economic Review 1981, The State PlanningBoard, Trivandrum, 1982.
Economic Review 1982, The State PlanningBoard, Trivandrum, 1983.
Economic Review 1983, The State PlanningBoard, Trivandrum, 1984.
Economic Review 1984, The State PlanningBoard, Trivandrum, 1983.
Economic Reglew 1985, The State PlanningBoard, Trivandrum, 1988.
Economic Review 1986, The State PlanningBoard, Trivandrum, 198?.
Environmental Status Report on GreaterCochin~Herala, The Herala State PollutionControl Board, Trivandrum, 1982.
Episodal Pollution Caused bv e Bundficroee Periver ~ S case study; The KeralaState Pollution Control Board,Trivandrum, 1982.
Induet*ies end lnduetriel Labour andInfraetructure. Transport and IndustriesDivision, State Planning Board,Trivandrum, 1988.
Season and crop Report of Herala State119??:Z‘, Directrate oi Econom c and
statistics, Trivandrum, 1982.Government of Sweden, ficidificetion: Q Bountlers Threet to ourEnvironmeng, National Environmental Protection Board, Ministryof agriculture, Solna, 1983.Jolly Joseph, "Q Survey o4 Ground water in Eloor~EdavarIndustrial Belt”, Project Report, Department of AppliedChemistry, University ot Cochin, 1982.
Satheeskumar M.K. and Vallabhan C.P.G. “Q Photoacoustic set upFor fitmospheric fittenuation Studies using the Ne Lazer Beam,”Project report at the Department of Phvsice, University ofCochin, 1983.

STATUTES:
fiir (Prevention & Control of Pellutinnl fiat, 198@The Environment (Pr0tectinn) fiat, 1986water (Preventien & Central QT Pollution} fiat, 1??4Hater Bees (Prevention & Central 0% Pollution) fiat, 1???
Related Documents